Electrorefining of a Base Metal Refinery residue copper alloy ...
Upload
khangminh22Category
view
2download
0
Appendix A
APPENDICES FOR SECTION 5 – AIR QUALITY AND ODOUR

APPENDIX A-1
APPENDIX 5.1: AIR QUALITY
BASELINE REPORT

REPORT NO 70029220-02-C-BASE/AQ
ENVIRONMENTAL BASELINE: AIR QUALITY DUQM REFINERY, OMAN
CONSOLIDATED ENVIRONMENTAL AND SOCIAL IMPACT ASSESSMENT
FOR DRPIC ONLY: CONFIDENTIAL AUGUST 2017

Confidential Project no: 70029220 Date: August 2017
WSP 6 Devonshire Square London, EC2M 4YE Tel: +44 (0)20 7337 1700 www.wsp.com
DUQM REFINERY PROJECT
DUQM REFINERY, OMAN
Duqm Refinery & Petrochemical Industries Company

Q U A L I T Y M A N A G E M E N T
ISSUE/REVISION FIRST ISSUE REVISION 1 REVISION 2 REVISION 3
Remarks Issue 1 Issue 2 Issue 3, Rev 2a Issue 4, Rev 2b
Date 04.08.2017 18.08.2017 31.08.2017 31.08.2017
Project number 70029220 70029220 70029220 70029220
Report number N
o 70029220-02-
C-Base/AQ
No 70029220-02-C-
Base/AQ-02
No 70029220-02-C-
Base/AQ-02
No 70029220-02-C-
Base/AQ-02
File reference Project drive Project drive Project drive Project drive

ii
Duqm Refinery Project WSP DRPIC Project No 70029220 Confidential August 2017
TABLE OF CONTENTS 1 INTRODUCTION ...........................................................................1
1.1 BACKGROUND.................................................................................................. 1
1.2 SCOPE OF REPORT ......................................................................................... 1
1.3 PROJECT OVERVIEW ...................................................................................... 1
1.4 PREVIOUS BASELINE WORK .......................................................................... 2
1.5 FINDINGS OF THE PREVIOUS AIR QUALITY AND ODOUR ASSESSMENTS IN THE DUQM REGION ........................................................ 3
1.6 SUMMARY OF THE AIR QUALITY MONITORING STUDIES UNDERTAKEN IN THE DUQM REGION TO DATE .......................................... 5
2 METHODOLOGY ..........................................................................6
2.1 RELEVANT AIR QUALITY AND ODOUR STANDARDS ................................. 6
2.2 GUIDANCE ......................................................................................................... 6
2.3 INTERNATIONAL STANDARDS ORGANISATION.......................................... 9
2.4 EQUIPMENT ....................................................................................................... 9
2.5 SURVEY LOCATIONS ..................................................................................... 12
2.6 SAMPLING PROCEDURE ............................................................................... 13
3 BASELINE AIR QUALITY .......................................................... 15
3.1 SURVEY RESULTS ......................................................................................... 15
4 REFERENCES ............................................................................ 21

iii
Duqm Refinery Project WSP DRPIC Project No 70029220 Confidential August 2017
T A B L E S
TABLE 1.1: DUQM REFINERY PROJECT ......................................................................... 1
TABLE 2.1 PROVISIONAL OMANI: AMBIENT AIR QUALITY STANDARDS .................... 6
TABLE 2.2 AMBIENT AIR QUALITY STANDARDS ........................................................... 7
TABLE 2.3 USEPA, UNITED KINGDOM AND EUROPEAN UNION (EU) AIR QUALITY STANDARD ...................................................................................... 8
TABLE 2.4 ODOUR THRESHOLDS FOR REFINERY EMISSIONS TO AIR ..................... 9
TABLE 2.5 AIR QUALITY MONITORING STATION EQUIPMENT LIST ......................... 10
TABLE 2.6 PASSIVE DIFFUSION SAMPLES DEPLOYED ACROSS THE STUDY AREA11
TABLE 2.7 BASELINE AIR QUALITY MONITORING LOCATIONS ................................ 13
TABLE 3.1 AMBIENT AIR QUALITY MONITORING STATION RESULTS – DUQM, MAY - AUGUST 2017 .............................................................................. 15
TABLE 3.2 DIFFUSION TUBE SURVEY RESULTS FOR DUQM REFINERY BASELINE SURVEY ......................................................................................... 19
F I G U R E S
FIGURE 2-1 AIR QUALITY MONITORING STATION AT THE SAMPLE LOCATION ..... 11
FIGURE 2-2 PASSIVE DIFFUSION TUBE SAMPLING SITES, ACROSS THE STUDY AREA............................................................................................... 12
FIGURE 2-3 CAQMS SITE LOCATION ............................................................................ 13
FIGURE 3-1 NO2 CONCENTRATION AT THE CAQMS BETWEEN 3RD
MAY TO 2ND
JUNE 2017 ...................................................................................... 16
FIGURE 3-2 SO2 CONCENTRATION AT THE CAQMS BETWEEN 3RD
MAY TO 2ND
JUNE 2017 ...................................................................................... 17
FIGURE 3-3 O3 CONCENTRATION AT THE CAQMS BETWEEN 3RD
MAY TO 2ND
JUNE 2017 ................................................................................................ 17
FIGURE 3-4 WINDROSE FORM THE CAQMS SITE....................................................... 18
FIGURE 3-5 OZONE-ROSE FROM THE CAQMS SITE .................................................. 18
A P P E N D I C E S
A P P E N D I X A AMBIENT AIR QUALITY MONITORING STATION RESULTS – DUQM MAY 2017
A P P E N D I X B MAXIMUM POLLUTANT CONCENTRATIONS MONITORED AT BASELINE LOCATION
A P P E N D I X C DIFFUSION TUBE SURVEY RESULTS FOR DUQM REFINERY BASELINE SURVEY

1
Duqm Refinery Project WSP DRPIC Project No 70029220 Confidential August 2017
1 INTRODUCTION
1.1 BACKGROUND
This report represents the methodology and results of an environmental air quality and odour baseline survey carried out at, and around the area close to, the Duqm Refinery Project, Oman.
1.2 SCOPE OF REPORT
The purpose of the air quality and baseline survey was to provide a robust and full data set at a fixed location of air pollutants and odour sources for a minimum period of three months, while also providing a wider range of air quality data from additional measurements across the study area. The survey results are expected to represent typical baseline ambient air levels and baseline odour at both background locations and at location close to sensitive receptors.
This report sets out the methodology employed and a summary of the results, along with details of the measurement data and equipment.
1.3 PROJECT OVERVIEW
The Duqm Refinery Project comprises the Refinery itself and its Off-site Facilities. The components of the Project are described in Table 1.1 below.
Table 1.1: Duqm Refinery Project
PROJECT COMPONENT DESCRIPTION
Duqm Refinery
A 230,000 barrels per day complex refinery on a plot of 9km2 area to the north
of the main industrial area within the Duqm Special Economic Zone (SEZ). This includes:
Site clearance and levelling (completed in late 2016);
Product pipelines and service lines to the Duqm Export Terminal;
Construction accommodation/Workers’ Camps; and
Laydown areas.
Off-site Facilities
i. Crude oil storage facility at the Ras Markaz (RM) Crude Oil Storage Terminal: eight tanks located within, and part of the wider Terminal,
approximately 80km from the Refinery. The large-scale Tank Terminal (to be run by Oman Oil Tank Terminal Company, OTTCO) in its entirety is not part of the Project.
ii. ‘DRPIC Crude Pipeline’: 28-inch diameter 80km crude oil import pipeline
to transport crude oil from RM to Duqm Refinery.
iii. Product ‘Export Terminal’: on the lee breakwater of the Port of Duqm,
close to to the south-east of the Refinery plot. Topside works only, i.e., storage for products and export handling facilities.
The transition of crude oil from its import, via a Single Point Mooring (SPM) at Raz Markaz, to the export of refined products through the Project facilities follows these key stages:

2
Duqm Refinery Project WSP DRPIC Project No 70029220 Confidential August 2017
1. Offload of crude oil from offshore vessel delivery. Crude oil is stored within the crude import and storage facility at Ras Markaz Tank Farm of which only eight crude oil tanks are part of the Project.
2. The oil is transferred to the Duqm Refinery through the 80.7km Crude Import Pipeline. The Duqm Refinery will have a design capacity of 230,000 barrels per day and will produce the following products:
a. Naphtha;
b. Liquid Petroleum Gas (LPG);
c. Jet A-1;
d. Diesel;
e. Heavy Sulphur Fuel Oil (intermittently);
f. Petroleum Coke (Solid); and
g. Sulphur (Solid).
3. Once the crude oil is refined to the final products, then these are marine exported via the Duqm Export Terminal. The liquid products are conveyed to the terminal via pipelines within a service corridor and the solid products via ground transport.
1.4 PREVIOUS BASELINE WORK
Previous baseline air quality and odour survey work has been documented as follows (see also References):
Appendix A of the Environmental Impact Assessment Study Report for Duqm Refinery (HMR, 2015);
Environmental and Social Impact Assessment (ESIA) Scoping Report for the Proposed Duqm Integrated Power and Water Plant (DIPWP), Duqm, Sultanate of Oman;
Sections 5 (ambient air quality) and 6 (impact assessment), and Appendix 3 of the Raz Markaz Oil Pipeline Concept Study & FEED Environmental Impact Assessment Report (WorleyParsons Oman Engineering, 2016);
Duqm Industrial and Free Zone Masterplan Sultanate of Oman, Final EIA Report;
Appendices B and E of the Environmental Impact Assessment Study Report for Duqm Refinery Construction Camp (HMR, 2014);
Environmental Impact Assessment (EIA) Study Report, Duqm Refinery;
Sections 2, 6 and 7 of the Environmental Impact Assessment Report: Duqm Liquid Bulk Berths Project (WorleyParsons Oman Engineering, 2015);
EIA for Service Corridor, Duqm, Environmental Impact Assessment Report;
ESIA for Ras Markaz Crude Oil Park;
Environmental Impact Assessment (EIA) Report for Duqm Sea Water for Industrial Zone Project (SWIP); and
Equator Principles Supplementary Report on Associated Facilies – Gensis Technip, March 2016

3
Duqm Refinery Project WSP DRPIC Project No 70029220 Confidential August 2017
The previous baseline air quality studies and odour included measurements in and around Project components and relevant receptors. These are summarised in the following Section.
1.5 FINDINGS OF THE PREVIOUS AIR QUALITY AND ODOUR ASSESSMENTS IN THE DUQM REGION
Duqm Ras Markaz Oil Pipeline Concept Study & FEED, Environmental Impact Assessment Report - Oman Gas Company, May 2016
As part of the zone development, SEZAD undertook continuous ambient air quality studies at three locations within the Duqm SEZ area between 2012 and 2013, recording concentrations of carbon monoxide (CO), nitrogen dioxide (NO2), ozone (O3), sulphur dioxide (SO2) and particulate matter of diameter less than or equal to ten micrometers (microns) PM10.
The monitoring detected exceedances of both the USEPA and Omani provisional standards for
Ozone (8 hour average, 177g/m3, Sep 2013); SO2 (1 hour average, 211 g/m
3, Sep 2013) and
PM10 (24 hour average, 244 g/m3 Mar 2013).
In addition, PM10 monitoring was undertaken at 70 locations along the pipeline for up to 15
minutes at each location. Concentrations ranged from 10 to 339g/m3 as a 15 minute average.
High dust levels were recorded during periods of high wind speeds.
Ras Markaz Crude Oil Park Project – HMR Consultants, October 2015
Ambient concentrations of CO, NO, NO2, NOx, O3, hydrogen sulphide (H2S), SO2, methane (CH4), Total Non-Methane Hydrocarbons (TNMHCs) and PM10 were monitored using a continuous analyser for a period of one month. Monitored concentrations were within the relevant standards with the exception of 24 hr PM10 concentrations which reached 244µg/m
3.
Duqm Industrial and Free Zone Masterplan – Jurong Consultants, June 2010
PM10 monitoring was undertaken at ten sites for a period of less than one day at each location.
Period mean concentrations ranged between 13.4 and 73.0 g/m3 and it was stated that gusting
wind may have played a role in the higher concentrations measured.
In addition, diffusion tubes for sulphur dioxide and nitrogen dioxide were deployed at four
locations for a period of 36 days. Mean SO2 concentrations ranged from 11.97 to 19.60 g/m3 and
nitrogen dioxide concentrations ranged between 2.93 and 4.07 g/m3.
Duqm Refinery Air Quality Baseline Study Report (HMR, Dec. 2014)
Baseline air quality was assessed using a series of several short monitoring surveys (ranging between 11 to 18 days) at five locations within the Duqm Refinery study area. A Continuous Air Quality Monitoring Station (CCAQMS) was used to monitor concentrations of SO2, NOx, CO, O3, H2S, PM10 and total non-methane hydrocarbons (TNMHC). Monitoring locations included the Duqm Refinery site (October 2013 and June 2014), Wadi Dhanjart, the Village of Nafun, the heavily Industrialised area to the north of Duqm town, Duqm Town and the Airport. During the surveys several exceedances of air quality standards were observed, these occurred principally at the Refinery site, and included an exceedance of the O3 8-hr standard in the June to July 2014 air quality monitoring period, which was not observed during the previous monitoring undertaken at the site in October 2013. Also an exceedance of the PM10, air quality standard was observed at both the Refinery site and in Duqm Town. Ozone exceedances are more likely during summer periods than winter periods due to the higher UV intensities, and elevated PM10 concentrations were attributed to the characteristic Shamal winds which occur in the summer months.

4
Duqm Refinery Project WSP DRPIC Project No 70029220 Confidential August 2017
Duqm Liquid Bulk Berths Project – Worley Parsons, September 2015
Diffusion tube monitoring was undertaken at eight sites, measuring SO2, volatile organic compounds (VOC), O3, oxides of nitrogen (NOx) – made up of nitrogen monoxide (NO) and nitrogen dioxide (NO2) concentrations over a period of 21 days. Concentrations of SO2, VOC, NOx and NO2 were all well below the relevant standards (<5µg/m
3 in each case). Ozone
concentrations ranged between 59 and 78 µg/m3 over the period.
Environmental Impact Assessment Report for Duqm Sea Water for Industrial Zone Project – HMR Consultants, July 2015
Concentrations of SO2, NOx, CO, O3, H2S, PM10 and total non-methane hydrocarbons (TNMHC) were monitored using a continuous analyser for a period of approximately two weeks at each of three locations. 24 hr average concentrations of SO2 exceeded the standard with a maximum value of 160.3µg/m
3 as did 8-hour average concentrations of O3 with a maximum of 125.2 µg/m
3.
All other measured concentrations fell within the relevant standards.
Environmental Impact Assessment Report for Duqm Refinery Construction Camp – HMR Consultants, December 2014
Ambient concentrations of CO, NO, NO2, NOx, O3, H2S, SO2, CH4, Total Non-Methane Hydrocarbons (TNMHCs) and PM10 were monitored using a continuous analyser at three separate sites over a total period of 39 days. 8 hr average concentrations of O3, exceeded the standard with a maximum value of 193µg/m
3 as did 24 hour average concentrations of PM10 with
a maximum of 227 µg/m3 and NMHCs with a maximum value of 260 µg/m
3. All other measured
concentrations fell within the relevant standards. Odour sampling was carried out using sorbent tubes. Sorbent tube sampling is NIOSH/OSHA approved method for collecting most hazardous gases and vapours from the air. All VOCs sampled for odour were below the detection limits.
Environmental and Social Impact Assessment Report for the proposed Duqm Integrated Power and Water Plant (DIPWP), Duqm – Marafiq; BEYA 2015
Ambient concentrations of O3, PM10, SO2, H2S, CO, NO2, CH4 and NMHC were monitored at five locations for a period of approximately 24 hours at each location. 24 hr PM10 concentrations exceeded the 24hr standard at one location, with a maximum concentration of 506µg/m
3. In
addition, elevated concentrations of ozone were recorded (a maximum of 68.1µg/m3 as 24 hr
average), indicating a likely exceedance of the 8 hour standard for O3. All other measured concentrations fell within the relevant standards. Scoping Report and ESIA
1 for the Proposed DIPWP – ADP Consultants, December 2016
Ambient air quality monitoring was carried out in December 2016 on continuous basis over just 24hrs hours at four separate locations measuring SO2, H2S, NO2, NOx, CO, O3, CH4, NMHC and PM10. Measured concentrations of O3 over the 24hr period were elevated (between 53.5 to 68.1 µg/m
3) though well within the Omani 8 hr air quality standard of 120 µg/m
3, as the monitoring
period was greater than the standard duration, an exceedance of the O3 standard at these locations were possible. In addition PM10 concentrations at all five sample locations were within the 24hr national ambient air standard of 125 µg/m
3 though exceeded the WHO annual standard
1 Due to the timing of the availability of an updated ESIA Report (end of July 2017) the results were not
available in time for this Report.

5
Duqm Refinery Project WSP DRPIC Project No 70029220 Confidential August 2017
of 20 µg/m3, which was not applicable over these very short monitoring durations. All other
parameters were well below the Omani nation air quality standards.
1.6 SUMMARY OF THE AIR QUALITY MONITORING STUDIES UNDERTAKEN IN THE DUQM REGION TO DATE
The previous air quality survey undertaken in the Duqm region detected exceedances of PM10, O3 and SO2 concentrations against the Omani air quality standards. A continuous analyser was deployed for only six of the nine air quality surveys and only for a maximum period of one month at any one site. In the studies which deployed diffusion tubes exposed over several weeks, the likelihood that a non-compliance against a 24hr air quality standard would have been detected is low. These previous studies, even though short in duration, and in two cases limited to a diffusion tube study, detected several non-compliances of pollutants, two of which (PM10 and O3) would be considered to be as result of natural processes, and not as an consequence of anthropogenic emissions.

6
Duqm Refinery Project WSP DRPIC Project No 70029220 Confidential August 2017
2 METHODOLOGY
2.1 RELEVANT AIR QUALITY AND ODOUR STANDARDS
2.1.1 Provisional Omani Ambient Air Quality Standards
2.2 GUIDANCE
In preparation of the new baseline survey to be carried out to enhance the set of historic measurements, it was important to take account of any existing Omani and international Air Quality Standards.
There are no formal Omani standards for air quality, however Provisional Ambient Air Quality Standards have been developed (see Table 2-1 below) along with ‘Ministerial Decision No. 118/04 on the Control of Air Pollution from Stationary Source’. In addition to these, international standards from the United States Environmental Protection Agency (USEPA), United Kingdom and European Union (EU) provide air quality limits values for pollutants not addressed in the Provisional Ambient Air Quality Standards (see Table 2-2).
Where applicable, the Omani Provisional Ambient Air Quality Standards will be required to be met, and where a limit value for a pollutant is not presented within either the Omani standards, the IFC (referring to World Health Organization, WHO) standards will be considered the project specific air quality standard.
Table 2-1: Provisional Omani: Ambient Air Quality Standards
POLLUTANT AVERAGING
PERIOD OMANI AIR QUALITY STANDARD (MD 41/2017)
PREVIOUS PROVISIONAL
OMANI AAQS
PM10 24 hour 150 µg/m
3 125 µg/m
3
1 Year - -
NO2
24 hour 130 µg/m3 112 µg/m
3
1 hour 250 µg/m3 - -
1 year - -
SO2
24 hour 150 µg/m3 125 µg/m
3
1 hour 350 µg/m3 - -
3 hour - -
10 minutes - -
CO 8 hour 10 mg/m
3 6 mg/m
3
1 hour 30 mg/m3 - -
H2S 24 hour 40 µg/m
3
1 hour 30 µg/m3
O3 8 hour 120 µg/m3 120 µg/m
3
HCNM 3 hour 160 µg/m3 160 µg/m
3
Lead 3 month 1.5 µg/m
3 - -
1 year - -
PM2.5 24 hours 65 µg/m
3 - -
1 year - -
NH3 24 hours 200 µg/m3

7
Duqm Refinery Project WSP DRPIC Project No 70029220 Confidential August 2017
POLLUTANT AVERAGING
PERIOD OMANI AIR QUALITY STANDARD (MD 41/2017)
PREVIOUS PROVISIONAL
OMANI AAQS
Benzene 1 year - -
Arsenic 1 year - -
Cadmium 1 year - -
Nickel 1 year - -
PAH 1 year - -
2.2.1 IFC EHS Guidelines
For pollutants where no Omani standards apply, air quality guidelines IFC general (WHO) international standards have been adopted. These criteria are shown in Table 2.2.
Table 2.2: Ambient Air Quality Standards
POLLUTANT AVERAGING PERIOD IFC GENERAL (WHO)
PM10 24 hour 50 µg/m
3
1 Year 20 µg/m3
NO2
24 hour - -
1 hour 200 µg/m3
1 year 40 µg/m3
SO2
24 hour 20 µg/m3
1 hour - -
3 hour - -
10 minutes 500 µg/m3
CO 8 hour - -
1 hour - -
H2S 24 hour - -
O3 8 hour 100 µg/m3
HCNM 3 hour - -
Lead 3 month - -
1 year - -
PM2.5 24 hours 25 µg/m
3
1 year 10 µg/m3
Benzene 1 year
Arsenic 1 year - -
Cadmium 1 year - -
Nickel 1 year - -
PAH 1 year - -
2.2.2 USEPA and EU Air Quality Standards
For reference the United States Environmental Protection Agency (USEPA), United Kingdom and European Union (EU) air quality standards have been set out to provide a guideline value air for those pollutants which have no Omani or WHO standards equivalent (see Table 2-3 below).

8
Duqm Refinery Project WSP DRPIC Project No 70029220 Confidential August 2017
Table 2-3: USEPA, UK and EU Air Quality Standard
2.2.3 Odour Nuisance Standards
No nuisance thresholds exist for odour in Oman. Therefore complaints of odour nuisance was assumed to be equivalent to the odour detection thresholds at receptors from known odourous emission from the refinery activities.
Odour thresholds for VOC other anticipated emissions from refinery activities are2 provided in
Table 2-4 below. These odour detection values represent a conservative assessment, as they are from the lower end of the detection range of odour threshold values.
2 Reference Guide to Odor Thresholds for Hazardous Air Pollutants published by the Unites States
Environmental Protection Agency (US EPA), 1992
POLLUTANT AVERAGING PERIOD US EPA EU UK
PM10 24 hour 150 µg/m
3 50 µg/m
3 50 µg/m
3
1 Year - - 40 µg/m3 40 µg/m
3
NO2
24 hour - - - - - -
1 hour 0.1 ppm 200 µg/m3 200 µg/m
3
1 year 0.053 ppm 40 µg/m3 40 µg/m
3
SO2
24 hour - - 125 µg/m3 125 µg/m
3
1 hour 0.075 ppm 350 µg/m3 350 µg/m
3
3 hour 0.5 ppm - - - -
10 minutes - - - - - -
CO 8 hour 9 ppm 10000 µg/m
3 10000 µg/m
3
1 hour - - - - - -
H2S 24 hour - - - - - -
O3 8 hour 0.07 ppm 120 µg/m3 120 µg/m
3
HCNM 3 hour - - - - - -
Lead 3 month 0.15 µg/m
3 - - - -
1 year - - 0.5 µg/m3 0.5 µg/m
3
PM2.5 24 hours 35 µg/m
3 - - - -
1 year 12 µg/m3 25 µg/m
3 25 µg/m
3
Benzene 1 year - - 5 µg/m3 5 µg/m
3
Arsenic 1 year - - 6 ng/m3 - -
Cadmium 1 year - - 5 ng/m3 - -
Nickel 1 year - - 20 ng/m3 - -
PAH 1 year - - 1 ng/m3 - -

9
Duqm Refinery Project WSP DRPIC Project No 70029220 Confidential August 2017
Table 2-4: Odour Thresholds for Refinery Emissions to Air3&4
COMPOUND ODOUR SOURCE
ODOUR THRESHOLD
mg/m3 ppm
Hydrogen Sulphide Crude Oil, Sulphur tanks, desulphurisation
& Waste Water Treatment 0.014 0.01
Ammonia Reimpregnation and Waste Water
Treatment 3.48 5
Dimethyl Disulphide Crude Oil, Sulphur tanks, desulphurisation 0.002 0.001
Benzene Crude Oil and Refined Naphtha 2.50 0.78
Toluene Crude Oil and Refined Naphtha 7.6 28.6
Ethylbenzene Crude Oil and Refined Naphtha 0.40 0.092
Xylenes Crude Oil and Refined Naphtha 0.60 0.14
Hexane Crude Oil and Refined Naphtha 459 130
2.3 INTERNATIONAL STANDARDS ORGANISATION
In order to comply with IFC requirements, baseline monitoring should adhere to ISO reference methods, where applicable. Compliance of ambient air monitoring methods used within this baseline study is detailed in Table 2-5 below.
2.4 EQUIPMENT
A continuous air quality monitoring station (CAQMS) was deployed at the selected sampling site on 3
rd May 2017. The CAQMS was equipped to continuously monitor for the following air quality
parameters:
PM10;
PM2.5;
NO2;
SO2;
O3;
CO;
H2S;
VOCs;
BTEX; and
3 Occupational Safety and Health Guideline for Methyl Mercaptan, US Dept. Health and Human Services,
1988 4 Occupational Safety and Health Guideline for Hexane, US Dept. Health and Human Services, 1988

10
Duqm Refinery Project WSP DRPIC Project No 70029220 Confidential August 2017
CH4
Measurements were carried out for three months at a single fixed background location. The data was then used to providing both short-term and annualised baseline ambient air concentrations.
In addition an anemometer was installed to measure wind speed and wind direction at the sample site. The equipment deployed in the Air Quality monitoring survey is shown in Table 2-5 below.
Table 2-5: List of Air Quality Monitoring Station Equipment
ITEM
NO. ITEM PURPOSE NUMBER OF
ITEMS ISO STANDARD
COMPLIANCE
1 Steel Framed Enclosure
Enclosure for the safe containment of sensitive Air Quality monitoring instrumentation
1 -
2 Not Available Beta Attenuation using a Metone BAM
Monitoring particulate airborne matter (PM10)
1 Equivalent Method to ISO EN 12341
3 Metone BAM Beta Attenuation Monitor
Monitoring particulate airborne matter (PM2.5)
1 Equivalent Method to ISO EN 14097
4 Serinus 50, UV Fluorescent detector
Monitoring Ambient air concentrations of Sulphur Dioxide
1 Compliant with Method ISO EN 14214A
5 Serinus 51 UV Fluorescent detector
Monitoring Ambient air concentrations of Hydrogen Sulphide
1 No ISO Method
6 Gas Chromatograph and Flame ionisation detector
Monitoring Ambient air concentrations of Benzene, Toluene, Ethyl Benzene and Xylene
1 Compliant with Method ISO EN 14662
7 Gas Chromatograph and Flame ionisation detector
Monitoring Ambient air concentrations of Total Volatile organic compounds
1 Compliant with Method ISO EN 16017
8 Serinus 30, Dispersive Infrared detector
Monitoring Ambient air concentrations of Carbon Monoxide
1 Compliant with Method ISO EN 14626
9 Serinus 40, Chemiluminesence detector
Monitoring Ambient air concentrations of Nitrogen Dioxide
1 Compliant with Method ISO EN 14211
10 Serinus 10 Non Dispersive UV detector
Monitoring Ambient air concentrations of Ozone 1
Compliant with Method ISO EN 14625
11 Gas Chromatograph and Flame ionisation detector
Monitoring Ambient air concentrations of Methane 1 No ISO Method
12 Anemometer/Vane using a Gill Met Station
Measuring Wind speed and wind direction 1 -
13 NO2 Passive Sampling Tubes Monitoring Ambient air concentrations of Nitrogen Dioxide
6 -
14 SO2 Passive Sampling Tubes Monitoring Ambient air concentrations of Sulphur Dioxide
6 -
15 O3 Passive Sampling Tubes Monitoring Ambient air concentrations of Ozone
6 -
16 BTEX Passive Sampling Tubes
Monitoring Ambient air concentrations of Benzene, Toluene, Ethyl Benzene, and Xylenes
6
-

11
Duqm Refinery Project WSP DRPIC Project No 70029220 Confidential August 2017
Figure 2-1: Continuous Air Quality Monitoring Station at the Sample Location
In addition to the CAQMS, passive samples were deployed at six locations across the study area for NO2, SO2, H2S and BTEX, for a total of three months. However due to contamination via dust intrusion of the final batch (July 2017), only two months of passive sample data was available for the period May and June only. Each sample was collected and a new sample deployed each month. These provided a spatial distribution of baseline ambient air concentrations for up to a total period of two months.
The passive samples deployed across the study area are shown in Table 2.6 and Figure 2-2 below.
Table 2.6 Passive Diffusion Samples Deployed Across the Study Area
ITEM
NO. ITEM PURPOSE NUMBER OF ITEMS
1 NO2 Passive Sampling Tubes Monitoring ambient air concentrations of Nitrogen Dioxide
6
2 SO2 Passive Sampling Tubes Monitoring ambient air concentrations of Sulphur Dioxide
6
3 H2S Passive Sampling Tubes Monitoring Ambient air concentrations of H2S
6
4 BTEX Passive Sampling Tubes Monitoring Ambient air concentrations of Benzene,
6

12
Duqm Refinery Project WSP DRPIC Project No 70029220 Confidential August 2017
ITEM
NO. ITEM PURPOSE NUMBER OF ITEMS
Toluene, Ethyl Benzene, and Xylenes
Figure 2-2: Passive Diffusion Tube Sampling Sites, across the study area
2.5 SURVEY LOCATIONS
Air quality survey sites were selected on the basis that they provided a safe, secure location representative of either a background site or a sensitive receptor. The CAQMS was located at the Sebacic Acid plant, which is approximately 200m to the south east of the Refinery perimeter. The Sebacic Acid plant provided access to a continuous power source and a secure background location, representative of the current conditions at, or close to the Refinery site (see Figure 2-3).
The passive diffusion sample sites were selected on the basis that a range of criteria were met, including fulfilling the data gaps and providing a range of representative sample locations.
Surveillance of Nafoon Village was undertaken to determine a suitable discrete sample position for diffusion tube monitoring at that location. As a consequence of the surveillance exercise, it was concluded that Nafoon Village did not represent a secure sampling location where a set of diffusion tube samples could be left undisturbed or uncorrupted for a monthly period. This was due to a combination of its remote location, lack of public realm structures, lack of anonymity of sampling staff (visiting outsiders were closely observed by villagers) and the presence of grazing animals in the area. The Quarry road site was identified as a suitable alternative sampling location to Nafoon Village, which similarly to Nafoon Village, was location to the north of the proposed Refinery site, and outside the immediate influence of major industrial activities or major transport routes.

13
Duqm Refinery Project WSP DRPIC Project No 70029220 Confidential August 2017
Figure 2-3: CAQMS Site Location
Table 2-7: Baseline Air Quality Monitoring Locations
MEASUREMENT LOCATION SITE CATEGORY SAMPLE
DEPLOYMENT LATITUDE LONGITUDE
NEAREST PROJECT
COMPONENT
Quarry Road, North of site Background Rural Passive Samplers 19.794795 N 57.662465 E Refinery
Refinery Site Gatehouse Project Location CAQMS/ Passive Samplers
19.739108 N 57.648629 E Refinery
CAQMS, Sebacic Acid Plant Background Industrial
Passive Samplers 19.718025 N 57.672829 E Refinery
Duqm Town centre Urban Passive Samplers
19.628775 N 57.633750 E Refinery Export Terminal
Rock Garden Background Rural Passive Samplers
19.625286 N 57.633750 E Refinery Export Terminal
Export Terminal Background Industrial
Passive Samplers 19. 601503 N 57.672579 E Export Terminal
2.6 SAMPLING PROCEDURE
The CAQMS monitored air pollutants continuously from 3rd
May 2017 until 6th August 2017.
For NO2, SO2, O3, CO, H2S and O3, samples were collected and analysed every five minutes. For BTEX, VOCs and Methane, samples were collected and analysed every 15mins. For PM10 and PM2.5 samples are collected and measured every 60 mins.
The analysers within the CAQMS were automatically calibrated every 24hr using calibration gas held within the CAQMS. The O3 analysers are calibrated using a photometer which acts as its own O3 calibration source.
An additional calibration was carried out by the specialist environmental engineers (Exova, Dubai, UAE) every four weeks, when they attended site to inspect the CAQMS and its equipment, as well as conduct filter changes and attend to any routine servicing which may arise.

14
Duqm Refinery Project WSP DRPIC Project No 70029220 Confidential August 2017
Passive samples were deployed, exposed for one month and then collected and replaced. The exposed samples were stored in a fridge, before being dispatched to the laboratory by the Exova environmental engineers. Analysis for diffusion tubes, once received at the laboratory, took up to 15 working days.
Sampling for H2S, BTEX and NMHC’s was considered representative of odour sampling. As the vapour of these chemicals are pungent, and are likely to be present in of residual form and as a consequence of fugitive emissions of those compounds during operation of both the Crude Export Terminal and Refinery.

15
Duqm Refinery Project WSP DRPIC Project No 70029220 Confidential August 2017
3 BASELINE AIR QUALITY
3.1 SURVEY RESULTS
Ambient air quality results at the Sebacic Acid plant have been reported for the monitoring period between 3rd May 2017 and 6
th August 2017.
3.1.1 Ambient Air Quality and Odour Monitoring Results, Duqm
Results from the CAQMS are summarised in Table 3-1, as period average and compliances against 24 hourly, 8 hourly and 3 hourly standards where relevant. More detail on the data recorded at the CAQMS is presented in Appendices A and B, the latter with maximum concentrations.
Table 3-1: Ambient Air Quality Monitoring Station Results – Duqm, May to August 2017
POLLUTANT PERIOD MEAN
MAX
CONCENTRATION
(AVERAGED TO
STANDARD)
OMANI AQ
STANDARD (MD
41/2017)
COMPLIANT
O3 Conc µg/m3 74.73 172.69 (8 hrs) 120 (8hrs) No (Exceeds 8hr standard)
CO Conc mg/m3 0.51
0.0088 (8 hrs) 10 (8 hrs) Yes
0.041 (1 hr) 30 (1 hr)
NO µg/m3 1.84
NO2 µg/m3 3.32
10.29 (24 hr) 130 (24 hr) Yes
58.48 (1 hr) 250 (1 hr)
SO2 µg/m3 6.26
14.46 (24 hr) 150 (24 hr) Yes
15.90 (1 hr) 350 (1 hr)
H2S µg/m3 1.34 9.83(1hr) 30 (1 hr) Yes
PM2.5 Conc ug/m3 64.35 158.92 (24 hr) 65 (24 hr) No
PM10 Conc ug/m3 151.53 488.92 (24 hr) 150 (24 hr) No
CH4 g/m3 770.72 -
NMHC g/m3 0.00 0.00 160 (3 hr) Yes
TVOCs g/m3 4,174 -
Benzene g/m3 0.00 0.00 Yes
Toluene g/m3 0.38 -
EthylBenzene
g/m3
0.00 -
M&P-Xylenes
g/m3
0.00 -
O-Xylene g/m3 0.00 -
*Assuming NMHC = Butane

16
Duqm Refinery Project WSP DRPIC Project No 70029220 Confidential August 2017
Air quality and odour monitored by the CAQMS was generally good during the sampling period 3rd
May to 6
th August 2017, though particulate matter and ozone were both elevated. A power
interruption to the CAQMS occurred on 2nd
June, which resulted in a four day data gap due to repairs being required to the CAQMS. This sampling period loss was made up be an additional four days sampling by the CAQMS at the end of the third month.
Monitoring results indicate that both NO2 and SO2 were both low in concentration during the sampling period, implying that there are no significant industrial emissions sources within the proximity of the CAQMS. However, O3, PM10 and PM2.5 all exceeded short-term concentrations limits. In the case of both PM10 and PM2.5, the period mean exceeded the 24hr air quality standards for both pollutants. O3 and PM are known to originate as a consequence of natural processes, such as strong sunlight and UV radiation in the case of O3, and re-entrainment of dust and sand in the case of PM. Therefore, though the baseline survey has detected exceedances of ambient air pollutants, these pollutants are highly likely to originate from natural processes and not as a consequence of existing anthropogenic activity locally.
The periods of elevated particulate matter were extended and not attributable to localised sources. Therefore, though construction activity at the Sebacic Acid Plant would have contributed to the elevated particulate matter concentrations, it was not considered to be the primary source of particulates resulting in the exceedance of both the PM10 and PM2.5 air quality standard,
Temporal plots of NO2, SO2 and O3 concentrations over the sampling 3rd
May to 6th August period
indicate the pattern of detection by the CAQMS over time (Figures 3-1 to 3-3).
NO2 concentrations detected at the CAQMS can be seen to remain low (< 5µg/m3) over the
majority of the monitoring period (Figure 3-1). A number of short-term incidents of elevated NO2 concentrations can be seen to influence the NO2 detected. These incidents are low in frequency and do not result in an exceedance of NO2 standards. The short-term nature of these elevated peaks implies a rapid dispersion of the NO2, which suggests that the source of the NO2 was local to the CAQMS, possibly local vehicle activity.
Figure 3-1: NO2 Concentration at the CAQMS between 3rd
May to 6th
August 2017
SO2 concentrations detected at the CAQMS remained below <42µg/m3 over the whole of the
monitoring period (Figure 3-2). Due to the lack of peaks and the homogenous concentration profile of SO2 over the monitoring period, it can be implied that there is no local source of SO2 close the CAQMS. SO2 concentrations over the sampling period did not exceed the SO2 standards. The step changes in the SO2 concentrations magnitude are aligned with dates of routine calibrations against a validated SO2 reference as standard.

17
Duqm Refinery Project WSP DRPIC Project No 70029220 Confidential August 2017
Figure 3-2: SO2 Concentration at the CAQMS between 3rd
May to 6th
August 2017
O3 concentrations detected at the CAQMS can be seen to follow a diurnal cycle across the monitoring period (Figure 3-3). This is in response to the sunlight and UV light contributing to the production of O3 during the day, and its subsequent absorption and decay overnight. Peaks in O3 concentration can be observed during the late afternoon, and are only in very short duration. From the 12
th May until the end of the sampling period, O3 concentrations at the CAQMS
exceeded the air Omani air quality standard of 60 µg/m3 over an 8-hour period. Prior to this, not
all elevated O3 episodes exceed the standard average over the 8-hour period, though O3 concentrations can be observed as elevated at some period of the day for the majority of days during the sampling programme.
Figure 3-3: O3 concentration at the CAQMS between 3rd
May to 6th
August 2017
Wind direction and wind speed monitored at the CAQMS over the sampling period 3rd
May to 6th
August illustrates that the prevailing wind on-site is easterly (Figure 3-4). The resultant easterly windrose relates to wind coming off the nearby coast, and may correlate with adiabatic winds, strong on-shore winds during the late afternoon due to heating of the land mass.

18
Duqm Refinery Project WSP DRPIC Project No 70029220 Confidential August 2017
Figure 3-4: Windrose from the CAQMS Site
Correlating wind direction with O3 concentrations detected over the sampling period 3rd
May to 6th
August at the CAQMS provides an Ozone-rose, which illustrates the wind direction during various concentrations of O3 (see Figure 3-5). Elevated O3 concentrations coincide with an easterly wind direction, which implies that the coast may represent a significant source of O3.
Figure 3-5: Ozone-Rose from the CAQMS Site

19
Duqm Refinery Project WSP DRPIC Project No 70029220 Confidential August 2017
Results from the diffusion tube survey are summarised in Table 3-2 below. Concentrations of pollutants monitored by diffusion tube across the study area were all very low, and indicate that none of the pollutants monitored by diffusion tube were likely to be at risk of exceeding any annual average limits (e.g. such as for Benzene or NO2).
The spatial variation of pollutant concentrations observed by the diffusion tube results can be seen to vary with respect to the proximity to populated areas. With higher concentrations of NO2 being detected at the Duqm Town sample site and the Rock garden sample site (within 1km of Duqm Town); whereas the NO2 concentrations elsewhere were all consistent, even at the CAQMS location (Sebacic Acid Plant). Therefore it can be implied that the current impact of vehicle emissions upon local air quality and NO2 concentrations within the study low is currently low to negligible.
The concentrations of SO2 monitored across the study area over the two month diffusion tube survey were low. As the Oman air quality limit value is assessed over a sample duration of 24 hours, no firm assessment of SO2 limit value or standards compliance can be reached on the monthly diffusion tube samples. However, there is an implication that there is currently no dominating source of SO2 within the study area, such as the Desalination plant power station, and that baseline concentrations at remote locations to the north of the proposed refinery site (e.g. Quarry Road locations and Nafoon Village) are likely to remain very low.
Table 3-2: Diffusion Tube Survey Results for Duqm Refinery Baseline Survey
Pollutant NO2 SO2 H2S BENZENE TOLUENE ETHYL
BENZENE M,P-XYLENE O-XYLENE
Duqm Town 8.33 0.32 - - - - - -
Rock Garden 9.74 0.38 1.00 0.37 <0.21 <0.25 <0.25 <0.25
Dry Dock Camp 5.32 1.71 - - - - - -
Quarry Road 5.16 0.16 0.22 0.25 <0.21 <0.25 <0.25 <0.25
Refinery Gate house 5.66 0.50 0.12 0.215 <0.21 <0.25 0.315 <0.25
CAQMS 6.56 1.29 - - - - - -
Further detail is presented in Appendix C.

20
Duqm Refinery Project WSP DRPIC Project No 70029220 Confidential August 2017
4 SUMMARY AND CONCLUSIONS
4.1 SUMMARY
This air quality and odour baseline survey and around the area close to the Duqm Refinery Project, Oman found that pollutants concentrations were low to very low for a number of pollutants, including odorous air pollutants. However air quality exceedances were observed for O3, PM10 and PM2.5.
4.2 CONCLUSIONS
This baseline air quality and odour survey has resulted in a robust and full data set, totalling three months in duration.
Exceedances of the air quality standards for the three pollutants O3, PM10 and PM2.5 were determined as being attributable largely to emissions from natural sources, both regionally and locally, and not as a result of industrial activity or emissions from road vehicles. Therefore it can be concluded from the baseline study, that the study area airshed is considered to be degraded for these three specific pollutants, and non-degraded for the remaining air pollutants including NO2, CO, SO2, CH4, NMHC, TVOCs, Benzene, Toluene, Ethyl Benzene and Xylenes.

21
Duqm Refinery Project WSP DRPIC Project No 70029220 Confidential August 2017
5 REFERENCES
HMR. (2014). Document No 3514-EIA-02 Environmental Impact Assessment Study Report - Duqm Refinery Construction Camp; Project No: HMR #3514.
HMR. (2015). Document No 3514-EIA-01 Environmental Impact Assessment Study Report - Duqm Refinery; Project No: HMR #3514.
HMR. (2015). Document No 3514-EIA-01 Environmental Impact Assessment Study Report - Duqm Refinery; Project No: HMR #3514.
IEC. (2013). IEC 61672-1:2013 Electrocacoustics — Sound level meters — Part 1: Specifications. Geneva: International Electrotechnical Commission.
IFC. (2007). Environmental Health and Safety Guidelines: Environmental.
ISO. (1982). ISO 1996-1:1982 Description and measurement of environmental noise — Part 1: Guide to quantities and procedures. Geneva: International Standards Organisation.
ISO. (1987). ISO 1996-2:1987 Description and measurement of environmental noise — Part 2: Guide to the acquisition of data pertinent to land use. Geneva: International Standards Organisation.
Smith, J. (1998). Study on Animal Behavior. Sydney: World Press.
WorleyParsons Oman Engineering. (2015). Environmental Impact Assessment Report: Duqm Liquid Bulk Berths Project.
WorleyParsons Oman Engineering. (2016). Raz Markaz Oil Pipeline Concept Study & FEED Environmental Impact Assessment Report.

1
Duqm Refinery Project WSP DRPIC Project No 70029220 Confidential August 2017
Appendix A
AMBIENT AIR QUALITY MONITORING STATION RESULTS –
DUQM MAY 2017

1
Duqm Refinery Project WSP DRPIC Project No 70029220 Confidential August 2017
Table 1: Ambient Air Quality Monitoring Station Results – Duqm May to August 2017
Table 2 Ambient Air Quality Monitoring Station Results – Duqm May to August 2017
CH4 PPB NMHC PPB TVOCS PPB BENZENE PPB TOLUENE PPB
ETHYLBENZENE
PPB M&P-XYLENES
PPB O-XYLENE PPB
Mean 1082.15 0.00 1185.72 0.00 0.01 0.00 0.00 0.00
Minimum 455.44 0.00 567.65 0.00 0.00 0.00 0.00 0.00
Date of minimum
09/07/2017 05:00 -
03/05/2017 07:50
- 03/05/2017
00:00 - - -
Maximum 13905.49 0.00 13905.49 0.00 11.34 0.00 0.00 0.00
Date of Maximum
03/05/2017 18:15 -
03/05/2017 18:15
- 14/05/2017
08:45 - - -
Data Capture 99.9% 99.9% 99.7% 99.7% 99.7% 99.7% 99.7% 99.7%
WIND SPEED WIND DIR. AMB TEMP O3 CONC PPB
CO CONC
PPM NO PPB NO2 PPB
SO2 CONC
PPB H2S CONC
PPB PM2.5 CONC
UG/M3
PM10 CONC
UG/M3
Mean 7.99 87.42 29.39 45.06 0.45 1.50 1.80 2.31 1.88 64.35 151.53
Minimum 0.17 9.40 21.60 0.00 0.00 0.00 0.00 0.00 -0.60 0.00 0.00
Date of minimum
05/05/2017 06:05
25/06/2017 17:10
05/07/2017 05:15
03/05/2017 03:00
03/05/2017 01:00
03/05/2017 01:00
03/05/2017 01:00
03/05/2017 00:55
26/05/2017 23:55
17/05/2017 12:45
04/05/2017 16:55
Maximum
16.12 355.70 45.60 130.10 41.23 126.60 58.48 15.90 28.40 985.00 985.00
Date of Maximu
m
30/06/2017 08:45
02/06/2017 23:55
31/05/2017 12:30
08/07/2017 13:20
07/06/2017 10:25
03/05/2017 11:00
03/05/2017 11:00
10/07/2017 22:00
18/07/2017 11:40
30/05/2017 07:40
04/05/2017 08:55
Data Capture
99.8% 99.8% 99.6% 94.0% 98.0% 95.4% 98.0% 97.8% 97.3% 84.1% 85.0%

Appendix B
MAXIMUM POLLUTANT CONCENTRATIONS MONITORED AT
BASELINE LOCATION

Appendix B
Table 1: Maximum concentrations of Air Quality Pollutants at Sebacic Acid Plant, Duqm Against Air Quality Standards (non-compliance in bold)
POLLUTANT STANDARD AVERAGING
PERIOD MAX
CONCENTRATION DATE MAX
PM10 125 24 hour 488.92 17/06/2017
NO2 112 24 hour 10.29 08/06/2017
SO2 125 24 hour 14.46 14/06/2017
CO 6000 8 hour 8.80 08/06/2017
H2S 40 24 hour 3.28 18/07/2017
O3 120 8 hour 172.69 12/05/2017
HCNM 160 3 hour 0 -
PM2.5 25 24 hour 158.92 31/05/2017

Appendix C
DIFFUSION TUBE SURVEY RESULTS FOR DUQM REFINERY
BASELINE SURVEY

Table 1: Diffusion Tube Survey Results for Duqm Refinery Baseline Survey
SITE NAME EXPOSURE DATA NO2 SO2 H2S BENZENE TOLUENE ETHYL
BENZENE M,P-XYLENE
O-XYLENE
Date On Date Off g/m
3
Duqm Town 02/05/2017 02/06/2017 6.64 0.07 - - - - - -
Rock Garden 02/05/2017 02/06/2017 2.32 0.09 0.08 0.54 <0.20 <0.24 <0.24 <0.24
Dry Dock Camp 02/05/2017 02/06/2017 4.32 0.13 - - - - - -
Quarry Road 02/05/2017 02/06/2017 3.04 0.07 0.16 0.3 <0.20 <0.24 <0.24 <0.24
Refinery Gate house
02/05/2017 02/06/2017 8.44 0.06 0.09 0.23 <0.20 <0.24 0.38 <0.24
CAQMS Sebacic Acid Plant
02/05/2017 02/06/2017 8.27 0.06 - - - - - -
CAQMS Sebacic Acid Plant
02/05/2017 02/06/2017 4.04 - - - - - - -
CAQMS Sebacic Acid Plant
02/05/2017 02/06/2017 4.77 - - - - - - -
Duqm Town 02/06/2017 02/07/2017 10.01 0.57
Rock Garden 02/06/2017 02/07/2017 17.15 0.68 1.92 0.2 <0.21 <0.25 <0.25 <0.25
Dry Dock Camp 02/06/2017 02/07/2017 6.32 3.30
Quarry Road 02/06/2017 02/07/2017 7.29 0.26 0.28 0.2 <0.21 <0.25 <0.25 <0.25
Refinery Gate house
02/06/2017 02/07/2017 2.87 0.95 0.15 0.2 <0.21 <0.25 0.25 <0.25
CAQMS Sebacic Acid Plant
02/06/2017 02/07/2017 2.47 2.52 - - - - - -
CAQMS Sebacic Acid Plant
02/06/2017 02/07/2017 11.90 - - - - - - -
CAQMS Sebacic Acid Plant
02/06/2017 02/07/2017 7.93 - - - - - - -

Appendix B
APPENDICES FOR SECTION 5 – NOISE

APPENDIX B-1
APPENDIX 5.1: BASELINE NOISE

REPORT NO 70029220-102-BS01
ENVIRONMENTAL BASELINE: NOISE DUQM REFINERY PROJECT, OMAN
CONSOLIDATED ENVIRONMENTAL AND SOCIAL IMPACT ASSESSMENT (ESIA)
CONFIDENTIAL JUNE 2017

Issue 1 Confidential Project no: 70029220 Date: June 2017
WSP 6 Devonshire Square London, EC2M 4YE Tel: +44 (0)20 7337 1700 www.wsp.com
ENVIRONMENTAL BASELINE: NOISE
DUQM REFINERY PROJECT, OMAN
Duqm Refinery & Petrochemical Industries Company

iii
Duqm Refinery Project WSP DRPIC Project No 70029220 Confidential June 2017
TABLE OF CONTENTS 1 INTRODUCTION ...........................................................................1
1.1 BACKGROUND.................................................................................................. 1
1.2 PREVIOUS BASELINE WORK .......................................................................... 1
1.3 SCOPE OF REPORT ......................................................................................... 1
1.4 PROJECT OVERVIEW ...................................................................................... 1
2 METHODOLOGY ..........................................................................3
2.1 GUIDANCE ......................................................................................................... 3
2.2 SURVEY LOCATIONS ....................................................................................... 3
2.3 EQUIPMENT ....................................................................................................... 4
2.4 PROCEDURE ..................................................................................................... 5
3 BASELINE NOISE ........................................................................6
3.1 SURVEY RESULTS ........................................................................................... 6
4 REFERENCES ..............................................................................8
T A B L E S
TABLE 1.1: DUQM REFINERY PROJECT ......................................................................... 2
TABLE 2.1: BASELINE NOISE SURVEY NOISE MONITORING LOCATIONS ................ 4
TABLE 3.1: SUMMARISED BASELINE NOISE SURVEY MEASUREMENT RESULTS ... 6
F I G U R E S
FIGURE 2.1: EXAMPLE SETUP OF SOUND LEVEL MEASUREMENT EQUIPMENT..... 4
FIGURE 3.1: MID-POINT EQUIVALENT CONTINUOUS SOUND LEVELS MEASURED AT ALL LOCATIONS ........................................................................ 7

iv
Duqm Refinery Project WSP DRPIC Project No 70029220 Confidential June 2017
A P P E N D I C E S
A P P E N D I X A PREVIOUS BASELINE NOISE STUDIES
A P P E N D I X B SURVEY LOCATIONS
A P P E N D I X C CALIBRATION CERTIFICATES
A P P E N D I X D SOUND MEASUREMENT RECORDS

1
Duqm Refinery Project WSP Duqm Refinery & Petrochemical Industries Company Project No 70029220 Confidential June 2017
1 INTRODUCTION
1.1 BACKGROUND
This report presents the methodology and results of an environmental baseline noise survey carried out around the geographic area of the Duqm Refinery Project, Oman.
1.2 PREVIOUS BASELINE WORK
Previous baseline noise survey work has been documented as follows:
Appendix A of the Environmental Impact Assessment Study Report for Duqm Refinery (HMR, 2015)
Appendix A of the Environmental Impact Assessment Study Report for Duqm Refinery Construction Camp (HMR, 2014)
Section 6.15 of the Environmental Impact Assessment Report: Duqm Liquid Bulk Berths Project (WorleyParsons Oman Engineering, 2015)
Section 5.10 and Appendix 3 of the Raz Markaz Oil Pipeline Concept Study & FEED Environmental Impact Assessment Report (WorleyParsons Oman Engineering, 2016)
The previous baseline noise studies included measurements in and around Project components and relevant receptors. These studies noted that data was collected during periods of high winds, and the results show high noise levels indicative of measurements taken in windy conditions. To ensure a robust characterisation of baseline noise levels, a further survey has been conducted as detailed below. Relevant extracts from the previous baseline survey work are included in Appendix A and discussed below.
1.3 SCOPE OF REPORT
The purpose of the survey was to provide supplemental and updated typical baseline ambient noise levels at locations considered representative of local noise-sensitive receptors.
This report sets out the methodology employed and a summary of the results, along with details of the measurement data and equipment.
1.4 PROJECT OVERVIEW
The Duqm Refinery Project comprises the Refinery itself and its Off-site Facilities. The components of the Project are described in Table 1.1 below.

2
Duqm Refinery Project WSP Duqm Refinery & Petrochemical Industries Company Project No 70029220 Confidential June 2017
Table 1.1: Duqm Refinery Project
PROJECT COMPONENT DESCRIPTION
Duqm Refinery
A 230,000 BDP complex refinery on a plot of 9km2 area to the north of
the main industrial area within the Duqm Special Economic Zone. Includes:
Site clearance and levelling (completed in late 2016)
Product pipelines and service lines to the Duqm Export Terminal
Construction accommodation/workers’ camps
Laydown areas.
Off-site Facilities
i. Crude storage facility at the Ras Markaz (RM) Crude Oil Terminal: eight tanks located within, and part of the wider Tank
Farm, approx. 80km from the Refinery. The large-scale Tank Farm (Oman Oil Tank Terminal Company, OTTCO) in its entirety is not part of the Project.
ii. ‘DRPIC Crude Pipeline’: 28-inch diameter 80km crude oil import
pipeline to transport crude oil from RM to Duqm Refinery.
iii. Product ‘Export Terminal’: on the lee breakwater of Port of Duqm,
immediately to the south-east of the Refinery plot. Topside works only, i.e., to establish storage for products and export handling facilities.
The transition from crude oil import (via a Single Point Mooring, (SPM) at Raz Markaz to the export of refined products through the Project facilities follows these key stages:
1. Offload of crude oil from offshore vessel delivery. Crude oil is stored within the crude import and storage facility at Ras Markaz Tank Farm of which only eight crude oil tanks are part of the Project.
2. The oil is transferred to the Duqm Refinery through the 80.7km Crude Import Pipeline. The Duqm Refinery will have a design capacity of 230,000 barrels per day and will produce the following key products:
a. Naptha
b. Liquid Petroleum Gas (LPG)
c. Jet A-1
d. Diesel
e. Heavy Sulphur Fuel Oil
f. Petroleum Coke (Solid)
g. Sulphur (Solid)
3. Once the crude oil is refined to the final products then these are marine exported via the Duqm Export Terminal. The liquid products are conveyed to the terminal via pipelines within a service corridor and the solid products via ground transport.

3
Duqm Refinery Project WSP Duqm Refinery & Petrochemical Industries Company Project No 70029220 Confidential June 2017
2 METHODOLOGY
2.1 GUIDANCE
2.1.1 International Finance Corporation
General guidance on noise management to international standards is provided in the IFC Environmental Health and Safety Guidelines: Environmental (IFC, 2007). Specific advice is given concerning noise monitoring microphone positioning and equipment precision as follows:
Monitors should be located approximately 1.5 metres (m) above the ground and no closer than 3 m to any reflecting surface; and
Noise monitoring should be carried out using a Type 1 or 2 sound level meter meeting all appropriate IEC standards.
2.1.2 International Standards Organisation
Guidance on sound measurement techniques and good practice can be found in ISO 1996 Part 1 (ISO, 1982) and Part 2 (ISO, 1987), relevant sections of which have been followed wherever appropriate and practicable
1.
2.1.3 International Electrotechnical Commission
Specifications for the accuracy and parameters of sound measurement equipment are contained in IEC 61672-1 (IEC, 2013). All sound measurement equipment used in the survey conforms to the ‘Class 1’ specifications, which is equivalent to the performance of the older ‘Type 1’ specification used in withdrawn versions of this standard (ie IEC 60804:2000) and referred to in the IFC Guidelines.
2.2 SURVEY LOCATIONS
Prior to undertaking the baseline noise survey, details of indicative noise monitoring locations and the noise survey methodology were included in a Field Survey Plan, which was provided to DRPIC. Locations were selected to represent the existing receptors in closest proximity to the project components.
Coordinates for each monitoring location are provided in Table 2.1. The project components which will be nearest to the residential locations are also indicated. The monitoring locations are shown graphically in Appendix B.
1 Revisions of these standards are available, but have not been universally adopted by member countries.

4
Duqm Refinery Project WSP Duqm Refinery & Petrochemical Industries Company Project No 70029220 Confidential June 2017
Table 2.1: Baseline Noise Survey Noise Monitoring Locations
MEASUREMENT LOCATION LATITUDE LONGITUDE NEAREST PROJECT COMPONENT
Wadi Saay Location 1 19°37'52.50"N 57°38'14.60"E Refinery / Export Terminal
Wadi Saay Location 2 19°38'27.70"N 57°38'10.00"E Refinery / Export Terminal
Wadi Saay Location 3 19°38'55.20"N 57°38'28.10"E Refinery / Export Terminal
Nafun Location 1 19°48'25.90"N 57°43'27.90"E Refinery
Nafun Location 2 19°48'9.90"N 57°44'6.00"E Refinery
Antoot Fishing Area 19°42'24.70"N 57°40'36.20"E Refinery / Export Terminal
Dhahr Location 1 19°16'46.80"N 57°36'14.20"E Pipeline / Crude Oil Storage
Dhahr Location 2 19°15'56.20"N 57°37'14.70"E Pipeline / Crude Oil Storage
Dhahr Location 3 19°14'9.10"N 57°37'9.40"E Pipeline / Crude Oil Storage
2.3 EQUIPMENT
Sound level measurements were made at each measurement location using a Rion NL-52 sound level meter. The measurement microphone was a type UC-53A, which was fitted during measurements with a double-skin foam wind shield type WS-15 to ensure adequate protection against wind noise and pressure fluctuations at the microphone. The microphone was mounted at a height of 1.2 m above ground level. An example of the sound measurement setup is shown in Figure 2.1
Figure 2.1: Example setup of sound level measurement equipment
The meter was field-calibrated on site using a Rion NC-74 calibrator prior to and following each set of measurements. The calibration levels were within accepted tolerances (ie < ±0.5 dB) during all calibration procedures. Measurements were made of the local wind speed at each measurement location using a handheld Lutron LM-81 anemometer.

5
Duqm Refinery Project WSP Duqm Refinery & Petrochemical Industries Company Project No 70029220 Confidential June 2017
The calibrator, meter, preamp and microphone assembly were all within certified laboratory calibration at the time of the survey; the relevant calibration certificates are included in Appendix C.
2.4 PROCEDURE
Measurements were made over one, two or three separate 15-minute periods at each measurement position, depending on the steadiness of the noise climate assessed by the survey engineer. It was initially intended to make measurements during evening and night periods at all the Wadi Saay and Nafun locations. This was achieved at the Wadi Saay locations, but safety and security issues encountered during measurements at Nafun on Tuesday 25
th April prohibited
late night measurements at the Nafun locations. Nevertheless, a measurement was made at both Nafun locations during the late evening (and daytime) periods, and as the primary noise source was wind interaction with surfaces and vegetation, the night-time noise levels would be expected to be similar. Furthermore, the Wadi Saay locations are representative of the nearest residential receptors to the Refinery and Export Terminal sites, and will therefore be the worst-case in terms of noise impact from the development. Noise levels were also measured during the daytime at the Antoot and Dhahr areas.

6
Duqm Refinery Project WSP Duqm Refinery & Petrochemical Industries Company Project No 70029220 Confidential June 2017
3 BASELINE NOISE
3.1 SURVEY RESULTS
The noise levels measured at each of the noise monitoring locations are shown in Table 3.1. The noise levels are summarised in terms of the range of the measured LAeq (ambient) and LA90 (background) noise levels. The primary noise source and wind speed measured at each location are also indicated. Detailed monitoring records are shown in Appendix D.
Table 3.1: Summarised Baseline Noise Survey Measurement Results
LOCATION DATE, dd/mm/yy
TIME
PERIOD, hrs PERIOD
DESCRIPTION LAeq RANGE,
dB LA90 RANGE,
dB WIND
SPEED, m/s
PRIMARY NOISE
SOURCE(S)
Wadi Saay Location 1
25/04/17 1509 – 1539 Day 50 – 51 45 – 46 2 – 3 Distant construction noise along Highway 32, wind
26/04/17 0922 – 0952 Day 52 44 2 – 3
Occasional road traffic & construction activity on Highway 32, wind
24/04/17 1807 – 1837 Evening 52 – 53 45 3 – 5 Very occasional road traffic on Highway 32, wind
24/04/17 2317 – 2332 Night 45 – 46 41 2 – 4 Wind
Wadi Saay Location 2
25/04/17 1554 – 1624 Day 46 – 47 40 – 41 2 – 3 Wind
26/04/17 1001 – 1031 Day 44 – 45 39 3 – 4 Wind
24/04/17 1911 – 1956 Evening 49 – 51 41 – 43 4 – 5 Wind
25/04/17 0004 – 0034 Night 42 – 44 38 4 – 5 Wind
Wadi Saay Location 3
26/04/17 1038 – 1108 Day 52 43 – 44 2 – 3
Occasional road traffic & construction activity on Highway 32, wind
26/04/17 1804 – 1834 Evening 49 – 50 44 4 – 5 Very occasional road traffic on Highway 32, wind
25/04/17 2328 - 2358 Night 51 – 52 40 – 41 4 – 5 Wind
Nafun Location 1
25/04/17 1212 – 1242 Day 41 – 42 39 2 – 3 Wind, very occasional local vehicles
25/04/17 2217 - 2232 Evening 42 38 2 – 3 Wind, very occasional local vehicles
Nafun Location 2
25/04/17 1303 – 1348 Day 54 52 – 53 4 – 5 Wind, sea
25/04/17 2241 – 2253 Evening 48 45 4 – 5
Wind, sea – note: measurement cut short for safety reasons
Antoot Fishing Area
25/04/17 1053 - 1123 Day 42 – 44 35 – 36 4 – 5 Wind / sea
Dhahr Location 1
26/04/17 1226 – 1256 Day 46 – 47 38 5 - 7 Occasional local vehicles, wind
Dhahr Location 2
26/04/17 1309 – 1339 Day 46 – 48 39 – 41 4 – 5 Occasional local vehicles, wind
Dhahr Location 3
26/04/17 1403 – 1433 Day 43 – 45 36 2 – 3 Occasional local vehicles, wind

7
Duqm Refinery Project WSP Duqm Refinery & Petrochemical Industries Company Project No 70029220 Confidential June 2017
The results in Table 3.1 indicate that noise levels were steady throughout measurement periods, with small variations of around 1-3 dB. The most prevalent noise source around the area was wind interaction with buildings, surfaces and vegetation. Measured average wind speeds were below 5 ms
-1 during all measurements with the exception of the daytime measurements at Dhahr
Location 1, when speeds measured up to 7 ms-1
. The noise levels measured at this location are considered to be valid due to the additional microphone protection afforded by the double-layer windshield, which ensures measurement accuracy up to higher wind speed ranges. The area around Duqm is generally characterised by relatively high winds, so the noise environment captured during the survey is considered sufficiently representative of normal ambient conditions. No precipitation was encountered during the survey.
The overall mid-points of the measured equivalent sound levels (LAeq) are shown for each location and period in Figure 3.1. This shows that levels around Wadi Saay vary in the approximate range 45-50 dB(A) across day, evening and night-time. Sound levels around Nafun are around 40-50 dB(A) – levels at Nafun Location 2 were slightly higher due to the closer proximity to the sea, and associated contributions from surf sound. Sound levels around Dhahr were typically around 45 dB(A).
Figure 3.1: Mid-point equivalent continuous sound levels measured at all locations
In comparison with the previous baseline survey work, the measurements taken indicate that during periods of low winds (ie < 5ms
-1), noise levels at comparable locations around Nafun and
Duqm are generally somewhat lower than reported during higher wind conditions.

8
Duqm Refinery Project WSP Duqm Refinery & Petrochemical Industries Company Project No 70029220 Confidential June 2017
4 REFERENCES HMR. (2014). Document No 3514-EIA-02 Environmental Impact Assessment Study Report -
Duqm Refinery Construction Camp; Project No: HMR #3514. HMR. (2015). Document No 3514-EIA-01 Environmental Impact Assessment Study Report -
Duqm Refinery; Project No: HMR #3514. HMR. (2015). Document No 3514-EIA-01 Environmental Impact Assessment Study Report -
Duqm Refinery; Project No: HMR #3514. IEC. (2013). IEC 61672-1:2013 Electrocacoustics — Sound level meters — Part 1: Specifications.
Geneva: International Electrotechnical Commission. IFC. (2007). Environmental Health and Safety Guidelines: Environmental. ISO. (1982). ISO 1996-1:1982 Description and measurement of environmental noise — Part 1:
Guide to quantities and procedures. Geneva: International Standards Organisation. ISO. (1987). ISO 1996-2:1987 Description and measurement of environmental noise — Part 2:
Guide to the acquisition of data pertinent to land use. Geneva: International Standards Organisation.
WorleyParsons Oman Engineering. (2015). Environmental Impact Assessment Report: Duqm Liquid Bulk Berths Project.
WorleyParsons Oman Engineering. (2016). Raz Markaz Oil Pipeline Concept Study & FEED Environmental Impact Assessment Report.

Appendix A
PREVIOUS BASELINE NOISE STUDIES

5 NOISE
Noise level measurements were conducted using Integrating and Logging Sound Level Meter (ISLM),
Quest SoundPro. The instrument is capable of measuring equivalent continuous noise levels (Leq)
with standard measurement settings conforming to regulatory requirements. Various locations within
the site and outside the site boundary were chosen based on the rationale that maximum noise is
expected to be generated from within the site and there will be a carry both crosswind and
downwind.
Data was captured for at least 15 minutes at each location - during daytime, evenings and nights (and
holidays) – for the time periods as shown below. These time periods are defined in Article (6) of MD
79/1994.
Workdays (daytime) - A : after 7am and up to 6pm
Workdays (evenings) - B : after 6pm and up to 11pm
Holidays and nights - C : after 11pm and up to 7am
Parameters such as frequency weighting, the time weighting and the measurement time were set
prior to site visit. All sound level measurements followed the procedure prescribed in ANSI standards
(ANSI Standard S1.4). During the monitoring period, Leq along with Lmax and Lmin were recorded.
Weather conditions were normal however; there was excess wind during the measurements. Though
the wind speed was approximately 7 m/s when the measurements were taken, Duqm is inherently a
windy area as observed from wind rose plots earlier. The ambient noise levels are presented in Table
12 and measurement locations and the noise contours presented in Figure 10, Figure 11 and Figure 12
respectively for daytime, evening and night. The noise contours are generated using Surfer Modelling
software which uses Kriging regression.
Noise measurements were undertaken during the first week of September. The rationale for choosing
noise locations is based on the location of sensitive receptors in the buffer zone area (near & far)
given the predominant wind direction. Further, nine locations within the proposed site have been
chosen at 1 km2 grid to cover noise baseline within the entire site.
Table 12: Noise Levels
Location A B C Location A B C
Limits (Leq) 65
dB(A) 60 dB(A)
55 dB(A)
Limits (Leq) 65 dB(A)
60 dB(A)
55 dB(A)
N1D1 Leq 73.2 57.7 51.0 N7D7 Leq 66.0 54.7 53.1
Lmax 86.2 68.5 60.9 Lmax 85.7 63.8 63.9
Lmin 50.4 44.9 44.9 Lmin 48.1 46.3 47.5
N2D2 (Wadi Dhanjart)
Leq 70.9 63.8 57.4 N8D8 Leq 64.8 48.8 53.5
Lmax 88.7 76.0 73.9 Lmax 79.2 57.3 64.8
Lmin 53.7 46.2 44.2 Lmin 50.4 46.4 46.8
4.3.2.1 Appendix A EBS.pdf - Page 24
ESIA Consultants - Michael Lotinga - WSP|Parsons Brinckerhoff - 3/28/2017 1:19:34 PM - 62.6.164.67
ESIA
Con
sulta
nts -
Michae
l Loti
nga -
WSP
|Par
sons
Brin
cker
hoff -
3/28
/2017
1:19
:34 P
M - 62
.6.16
4.67

Location A B C Location A B C
Limits (Leq) 65
dB(A) 60 dB(A)
55 dB(A)
Limits (Leq) 65 dB(A)
60 dB(A)
55 dB(A)
N3D3 (Nafun) Leq 57.0 57.4 47.8 N9D9 Leq 69.9 62.0 58.0
Lmax 71.1 68.7 59.3 Lmax 86.6 80.0 67.9
Lmin 48.5 48.3 44.5 Lmin 53.8 45.3 45.3
N4D4 Leq 57.0 62.0 62.2 N10D10 Leq 73.2 53.9 62.6
Lmax 77.8 74.8 72.6 Lmax 82.6 68.9 79.3
Lmin 45.8 45.5 47.7 Lmin 46.3 44.7 44.4
N5D5 Leq 68.0 57.8 56.5 N11D11 Leq 65.7 59.7 59.4
Lmax 85.5 69.6 68.0 Lmax 82.7 74.1 70.7
Lmin 54.1 49.5 46.3 Lmin 50.3 47.1 48.5
N6D6 Leq 71.1 56.0 60.2 N12D12 (Wadi Al Kahban)
Leq 60.7 63.9 51.5
Lmax 89.1 72.4 80.1 Lmax 79.2 84.8 69.1
Lmin 52.2 48.5 45.7 Lmin 45.9 44.3 44.2
The site is within a dedicated special economic zone and will have various types of commercial
developments in the future. As this is not a dedicated industrial estate, noise levels have been
compared with those stipulated for suburban residential area in MD 79/94. The measurements
indicate that noise levels at certain locations exceed the limits specified for different time intervals i.e.
day, evening and night. High noise levels at N2D2 can be attributed to traffic from the quarrying
activities. Locations N9D9, N10D10 and N11D11 are near dirt tracks linking Road 32 to the beach and
the nearby power and desalination unit which have intermittent traffic that contribute to higher
noise. Locations N12D12, N4D4 and N7D7 are located close to Road 32, where vehicular traffic
contributes to higher noise levels. Higher noise levels at N1D1, N5D5 and N6D6 can be attributed to
environmental disturbances9.
Further, inherently higher noise levels can be attributed to that from the strong winds, which is a
common feature in the Duqm region and also from the surfing noise of the waves considering close
proximity to the coast. In a recent EIA Report for Duqm Industrial and Freezone Masterplan Invalid
source specified. ambient noise monitoring survey was conducted at 10 locations within the RDB
between July and August 2010. The locations and recorded noise measurements are shown in Figure
13. The results indicate that the noise levels at several locations are higher. The noise levels measured
during current study are hence consistent with the previous study and the threshold values at certain
locations exceed limits specified in MD 79/94.
9 Avifaunal squawk and dog barking were noted during the survey.
4.3.2.1 Appendix A EBS.pdf - Page 25
ESIA Consultants - Michael Lotinga - WSP|Parsons Brinckerhoff - 3/28/2017 1:19:34 PM - 62.6.164.67
ESIA
Con
sulta
nts -
Michae
l Loti
nga -
WSP
|Par
sons
Brin
cker
hoff -
3/28
/2017
1:19
:34 P
M - 62
.6.16
4.67

Figure 10: Noise Contours (Daytime)
4.3.2.1 Appendix A EBS.pdf - Page 26
ESIA Consultants - Michael Lotinga - WSP|Parsons Brinckerhoff - 3/28/2017 1:19:34 PM - 62.6.164.67ESIA Consultants - M
ichael Lotinga - WSP|Parsons Brinckerhoff -
3/28/2017 1:19:34 PM - 62.6.164.67

Figure 11: Noise Contours (Evening)
4.3.2.1 Appendix A EBS.pdf - Page 27
ESIA Consultants - Michael Lotinga - WSP|Parsons Brinckerhoff - 3/28/2017 1:19:34 PM - 62.6.164.67ESIA Consultants - M
ichael Lotinga - WSP|Parsons Brinckerhoff -
3/28/2017 1:19:34 PM - 62.6.164.67

Figure 12: Noise Contours (Night)
4.3.2.1 Appendix A EBS.pdf - Page 28
ESIA Consultants - Michael Lotinga - WSP|Parsons Brinckerhoff - 3/28/2017 1:19:34 PM - 62.6.164.67ESIA Consultants - M
ichael Lotinga - WSP|Parsons Brinckerhoff -
3/28/2017 1:19:34 PM - 62.6.164.67
Figure 13: Noise Measurement Locations and Noise Levels by 5 Oceans10
10 Source: (5 Oceans, 2011)
4.3.2.1 Appendix A EBS.pdf - Page 29
ESIA Consultants - Michael Lotinga - WSP|Parsons Brinckerhoff - 3/28/2017 1:19:34 PM - 62.6.164.67ESIA Consultants - M
ichael Lotinga - WSP|Parsons Brinckerhoff -
3/28/2017 1:19:34 PM - 62.6.164.67

DUQM LIQUID BULK BERTHS PROJECT
REPORT-ENVIRONMENTAL IMPACT ASSESSMENT
SEZAD-DPTC-00-WP-EV-REP-3001 Page 183 of 289 Rev B2 (22-Sep-2015)) Project Internal
Table 6-11: Ambient Dust Levels
Location 5/6-Jan-2015 26/27-Jan-2015 20-Aug-2015
PM2.5 PM10 TSP PM2.5 PM10 TSP PM2.5 PM10 TSP
DF1 7 12 12 2 8 12 14 34 36
DF2 6 9 9 2 12 14 20 48 49
DF3 8 13 13 2 6 6 18 62 73
DF4 4 7 7 2 9 9 18 80 92
DF5 4 8 9 2 11 12 16 35 37
DF6 3 4 4 2 5 9 16 42 45
DF7 4 6 7 4 8 14 19 54 57
DF8 3 8 8 3 6 7 17 78 82
DF9 - - - 2 6 6 19 46 49
Say Village 16 52 52 - - - 20 54 92
NOTE: All readings measured in µg/m3
From the above table, it can be seen that the dust levels during August 2015 is higher than that
during January 2015. The primary reason for this is the presence of trucks transporting construction
material (soil) around the monitoring locations (during January measurements, there were no trucks
on the road connecting LBW to the Highway 32; and lesser number of construction vehicles at other
locations). Further, the wind speed during August measurements were in the range of 6 to 9 m/s;
while the wind speed during January measurements were between 3 and 4 m/s.
The USEPA NAAQS does not specify standard for TSP and regulates TSP through the quantities of
PM2.5 and PM10. The NAAQS specifies the following limits for PM2.5 and PM10:
PM2.5 annual standard (primary) 12 µg/m3 and (secondary) 15 µg/m
3
PM2.5 – 24-hr standard: 35 µg/m3
PM10 – 24-hr standard: 150 µg/m3
Although, Table 6-11 represents the spot readings for a period of 15 minutes; comparison with
USEPA NAAQS shows that the potential for exceedances in the present setting is low.
6.15 Noise
Past Noise Studies 6.15.1
A number of baseline studies have been undertaken in Duqm; and noise levels were assessed in two
studies, available with WorleyParsons. The Duqm Industrial and Free Zone Master Plan – Final EIA
Report, for Jurong, June 2011 and the Q3 Report Environmental Baseline Study for Duqm
4.3.5.3 DPTC-EIA.pdf - Page 183
ESIA Consultants - Michael Lotinga - WSP|Parsons Brinckerhoff - 3/28/2017 1:36:25 PM - 62.6.164.67
ESIA
Con
sulta
nts -
Michae
l Loti
nga -
WSP
|Par
sons
Brin
cker
hoff -
3/28
/2017
1:36
:25 P
M - 62
.6.16
4.67

DUQM LIQUID BULK BERTHS PROJECT
REPORT-ENVIRONMENTAL IMPACT ASSESSMENT
SEZAD-DPTC-00-WP-EV-REP-3001 Page 184 of 289 Rev B2 (22-Sep-2015)) Project Internal
Development and Surroundings, for SEZAD, March 2013, undertook noise monitoring at 3 locations.
Figure 6-37 below presents the locations where daytime monitoring was undertaken. It should be
noted that the entire DLBB Project area has been demarcated for industrial activity and hence
comparison was made against the industrial standard
Figure 6-37: Historic Noise Monitoring Locations
It can be seen from the above figure, that monitoring was undertaken along roads (marked yellow in
figure) and represents a measure of noise from road traffic in an industrial area. Table 6-12presents a
summary of the comparison.
Table 6-12: Historic Noise Monitoring Locations
Location October 2012 November 2012 Day Time Noise Level in Industrial Area from Road Traffic
LA-eq LA-eq
DF1 41.3 45.5
70
DF2 55.1 52.4
DF3 62.7 44.6
Note: all readings measured in dBA
A review of the above table shows that the noise levels are within the proposed standards.
DRAWN: DATE:
CHECKED: DATE:
ENGINEER: DATE:
PROC ENG: DATE:
WorleyParsons SelectDraw Version 2.08
1
B
C
D
E
F
G
1 2 3 4 5 6 7 8 9 10 11 12
H
A
2 3 4 5 6 7 8 9 10 11 12
A
R EF ER EN C E D R A WIN GS
DRAWING No. TITLE
Historic no ise masuremnt locations
B
C
D
E
F
G
H
11 june SP AC M B
R EVISION S
DESCRIPTION ENG CLIENT SCALENo. DATE DRAWN CHECKED APPROVED DRAWING NUM BER REV
N1
N2
N3
DLBB Project
4.3.5.3 DPTC-EIA.pdf - Page 184
ESIA Consultants - Michael Lotinga - WSP|Parsons Brinckerhoff - 3/28/2017 1:36:25 PM - 62.6.164.67
ESIA
Con
sulta
nts -
Michae
l Loti
nga -
WSP
|Par
sons
Brin
cker
hoff -
3/28
/2017
1:36
:25 P
M - 62
.6.16
4.67

DUQM LIQUID BULK BERTHS PROJECT
REPORT-ENVIRONMENTAL IMPACT ASSESSMENT
SEZAD-DPTC-00-WP-EV-REP-3001 Page 185 of 289 Rev B2 (22-Sep-2015)) Project Internal
Current Noise Studies 6.15.2
The noise survey were undertaken at the nine ambient air quality monitoring locations and at Say
village (near the main road) to measure the equivalent continuous (LA-eq), and maximum and minimum
sound levels (LA-max and LA-min) in the DLBB Project area. The survey was undertaken using the hand
held Bruel & Kjaer Model 2250 sound level meter. Ambient noise survey was carried out on three
occasions – first when the diffusion tubes were installed on 5/6-Jan 2015, second when the tubes
were retrieved on 26/27-Jan-2015, and third on 19 and 20-Aug-2015.
It should be noted that the DLBB Project area has been designated for industrial development and
hence deemed as an industrial area. As per MD 79/94 the permissible LA-eq are as presented in
Table 6-13.
Table 6-13: Permissible LA-eq Limits as per MD 79/94
Type of Area Source of Noise Daytime Limit (7 am to 6 pm)
Evening Time Limit (6 pm to 11 pm)
Night Time Limit (11 pm to 7 am)
Industrial and commercial
Industrial plants and public works 70 70 70
Road traffic 70 65 60
NOTE: All units in dB(A).
Table 6-14 presents the ambient noise levels recorded at the measuring locations. In the last column
of the table the applicable limit prescribed in MD 79/94 is mentioned for comparison. The noise levels
were measured during day time. It must be noted that the current source of noise is road traffic.
However, the future the main source of noise will be industrial plants. It is further understood that the
Say village will be relocated to another location; thus, the monitoring location at Say village is also
considered as industrial and commercial area. Accordingly, limit of 70 dB(A) applies to all locations.
Table 6-14: Ambient Noise Levels Measured at Site
Location 5/6-Jan-2015 26/27-Jan-2015 19-Aug-2015 20-Aug-2015
LA-max LA-min LA-eq LA-max LA-min LA-eq LA-max LA-min LA-eq LA-max LA-min LA-eq
DF1 73.27 33.17 51.60 61.62 39.00 42.49 53.7 49.2 51.3 61.6 58.0 59.9
DF2 52.51 33.30 38.37 67.09 39.52 43.61 59.1 54.5 57.3 64.0 59.3 62.0
DF3 - - - 70.99 30.81 46.27 47.5 39.9 43.1 47.3 44.2 45.5
DF4 69.74 35.95 42.81 74.10 37.33 43.85 54.4 47.7 50.2 56.2 50.8 53.2
DF5 76.92 47.91 58.14 70.64 29.16 42.72 61.4 50.3 55.0 49.1 42.2 46.2
DF6 64.75 33.12 44.47 74.39 31.19 42.14 60.5 52.3 55.6 44.6 42.2 43.5
DF7 75.51 28.67 48.40 66.18 43.73 46.82 56.7 47.8 50.5 53.2 49.6 51.5
DF8 58.22 27.94 40.72 59.12 38.77 43.57 54.7 44.0 50.7 51.8 48.0 50.0
DF9 65.28 29.01 44.74 63.85 38.41 42.96 64.4 56.5 60.3 52.9 48.3 50.2
4.3.5.3 DPTC-EIA.pdf - Page 185
ESIA Consultants - Michael Lotinga - WSP|Parsons Brinckerhoff - 3/28/2017 1:36:25 PM - 62.6.164.67
ESIA
Con
sulta
nts -
Michae
l Loti
nga -
WSP
|Par
sons
Brin
cker
hoff -
3/28
/2017
1:36
:25 P
M - 62
.6.16
4.67

DUQM LIQUID BULK BERTHS PROJECT
REPORT-ENVIRONMENTAL IMPACT ASSESSMENT
SEZAD-DPTC-00-WP-EV-REP-3001 Page 186 of 289 Rev B2 (22-Sep-2015)) Project Internal
Location 5/6-Jan-2015 26/27-Jan-2015 19-Aug-2015 20-Aug-2015
LA-max LA-min LA-eq LA-max LA-min LA-eq LA-max LA-min LA-eq LA-max LA-min LA-eq
Say* 75.00 44.38 56.75 - - - 64.2 60.7 62.4 63.3 60.0 61.6
NOTE: All units in dB(A); *Say means the Say Village
From the above table it can be seen that the ambient LA-eq levels measured around the LBW and near
the main road in Say village during January as well as August are below applicable standard limits.
However, the LA-eq levels measured in August are mostly higher than the LA-eq levels measured in
January. This is because there are more construction vehicles plying the road connecting LBW to the
Highway 32 in August than in January (when there were no trucks moving on this road). Further, the
wind speed during measurements in August were higher the wind speed during measurements in
January.
6.16 Terrestrial Ecology
The study of ecology and biodiversity is an important part of any baseline survey as it sustains the
basic needs of the society. The most ecologically important areas in Oman, on account of the highest
species diversity and concentration of endemic species, are in the mountains of Dhofar and the Al
Hajar Mountains of Northern Oman.
The Duqm region is important from the perspective of biological diversity which needs to be
conserved for its productivity, regulation of climate and ecosystem services. The main objective of the
ecological baseline study is to collect adequate ecological information of the proposed development
and its vicinity to establish a baseline ecological status of the area.
This section provides a characterization of the ecological conditions in the study area, based on
primary survey data and secondary supporting literature of the area. Secondary data has been
collated from for the study area previous environmental impact assessment studies carried out and
academic research relevant to this areas. This sections deal with the habitat types in the study area,
prevalent flora and fauna found during the site survey and their present status as per the Red List
from International Union for Conservation of Nature (IUCN). The major factors that influence the
distribution of flora and fauna in this biome are topography, elevation, distance from the sea and the
extent of salt water intrusion.
As highlighted in the EIA Scoping report for the DLBB Project (Doc. No. SEZAD-DPTC-00-WP-EV-
REP-0001) the study area for the terrestrial ecological study was restricted to 1 km radius around the
LBW. Figure 6-38 below presents the extent of the study area.
4.3.5.3 DPTC-EIA.pdf - Page 186
ESIA Consultants - Michael Lotinga - WSP|Parsons Brinckerhoff - 3/28/2017 1:36:25 PM - 62.6.164.67
ESIA
Con
sulta
nts -
Michae
l Loti
nga -
WSP
|Par
sons
Brin
cker
hoff -
3/28
/2017
1:36
:25 P
M - 62
.6.16
4.67

RAS MARKAZ OIL PIPELINE CONCEPT STUDY & FEED ENVIRONMENTAL IMPACT ASSESSMENT REPORT
RMZ-9-2028-001-Q9-4 Rev C Date (29 May 2016) Page 170 of 247
On account of high wind speeds exceedances in dust levels were recorded between:
KM-370 to KM-380
KM-380 to KM-400
KM-400 to KM-410
It may be said that the ambient condition in these area represents days with high dust levels. As dust
is expected to be a significant emission from project operation emphasis must be placed on the
management of dust during the construction phase.
5.10 Ambient Noise Levels
The noise survey was undertaken at about 70 locations to measure the LAeq and the maximum (LAmax)
and minimum (LAmin) sound levels. The survey was undertaken using the hand held Bruel & Kjaer
Model 2250 sound level meter. Table 5-18 presents the range of LAeq monitored at the sections.
Appendix 3 presents the noise readings.
Table 5-18: Ambient Noise Levels (Summary)
Section Ambient Noise Levels (dB(A)) LAeq range
Min Max
KM-0 to KM-10 50.9 59.5
KM-10 to KM-20 43.1 61.2
KM-20 to KM-130 36.5 49.4
KM-130 to KM-300 37.8 46.8
KM-310 to KM-330 35.3 45
KM-330 to KM-340 (a) 50.1 61.8
KM-340 to KM-370 (a) 44.2 56.4
KM-370 to KM-380 (a) 57.6 71.2
KM-380 to KM-400 (a) 57 64.5
KM-400 to KM-410 (a) (c) (c)
KM-410 to KM-421.5 (a) 45.8 54.9
Notes:
(a) High wind speeds were recorded at these stations over 8 m/s.
(b) Measurements were taken between 15 to 19 November and 7 to 11 December 2015
(c) No readings were taken
The noise levels presented in Table 5-18 were compared with MD 79/94 for noise pollution control in
public environment. The MD defines the allowable daytime noise level as a result of industrial plants
and public works in rural recreational area as 45 dB(A). This standard was exceeded at a number of
4.3.6.2 RMZ-9-2028-001-Q9-4-C.PDF - Page 170
ESIA Consultants - Michael Lotinga - WSP|Parsons Brinckerhoff - 3/28/2017 1:36:44 PM - 62.6.164.67
ESIA
Con
sulta
nts -
Michae
l Loti
nga -
WSP
|Par
sons
Brin
cker
hoff -
3/28
/2017
1:36
:44 P
M - 62
.6.16
4.67
RAS MARKAZ OIL PIPELINE CONCEPT STUDY & FEED ENVIRONMENTAL IMPACT ASSESSMENT REPORT
RMZ-9-2028-001-Q9-4 Rev C Date (29 May 2016) Page 171 of 247
locations, however there was no specific sources and represents the natural ambient condition. It
should be noted that between KM-330 to KM-421.5 the high wind speed was the primary cause for
exceedance.
5.11 Existing Pipeline ROW
The project shares its ROW with an existing pipeline in the section KM-0 to KM-70 i.e. a total of 70
km. The Ras Markaz Nahadha Oil Pipeline travels along the 36” Qarn Alam-Al Nahadha Oil Pipeline.
Figure 5-22 highlights areas shared by the Ras Markaz Oil Pipeline project with existing pipeline in
two areas.
Figure 5-22: ROW shared with existing pipelines
5.12 Existing Infrastructure
The initial site visit/ route reconnaissance exercises, identified several existing graded/blacktop roads
and Over Head Line/buried power/utility cables. Listed below are the significant crossings observed
during the site visit:
23 crossings with Route 31 (Muscat - Salalah ) and 32 (Muscat – Al Mahout – Duqm – Ras
Markaz)
52 graded roads at various concession areas
16 overhead electric lines
4.3.6.2 RMZ-9-2028-001-Q9-4-C.PDF - Page 171
ESIA Consultants - Michael Lotinga - WSP|Parsons Brinckerhoff - 3/28/2017 1:36:44 PM - 62.6.164.67
ESIA
Con
sulta
nts -
Michae
l Loti
nga -
WSP
|Par
sons
Brin
cker
hoff -
3/28
/2017
1:36
:44 P
M - 62
.6.16
4.67

RAS MARKAZ OIL PIPELINE CONCEPT STUDY & FEED ENVIRONMENTAL IMPACT ASSESSMENT REPORT
RMZ-9-2028-001-Q9-4 Rev C Date (29 May 2016) Page 245 of 247
RH /Temp TSP PM10 PM2.5 Leq Lmax Lmin
KM
-0 t
o
KM
-10
35/31 ⁰C - - - 54.8 55.1 54.2
37/30 ⁰C 0.049 0.037 0.007 51.8 55.1 50.2
33/31⁰C 0.006 0.03 0.034 59.5 60.5 58.5
28/34⁰C 0.006 0.021 0.028 50.9 57.1 45.3
KM
-10
to
KM
-20
- 0.034 0.027 0.005 - - -
26/32⁰C 0.021 0.016 0.005 43.3 44.3 42.3
26/32⁰C 0.017 0.021 0.005 43.1 44.2 41.2
25/32⁰C 0.016 0.014 0.005 44.4 52.1 41.2
25/32⁰C 0.03 0.029 0.016 61.2 70.3 51.2
17/34⁰C 0.042 0.016 0.008 49.2 49.7 48.8
22/31⁰C 0.014 0.013 0.003 48.6 52.5 47
KM
-20
to
KM
-13
0
51/27⁰C 0.016 0.015 0.005 47.8 51.7 44.9
49/29⁰C 0.027 0.025 0.006 39.8 44.3 37.8
47/28⁰C 0.02 0.018 0.006 44.4 53.7 40.8
45/28⁰C 0.029 0.026 0.009 36.5 42.2 34.1
35/33⁰C 0.064 0.017 0.005 44.1 48.3 41.1
36/33⁰C 0.196 0.141 0.01 48.8 50.2 48
36/32⁰C 0.033 0.02 0.005 43.2 53.4 36
36/30⁰C 0.022 0.015 0.006 42.8 43.9 41.9
31/32⁰C 0.027 0.022 0.005 39.6 41.5 38
24/32⁰C 0.03 0.013 0.003 51.8 58.6 46.9
23/32⁰C 0.02 0.015 0.003 46.1 49.6 44.4
19/35⁰C 0.025 0.01 0.004 42.5 48.6 38.7
20/31⁰C 0.042 0.024 0.002 44.4 49.1 40.6
19/31⁰C 0.042 0.024 0.002 43.3 48.2 41.6
59/24⁰C 0.039 0.036 0.009 44.7 50.9 43.1
60/24⁰C 0.039 0.036 0.009 49.4 57.2 42.8
36/28⁰C 0.057 0.048 0.009 42.9 44.5 41.9
KM
-130
to
KM
-310
- - - - 36.6 45 35.3
19/2⁰C 0.072 0.037 0.01 46.8 48.4 44.9
24/30⁰C 0.02 0.018 0.005 38.1 43.9 35
18/32⁰C 0.051 0.04 0.006 43.8 45.3 42.4
18/32⁰C 0.051 0.4 0.006 42.4 45.5 41.4
19/31⁰C 0.038 0.033 0.009 42 43 41.1
51/27 0.048 0.044 0.022 37.8 47.8 33.3
37/29 0.034 0.026 0.006 43.2 47.4 41.7
35/30 0.017 0.013 0.006 44.2 48 42.1
31/30 0.046 0.029 0.005 44.4 46 43.3
40/29 0.013 0.01 0.006 45.2 47 43.3
43/28 0.02 0.016 0.007 43.6 45.7 42.7
41/29 0.018 0.017 0.006 43 44.4 41.8
47/28 0.02 0.015 0.007 45.2 46.4 44.6
4.3.6.2 RMZ-9-2028-001-Q9-4-C.PDF - Page 260
ESIA Consultants - Michael Lotinga - WSP|Parsons Brinckerhoff - 3/28/2017 1:36:44 PM - 62.6.164.67
ESIA
Con
sulta
nts -
Michae
l Loti
nga -
WSP
|Par
sons
Brin
cker
hoff -
3/28
/2017
1:36
:44 P
M - 62
.6.16
4.67

RAS MARKAZ OIL PIPELINE CONCEPT STUDY & FEED ENVIRONMENTAL IMPACT ASSESSMENT REPORT
RMZ-9-2028-001-Q9-4 Rev C Date (29 May 2016) Page 246 of 247
RH /Temp TSP PM10 PM2.5 Leq Lmax Lmin
KM
-31
0 t
o
KM
-330
36/24 0.1 0.071 0.013 43.3 45.5 40.5
37/26 0.084 0.063 0.009 45 48.7 41.3
42/26 0.037 0.021 0.008 35.3 43.5 33.3
43/26 - - 0.007 - - -
KM
-33
0
to K
M-
34
0 26/28 0.094 0.076 0.025 61.8 64.5 58.4
31/23 0.089 0.084 0.035 50.1 51.9 48
49/18 0.042 0.039 0.01 52.7 56.4 50
KM
-34
0 t
o K
M-3
70
56/16 0.022 0.022 0.01 54.1 61.9 44
51/16 0.044 0.036 0.011 52.9 55.8 49.9
51/18 0.091 0.061 0.015 44.2 49.4 40.3
44/21 0.091 0.061 0.015 47.6 54.4 42.2
43/21 0.075 0.04 0.011 54.2 60 45.9
43/21 0.27 0.024 0.006 52.5 58.9 44.9
41/22 0.038 0.032 0.011 56.4 58.2 54.9
36/24 0.091 0.076 0.02 54.7 59.6 52.8
33/24 0.123 0.103 0.028 52 58.9 49
28/25 0.134 0.127 0.056 - - -
KM
-3
70
to
K
M-
38
0 25/26 0.376 0.302 0.091 57.6 59.6 56.9
25/26 0.358 0.307 0.074 71.2 72.4 69.4
KM
-3
80
to
K
M-
40
0 31/25 0.484 0.344 0.085 57 58.6 54.5
28/27 0.312 0.268 0.076 64.5 66.9 61.2
KM
-40
0
to K
M-
41
0 36/23 - - - - - -
35/23 0.385 0.339 0.068 - - -
35/23 0.377 0.295 0.073 59.9 62.4 56.6
KM
-410
to
K
M-4
21.5
53/21 0.178 0.125 0.018 50.6 54.4 45.7
49/21 0.145 0.116 0.017 54.9 57.5 51.3
47/21 0.095 0.074 0.013 45.8 49 42.9
38/22 0.32 0.24 0.026 62.7 66.5 57.9
4.3.6.2 RMZ-9-2028-001-Q9-4-C.PDF - Page 261
ESIA Consultants - Michael Lotinga - WSP|Parsons Brinckerhoff - 3/28/2017 1:36:44 PM - 62.6.164.67
ESIA
Con
sulta
nts -
Michae
l Loti
nga -
WSP
|Par
sons
Brin
cker
hoff -
3/28
/2017
1:36
:44 P
M - 62
.6.16
4.67

ESIA for Ras Markaz Crude Oil Park Environmental & Social Impact Assessment Sultanate of Oman HMR# 4132
HMR Consultants 107 Version 1 Doc: 1-14-5440/9(4132 ESIA) October 2015
# GPS Coordinates (m) Dust Concentration MECA AAQS – 3
D8 583451 2116730 0.088
D9 580958 2116724 0.088
D10 578332 2116689 0.084
D11 578321 2118619 0.080
D12 578305 2119775 0.083 125
D13 580803 2117833 0.084
D14 579793 2121828 0.078
On comparison of thee measured dust levels with the OAAQS, it is seen that the dust levels measured
at all locations are within the standards limits. Graphical representation of dust concentration has been
provided in Figure 4-18.
Figure 4-18: Graphical Representation of Dust Concentration
4.8 Noise Monitoring
The proposed site currently has no noise significant sources located within several kilometres. Given
the isolated location of the proposed site, vehicular traffic noise is similarly restricted. Current
anthropogenic sources of noise in the area include operation of fishing boats, movement of
fishermen’s vehicles and the fish unloading area.
Noise monitoring was carried out at 13 locations. Noise monitoring locations are presented in Figure
4-20. Noise level measurements were conducted using Integrating and Logging Sound Level Meter
(ISLM), Quest SoundPro which is capable of measuring equivalent continuous noise levels (Leq).
Noise levels were measured for 15mins at each location- during day and evening times as defined in
Article (6) of MD 79/1994.
Workdays (daytime) - A : after 7am and up to 6pm
Workdays (evenings) - B : after 6pm and up to 11pm
0
0.02
0.04
0.06
0.08
0.1
0.12
0.14
1 2 3 4 5 6 7 8 9 10 11 12 13 14
Dust Read
ing
Location
Dust
DustConcentation
4.3.3.1 OTTCO-EIA.pdf - Page 144
ESIA Consultants - Michael Lotinga - WSP|Parsons Brinckerhoff - 3/28/2017 1:35:37 PM - 62.6.164.67
ESIA C
onsu
ltants
- Mich
ael L
oting
a - W
SP|Pars
ons B
rinck
erhoff
- 3/28
/2017
1:35
:37 P
M - 62.6
.164.6
7

ESIA for Ras Markaz Crude Oil Park Environmental & Social Impact Assessment Sultanate of Oman HMR# 4132
HMR Consultants 108 Version 1 Doc: 1-14-5440/9(4132 ESIA) October 2015
Holidays and nights - C : after 11pm and up to 7am
Weather conditions were normal and there was no excess wind during the measurements. Wind
speeds were measured using a hand-held anemometer simultaneously with noise measurements to
ensure that the wind speeds were less, as high wind speeds would lead to errors in the measured noise
levels. The ambient noise levels during daytime, evening and night are presented in Table 4-16.
Table 4-16: Ambient Noise Level
# UTM co-ordinates Noise
Omani Standard5 Easting Northing Leq Lmin Lmax
Daytime (7:00am to 6:00pm)
N1 578278 2120759 37.8 29.5 54.3
70
N2 578998 2120752 38.7 29.4 65.1
N3 580006 2120767 48.7 43.7 63.3
N4 580876 2119370 50.2 33.8 67.7
N5 583005 2119492 58.0 28.2 71.8
N6 583422 2118806 56.6 25.9 67.7
N7 583477 2117825 51.7 26.0 66.3
N8 583451 2116730 32.9 25.9 55.0
N9 580958 2116724 44.6 28.1 62.3
N10 578332 2116689 33.6 26.3 57.3
N11 578321 2118619 38.0 30.2 58.0
N12 578305 2119775 41.0 31.3 56.0
N13 580803 2117833 32.3 24.8 54.4
N14 579793 2121828 40.4 33.8 67.8
Evening Time (6:00pm to 11:00pm)
N1 578278 2120759 70.6 46.0 83.7
70
N2 578998 2120752 63.8 43.5 81.1
N3 580006 2120767 89.0 56.9 104.6
N4 580876 2119370 71.5 50.6 87.3
N5 583005 2119492 77.2 47.7 92.7
N6 583422 2118806 86.1 52.8 99.1
5Ambient noise standards issued under MD 79/94 from industrial sources applicable to the proposed park (Industrial and
Commercial)
4.3.3.1 OTTCO-EIA.pdf - Page 145
ESIA Consultants - Michael Lotinga - WSP|Parsons Brinckerhoff - 3/28/2017 1:35:37 PM - 62.6.164.67
ESIA C
onsu
ltants
- Mich
ael L
oting
a - W
SP|Pars
ons B
rinck
erhoff
- 3/28
/2017
1:35
:37 P
M - 62.6
.164.6
7

ESIA for Ras Markaz Crude Oil Park Environmental & Social Impact Assessment Sultanate of Oman HMR# 4132
HMR Consultants 109 Version 1 Doc: 1-14-5440/9(4132 ESIA) October 2015
# UTM co-ordinates Noise
Omani Standard5 Easting Northing Leq Lmin Lmax
N7 583477 2117825 84.4 63.5 96.9
N8 583451 2116730 89.0 54.2 101
N9 580958 2116724 90.4 55.1 102.3
N10 578332 2116689 80.3 68.1 91.9
N11 578321 2118619 93.6 73.9 103.7
N12 578305 2119775 75.4 56.7 88.5
N13 580803 2117833 86.0 53.4 98.1
N14 579793 2121828 66.5 43.8 86.7
From the table it is observed that the noise measured during Daytime and Evening time) are well
below the applicable Omani standard except the evening time at all locations except N2 and N14. As
this is dedicated industrial estate, noise levels have been compared with those stipulated for industrial
area in MD 79/94. The measurements indicate that noise levels at certain locations exceed the limits
specified for evening time intervals. The area is currently devoid of any industrial activities. The
inherently higher noise levels can be attributed to that from the strong winds, which is a common
feature in the region considering the open nature of the entire site and also from the surfing noise of
the waves for locations in close proximity to the coast. The results are consistent with the readings
obtained for earlier baseline studies undertaken for SEZAD and for the ESIA of the industrial
development zone of Duqm. These studies have also recorded values which exceed the rural threshold
for some locations and the industrial source threshold values at different time intervals specified in
MD 79/94. Noise level interpretations are graphically presented in Figure 4-19.
4.3.3.1 OTTCO-EIA.pdf - Page 146
ESIA Consultants - Michael Lotinga - WSP|Parsons Brinckerhoff - 3/28/2017 1:35:37 PM - 62.6.164.67
ESIA C
onsu
ltants
- Mich
ael L
oting
a - W
SP|Pars
ons B
rinck
erhoff
- 3/28
/2017
1:35
:37 P
M - 62.6
.164.6
7

ESIA for RSultanate
HMR ConDoc: 1-14
L1
Ras Markaz Cruof Oman
nsultants 4-5440/9(4132 E
Fi
0
10
20
30
40
50
60
70
80
90
100
1
Leq‐1
ude Oil Park
ESIA)
igure 4-19:
2 3 4
Graphical
5 6 7
Loca
110
Represen
8 9 10 1
ations
Noise
Env
tation of N
11 12 13 1
vironmental &
oise Resul
14
D
E
O(
Social Impact AH
Oc
lts
Day time
Evening time
Omani standaDay & Evenin
Assessment HMR# 4132
Version 1 ctober 2015
rdsg)
4.3.3.1 OTTCO-EIA.pdf - Page 147
ESIA Consultants - Michael Lotinga - WSP|Parsons Brinckerhoff - 3/28/2017 1:35:37 PM - 62.6.164.67
ESIA C
onsu
ltants
- Mich
ael L
oting
a - W
SP|Pars
ons B
rinck
erhoff
- 3/28
/2017
1:35
:37 P
M - 62.6
.164.6
7

ESIA for Ras Markaz Crude Oil Park Environmental & Social Impact Assessment Sultanate of Oman HMR# 4132
HMR Consultants 111 Version 1 Doc: 1-14-5440/9(4132 ESIA) October 2015
4.3.3.1 OTTCO-EIA.pdf - Page 148
ESIA Consultants - Michael Lotinga - WSP|Parsons Brinckerhoff - 3/28/2017 1:35:37 PM - 62.6.164.67
ESIA Consultants - Michael Lotinga - W
SP|Parsons Brinckerhoff - 3/28/2017 1:35:37 PM - 6
2.6.164.67

ESIA for Ras Markaz Crude Oil Park Environmental & Social Impact Assessment Sultanate of Oman HMR# 4132
HMR Consultants 112 Version 1 Doc: 1-14-5440/9(4132 ESIA) October 2015
Figure 4-20: Onshore Sampling Location
4.3.3.1 OTTCO-EIA.pdf - Page 149
ESIA Consultants - Michael Lotinga - WSP|Parsons Brinckerhoff - 3/28/2017 1:35:37 PM - 62.6.164.67
ESIA Consultants - Michael Lotinga - W
SP|Parsons Brinckerhoff - 3/28/2017 1:35:37 PM - 6
2.6.164.67

Appendix B
SURVEY LOCATIONS

2017 Baseline Noise Survey Locations

Appendix C
CALIBRATION CERTIFICATES

Sound measurement equipment calibration certificates


Appendix D
SOUND MEASUREMENT RECORDS

Project: Duqm Refinery Job Number: 70029220
Equipment: Rion NL-52 Kit E Engineer: Paul DoylePre-Calibration Level: 94.0 General Weather Description: Day: Hot, Sunny. Evening/Night: HotPost-Calibration Level: 94.0
Date Time ElapsedMinutes
Wind Speed(m/s)
Wind Direction(from) Temperature (°C) LAeq LAmax LA01 LA10 LA90
24/04/2017 18:07 15:00 3-5 SW 30+ 53.2 78.5 59.2 56.8 45.024/04/2017 18:22 15:00 3-5 SW 30+ 52.0 68.2 58.2 55.8 44.624/04/2017 23:17 15:00 2-4 SW 25+ 46.1 60.6 50.7 48.9 40.524/04/2017 23:32 15:00 2-4 SW 25+ 44.6 63.8 48.9 47.3 40.925/04/2017 15:09 15:00 2-3 SW 35+ 49.5 64.2 54.1 51.8 45.025/04/2017 15:24 15:00 2-3 SW 35+ 50.6 63.4 55.5 53.8 45.726/04/2017 09:22 15:00 2-3 SW 30+ 52.0 71.3 57.9 53.9 43.726/04/2017 09:37 15:00 2-3 SW 30+ 51.6 66.0 58.0 54.3 43.9
Measurement Period Weather Statistical Noise Levels / dB Description of Audible Noise
Noise Monitoring Form
Location: Wadi Saay Location 1
Very occasional road traffic on Highway 32, wind
WindWind
Occasional road traffic & construction activity on Highway 32, windOccasional road traffic & construction activity on Highway 32, wind
Distant construction noise along road, windDistant construction noise along road, wind
Very occasional road traffic on Highway 32, wind

Project: Duqm Refinery Job Number: 70029220
Equipment: Rion NL-52 Kit E Engineer: Paul DoylePre-Calibration Level: 94.0 General Weather Description: Day: Hot, Sunny. Evening/Night: HotPost-Calibration Level: 94.0
Date Time ElapsedMinutes
Wind Speed(m/s)
Wind Direction(from) Temperature (°C) LAeq LAmax LA01 LA10 LA90
24/04/2017 19:11 15:00 4-5 SW 30+ 48.7 69.5 53.9 51.3 41.424/04/2017 19:26 15:00 4-5 SW 30+ 51.1 70.8 56.5 53.7 41.724/04/2017 19:41 15:00 4-5 SW 25+ 51.0 75.9 55.4 53.1 42.525/04/2017 00:04 15:00 4-5 SW 25+ 42.1 59.7 46.1 44.9 37.825/04/2017 00:19 15:00 4-5 SW 25+ 44.1 61.2 47.2 45.4 38.125/04/2017 15:54 15:00 2-3 SW 35+ 45.8 54.8 49.8 49.1 40.025/04/2017 16:09 15:00 2-3 SW 35+ 47.3 65.0 51.4 49.3 40.726/04/2017 10:01 15:00 3-4 SW 30+ 44.1 58.7 48.3 46.3 39.326/04/2017 10:16 15:00 3-4 SW 30+ 44.9 70.0 48.5 46.7 39.1
Wind
WindWindWindWindWind
Noise Monitoring Form
Location:
Measurement Period Weather Statistical Noise Levels / dB Description of Audible Noise
Wadi Saay Location 2
Wind
WindWind

Project: Duqm Refinery Job Number: 70029220
Equipment: Rion NL-52 Kit E Engineer: Paul DoylePre-Calibration Level: 94.0 General Weather Description: Day: Hot, Sunny. Evening/Night: HotPost-Calibration Level: 94.0
Date Time ElapsedMinutes
Wind Speed(m/s)
Wind Direction(from) Temperature (°C) LAeq LAmax LA01 LA10 LA90
25/04/2017 23:28 15:00 4-5 SW 25+ 51.2 69.5 57.2 55.3 40.325/04/2017 23:43 15:00 4-5 SW 25+ 51.5 70.3 57.4 55.5 41.026/04/2017 18:04 15:00 4-5 SW 30+ 49.4 62.4 53.6 52.4 43.926/04/2017 18:19 15:00 4-5 SW 30+ 50.3 69.4 54.7 53.5 43.926/04/2017 10:38 15:00 2-3 SW 30+ 52.2 64.5 56.9 55.8 43.826/04/2017 10:53 15:00 2-3 SW 30+ 51.5 82.6 54.8 53.2 43.1
Wind
Statistical Noise Levels / dB Description of Audible Noise
Wind
Location: Wadi Saay Location 3
Very occasional road traffic on Highway 32, windVery occasional road traffic on Highway 32, windOccasional road traffic & construction activity on Highway 32, windOccasional road traffic & construction activity on Highway 32, wind
Noise Monitoring Form
Measurement Period Weather

Project: Duqm Refinery Job Number: 70029220
Equipment: Rion NL-52 Kit E Engineer: Paul DoylePre-Calibration Level: 94.0 General Weather Description: Day: Hot, Sunny. Evening/Night: HotPost-Calibration Level: 94.0
Measurement PeriodDate Time Elapsed
MinutesWind Speed
(m/s)Wind Direction
(from) Temperature (°C) LAeq LAmax LA01 LA10 LA90
25/04/2017 12:12 15:00 2-3 SW 35+ 42.1 62.6 45.2 43.6 38.925/04/2017 12:27 15:00 2-3 SW 35+ 41.4 48.9 44.3 43.4 39.025/04/2017 22:17 15:00 2-3 SW 25+ 41.6 57.4 45.2 43.9 38.3 Wind, very occasional local vehicles
Wind, very occasional local vehiclesWind, very occasional local vehicles
Statistical Noise Levels / dBWeather Description of Audible Noise
Location: Nafun Location 1
Noise Monitoring FormNoise Monitoring Form

Project: Duqm Refinery Job Number: 70029220
Equipment: Rion NL-52 Kit E Engineer: Paul DoylePre-Calibration Level: 94.0 General Weather Description: Day: Hot, Sunny. Evening/Night: HotPost-Calibration Level: 94.0
Date Time ElapsedMinutes
Wind Speed(m/s)
Wind Direction(from) Temperature (°C) LAeq LAmax LA01 LA10 LA90
25/04/2017 13:03 15:00 4-5 SW 35+ 53.6 59.3 55.2 54.9 51.925/04/2017 13:18 15:00 4-5 SW 35+ 54.0 57.0 55.5 55.2 52.625/04/2017 13:33 15:00 4-5 SW 35+ 53.8 57.0 55.4 55.0 52.325/04/2017 22:41 15:00 4-5 SW 25+ 48.2 69.8 50.2 48.2 45.3
Wind / sea
Description of Audible Noise
Wind / sea - measurement cut short due to safety concernsWind / sea
Location: Nafun Location 2
Wind / sea
Statistical Noise Levels / dB
Noise Monitoring Form
Measurement Period Weather

Project: Duqm Refinery Job Number: 70029220
Equipment: Rion NL-52 Kit E Engineer: Paul DoylePre-Calibration Level: 94.0 General Weather Description: Day: Hot, Sunny. Evening/Night: HotPost-Calibration Level: 94.0
Date Time ElapsedMinutes
Wind Speed(m/s)
Wind Direction(from) Temperature (°C) LAeq LAmax LA01 LA10 LA90
25/04/2017 10:53 15:00 4-5 SW 30+ 42.1 62.3 46.1 44.6 35.025/04/2017 11:08 15:00 4-5 SW 30+ 43.9 55.0 49.1 47.6 35.6
Measurement Period Weather Statistical Noise Levels / dB Description of Audible Noise
Noise Monitoring Form
Location: Antoot Fishing Area
Wind / seaWind / sea
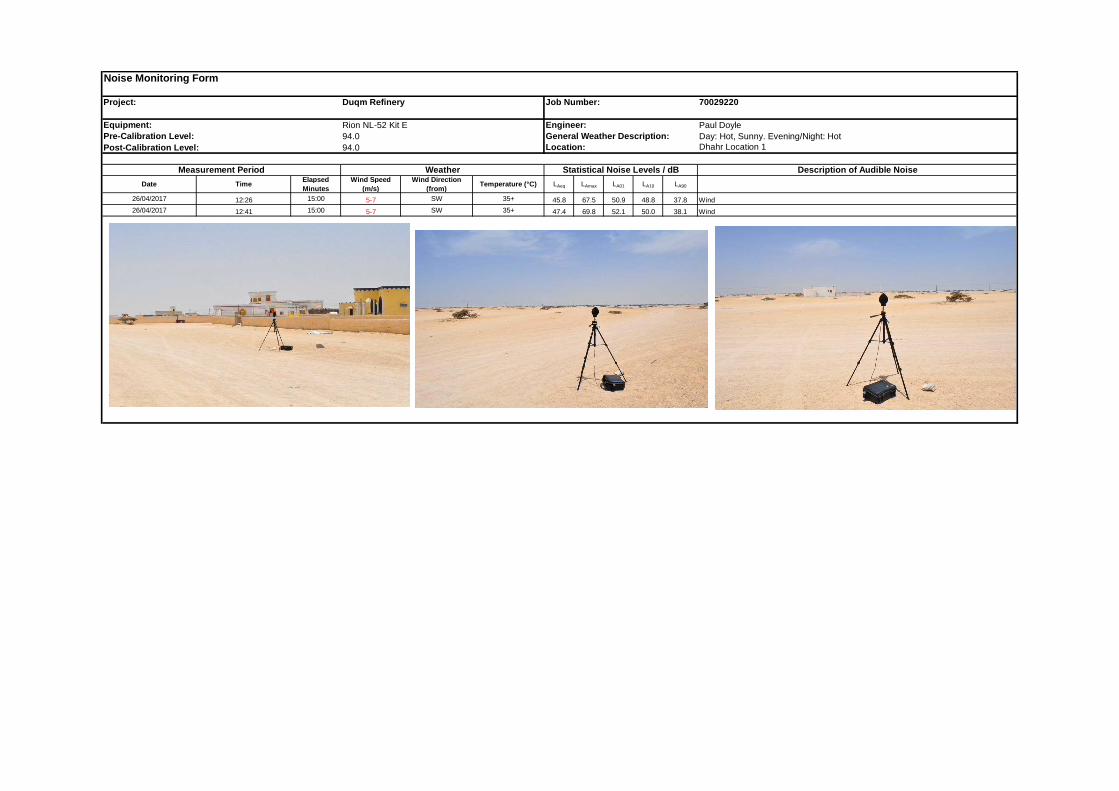
Project: Duqm Refinery Job Number: 70029220
Equipment: Rion NL-52 Kit E Engineer: Paul DoylePre-Calibration Level: 94.0 General Weather Description: Day: Hot, Sunny. Evening/Night: HotPost-Calibration Level: 94.0
Date Time ElapsedMinutes
Wind Speed(m/s)
Wind Direction(from) Temperature (°C) LAeq LAmax LA01 LA10 LA90
26/04/2017 12:26 15:00 5-7 SW 35+ 45.8 67.5 50.9 48.8 37.826/04/2017 12:41 15:00 5-7 SW 35+ 47.4 69.8 52.1 50.0 38.1
Noise Monitoring Form
Dhahr Location 1
Measurement Period Weather Statistical Noise Levels / dB Description of Audible Noise
WindWind
Location:

Project: Duqm Refinery Job Number: 70029220
Equipment: Rion NL-52 Kit E Engineer: Paul DoylePre-Calibration Level: 94.0 General Weather Description: Day: Hot, Sunny. Evening/Night: HotPost-Calibration Level: 94.0
Date Time ElapsedMinutes
Wind Speed(m/s)
Wind Direction(from) Temperature (°C) LAeq LAmax LA01 LA10 LA90
26/04/2017 13:09 15:00 4-5 SW 35+ 47.7 67.1 52.8 51.2 40.626/04/2017 13:24 15:00 4-5 SW 35+ 46.3 58.9 51.4 49.6 39.4
Description of Audible Noise
WindWind
Location: Dhahr Location 2
Noise Monitoring Form
Measurement Period Weather Statistical Noise Levels / dB

Project: Duqm Refinery Job Number: 70029220
Equipment: Rion NL-52 Kit E Engineer: Paul DoylePre-Calibration Level: 94.0 General Weather Description: Day: Hot, Sunny. Evening/Night: HotPost-Calibration Level: 94.0
Date Time ElapsedMinutes
Wind Speed(m/s)
Wind Direction(from) Temperature (°C) LAeq LAmax LA01 LA10 LA90
26/04/2017 14:03 15:00 2-3 SW 35+ 42.7 64.7 47.0 42.9 35.526/04/2017 14:18 15:00 2-3 SW 35+ 45.4 77.8 47.1 44.7 36.4
Description of Audible Noise
Wind, very occasional local vehicles
Location: Dhahr Location 3
Wind, very occasional local vehicles
Noise Monitoring Form
Measurement Period Weather Statistical Noise Levels / dB

APPENDIX B-2
APPENDIX 5.2: ACGIH VIBRATION TLVS

Hand—Arm (Segmental) Vibration — 181
HAND—ARM (SEGMENTAL) VIBRATIONThe TLVs® in Table 1 refer to component acceleration levels and durations
of exposure that represent conditions under which it is believed that nearly allworkers may be exposed repeatedly without progressing beyond Stage 1 of theStockholm Workshop Classification System for Vibration-induced White Finger(VWF), also known as Raynaud’s Phenomenon of Occupational Origin (Table2). Since there is a paucity of dose—response relationships for VWF, these rec-ommendations have been derived from epidemiological data from forestry, min-ing, and metal working. These values should be used as guides in the control ofhand-arm vibration exposure; because of individual susceptibility, they shouldnot be regarded as defining a boundary between safe and dangerous levels.
It should be recognized that control of hand-arm vibration syndrome (HAVS)from the workplace cannot occur simply by specifying and adhering to a givenTLV®. The use of 1) antivibration tools, 2) antivibration gloves, 3) proper workpractices that keep the worker’s hands and remaining body warm and also mini-mize the vibration coupling between the worker and the vibration tool are neces-sary to minimize vibration exposure, and 4) a conscientiously applied medicalsurveillance program are ALL necessary to rid HAVS from the workplace.
TABLE 1. TLVs® for Exposure of the Hand to Vibration in EitherXh, Yh, 0r Zh Directions
Values of the Dominant,*Frequency-Weighted, rms,Component Acceleration
Which Shall not be ExceededaK9(aKeq)
Total Daily ExposureDurati0n* m/s2 gA
4 hours and less than 8 4 0.402 hours and less than 4 6 0.611 hour and less than 2 8 0.81less than 1 hour 12 1.227"The total time Vibration enters the hand per day, whether continuously or intermittently.*Usually one axis of Vibration is dominant over the remaining two axes. If one or more
Vibration axes exceeds the Total Daily Exposure, then the TLV® has been exceeded.gA = 9.81 111/52.
Notes for Table 1:1. The weighting network provided in Figure 1 is considered the best available
to frequency weight acceleration components. However, studies suggestthat the frequency weighting at higher frequencies (above 16 Hz) may notincorporate a sufficient safety factor, and CAUTION must be applied whentools with high-frequency components are used.
2. Acute exposures to frequency-weighted, root-mean-square (rms), compo-nent accelerations in excess of the TLVs® for infrequent periods of time(e.g., 1 day per week or several days over a 2-week period) are not neces-sarily more harmful.
3. Acute exposures to frequency-weighted, rms, component accelerations ofthree times the magnitude of the TLVs® are expected to result in the samehealth effects after 5 to 6 years of exposure.

182 — Ergonomics
4. To moderate the adverse effects of vibration exposure, workers should beadvised to avoid continuous vibration exposure by cessation of vibrationexposure for approximately 10 minutes per continuous vibration hour.
5. Good work practices should be used and should include instructing workersto employ a minimum hand grip force consistent with safe operation of thepower tool or process, to keep their body and hands warm and dry, to avoidsmoking, and to use antivibration tools and gloves when possible. As a gen-eral rule, gloves are more effective for damping vibration at high frequencies.
6. A vibration measurement transducer, together with its device for attachmentto the vibration source, should weigh less than 15 grams and should possessa cross-axis sensitivity of less than 10%.
7. The measurement by many (mechanically underdamped) piezoelectricaccelerometers of repetitive, large displacement, impulsive vibrations, suchas those produced by percussive pneumatic tools, is subject to error. Theinsertion of a suitable, low-pass, mechanical filter between the accelerometerand the source of vibration with a cut-off frequency of 1500 Hz or greater (andcross-axis sensitivity of less than 10%) can help eliminate incorrect readings.
8. The manufacturer and type number of all apparatus used to measure vibra-tion should be reported, as well as the value of the dominant direction andfrequency-weighted, rms, component acceleration.
TABLE 2. Stockholm Workshop HAVS Classification System forCold-induced Peripheral Vascular and Sensorineural Symptoms
Vascular AssessmentStage Grade Description
0 No attacks1 Mild Occasional attacks affecting only the
tips of one or more fingers2 Moderate Occasional attacks affecting distal
and middle (rarely also proximal)phalanges of one or more fingers
3 Severe Frequent attacks affecting ALLphalanges ofmost fingers
4 Very Severe As in Stage 3, with trophic skinchanges in the finger tips
Note: Separate staging is made for each hand, e.g., 2L(2)/1R(l) 2 stage 2 on left hand in twofingers: stage I on right hand in one finger.
Sensorineural AssessmentStage Symptoms
OSN Exposed to vibration but no symptomsISN Intermittent numbness, With or Without tinglingZSN Intermittent or persistent numbness, reducing sensory
perception3SN Intermittent or persistent numbness, reducing tactile
discrimination and/or manipulative dexterityNote: Separate staging is made for each hand.

Hand—Arm (Segmental) Vibration — 183
Continuous, Intermittent, Impulsive, or Impact Hand—Arm Vibration
The measurement of vibration should be performed in accordance withthe procedures and instrumentation specified by ISO 5349 (1986)“) or ANSI8334-1986” and summarized below.
The acceleration of a vibration handle or work piece should be determinedin three mutually orthogonal directions at a point close to where vibrationenters the hand. The directions should preferably be those forming the biody—namic coordinate system but may be a closely related basicentric system withits origin at the interface between the hand and the vibrating surface (Figure 2)to accommodate different handle or work piece configurations. A small andlightweight transducer should be mounted so as to record accurately one ormore orthogonal components of the source vibration in the frequency rangefrom 5 to 1500 Hz. Each component should be frequency-weighted by a filternetwork with gain characteristics specified for human-response vibration mea-suring instrumentation, to account for the change in vibration hazard with fre-quency (Figure 1).
Assessment of vibration exposure should be made for EACH applicabledirection (Xh, Yh, Zh) since vibration is a vector quantity (magnitude and direc-tion). In each direction, the magnitude of the vibration during normal operationof the power tool, machine, or work piece should be expressed by the root-mean-square (rms) value of the frequency-weighted component accelerations,in units of meters per second squared (m/sz), or gravitational units (9), thelargest of which, aK, forms the basis for exposure assessment.
For each direction being measured, linear integration should beemployed for vibrations that are of extremely short duration or vary sub-stantially in time. If the total daily vibration exposure in a given direction is
0.1
0.01GAIN
0.001
0.0001 1 I l l l l l l 14 1M J1 2 4 8 16 31.5 63125250500 1K 4K
1/3 OCTAVE-BAND CENTER FREQUENCY (Hz)
FIGURE 1. Gain characteristics on the filter network used tofrequency-weight acceleration components (continuous line). Thefilter tolerances (dashed lines) are those contained in ISO 5349 andANSI 83.34-1986.

184 — Ergonomics
FIGURE 2. Biodynamic and basicentric coordinate systems for the hand, showingthe directions of the acceleration components (ISO 5349‘” and ANSI 8334—1986(2)).
composed of several exposures at different rms accelerations, then the equiv-alent, frequency-weighted component acceleration in that direction should bedetermined in accordance with the following equation:
(at) = ti («)2 Tim]
I Q) 5 vN
—I|:
'+
Q) .35 VN
l—l
N
+ >2" Q/ N
-||=—
'
T = total daily exposure durationaKi = ith frequency-weighted, rms acceleration
component with duration Ti
These computations may be performed by commercially available human-response vibration measuring instruments.
References1. International Standards Organization: ISO 5349 (1986): Guide for the Measurement and the
Assessment of Human Exposure to Hand Transmitted Vibration. ISO, Geneva (1986).2. American National Standards Institute: ANSI 8334-1986: Guide for the Measurement and
Evaluation of Human Exposure to Vibration Transmitted to the Hand. ANSI, New York(1986).

Whole-Body Vibration — 185
WHOLE—BODY VIBRATIONThe TLVs® in Figures 1 and 2 (tabulated in Tables 1 and 2) refer to
mechanically induced whole-body vibration (WBV) acceleration componentroot-mean-square (rms) magnitudes and durations under which it is believedthat nearly all workers may be exposed repeatedly with minimum risk of backpain, adverse health effects to the back, and inability to operate a land-basedvehicle properly. The biodynamic coordinate system to which they apply is dis-played in Figure 3. These values should be used as guides in the control ofWBV exposure, but because of individual susceptibility, they should not beregarded as defining a boundary between safe and dangerous levels.
Notes:
1. Vibration acceleration is a vector with magnitude expressed in units ofm/sz. The gravitational acceleration, 9, equals 9.81 m/sz.
2. Figures 1 and 2 each show a family of daily exposure time—dependentcurves. They indicate that human vibration resonance occurs in the 4 to 8Hz frequency range for the z axis and in the 1 to 2 Hz frequency range forthe x and y axes, where the axes are defined in Figure 3.
3. WBV measurements and equivalent exposure time calculations for inter-rupted exposures, where the rms acceleration levels vary appreciably overtime, should be made according to ISO 2631 or ANSI 8318-1979(12)
4. The TLV® is valid for vibration crest factors of 6 or less. Crest factor isdefined as the ratio of peak to rms acceleration, measured in the samedirection, over a period of 1 minute for any of the orthogonal x, y, and zaxes. The TLV® will underestimate the effects of WBV and must be usedwith caution when the crest factor exceeds 6.
5. The TLV® is not intended for use in fixed buildings (see ANSI 83.29-1983),‘3>in off-shore structures, or in ships.
6. A summary of WBV measurement and data analysis procedures follows“)a. At each measurement point, three orthogonal, continuous, rms accel-
eration measurements are simultaneously made and recorded for atleast 1 minute along the biodynamic coordinates shown in Figure 3.
b. Three very light-weight accelerometers, each with a cross-axis sensi-tivity of less than 10%, are perpendicularly mounted to a light-weightmetal cube and placed in the center of a hard rubber disc (per SAE,J1O13).‘5> The total weight of the disc, cube, accelerometers, andcables should not exceed 10% of the total weight of the object to bemeasured. Measurements are made by placing the instrumented rub-ber disc on the top of the driver’s seat, under the driver’s buttocks, asthe vehicle is operated.
c. For each axis, a 1/3 octave band (1 to 80 Hz), separate Fourier spec-trum analysis is required for comparison to Figure 1 or Figure 2, asappropriate.

Acce
lerati
onaZ
(r.m.s.)
,m/s
2
186 — Ergonomics
201612.5108.06.35.04.03.152.52.01.61.251.00.80.630.500.400.3150.250.200.16
8h
16h
0.125 ‘01 24 h0.10
0.016 0.4 0.5 0.63 0.8 1.0 1251.6 2.0 2.5 3.15 4.0 5.0 6.3 8.0 10 12.516 20 25 31.5 40 50 63 80
Frequency or center frequency of one-third octave band, Hz
FIGURE 1. Longitudinal (az) acceleration TLVs® as a function of frequency and exposure time. Adapted from ISO 2631 .“l

Acce
lerati
onax,
ay(r.
m.s.)
,m/s
2
Whole-Body Vibration — 187
201612.5108.06.35.04.03.152.52.01.61.251.00.80.630.500.400.3150.250.200.160.1250.10
8h
0124h
0.016 0.4 0.5 0.63 0.8 1.0 1251.6 2.0 2.5 3.15 4.0 5.0 6.3 8.0 10 12.516 20 25 31.5 40 50 63 80
Frequency or center frequency of one-third octave band, Hz
FIGURE 2. Transverse (ax, ay) acceleration TLVs® as a function of frequency and exposure time. Adapted from ISO 2631 .‘1’

188 — Ergonomics
TLV®—PA
TABLE 1. Numerical values for vibration acceleration in the longitudinal, az, direction [foot-to-head direction] [see Figure 1]. Values define the TLV® in termsof rms value of pure (sinusoidal) single-frequency vibration or of rms value in one-third-octave band for distributed vibration. (Adapted from ISO 2631)
Acceleration, m/s2Frequency Exposure times
Hz 24 h 16 h 8 h 4 h 2.5 h 1 h 25 min 16 min 1 min1.0 0.280 0.383 0.63 1.06 1.40 2.36 3.55 4.25 5.601.25 0.250 0.338 0.56 0.95 1.26 2.12 3.15 3.75 5.001.6 0.224 0.302 0.50 0.85 1.12 1.90 2.80 3.35 4.502.0 0.200 0.270 0.45 0.75 1.00 1.70 2.50 3.00 4.002.5 0.180 0.239 0.40 0.67 0.90 1.50 2.24 2.65 3.553.15 0.160 0.212 0.355 0.60 0.80 1.32 2.00 2.35 3.154.0 0.140 0.192 0.315 0.53 0.71 1.18 1.80 2.12 2.805.0 0.140 0.192 0.315 0.53 0.71 1.18 1.80 2.12 2.806.3 0.140 0.192 0.315 0.53 0.71 1.18 1.80 2.12 2.808.0 0.140 0.192 0.315 0.53 0.71 1.18 1.80 2.12 2.80
10.0 0.180 0.239 0.40 0.67 0.90 1.50 2.24 2.65 3.5512.5 0.224 0.302 0.50 0.85 1.12 1.90 2.80 3.35 4.5016.0 0.280 0.383 0.63 1.06 1.40 2.36 3.55 4.25 5.6020.0 0.355 0.477 0.80 1.32 1.80 3.00 4.50 5.30 7.1025.0 0.450 0.605 1.0 1.70 2.24 3.75 5.60 6.70 9.0031.5 0.560 0.765 1.25 2.12 2.80 4.75 7.10 8.50 11.240.0 0.710 0.955 1.60 2.65 3.55 6.00 9.00 10.6 14.050.0 0.900 1.19 2.0 3.35 4.50 7.50 11.2 13.2 18.063.0 1.120 1.53 2.5 4.25 5.60 9.50 14.0 17.0 22.480.0 1.400 1.91 3.15 5.30 7.10 11.8 18.0 21.2 28.0

TABLE 2. Numerical values for vibration acceleration in the transverse, aX 0r ay, direction [back-to-chest or side-to-side] [see Figure 2]. Values define the TLV®in terms of ms value of pure (sinusoidal) single-frequency vibration or of ms value in one-third-octave band for distributed vibration. (Adapted from ISO 2631)
Acceleration, nfls2Frequency Exposure times
Hz 24 h 16 h 8 h 4 h 2.5 h 1 h 25 min 16 min 1 min1.0 0.100 0.135 0.224 0.355 0.50 0.85 1.25 1.50 2.01.25 0.100 0.135 0.224 0.355 0.50 0.85 1.25 1.50 2.01.6 0.100 0.135 0.224 0.355 0.50 0.85 1.25 1.50 2.02.0 0.100 0.135 0.224 0.355 0.50 0.85 1.25 1.50 2.02.5 0.125 0.171 0.280 0.450 0.63 1.06 1.6 1.9 2.53.15 0.160 0.212 0.355 0.560 0.8 1.32 2.0 2.36 3.154.0 0.200 0.270 0.450 0.710 1.0 1.70 2.5 3.0 4.05.0 0.250 0.338 0.560 0.900 1.25 2.12 3.15 3.75 5.06.3 0.315 0.428 0.710 1.12 1.6 2.65 4.0 4.75 6.38.0 0.40 0.54 0.900 1.40 2.0 3.35 5.0 6.0 8.0
10.0 0.50 0.675 1.12 1.80 2.5 4.25 6.3 7.5 10.012.5 0.63 0.855 1.40 2.24 3.15 5.30 8.0 9.5 12.516.0 0.80 1.06 1.80 2.80 4.0 6.70 10.0 11.8 16.020.0 1.00 1.35 2.24 3.55 5.0 8.5 12.5 15.0 20.025.0 1.25 1.71 2.80 4.50 6.3 10.6 15.0 19.0 25.031.5 1.60 2.12 3.55 5.60 8.0 13.2 20.0 23.6 31.540.0 2.00 2.70 4.50 7.10 10.0 17.0 25.0 30.0 40.050.0 2.50 3.38 5.60 9.00 12.5 21.2 31.5 37.5 50.063 0 3 15 4.28 7.10 11.2 16.0 26 5 40 0 45 7 63 080.0 4300 5.4 9.00 14.0 20.0 3315 50.0 60.0 80.0

190 — Ergonomics
d. If the rms acceleration of any of the spectral peaks equals or exceedsthe values shown in Figure 1 or Figure 2 for the relevant time periods,then the TLV® is exceeded for that exposure time. The axis with thehighest spectral peak intersecting the curve with the shortest expo-sure time dominates and determines the permissible exposure.
7. The total-weighted rms acceleration for each axis can be calculated usingEquation 1 with the appropriate axis weighting factors taken from Table 3.For the x axis (analogous equations and definitions apply to the y and zaxes), the equation is:
w = “ 2 (f Afx)2 (1)
where: AVVX = total weighted rms acceleration for the x axisf = weighting factor for the x axis at each 1/3 octave
band frequency from 1 to 80 Hz (Table 3)Afx = rms acceleration value for the x axis spectrum at
each 1/3 octave band frequency from 1 to 80 Hz8. If the vibration axes have similar acceleration magnitudes as determined by
Equation 1, the combined motion of all three axes could be greater thanany one component and could possibly affect vehicle operator perfor-mance.“ Each of the component results determined by Equation 1 may be
ay
a3x x
32‘—‘.’
\ \
av
FIGURE 3. Biodynamic coordinate system acceleration measurements (adapted from ISO2631). ax,ay,az = acceleration in the direction of the x, y, and z axes; x axis = back-to-chest; y axis = right-to-left; z axis = foot-to-head.

Whole-Body Vibration — 191
used in Equation 2 to find the resultant, which is the overall weightedtotal rms acceleration, Awt:
Awt = ‘I (1-4 Am)2 + (1-4 Aw + (Am)2 (2)The factor of 1.4 multiplying the x and y total, weighted rms accelerationvalues is the ratio of the values of the longitudinal and transverse curves ofequal response in the most sensitive human response ranges.
The Commission of the European Communities now recommends0.5 m/s2 as an action level for an 8 hour per day overall weighted total rmsacceleration. This may be compared with the results of Equation 2.
9. Short-duration, high-amplitude, multiple-vibration shocks may occur withcrest factors greater than 6 during the workday, in which cases the TLV®may not be protective (Note 4). Other methods of calculation that includethe “4th power concept” may be desirable in these instances”)
TABLE 3. Weighting Factors Relative to the Frequency Rangeof Maximum Acceleration SensitivityA for the Response Curvesof Figures 1 and 2 (Adapted from ISO 2631)
Weighting factor forLongitudinal 2 Transverse x, y
Frequency Hz Vibrations [Figure 1] Vibrations [Figure 2]
1.0 0.50 1.001.25 0.56 1.001.6 0.63 1.002.0 0.71 1.002.5 0.80 0.803.15 0.90 0.634.0 1.00 0.55.0 1.00 0.46.3 1.00 0.3158.0 1.00 0.25
10.0 0.80 0.212.5 0.63 0.1616.0 0.50 0.12520.0 0.40 0.125.0 0.315 0.0831.5 0.25 0.06340.0 0.20 0.0550.0 0.16 0.0463.0 0.125 0.031580.0 0.10 0.025
A 4 to 8 Hz in the case ofi aZ resonance Vibration.1 to 2 Hz in the case ofi ay or ax resonance vibration.

192 — Ergonomics
10. WBV controls may include the use of “air-ride” suspended seats, suspendedcabs, maintenance of vehicle suspension systems, proper tire inflation, andremote control of vibrating processes. Seats with arm rests, lumbar support,an adjustable seat back, and an adjustable seat pan are also useful.
11. The following good work practices may also be useful for workers operatingvehicles”)a. Avoid lifting or bending immediately following exposure.b. Use simple motions, with minimum rotation or twisting, when exiting a
vehicle.
References
1. International Standards Organization: ISO 2631/1: Evaluation of Human Exposure toWhole-Body Vibration. ISO, Geneva (1985).
2. American National Standards Institute: ANSI S3.18: Guide for the Evaluation of HumanExposure to Whole-Body Vibration. ANSI, New York (1979).
3. American National Standards Institute: ANSI 83.29: Guide for the Evaluation of HumanExposure to Whole-Body Vibration in Buildings. ANSI, New York (1983).
4. Wasserman, D: Human Aspects of Occupational Vibration. Elsevier Publishers,Amsterdam (1987).
5. Society of Automotive Engineers. SAE J1013: Measurement of Whole Body Vibration ofthe Seated Operator of Off Highway Work Machines. SAE, Warrendale, PA (August1992).
6. Griffin, M: Handbook of Human Vibration. Academic Press, London (1990).7. Wilder, D: The Biomechanics of Vibration and Low Back Pain. Am. J. Ind. Med.
23:577—588 (1993).8. Wilder, D; Pope, M; Frymoyer, J: The Biomechanics of Lumbar Disc Herniation and the
Effect of Overload and Instability. J. Spinal Disorders 1:16—32 (1988).

APPENDIX B-3
APPENDIX 5.3: CONSTRUCTION PHASING

P1 P2 P3
Month 1 2 3 4 5 6 7 8 9 10 11 12 13 14 15 16 17 18 19 20 21 22 23 24 25 26 27 28 29 30 31 32 33 34 35 36 37 38 39 40 41 42 43 44 45 46 47 48 49 50 51 52
Overview
EPC 1&2 (Refinery and Pipeline and offsite facilities / camps / port section / haul route)
EPC 3 (Duqm terminal)
Power and Desalination Plant (by CUC)
Sea Water Intake & Outfall Facilities (by SEZAD / CUC)
Service corridor from Refinery to Duqm Petrolium Terminal Company (DPTC) (by SEZAD / CUC)
Oman Tank Terminal Company (OTTCO) Tank Terminal at Ras Markaz (by OTTCO)
Natural Gas Pipeline to Gas supply station (GSS) at Duqm (by Oman Gas Company - OGC)
Gas supply station (GSS) and Gas Spur line to Refinery (by Oman Gas company)
Liquid Jetty Marine Scope EPC1 (by SEZAD)
EPC 1&2 Execution
Heavy haul roads
Pipeline corridor from Refinery to Petroleum Terminal
Desalinated Water
Discharge Outfall Basin
Electrical Power
Natural Gas
Ras-Markaz terminal
EPC 3 Execution
Tankage and Pumps
Shorline Piperacks and Jetties 903 - 906
Substations
Admin / Control building, Warehouse and Guardhouse
Utilities Area
Dry Bulk Handling
RMZ-DR Crude Pipeline Construction & mech completion
RMZ Vcrude storage tanks construction & mech completion
Roads
Haul Road construction (1,2)
Main Highway (NR 32)
Section 4 Road (Duqm Refinery South Road)
(Roads by SEZAD)
Construction of construction camps. Schedule not currently available.
Construction camp operation

APPENDIX B-4
APPENDIX 5.4: REFINERY NOISE MODELLING REPORT


AMEC FOSTER WHEELER REPORT DRP001-FED-RPT-M-000-001 5660-8440-RP-000-004
PAGE 2 OF 45 REV D2 NOISE ASSESSMENT REPORT
DSN: 2668
UTILITIES/LOADING/OFFICE/MAINTENANCE AREAS ..................................................... 18 ATTACHMENT 8 EQUIPMENT NOISE BREAKDOWN FOR UNIT 100/105/110 PLOT PLAN 19 ATTACHMENT 9 EQUIPMENT NOISE BREAKDOWN FOR UNIT 120 PLOT PLAN ....... 21 ATTACHMENT 10 EQUIPMENT NOISE BREAKDOWN FOR UNIT 130 PLOT PLAN ..... 24 ATTACHMENT 11 EQUIPMENT NOISE BREAKDOWN FOR UNIT 135 PLOT PLAN ..... 27 ATTACHMENT 12 EQUIPMENT NOISE BREAKDOWN FOR UNIT 136 PLOT PLAN ..... 28 ATTACHMENT 13 EQUIPMENT NOISE BREAKDOWN FOR UNIT 150 PLOT PLAN ..... 29 ATTACHMENT 14 EQUIPMENT NOISE BREAKDOWN FOR UNIT 160 PLOT PLAN ..... 30 ATTACHMENT 15 EQUIPMENT NOISE BREAKDOWN FOR UNIT 170 PLOT PLAN ..... 32 ATTACHMENT 16 EQUIPMENT NOISE BREAKDOWN FOR UNIT 320 PLOT PLAN ..... 34 ATTACHMENT 17 EQUIPMENT NOISE BREAKDOWN FOR UNIT 330 PLOT PLAN ..... 35 ATTACHMENT 18 EQUIPMENT NOISE BREAKDOWN FOR UNIT 340 PLOT PLAN ..... 36 ATTACHMENT 19 EQUIPMENT NOISE BREAKDOWN FOR UNIT 400 PLOT PLAN ..... 38 ATTACHMENT 20 EQUIPMENT NOISE BREAKDOWN FOR UNIT 710 PLOT PLAN ..... 39 ATTACHMENT 21 EQUIPMENT NOISE BREAKDOWN FOR UNIT 570 PLOT PLAN ..... 40 ATTACHMENT 22 EQUIPMENT NOISE BREAKDOWN FOR UNIT 700 PLOT PLAN ..... 42 ATTACHMENT 23 EQUIPMENT NOISE BREAKDOWN FOR UNIT 730 PLOT PLAN ..... 43 ATTACHMENT 24 EQUIPMENT NOISE BREAKDOWN FOR UNIT 640 PLOT PLAN ..... 44
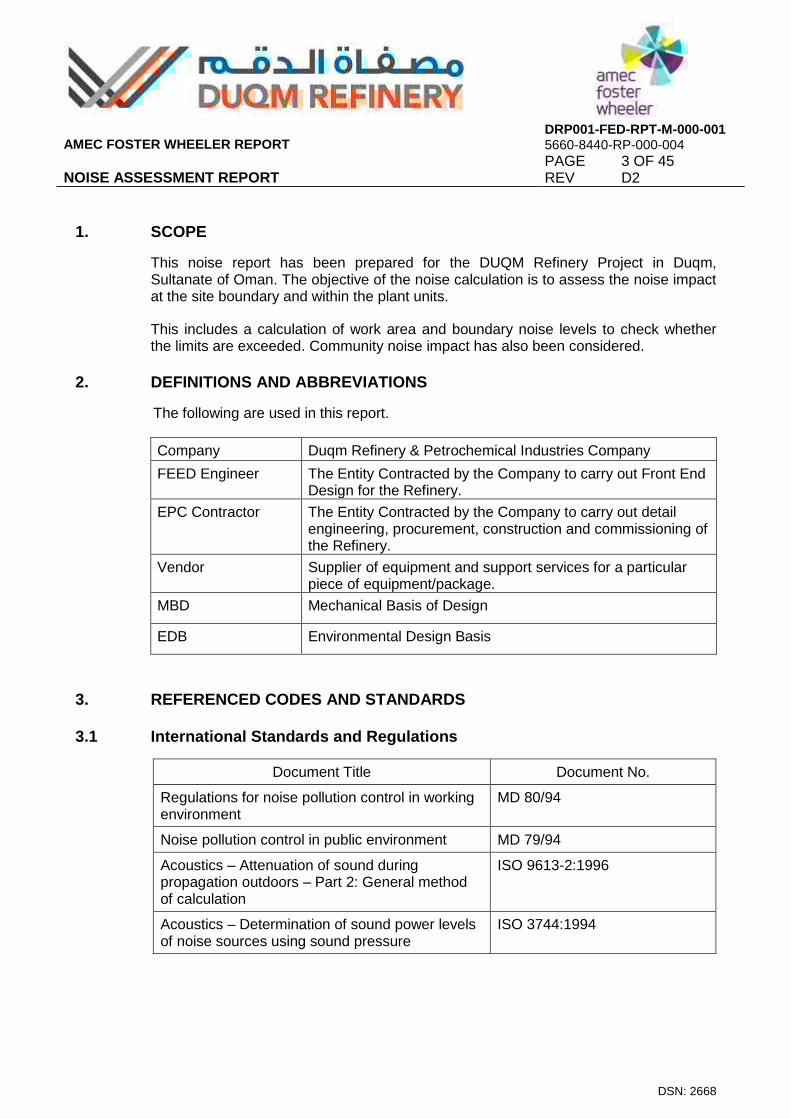
AMEC FOSTER WHEELER REPORT DRP001-FED-RPT-M-000-001 5660-8440-RP-000-004
PAGE 3 OF 45 REV D2 NOISE ASSESSMENT REPORT
DSN: 2668
1. SCOPE
This noise report has been prepared for the DUQM Refinery Project in Duqm, Sultanate of Oman. The objective of the noise calculation is to assess the noise impact at the site boundary and within the plant units.
This includes a calculation of work area and boundary noise levels to check whether the limits are exceeded. Community noise impact has also been considered.
2. DEFINITIONS AND ABBREVIATIONS
The following are used in this report.
Company Duqm Refinery & Petrochemical Industries Company
FEED Engineer The Entity Contracted by the Company to carry out Front End Design for the Refinery.
EPC Contractor The Entity Contracted by the Company to carry out detail engineering, procurement, construction and commissioning of the Refinery.
Vendor Supplier of equipment and support services for a particular piece of equipment/package.
MBD Mechanical Basis of Design
EDB Environmental Design Basis
3. REFERENCED CODES AND STANDARDS
3.1 International Standards and Regulations
Document Title Document No.
Regulations for noise pollution control in working environment
MD 80/94
Noise pollution control in public environment MD 79/94
Acoustics – Attenuation of sound during propagation outdoors – Part 2: General method of calculation
ISO 9613-2:1996
Acoustics – Determination of sound power levels of noise sources using sound pressure
ISO 3744:1994

AMEC FOSTER WHEELER REPORT DRP001-FED-RPT-M-000-001 5660-8440-RP-000-004
PAGE 4 OF 45 REV D2 NOISE ASSESSMENT REPORT
DSN: 2668
3.2 Project Documents
The following project documents have been referenced while preparing this report.
Document Title Document No.
Mechanical Basis of Design (MBD) DRP001-FED-SPE-M-000-001
Environmental Design Basis (EDB) DRP001-FED-SPE-Z-000-001
Equipment Noise DRP001-FED-SPE-M-000-007
4. NOISE LIMITS
Two distinct categories of noise limits are considered in this report:
Work area noise limits.
Community noise limits.
4.1 Work Area Noise Limits
4.1.1 Absolute Limit
As per reference document MD 80/94 the absolute maximum of 130dB shall apply to any location which personnel may visit.
4.1.2 Work Area Limit
The work area noise limit is 85dB(A) for all walkways, passages and accessible work and maintenance locations. Company review and approval is required for any deviations above the sound level limit.

AMEC FOSTER WHEELER REPORT DRP001-FED-RPT-M-000-001 5660-8440-RP-000-004
PAGE 5 OF 45 REV D2 NOISE ASSESSMENT REPORT
DSN: 2668
4.2 Community Noise Limits
As per MD 79/94, the noise levels from the facility shall not cause an increase in the community noise levels to above the limits in the table below:
Type of District
Leq, T, dB(A)
Over time Period
A B C
Rural residential recreational 60 40 35
Suburban residential 65 45 40
Urban residential 65 50 45
Urban residential with some workshops or business; city hubs
65 55 50
Industrial/Commercial 70 70 70
Table 1: Community Noise
Workdays Daytime (A) : 07:00 to 18:00
Workdays Evening (B) : 18:00 to 23:00
Holidays and Nights (C) : 23:00 to 07:00
5. CALCULATION METHOD AND INPUT DATA
All significant noise radiating plant equipment is allocated an octave band sound power level. These sound power levels were obtained from:-
Calculations based on FEED Engineer algorithms derived from library noise data. The data source code in the Noise Allocation Table is ‘E’.
Vendor’s supplied noise data estimated from similar equipment. The data source code in the Noise Allocation Table is ‘EM’.
Vendor noise level submitted with quote. The data source code in the Noise Allocation Table is ‘Q’.
Currently no Vendor noise data is available in terms of sound pressure level at 1m from equipment.
As Vendor noise data is not available, the sound pressure level at 1m for equipment train has been calculated as per ISO 3744 using the relationship between sound power level, sound pressure level and estimated equipment dimensions derived from unit plot plans.
Proprietary software ‘SoundPlan’ version 7.2 was used to generate a noise contour map. The SoundPlan applies ISO 9613-2 industry standard to carry out noise

AMEC FOSTER WHEELER REPORT DRP001-FED-RPT-M-000-001 5660-8440-RP-000-004
PAGE 6 OF 45 REV D2 NOISE ASSESSMENT REPORT
DSN: 2668
calculations. Input data to the software comprised octave band sound power levels for each noise radiating item of equipment item and scaled plot plans.
5.1 Assumptions
This report is for noise generated during normal plant operation only.
Equipment items with <10kW rating are not considered as the noise level is assumed insignificant. Typical examples are pumps with <10kW rating.
Control valve noise has not been included in the present revision of the report. The piping noise is not included as there is no significant source of piping noise in the new equipment.
Only one pump in a pair is active at any time.
All Driven equipment listed in attachments 8 to 24, are combined. The calculated SWL value is for the driven equipment and driver together.
The applied spectral frequency band adjustments were derived from an in-house database for specific equipment types.
The Air Fin Heat Exchanger noise is conservatively modelled using dimension from the unit plot plans due to lack equipment data.
Equipment has been assumed to satisfy the 85dB(A) @ 1m limit.

AMEC FOSTER WHEELER REPORT DRP001-FED-RPT-M-000-001 5660-8440-RP-000-004
PAGE 7 OF 45 REV D2 NOISE ASSESSMENT REPORT
DSN: 2668
6. CALCULATION SUMMARY
A Noise Allocation Table in given below and shows the sound power that has been calculated for each area as defined in the overall plot plan.
Unit Number Octave band centre frequency (Hz) dB dB(A) Source
63 125 250 500 1000 2000 4000 8000
Unit 640 124 125 126 127 124 119 112 106 133 128 E
Unit 730 106 106 106 106 106 104 102 100 114 111 E
Unit 700 101 101 101 101 101 99 97 95 109 106 E
Unit 570 110 110 110 110 110 108 106 104 118 115 E
Unit 710 108 108 108 108 108 106 104 102 116 113 E
Utilities Unit 400 110 111 111 112 110 106 103 100 118 115 E
Unit 340 T1/T2/T3 134 132 129 125 120 116 113 108 138 127 E
SWS_CSW Unit 330
123 121 118 114 112 108 104 101 126 117 E
ARU Unit 320 125 123 120 116 113 109 105 102 128 119 E
LTU Unit 170 110 110 110 110 110 108 106 104 118 115 E
DHT Unit 160 128 126 123 119 117 113 110 106 131 122 E
KTU Unit 150 104 104 104 104 104 104 102 98 112 110 E
Unit 136 121 119 116 113 110 107 103 101 124 116 E
CAR Unit 135 123 121 118 115 113 109 105 102 127 118 E
DCU Unit 130 130 128 125 123 120 116 111 107 133 125 E
HCU Unit 120 131 129 126 123 120 116 113 109 135 125 E
CDU Unit 100/105/110
126 124 122 118 116 112 109 106 130 121 E
TOTAL 138 137 134 132 129 125 120 116 142 134
Table 2: Total Sound Power Level Octave band Calculation for all considered equipment
6.1 Receptor Locations
As an aid to the reporting of results, the following in-plant and boundary receptor locations (illustrated in Attachment 1), have been created;
R1 to R8 (boundary line receptors)
Main Administration Building
Mosque
Maintenance Centre
Main Stores

AMEC FOSTER WHEELER REPORT DRP001-FED-RPT-M-000-001 5660-8440-RP-000-004
PAGE 8 OF 45 REV D2 NOISE ASSESSMENT REPORT
DSN: 2668
Chemical Store
Main control Building
The Soundplan model will be specifically interrogated to identify the noise levels at these specific locations.
7. ANALYSIS
This noise study is required to assess “in-plant” and “community” noise within the refinery, so it is necessary to model each noise generating item of equipment individually, or clusters where relevant. This approach has the potential of yielding greater accuracy of plant noise distribution.
At this point in the project cycle the exact equipment locations and elevations are still subject to change. Therefore the equipment selected to be included in the model have been positioned manually on the overall site plot plan with locations corresponding approximately to the individual unit plot plans.
7.1 In-Plant Noise Distribution
Attachments 2 to 7 show the predicted noise contour plot within the plant area and site boundary.
Within the site, it can also be deduced that of the unit plot plans the work area limit of 85dB(A) has been broadly satisfied.
However a more in depth review of the noise contour plot, will highlight some noise hotspots, within units 340 (T1, T2 & T3), 120 and 160. These hotspots may in part be caused by the conservative equipment noise estimation methodology or a real effect caused by the close proximity of certain noise generating equipment.
Typical approaches to mitigating against the noise hotspots are;
Imposing lower equipment noise limits on equipment in the locality of the hotspots.
The use of actual vendor data can in certain circumstances eliminate noise hotspots.
Additional acoustic treatment of some equipment may reduce or eliminate the noise hotspots.
The imposition of noise exclusion zone, within which the wearing of hearing protection is mandatory. This approach will not eliminate the hotspot and requires client agreement.

AMEC FOSTER WHEELER REPORT DRP001-FED-RPT-M-000-001 5660-8440-RP-000-004
PAGE 9 OF 45 REV D2 NOISE ASSESSMENT REPORT
DSN: 2668
7.2 In-plant Receptor Location Noise
Based on the equipment noise data in allocation tables listed attachments 8 to 24, the following noise values have been derived from the Soundplan model for the specially created in-plant receptor locations. Buildings within the plant boundary are classed as Industrial/Commercial, and the noise limit defined in Table 3 are applicable.
Receiver
Calculated Noise
Noise Limit
dB(A)
Main control building 67.2 70
Main store 61.3 70
Maintenance Store 60.2 70
Mosque 58.9 70
Administration building 53.9 70
Chemical Store 64.9 70
Table 3: Sound Pressure Level at selected in-plant receptor locations (Att 1)
7.3 Site Boundary Receptor Location Noise
Based on the equipment noise data in allocation tables listed attachments 8 to 24, the following noise values have been derived from the Soundplan model for the specially created site boundary receptor locations.
Receiver
Calculated Noise
dB(A)
FENCE_R1 50.2
FENCE_R2 46.6
FENCE_R3 43.0
FENCE_R4 46.6
FENCE_R5 49.4
FENCE_R6 61.1
FENCE_R7 52.0
FENCE_R8 59.0
Table 4: Sound Pressure Level at selected at site boundary receptor locations (Att 1)
It can be deduced that the sound pressure level predicted at the site boundary does not exceed the 70dB(A) limit as summarised in Table 1.

AMEC FOSTER WHEELER REPORT DRP001-FED-RPT-M-000-001 5660-8440-RP-000-004
PAGE 10 OF 45 REV D2 NOISE ASSESSMENT REPORT
DSN: 2668
8. CONCLUSIONS
Following conclusions can be drawn from this noise report:-
The site boundary noise limit of 70dB(A) as defined in MD 79/94 is predicted not to be exceeded.
The work area noise limit of 85dB(A) is broadly satisfied.
A number of noise hotspots exceeding the 85dB(A) limit have been identified. Equipment vendor noise data can be incorporated into subsequent revisions of this assessment in the FEED stage once the process and plot plans have been finalised. Should the noise hotspots remain; additional measures as described in section 7.1 can be implemented to mitigate against the noise hotspots.
The noise at buildings within the site boundary are below the noise limit, defined in table 1.
The in-plant points of interest including the site mosque, main administration building, main control building and stores range from 53 up to 68dB(A).
The above described analysis should be revisited once the unit and overall plot plans have been finalised and equipment vendor noise data becomes available by the EPC Contractor.
9. RECOMMENDATIONS
This assessment is based on equipment items achieving 85dB(A) in the work area or at 1m from equipment surfaces. Further noise control work will be required during the EPC phase that will include but not limited to the following.
Carry out initial noise survey of plant areas where new noise radiating equipment will be located to obtain background noise levels (This will be considered a fixed condition).
Agree noise standards to be applied to the project with the Company or representative.
Obtain equipment noise levels (octave band) from equipment suppliers.
Provide a Noise Allocation Table for noise radiating equipment and update throughout the project with manufacturer’s noise data.
Construct noise contour maps and update during EPC phase.
Provide plot limits for restricted areas if this approach is agreed by Company.
Specify noise control mitigation measures.
Identify equipment items that require a full load noise test during Factory Acceptance Tests and arrange tests.

AMEC FOSTER WHEELER REPORT DRP001-FED-RPT-M-000-001 5660-8440-RP-000-004
PAGE 11 OF 45 REV D2 NOISE ASSESSMENT REPORT
DSN: 2668
Repeat the noise survey following plant start-up.
Take corrective action where the survey identifies locations where agreed noise limits have been exceeded.
10. REFERENCE
Unit plot plan CDU 100 VDU 110 SGP 105 DRP001-FED-100000-P-PP-001-1, rev IFF
Plot plan Unit 120 - HCU DRP001-CLG-120000-P-PP-001-1, rev IFF
Unit plot plan CAR 135 DRP001-FED-135000-P-PP-001-1,rev IFF
Plot plant Unit 150 unit 170 DRP001-UOP-150000-P-PP-002-1, rev IFF
Unit plot plan ARU 320 DRP001-FED-320000-P-PP-001-1, rev IFF
Plot plan Unit 160- DHT DRP001-FED-160000-P-PP-001-1, rev IFF
Refinery Site Plan DRP001-FED-000000-P-PP-005-1, rev IFF
Plot plan Unit SWS 330 Sheet 2 DRP001-FED-330000-P-PP-001-2, rev IFF
Plot plan Unit SWS 330 Sheet 1 DRP001-FED-330000-P-PP-001-1, rev IFF
Plot plan Unit CSW 136 DRP001-FED-136000-P-PP-001-1, rev IFF
Plot plan Unit 710 Intermediate Tankage DRP001-FED-710000-P-PP-001-1, rev IFF
Plot plan Unit 740 LPG Storage, LPG Refrigeration & BOG Compression
DRP001-FED-740000-P-PP-001-1, rev IFF
Waste Water Treatment Plant plot plan Unit 570 sheet 2 DRP001-FED-570000-P-PP-001-1, rev IFF
Waste Water Treatment Plant plot plan Unit 570 sheet 2 DRP001-FED-570000-P-PP-001-2, rev IFF
Plot plan Unit 730 Product Tankage DRP001-FED-730000-P-PP-001-1, rev IFF
Plot plan unit 700 Crude Oil Storage DRP001-FED-700000-P-PP-001-1, rev IFF
Sulphur Recovery Unit 340 plot plan DRP001-FED-340000-PP-P-001-2, rev IFF
Plot plan Unit 130 Delayed Coker DRP001-FWH-130000-P-PP-001-1, rev IFF
Solids Export plot plan DRP001-FED-000000-P-PP-007-1, rev IFF
Overall Utility Plot Plan DRP001-FED-000000-P-PP-004-1, rev IFF

AMEC FOSTER WHEELER REPORT DRP001-FED-RPT-M-000-001 5660-8440-RP-000-004
PAGE 12 OF 45 REV D2 NOISE ASSESSMENT REPORT
DSN: 2668
ATTACHMENT 1 RECEPTOR LOCATIONS

AMEC FOSTER WHEELER REPORT DRP001-FED-RPT-M-000-001 5660-8440-RP-000-004
PAGE 13 OF 45 REV D2 NOISE ASSESSMENT REPORT
DSN: 2668
ATTACHMENT 2 DUQM REFINERY SITE NOISE DISTRIBUTION

AMEC FOSTER WHEELER REPORT DRP001-FED-RPT-M-000-001 5660-8440-RP-000-004
PAGE 14 OF 45 REV D2 NOISE ASSESSMENT REPORT
DSN: 2668
ATTACHMENT 3 NOISE DISTRIBUTION – UNIT 135/320/330/136

AMEC FOSTER WHEELER REPORT DRP001-FED-RPT-M-000-001 5660-8440-RP-000-004
PAGE 15 OF 45 REV D2 NOISE ASSESSMENT REPORT
DSN: 2668
ATTACHMENT 4 NOISE DISTRIBUTION – UNIT 340 TRAIN 1/2/3

AMEC FOSTER WHEELER REPORT DRP001-FED-RPT-M-000-001 5660-8440-RP-000-004
PAGE 16 OF 45 REV D2 NOISE ASSESSMENT REPORT
DSN: 2668
ATTACHMENT 5 NOISE DISTRIBUTION – UNIT 160/120/340 TRAIN 1 / 2

AMEC FOSTER WHEELER REPORT DRP001-FED-RPT-M-000-001 5660-8440-RP-000-004
PAGE 17 OF 45 REV D2 NOISE ASSESSMENT REPORT
DSN: 2668
ATTACHMENT 6 NOISE DISTRIBUTION – UNIT 105/100/110/170/150/130

AMEC FOSTER WHEELER REPORT DRP001-FED-RPT-M-000-001 5660-8440-RP-000-004
PAGE 18 OF 45 REV D2 NOISE ASSESSMENT REPORT
DSN: 2668
ATTACHMENT 7 NOISE DISTRIBUTION – UTILITIES/LOADING/OFFICE/MAINTENANCE AREAS

AMEC FOSTER WHEELER REPORT DRP001-FED-RPT-M-000-001 5660-8440-RP-000-004
PAGE 19 OF 45 REV D2 NOISE ASSESSMENT REPORT
DSN: 2668
ATTACHMENT 8 EQUIPMENT NOISE BREAKDOWN FOR UNIT 100/105/110 PLOT PLAN
Sound Power Level
Octave band centre frequency (Hz) dB dB(A) Source
Equipment No.
Equipment Description Equipment Type Comments 63 125 250 500 1000 2000 4000 8000
100P-001A/B Desalter Water Make-Up Pump Assumed Centrifugal n/a 97 97 97 97 97 95 93 91 105 102 E
100P-002A/B Desalter Water Circulation Pump Assumed Centrifugal n/a 97 97 97 97 97 95 93 91 105 102 E
100P-003A/B/C Flashed Crude Pump Assumed Centrifugal n/a 98 98 98 98 98 96 94 92 106 103 E
100P-004A/B/C Top Pump Around Pump Assumed Centrifugal n/a 98 98 98 98 98 96 94 92 106 103 E
100P-005A/B/C Kerosene Pump Around Pump Assumed Centrifugal n/a 98 98 98 98 98 96 94 92 106 103 E
100P-006A/B LAGO Pump Around Pump Assumed Centrifugal n/a 97 97 97 97 97 95 93 91 105 102 E
100P-007A/B HAGO Pump Around Pump Assumed Centrifugal n/a 97 97 97 97 97 95 93 91 105 102 E
100P-008A/B/C Kerosene Product Pump Assumed Centrifugal n/a 98 98 98 98 98 96 94 92 106 103 E
100P-009A/B LAGO Product Pump Assumed Centrifugal n/a 97 97 97 97 97 95 93 91 105 102 E
100P-010A/B HAGO Product Pump Assumed Centrifugal n/a 97 97 97 97 97 95 93 91 105 102 E
100P-011A/B/C Atmospheric Residue Pump Assumed Centrifugal n/a 98 98 98 98 98 96 94 92 106 103 E
100P-012A/B CDU Sour Water Pump Assumed Centrifugal n/a 97 97 97 97 97 95 93 91 105 102 E
100P-013A/B CDU Overhead Liquids Pump Assumed Centrifugal n/a 97 97 97 97 97 95 93 91 105 102 E
100P-050 CDU/VDU Closed Blowdown Pump Assumed Centrifugal n/a 97 97 97 97 97 95 93 91 105 102 E
110P-001A/B LVGO Pump Assumed Centrifugal n/a 97 97 97 97 97 95 93 91 105 102 E
110P-002A/B MVGO Pump Assumed Centrifugal n/a 97 97 97 97 97 95 93 91 105 102 E

AMEC FOSTER WHEELER REPORT DRP001-FED-RPT-M-000-001 5660-8440-RP-000-004
PAGE 20 OF 45 REV D2 NOISE ASSESSMENT REPORT
DSN: 2668
110P-003A/B HVGO Pump Assumed Centrifugal n/a 97 97 97 97 97 95 93 91 105 102 E
110P-004A/B Recycle Oil Pump Assumed Centrifugal n/a 97 97 97 97 97 95 93 91 105 102 E
110P-005A/B/C Vacuum Residue Pump Assumed Centrifugal n/a 98 98 98 98 98 96 94 92 106 103 E
110P-007A/B VDU Sour Water Pump Assumed Centrifugal n/a 97 97 97 97 97 95 93 91 105 102 E
100K-001 CDU Offgas Compressor Package 3 Stage Centrifugal Compressor
n/a 103 102 101 101 102 104 104 97 112 110 E
100AE-001 Crude Column Overhead Condenser Air Fan Cooler n/a 121 119 116 112 109 104 98 92 124 114 E
100AE-002 SR Diesel Product Cooler Air Fan Cooler n/a 116 114 111 107 104 99 93 87 120 110 E
100AE-003 Offspec HAGO Cooler Air Fan Cooler n/a 115 113 110 106 103 98 92 86 118 108 E
100AE-004 Top Pumparound Cooler Air Fan Cooler n/a 116 114 111 107 104 99 93 87 119 109 E
105AE-001 Naphtha Air Cooler Air Fan Cooler n/a 115 113 110 106 103 98 92 86 118 108 E
105AE-002 Naphtha Stabiliser Air Condenser Air Fan Cooler n/a 117 115 112 108 105 100 94 88 120 110 E
105AE-051 Flash Steam Air Condenser Air Fan Cooler n/a 113 111 108 104 101 96 90 84 117 107 E
110AE-001 VGO Product Cooler Air Fan Cooler n/a 119 117 114 110 107 102 96 90 122 112 E

AMEC FOSTER WHEELER REPORT DRP001-FED-RPT-M-000-001 5660-8440-RP-000-004
PAGE 21 OF 45 REV D2 NOISE ASSESSMENT REPORT
DSN: 2668
ATTACHMENT 9 EQUIPMENT NOISE BREAKDOWN FOR UNIT 120 PLOT PLAN
Sound Power Level
Octave band centre frequency (Hz) dB dB(A) Source
Equipment No.
Equipment Description Equipment Type Comments 63 125 250 500 1000 2000 4000 8000
120P-001A/B 1st Stage Reactor Feed Pump Assumed Centrifugal 1live/1spare 97 97 97 97 97 95 93 91 105 102 E
120P-002A/B 2nd Stage Reactor Feed Pump Assumed Centrifugal 1live/1spare 97 97 97 97 97 95 93 91 105 102 E
120P-003A/B Injection Water Pump Assumed Centrifugal 1live/1spare 97 97 97 97 97 95 93 91 105 102 E
120P-004A/B HP Lean Amine Pump Assumed Centrifugal 1live/1spare 97 97 97 97 97 95 93 91 105 102 E
120P-005A/B LP Lean Amine Pump Assumed Centrifugal 1live/1spare 97 97 97 97 97 95 93 91 105 102 E
120P-006A/B Product Stripper Reflux Pump Assumed Centrifugal 1live/1spare 97 97 97 97 97 95 93 91 105 102 E
120P-008A/B/C Product Stripper Bottoms Pump Assumed Centrifugal 2live/1spare 98 98 98 98 98 96 94 92 106 103 E
120P-009A/B Fractionator Overhead Water Pump Assumed Centrifugal 1live/1spare 97 97 97 97 97 95 93 91 105 102 E
120P-010A/B Fractionator Reflux Pump Assumed Centrifugal 1live/1spare 97 97 97 97 97 95 93 91 105 102 E
120P-011A/B Whole Naphtha Pump Assumed Centrifugal 1live/1spare 97 97 97 97 97 95 93 91 105 102 E
120P-012A/B Kerosene Product Pump Assumed Centrifugal 1live/1spare 97 97 97 97 97 95 93 91 105 102 E
120P-013A/B/C Light Diesel Pumparound Pump Assumed Centrifugal 1live/1spare 98 98 98 98 98 96 94 92 106 103 E
120P-014A/B Light Diesel Stripper Bottoms Pump Assumed Centrifugal 1live/1spare 97 97 97 97 97 95 93 91 105 102 E
120P-015A/B/C Heavy Diesel Pumparound Pump Assumed Centrifugal 2live/1spare 98 98 98 98 98 96 94 92 106 103 E
120P-016A/B Heavy Diesel Stripper Bottoms Pump
Assumed Centrifugal 1live/1spare 97 97 97 97 97 95 93 91 105 102 E
120P-017A/B/C Fractionator Bottoms Pump Assumed Centrifugal 2live/1spare 98 98 98 98 98 96 94 92 106 103 E
120P-018A/B Deethanizer Reflux Pump Assumed Centrifugal 1live/1spare 97 97 97 97 97 95 93 91 105 102 E

AMEC FOSTER WHEELER REPORT DRP001-FED-RPT-M-000-001 5660-8440-RP-000-004
PAGE 22 OF 45 REV D2 NOISE ASSESSMENT REPORT
DSN: 2668
120P-019A/B Sponge Oil Absorber Reflux Pump Assumed Centrifugal 1live/1spare 97 97 97 97 97 95 93 91 105 102 E
120P-020A/B Sponge Oil Absorber Bottoms Pump Assumed Centrifugal 1live/1spare 97 97 97 97 97 95 93 91 105 102 E
120P-021A/B Diesel Sponge Oil Absorber Bottoms Pump
Assumed Centrifugal 1live/1spare 97 97 97 97 97 95 93 91 105 102 E
120P-022A/B Naphtha Stabilizer Reflux Pump Assumed Centrifugal 1live/1spare 97 97 97 97 97 95 93 91 105 102 E
120P-023A/B Naphtha Stabilizer Bottoms Pump Assumed Centrifugal 1live/1spare 97 97 97 97 97 95 93 91 105 102 E
120P-024A/B Heavy Diesel Product Pump Assumed Centrifugal 1live/1spare 97 97 97 97 97 95 93 91 105 102 E
120P-025A/B Slop Oil Pump Assumed Centrifugal 1live/1spare 97 97 97 97 97 95 93 91 105 102 E
120P-026A/B Hot Well Water Pump Assumed Centrifugal 1live/1spare 97 97 97 97 97 95 93 91 105 102 E
120P-027A/B Backwash Oil Pump Assumed Centrifugal 1live/1spare 97 97 97 97 97 95 93 91 105 102 E
120P-028 LP Injection Water Pump Assumed Centrifugal n/a 97 97 97 97 97 95 93 91 105 102 E
120P-029A/B Rich Amine Pump Assumed Centrifugal 1live/1spare 97 97 97 97 97 95 93 91 105 102 E
120P-030 Water Washer Feed Pump Assumed Centrifugal n/a 97 97 97 97 97 95 93 91 105 102 E
120P-031A/B LPG Settler Water Circulation Pump Assumed Centrifugal 1live/1spare 97 97 97 97 97 95 93 91 105 102 E
120P-032A/B Deaerated Water Booster Pump Assumed Centrifugal 1live/1spare 97 97 97 97 97 95 93 91 105 102 E
120P-051A/B HC Liquid LP Flare Pump Assumed Centrifugal 1live/1spare 97 97 97 97 97 95 93 91 105 102 E
120P-052A/B HC Liquid HP Flare Pump Assumed Centrifugal 1live/1spare 97 97 97 97 97 95 93 91 105 102 E
120P-054A/B HC Liquid HP Flare Pump Assumed Centrifugal 1live/1spare 101 101 101 101 101 99 97 95 109 106 E
120P-055A/B 1st Stage Furnace HP BFW Circulation Pump
Assumed Centrifugal 1live/1spare 97 97 97 97 97 95 93 91 105 102 E
120P-056A/B 2nd Stage Furnace HP BFW Circulation Pump
Assumed Centrifugal 1live/1spare 97 97 97 97 97 95 93 91 105 102 E
120P-057A/B Fractionator Feed Furnace HP BFW Circulation Pump
Assumed Centrifugal 1live/1spare 97 97 97 97 97 95 93 91 105 102 E

AMEC FOSTER WHEELER REPORT DRP001-FED-RPT-M-000-001 5660-8440-RP-000-004
PAGE 23 OF 45 REV D2 NOISE ASSESSMENT REPORT
DSN: 2668
120K-001 Recycle Gas Compressor Assumed Multistage Centrifugal
n/a 101 100 99 99 100 102 102 95 110 108 E
120K-002A/B/C/D
Make-up Hydrogen Compressor (individual)
Assumed Multistage Centrifugal
3live/1spare 104 103 102 102 103 105 105 98 112 111 E
120AE-001A-H 1st Stage Reactor Effluent Air Cooler
Air Fan Cooler n/a 122 120 117 113 110 105 99 93 126 116 E
120AE-002A-D 2nd Stage HHPS Vapor Air Cooler Air Fan Cooler n/a 120 118 115 111 108 103 97 91 123 113 E
120AE-003 HLPS Vapor Air Cooler Air Fan Cooler n/a 116 114 111 107 104 99 93 87 119 109 E
120AE-004 Product Stripper Overhead Condenser
Air Fan Cooler n/a 118 116 113 109 106 101 95 89 121 111 E
120AE-005 Fractionator Overhead Condenser Air Fan Cooler n/a 124 122 119 115 112 107 101 95 127 117 E
120AE-006 Kerosene Product Air Cooler Air Fan Cooler n/a 116 114 111 107 104 99 93 87 119 109 E
120AE-007 A/B Naphtha Stabilizer Condenser Air Fan Cooler n/a 118 116 113 109 106 101 95 89 121 111 E
120AE-008 A-M Fractionator Bottoms Start-up Air Cooler
Air Fan Cooler n/a 124 122 119 115 112 107 101 95 127 117 E
120AE-009 Naphtha Air Cooler Air Fan Cooler n/a 116 114 111 107 104 99 93 87 119 109 E
120AE-010 UCO Product Bleed Air Cooler Air Fan Cooler n/a 116 114 111 107 104 99 93 87 119 109 E
120AE-011 Heavy Diesel Vacuum Drier Air Cooler
Air Fan Cooler n/a 116 114 111 107 104 99 93 87 119 109 E
120AE-012 A-C Diesel Air Cooler Air Fan Cooler n/a 119 117 114 110 107 102 96 90 123 113 E
120AE-013 A-D Backwash Oil Air Cooler Air Fan Cooler n/a 120 118 115 111 108 103 97 91 123 113 E

AMEC FOSTER WHEELER REPORT DRP001-FED-RPT-M-000-001 5660-8440-RP-000-004
PAGE 24 OF 45 REV D2 NOISE ASSESSMENT REPORT
DSN: 2668
ATTACHMENT 10 EQUIPMENT NOISE BREAKDOWN FOR UNIT 130 PLOT PLAN
Sound Power Level
Octave band centre frequency (Hz) dB dB(A) Source
Equipment No.
Equipment Description Equipment Type Comments 63 125 250 500 1000 2000 4000 8000
130P-001A/B/C Heater Charge Pumps Assumed Centrifugal 2live/1spare 98 98 98 98 98 96 94 92 106 103 E
130P-002A/B Unstabilized Naphtha Pump Assumed Centrifugal 1live/1spare 97 97 97 97 97 95 93 91 105 102 E
130P-003A/B Fractionator Reflux Pump Assumed Centrifugal 1live/1spare 97 97 97 97 97 95 93 91 105 102 E
130P-004A/B LCGO Product Pump Assumed Centrifugal 1live/1spare 97 97 97 97 97 95 93 91 105 102 E
130P-005A/B HCGO Product Pump Assumed Centrifugal 1live/1spare 97 97 97 97 97 95 93 91 105 102 E
130P-006A/B HCGO Pumparound Pump Assumed Centrifugal 1live/1spare 97 97 97 97 97 95 93 91 105 102 E
130P-007A/B Fractionator Sour Water Pump Assumed Centrifugal 1live/1spare 97 97 97 97 97 95 93 91 105 102 E
130P-008 Cutting Pump and Decoking Equipment
Assumed Centrifugal n/a 97 97 97 97 97 95 93 91 105 102 E
130P-009A/B/C/D
Clear Water Pumps Assumed Centrifugal 3live/1spare 99 99 99 99 99 97 95 93 107 104 E
130P-010A/B Quench Water Pump Assumed Centrifugal 1live/1spare 97 97 97 97 97 95 93 91 105 102 E
130P-011A/B/C Blowdown Circulating Oil Pumps Assumed Centrifugal 2live/1spare 98 98 98 98 98 96 94 92 106 103 E
130P-012A/B Blowdown Sour Water Pump Assumed Centrifugal 1live/1spare 97 97 97 97 97 95 93 91 105 102 E
130P-013A/B Sponge Oil Pump Assumed Centrifugal 1live/1spare 97 97 97 97 97 95 93 91 105 102 E
130P-014A/B Blowdown Slop Oil Pump Assumed Centrifugal 1live/1spare 97 97 97 97 97 95 93 91 105 102 E
130P-015 Fines Removal Pump Assumed Centrifugal n/a 97 97 97 97 97 95 93 91 105 102 E
130P-022A/B Condensate Pump Assumed Centrifugal 1live/1spare 97 97 97 97 97 95 93 91 105 102 E

AMEC FOSTER WHEELER REPORT DRP001-FED-RPT-M-000-001 5660-8440-RP-000-004
PAGE 25 OF 45 REV D2 NOISE ASSESSMENT REPORT
DSN: 2668
130P-023A/B Condensate Product Pump Assumed Centrifugal 1live/1spare 97 97 97 97 97 95 93 91 105 102 E
130P-051A/B Compressor Interstage Pump Assumed Centrifugal 1live/1spare 97 97 97 97 97 95 93 91 105 102 E
130P-054A/B Debutanizer Feed Pump Assumed Centrifugal 1live/1spare 97 97 97 97 97 95 93 91 105 102 E
130P-055A/B Debutanizer Reflux Pump Assumed Centrifugal 1live/1spare 97 97 97 97 97 95 93 91 105 102 E
130P-056A/B Debutanizer Overhead Product Pump
Assumed Centrifugal 1live/1spare 97 97 97 97 97 95 93 91 105 102 E
130P-057A/B Total Naphtha Pump Assumed Centrifugal 1live/1spare 97 97 97 97 97 95 93 91 105 102 E
130P-060A/B Compressor Liquid Suction Pump Assumed Centrifugal 1live/1spare 97 97 97 97 97 95 93 91 105 102 E
130P-062A/B Amine Booster Pump Assumed Centrifugal 1live/1spare 97 97 97 97 97 95 93 91 105 102 E
130K-051 Coker Gas Compressor Assumed Multistage Centrifugal Compressors
n/a 102 101 100 100 101 103 103 96 110 109 E
130PK-004 Solid Sludge Handling Package n/a 112 113 114 115 112 107 99 92 121 116 E
130U-071 Coke Handling System Package (ISBL)
n/a 108 109 110 111 108 103 95 88 117 113 E
130PK-051 Ammonium Polysulfide System Package
n/a 105 106 107 108 105 100 92 85 113 109 E
130PK-003 HCGO Product Filter Package n/a 108 109 110 111 108 103 95 88 116 112 E
130AE-001 Fractionator Overhead Condenser n/a 123 121 118 114 111 106 100 94 126 116 E
130AE-002 Blowdown Condenser n/a 121 119 116 112 109 104 98 92 125 115 E
130AE-003 Blowdown Circulation Oil Cooler n/a 116 114 111 107 104 99 93 87 119 109 E
130AE-004 HCGO Product Cooler n/a 119 117 114 110 107 102 96 90 122 112 E
130AE-005 LCGO Product Cooler n/a 117 115 112 108 105 100 94 88 120 110 E
130AE-006 Condensate Cooler n/a 116 114 111 107 104 99 93 87 119 109 E

AMEC FOSTER WHEELER REPORT DRP001-FED-RPT-M-000-001 5660-8440-RP-000-004
PAGE 26 OF 45 REV D2 NOISE ASSESSMENT REPORT
DSN: 2668
130AE-007 Atmospheric Steam Condenser n/a 116 114 111 107 104 99 93 87 119 109 E
130AE-008 Spalling Cooler n/a 116 114 111 107 104 99 93 87 119 109 E
130AE-051 Compressor Interstage Cooler n/a 119 117 114 110 107 102 96 90 122 112 E
130AE-052 Absorber Stripper Feed Condenser n/a 119 117 114 110 107 102 96 90 122 112 E
130AE-053 Total Naphtha Cooler n/a 116 114 111 107 104 99 93 87 119 109 E
130AE-054 Lean Sponge Oil Cooler n/a 116 114 111 107 104 99 93 87 119 109 E

AMEC FOSTER WHEELER REPORT DRP001-FED-RPT-M-000-001 5660-8440-RP-000-004
PAGE 27 OF 45 REV D2 NOISE ASSESSMENT REPORT
DSN: 2668
ATTACHMENT 11 EQUIPMENT NOISE BREAKDOWN FOR UNIT 135 PLOT PLAN
Sound Power Level
Octave band centre frequency (Hz) dB dB(A) Source
Equipment No.
Equipment Description Equipment Type Comments 63 125 250 500 1000 2000 4000 8000
135P-001A/B Rich Amine Pump Centrifugal Pump 1live/1spare 98 98 98 98 98 96 94 92 106 103 E
135P-002A/B Amine Filter Pump Centrifugal Pump 1live/1spare 98 98 98 98 98 96 94 92 106 103 E
135P-004 Wash Water Injection Pump Centrifugal Pump n/a 96 96 96 96 96 94 92 90 104 101 E
135P-101A/B Lean Amine Pump Centrifugal Pump 1live/1spare 102 102 102 102 102 100 98 96 110 107 E
135P-201A/B Lean Amine Pump Centrifugal Pump 1live/1spare 102 102 102 102 102 100 98 96 110 107 E
135P-202A/B Regenerator Reflux Pump Centrifugal Pump 1live/1spare 98 98 98 98 98 96 94 92 106 103 E
135AE-001 Lean Amine Cooler Air Fan Cooler n/a 121 119 116 112 109 104 98 92 124 114 E
135AE-101 Regenerator OVHD Condenser Air Fan Cooler n/a 116 114 111 107 104 99 93 87 119 109 E
135AE-201 Regenerator OVHD Condenser Air Fan Cooler n/a 116 114 111 107 104 99 93 87 119 109 E

AMEC FOSTER WHEELER REPORT DRP001-FED-RPT-M-000-001 5660-8440-RP-000-004
PAGE 28 OF 45 REV D2 NOISE ASSESSMENT REPORT
DSN: 2668
ATTACHMENT 12 EQUIPMENT NOISE BREAKDOWN FOR UNIT 136 PLOT PLAN
Sound Power Level
Octave band centre frequency (Hz) dB dB(A) Source
Equipment No.
Equipment Description Equipment Type Comments 63 125 250 500 1000 2000 4000 8000
136P-001A/B Sour Water Transfer Pump Assumed Centrifugal 1live/1spare 98 98 98 98 98 96 94 92 106 103 E
136P-002A/B Sour Water Tank Pump Assumed Centrifugal 1live/1spare 98 98 98 98 98 96 94 92 106 103 E
136P-101A/B Stripper Pump Around Pump Assumed Centrifugal 1live/1spare 98 98 98 98 98 96 94 92 106 103 E
136P-102A/B Stripped Water Pump Assumed Centrifugal 1live/1spare 98 98 98 98 98 96 94 92 106 103 E
136P-201A/B Stripper Pump Around Pump Assumed Centrifugal 1live/1spare 98 98 98 98 98 96 94 92 106 103 E
136P-202A/B Stripped Water Pump Assumed Centrifugal 1live/1spare 99 99 99 99 99 97 95 93 107 104 E
136AE-001 Stripped Water Bottoms Cooler Air Fan Cooler n/a 117 115 112 108 105 100 94 88 121 111 E
136AE-101 Stripper Overhead Condenser Air Fan Cooler n/a 115 113 110 106 103 98 92 86 119 109 E
136AE-201 Stripper Overhead Condenser Air Fan Cooler n/a 115 113 110 106 103 98 92 86 119 109 E

AMEC FOSTER WHEELER REPORT DRP001-FED-RPT-M-000-001 5660-8440-RP-000-004
PAGE 29 OF 45 REV D2 NOISE ASSESSMENT REPORT
DSN: 2668
ATTACHMENT 13 EQUIPMENT NOISE BREAKDOWN FOR UNIT 150 PLOT PLAN
Sound Power Level
Octave band centre frequency (Hz) dB dB(A) Source
Equipment No.
Equipment Description Equipment Type Comments 63 125 250 500 1000 2000 4000 8000
150P-003A/B Circulation Pumps Assumed Centrifugal 1live/1spare 96 96 96 96 96 94 92 90 104 101 E
150P-005 Water Addition Pump Assumed Centrifugal n/a 96 96 96 96 96 94 92 90 104 101 E
150P-007A/B Caustic Addition Pumps Assumed Centrifugal 1live/1spare 96 96 96 96 96 94 92 90 104 101 E
150P-008A/B High Pressure Flare Knockout Drum Slops Pumps
Assumed Centrifugal 1live/1spare 96 96 96 96 96 94 92 90 104 101 E
150P-009A/B Low Pressure Flare Knockout Drum Slops Pumps
Assumed Centrifugal 1live/1spare 96 96 96 96 96 94 92 90 104 101 E
150DS-001 Desuperheater n/a 69 75 81 87 93 97 93 87 100 101 E
150K-001A/B Air Compressor System Assumed Multistage Centrifugal Compressors
1live/1spare 96 95 94 94 95 97 97 90 104 102 E

AMEC FOSTER WHEELER REPORT DRP001-FED-RPT-M-000-001 5660-8440-RP-000-004
PAGE 30 OF 45 REV D2 NOISE ASSESSMENT REPORT
DSN: 2668
ATTACHMENT 14 EQUIPMENT NOISE BREAKDOWN FOR UNIT 160 PLOT PLAN
Sound Power Level
Octave band centre frequency (Hz) dB dB(A) Source
Equipment No.
Equipment Description Equipment Type Comments 63 125 250 500 1000 2000 4000 8000
160P-001 A/B Unfiltered DHT Reactor Feed Pump Assumed Centrifugal 1live/1spare 97 97 97 97 97 95 93 91 105 102 E
160P-002 A/B DHT Reactor Feed Pump Assumed Centrifugal 1live/1spare 97 97 97 97 97 95 93 91 105 102 E
160P-003 A/B Coker Naphtha Feed Pump Assumed Centrifugal 1live/1spare 97 97 97 97 97 95 93 91 105 102 E
160P-004 A/B Diesel Product Pump Assumed Centrifugal 1live/1spare 97 97 97 97 97 95 93 91 105 102 E
160P-005 A/B Fractionator Reboiler Pump Assumed Centrifugal 1live/1spare 97 97 97 97 97 95 93 91 105 102 E
160P-006 A/B Fractionator Reflux Pump Assumed Centrifugal 1live/1spare 97 97 97 97 97 95 93 91 105 102 E
160P-007 A/B Unstabilized Naphtha Pump Assumed Centrifugal 1live/1spare 97 97 97 97 97 95 93 91 105 102 E
160P-008 A/B Naphtha Stabilized Reflux Pump Assumed Centrifugal 1live/1spare 97 97 97 97 97 95 93 91 105 102 E
160P-009 A/B Stabilized Naphtha Product Pump Assumed Centrifugal 1live/1spare 97 97 97 97 97 95 93 91 105 102 E
160P-010 A/B Interstage Naphtha Pump Assumed Centrifugal 1live/1spare 97 97 97 97 97 95 93 91 105 102 E
160P-011 A/B Compressor Interstage KO Drum Pump
Assumed Centrifugal 1live/1spare 97 97 97 97 97 95 93 91 105 102 E
160P-012 A/B Offgas Compressor Suction Pump Assumed Centrifugal 1live/1spare 97 97 97 97 97 95 93 91 105 102 E
160P-013 A/B Backwash Oil Pump Assumed Centrifugal 1live/1spare 97 97 97 97 97 95 93 91 105 102 E
160P-014 A/B LP Lean Amine Pump Assumed Centrifugal 1live/1spare 97 97 97 97 97 95 93 91 105 102 E
160P-015 A/B HP Lean Amine Pump Assumed Centrifugal 1live/1spare 97 97 97 97 97 95 93 91 105 102 E
160P-016 A/B Injection Water Pump Assumed Centrifugal 1live/1spare 97 97 97 97 97 95 93 91 105 102 E
160P-051 A/B HC Liquid LP Flare Pump Assumed Centrifugal 1live/1spare 97 97 97 97 97 95 93 91 105 102 E

AMEC FOSTER WHEELER REPORT DRP001-FED-RPT-M-000-001 5660-8440-RP-000-004
PAGE 31 OF 45 REV D2 NOISE ASSESSMENT REPORT
DSN: 2668
160P-052 A/B HC Liquid HP Flare Pump Assumed Centrifugal 1live/1spare 97 97 97 97 97 95 93 91 105 102 E
160P-053 A/B ATM Condensate Return Pump Assumed Centrifugal 1live/1spare 97 97 97 97 97 95 93 91 105 102 E
160K-001 Recycle Gas Compressor Assumed Multistage Centrifugal
n/a 101 100 99 99 100 102 102 95 110 108 E
160K-002 A/B Offgas Compressor Assumed Multistage Centrifugal
n/a 101 100 99 99 100 102 102 95 110 108 E
160AE-001 Reactor Effluent Air Cooler Air Fan Cooler n/a 121 119 116 112 109 104 98 92 125 115 E
160AE-002 HLPS Vapor Air Cooler Air Fan Cooler n/a 116 114 111 107 104 99 93 87 119 109 E
160AE-003 Fractionator Overhead Air Cooler Air Fan Cooler n/a 123 121 118 114 111 106 100 94 126 116 E
160AE-004 Diesel Product Air Cooler Air Fan Cooler n/a 118 116 113 109 106 101 95 89 121 111 E
160AE-005 Stabilized Naphtha Product Air Cooler
Air Fan Cooler n/a 119 117 114 110 107 102 96 90 123 113 E
160AE-006 Backwash Oil Air Cooler Air Fan Cooler n/a 118 116 113 109 106 101 95 89 121 111 E

AMEC FOSTER WHEELER REPORT DRP001-FED-RPT-M-000-001 5660-8440-RP-000-004
PAGE 32 OF 45 REV D2 NOISE ASSESSMENT REPORT
DSN: 2668
ATTACHMENT 15 EQUIPMENT NOISE BREAKDOWN FOR UNIT 170 PLOT PLAN
Sound Power Level
Octave band centre frequency (Hz) dB dB(A) Source
Equipment No. Equipment Description Equipment Type Comments 63 125 250 500 1000 2000 4000 8000
170P-101A/B Caustic Prewash Circulation Pump Assumed centrifugal n/a 96 96 96 96 96 94 92 90 104 101 E
170P-102A/B Spent Solvent Pump Assumed centrifugal n/a 96 96 96 96 96 94 92 90 104 101 E
170P-103A/B Caustic Injection Pump Assumed centrifugal n/a 96 96 96 96 96 94 92 90 104 101 E
170P-104 Water-Caustic Addition Pump Assumed centrifugal n/a 96 96 96 96 96 94 92 90 104 101 E
170P-105A/B COS Solvent Circulation Pump Assumed centrifugal n/a 96 96 96 96 96 94 92 90 104 101 E
170P-106A/B Product Recycle Pump Assumed centrifugal n/a 96 96 96 96 96 94 92 90 104 101 E
170P-107 MEA Makeup Pump Assumed centrifugal n/a 96 96 96 96 96 94 92 90 104 101 E
170P-108 COS Solvent Makeup Pump Assumed centrifugal n/a 96 96 96 96 96 94 92 90 104 101 E
170P-109A/B Merox WS Injection Pump Assumed centrifugal n/a 96 96 96 96 96 94 92 90 104 101 E
170P-110A/B Caustic Circulation Pump Assumed centrifugal n/a 96 96 96 96 96 94 92 90 104 101 E
170P-111A/B Wash Oil Pump Assumed centrifugal n/a 96 96 96 96 96 94 92 90 104 101 E
170P-112A/B Disulfide Oil Pump Assumed centrifugal n/a 96 96 96 96 96 94 92 90 104 101 E
170P-113A/B Vent Tank Drain Pump Assumed centrifugal n/a 96 96 96 96 96 94 92 90 104 101 E
170P-201A/B Caustic Prewash Circulation Pump Assumed centrifugal n/a 96 96 96 96 96 94 92 90 104 101 E
170P-202A/B Spent Solvent Pump Assumed centrifugal n/a 96 96 96 96 96 94 92 90 104 101 E
170P-203A/B Caustic Injection Pump Assumed centrifugal n/a 96 96 96 96 96 94 92 90 104 101 E
170P-204 Water-Caustic Addition Pump Assumed centrifugal n/a 96 96 96 96 96 94 92 90 104 101 E

AMEC FOSTER WHEELER REPORT DRP001-FED-RPT-M-000-001 5660-8440-RP-000-004
PAGE 33 OF 45 REV D2 NOISE ASSESSMENT REPORT
DSN: 2668
170P-205A/B COS Solvent Circulation Pump Assumed centrifugal n/a 96 96 96 96 96 94 92 90 104 101 E
170P-206A/B Product Recycle Pump Assumed centrifugal n/a 96 96 96 96 96 94 92 90 104 101 E
170P-207 MEA Makeup Pump Assumed centrifugal n/a 96 96 96 96 96 94 92 90 104 101 E
170P-208 COS Solvent Makeup Pump Assumed centrifugal n/a 96 96 96 96 96 94 92 90 104 101 E
170P-209A/B Merox WS Injection Pump Assumed centrifugal n/a 96 96 96 96 96 94 92 90 104 101 E
170P-210A/B Caustic Circulation Pump Assumed centrifugal n/a 96 96 96 96 96 94 92 90 104 101 E
170P-211A/B Wash Oil Pump Assumed centrifugal n/a 96 96 96 96 96 94 92 90 104 101 E
170P-212A/B Disulfide Oil Pump Assumed centrifugal n/a 96 96 96 96 96 94 92 90 104 101 E
170P-213A/B Vent Tank Drain Pump Assumed centrifugal n/a 96 96 96 96 96 94 92 90 104 101 E

AMEC FOSTER WHEELER REPORT DRP001-FED-RPT-M-000-001 5660-8440-RP-000-004
PAGE 34 OF 45 REV D2 NOISE ASSESSMENT REPORT
DSN: 2668
ATTACHMENT 16 EQUIPMENT NOISE BREAKDOWN FOR UNIT 320 PLOT PLAN
Sound Power Level
Octave band centre frequency (Hz) dB dB(A) Source
Equipment No. Equipment Description Equipment Type Comments 63 125 250 500 1000 2000 4000 8000
320P-001A/B Rich Amine Pump Assumed Centrifugal n/a 98 98 98 98 98 96 94 92 106 103 E
320P-002A/B Amine Filter Pump Assumed Centrifugal n/a 96 96 96 96 96 94 92 90 104 101 E
320P-008A/B Condensate Pump Assumed Centrifugal n/a 96 96 96 96 96 94 92 90 104 101 E
320P-101A/B Lean Amine Pump Assumed Centrifugal n/a 100 100 100 100 100 98 96 94 108 105 E
320P-201A/B Lean Amine Pump Assumed Centrifugal n/a 100 100 100 100 100 98 96 94 108 105 E
320P-202A/B Regenerator Reflux Pump Assumed Centrifugal n/a 100 100 100 100 100 98 96 94 108 105 E
320AE-001 Lean Amine Cooler Air Fan Cooler n/a 122 120 117 113 110 105 99 93 125 115 E
320AE-002 Condensate Drum Condenser Air Fan Cooler n/a 116 114 111 107 104 99 93 87 120 110 E
320AE-101 Regenerator OVHD Condenser Air Fan Cooler n/a 116 114 111 107 104 99 93 87 120 110 E
320AE-201 Regenerator OVHD Condenser Air Fan Cooler n/a 116 114 111 107 104 99 93 87 120 110 E

AMEC FOSTER WHEELER REPORT DRP001-FED-RPT-M-000-001 5660-8440-RP-000-004
PAGE 35 OF 45 REV D2 NOISE ASSESSMENT REPORT
DSN: 2668
ATTACHMENT 17 EQUIPMENT NOISE BREAKDOWN FOR UNIT 330 PLOT PLAN
Sound Power Level
Octave band centre frequency (Hz) dB dB(A) Source
Equipment No. Equipment Description Equipment Type Comment
s 63 125 250 500 1000 2000 4000 8000
330P-001A/B Sour Water Transfer Pump Assumed Centrifugal n/a 98 98 98 98 98 96 94 92 106 103 E
330P-005 Cold Condensate Pump Assumed Centrifugal n/a 96 96 96 96 96 94 92 90 104 101 E
330P-101A/B Stripper Reflux Pump Assumed Centrifugal n/a 96 96 96 96 96 94 92 90 104 101 E
330P-102A/B Stripped Water Pump Assumed Centrifugal n/a 99 99 99 99 99 97 95 93 107 104 E
330P-201A/B Stripper Reflux Pump Assumed Centrifugal n/a 96 96 96 96 96 94 92 90 104 101 E
330P-202A/B Stripped Water Pump Assumed Centrifugal n/a 100 100 100 100 100 98 96 94 108 105 E
330AE-001 Stripped Water Bottoms Cooler Air Fan Cooler n/a 118 116 113 109 106 101 95 89 121 111 E
330AE-002 Condensate Drum Condenser Air Fan Cooler n/a 116 114 111 107 104 99 93 87 120 110 E
330AE-101 Stripper Overhead Condenser Air Fan Cooler n/a 116 114 111 107 104 99 93 87 120 110 E
330AE-201 Stripper Overhead Condenser Air Fan Cooler n/a 116 114 111 107 104 99 93 87 120 110 E

AMEC FOSTER WHEELER REPORT DRP001-FED-RPT-M-000-001 5660-8440-RP-000-004
PAGE 36 OF 45 REV D2 NOISE ASSESSMENT REPORT
DSN: 2668
ATTACHMENT 18 EQUIPMENT NOISE BREAKDOWN FOR UNIT 340 PLOT PLAN
Sound Power Level
Octave band centre frequency (Hz) dB dB(A) Source
Equipment No. Equipment Description Equipment Type Comments 63 125 250 500 1000 2000 4000 8000
340P-105/205/305A/B
Contact Condenser Pump Assumed Centrifugal n/a 96 96 96 96 96 94 92 90 104 101 E
340P-106/206/306A/B
Desuperheater Pump Assumed Centrifugal n/a 96 96 96 96 96 94 92 90 104 101 E
340P-107/207/307A/B
Rich Amine Pump Assumed Centrifugal n/a 96 96 96 96 96 94 92 90 104 101 E
340P-108/208A/B Lean Amine Pump Assumed Centrifugal n/a 96 96 96 96 96 94 92 90 104 101 E
340P-111/211/311A/B
Condensate Return Pump Assumed Centrifugal n/a 96 96 96 96 96 94 92 90 104 101 E
340P-113/213/313A/B
LP Blowdown Drum Pump Assumed Centrifugal n/a 96 96 96 96 96 94 92 90 104 101 E
340P-114/214/314A/B
Sulphur Transfer Pump Assumed Centrifugal n/a 96 96 96 96 96 94 92 90 104 101 E
340K-001A/B/C/D Combustion Air Blowers n/a 96 95 94 94 95 97 97 90 104 103 E
340K-102A/B/C Incinerator Combustion Air Blowers
n/a 98 97 96 96 97 99 99 92 107 105 E
340K-202A/B/C Incinerator Combustion Air Blowers
n/a 98 97 96 96 97 99 99 92 107 105 E
340K-302A/B/C Incinerator Combustion Air Blowers
n/a 98 97 96 96 97 99 99 92 107 105 E
340AE- Waste Steam Condenser n/a 116 114 111 107 104 99 93 87 120 110 E

AMEC FOSTER WHEELER REPORT DRP001-FED-RPT-M-000-001 5660-8440-RP-000-004
PAGE 37 OF 45 REV D2 NOISE ASSESSMENT REPORT
DSN: 2668
101/201/301
340AE-102/202/302
Contact Condenser Cooler n/a 116 114 111 107 104 99 93 87 120 110 E
340AE-103/203AB Lean Amine Cooler n/a 116 114 111 107 104 99 93 87 120 110 E
340AE-104/204 Regenerator Overhead Condenser n/a 116 114 111 107 104 99 93 87 120 110 E
340AE-105/205/305
Flash Steam Condenser n/a 116 114 111 107 104 99 93 87 120 110 E
340AE-106/206/306
Blowdown Flash Steam Condenser
n/a 116 114 111 107 104 99 93 87 120 110 E
340AE-107/207/307
Blowdown Cooler n/a 116 114 111 107 104 99 93 87 120 110 E
340BR-101/201/301
Main Burner n/a 90 96 100 99 95 90 85 80 105 101 E
340BR-102/202/302
Incinerator Burner n/a 90 96 100 99 95 90 85 80 105 101 E
340F-101/201/301 Reaction Furnace n/a 125 119 114 109 105 102 99 92 126 112 E
340F-102/202/302 Incinerator n/a 95 102 101 99 95 90 85 80 107 101 E
340J-101/201/301 Pit Vent Ejector n/a 68 74 80 86 92 96 92 86 100 100 E
340J-102/202/302 Tail Gas Start-Up Ejector n/a 68 74 80 86 92 96 92 86 100 100 E
340SK-101/201/301
Stack n/a 125 125 121 118 106 98 93 92 130 118 E

AMEC FOSTER WHEELER REPORT DRP001-FED-RPT-M-000-001 5660-8440-RP-000-004
PAGE 38 OF 45 REV D2 NOISE ASSESSMENT REPORT
DSN: 2668
ATTACHMENT 19 EQUIPMENT NOISE BREAKDOWN FOR UNIT 400 PLOT PLAN
Sound Power Level
Octave band centre frequency (Hz) dB dB(A) Source
Equipment No. Equipment Description Equipment Type Comments 63 125 250 500 1000 2000 4000 8000
400P-001A/B Potable Water Pumps Assumed Centrifugal 1live/1spare 96 96 96 96 96 94 92 90 104 101 E
400P-002A/B Service Water Pumps Assumed Centrifugal 1live/1spare 96 96 96 96 96 94 92 90 104 101 E
420P-001A/B/C Demineralised Water Pumps Assumed Centrifugal 1live/1spare 97 97 97 97 97 95 93 91 105 102 E
510P-001A/B/C Desalinated Water Pumps Assumed Centrifugal 2live/1spare 97 97 97 97 97 95 93 91 105 102 E
480P-001A/B Caustic Solution Pumps Assumed Centrifugal 1live/1spare 96 96 96 96 96 94 92 90 104 101 E
480P-002A/B Caustic Tanker Offloading Pumps Assumed Centrifugal 1live/1spare 96 96 96 96 96 94 92 90 104 101 E
480P-003 Caustic Drain Pump Assumed Centrifugal n/a 96 96 96 96 96 94 92 90 104 101 E
460K-001A/B HP Instrument Air Compressors Assumed Multistage Centrifugal
1live/1spare 96 95 94 94 95 97 97 90 104 102 E
510PK-001 RO Desalination Package n/a 106 107 108 109 106 101 93 86 114 110 E
510PK-002 UV Disinfection Package n/a 104 105 106 107 104 99 91 84 112 108 E

AMEC FOSTER WHEELER REPORT DRP001-FED-RPT-M-000-001 5660-8440-RP-000-004
PAGE 39 OF 45 REV D2 NOISE ASSESSMENT REPORT
DSN: 2668
ATTACHMENT 20 EQUIPMENT NOISE BREAKDOWN FOR UNIT 710 PLOT PLAN
Sound Power Level
Octave band centre frequency (Hz) dB dB(A) Source
Equipment No. Equipment Description Equipment Type Comments 63 125 250 500 1000 2000 4000 8000
710P-001A/B Kerosene Transfer Pump Assumed Centrifugal n/a 97 97 97 97 97 95 93 91 105 102 E
710P-002A/B Combined Diesel Transfer Pump
Assumed Centrifugal n/a 97 97 97 97 97 95 93 91 105 102 E
710P-003A/B LCGO Transfer Pump Assumed Centrifugal n/a 97 97 97 97 97 95 93 91 105 102 E
710P-005A/B/C VGO Transfer Pump Assumed Centrifugal n/a 98 98 98 98 98 96 94 92 106 103 E
710P-006A/B VGO Circulation Pump Assumed Centrifugal n/a 97 97 97 97 97 95 93 91 105 102 E
710P-007A/B HCGO Storage Pump Assumed Centrifugal n/a 97 97 97 97 97 95 93 91 105 102 E
710P-008A/B HCGO Circulation Pump Assumed Centrifugal n/a 97 97 97 97 97 95 93 91 105 102 E
710P-009A/B/C VR Storage Pump Assumed Centrifugal n/a 98 98 98 98 98 96 94 92 106 103 E
710P-010A/B/C HSFO Storage Pump Assumed Centrifugal n/a 98 98 98 98 98 96 94 92 106 103 E
710P-011A/B/C/D VR/HSFO Circulation Pump Assumed Centrifugal n/a 99 99 99 99 99 97 95 93 107 104 E

AMEC FOSTER WHEELER REPORT DRP001-FED-RPT-M-000-001 5660-8440-RP-000-004
PAGE 40 OF 45 REV D2 NOISE ASSESSMENT REPORT
DSN: 2668
ATTACHMENT 21 EQUIPMENT NOISE BREAKDOWN FOR UNIT 570 PLOT PLAN
Sound Power Level
Octave band centre frequency (Hz) dB dB(A) Source
Equipment No. Equipment Description Equipment Type Comments 63 125 250 500 1000 2000 4000 8000
570P-001A/B/C API De-Oiled Water Pump Assumed Centrifugal 2live/1spare 98 98 98 98 98 96 94 92 106 103 E
570P-004A/B/C/D Balance Tank Mixing Pump Assumed Centrifugal 3live/1spare 99 99 99 99 99 97 95 93 107 104 E
570P-005A/B Off-Spec Sour Water Discharge Pump
Assumed Centrifugal 1live/1spare 97 97 97 97 97 95 93 91 105 102 E
570P-006A/B Desalter Slops Pump Assumed Centrifugal 1live/1spare 97 97 97 97 97 95 93 91 105 102 E
570P-007A/B/C/D Equalisation Mixing Pump Assumed Centrifugal 3live/1spare 99 99 99 99 99 97 95 93 107 104 E
570P-008A/B Equalisation Discharge Pump Assumed Centrifugal 1live/1spare 97 97 97 97 97 95 93 91 105 102 E
570P-009A/B Off-Spec Equalisation Mixing Pump
Assumed Centrifugal 1live/1spare 97 97 97 97 97 95 93 91 105 102 E
570P-010A/B Off-Spec Equalisation Discharge Pump
Assumed Centrifugal 1live/1spare 97 97 97 97 97 95 93 91 105 102 E
570P-012A/B Slop Oil Pump Assumed Centrifugal 1live/1spare 97 97 97 97 97 95 93 91 105 102 E
570P-013A/B Oil Sludge Pump Assumed Centrifugal 1live/1spare 97 97 97 97 97 95 93 91 105 102 E
570P-014A/B Oily Area Drainage Pump Assumed Centrifugal 1live/1spare 97 97 97 97 97 95 93 91 105 102 E
570P-019A/B Sand Filter Feed Pump Assumed Centrifugal 1live/1spare 97 97 97 97 97 95 93 91 105 102 E
570P-020A/B Acid Transfer Pump Assumed Centrifugal 1live/1spare 97 97 97 97 97 95 93 91 105 102 E
570P-021A/B Reuse Water Distribution Pump
Assumed Centrifugal 1live/1spare 97 97 97 97 97 95 93 91 105 102 E
570P-022A/B/C Thickener Supernatant Pump Assumed Centrifugal 2live/1spare 98 98 98 98 98 96 94 92 106 103 E

AMEC FOSTER WHEELER REPORT DRP001-FED-RPT-M-000-001 5660-8440-RP-000-004
PAGE 41 OF 45 REV D2 NOISE ASSESSMENT REPORT
DSN: 2668
590P-001AB/C/D Spent Sulphidic Caustic Discharge Pump
Assumed Centrifugal 3live/1spare 99 99 99 99 99 97 95 93 107 104 E

AMEC FOSTER WHEELER REPORT DRP001-FED-RPT-M-000-001 5660-8440-RP-000-004
PAGE 42 OF 45 REV D2 NOISE ASSESSMENT REPORT
DSN: 2668
ATTACHMENT 22 EQUIPMENT NOISE BREAKDOWN FOR UNIT 700 PLOT PLAN
Sound Power Level
Octave band centre frequency (Hz) dB dB(A) Source
Equipment No. Equipment Description Equipment Type Comments 63 125 250 500 1000 2000 4000 8000
700P-001A/B/C/D/E/F Crude Charge Pumps Assumed Centrifugal 5live/1spare 101 101 101 101 101 99 97 95 109 106 E

AMEC FOSTER WHEELER REPORT DRP001-FED-RPT-M-000-001 5660-8440-RP-000-004
PAGE 43 OF 45 REV D2 NOISE ASSESSMENT REPORT
DSN: 2668
ATTACHMENT 23 EQUIPMENT NOISE BREAKDOWN FOR UNIT 730 PLOT PLAN
Sound Power Level
Octave band centre frequency (Hz) dB dB(A) Source
Equipment No. Equipment Description Equipment Type Comments 63 125 250 500 1000 2000 4000 8000
730P-001A/B/C/D Naphtha Product Export Pumps Assumed Centrifugal 3live/1spare 99 99 99 99 99 97 95 93 107 104 E
730P-002A/B/C/D Jet A-1 Product Export Pumps Assumed Centrifugal 3live/1spare 99 99 99 99 99 97 95 93 107 104 E
730P-003A/B/C/D Diesel Product Export Pumps Assumed Centrifugal 3live/1spare 99 99 99 99 99 97 95 93 107 104 E
730P-004 Tankage Area Blowdown Pump Assumed Centrifugal 99 99 99 99 99 97 95 93 107 104 E
730P-015A/B Diesel Truck Loading Transfer Pumps
Assumed Centrifugal 1live/1spare 96 96 96 96 96 94 92 90 104 101 E
730P-016A/B Jet A-1 Truck Loading Transfer Pumps
Assumed Centrifugal 1live/1spare 96 96 96 96 96 94 92 90 104 101 E

AMEC FOSTER WHEELER REPORT DRP001-FED-RPT-M-000-001 5660-8440-RP-000-004
PAGE 44 OF 45 REV D2 NOISE ASSESSMENT REPORT
DSN: 2668
ATTACHMENT 24 EQUIPMENT NOISE BREAKDOWN FOR UNIT 640 PLOT PLAN
Sound Power Level
Octave band centre frequency (Hz) dB dB(A) Source
Equipment No.
Equipment Description Equipment Type Comments 63 125 250 500 1000 2000 4000 8000
640P-003 Truck Loading Closed Drain Drum Pump
Assumed Centrifugal
n/a 97 97 97 97 97 95 93 91 105 102 E
640P-001A/B Diesel Loading Pumps Assumed Centrifugal
n/a 97 97 97 97 97 95 93 91 105 102 E
640P-002A/B Jet A-1 Loading Pumps Assumed Centrifugal
n/a 97 97 97 97 97 95 93 91 105 102 E
550P-001A/B SR Light Slops Storage Pumps Assumed Centrifugal
n/a 97 97 97 97 97 95 93 91 105 102 E
550P-002A/B Cracked Light Slops Storage Pumps
Assumed Centrifugal
n/a 97 97 97 97 97 95 93 91 105 102 E
550P-003A/B SR Heavy Slops Storage Transfer Pumps
Assumed Centrifugal
n/a 97 97 97 97 97 95 93 91 105 102 E
550P-004A/B Cracked Heavy Slops Storage Transfer Pumps
Assumed Centrifugal
n/a 97 97 97 97 97 95 93 91 105 102 E
550P-005A/B SR Heavy Slops Pump Around Pumps
Assumed Centrifugal
n/a 97 97 97 97 97 95 93 91 105 102 E
550P-006A/B Cracked Heavy Slops Circulation Pumps
Assumed Centrifugal
n/a 97 97 97 97 97 95 93 91 105 102 E
585P-001A/B/C Flushing Oil Pumps Assumed Centrifugal
n/a 98 98 98 98 98 96 94 92 106 103 E
660PK-001ABC Sulphur Granulation Package n/a 117 118 119 120 117 112 104 97 126 122 E

AMEC FOSTER WHEELER REPORT DRP001-FED-RPT-M-000-001 5660-8440-RP-000-004
PAGE 45 OF 45 REV D2 NOISE ASSESSMENT REPORT
DSN: 2668
660PK-002 Sulphur Conveyer Conveyer 285m long approx
117 118 119 120 117 112 104 97 125 121 E
680PK-001 Coke Transfer Conveyer Conveyer 600m long approx
120 121 122 123 120 115 107 100 128 124 E
680PK-003 Coke Loading Conveyer Conveyer 285m long approx
117 118 119 120 117 112 104 97 125 121 E

Appendix C
APPENDICES FOR SECTION 6 – LANDSCAPE & VISUAL

APPENDIX C-1
APPENDIX 6.1: BASELINE LANDSCAPE AND VISUAL REPORT

REPORT NO 70029220-02-C-BASE/VL
LANDSCAPE & VISUAL CONTEXT DUQM REFINERY, OMAN
CONSOLIDATED ENVIRONMENTAL AND SOCIAL IMPACT ASSESSMENT
FOR DRPIC ONLY: CONFIDENTIAL JULY 2017

Confidential Project no: 70029220 Date: July 2017
– WSP 6 Devonshire Square London, EC2M 4YE Tel: +44 (0)20 7337 1700 www.wsp.com
LANDSCAPE & VISUAL CONTEXT
DUQM REFINERY, OMAN
Duqm Refinery & Petrochemical Industries Company

iii
Duqm Refinery Project WSP DRPIC Project No 70029220 Confidential May 2017
TABLE OF CONTENTS 1 INTRODUCTION ...........................................................................2
1.1 INTRODUCTION ................................................................................................ 2
1.1.1 SUMMARY OF PREVIOUS BASELINE WORK .................................. 2
1.2 SCOPE OF REPORT ......................................................................................... 3
1.3 PROJECT OVERVIEW ...................................................................................... 3
1.4 SOURCES OF INFORMATION .......................................................................... 5
2 APPROACH AND METHODOLOGY ...........................................5
2.1 LANDSCAPE...................................................................................................... 6
LANDSCAPE SENSITIVITY ............................................................................................6
2.2 VISUAL AMENITY ............................................................................................. 6
3 LANDSCAPE AND VISUAL BASELINE CONDITIONS ..............7
3.1 LANDSCAPE CHARACTER .............................................................................. 7
3.1.1 LOCAL LANDSCAPE CHARACTER ................................................... 7 LCA1: BEACH AND DUNES ............................................................................................7 LCA2: LOW LYING ALLUVIUM PLAINS .........................................................................8 LCA 3: URBAN LANDSCAPE ..........................................................................................9 LCA 4: LIMESTONE AND SANDSTONE HILLS ..............................................................9 LCA 5: LIMESTONE/DOLOMITE COASTAL CLIFFS ......................................................9
3.2 RAS MARKAZ CRUDE IMPORT AND STORAGE (PROJECT FACILITY) ......................................................................................................... 10
3.2.1 SITE CONTEXT ................................................................................. 10
3.2.2 LANDSCAPE CHARACTER .............................................................. 10 SENSITIVITY ................................................................................................................. 10 3.2.3 VISUAL AMENITY ............................................................................. 11 IDENTIFIED RECEPTORS ............................................................................................ 11
3.3 CRUDE IMPORT PIPELINE (PROJECT FACILITY) ....................................... 11
3.3.1 SITE CONTEXT ................................................................................. 11
3.3.2 LANDSCAPE CHARACTER .............................................................. 11 SENSITIVITY ................................................................................................................. 11 3.3.3 VISUAL AMENITY ............................................................................. 11 IDENTIFIED RECEPTORS ............................................................................................ 12
3.4 DUQM REFINERY (PROJECT FACILITY) ...................................................... 12
SITE CONTEXT ............................................................................................................. 12 3.4.1 LANDSCAPE CHARACTER .............................................................. 12

iv
Duqm Refinery Project WSP DRPIC Project No 70029220 Confidential May 2017
SENSITIVITY ................................................................................................................. 12 3.4.2 VISUAL AMENITY ............................................................................. 12 IDENTIFIED RECEPTORS ............................................................................................ 13
3.5 DUQM EXPORT TERMINAL (PROJECT FACILITY) ...................................... 13
3.5.1 SITE CONTEXT ................................................................................. 13
3.5.2 LANDSCAPE CHARACTER .............................................................. 13 SENSITIVITY ................................................................................................................. 13 3.5.3 VISUAL AMENITY ............................................................................. 13 IDENTIFIED RECEPTORS ............................................................................................ 14
3.6 SUMMARY ....................................................................................................... 14
3.7 REFERENCES ................................................................................................. 14
T A B L E S
TABLE 1.1 REVIEWED DOCUMENTS .............................................................................. 2
TABLE 1.2 DUQM REFINERY PROJECT .......................................................................... 4
F I G U R E S
FIGURE I: VIEW OF BEACH, SPRING 2017 ..................................................................... 8
FIGURE II: VIEW OF ALLUVIUM PLAINS, SPRING 2017 ................................................. 9
FIGURE III: VIEW OF COAST NORTH OF RAS MARKAZ, SPRING 2017 ..................... 10
FIGURE IV: ZONE OF THEORETICAL VISIBILITY ......................................................... 17
FIGURE II: LANDSCAPE CHARACTER AREAS ............................................................. 18
A P P E N D I X
APPENDIX A-1 FIGURES


2
Duqm Refinery Project WSP DRPIC Project No 70029220 Confidential May 2017
1 INTRODUCTION
1.1 INTRODUCTION
This report provides a description and evaluation of the existing landscape resource and the visual receptors within the vicinity of the Duqm Refinery Project (the “Project”). It includes a review of relevant documents, desk-based and field survey observations to assess baseline landscape character and views.
‘Landscape is an area, as perceived by people, whose character is the result of the action and interaction of natural and/or human factors.’ (Council of Europe, 2000).
In terms of the above definition, this may include areas of special value as well as everyday landscapes. The landscape in the area of the Project has been described as ‘inherently Omani’ (Jurong Consultants EIA, 2011), comprising arid gravel plains, contained to the west by the Huqf escarpment and to the east by the Arabian Sea and the associated coastal landscape of dunes and cliffs.
Visual amenity is a separate but related consideration, reflecting the pleasantness of the view or outlook that people have of their surroundings and the overall composition and character of these views. Visual receptors may be residents, visitors or people in their workplace, such as fishermen.
1.1.1 Summary of Previous Baseline Work
Amongst the secondary sources of information used as part of the landscape work, the following reports were reviewed in preparation of this Report.
Table 1.1: Reviewed documents
NAME OF REPORT AUTHOR/YEAR RELEVANT INFORMATION
ESIA for the Proposed Duqm Integrated Power and Water Plant (DIPWIP)
ADP Consultant/BEYA Environmental Consultancy, 2016
Some geographical, climate and social context.
EIA for Service Corridor, Duqm – Environmental Baseline Report
HMR Consultants, 2015 Some detailed topographical information.
Duqm Refinery EIA Study Report, Appendix A – Environmental Baseline
HMR Consultants, 2015
Site observations about land use.
EIA for Duqm SWIP HMR Consultants 2015
Description of local Wadi systems.
Comparative study of changes in vegetation since commencement of development.

3
Duqm Refinery Project WSP DRPIC Project No 70029220 Confidential May 2017
NAME OF REPORT AUTHOR/YEAR RELEVANT INFORMATION
Duqm Industrial and Free Zone Masterplan EIA
Jurong Consultants, 2011
Full landscape and visual assessment including classification of Landscape character areas and detailed assessment of landscape and visual baseline and value. Useful in describing typical coastal areas and landscape character including outside of the Special Economic Zone (SEZ) boundary.
Ras Markaz Crude Oil Park Project ESIA
Amec Foster Wheeler, 2015
Includes descriptions of geology, hydrology and ecology of study area, contributing to landscape characterisation.
In summary, information from the geology, ecology and land use sections of these reports contributes to an understanding of the landscape baseline. The communities’ chapters set out a range of potential visual receptors, although there was a lack of consistency, perhaps due to the changeable nature of the local population. The investigations undertaken on socio-economic and health as part of the Consolidated Environmental and Social Impact Assessment (ESIA) work also contributed valuable insights into the character of the area, the potential receptors and observations that contributed to this landscape baseline. The Free Zone Masterplan EIA (Jurong, 2011) includes a full classification of local landscape types which we have adopted to apply to the study area of this Report.
1.2 SCOPE OF REPORT
This Report is part of the Consolidated ESIA scope of work that WSP is undertaking for DRPIC.
The intention of this Report is to set out the baseline conditions for landscape and visual receptors in order to be able to assess changes in the local environment caused by the development of the Project and how this would affect these receptors.
The study area for visual effects extends to the area from which the project could be visible, cut off at a distance of five kilometres (km) from the Project site areas (see below). The Zone of Theoretical Visibility (ZTV) has been established to show the area of land from which there could be a view of any part of the proposed project. The ZTV is shown on Figure 1 in Appendix A. The study area for landscape effects covers the proposed project site and the wider landscape context within which the project may influence landscape character.
The Study Area for both landscape and visual impacts has been cut off at a radius of 5km from each of the project components, in order to focus on potentially significant effects. This reflects the largely flat, undeveloped landscape, lacking substantial vegetation which would interrupt views towards the Project, which would be of a large scale and therefore readily visible. Atmospheric conditions are generally dry, although occasional sea mists may reduce visibility. It is considered that even though the development may be visible from greater distances, it would not constitute a dominant element in the view, and would therefore be unlikely to cause significant landscape and visual effects.
1.3 PROJECT OVERVIEW
The Project comprises the Refinery itself and its Off-site Facilities. The components of the Project are described in Table 1.2 below.

4
Duqm Refinery Project WSP DRPIC Project No 70029220 Confidential May 2017
Table 1.2 Duqm Refinery Project
PROJECT COMPONENT DESCRIPTION
Duqm Refinery
A 230,000 BDP complex refinery on a plot of 9km2 area to the north of
the main industrial area within the Duqm Special Economic Zone. Includes:
Site clearance and levelling (completed in late 2016)
Product pipelines and service lines to the Duqm Export Terminal
Construction accommodation/workers’ camps
Laydown areas.
Off-site Facilities
i. Crude storage facility at the Ras Markaz (RM) Crude Oil Terminal: eight tanks located within, and part of the wider Tank
Farm, approx. 80km from the Refinery. The large-scale Tank Farm (Oman Oil Tank Terminal Company, OTTCO) in its entirety is not part of the Project.
ii. ‘DRPIC Crude Pipeline’: 28-inch diameter 80km crude oil import
pipeline to transport crude oil from RM to Duqm Refinery.
iii. Product ‘Export Terminal’: on the lee breakwater of Port of Duqm,
immediately to the south-east of the Refinery plot. Topside works only, i.e., to establish storage for products and export handling facilities. For marine works, see Associated Facilities below.
Associated Facilities
i. Natural gas spur line/metering station used to supply gas feedstock to DR from the national gas network (Oman Gas Company, OGC);
ii. Export pipeline corridor – Construction of the corridor and infrastructure, i.e., pipe supports, bridges, fencing drainage, etc., including pipeline and services themselves under the Refinery. (Under SEZAD/Marafiq responsibility). Note: SEZAD has overall responsibility for the Pipeline Corridor, excluding the DR pipelines and cables, extending from the Refinery Boundary Marker fenceline to the Port fenceline;
iii. The marine scope including dredging and reclamation and jetty and quay wall construction of the Duqm Export Terminal. (SEZAD);
iv. Haul road or dedicated lane (on Existing Road) for solid product from DR to the Duqm Export Terminal. (SEZAD);
v. Duqm Integrated Power and Water Plant (DIPWP) supplying electricity and desalinated water to DR (and in the future other consumers in the DSEZ. (Marafiq, also known as Central Utilities Company, CUC). Note that this now includes items vi and vii below;
vi. Seawater supply network (to DIPWP). (Marafiq);
vii. Common wastewater outfall for industrial zone users. (SEZAD); and
viii. Offshore oil import facilities (including offshore single point mooring (SPM) and crude oil pipeline to shore at RM. (OTTCO).
The transition from crude oil import (via a Single Point Mooring, (SPM) at Raz Markaz to the export of refined products through the Project facilities follows these key stages: 1. Offload of crude oil from offshore vessel delivery. Crude oil is stored within the crude import and
storage facility at Ras Markaz Tank Farm of which only eight crude oil tanks are part of the Project.

5
Duqm Refinery Project WSP DRPIC Project No 70029220 Confidential May 2017
2. The oil is transferred to the Duqm Refinery through the 80.7km Crude Import Pipeline. The Duqm
Refinery will have a design capacity of 230,000 barrels per day and will produce the following products:
Naphtha;
Liquid Petroleum Gas (LPG);
Jet A-1;
Diesel;
Heavy Sulphur Fuel Oil (intermittently);
Petroleum Coke (Solid); and
Sulphur (Solid).
3. Once the crude oil is refined to the final products then these are marine exported via the Duqm
Export Terminal. The liquid products are sent to the terminal via pipelines within a service corridor and the solid products via ground transport.
1.4 SOURCES OF INFORMATION
In compilation of the landscape work, we have utilised the following sources of information and data.
Satellite imagery (Google Earth);
World Mapping Project Oman Map (Reise Know-How Verlag, Bielefield, 2017);
Site survey photographs by WSP team visiting March 2017; and
Previous EIA reports for this and related projects (See References).
2 APPROACH AND METHODOLOGY
This methodology for the landscape and visual baseline appraisal is generally in accordance with guidance described in the ‘the Guidelines for Landscape and Visual Assessment’ (GLVIA) published by the Landscape Institute (LI) and the Institute of Environmental Management and Assessment (IEMA), 3rd edition (2013).
This report is the result of desk based study of the site conditions supplemented with information on the site and Project area provided by visitors to Duqm, an extensive library of photographs taken during site visits and interviews with specialists (e.g. for baseline survey of air quality, noise and socio-economics) upon their return. The evaluation and assessment of landscape and visual receptors is based on professional judgement of established criteria set out in the methodology below.
The assessment followed the following process.

6
Duqm Refinery Project WSP DRPIC Project No 70029220 Confidential May 2017
2.1 LANDSCAPE
Describing the different elements that make up the landscape in the study area, such as:
Geology;
Topography;
Waterbodies;
Vegetation; and
Human influence and land use.
This information is used to define landscape character types within the study area: geographical areas made up of a distinct combination of elements and aesthetic or perceptual aspects.
LANDSCAPE SENSITIVITY
The assessment of overall landscape sensitivity combines the judgements on the susceptibility of receptors to the proposed development. The capacity of the landscape to accept development is determined by the degree to which it is able to accommodate change (due to a specific development or land use change) without adverse effects on its character. Sensitivity will vary according to its physical aspects, landscape character/aesthetic aspects, landscape value (e.g. consensus via designations), landscape quality/conditions and cultural/natural heritage factors, including the value of the existing landscape and the extent and nature of the development proposed.
2.2 VISUAL AMENITY
Evaluating visual amenity (as defined in the Introduction) involves determining the extent of visibility of the proposals, followed by identification of visual receptors and their sensitivity to changes in their surroundings.
The Zone of Theoretical Visibility (ZTV) helps to establish the geographical extents of the study area. It was determined by digital modelling using specialist GIS software to analyse a Digital Terrain Model (DTM). The height of viewer is assumed to be 1.8m and the maximum height of the proposed development, based on the information available, is included in the model to assess its potential visibility. The ZTV is approximate only as vegetation and buildings may provide local screening. The output of this process is illustrated using a map of the area (Figure 1).
Visual receptors, such as users of buildings, recreational spaces, footpaths and transport routes, have differing sensitivities to their visual environment. Generally, this is dependent upon their interest in the visual environment, their viewing opportunity and duration, and the context of the views. These factors may be expressed in terms of:
The value of the view/viewpoint;
The importance of the viewpoint; and
The nature of the viewer.
The nature of visual receptors likely to be impacted is categorised on a three point scale ranging between high, medium and low, with residents and those engaged in recreational activities which involve appreciation of the landscape defined as high sensitivity and road users and people in their workplace as low sensitivity. The sensitivity of the receptor is also dependent on the existing perceived quality of the landscape due to the presence of existing intrusive features.

7
Duqm Refinery Project WSP DRPIC Project No 70029220 Confidential May 2017
Visual receptors have been identified based on existing mapping and previous reports on social impacts. Settlements in and around Duqm have been static for some time and the nature of the SEZ does not allow for new temporary settlements.
3 LANDSCAPE AND VISUAL BASELINE CONDITIONS
3.1 LANDSCAPE CHARACTER
3.1.1 Local Landscape Character
The landscape character is typical of mature marine fringe environments in the Al Wusta region, which is generally characterised by an open coastline backed by sand and alluvium plains and hills. The climate is arid to hyper arid with temperatures from 21-36 ̊C. There is typically very low precipitation and high temperatures.
The following local landscape character area descriptions LCA1-4 were set out in the Duqm Industrial and Free Zone EIA Report.
Landscape Character Areas were determined that have the following distinct characteristics:
LCA1: BEACH AND DUNES
The Duqm coastal frontage is described as a low-relief crenulated bay, which has a classic fish-hook shape with the shank pointing to the north-east. The frontage has a well-developed beach enriched with offshore derived carbonate sediments, giving it a light colour. The coastal zone can be subdivided into three sub-categories: beach and back beach, khawrs and intertidal mudflats. Litter, some of which undoubtedly originates offshore, is ubiquitous along the whole length of the coast.
LCA1 is defined by land on one side and by open sea on the other side and the result is a distinct sense of space and openness. The dune ridge creates a limited sense of enclosure or containment. The landscape is characterized predominantly by the horizontality and muted hues of the coastal waters, which – according to the Industrial and Free Zone Masterplan EIA – may also include marine activities such as anchorage, and commercial shipping lanes. The development of the Duqm Port and Dry Dock has interrupted the naturalness of the landscape area. The result is a largely open, tranquil and natural landscape which is punctuated by the colours and noises of human features and activities. It has been assessed as of high quality, due to its integrity, high importance as it contributes to the unique identity of Oman, but of low rarity and therefore of only local importance.

8
Duqm Refinery Project WSP DRPIC Project No 70029220 Confidential May 2017
Figure 3-1i: View of beach east of Duqm Refinery plot, Spring 2017
LCA2: LOW LYING ALLUVIUM PLAINS
The majority of the site comprises low lying alluvium plains that are naturally fragmented by low rocky outcrops, gravel hills, areas of sabkha and wadi courses. The wadi channels provide diversity to the landscape and topography and also provide pockets of more dense vegetation across the plain, which is generally sparsely vegetated. This LCA has already been subjected to some modification through the creation of the main highway that runs north to south through the site (R32), graded tracks, ad-hoc off-road driving, sand-mining and the development of materials sorting areas as well as other infrastructure/projects (e.g. Sebacic acid manufacturing plant) being developed by SEZAD and other proponents (e.g. Rural Area Electricity Company, RAECO).
The LCA is defined by the coast to the east and limestone and sandstone hills that enclose the area. The LCA is expansive and provides a real sense of space, openness and wildness. This sense of openness and exposure is interrupted by Duqm Town, or Wadi Saay, (LCA3) and also construction works that occur in the area to support the development of the Port and Dry Dock, SEZAD infrastructure projects and other developments underway in the SEZ. It is considered of high quality and high importance (contributing to the unique identity of Oman), but low rarity and thus of only local importance overall.

9
Duqm Refinery Project WSP DRPIC Project No 70029220 Confidential May 2017
Figure 3-2: View of Alluvium Plains, Spring 2017
LCA 3: URBAN LANDSCAPE
This LCA is located within the low-lying alluvium plain to the south-east of the IDZ. This landscape is almost exclusively defined by low lying commercial and residential development which is connected by a main highway (R32) and minor arterial access roads. Streets are mainly residual spaces, with little or no vegetation other than wadi areas that flank the town to the west. Development is widely spaced, which provides an incoherent open development type with very little connectivity between areas of development. It is assessed of low quality, importance and rarity.
LCA 4: LIMESTONE AND SANDSTONE HILLS
The alluvium plains of the IDZ are enclosed by hills. These are large-scale upland and hillside landscapes lying between around 50 m and 190 m above mean sea level, backed by the Huqf escarpment, which abut (wholly or in part) the coast to the north and south of the IDZ. Consisting of ridges and ravines, and incised by wadis the hills generally consist of exposed rock with pockets of scrub and seasonal grassland. Due to their complex and often steep topography, infrequent but large fluvial flows and distance from the coast in some areas, this landscape does not contain human features (other than footpaths or small access roads). LCA4 possesses a distinct remote and exposed character and may offer striking views along the surrounding coast and sea. It is assessed as of high importance, high value (when part of the Arabian Oryx Sanctuary) and of regional importance.
In addition it has been necessary to include a further Character Area:
LCA 5: LIMESTONE/DOLOMITE COASTAL CLIFFS
The whole of the rocky coast between Shuwayr and Madrakah is bordered by black and white cliffs of 80m average height rising to 200m in places. They are of a depositional formation with layers of Oligo-Miocene limestone inter-bedded with dolomite and containing fragments of coral and other marine debris. They are edged by sandy beaches interspersed with a rocky shore line. There are typically heaps of eroded material forming dunes at the cliff base, particularly where wadis have cut through the softer rock. These cliffs make the foreshore inaccessible for much of their length. However, fishermen use those bays which have road

10
Duqm Refinery Project WSP DRPIC Project No 70029220 Confidential May 2017
connections. The cliffs and surf on the rocky shore present a sometimes harsh but dramatic character, with views enclosed by the attractive geological diversity of the cliff face on one side and open to the ocean on the other.
The cliffs are assessed to be of high quality, high importance and moderate rarity, and should be considered to be of regional importance.
Figure 3-2: View of Coast north of Ras Markaz, Spring 2017
3.2 RAS MARKAZ CRUDE IMPORT AND STORAGE (PROJECT FACILITY)
3.2.1 SITE CONTEXT
Eight tanks in this new facility will be part of the Project. The Crude Import and Storage Facility Site is located approximately 50km south of Duqm Town, on the coastal cliffs of Ras Markaz, at an elevation between 100-160m above sea level, set back approximately 1.7km from the shoreline. The beach area below will also be used for the landing siting of the proposed offshore single point mooring, subsea pipeline and related infrastructure being developed outside of the Project, as Associated Facilities. The area is currently largely undeveloped, with a natural coastal character and very limited settlement. Human activity is largely limited to fishing from the beach at Ras Markaz, approximately 2.5km north of the shore facilities (part of the AF). Detractors from the perceived natural character include highway 32 and litter from fishing activities.
3.2.2 LANDSCAPE CHARACTER
The Ras Markaz Site lies within both LCA2: Low lying Alluvium Plains and LCA5: Limestone/Dolomite Coastal Cliffs.
SENSITIVITY
The sensitivity (to the proposed crude import and storage facility) of the landscape is considered to be high due to its currently largely undeveloped state and regional importance, and the scale and industrial nature of the proposed facility.

11
Duqm Refinery Project WSP DRPIC Project No 70029220 Confidential May 2017
3.2.3 VISUAL AMENITY
The study area is generally considered to be of a high scenic quality, with the conjunction of the sea and the arid, generally natural, landscape forming a distinctive attractive coastal character. There is potential for recreational activity on the shore and in the water although no support services for this exist..The ZTV indicates that the facility would be largely visible within a 1-2 km radius and this reduces to intermittent visibility with distance, particularly in areas further inland and to the south. It is assumed that there would be some visibility from the sea.
IDENTIFIED RECEPTORS
Desk based study and local knowledge indicates the following visual receptors:
People that seasonally inhabit the few local individual temporary residences; and
Fishermen on the beach and at sea.
There are no settlements apparent in the Study Area however there are some indications of individual buildings and there is a fishing landing site (Ras Markaz) 2.5 km to the north.
3.3 CRUDE IMPORT PIPELINE (PROJECT FACILITY)
3.3.1 SITE CONTEXT
The Pipeline ROW Site runs between the Ras Markaz Crude Oil Storage Terminal and the Refinery near Duqm. The corridor will include maintenance roads and the trench/windrow of the pipeline itself, covering a distance of 80.7km. The area is currently largely undeveloped, with a natural coastal character and scattered settlements. Detractors from the perceived natural character include the R 32 and N 37 and new built development including the Duqm Jaaluni International Airport and other infrastructure and development by SEZAD.
3.3.2 LANDSCAPE CHARACTER
The local landscape character area descriptions covering this area have been set out in section 3.1.above, and illustrated in Figure 2 Landscape Character.
The Crude Import Pipeline is a linear feature passing through LCA2: Low lying Alluvium Plains.
It will cross numerous wadis which intersect the plains. The study area is devoid of any wadis with perennial flow of fresh water. Water flows only for few hours after a heavy rain. These features support a more diverse flora and fauna than elsewhere in the region however, as sea fog supplements the water requirements of the vegetation. The main wadis in the study area are Wadi Jurf, Wadi Say, Wadi Dhanjart and Wadi Dhahr.
SENSITIVITY
LCA2 is considered to be of low sensitivity to this type of development. The pipeline will be buried in its operational period and access roads will be similar to existing features.
3.3.3 VISUAL AMENITY
The study area is generally considered to be of a high scenic quality, with the conjunction of the sea and the arid, generally natural, landscape forming a distinctive attractive coastal character. Industrial and residential development detracts from this visual amenity.

12
Duqm Refinery Project WSP DRPIC Project No 70029220 Confidential May 2017
IDENTIFIED RECEPTORS
Desk based study and local knowledge indicates the following visual receptors:
People that inhabit local settlements and individual residences;
People in transit on the highway; and
Settlements in the Pipeline study area such as As Sadanat (west of the airport in Duqm) and Qasadat (on the main Duqm to Madrakah, before the turning to Ras Markaz). Note, the Socio-economic and health baseline report (DRPIC Report No. 05-C-Base/Soc) contains more information on settlements in the area.
3.4 DUQM REFINERY (PROJECT FACILITY)
SITE CONTEXT
The Refinery Site plot has been cleared and levelled and the immediate surrounding area is currently largely undeveloped, with a natural coastal character, minimally influenced by agricultural land use including small-scale grazing and raising of crops. Detractors from the perceived natural character include the Duqm Port development to the south-east, the small existing power station (and plot for a new Integrated Power and Water plant), Sebacic Acid plant and highway routes 8, 16 and 32. Additionally, a common utilities corridor is routed to the north of the Refinery Site to the now-engineered Dangert Channel, which discharges to the sea approximately 2.5km to the east. The near flat topography provides extensive views inland to the mountains and out to sea.
The Site lies at low elevation within the drainage basin of the surrounding landscape where it meets the Arabian Sea, which ranges from 180m elevation to sea level. The site topography is undulating, varying between -0.3m and 17.8m above mean sea level.
It is understood that vegetation clearing in the developmental zone for the construction of road networks has been underway including considerable earth moving and ground work, in addition to quarrying and other ongoing port and construction-related excavation and dumping.
3.4.1 LANDSCAPE CHARACTER
The local landscape character area descriptions covering this area have been set out in section 3.1 above, and illustrated in Figure 2 Landscape Character.
The Refinery Facility Site lies within LCA: 2 Low lying Alluvium Plains and immediately adjacent to LCA1: Beach and Dunes.
SENSITIVITY
These areas are considered to be of medium sensitivity to this type of development due to their local importance and the existing intrusive development in this area.
3.4.2 VISUAL AMENITY
The study area is generally considered to be of a high scenic quality, with the conjunction of the sea and the arid, generally natural, landscape forming a distinctive attractive coastal character. This is a relatively well represented Omani landscape type. Recent industrial development detracts from this visual amenity.
The ZTV indicates that the Refinery would be widely visible within the study area and beyond the 5km study area boundary. This reflects the maximum stack height of 73m used in generating the ZTV,

13
Duqm Refinery Project WSP DRPIC Project No 70029220 Confidential May 2017
whereas the majority of the built form would be considerably lower in height and likely to be less extensively visible. It is assumed that this facility would be extensively visible from the sea.
IDENTIFIED RECEPTORS
Desk based study and local knowledge indicates the following visual receptors:
People that inhabit local settlements and individual residences;
People in transit on the highway;
Duqm Port and Dry Dock staff and visitors; and
Fishermen utilising beaches along the coast to the south and at sea.
Settlements in the Refinery Study Area include Duqm Town/Wadi Say. There is an existing fishing beach to the south east of the Site, Antout. The temporary facilities here are proposed to be relocated by SEZAD to a new fisheries harbour under construction.
3.5 DUQM EXPORT TERMINAL (PROJECT FACILITY)
3.5.1 SITE CONTEXT
The immediate Site area is currently largely undeveloped, with the exception of an existing breakwater, although it is adjacent to the large-scale development at Duqm Port, 3km to the south east. It has a changeable coastal character, including the area of sabkha where the Wadi Saay meets the sea. Detractors from the perceived natural character include the Duqm Port development and the existing power plant 4km to the northwest. There is very little interruption to views out to sea, which includes views of small-scale fishing activity as well as vessel movements into and out of the port and dry dock. Birdlife is prevalent in this location and the colonies of seabirds on the beach and in the air feature in many views.
The Site lies at low elevation within the drainage basin of the surrounding landscape where it meets the Arabian Sea, which ranges from 180m elevation down to sea level.
3.5.2 LANDSCAPE CHARACTER
The local landscape character area descriptions covering this area have been set out in section 3.1 above, and illustrated in Figure 2 Landscape Character.
The Export Terminal Project Facility Site lies within LCA1: Beach and Dunes and extends out to sea by approximately 4.5km, approaching the existing Commercial Quay. Pipelines and access roads to the Terminalwould fall within LCA2: Low lying Alluvium Plains.
SENSITIVITY
These areas are considered to be of medium sensitivity to this type of development due to their local importance, low lying open character and biodiversity value, tempered by the existing infrastructure in this area.
3.5.3 VISUAL AMENITY
The study area is generally considered to be of a high scenic quality, dominated by the seascape and distinctive, natural coastal character. However, industrial development and activity is already intruding on the extensive existing views, reducing the expected sensitivity of potential receptors.

14
Duqm Refinery Project WSP DRPIC Project No 70029220 Confidential May 2017
The ZTV indicates that the Terminal will be widely visible within the study area, particularly on the low ground of the sabkha, and also beyond the 5km boundary. As the facility extends into coastal waters it is assumed that it will be widely visible from the sea as well. The majority of the terminal structures would be of low height, for example the tanks would be 24m (Worley Parsons, 2016), but any mast lighting would be visible in this area.
IDENTIFIED RECEPTORS
Desk based study and local knowledge indicates the following visual receptors:
People that inhabit local settlements and individual temporary living areas (e.g. in containers);
People in transit on the highway;
Duqm Port and Dry Dock staff and visitors; and
Fishermen at sea.
Settlements in the Terminal study area include Wadi Say/Duqm Town. The Renaissance Workcamp are located approximately 8km to the south west. There is also the previously mentioned fishing beach approximately 2.5km to the north.
3.6 SUMMARY
The landscape is typical and well represented throughout the Al Wusta region, with an open, wild, arid character. The coastal area is particularly scenic due to the intersection of land and sea which provides increased geological and ecological diversity and extensive views. There are no formal landscape designations applicable to this area, although the coast is protected by any development being set inland from its immediate edge. The area currently supports a limited population in scattered small settlements. The area has been marked and zoned for development by the Government, which will increase the population and introduce an increasingly industrial and urban character to the landscape, of which the Project will form a part.
3.7 REFERENCES
BEYA for Environmental Consultancy and ADP Consultant FZE (2015), Environmental and Social Impact Assessment Study Report for the Duqm Integrated Power and Water Project (Marafiq). BEYA, Muscat, Oman. Five Oceans LLC (2011, June), Duqm Industrial and Free Zone Masterplan – Environmental Impact Assessment (EIA). Final EIA Report Rev 02 for Jurong Consultants Pte Ltd (Oman branch), Muscat, Oman. HMR Consultants and Amex Foster Wheeler (2015, Oct.), Environmental and Social Impact Assessment for Ras Markaz Crude Oil Park. Report for Oman Tank Terminal Company LLC (OTTCO). Document No.: 1-14-5440/9(4132 ESIA). HMR, Muscat, Oman. HMR Consultants (2015, Aug.), Environmental Impact Assessment (EIA) for Service Corridor, Duqm. HMR #4054. Report for SEZAD. HMR Consultants (2015, 28 July), Environmental Impact Assessment (EIA) Report for Duqm Sea Water for Industrial Zone projects (SWIP). Report for Parsons International & Co. LLC for SEZAD. HMR, Muscat, Oman.

15
Duqm Refinery Project WSP DRPIC Project No 70029220 Confidential May 2017
HMR Consultants (2014, Dec.), Appendix A – Environmental Baseline. In Duqm Refinery Environmental Impact Assessment (EIA) Study Report. DRPIC Document No.: DRP001-EIA-RPT-Z-000-001. HMR Document No.: 3514-EIA-01. HMR, Muscat, Oman. Landscape Institute (LI) and the Institute of Environmental Management and Assessment (IEMA), (2013), ‘The Guidelines for Landscape and Visual Assessment’ (GLVIA) 3rd edition. Worley Parsons (2016, June), Equipment list for Duqm Liquid Bulk berths Project. DRPIC Report No. SEZAD-DPTC-21-WP-PR-LST-3001-B3_AFU for Duqm Terminal.

16
Duqm Refinery Project WSP DRPIC Project No 70029220 Confidential May 2017
APPENDIX A-1
FIGURES

17
Duqm Refinery Project WSP DRPIC Project No 70029220 Confidential May 2017
Figure ii: Zone of Theoretical Visibility

18
Duqm Refinery Project WSP DRPIC Project No 70029220 Confidential May 2017
Figure iii: Landscape Character Areas

Appendix D
APPENDICES FOR SECTION 7 - BIODIVERSITY

APPENDIX D-1
APPENDIX 7.1: TERRESTRIAL ECOLOGY SURVEY RECORD

SURVEY
POINT LOCATION NORTHING EASTING
HABITAT
DESCRIPTION PLANTS NOTES OTHER NOTES
Start of pipeline route from Ras Markaz storage area heading north
PL 0 Pipeline exits storage area
19.172059 57.749412 Rocky plateau above sea cliffs
Blepharis ciliaris, Pulicaria omanensis
Group of 6 donkeys
PL 1 Pipeline markers found
19.176830 57.745228 Rocky plateau above sea cliffs
Blepharis ciliaris, Pulicaria omanensis
PL 2 Scarp edge 19.184412 57.734829 Scarp edge, rocky
Tetraena qatarensis
PL 3 19.194498 57.722103 Sandy-gravel plain
Blepharis ciliaris, Pulicaria omanensis
–in runnels
PL 4 19.208212 57.715919 Broad wadi, outflow area
Acacia sp. Likely A.tortilis, Blepharis ciliaris, Tephrosia apollinea
Donkey & Camel droppings, small carnivore partial skull (Viverrid or Mustelid?)
PL 5 19.231171 57.671139 Sandy plain, lightly wooded
Acacia tortilis, Blepharis ciliaris, Poaceae sp, Rhazya stricta
PL 6 19.246351 57.656273 Sandy-gravel plain
Blepharis ciliaris
PL 7 In village 19.263441 57.633442 Urban
PL 8 19.277147 57.616642 Sandy-gravel plain
Scattered Acacia tortilis, Blepharis ciliaris, Pulicaria omanensis, Convolvulus sp.
Pipeline route & Duqm Special Economic Zone concrete marker pillar photos 54-55
PL 9 19.295979 57.608273 Sandy-gravel plain
Pulicaria omanensis Acacia tortilis, Dried stem - Blepharis ciliaris?
Paired Line marker photo 60.
PL 10 19.315599 57.598553 Borrow pits photo 63
PL 11 19.358812 57.591915 Sandy-gravel plain
Blepharis ciliaris, Pulicaria omanensis, Rhazya stricta, Euphorb?, Tephrosia apollinea
PL 12 19.379986 57.590813 In Acacia tortilis woodlands
PL 13 19.424900 57.588345 Sandy-gravel plain
scattered Acacia tortilis, Pulicaria omanensis, little else
PL 14 After crossing to W of main road
19.424714 57.581136 Sandy-gravel plain
Unvegetated
PL 15 Flash flood pan 19.456619 57.579941 Sandy-gravel plain
Many tiny seedlings, Pulicaria omanensis, Cyperus sp, Tetraena qatarensis, Schweinfurthia sp., Helianthemum sp.
PL 16 End day's work at Hayma road crossing
19.477003 57.573147
Damaged habitat through road construction
Continuation of Pipeline route heading north down scarp and across wadi and plains area to north
PL 17 start at Hayma 19.479069 57.574692 Damaged

SURVEY
POINT LOCATION NORTHING EASTING
HABITAT
DESCRIPTION PLANTS NOTES OTHER NOTES
road crossing habitat through road construction
PL 18 Edge of scarp beside house & compound
19.486675 57.570545 Sandy-gravel plain
No vegetation scarp is major habitat boundary
PL 19 Below scarp in major wadi system
19.488495 57.563995 Vegetated wadi, extensive system
Convolvulus sp., Pulicaria omanensis, Rhazya stricta, Poaceae sp., Acacia tortilis,
"euphorb"
Very wide braided wadi system verging on sandy gravelplain
PL 20 19.492279 57.567898 Vegetated wadi, extensive system
Convolvulus sp., Pulicaria omanensis, Poaceae sp., Acacia tortilis, "euphorb" sp.
PL 21 19.496716 57.568428
Wadi edge, against piedmont foothills of scarp
Convolvulus sp, Pulicaria omanensis, Poaceae sp., Acacia tortilis, "euphorb" sp. Fagonia sp.
Wadi edge, site footprint will determine impact on wadi, settlement nearby
PL 22 19.499197 57.566013 Wooded sandy gravel plain
Acacia tortilis, Rhazya stricta, Pulicaria omanensis, Nanorrhops ritchieana
PL 23 19.509232 57.572632 Wooded sandy gravel plain
Blepharis ciliaris (desiccated), Acacia tortilis, Convolvulus sp., Heliotropium kotschyi, Rhazya stricta, Pulicaria omanensis
PL 24 19.522366 57.560303 Wooded sandy gravel plain
Pulicaria omanensis, Acacia tortilis, Dried stem - Blepharis ciliaris ?
PL 25 19.549030 57.570415 Rocky hills, scarp base
Acacia tortilis, Poaceae sp., Limonium sp.
PL 26 19.556787 57.566040 Wadi in Sandy-gravel plain
Acacia tortilis, Pluchea dioscoridis, Salvadora persica, Echiochilon jugatum
Gazelle midden 3 photos, very fresh dung
PL 27 19.571968 57.567287
Sandy-gravel plain, many small wadis/runnels
Pulicaria omanensis, Acacia tortilis, Dried stem - Blepharis ciliaris?, Limonium sp
Pristurus carteri gecko
PL 28 Large wadi, small cliffs
19.575554 57.562035 Wadi crossing Acacia tortilis prominent (large trees)
PL 29 19.588905 57.570449 Sandy-gravel plain, beside small wadi
Acacia tortilis, Pulicaria omanensis , lichens on small rocks at surface

SURVEY
POINT LOCATION NORTHING EASTING
HABITAT
DESCRIPTION PLANTS NOTES OTHER NOTES
PL 30
Point at which overlapping with 5OES (2011) survey to north
19.612886 57.570431 Sandy-gravel plain
Dried stem - Blepharis ciliaris?, Pulicaria omanensis Acacia tortilis
Following line of the between N breakwater land end and Refinery area
R 1
IBA area over-view, from end of Route no. 1 road where adjoins landward end of the port northern breakwater.
19.677883 57.675755 Sabkha, wet & dry
Unvegetated apart from marine algae.
S of northern port breakwater (the Lee Breakwater), significant area of tidally inundated sabkha/mudflats occurs, channel along N edge road bund, some 300 odd-birds present, including Reef Heron (white phase), 6 Greater Flamingo, numbers of small waders from small & larger plovers to larger Whimbrel. Numerous Grey (& Purple?) Heron seen on 25th on N side of this road bund. Evident that along the initial (port end) of Port Road Number 5 acting as a dam to water movement, so water trapped that side cannot drain to sea but evaporating creating salf flats area. The area trapped between the two parallel road bunds however, still wet and seemingly connected with the larger port area wetland within IBA.
R 2 Wetland overview
19.659540 57.671135 Mudflats, linked to the sea
Unvegetated apart from marine algae.
R 3 19.665401 57.644207 Mudflats, linked to the sea
Unvegetated apart
R 4 Junction of roads
19.687019 57.655815
Modified habitat across sabkha due to roads construction.
Unable to stop and study due to construction traffic
R 5 Refinery fence 19.718637 57.642082 Sandy-gravel plain
Sparse Tetraena qatarensis, Pulicaria omanensis
Port Road 5 crosses Sandy-Gravel Plain area W of main road, as well as some vegetated & unvegetated sabkha areas.
Start of Pipeline route from Refinery heading west
PL 31 Refinery cleared area, fenced
19.715330 57.640949 Modified cleared area & road
Sparse Tetraena qatarensis, Pulicaria omanensis, Heliotropium sp., Salsola rubescens
Pipeline enters Refinery area to E
PL 32 W of main road 19.714930 57.629303 Sandy-Gravel plain
Tetraena qatarensis, Limonium sp., Acacia ehrenbergiana
stuck in sand W of main road
Tamarix sp., Tavernieria sp.
Became bogged in sand, no further observations. Spiny-tailed lizard dropping found here.

APPENDIX D-2
APPENDIX 7.2: HARMONIZED HABITAT MAPPING

Project Title WSP Client Name Project No 70029220141-00000-00 Confidential Month Year
TECHNICAL APPENDIX: HARMONISED HABITAT MAPPING
1. METHOD
A pre-fieldwork biodiversity workshop was held on 24 April 2017 involving representatives from WSP and 5OES. It was determined that the most appropriate method for creating a habitat map covering the wider Duqm area was to integrate the mapping produced for the Duqm Industrial Development Zone (IDZ) EIA (5OES, 2011) and Port of Duqm EBS (5OES, 2015) with the mapping generated by the 2017 field visit (Figure B-1). To that end the harmonised habitat mapping for the Duqm Refinery Project and Associated Facilities (AF) was conducted in a phased approach that is outlined below.
1. Preliminary habitat mapping of the Project footprint
Preliminary habitat polygons were delineated following a review of Google Earth 2015 satellite imagery. Habitat units were principally based on the Brown and Boër’s interpretation manual of the major terrestrial natural and semi-natural types of Abu Dhabi emirate (2004). Where appropriate, the nomenclature has been modified to reflect the local environmental conditions (see Appendix 1). A 250 m buffer zone was mapped either side of the Project footpring to account for the potential impact of Project construction works and DRPIC Crude Pipeline maintenance.
2. Rapid drive-over/walk-over of the Project footprint
A rapid ground-truthing exercise (24-26th April 2017) was conducted by Dr Chris Hillman (5OES) and Mr Richard Gowing (WSP) in order to refine the preliminary mapping and gather further information about the fauna and flora present in the Project area. Each of the Project components were visited as far as safe access was possible (e.g. the Refinery site was fenced off but could be observed from the fenceline). For the import DRPIC Crude Pipeline, as far as possible the team attempted to follow the DRPIC Crude Pipeline route and noted changes in habitat as they progressed. However, greater emphasis was placed on collecting information at pre-determined survey locations, including DRPIC Crude Pipeline turning points. In the event that an unplanned point was surveyed, its location was recorded using a handheld GPS device. The ground truthing survey did not include the location where AF’s are being constructed, habitat information presented in the EIA’s corresponding to each AF is relied upon. The terrestrial habitat around the breakwater at Duqm Port was similarly excluded as all terrestrial environments at this location have already been developed by third parties and no natural terrestrial vegetation remains.
A brief walkover was conducted at each survey point in order to document the presence of wildlife (including direct observations, tracks, signs and calls) and flora in the area. The flora component focused on recording the dominant species and those of conservation interest including woodland areas (woodland in the context of the Duqm environment is defined as scattered assemblages of woody shrubs/small trees such as Prosopis cineraria and Acacia tortilis). In addition, photos were taken in the direction of the four cardinal compass points at each survey point. The survey field notes are presented in Appendix 2.
3. Revision of preliminary habitat mapping and integration with existing mapping
Following the completion of the fieldwork the preliminary habitat map was updated through the integration of ground observations and imagery (Google Earth 2015 and 2017 Sentinel map medium resolution satellite imagery) to reflect current environmental conditions. Thereafter, the habitat mapping conducted by 5OES in 2010 for the Duqm IDZ masterplan EIA (5OES, 2011) and in 2015 for the Port of Duqm winter Ecological Baseline Survey (EBS) (5OES 2015) was revised

Project Title WSP Client Name Project No 70029220141-00000-00 Confidential Month Year
so that the nomenclature of the habitat units is consistent with those used in 2017. It should be noted that the 5OES 2015 map represents an expansion and revision of earlier mapping produced by another organisation.

Project Title WSP Client Name Project No 70029220141-00000-00 Confidential Month Year
Figure B-1: Areas mapped by 5OES in 2011, 2015 and 2017

Project Title WSP DRPIC Project No 70029220141-00000-00 Confidential Month Year
4. Delineation of natural, modified and critical habitats
The following paragraphs have been extracted from Guidance Note 6: Biodiversity Conservation and Sustainable Management of Living Natural Resources (IFC 2012):
Modified, natural and critical habitat refers to the biodiversity value of the area as determined by species, ecosystems and ecological processes. In practice, natural and modified habitats exist on a continuum that ranges from largely untouched, pristine natural habitats to intensively managed modified habitats. In reality, project sites will often be located among a mosaic of habitats with varying levels of anthropogenic and/or natural disturbance. Clients (i.e. project proponents) are responsible for delineating the Project site as best as possible in terms of modified and natural habitat. This determination is made based on the level of human-induced disturbance (e.g. presence of invasive species, level of pollution, extent of habitat fragmentation, viability of existing naturally-occurring species assemblages, resemblance of existing ecosystem functionality and structure to historical conditions, degree of other types of habitat degradation, etc.) and the biodiversity values of the site (e.g. threatened species and ecosystems, culturally important biodiversity features, ecological processes necessary for maintaining nearby critical habitats). When delineating modified and natural habitats, clients should not focus on the Project site in isolation. The level of anthropogenic impact should be determined with respect to the greater landscape/seascape in which the project is located. In other words, is the project site (or parts of it) located in a disturbed area amidst an otherwise intact landscape? Is the project site (or parts of it) an island of natural habitat within a heavily disturbed or managed landscape? Is the project site located near areas of high biodiversity value (e.g. wildlife refuges, corridors or protected areas)? Or, is the project site located in a mosaic of modified and natural habitats that contain various degrees of biodiversity values of importance to conservation? The client should be prepared to define its project site in these terms as part of the risks and impacts identification process.
Both natural and modified habitats may contain high biodiversity values, thereby qualifying as critical habitat. IFC PS 6 does not limit its definition of critical habitat to critical natural habitat. An area may just as well be critical modified habitat. The extent of human-induced modification of the habitat is therefore not necessarily an indicator of its biodiversity value or the presence of critical habitat.
Critical habitats are areas with high biodiversity value, including:
i. Habitat of significant importance to Critically Endangered and/or Endangered1
species;
ii. Habitat of significant importance to endemic and/or restricted-range species;
iii. Habitat supporting globally significant concentrations of migratory species and/or congregatory species;
iv. Highly threatened and/or unique ecosystems; and/or
1 As listed on the International Union for the Conservation of Nature (IUCN) Red List of Threatened
Species. The determination of critical habitat based on other listings is as follows: (i) If the species is listed nationally / regionally as critically endangered or endangered, in countries that have adhered to IUCN guidance, the critical habitat determination will be made on a project by project basis in consultation with competent professionals; and (ii) in instances where nationally or regionally listed species’ categorizations do not correspond well to those of the IUCN (e.g., some countries more generally list species as “protected” or “restricted”), an assessment will be conducted to determine the rationale and purpose of the listing. In this case, the critical habitat determination will be based on such an assessment.

Project Title WSP DRPIC Project No 70029220141-00000-00 Confidential Month Year
v. Areas associated with key evolutionary processes.
The determination of critical habitat however is not necessarily limited to these criteria. Other recognized high biodiversity values might also support a critical habitat designation, and the appropriateness of this decision would be evaluated on a case-by-case basis.
In general, internationally and/or nationally recognized areas of high biodiversity value will likely qualify as critical habitat; examples include the following:
Areas that meet the criteria of the IUCN’s Protected Area Management Categories Ia, Ib and II, although areas that meet criteria for Management Categories III-VI may also qualify depending on the biodiversity values inherent to those sites.
Majority of Key Biodiversity Areas (KBAs), which encompass inter alia Ramsar Sites, Important Bird Areas (IBA), Important Plant Areas (IPA) and Alliance for Zero Extinction Sites (AZE).
IFC PS6 requires areas of critical habitat to be further defined as Tier 1 or Tier 2 critical habitat according to criteria listed in Table B-1. Tier 1 and Tier 2 habitats are not mapped as part of the harmonised habitat mapping exercise as for each different species, these differ). A full discussion of which Tier 1 and Tier 2 habitats occur in the Project area is provided in Technical Appendix C: Critical Habitat Assessment.
The following abbreviations are used in Table B-1, relating to the IUCN red data book categories: Critically Endangered (CR); Endangered (EN), Vulnerable (VI) and Near Threatened (NT).
Table B-1: Quantitative thresholds for Tiers 1 and 2 of Critical Habitat Criteria 1 through 3
CRITERIA TIER 1 TIER 2
1.Critically endangered (CR)/ Endangered (EN) Species
(a) Habitat required to sustain ≥ 10 percent of the global population of a CR or EN species/subspecies where there are known, regular occurrences of the species and where that habitat could be considered a discrete management unit for that species. (b) Habitat with known, regular occurrences of Critically Endangered (CR) or Endangered (EN) species where that habitat is one of 10 or fewer discrete management sites globally for that species.
(c) Habitat that supports the regular occurrence of a single individual of a CR species and/or habitat containing regionally- important concentrations of a Red-listed EN species where that habitat could be considered a discrete management unit for that species/ subspecies. (d) Habitat of significant importance to CR or EN species that are wide-ranging and/or whose population distribution is not well understood and where the loss of such a habitat could potentially impact the long-term survivability of the species. (e) As appropriate, habitat containing nationally/regionally important concentrations of an EN, CR or equivalent national/regional listing.
2. Endemic/ Restricted Range Species
(a) Habitat known to sustain ≥ 95 percent of the global population of an endemic or restricted-range species where that habitat could be considered a discrete management unit for that species (e.g., a single-site endemic).
(b) Habitat known to sustain ≥ 1 percent but < 95 percent of the global population of an endemic or restricted-range species where that habitat could be considered a discrete management unit for that species, where data are available and/or based on expert judgement
3. Migratory/ Congregatory Species
(a) Habitat known to sustain, on a cyclical or otherwise regular basis, ≥ 95 percent of the global population of a migratory or congregatory species at any point of the species’ lifecycle where that habitat could be considered a discrete management
(b) Habitat known to sustain, on a cyclical or otherwise regular basis, ≥ 1 percent but < 95 percent of the global population of a migratory or congregatory species at any point of the species’ lifecycle and where that habitat could be considered a discrete management unit for that

Project Title WSP DRPIC Project No 70029220141-00000-00 Confidential Month Year
CRITERIA TIER 1 TIER 2
unit for that species.
species, where adequate data are available and/or based on expert judgment. (c) For birds, habitat that meets BirdLife International’s Criterion A4 for congregations and/or Ramsar Criteria 5 or 6 for Identifying Wetlands of International Importance. (d) For species with large but clumped distributions, a provisional threshold is set at ≥5 percent of the global population for both terrestrial and marine species. (e) Source sites that contribute ≥ 1 percent of the global population of recruits.
2. CRITICAL HABITAT ASSESSMENT STEPPED PROCESS
The CHA involves a three-step process:
Step 1 – Stakeholder consultation/initial literature review involving In-field consultation exercises and desktop research;
Step 2 – In-field data collection and verification of available information through engaging qualified specialists to collect field data as necessary both within and outside of the project area/discrete management unit; and
Step 3 – Critical Habitat Determination through the analysis and interpretation of the desktop and field data.
A detailed account of how critical habitat was assessed and has been determined is provided in Technical Appendix C: Critical Habitat Assessment. For the purposes of this Project a single terrestrial (excluding beach and coastal zone habitats) critical habitat has been identified:
Habitat supporting two endemic plant namely Salsola omanensis and Ochradenus harsusiticus. The three species were selected in favour of other endemics on account of having been recorded in the four quarter degree grid squares between 19.0° - 20.0° N and 57.0° - 58.0° E that include or surround the SEZAD area (Patzelt 2014) and been documented during other baseline surveys related to the SEZAD area (e.g. 5OES 2011 and 5OES 2015). In addition these three species also have an elevated global conservation status - vulnerable as opposed least concern or near threatened. Further details are provided in the critical habitat assessment chapter. Ochradenus harsusiticus was recorded in the Refinery footprint during the historic EIAs conducted by HMR. Salsola omanensis was recorded in the Port of Duqm footprint in 2015.
3. LIMITATIONS
Three key limitations have been identified:
1. The ground truthing survey was designed to confirm or evaluate the findings of previous ecological survey work and not to investigate the fauna and flora comprehensively.
2. As far as practical the team attempted to follow the DRPIC Crude Pipeline route but this was not always possible due to the presence of sand accumulations, wadis and escarpments. The broken terrain of the escarpment and hills especially slowed progress and required extensive deviation.

Project Title WSP DRPIC Project No 70029220141-00000-00 Confidential Month Year
3. The habitat mapping conducted by 5OES in 2010 as part of the Duqm IDZ EIA (5OES 2011) is now out of date as some areas have been significantly modified in the intervening years. The same issue, albeit to a lesser extent, has been identified with the Port of Duqm habitat mapping (5OES 2015). Mapping the new infrastructure outside of the Project and Associated Facilities footprint is beyond the scope of this project and therefore these developments are not reflected in the harmonised habitat map.
4. RESULTS
COVERAGE OF EACH DIFFERENT HABITAT IN THE FIELD STUDY AREA
Table B-2. Habitat coverage within the Project footprint
HABITAT TYPE AREA IN
KM2 DISTRIBUTION WITHIN THE PROJECT FOOTPRINT
Borrow pit areas, quarries and construction sites
10.16 Principally the Refinery site which is entirely modified but also along DRPIC Crude Pipeline to the west of construction camp 1 plot and at the junction of the Hayma road
Gravel & sand plains with dwarf shrub cover
31.28 Along the length of the DRPIC Crude Pipeline, dominant habitat at both construction camps and along part of service corridor close to refinery. Co-dominant habitat at Ras Markaz crude oil park
Gravel & sand plains with trees
2.23 Scattered locations along the DRPIC Crude Pipeline
Industry and infrastructure
1.37 Scattered locations along the DRPIC Crude Pipeline, construction camp 2 plot, the services corridor
Rocky mountain & escarpment
0.96 A few locations along DRPIC Crude Pipeline north of Hayma road junction
Rocky outcrops & gravel hills
5.97 Scattered locations including service corridor, construction camp 2, Ras Markaz crude oil park and along the length of the DRPIC Crude Pipeline
Settlements 0.03 Two locations within 0.25 km of the the DRPIC Crude Pipeline but outside of the construction Right of Way (ROW).
Vegetated dune 0.05 Ras Markaz crude oil park (shore)
Vegetated sabkha 1.73 Co-dominant habitat along the service corridor. Also present where DRPIC Crude Pipeline turns east and heads towards construction camp 1 plot.
Wadis in close association with mountains
0.3 250 m north of Hayma road junction
Wadis in open terrain 5.3 Scattered along length of the DRPIC Crude Pipeline. Also in NE corner of construction camp 2 plot.
The gravel and sand plains with dwarf shrub cover habitat is by far the most prevalent habitat type within the project footprint, accounting for nearly 53% of the total surface area (Figure B-2). The next most abundant habitat type are borrow pit areas, quarries and non-Project related construction sites that comprise approximately 17% of the project footprint. Although much of that area is attributed to the construction taking place near the refinery (not Project related), other areas of excavation can be found to the west of construction camp 1 plot and at the junction of the Haima road.
DESCRIPTION OF THEIR RELATIVE ABUNDANCE IN THE DUQM AREA
When the habitat mapping was conducted for the 5OES 2011 and 5OES 2015 reports, the two gravel and sand plains habitat categories were considered as a single entity. Nevertheless, that habitat type was estimated to comprise approximately 30% or 119km
2 of the total IDZ project area
(395km2) and 12% of the overall Port of Duqm project footprint (56.3km
2). It is therefore
considered to be a common habitat in the wider area (Figure B-3).

Project Title WSP DRPIC Project No 70029220141-00000-00 Confidential Month Year
Together the rocky mountain & escarpment and rocky outcrops & gravel hills only comprise just over 11.5% of the Refinery and AF footprint. In contrast those habitats coupled with the piedmont and foothills (another rocky habitat type but one absent from the current project area) comprise 190km
2 or 48% of the overall IDZ project area.
The percentage area covered by the wadis in open areas is similar across the current project (approximately 9%) and the IDZ (nearly 10%), both of which are slightly higher (proportionally) compared to the Port of Duqm (6.5%). As is to be expected the area covered by wadis in association with mountainous terrain is much lower than in open areas and estimated to only cover 0.26km
2 of the current project area and approximately 4% of the IDZ.
Vegetated sabkha, which is restricted to the services corridor and DRPIC Crude Pipeline areas of this project, covers approximately 1.73km
2 or 3% of the total area. No distinction was made
between vegetated and unvegetated sabkha in 5OES 2011 mapping, however, that habitat type was estimated to cover 3.20km
2 or approximately 5.5% of the Port of Duqm area.
A small area of vegetated dunes (0.05km2) was mapped within the footprint of the Ras Markaz
facility and a similarly small area was noted on the Port of Duqm habitat map (0.17km2). All
coastal habitats were grouped together for the 5OES 2011 mapping so it is not possible to make meaningful comparisons.
In conclusion, with the possible exception of the vegetated dunes all the habitat types documented within the current project footprint are assessed to be relatively common within the wider Duqm area.
DELINEATION OF MODIFIED AND NATURAL HABITATS AS PER PS6
Although natural and modified habitats exist on a continuum (as described in PS6 extract above) for the purposes of this study, in the absence of more detailed information, it has been agreed with WSP that modified habitat will be defined as that habitat which is irrevocably transformed and cannot realistically be returned to its natural state. Examples include quarries, borrow pits as well as areas where non-Project related infrastructure has been built or is in the process of being built (i.e. construction sites). In contrast, areas that have been subjected to livestock grazing or that exhibit signs of off-road driving but are otherwise not significantly degraded are still classified as natural. On that basis the natural habitats are estimated to cover 47.0 km
2 (79%) of the current
project area. The majority of the modified habitat (12.3 km2) is attributed to the Refinery site,
which has already undergone site preparation and the surroundings, which are being developed by third parties (Figure B-4).
5. DISCUSSION
IDENTIFICATION OF PRESSURES AND THREATS OBSERVED ON HABITATS
Grazing and fuelwood collection, especially near habitation and dispersed livestock compounds were identified as possible factors reducing the abundance of natural vegetation cover;
Vehicle tracking over much of the area, concentrated at wadi crossings, narrow defiles and places where escarpment can be ascended/descended are sources of localised disturbance/erosion of natural vegetation;
Construction activity in the wider SEZ in many places especially ancillary exercises, such as fill scraping and collection and removal to port area account for the modification of natural desert habitats;
Changes to hydrology through drainage impedance by bund construction to carry roads through sabkha and tidal flats. If balance drainage is not provided, then water will

Project Title WSP DRPIC Project No 70029220141-00000-00 Confidential Month Year
accumulate and then evaporate. One location on the Port Road Numbber 5 already noted and photographed. Two major wadi outflows came together at the port area, now compromised by the developments and the northern breakwater. There is still some exchange with the sea and this should be enhanced and maintained to protect and further develop the Duqm Important Bird Area (IBA) wetland area for shore birds use during migratory periods in mitigation;
There may also be some small local changes to surface water flow in wadi habitats, especially during rare but heavy rain, by any alteration to the surface topography through DRPIC Crude Pipeline burial and the construction process;
Dust generation by vehicles during construction phases may smother natural vegetation. This affect was noted in the direct vicinity of third party construction activities around the port. Seawater could be used to supress dust from Project construction sites particularly since it develops a hardcore-like crust. However, it also introduces salt to areas with otherwise low salinity. Use of sea water for dust suppression should only be done in sabkha areas (i.e. in the coastal zone near the Refinery)) during construction, and later if not tarmac-surfaced;
Access to and travel along tracks to reach the DRPIC Crude Pipeline or travel along it during construction and future operational phases will further fragment habitat areas and increase tracking if not controlled. These will also permit increased incursions by local people by vehicle to harvest vegetation and other resources, possibly beyond natural replacement rates; and
Depending on the profiling of the buried DRPIC Crude Pipeline around wadis crossings the water flow and sediment/erosion dynamics may be affected leading to loss or smothering of natural vegetation. It should be possible to design-out this impact through careful post construction landscaping.
RECOMMENDATIONS
The following recommendations have been divided into two categories:
1. Project related recommendations – factors that DRPIC has direct influence or control over. Factors relating to significant ecological impacts identified in ecological impact assessment.
2. Strategic recommendations – factors and conservation issues which the Project may effect in a cumulative way but relating more to landscape scale management and planning directed by SEZAD.
In the former category, DRPIC will seek to mitigation for these issues through implementation of the Biodiversity Management Plan
Project Related Recommendations
A detailed log of ‘hot spots’ where critical habitat for endemic plant species or vegetated wadi crossings may occur (see Technical Appendix C: Critical Habitat Assessment) will be provided in the BMP to enable pre-construction survey work and eventual micro-siting and minimisation of the Project working area to avoid impacts or to inform translocation strategies.
In accordance with legislation and the Project ESMP, minimise the removal of trees during Project construction.
An inventory of areas where the DRPIC Crude Pipeline crosses a wadi should be produced to inform ‘narrowing’ of the DRPIC Crude Pipeline construction working area.
Use local trees, including Prosopis cineraria, Acacia tortilis and Nannorrhops ritcheana (dwarf palm) instead of exotic species in greenbelt planting. Integrate with SEZAD

Project Title WSP DRPIC Project No 70029220141-00000-00 Confidential Month Year
strategic greenbelt strategy. The ESPM contains a requirement to utilise permit based greenbelt planting to ensure adoption.
Conduct targeted pre-construction botanical survey work of key locations in the Project footprint likely to support endemic plant species (e.g. a 0.5 km radius of previous records) and at wadi/DRPIC Crude Oil Pipeline crossings. Evaluate the feasibility of translocating flora species of conservation concern, in particular rare and threatened endemic species. Surveys and mitigation initiatives of this nature could be conducted in partnership with the Oman Botanical Gardens.
Mitigate for accidental transgression from access tracks and unofficial use of access tracks by non-Project related vehicle traffic by closing off and securing tracks.
Strategic Recommendations
Encourage SEZAD and Port of Duqm to re-survey the Duqm IDZ and Port area in order to update the habitat map and ecological findings reported by 5OES in 2011 and 2015 respectively. The focus of the survey should be to identify populations of endemic or threatened plant species such as those listed in the Technical Appendix C: Critical Habitat Assessment, and to coordinate a strategic conservation approach to protect and enhance these populations through sensitive development planning, provision of appropriate ‘nature reserve’ areas which are protected from development and habitat enhancement.

Project Title WSP Client Name Project No 70029220141-00000-00 Confidential Month Year
Figure B-2. Habitat map for the Duqm Refinery and AFs

Project Title WSP Client Name Project No 70029220141-00000-00 Confidential August 2017
Figure B-3. A zoomed in view of DRPIC Crude Pipeline habitat mapping

Project Title WSP Client Name Project No 70029220141-00000-00 Confidential Month Year
Figure B-4. Harmonised habitat map; integrated mapping from IDZ (5OES 2011), Port (5OES 2015) and Refinery and AFs

Project Title WSP Client Name Project No 70029220141-00000-00 Confidential Month Year
Figure B-5. An overview of natural and modified habitats within the Duqm Refinery and AFs footprint

Project Title WSP Client Name Project No 70029220141-00000-00 Confidential Month Year
ANNEX 1 – COMPARISON OF HABITAT UNITS
MAJOR TERRESTRIAL NATURAL AND SEMI-NATURAL
HABITAT TYPES OF ABU DHABI (BROWN & BOER
2004)
DUQM OIL REFINERY AND
ASSOCIATED FACILITIES
HARMONISED HABITAT MAPPING UNITS (2017)
PORT OF DUQM HABITAT
UNITS (5OES 2015)
DUQM IDZ HABITAT
UNITS (5OES 2011)
UNIT CODE
1000 MUDFLATS, BEACHES AND ROCKY COASTAL HABITATS
COASTAL HABITATS INCL MUDFLATS, SANDS AND LAGOONS
COASTAL HABITATS INCL MUDFLATS, SANDS AND LAGOONS
COASTAL HABITATS INCL MUDFLATS, SANDS AND LAGOONS
1010 Mudflats and sand flats exposed at low tide
Khawr
Intertidal sands (fine, bivalve dominated)
Coastal zone
1020 Sheltered tidal flats with cyanobacterial mats
Intertidal sand (thixotrophic, fine, bivalve and polychaete dominated)
1030 Intertidal mudflats and lagoons with coastal marshland
Tidal lagoon
Intertidal sand partially covered in green algae (polychaetes/bivalves)
1040 Intertidal mudflats and lagoons with mangroves
Intertidal mud (anoxic dominated by polychaetes and crabs)
1050 Storm beach ridges
Intertidal mud
Infralittoral mud covered in green algae/seagrass
1060 Non-vegetated, exposed sandy beaches
Supralittoral sand dominated by ghost crabs
1070 Vegetated sandy beaches Intertidal mud overlain on sabkha
Tidal lagoon
1080 Rocky and gravelly beaches Infralittoral sand
1090 Coastal cliffs and headlands
Intertidal sand
Intertidal sands covered in green algae
1095 Maritime rocky slopes Intertidal mud/tidal lagoon
1098 Wadis in coastal situations Supralittoral/intertidal mud overlain on sabkha
Intertidal upper coarse sand/deeper mud layers with crabs and bivalves
2000 COASTAL PLAINS, SAND SHEETS AND LOW DUNES
COASTAL PLAINS AND DUNES COASTAL DUNES COASTAL DUNES
2010 Coastal plains on well-drained ground
Coastal sand sheets and low dunes
Barren dune
Coastal zone
2011 On sandy ground

Project Title WSP Client Name Project No 70029220141-00000-00 Confidential Month Year
MAJOR TERRESTRIAL NATURAL AND SEMI-NATURAL
HABITAT TYPES OF ABU DHABI (BROWN & BOER
2004)
DUQM OIL REFINERY AND
ASSOCIATED FACILITIES
HARMONISED HABITAT MAPPING UNITS (2017)
PORT OF DUQM HABITAT
UNITS (5OES 2015)
DUQM IDZ HABITAT
UNITS (5OES 2011)
2012 On rocky or gravelly terrain Vegetated dune
Vegetated dune
2020 Coastal sand sheets and low dunes
3000 COASTAL SABKHA AND SABKHA MATTI (LARGELY UNVEGETATED)
COASTAL SABKHA COASTAL SABKHA COASTAL SABKHA
3100 Coastal sabkha Barren or sparsely vegetated sabkha Barren or sparsely vegetated sabkha
Sabkha
3200 Sabkha matti Vegetated sabkha Vegetated sabkha
5000 PLAINS (ALLUVIAL AND INTERDUNAL)
GRAVEL AND SAND PLAINS GRAVEL & SAND PLAINS GRAVEL & SAND PLAINS
5100 Alluvial plains
Gravel & sand plains
Gravel & sand plains
5110 Alluvial plains with distinct tree vegetation
Gravel & sand plains with trees
5120 Alluvial plains with dwarf shrub vegetation
Gravel & sand plains with dwarf shrub cover
5121 with Haloxylon salicornicum
5122 with Rhazya stricta
6000 MOUNTAINS, ROCKY TERRAIN AND WADIS
MOUNTAINS AND ROCKY TERRAIN MOUNTAINS AND ROCKY TERRAIN
MOUNTAINS AND ROCKY TERRAIN
6100* Mountain slopes and scree Rocky mountain & escarpment Mountain Rocky Mountain & escarpment
6200 Other rocky habitats Rocky outcrops & gravel hills
Rocky outcrops, plateaux & slopes
Rocky outcrops & gravel hills
6210 ‘Jebels’
Piedmont & foothills
Piedmont & foothills 6220
Escarpments, lithified sand dunes, rocky exposures
WADIS AND OTHER TEMPORARY WATERCOURSES
WADIS AND OTHER TEMPORARY WATERCOURSES
WADIS AND OTHER TEMPORARY WATERCOURSES
6300 Wadis and other temporary watercourses
Wadis & runnels
Wadi courses 6310 Wadis in close association with mountains
Wadis in close association with mountains
6320 Wadis in open terrain Wadis in open terrain
6330 Drainage channels Drainage channels (too small to map)
8000 OASES, FARMLAND AND FORESTRY
DEGRADED OR TRANSFORMED LAND DEGRADED OR TRANSFORMED LAND
Settlements Degraded and/or transformed land
Industry and infrastructure

Project Title WSP Client Name Project No 70029220141-00000-00 Confidential Month Year
MAJOR TERRESTRIAL NATURAL AND SEMI-NATURAL
HABITAT TYPES OF ABU DHABI (BROWN & BOER
2004)
DUQM OIL REFINERY AND
ASSOCIATED FACILITIES
HARMONISED HABITAT MAPPING UNITS (2017)
PORT OF DUQM HABITAT
UNITS (5OES 2015)
DUQM IDZ HABITAT
UNITS (5OES 2011)
9000 URBAN HABITAT TYPES Borrow pit areas and quarries
Construction sites
ANNEX 2 – 2017 DUQM OIL REFINERY AND ASSOCIATED FACILITIES FIELD NOTES
SURVEY
POINT LOCATION NORTHING EASTING
HABITAT
DESCRIPTION PLANT NOTES OTHER NOTES
Start of DRPIC Crude Pipeline route from Ras Markaz storage area heading north
PL 0 DRPIC Crude Pipeline exits storage area
19.172059 57.749412 Rocky plateau above sea cliffs
Blepharis ciliaris, Pulicaria omanensis
Group of 6 donkeys
PL 1 DRPIC Crude Pipeline markers found
19.176830 57.745228 Rocky plateau above sea cliffs
Blepharis ciliaris, Pulicaria omanensis
PL 2 Scarp edge 19.184412 57.734829 Scarp edge, rocky Tetraena qatarensis
PL 3 19.194498 57.722103 Sandy-gravel plain Blepharis ciliaris, Pulicaria omanensis in runnels
PL 4 19.208212 57.715919 Broad wadi, outflow area
Acacia sp. Likely A.tortilis, Blepharis ciliaris, Tephrosia apollinea, Calligonum sp., Crotalaria aegyptiaca
Donkey & Camel droppings, small carnivore partial skull (Viverrid or Mustelid?)
PL 5 19.231171 57.671139 Sandy plain, lightly wooded
Acacia tortilis, Blepharis ciliaris, Poaceae sp, Rhazya stricta
PL 6 19.246351 57.656273 Sandy-gravel plain Blepharis ciliaris
PL 7 In village 19.263441 57.633442 Urban
PL 8 19.277147 57.616642 Sandy-gravel plain
Scattered Acacia tortilis, Blepharis ciliaris, Pulicaria omanensis, Convolvulus sp.
DRPIC Crude Pipeline route & Duqm Special Economic Zone concrete marker pillar photos 54-55
PL 9 19.295979 57.608273 Sandy-gravel plain Pulicaria omanensis Acacia tortilis, Dried stem - Blepharis ciliaris?
Paired Line marker photo 60.
PL 10 19.315599 57.598553 Borrow pits photo 63
PL 11 19.358812 57.591915 Sandy-gravel plain
Blepharis ciliaris, Pulicaria omanensis, Rhazya stricta, Euphorb?, Tephrosia apollinea

Project Title WSP Client Name Project No 70029220141-00000-00 Confidential Month Year
SURVEY
POINT LOCATION NORTHING EASTING
HABITAT
DESCRIPTION PLANT NOTES OTHER NOTES
PL 12 19.379986 57.590813 In Acacia tortilis woodlands
PL 13 19.424900 57.588345 Sandy-gravel plain
scattered Acacia tortilis, Pulicaria omanensis, little else
PL 14 After crossing to W of main road
19.424714 57.581136 Sandy-gravel plain Unvegetated
PL 15 Flash flood pan 19.456619 57.579941 Sandy-gravel plain
Many tiny seedlings, Pulicaria omanensis, Cyperus sp, Tetraena qatarensis, Schweinfurthia sp., Helianthemum sp.
PL 16 Hayma road crossing 19.477003 57.573147 Damaged habitat through road construction
Continuation of DRPIC Crude Pipeline route heading north down scarp and across wadi and plains area to north
PL 17 Start at Hayma road crossing
19.479069 57.574692 Damaged habitat through road construction
PL 18 Edge of scarp beside house & compound
19.486675 57.570545 Sandy-gravel plain No vegetation scarp is major habitat boundary
PL 19 Below scarp in major wadi system
19.488495 57.563995 Vegetated wadi, extensive system
Convolvulus sp., Pulicaria omanensis, Rhazya stricta, Poaceae sp., Acacia tortilis, "euphorb"
Very wide braided wadi system verging on sandy gravel plain
PL 20 19.492279 57.567898 Vegetated wadi, extensive system
Convolvulus sp., Pulicaria omanensis, Poaceae sp., Acacia tortilis, "euphorb" sp.
PL 21 19.496716 57.568428 Wadi edge, against piedmont foothills of scarp
Convolvulus sp, Pulicaria omanensis, Poaceae sp., Acacia tortilis, "euphorb" sp. Fagonia sp.
Wadi edge, site footprint will determine impact on wadi, settlement nearby
PL 22 19.499197 57.566013 Wooded sandy gravel plain
Acacia tortilis, Rhazya stricta, Pulicaria omanensis spp TBC, Nanorrhops ritchieana
PL 23 19.509232 57.572632 Wooded sandy gravel plain
Blepharis ciliaris (desiccated), Acacia tortilis, Convolvulus sp.,

Project Title WSP Client Name Project No 70029220141-00000-00 Confidential Month Year
SURVEY
POINT LOCATION NORTHING EASTING
HABITAT
DESCRIPTION PLANT NOTES OTHER NOTES
Heliotropium kotschyi, Rhazya stricta, Pulicaria omanensis
PL 24 19.522366 57.560303 Wooded sandy gravel plain
Pulicaria omanensis Acacia tortilis, Dried stem - Blepharis ciliaris?
PL 25 19.549030 57.570415 Rocky hills, scarp base
Acacia tortilis, Poaceae sp., Limonium sp.
PL 26 19.556787 57.566040 Wadi in Sandy-gravel plain
Acacia tortilis, Pluchea dioscoridis, Salvadora persica, Echiochilon jugatum
Gazelle midden 3 photos, very fresh dung
PL 27 19.571968 57.567287 Sandy-gravel plain, many small wadis/runnels
Pulicaria omanensis,. Acacia tortilis, Dried stem - Blepharis ciliaris?, Limonium sp
Pristurus carteri gecko
PL 28 Large wadi, small cliffs 19.575554 57.562035 Wadi crossing Acacia tortilis prominent
(large trees)
PL 29 19.588905 57.570449 Sandy-gravel plain, beside small wadi
Acacia tortilis, Pulicaria omanensis, lichens on
small rocks at surface
PL 30 Point at which overlapping with 5OES (2011) survey to north
19.612886 57.570431 Sandy-gravel plain Dried stem - Blepharis ciliaris?, , Acacia tortilis
Following line of the road for solid byproducts between N breakwater land end and Refinery area
R 1
IBA area over-view, from end of the road from refinery where adjoins landward end of the port northern breakwater.
19.677883 57.675755 Sabkha, wet & dry Unvegetated apart from marine algae.
S of northern port breakwater, significant area of tidally inundated sabkha/mudflats occurs, channel along northern edge road bund, some 300 odd-birds present, including Reef Heron (white phase), 6 Greater Flamingo, numbers of small waders from small & larger plovers to larger Whimbrel. Numerous Grey (& Purple?) Heron seen on 25th on northern side of this road bund. Evident that along the initial (port end) of the haul road to refinery acting as a dam to water movement, so water trapped that side cannot drain to sea but evaporating creating salt flats area. The area trapped between the two parallel road bunds however, is still wet and seemingly connected with the larger port area wetland within IBA.
R 2 Wetland overview 19.659540 57.671135 Mudflats, linked to the sea
Unvegetated apart from marine algae.

Project Title WSP Client Name Project No 70029220141-00000-00 Confidential Month Year
SURVEY
POINT LOCATION NORTHING EASTING
HABITAT
DESCRIPTION PLANT NOTES OTHER NOTES
R 3 19.665401 57.644207 Mudflats, linked to the sea
Unvegetated apart
R 4 Junction of roads 19.687019 57.655815
Modified habitat across sabkha due to roads construction.
Unable to stop and study due to construction traffic
R 5 Refinery fence 19.718637 57.642082 Sandy-gravel plain
Sparse Tetraena qatarensis, Pulicaria omanensis
Haul Road will cross sandy-gravel plain area W of main road, as well as some vegetated & unvegetated sabkha areas.
Start of DRPIC Crude Pipeline route from Refinery heading west
PL 31 Refinery cleared area, fenced
19.715330 57.640949 Modified cleared area & road
Sparse Tetraena qatarensis, Pulicaria omanensis, Heliotropium sp., Salsola rubescens
DRPIC Crude Pipeline enters refinery area to the east
PL 32 West of main road 19.714930 57.629303 Sandy-Gravel plain Tetraena qatarensis, Limonium sp., Acacia ehrenbergiana
Stuck in sand west of main road
Tamarix sp., Tavernieria sp.
Became bogged in sand, no further observations. Spiny-tailed lizard dropping found here.

APPENDIX D-3
APPENDIX 7.3: CRITICAL HABITATS’ ASSESSMENT (CHA)

TECHNICAL APPENDIX: CRITICAL HABITAT ASSESSMENT DUQM REFINERY PROJECT, OMAN
CONSOLIDATED ENVIRONMENTAL AND SOCIAL IMPACT ASSESSMENT (ESIA)
CONFIDENTIAL AUGUST 2017

Confidential Project no: 70029220 Date: July 2017
WSP 6 Devonshire Square London, EC2M 4YE Tel: +44 (0)20 7337 1700 www.wsp.com
CRITICAL HABITAT ASSESSMENT
DUQM REFINERY PROJECT, OMAN
Duqm Refinery & Petrochemical Industries Company

Q U A L I T Y M A N A G E M E N T
ISSUE/REVISION FIRST ISSUE REVISION 1 REVISION 2 REVISION 3
Remarks DRAFT01 ISSUE01 ISSUE02 Final Issue
Date 16/06/17 2/08/17 2/08/17 18/08/17
Prepared by
A. Willson, G. Whittington-Jones, S Wilson & R Baldwin (5OES)
A. Willson, G. Whittington-Jones, S Wilson & R Baldwin (5OES)
A. Willson, G. Whittington-Jones, S Wilson & R Baldwin (5OES)
A. Willson, G. Whittington-Jones, S Wilson & R Baldwin (5OES)
Signature
Checked by R. Gowing R. Gowing R. Gowing R. Gowing
Signature
Authorised by C.Haine C Haine C Haine C Haine
Signature
Project number 70029220 70029220 70029220 70029220
Report number 70029220-102-BS01 70029220-102-BS01 70029220-102-BS01 70029220-102-BS01
File reference Project drive Project drive Project drive Project drive

ii
Duqm Refinery Project WSP DRPIC Project No 70029220 Confidential

iii
Duqm Refinery Project WSP DRPIC Project No 70029220 Confidential
TABLE OF CONTENTS 1 INTRODUCTION ...........................................................................6
1.1 OVERVIEW AND PERFORMANCE STANDARDS ........................................... 6
1.2 STRUCTURE OF THE CRITICAL HABITAT ASSESSMENT ........................... 8
1.3 LIMITATIONS AND ASSUMPTIONS ................................................................ 8
2 METHOD.......................................................................................9
2.1 CRITICAL HABITAT DETERMINATION ........................................................... 9
3 RESULTS ................................................................................... 11
3.1 TERRESTRIAL ENVIRONMENT ..................................................................... 11
LIFE HISTORY AND ECOLOGY ................................................................................... 15 CONSERVATION STATUS ........................................................................................... 15 GLOBAL AND NATIONAL DISTRIBUTION ................................................................... 16 DISTRIBUTION WITHIN CHAA ..................................................................................... 16 KNOWLEDGE GAPS ..................................................................................................... 16 CONCLUSIONS AND JUSTIFICATION FOR TIER SELECTION .................................. 17 LIFE HISTORY AND ECOLOGY ................................................................................... 17 CONSERVATION STATUS ........................................................................................... 17 GLOBAL AND NATIONAL DISTRIBUTION ................................................................... 17 DISTRIBUTION WITHIN CHAA ..................................................................................... 17 KNOWLEDGE GAPS ..................................................................................................... 18 CONCLUSIONS AND JUSTIFICATION FOR TIER SELECTION .................................. 18 LIFE HISTORY AND ECOLOGY ................................................................................... 18 CONSERVATION STATUS ........................................................................................... 18 GLOBAL AND NATIONAL DISTRIBUTION ................................................................... 18 DISTRIBUTION WITHIN CHAA ..................................................................................... 18 KNOWLEDGE GAPS ..................................................................................................... 18 CONCLUSIONS AND JUSTIFICATION FOR TIER SELECTION .................................. 19
3.2 MARINE ENVIRONMENT ................................................................................ 23
LIFE HISTORY AND ECOLOGY .....................................................................................1 CONSERVATION STATUS .............................................................................................1 GLOBAL AND NATIONAL DISTRIBUTION .....................................................................2 DISTRIBUTION WITHIN AREA OF INFLUENCE ............................................................5 KNOWLEDGE GAPS .......................................................................................................9 CONCLUSIONS AND JUSTIFICATION FOR TIER SELECTION ....................................9 LIFE HISTORY AND ECOLOGY ................................................................................... 10 CONSERVATION STATUS ........................................................................................... 10 GLOBAL AND NATIONAL DISTRIBUTION ................................................................... 11 DISTRIBUTION WITHIN CHAA ..................................................................................... 12 KNOWLEDGE GAPS ..................................................................................................... 14 CONCLUSIONS AND JUSTIFICATION FOR TIER SELECTION .................................. 14 LIFE HISTORY AND ECOLOGY ................................................................................... 14 CONSERVATION STATUS ........................................................................................... 15 GLOBAL AND NATIONAL DISTRIBUTION ................................................................... 15 DISTRIBUTION WITHIN CHAA ..................................................................................... 16 KNOWLEDGE GAPS ..................................................................................................... 18 CONCLUSIONS AND JUSTIFICATION FOR TIER SELECTION .................................. 18

iv
Duqm Refinery Project WSP DRPIC Project No 70029220 Confidential
LIFE HISTORY AND ECOLOGY ................................................................................... 18 CONSERVATION STATUS ........................................................................................... 19 GLOBAL AND NATIONAL DISTRIBUTION ................................................................... 20 DISTRIBUTION WITHIN CHAA ..................................................................................... 20 KNOWLEDGE GAPS ..................................................................................................... 24 CONCLUSIONS AND JUSTIFICATION FOR TIER SELECTION .................................. 24 LIFE HISTORY AND ECOLOGY ................................................................................... 24 CONSERVATION STATUS ........................................................................................... 25 GLOBAL AND NATIONAL DISTRIBUTION ................................................................... 25 DISTRIBUTION WITHIN CHAA ..................................................................................... 26 KNOWLEDGE GAPS ..................................................................................................... 28 CONCLUSIONS AND JUSTIFICATION FOR TIER SELECTION .................................. 28
4 RECOMMENDATIONS ............................................................... 30
5 REFERENCES ............................................................................ 53
TERRESTRIAL ENVIRONMENT ....................................................................................... 53
MARINE ENVIRONMENT .................................................................................................. 54
T A B L E S
TABLE 2.1: MAIN SOURCES OF DATA ............................................................................ 9
TABLE 3.1: TERRESTRIAL DISCRETE MANAGEMENT UNITS AND ASSOCIATED BIODIVERSITY FEATURES ............................................................................................. 11
TABLE 3.2: BIODIVERSITY SCREENING FOR TERRESTRIAL ENVIRONMENT ......... 13
TABLE 3.3: MARINE DISCRETE MANAGEMENT UNITS AND ASSOCIATED BIODIVERSITY FEATURES ............................................................................................. 25
TABLE 3.4: BIODIVERSITY SCREENING FOR MARINE ENVIRONMENT .................... 28
TABLE 3.5: OCCURRENCE OF IDENTIFIED ASHWS WITHIN DIFFERENT STUDY AREAS WITHIN OMAN (WILLSON ET AL. IN PREP) ....................................................... 6
F I G U R E S
FIGURE 3.1: DISTRIBUTION OF CRITICAL HABITAT FOR THE FOUR SPECIES ASSESSED. THE CRITICAL HABITAT MAPPING IS RESTRICTED TO AREAS FOR WHICH PRIOR HABITAT MAPPING IS AVAILABLE NAMELY THE IDZ (5OES 2011), PORT (50ES 2015) AND OIL REFINERY AND ASSOCIATED FACILITIES (5OES 2 .... 21
FIGURE 3.2: COMBINED CRITICAL HABITAT MAPPING FOR THE FOUR SPECIES INCLUDED IN THE ASSESSMENT. LOW REFERS TO AREAS WHERE ONE OF THE SPECIES MAY POTENTIALLY OCCUR, MEDIUM FOR AREAS WHERE TWO OF THE SPECIES MAY OVERLAP AND HIGH FOR AREAS WHERE THREE SPECIES MAY OVERLAP. NO AREAS EXIST WHERE ALL FOUR MAY POSSIBLY OCCUR. AS CAN BE SEEN FROM THE MAP THE MAJORITY OF CRITICAL HABITAT LIES OUTSIDE THE FOOTPRINT OF THE OIL REFINERY AND ASSOCIATED FACILITIES PROJECT

v
Duqm Refinery Project WSP DRPIC Project No 70029220 Confidential
FOOTPRINT. CRITICAL HABITATS WITHIN THE FOOTPRINT ARE PREDOMINANTLY ASSESSED TO BE LOW OR MEDIUM. ........................................................................... 22
FIGURE 3.3: GEOGRAPHIC AREA COVERED BY THE MARINE CRITICAL HABITAT AREA ANALYSIS ............................................................................ 24
FIGURE 3.4: MARINE DISCRETE MANAGEMENT UNITS ............................................. 26
FIGURE 3.5: AVERAGE OF SIGHTINGS AND SATELLITE TELEMETRY ENSEMBLE ECOLOGICAL NICHE MODELS WITH OVERLAY OF HISTORICAL TAKES OF HUMPBACK WHALES IN THE NORTHERN INDIAN OCEAN BETWEEN 1962 AND 1966, (MIKHALEV, 2000; IWC CATCH DATABASE, EXTRACTED 25 OCTOBER 2013). (SOURCE: WILLSON ET AL. 2017) ................................................................................... 2
FIGURE 3.6: DENSITY PLOTS OF TOTAL VESSEL EFFORT (A) VESSEL EFFORT STANDARD DEVIATION (B) SUM OF SIGHTINGS DENSITY (C) AND STANDARD DEVIATION OF SIGHTINGS DENSITY (SOURCE: WILLSON ET AL, IN PREP) ............. 4
FIGURE 3.7: HABITAT UTILIZATION DERIVED FROM COUNTS OF STATIC SPACE STATE MODEL (SSSM) LOCATIONS WITHIN A HEXAGON GRID NETWORK. FULL EXTENT OF THE STUDY AREA DEFINED BY WHALE MOVEMENT (UPPER PANEL; THIS SHOULD BE A; CELL SIZE 25 KM MIN. RADIUS) AND SELECTED HIGH-USE AREAS (BOTTOM PLOTS ‘B’ AND ‘C’; CELL SIZE 15 KM MIN. RADIUS). (WILLSON ET AL., 2016). 5
FIGURE 3.8: KERNEL DENSITY ESTIMATE OF ARABIAN SEA HUMPBACK WHALE HABITAT UTILISATION DERIVED FROM STATIC SPACE STATE MODEL LOCATIONS FROM SATELLITE TELEMETRY STUDIES 2014-’16 WITHIN THE GULF OF MASIRAH.6
FIGURE 3.9: BEST DAILY LOCATIONS (BDL) OF TELEMETRY PLOTS COMBINED WITH MAXIMUM DEPTHS FOR EACH DAY (SOURCE: WILLSON ET AL. 2016) ........... 8
FIGURE 3.10: THE ASSUMED DISTRIBUTION OF THE INDIAN OCEAN HUMPBACK DOLPHIN (SOUSA PLUMBEA). (SOURCE: BRAULIK ET AL. 2016).............................. 11
FIGURE 3.11: DISTRIBUTION OF INDIAN OCEAN HUMPBACK DOLPHIN BASED ON SIGHTINGS AND STRANDINGS RECORDS .................................................................. 13
FIGURE 3.12: DISTRIBUTION OF HAWKSBILL TURTLES INCLUDING NESTING LOCATIONS AND POST-NESTING MIGRATIONS OBTAINED USING SATELLITE TELEMETRY STUDIES .................................................................................................... 17
FIGURE 3.13: ADULT FEMALE LOGGERHEAD TURTLE DISTRIBUTION BASED ON TELEMETRY STUDIES CONDUCTED BETWEEN 2006 AND 2012 (ESO UNPUBL. DATA) 21
FIGURE 3.14: KERNEL DENSITY PLOTS OF BEST DAILY LOCATIONS FROM TELEMETRY STUDIES, SHOWING MONTHLY DISTRIBUTION OF ADULT FEMALE LOGGERHEAD TURTLES IN THE CHAA BETWEEN 2006 AND 2012 (ESO UNPUBL. DATA) 22
FIGURE 3.15: DISTRIBUTION OF LOGGERHEAD TURTLES IN THE CHAA INCLUDING NESTING LOCATIONS AND POST-NESTING MIGRATIONS OBTAINED USING SATELLITE TELEMETRY STUDIES. ................................................................... 23
FIGURE 3.16: DISTRIBUTION OF GREEN TURTLES NESTING LOCATIONS IN THE CHAA 27

6
Duqm Refinery Project WSP DRPIC Project No 70029220 Confidential
1 INTRODUCTION
1.1 OVERVIEW AND PERFORMANCE STANDARDS
The International Finance Corporation’s (IFC)’s Policy on Environmental and Social Sustainability describes commitments, roles, and responsibilities related to environmental and social sustainability
1. The requirement for a Critical Habitat Assessment (CHA) is set out in IFC
Performance Standard 6 - Biodiversity Conservation and Sustainable Management of Living Natural Resources. (PS6
22):. Critical habitat is defined as:
“areas with high biodiversity value, including (i) habitat of significant importance to Critically Endangered and/or Endangered
3 species; (ii) habitat of significant importance to
endemic and/or restricted-range species; (iii) habitat supporting globally significant concentrations of migratory species and/or congregatory species; (iv) highly threatened and/or unique ecosystems; and/or (v) areas associated with key evolutionary processes.”
IFC PS6 is guided by the Convention on Biological Diversity (CBD) including the CBD’s Strategic Plan
for Biodiversity 2011–2020 and the Aichi Biodiversity Targets. Full details of the method and process for CHA are provided on pages 19-26 of the IFC6 Guidance Note (GN) document
4.
For projects located in critical habitat, PS6 requires that specific CHAs are conducted. It is additionally recommended that if habitat is critical due to the presence of Critically Endangered and Endangered species, recognized species specialists must be involved (for example, including individuals from IUCN Species Survival Commission Specialist Groups). The CHA was undertaken by staff from Five Oceans Environmental Services (5OES) who are current members of relevant IUCN Species Survival Commission Specialist Groups, including both the Sea Turtle Specialist Group and the Cetacean
5
Specialist Group, and are appropriately qualified to undertake the assessments presented below.
Of the five criteria listed above that are included in the definition of critical habitat, three are relevant to this current assessment:
Criterion 1: Critically Endangered (CR) or Endangered (EN) Species.
Criterion 2: Endemic/Restricted Range Species.
Criterion 3: Migratory/Congregatory Species.
The ultimate outcome of the CHA is determined, against each of these criteria, the gradient of critical habitat or the continuum of degree of biodiversity value associated with critical habitats
1 IFC (International Finance Corporation). 2012. IFC Performance Standards on Environmental and Social Sustainability.
World Bank Group, Washington, DC. 66pp. 2 IFC (International Finance Corporation). 2012. Performance Standard 6: Biodiversity Conservation and Sustainable
Management of Living Natural Resources. World Bank Group, Washington, DC. 7pp. 3 As listed on the International Union for the Conservation of Nature (IUCN) Red List of Threatened Species. The
determination of critical habitat based on other listings is as follows: (i) If the species is listed nationally / regionally as critically endangered or endangered, in countries that have adhered to IUCN guidance, the critical habitat determination will be made on a project by project basis in consultation with competent professionals; and (ii) in instances where nationally or regionally listed species’ categorizations do not correspond well to those of the IUCN (e.g., some countries more generally list species as “protected” or “restricted”), an assessment will be conducted to determine the rationale and purpose of the listing. In this case, the critical habitat determination will be based on such an assessment. 4 IFC (International Finance Corporation). 2012b. Guidance Note 6: Biodiversity Conservation and Sustainable
Management of Living Natural Resources. World Bank Group, Washington, DC. 69pp. 5 ‘Cetacean’ is the collective name given to whales and dolphins.

7
Duqm Refinery Project WSP DRPIC Project No 70029220 Confidential
based on the relative vulnerability (degree of threat) and irreplaceability (rarity or uniqueness) of the site. Numerical thresholds are defined for the three critical habitat criteria (i.e., CR/EN species; endemic/restricted-range species; migratory/congregatory species) based on IUCN Best Practice Protected Area Guidelines (Langhammer et al., 2007)
6.
The thresholds form the basis of a tiered approach, in that numerical thresholds are used to assign Criteria 1 through 3 to a Tier 1 or a Tier 2 critical habitat designation. A summary of the tiers with respect to the thresholds for each criterion is provided in the table that follows paragraph GN89 in the PS and is repeated in Table 1.1. Paragraphs GN71–GN97 discuss each criterion with respect to the tiers in more detail. It should be emphasized that both the thresholds and associated tiers are indicative and serve as a guideline for decision-making only. There is no universally accepted or automatic formula for making determinations on critical habitat.
Section GN6 in the IFC PS6 guidance document provides specific guidance on how to determine critical habitat by criterion, including the basis for determination of the gradient of critical habitat i.e. Tier 1 or Tier 2. Details are available on page 23 through 28 of IFC GN6.
Importantly, the IFC GN6 states that both a Tier 1 and a Tier 2 habitat would qualify as critical but the likelihood of project receiving investment in a Tier 1 habitat is generally considered to be substantially lower than in a Tier 2 habitat. Recommendations are provided in this document (Section 4) that DRPIC brings this requirement to the attention of SEZAD for inclusion in strategic land allocation and mitigation planning.
Table 1.1: Quantitative thresholds for CHA Tiers 1 and 2 of Critical Habitat Criteria 1 through 3
CRITERIA TEIR 1 TEIR 2
1. Critically Endangered (CR)/ Endangered (EN) Species
(a) Habitat required to sustain ≥ 10 percent of the global population of a CR or EN species/subspecies where there are known, regular occurrences of the species and where that habitat could be considered a discrete management unit for that species. (b) Habitat with known, regular occurrences of CR or EN species where that habitat is one of 10 or fewer discrete management sites globally for that species.
(c) Habitat that supports the regular occurrence of a single individual of a CR species and/or habitat containing regionally- important concentrations of a Red-listed EN species where that habitat could be considered a discrete management unit for that species/ subspecies. (d) Habitat of significant importance to CR or EN species that are wide- ranging and/or whose population distribution is not well understood and where the loss of such a habitat could potentially impact the long-term survivability of the species. (e) As appropriate, habitat containing nationally/regionally important concentrations of an EN, CR or equivalent national/regional listing.
2. Endemic/ Restricted Range Species
(a) Habitat known to sustain ≥ 95 percent of the global population of an endemic or restricted-range species where that habitat could be considered a discrete management unit for that species (e.g., a single-site endemic).
(b) Habitat known to sustain ≥ 1 percent but < 95 percent of the global population of an endemic or restricted-range species where that habitat could be considered a discrete management unit for that species, where data are available and/or based on expert judgment.
6 Langhammer, P.F. et al. 2007. Identification and Gap Analysis of Key Biodiversity Areas: Targets for Comprehensive
Protected Area Systems. Best Practice Protected Area Guideline Series No. 15. IUCN, Gland, Switzerland.

8
Duqm Refinery Project WSP DRPIC Project No 70029220 Confidential
CRITERIA TEIR 1 TEIR 2
3. Migratory/ Congregatory Species
(a) Habitat known to sustain, on a cyclical or otherwise regular basis, ≥ 95 percent of the global population of a migratory or congregatory species at any point of the species’ lifecycle where that habitat could be considered a discrete management unit for that species.
(b) Habitat known to sustain, on a cyclical or otherwise regular basis, ≥ 1 percent but < 95 percent of the global population of a migratory or congregatory species at any point of the species’ lifecycle and where that habitat could be considered a discrete management unit for that species, where adequate data are available and/or based on expert judgment. (c) For birds, habitat that meets BirdLife International’s Criterion A4 for congregations and/or Ramsar Criteria 5 or 6 for Identifying Wetlands of International Importance. (d) For species with large but clumped distributions, a provisional threshold is set at ≥5 percent of the global population for both terrestrial and marine species. (e) Source sites that contribute ≥ 1 percent of the global population of recruits.
1.2 STRUCTURE OF THE CRITICAL HABITAT ASSESSMENT
This appendix is structured to provide an assessment of some key species in the Duqm area that meet Criteria 1, 2, 3 or some combination of these. It is divided into two main sections, namely a terrestrial section and a marine section. For each species assessed, background is presented based on knowledge of the species life history and ecology, conservation and population status and its distribution globally, nationally and within the Duqm area. Finally, conclusions are drawn with respect to the gradient of critical habitat that the area represents for each species, including assessment of whether the habitat can be defined within a Tier 1 or Tier 2 category.
1.3 LIMITATIONS AND ASSUMPTIONS
Sufficient data were available to enable firm conclusions to be drawn regarding the critical habitat designations presented in this document. However, subsequent mitigation and management recommendations, would be significantly improved if more data were available, and recommendations covering potential future survey work are presented in Section 4 of this technical appendix.
The study presented here was also limited by the nature and variety of third party data sets which were not all necessarily designed for use in CHA and were of variable quality.
The review and compilation of component EIA studies relating to the different Project and AF components has identified a number of species potentially triggering CHA which require some consideration at the SEZAD (regional) scale to inform future development planning in the region. Recommendations are provided in Section 4 of this technical appendix for future CHA studies.

9
Duqm Refinery Project WSP DRPIC Project No 70029220 Confidential
2 METHOD
2.1 CRITICAL HABITAT DETERMINATION
The CHA was based on the broad pool of biodiversity data obtained as through consulting existing information sources (Table 2.1, below) and generating an inventory of marine species known to the area. This list was screened against the IUCN Red List of Threatened Species to determine listed species including Critically Endangered (CR), Endangered (EN), Vulnerable (VU), Near threatened (NT), Least Concern (LC) and Data Deficient (DD) species, These species were then subject to assessment using critical habitat criteria and thresholds, as appropriate, as defined in PS6 and GN6. The analysis of this data was conducted with the overall scope of determining the relative irreplaceability and vulnerability of any biodiversity values that trigger Criteria 1 through 5 on a scale that is ecologically relevant as made explicit in footnote 12 of Performance Standard 6 (see also paragraph GN13). Most of the assessment was based on analysis of existing data and results of previous studies. In the event that new, secondary analysis was deemed necessary for this report, this was conducted as mentioned in the results sections where relevant.
Table 2.1: Main sources of data
ORGANISATION REFERENCED DATA
Ministry of Environment and Climate Affairs
CBD Biodiversity List Cetacean strandings data
Ministry of Fisheries and Agriculture Fisheries species data
Environment Society of Oman Cetacean and turtle data (Oman Cetacean Database)
Emirates Wildlife Society Green turtle and hawksbill telemetry data. Turtle foraging ecology data
Five Oceans Environmental Services
Cetacean. turtle and baseline ecology data
Previous ecology surveys in Duqm and the Gulf of Masirah
HMR Environmental Engineering Consultants
Previous marine and terrestrial ecology surveys in the Gulf of Masirah
Royal Haskoning DHV Previous marine and terrestrial ecology surveys in the Gulf of Masirah
The Lenders’ Independent Environmental and Social Consultant (IESC) identified the following species as a priority requiring CHA, which are accordingly used as the starting point in this report to which other eligible species have been added: Terrestrial Species:
Egyptian Vulture (Neophron percnopterus);
Sociable Lapwing (Vanellus gregarius)
Salsola omanensis (Plant); and
Ochradenus harsusiticus (Plant).
Marine Species:
Arabian Sea humpback whale (ASHW; Megaptera novaeangliae);
Sei whale (Balaenoptera borealis);
Loggerhead turtle (Caretta caretta);
Hawksbill turtle (Eretmochelys imbricata); and
Green turtle (Chelonia mydas).

10
Duqm Refinery Project WSP DRPIC Project No 70029220 Confidential
The Egyptian Vulture (Neophron percnopterus) occurs in the area of interest and was therefore included in the CHA. However, the findings of the assessment and expert opinion agree that this species occurs at such low density in the project area that habitats therein are not considered to be critical for this species at this time. The assessment concludes that the Egyptian Vulture should therefore be excluded as an important ecological feature of the project area, and no mitigation measures to ensure no net loss of this species is required in the biodiversity management plan.
The Sociable Lapwing (Vanellus gregarius) was also initially identified by the IESC as a priority species, but since it has not previously been recorded in the Duqm area (Jens Erikson pers. comm.
7) it has been ruled out and is not given further consideration in the CHA.
Although vagrants cannot be ruled out, the weight of evidence (Robert Baldwin, pers comm.) indicates that it is unlikely that Sei whales commonly occur in the Arabian Sea. Unconfirmed reports from Oman are noted (Baldwin et al, 1999) but these anecdotal reports have been made in the absence of definitive, positive identification by cetacean experts, nor have they been verified by genetic or photographic evidence. No confirmed records are reported from Omani waters either from vessels, nor beach based surveys of the Sei whale are included in the Oman Cetacean Database (1985 - 2017). Furthermore the chief scientist of Soviet whaling vessels active in the area from 1963 to 1966 made no record of Sei whales in their capture of 2,385 baleen whales (Michalev et al, 2000). Their presence in the area of interest is therefore considered highly unlikely (Baldwin, 2003) and according to regional experts it is considered likely that reports of this species in the region are either vagrants or misidentifications (Dr G Minton, pers.comm, 23 July 2017).
However, during this assessment another endangered cetacean, the Indian Ocean humpback dolphin (Sousa plumbea), was identified as meeting the criteria for CHA and is included in the assessment below.
7 Jens Erikson is a resident bird specialist managing the Oman Bird Records Database. The database reveals no records
of Sociable Lapwing in the area. According to expert opinion there is no known suitable habitat for this species in the area or nearby.

11
Duqm Refinery Project WSP DRPIC Project No 70029220 Confidential
3 RESULTS
3.1 TERRESTRIAL ENVIRONMENT
3.1.1 TERRESTRIAL CRITICAL HABITAT ASSESSMENT AREA
The Critical Habitat Assessment Area (CHAA) for terrestrial species is defined as all habitat potentially offering suitable ecological conditions for that species to breed, feed, shelter, commute, congregate or which contributes to any other element of its life history. The identification of potential suitable habitat is confined to habitat data presented in Technical Appendix B: Harmonised Habitat Mapping which is compiled from baseline information presented in the EIA studies listed in Table 2.1. The resulting CHAA encompasses all of the Project and Associated Facility (AF) footprint and a 0.25 km buffer zone around it. To this end the terrestrial CHAA is synonymous with the direct and indirect Areas of Influence (AoI) as described in the main assessment.
3.1.2 DISCRETE MANAGEMENT UNITS (DMU)
The delineation of discrete management units within the Duqm Special Economic Zone (Duqm SEZ) is based on ecological units that have more in common with each other than they do with those in adjacent areas. For further information refer to the harmonised habitat mapping (Technical Appendix B).
Table 3.1: Terrestrial discrete management units and associated biodiversity features
DMU KEY BIODIVERSITY FEATURES8
Coastal habitats including mudflats, sand and lagoons
Important area for wading and migratory bird species
Coastal plains and dunes Reptiles and the Oman-endemic plant, Salsola omanensis. Striped hyena may scavenge along the coastal belt
Coastal sabkha9 Scattered areas of vegetation supporting small mammals and reptiles
Gravel and sand plains Highest diversity of reptiles including endemic Thomas’ spiny-tailed lizard and regionally endemic Egyptian spiny-tailed lizard
Mountains and rocky terrain
Diversity of flora and important wildlife corridor for larger species such as gazelle and ibex. The Oman-endemic plant, Salsola omanensis may be present. Cliffs may be used by nesting Egyptian Vultures (in the future)
Wadis and other temporary watercourses
Higher diversity of flora including mature stands of Prosopis cineraria and Acacia tortilis, habitat for the Oman-endemic plant Ochradenus harsusiticus. Important habitat for wildlife including arthropods, reptiles, birds and mammals
Degraded or transformed land
Generally of limited biodiversity value
3.1.3 SCREENING OF BIODIVERSITY FEATURES
The terrestrial CHA has been restricted to consideration of a single bird species, the Egyptian Vulture and two endemic plant species. Table 3.2 below highlights the species included in the CHA and justification for their inclusion.
8 For species, common and scientific names are tabulated in the results section of this report.
9 Sabkah - an area of coastal flats subject to periodic flooding and evaporation which result in the accumulation of aeolian
clays, evaporites, and salts, particular to North Africa and Arabia.

12
Duqm Refinery Project WSP DRPIC Project No 70029220 Confidential
Table 3.2 also highlights a number of additional biodiversity features that potentially warrant CHA consideration at a strategic (SEZAD) scale. In the case of the plants listed in Table 3.2 many have not been recorded in the project area but are known to occur in central Oman and more specifically in the four quarter degree grid squares between 19.0° - 20.0° N and 57.0° - 58.0° E that includes or surrounds the SEZAD area. More detailed surveys would be required to accurately map the distribution of many of the species listed as detailed botanical survey data is not available. Information on species conservation statuses is based on the following sources (Fisher et al 1999; Mallon & Budd 2011; IUCN 2017; Patzelt 2014). With reference to the five terrestrial mammal species – consultation with Omani mammal experts identified a possibility that these species occur in the Duqm area on the basis that habitats which are present in the CHAA may be suitable to support them (see the main biodiversity assessment for additional baseline information on these species). IFC PS6 guidance requires that key biodiversity areas are also subject to CHA. Key biodiversity areas are identified as being sites of high nature conservation value, defined using internationally recognized standards. In the context of the Project, the Duqm Important Bird Area (IBA) and the Jiddat al Harasis IBA qualify as key biodiversity areas because they are designated according to international standards defined by Wetlands International. However, both IBA sites are not assessed in this CHA in order to keep individual species (rather than assemblages of species) the sole focus of this document. Potential impacts are fully considered in the main biodiversity assessment where detailed baseline information for these IBAs is also presented.

13
Duqm Refinery Project WSP DRPIC Project No 70029220 Confidential
Table 3.2: Biodiversity screening for terrestrial environment
SPECIES/FEATURE FEATURE
TYPE
ENDEMISM
(OMAN OR
REGIONAL)
OMAN
STATUS REGIONAL
STATUS GLOBAL
STATUS INCLUDED/EXCLUDED
FROM THIS ASSESSMENT JUSTIFICATION FOR INCLUSION/EXCLUSION
Egyptian Vulture (Neophron percnopterus)
Bird N/A NE NE En3
Included Included in this CHA. Of global conservation concern. Requested by the Lenders’ IESC.
Sociable Lapwing (Vanellus gregarius)
Bird N/A NE NE CR3
Excluded
Identified by the Lenders IESC but there are no records of this species occurring in the vicinity of Duqm. All Omani records for this species are restricted to Sohar and Dhofar.
Steppe Eagle (Aquila nipalensis)
Bird N/A NE NE En3
Excluded Not identified by the Lenders IESC. Only one recorded sighting. Unlikely to warrant strategic CHA consideration in the Duqm region
Saker Falcon (Falco cherrug)
Bird N/A NE NE En3 Excluded
Not identified by the Lenders IESC. Only one recorded sighting. Unlikely to warrant strategic CHA consideration in the Duqm region
Salsola omanensis Plant Endemic NE NE VU4 Included
Included in this CHA. Endemic species of global conservation concern. Recorded in Port of Duqm boundary (5OES 2015). Under threat from development, livestock farming and road construction
Ochradenus harsusiticus
Plant Endemic NE NE VU4
Included
Included in this CHA. Endemic species of global conservation concern. Recorded in SEZAD boundary (5OES 2011). Under threat from development, livestock farming and road construction
Pycnocycla sp. nov. Plant Endemic Dd NE NE4 Excluded
Not identified by the Lenders IESC but species potentially requiring strategic CHA consideration in the Duqm region.
Campylanthus sedoides
Plant Endemic NE NE NT4 Excluded
Not identified by the Lenders IESC but species potentially requiring strategic CHA consideration in the Duqm region. Not under threat.
Convolvulus oppositifolius
Plant Endemic NE NE NT4 Excluded
Not identified by the Lenders IESC but species potentially requiring strategic CHA consideration in the Duqm region. Under no immediate threat
Pulicaria pulvinata Plant Endemic NE NE NT4 Excluded
Not identified by the Lenders IESC but species potentially requiring strategic CHA consideration in the Duqm region. Under no immediate threat
Striped hyena (Hyaena hyaena)
Mammal N/A CR1
EN2
NT3 Excluded
Not identified by the Lenders IESC but species potentially requiring strategic CHA consideration in the Duqm

14
Duqm Refinery Project WSP DRPIC Project No 70029220 Confidential
SPECIES/FEATURE FEATURE
TYPE
ENDEMISM
(OMAN OR
REGIONAL)
OMAN
STATUS REGIONAL
STATUS GLOBAL
STATUS INCLUDED/EXCLUDED
FROM THIS ASSESSMENT JUSTIFICATION FOR INCLUSION/EXCLUSION
region.
Arabian wolf (Canis lupus arabs)
Mammal N/A EN1
EN2 LC
3 Excluded
Not identified by the Lenders IESC but species potentially requiring strategic CHA consideration in the Duqm region.
Rüppell's sand fox (Vulpes rueppellii)
Mammal N/A EN1
LC2
LC3
Excluded Not identified by the Lenders IESC but species potentially requiring strategic CHA consideration in the Duqm region.
Caracal (Caracal caracal)
Mammal N/A EN1
LC2 LC
3 Excluded
Not identified by the Lenders IESC but species potentially requiring strategic CHA consideration in the Duqm region.
Ibex (Capra ibex)
Mammal N/A EN1
NE VU3
Excluded Not identified by the Lenders IESC but species potentially requiring strategic CHA consideration in the Duqm region.
Duqm Important Bird Area
Key Biodiversity Area
N/A N/A N/A N/A Excluded Assessed in the main biodiversity impact assessment not in this CHA.
Jiddat Al Harasis Important Bird Area
Key Biodiversity Area
N/A N/A N/A N/A Excluded Assessed in the main biodiversity impact assessment not in this CHA.
1 Fisher et al 1999
2 Mallon & Budd 2011
3IUCN 2017
4Patzelt 2014

15
Duqm Refinery Project WSP DRPIC Project No 70029220 Confidential
3.1.4 EGYPTIAN VULTURE
LIFE HISTORY AND ECOLOGY
The Egyptian Vulture typically nests on ledges or in caves on cliffs, crags and rocky outcrops, but occasionally also in large trees, and exceptionally on the ground (Gangoso and Palacios, 2005). It forages in lowland and montane regions over open, often arid, country. It also scavenges at human settlements. The Egyptian vulture has a broad diet including carrion, tortoises, organic waste, insects, young vertebrates, eggs and even faeces (Margalida et al., 2012). It is usually solitary, but will congregate at feeding sites, such as rubbish tips.
CONSERVATION STATUS
The Egyptian Vulture is a medium-sized avian scavenger that is globally endangered (BirdLife International, 2017). Published information puts the Oman population of breeding Egyptian Vulture at around 100 pairs (Jennings, 2010). However, recent work on Masirah Island (about 110 km north-east of Duqm) estimated the population on that island alone to be 65-80 pairs (Angelov et al., 2013), suggesting a larger national breeding population. The previous estimate of the breeding Egyptian Vulture population on Masirah was of 12 pairs (Rogers, 1988). The new estimate makes Masirah the second-most dense known population of breeding Egyptian Vultures in the world. Only Socotra Island, Yemen, is more densely populated. It is not known whether the Oman population of Egyptian Vultures has increased, or whether higher recent population estimates are the result of better survey work. Generally speaking, information on numbers of breeding vultures in Oman is lacking.
Electrocution of Egyptian Vultures and other large birds is a conservation problem. The impact of electrocution on some bird species, especially endangered ones, can be significant. The risk and impact of this threat has increased over the years as electricity infrastructure has expanded. Electrocution events can also cause power outages, which affect end users and can increase transmission costs.
There is evidence that Egyptian Vultures are sometimes electrocuted in Oman, though the extent of the problem has not been quantified (http://egyptianvultureoman.blogspot.co.at/). Electrocution incidents are known to have occurred at oil production camps in Oman, resulting in damage to equipment, lost production time and death of birds (Petroleum Development Oman, unpublished data). Solutions have been found by power transmission and distribution companies, users and conservationists, and can be particularly cost effective, if implemented early in development (APLIC 2006, http://www.aplic.org/mission.php).
It appears that other threats to Egyptian Vultures are either not operative or not significant in Oman, including the Duqm area. Because there is apparently no breeding population near Duqm, nest disturbance and persecution of breeders is not an issue. Firearms are not widely used, though some poaching of wildlife is known to occur. Although Omanis have a generally negative view of Egyptian Vultures (local name: Rahma), this does not usually translate into direct persecution, poisoning or shooting. Low human populations across much of the country and local animal husbandry methods suggest that inadvertent or targeted poisoning may be low.
Increasing human population at Duqm will mean a larger volume of organic waste, which the government will want to dispose of in a manner that promotes human health. A larger volume of waste, if available to vultures, will be an attractant, and may provide a foothold for future breeding birds or the regular use of rubbish dumps at Duqm by non-breeding birds. At the very least, an increase in biological waste might attract small numbers and single transient birds.
In recent decades global Egyptian Vulture populations have suffered huge declines. The main causes for the declines are targeted and inadvertent poisoning, electrocution, hunting/persecution, and changes in food availability. As a group, vultures are under threat.

16
Duqm Refinery Project WSP DRPIC Project No 70029220 Confidential
Declines have occurred in 15 of the 16 vulture species in Europe, Asia and Africa, a situation which is driving the urgent development of a multi-species conservation action plan being coordinated by the Convention on Migratory Species (CMS). At a recent regional workshop to develop that action plan (Sharjah, February 2017), Oman was identified by local and international experts as particularly important because of its breeding population, its large wintering population, and that it is apparently fairly benign in terms of the main threats being faced by vultures.
GLOBAL AND NATIONAL DISTRIBUTION
The species has a huge global distribution, extending from the Iberian Peninsula across to central Asia, south to India, Arabia and large parts of Africa, mostly north of the equator. In southern areas Egyptian Vultures are year-round residents; in the north, they are migratory. Migratory birds winter mostly in Arabia and Africa. Young Egyptian Vultures from migratory populations will spend at least their first 1.5 years in southern areas (i.e. they do not undertake migration in their first spring, at least) (Oppel et al 2015, BirdLife International 2017, Vulture Conservation Foundation https://www.4vultures.org/2017/04/19/egyptian-vulture-rupis-is-home/).
DISTRIBUTION WITHIN CHAA
There is no published information that suggests the Duqm area to be currently important to Egyptian Vultures, either as a place to nest or as an area that might support pre-breeding or migratory birds. Masirah Island, approximately 125 km from Duqm, is the nearest concentration of breeders, and breeding has been confirmed (probably of a single pair) at Jaaluni (about 70 km west) (Eriksen & Victor 2013). Although no vultures seem to breed nearby, cliffs in the Duqm area are probably suitable for Egyptian Vulture nesting. It is important to note that changes resulting from the development of Duqm may attract Egyptian Vultures and other scavenging birds, and so the potential for impact may change over time. Resident species attracted to Duqm (i.e. Egyptian Vulture and Lappet-faced Vulture) could potentially set up territories and attempt to breed.
Egyptian Vultures breed on ledges and in holes in cliffs. Nesting cliffs need not be very high. The main breeding areas in Oman are where cliffs exist on Masirah Island and in the mountains in northern Oman (Eriksen & Victor 2013). Egyptian Vultures may nest in other parts of Oman, but if so at low densities, reflecting the lack of food and the absence of cliffs in which to nest and roost. Nesting Egyptian Vultures are territorial. In high density areas Egyptian Vulture territories may be separated by hundreds of meters, in low density areas there could be tens of kilometers between nests.
Like most scavengers, Egyptian Vultures can forage over huge areas, especially when not tied to a nest during breeding. This allows them to survive in areas where food availability is unpredictable. Egyptian Vultures in Oman tracked via satellite used an area that extended over more than 11,000 square km in the course of a year (Dr. Mike McGrady unpubl. data).
In places across their global distribution, Egyptian Vultures are commensal with humans. They are often associated with nomadic camps, and forage at abattoirs and rubbish dumps in villages and towns. In southern areas (i.e. Arabia, Africa and India) during the non-breeding season, (sometimes very large) aggregations of migrant and resident Egyptian Vultures gather at rubbish dumps. In recent decades such aggregations have occurred at rubbish dumps and landfills in Oman, and some landfills in the sultanate are internationally recognized as important to Egyptian Vultures and other scavenging birds (eagles and vultures) of conservation concern (Al Fazari and McGrady 2016).
KNOWLEDGE GAPS
It is not known whether the Oman population of Egyptian Vultures has increased, or whether higher recent population estimates are the result of better survey work. Generally speaking, information on numbers of breeding vultures in Oman is lacking, including specific numbers for the Duqm area, if any. The national (Omani) Egyptian Vulture survey that is currently run in

17
Duqm Refinery Project WSP DRPIC Project No 70029220 Confidential
partnership with the Environment Society of Oman (since 2012) is designed to fill this knowledge gap.
CONCLUSIONS AND JUSTIFICATION FOR TIER SELECTION
Although Egyptian Vultures are listed globally, at present Duqm is not assessed to be an important area for the species. On that basis it is difficult to designate the natural (cliffs for nesting) or modified habitats (waste disposal sites and settlements for foraging) in the Duqm region as meeting either Tier 1 or Tier 2 critical habitat criteria. This species has therefore been excluded from further consideration in the management of critical biodiversity. In the future landfill sites catering for a larger volume of waste (if available to the birds) may act as an attractant for breeding or non-breeding birds. With this in mind landfill sites and the mountainous and rocky terrain, especially that between Duqm and Ras Madrakah and further inland (in particular cliffs of the rocky mountain and escarpment) could meet critical habitat for this species in the future.
3.1.5 SALSOLA OMANENSIS
LIFE HISTORY AND ECOLOGY
Salsola omanensis is a shrub that grows to a height of 50 cm (Ghazanfar, 2003). It occurs on limestone plateau, limestone cliffs and coastal plains ranging from 50-300m above sea level (Patzelt, 2014). It flowers/fruits in October (Ghazanfar, 2003). Little else is known about the ecology of the species.
CONSERVATION STATUS
The species is listed as by the IUCN Red List as Vulnerable with an observed, estimated, inferred, projected or suspected population reduction. Detailed information pertaining to the Omani status of this species is lacking. Key threats include development, agriculture (in particular livestock farming) and recreational activities that may lead to habitat destruction/degradation (Patzelt, 2014). Loss of habitat resulting from infrastructure development is listed as a key concern (ibid.).
GLOBAL AND NATIONAL DISTRIBUTION
Salsola omanensis is endemic to Oman. It reportedly occurs throughout the country including central Oman, the offshore island of Al Hallaniyah and the Sahil al Jazir coast but its abundance is classified as not common (Ghazanfar, 2003; Patzelt, 2014). It inhabits limestone plateaux, limestone cliffs and coastal plains (Patzelt, 2014).
DISTRIBUTION WITHIN CHAA
The presence of Salsola omanensis within the CHAA was not documented in the Duqm Refinery Project and Associated Facilities EIAs or the Industrial Development Zone (IDZ) EIA (5OES 2011). However, specimens were encountered during the Port of Duqm winter ecological baseline survey (5OES, 2015) around N19.644106 E57.694306. These specimens were positively identified as S. omanensis (J. Henrot pers. comm. 2015). This area in the Port has been earmarked for development and was already surrounded by modified habitat at the time the 2011 survey was conducted.

18
Duqm Refinery Project WSP DRPIC Project No 70029220 Confidential
KNOWLEDGE GAPS
Little information is currently available relating to the ecology and distribution of the species. Detailed surveys would be required to identify the population size, distribution and conservation measures (Patzelt 2014).
CONCLUSIONS AND JUSTIFICATION FOR TIER SELECTION
Only limited information exists regarding the presence of Salsola omanensis in the CHAA. However, the limestone cliffs and plateaux of the mountains and rocky terrain DMU together with coastal plains may potentially qualify as Tier 2 critical habitat on the basis that they are likely to sustain ≥ 1 percent but < 95 percent of the global population of an endemic or restricted-range species where that habitat could be considered a discrete management unit for that species, where data are available and/or based on expert judgement.
3.1.6 OCHRADENUS HARSUSITICUS
LIFE HISTORY AND ECOLOGY
Ochradenus harsusiticus is a spiny shrub that grows to a height of 50cm (Ghazanfar, 2003). It occurs in open Acacia tortilis - Prosopis cineraria woodland of sandy and gravelly depressions and wadi habitats (Ghazanfar, 2003; Patzelt, 2014). It fruits and flowers between November and April (Ghazanfar, 2003).
CONSERVATION STATUS
The species is listed as globally Vulnerable by the IUCN Red List reflecting continuing decline in the area of occupancy and area, extent and/or quality of habitat. Detailed information pertaining to the Omani status of this species is lacking (Patzelt, 2014). Key threats include infrastructure development, agriculture (in particular livestock farming) and road construction that may lead to habitat destruction/degradation (Patzelt, 2014). The wadis are already subject to some modification but are resilient and will recover if stress factors are limited. However, this habitat will not recover if large swathes are destroyed through the removal of mature stands of vegetation and/or alteration to natural drainage patterns and hydrology..
GLOBAL AND NATIONAL DISTRIBUTION
Ochradenus harsusiticus is endemic to Oman and more specifically the sandy and gravelly soils of central Oman (including the limestone plateau of the Jiddat Al Harasis) (Ghazanfar 2003; Patzelt 2014).
DISTRIBUTION WITHIN CHAA
Ochradenus harsusiticus was noted during the refinery and service corridor studies (referenced as HMR 2015a and HMR 2015e, respectively in the Biodiversity chapter), however, details of where the species occurred were not provided. Since the refinery footprint is now entirely modified it is extremely unlikely that the species is still present if they were located on the prepared ground. A few specimens of this species were also recorded in a shallow wadi less than 1 km from the sea between two areas of dense vegetation (N19.78598 E57.71176) approximately 5.8 km north-north-east of the refinery boundary during the IDZ survey (5OES 2011).
KNOWLEDGE GAPS
Little information is currently available relating to the ecology and distribution of the species. Detailed surveys would be required to identify the population size, distribution and conservation measures (Patzelt, 2014).

19
Duqm Refinery Project WSP DRPIC Project No 70029220 Confidential
CONCLUSIONS AND JUSTIFICATION FOR TIER SELECTION
Only limited information exists regarding the presence of Ochradenus harsusiticus in the CHAA. However, the sandy and gravelly wadis associated with open terrain populated by Acacia tortilis and Prosopis cineraria could potentially support populations of this species, and on this basis, they could qualify as Tier 2 critical habitat because they might sustain ≥ 1 percent but < 95 percent of the global population of an endemic or restricted-range species where that habitat could be considered a discrete management unit for that species, where data are available and/or based on expert judgement. 5OES (2011) concluded that the wadi habitats within the SEZAD area support the most diverse array of fauna and flora including mature stands of Prosopis cineraria and Acacia tortilis and are most likely to support this species.
3.1.7 TERRESTRIAL ENVIRONMENT CRITICAL HABITAT SUMMARY
Tier 2 critical habitat for the two Oman-endemic plant species assessed in this CHA may occur in the CHAA on the basis that the CHAA could sustain ≥ 1 percent but < 95 percent of the global population of an endemic or restricted-range species where that habitat could be considered a discrete management unit for that species, where data are available and/or based on expert judgement. Detailed academic research on the habitat preferences of the two assessed plant species is not available, however, available evidence suggests that their critical habitat comprises the following DMUs in the CHAA:
Salsola omanensis - limestone plateau, limestone cliffs and coastal plains ranging from 50 - 300m above sea level (likely to best correspond to the mountains and rocky terrain and coastal plains and dunes DMUs);
Ochradenus harsusiticus - sandy and gravelly depressions and wadi habitat in association with Acacia tortilis - Prosopis cineraria woodland (likely to best correspond to the wadis and other temporary watercourses DMU); and
In the case of the Egyptian Vulture, although this species is listed globally as Vulnerable, at present Duqm is not assessed to be an important area for the species and the CHAA is unlikely to contain either Tier 1 or Tier 2 critical habitat. It is noted that, in the future the species could colonise the area in association with increased scavenging opportunities associated with refuse disposal facilities. Suitable nesting habitat could, in the future, comprise cliffs in the mountains and rocky terrain DMU – although there is no evidence of nesting in the CHAA at present.
Using information on likely habitat preferences of the three assessed species and their corresponding DMUs, Figure 3.1 shows the distribution of potential critical habitat for the four assessed species in the CHAA. The distribution of critical habitat represents has been inferred based on potential habitat suitability for these species and not their actual distribution. The critical habitat mapping is restricted to areas for which prior habitat mapping is available namely the CHAA which is informed by the Duqm Industrial Zone IEA (5OES 2011), the Port EIA (50ES 2015) and Duqm Refinery and Associated Facilities EIA. The habitat mapping methodology and findings, which form the basis of the DMU mapping, is provided in Technical Appendix B: Harmonised Habitat Mapping).
Figure 3.2 shows the combined critical habitat for the four assessed species. In the legend for Figure 3.2 - low refers to areas where one of the species may potentially occur; medium for areas where two of the species may overlap; and high for areas where three species may overlap. No area exists where all four may possibly occur. Critical habitats within the footprint are predominantly assessed to be low or medium. As can be seen from Figure 3.2, the majority of potential critical habitat – four the three plant species and Egyptian vulture - lies outside the footprint of the Duqm Refinery and the Associated Facilities footprint.
There are 163 locations where the Project footprint overlaps an area of potential critical habitat for the two assessed plant species – the list of locations is provided at the end of this document.

20
Duqm Refinery Project WSP DRPIC Project No 70029220 Confidential
Egyptian vulture is omitted from Table 3.3 as there is no evidence that it is currently present in the CHAA.

21
Duqm Refinery Project WSP DRPIC Project No 70029220 Confidential
3.1.8
Figure 3-1: Distribution of critical habitat for the three terrestrial species assessed.

22
Duqm Refinery Project WSP DRPIC Project No 70029220 Confidential
Figure 3-2: Combined critical habitat mapping for the three species included in the assessment.

23
Duqm Refinery Project WSP DRPIC Project No 70029220 Confidential
3.2 MARINE ENVIRONMENT
3.2.1 MARINE CRITICAL HABITAT ASSESSMENT AREA
For assessment of the marine environment an initial step in the process was to define the CHAA using GIS analysis of data presented in previous EIA studies listed in Table 2.1. The relevance of project elements in defining the CHAA was directed by GN5 of PS6 that states:
“At a minimum, the client should screen and assess the risks to and potential impacts on biodiversity and ecosystem services in the project area of influence, taking into account the following: (i) the location and scale of project activities, including those of associated facilities; (ii) its supply chains (as required in paragraph 30 of Performance Standard 6); (iii) the project’s proximity to areas of known biodiversity value or areas known to provide ecosystem services; and (iv) the types of technology that will be used…”
The maximum extent of the CHAA from information available was ultimately defined by the ESIA dated October 2015 for the OTTCO Ras Markaz Crude Park, an Associated Facility, It should be noted that only eight tanks at the Ras Markaz facility will be used exclusively for the Project and therefore liability for spills arising from the facility are shared between the project owner and third parties. However, as no specific oil spill scenario for the eight dedicated project tanks was provided in the ESIA the precautionary principle was applied and the worst case presented in the EIA was used to define the area of influence for the project. It should be noted that adopting a Project focussed assessment, the ‘worst case’ scenariois potentially unrealistic given that the DRPIC crude oil storage tanks are approximately 1.7 km from the coast and the chances of oil spilling directly from the DRPIC part of the tank storage facility is low. However, to ensure a robust assessment available modelling for the whole tank storage facility (including the majority of the site which will be managed by OTTCO) has been used.
Annex 13 of the Ras Markaz ESIA presents a Tier 3 oil spill model (60,000 m3) which suggests
potential impacts covering a wide geographic area which represents the area of influence since it encompasses the footprint of all other potential impacts. Error! Reference source not found. shows the combined winter and summer oil dispersion models based on a 60,000m
3 spill from the
Ras Markaz tanker terminal single point mooring (SPM) (OTTCO, 2015). The full extent ranges over 250 km to the north, 170 km to the south and a maximum offshore distance of 85 km. The seaward extent of the spill model aligns approximately with the 200 m depth contour, which also coincides with DMU boundaries described in the section below. At least one SPM will have the capacity to receive oil from Ultra Large Crude Carriers OTTCO, 2015) which can transport over 550,000 m
3 (Evanelista 2002), and therefore the spill model used for this exercise does not
represent the very worst case scenario of a spill from a single vessel at the Ras Markaz site.
Fully developed impact scenario assessments that account for noise, wildlife strikes and spills from ships in transit through the Gulf of Masirah (associated with AFs) were not available to inform this CHA. The potential oil spill area has been adopted as a pragmatic CHAA which is likely to capture the spatial extent of the majority of other potential direct and indirect impacts associated with the Refinery, the off-site facilities or the AFs. This approach confers with paragraph GN64 in the IFC GN6 guidance document which recommends that CHAs extend beyond the immediate project site where biodiversity attributes and ecological processes dictate. This approach was also adopted to define the maximum direct and indirect Area of Influence (AoI) for the marine environment which is outlined in the main assessment.

24
Duqm Refinery Project WSP DRPIC Project No 70029220 Confidential
Figure 3-3: Geographic extent of marine CHAA as defined by 60,000 m3 oil spill from SPM at Ras
Markaz.

25
Duqm Refinery Project WSP DRPIC Project No 70029220 Confidential
3.2.2 Discrete Management Units
Discrete management units (DMUs) are defined by the spatial extent of physical and biological features within the CHAA. DMU’s were thematically defined through preliminary screening of the ecology of specific biodiversity features within the CHAA including an overlap with terrestrial DMUs in the nearshore and intertidal zone, as well as shallow coastal waters, deep water over shelf areas and oceanic water as detailed in Table 3-3. The spatial extent of DMUs is defined by bathymetry which is natural biogeographic feature delineating changes in ecological features in the marine environment. Enclosed within the CHAA boundary, the marine DMUs follow depth contours as depicted in Error! Reference source not found. below.
Table 3-3: Marine discrete management units and associated biodiversity features
DESCRIPTION DEPTH POTENTIAL MARINE BIODIVERSITY FEATURES10
Nearshore and intertidal habitat
Lowest Astronomical Tide (LAT) 0m
Turtle nesting sites
High biomass and high biodiversity mudflats
Bird wading and foraging
Shallow coastal habitat
0 - 20m
Sea-grass beds
Hard coral reef environments
Green, hawksbill and loggerhead turtle foraging areas and/or interesting habitat
Reef associated demersal (bottom-dwelling) fish resources
Coastal dolphin habitat
Humpback whale potential nursery habitat
Deep water shelf habitat
20 – 200m
Deep water benthic habitats including soft corals (octocorals)
Principle humpback whale habitat
Pelagic fish resources
Turtle migratory habitat
Oceanic habitat >200m
Oceanic cetacean species
Humpback whale migratory habitat
Pelagic fish resources
Turtle migratory habitat
10
Many of the habitats listed are in the wider CHAA. They are not present in the Project footprint.

26
Duqm Refinery Project WSP DRPIC Project No 70029220 Confidential
Figure 3-4: Marine Discrete Management Units (DMUs)

27
Duqm Refinery Project WSP DRPIC Project No 70029220 Confidential
3.2.3 Screening of Biodiversity Features
The marine CHA was limited to the two cetacean species (ASHW and Indian Ocean humpback dolphin) and three turtle species (hawksbill, loggerhead and green turtles). Table 3-4 also presents other species of high biodiversity value, extracted from EIA reports for the project and associated facilities (Table 2.1), that potentially warrant CHA consideration at a wider scale than the Project (e.g. the Gulf of Masirah scale). More detailed field surveys are required to enable CHA for many of the listed species as they remain data deficient. Additionally other important taxa not considered within relevant EIAs but which are relevant to the CHA include the scalloped hammerhead (Sphyrna lewini), great hammerhead (Sphyrna mokarran) and the narrow sawfish (Anoxypritis cuspidate). These three species are all noted on the IUCN Red List as Endangered (Jedabo and Ebert, 2015) and highlights the requirement to ensure marine species are given opportunity for more detailed review beyond findings of previous EIAs. Insufficient data on these biodiversity features is available at the present time to develop appropriate and effective mitigation (if required), noting that these issues sit largely outside the scope of the Present scope and relate to wide-scale commercial use of the marine zone (e.g. fishing).

28
Duqm Refinery Project WSP DRPIC Project No 70029220 Confidential
Table 3-4: Biodiversity screening for marine environment
SPECIES FEATURE TYPE OMAN STATUS REGIONAL STATUS GLOBAL STATUS INCLUDED/ EXCLUDED
JUSTIFICATION FOR INCLUSION/ EXCLUSION
Arabian long-beaked common dolphin Delphinus capensis tropicalis
Cetacean NE NE DD Excluded
Not identified by the Lenders IESC but species potentially requiring strategic CHA consideration, considering all commercial and non-commercial uses of the marine zone.
Blue Whale Balaenoptera musculus
Cetacean NE NE EN Excluded
Not identified by the Lenders IESC but species potentially requiring strategic CHA consideration, considering all commercial and non-commercial uses of the marine zone.
Bryde's Whale Balaenoptera edeni
Cetacean NE NE DD Excluded
Not identified by the Lenders IESC but species potentially requiring strategic CHA consideration, considering all commercial and non-commercial uses of the marine zone.
Cuvier's beaked whale Ziphius cavirostris
Cetacean NE NE LC Excluded
Not identified by the Lenders IESC but species potentially requiring strategic CHA consideration, considering all commercial and non-commercial uses of the marine zone.
Dwarf sperm whale Kogia sima
Cetacean NE NE DD Excluded
Not identified by the Lenders IESC but species potentially requiring strategic CHA consideration, considering all commercial and non-commercial uses of the marine zone.
False killer whale Pseudorca crassidens
Cetacean NE NE DD Excluded
Not identified by the Lenders IESC but species potentially requiring strategic CHA consideration, considering all commercial and non-commercial uses of the marine zone.
Humpback whale Megaptera novaeangliae
Cetacean NE EN LC Included Identified by the Lender’s IESC Regional population Endangered IUCN Red List
Indian Ocean humpback dolphin Sousa plumbea
Cetacean NE NE EN* Included
Not identified by the Lenders IESC but included in the CHA as a representative species subject to potential impacts arising from the Project and AFs. Global population assessed as Endangered (*in review)

29
Duqm Refinery Project WSP DRPIC Project No 70029220 Confidential
SPECIES FEATURE TYPE OMAN STATUS REGIONAL STATUS GLOBAL STATUS INCLUDED/ EXCLUDED
JUSTIFICATION FOR INCLUSION/ EXCLUSION
Indo-pacific bottlenose dolphin Tursiops aduncus
Cetacean NE NE DD Excluded
Not identified by the Lenders IESC but species potentially requiring strategic CHA consideration, considering all commercial and non-commercial uses of the marine zone.
Orca Orcinus orca
Cetacean NE NE DD Excluded
Not identified by the Lenders IESC but species potentially requiring strategic CHA consideration, considering all commercial and non-commercial uses of the marine zone.
Pygmy killer whale Feresa attenuata
Cetacean NE NE DD Excluded
Not identified by the Lenders IESC but species potentially requiring strategic CHA consideration, considering all commercial and non-commercial uses of the marine zone.
Risso's Dolphin Grampus griseus
Cetacean NE NE LC Excluded
Not identified by the Lenders IESC but species potentially requiring strategic CHA consideration, considering all commercial and non-commercial uses of the marine zone.
Rough toothed dolphin Steno bredanensis
Cetacean NE NE LC Excluded
Not identified by the Lenders IESC but species potentially requiring strategic CHA consideration, considering all commercial and non-commercial uses of the marine zone.
Sperm Whale Physeter macrocephalus
Cetacean NE NE VU Excluded
Not identified by the Lenders IESC but species potentially requiring strategic CHA consideration, considering all commercial and non-commercial uses of the marine zone.
Spinner Dolphin Stenella longirostris
Cetacean NE NE DD Excluded
Not identified by the Lenders IESC but species potentially requiring strategic CHA consideration, considering all commercial and non-commercial uses of the marine zone.
Pantropical Spotted Dolphin Stenella attenuata
Cetacean NE NE LC Excluded
Not identified by the Lenders IESC but species potentially requiring strategic CHA consideration, considering all commercial and non-commercial uses of the marine zone.
Hawksbill turtle Eretmochelys imbricata
Turtle NE NE CR Included Identified by client. Global population Critically Endangered IUCN Red List

30
Duqm Refinery Project WSP DRPIC Project No 70029220 Confidential
SPECIES FEATURE TYPE OMAN STATUS REGIONAL STATUS GLOBAL STATUS INCLUDED/ EXCLUDED
JUSTIFICATION FOR INCLUSION/ EXCLUSION
Green turtle Chelonia mydas
Turtle NE NE EN Included Identified by client. Global population Endangered IUCN Red List
Leatherback turtle Dermochelys coriacea
Turtle NE CR VU Excluded
Not identified by the Lenders IESC but species potentially requiring strategic CHA consideration, considering all commercial and non-commercial uses of the marine zone.
Loggerhead turtle Caretta caretta
Turtle NE CR VU Included Identified by client. Regional population Critically Endangered IUCN Red List
Olive Ridley turtle Lepidochelys olivacea
Turtle NE NE VU Excluded
Not identified by the Lenders IESC but species potentially requiring strategic CHA consideration, considering all commercial and non-commercial uses of the marine zone.
Oman Butterflyfish Chaetodon dialeucos
Fish NE NE LC Excluded
Not identified by the Lenders IESC but species potentially requiring strategic CHA consideration, considering all commercial and non-commercial uses of the marine zone.
Yellow-bellied sea snake Pelamis platura
Snake NE NE LC Excluded
Not identified by the Lenders IESC but species potentially requiring strategic CHA consideration, considering all commercial and non-commercial uses of the marine zone.
A coral species Diploastraea favus
Hard coral NE NE NE Excluded
Not identified by the Lenders IESC but species potentially requiring strategic CHA consideration, considering all commercial and non-commercial uses of the marine zone.
A coral species Favites pentagona
Hard coral NE NE LC Excluded
Not identified by the Lenders IESC but species potentially requiring strategic CHA consideration, considering all commercial and non-commercial uses of the marine zone.
Cabage Coral Montipora foliosa
Hard coral NE NE NT Excluded
Not identified by the Lenders IESC but species potentially requiring strategic CHA consideration, considering all commercial and non-commercial uses of the marine zone.
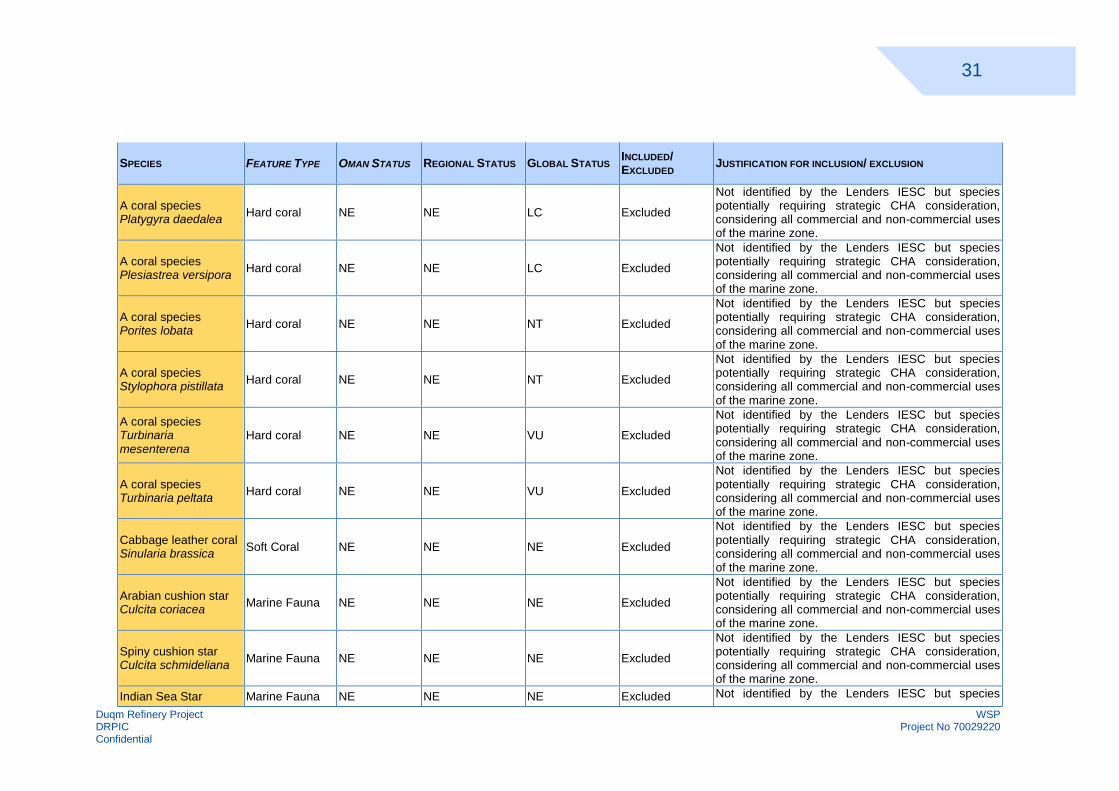
31
Duqm Refinery Project WSP DRPIC Project No 70029220 Confidential
SPECIES FEATURE TYPE OMAN STATUS REGIONAL STATUS GLOBAL STATUS INCLUDED/ EXCLUDED
JUSTIFICATION FOR INCLUSION/ EXCLUSION
A coral species Platygyra daedalea
Hard coral NE NE LC Excluded
Not identified by the Lenders IESC but species potentially requiring strategic CHA consideration, considering all commercial and non-commercial uses of the marine zone.
A coral species Plesiastrea versipora
Hard coral NE NE LC Excluded
Not identified by the Lenders IESC but species potentially requiring strategic CHA consideration, considering all commercial and non-commercial uses of the marine zone.
A coral species Porites lobata
Hard coral NE NE NT Excluded
Not identified by the Lenders IESC but species potentially requiring strategic CHA consideration, considering all commercial and non-commercial uses of the marine zone.
A coral species Stylophora pistillata
Hard coral NE NE NT Excluded
Not identified by the Lenders IESC but species potentially requiring strategic CHA consideration, considering all commercial and non-commercial uses of the marine zone.
A coral species Turbinaria mesenterena
Hard coral NE NE VU Excluded
Not identified by the Lenders IESC but species potentially requiring strategic CHA consideration, considering all commercial and non-commercial uses of the marine zone.
A coral species Turbinaria peltata
Hard coral NE NE VU Excluded
Not identified by the Lenders IESC but species potentially requiring strategic CHA consideration, considering all commercial and non-commercial uses of the marine zone.
Cabbage leather coral Sinularia brassica
Soft Coral NE NE NE Excluded
Not identified by the Lenders IESC but species potentially requiring strategic CHA consideration, considering all commercial and non-commercial uses of the marine zone.
Arabian cushion star Culcita coriacea
Marine Fauna NE NE NE Excluded
Not identified by the Lenders IESC but species potentially requiring strategic CHA consideration, considering all commercial and non-commercial uses of the marine zone.
Spiny cushion star Culcita schmideliana
Marine Fauna NE NE NE Excluded
Not identified by the Lenders IESC but species potentially requiring strategic CHA consideration, considering all commercial and non-commercial uses of the marine zone.
Indian Sea Star Marine Fauna NE NE NE Excluded Not identified by the Lenders IESC but species

32
Duqm Refinery Project WSP DRPIC Project No 70029220 Confidential
SPECIES FEATURE TYPE OMAN STATUS REGIONAL STATUS GLOBAL STATUS INCLUDED/ EXCLUDED
JUSTIFICATION FOR INCLUSION/ EXCLUSION
Fromia indica potentially requiring strategic CHA consideration, considering all commercial and non-commercial uses of the marine zone.
A starfish Linckia multifora
Marine Fauna NE NE NE Excluded
Not identified by the Lenders IESC but species potentially requiring strategic CHA consideration, considering all commercial and non-commercial uses of the marine zone.
Lollyfish Holothuria atra
Marine Fauna NE NE LC Excluded
Not identified by the Lenders IESC but species potentially requiring strategic CHA consideration, considering all commercial and non-commercial uses of the marine zone.
Tiger-tail sea cucumber Holothuria hilla
Marine Fauna NE NE LC Excluded
Not identified by the Lenders IESC but species potentially requiring strategic CHA consideration, considering all commercial and non-commercial uses of the marine zone.
White thread fish Holothuria leucospilota
Marine Fauna NE NE LC Excluded
Not identified by the Lenders IESC but species potentially requiring strategic CHA consideration, considering all commercial and non-commercial uses of the marine zone.
Macroalgae Nizamuddinia zanardinii
Macroalga NE NE NE Excluded
Not identified by the Lenders IESC but species potentially requiring strategic CHA consideration, considering all commercial and non-commercial uses of the marine zone.

3.2.4 ARABIAN Sea Humpback Whale
LIFE HISTORY AND ECOLOGY
The high primary productivity associated with the monsoon-driven upwelling in the Arabian Sea creates conditions suitable for feeding by large whales at latitudes more typically associated with breeding (Reeves et al. 1991; Mikhalev 1997; Papastavrou & Van Waerebeek 1997; Baldwin 2000). Whaling data and recent scientific research confirm that this includes a small and isolated subpopulation of humpback whales (Minton et al. 2008, Minton et al. 2011). Recent genetic analyses confirm that this subpopulation is significantly distinct from other humpback whale populations, and has been isolated for an estimated 70,000 years (Pomilla et al., 2014).
CONSERVATION STATUS
The IUCN Red list classifies Humpback whales globally as Least Concern. In the northern Indian Ocean (NIO), however, they are recognised by the IUCN Red List as geographically, demographically and genetically isolated (Minton et al. 2008) and are referred to as ‘Arabian Sea humpback whales’. This subpopulation is officially listed as ‘Endangered’ (Minton et al., 2008).
The global population abundance of humpback whales is currently undefined by IUCN status assessments (Reilly et al., 2008), but is estimated at over 80,000 individuals. The most recent assessment of the Arabian Sea population in Oman indicates a population of ASHWs of just 82 individuals (95% CI 60-111) and it has been speculated that this sub-population may be in decline (Minton et al., 2008).
Threats to whales in the region are well documented, and include accidental entanglement in fishing gear (Minton et al., 2011; Anderson, 2014; Sutaria et al., 2017; and Moazzam & Nawaz, 2017), ship strike and disturbance from underwater noise created by the shipping and transport industries, as well as coastal and offshore construction, seismic exploration and offshore oil and gas production (Baldwin et al., 2016b). Images of whales photo-identified in Oman between 2000 and 2003 demonstrate that 30-40% have scarring consistent with entanglement in fishing gear (Minton et al., 2011) and fishing effort, particularly that using gillnets, the gear known to cause the greatest risk to humpback whales (Johnson et al., 2005), is on the rise in Oman and many other parts of the region (Oman Department of Statistics, 2013; FAO, 2016; Anderson, 2014).
Globally, humpback whales are the cetacean species second most at risk from ship strike (Vanderlaan & Taggert, 2007). This is pertinent as the Arabian region hosts some of the busiest shipping lanes in the world. A threefold increase of container shipping traffic has been noted from the Arabian Sea between 2004 and 2014 (Willson et al., 2016b).
ASHWs may also be more susceptible to disease: nearly 70% of examined whales from Soviet whaling catches in the Arabian Sea in the 1960’s showed liver anomalies (Mikhalev, 2000b) and over 20% of examined whales from Oman displayed signs of Tattoo-like skin disease, with a significantly increasing trend between 2000 and 2011 (Van Bressem et al., 2014). This regionally resident population of whales may also be more vulnerable to climate change if shifts in oceanographic conditions affect productivity in their restricted Northern Indian Ocean range (Thomas et al., 2015).
The International Whaling Commission’s (IWC) Scientific Committee has repeatedly reiterated that this population is at great risk and requires significant collaborative conservation efforts to both prevent further decline and to promote recovery of the population (e.g. IWC, 2016b). Despite these designations and recommendations, conservation efforts to date have been minimal, piecemeal and lacking coordinated government support.

GLOBAL AND NATIONAL DISTRIBUTION
Humpback whales are found in all major oceans and noted as a cosmopolitan species (Clapham and Mead 1999) and are divided into separate management units by IUCN (also referred to as ‘stocks’ by the IWC).
The current known distribution of the ASHW includes the waters of Oman, Yemen, Iran, Pakistan and India with potential for occurrence in other states of the NIO region. Almost all data to date, however, has come from the results of research in Oman (Brown, 1957; Mikhalev, 2000; Minton et al. 2008; Reeves et al., 1991; Slijper et al., 1964; Wray and Martin, 1983; Yukhov, 1969; Baldwin 2003, and others).
Species distribution modelling and ecological niche modelling derived from Oman-based studies indicates a distribution around the periphery of the Arabian Sea with a core area along the central and southern coastline of Oman (Willson et al., 2017). Models were run using vessel based sightings data and satellite telemetry with the output of three separate model algorithms combined into an ‘ensemble model’ using environmental covariate data. The distribution models fit broadly with distribution of whale capture by Soviet whaling fleets between 1962 and 1966 (Figure 3-5) allowing for the fact that no information is available on the relativel effort spend whaling in different areas hence the catch density off the Pakistani coast may be biased. This information was reviewed by the IWC Scientific Committee in 2017 (IWC, 2017).
Figure 3-5: Average of sightings and satellite telemetry ensemble ecological niche models with overlay of historical takes of humpback whales in the Northern Indian Ocean between 1962 and 1966, (Mikhalev, 2000; IWC Catch Database, extracted 25 October 2013). (Source: Willson et al. 2017)
Vessel-based research surveys conducted in Oman since 2000, as well as the results of satellite telemetry studies (Willson et al 2017), demonstrate the Gulf of Masirah, to be one of the most important habitats yet identified for the ASHW. Minton (2011) reports humpback whale group sightings of 0.15/ hour for small vessel surveys in the Gulf of Masirah and 0.2/ hour from shore based

observations at Duqm during surveys conducted between 2000 and 2004. These are noted as the highest encounter rates of all study areas within Oman, with the other main high-density area being the Hallaniyats Bay (Dhofar region). Habitat modelling using Eigenvector Linear Models was performed on the same dataset (Corkeron et al., 2011) and resulted in the same conclusions. More recent analysis of vessel-based surveys conducted up to 2012 (Figure 3-6) continues to confirm the Gulf of Masirah as a critically important area (Willson et al. in prep).

Figure 3-6: Density plots of total vessel effort (a) vessel effort standard deviation (b) sum of ASHW sightings density (c) and standard deviation of sightings density (Source: Willson et al, in prep)
3.2.5

Satellite telemetry studies conducted in Oman between 2014 and 2016 to model the movements of ASHWs revealed migratory movements within a 1,150 km corridor between central Oman and Northern Yemen (n=9) (Willson et al, 2016). Whales in this study spent the majority of their time (72%) over shelf waters in depths of <200m.
Figure 3-7: Habitat utilization derived from counts of Static Space State Model (SSSM) locations within a hexagon grid network. Full extent of the study area defined by whale movement (upper panel; this should be A; cell size 25 km min. radius) and selected high-use areas (bottom plots ‘B’ and ‘C’; cell size 15 km min. radius). (Willson et al., 2016).
DISTRIBUTION WITHIN AREA OF INFLUENCE
Results of the 2014 to 2016 telemetry studies revealed that whales spent 35% of their time in the Gulf of Masirah (Willson et al. 2016) with the range included in this analysis determined by the extent of the area shown in

Figure 3-8. The results reveal that the 95% habitat range within the Gulf of Masirah is broadly distributed throughout the area, whilst the 50% range is found towards the north of the Gulf. Six satellite tags fitted with dive profile sensors revealed that whales spent 83% of their time within the top 20 m of the water column, with the most frequent dive duration lasting between 5-10 minutes (Willson et al. 2016).
Secondary analysis of the same data modelled using space state techniques for the specific purpose of the current report reveals that whales spent 54% of time within the defined CHAA between the months of November and July.
Figure 3-8: Kernel Density Estimate of ASHW habitat utilisation derived from Static Space State Model locations from satellite telemetry studies 2014-’16 within the Gulf of Masirah.
Ongoing vessel-based surveys in the area prioritise the collection of photographic data during encounters with humpback whales. Photographic records include the cataloguing of tail fluke and dorsal images together with location and behaviour data. Simultaneously genetic samples are taken that enable the same catalogue to match individual fluke and dorsal records with the sex derived from laboratory based DNA analysis. Recent review of the photographic database indicates that encounters have resulted in a total of 354 occasions where individual identifications could be made across study sites in Oman (Table 3.5).
Photographic records also reveal that over 52% of individuals registered in the database have been observed within the CHAA, thus making it the most important habitat within the known range of this endangered population (Willson et al. in prep).
Table 3.5: Occurrence of identified ASHWs within different study areas within Oman (Willson et al. in prep)
STUDY AREAS TOTAL NUMBER OF INDIVIDUAL
IDENTIFICATIONS NUMBER OF
INDIVIDUALS IDENTIFIED OVERALL PERCENTAGE OF INDIVIDUALS
IDENTIFIED WITHIN EACH STUDY AREA
Azaiba 1 1 0.6

STUDY AREAS TOTAL NUMBER OF INDIVIDUAL
IDENTIFICATIONS NUMBER OF
INDIVIDUALS IDENTIFIED OVERALL PERCENTAGE OF INDIVIDUALS
IDENTIFIED WITHIN EACH STUDY AREA
Duqm 3 3 1.7
Duqm Port 2 2 1.2
Gulf of Masirah 117 75 43.6
Hadbin 3 2 1.2
Hallaniyats 35 26 15.1
Hasik 144 39 22.7
Likbe 3 3 1.7
Masirah 14 11 6.4
Mirbat 5 5 2.9
Muscat Area 1 1 0.6
Sadh 2 2 1.2
Salalah 4 2 1.2
Grand Total 334 172 100
The foraging ecology of the ASHW remains poorly understood, and is of interest given the population’s unique regional status (Minton et al., 2008; Pomilla Amaral et al. 2014). Minton (2011) and Reeves (1991) hypothesised that energy requirements within the Arabian Sea may be met by increased productivity generated by nutrient rich upwelling water off the southern Arabian Peninsula during the summer monsoon period.
Sardines and euphasiids were found in the stomachs of whales examined in the Soviet catch (n=85) (Mikhalev, 1997). Both of these prey items occupy different habitats. Sardine species found in Oman predominantly feed on phytoplankton (Randal, 1995). Piontkovski (2014) identified monthly fluctuations in sardine landings associated with remotely sensed chlorophyll-a concentration from MODIS-Aqua and SeaWIFS archives off the northern coast of Oman. Spatial distribution modelling of ASHW revealed that net primary productivity was the strongest environmental co-variate associated with distribution, with primary productivity a noted feature of the Gulf of Masirah (Willson et al. 2017).
High densities of euphausids (shrimp-like krill) are typically associated with proximity to shelf edge (Harris et al. 2014). Dive behaviour of whales off Masirah Island bordering on the eastern extent of the CHAA has indicated repeated dives over 200m (Figure 3.9) and of equivalent depth to where high densities of myctophids (lantern fish) have been detected. The historical whaling records and evidence from telemetry work suggest behavioural plasticity in foraging strategies between coastal and offshore waters (Willson et al. 2016).

Figure 3.9: Best Daily Locations (BDL) of telemetry plots combined with maximum depths for each day (Source: Willson et al. 2016)
Of a total of 162 sightings within the CHAA the Oman Cetacean Database (OMCD) describes 11 encounters where feeding has been observed (OMCD 2016). These are defined by events during which surface lunge feeding is visible. It is possible that feeding behaviour often goes undetected given that dive profile information (recorded by satellite telemetry units) shows that dive duration of whales ranges between 2 – 35 minutes, with the most frequent average dive duration for all animals lasting between 5 to 10 minutes (Willson et al., 2016).
There are various lines of evidence to indicate that the Gulf of Masirah is important during the reproduction process of ASHW. Mating has not been directly observed anywhere in Oman. However, the breeding season for the ASHW population is estimated to commence in January, peak in March and end in late May based on inspection of foetus development during Soviet whaling activities (Mikhalev, 1997). A combined genetics and photographic study programme (Minton et al., 2011) has demonstrated that the Gulf of Masirah has an equal ratio of sightings of males and females over the winter/ spring period in contrast to male dominated ratios recorded elsewhere in Oman, thus providing the opportunity for mating to take place. Mating is also likely to be associated with locations where male humpback song is detected. Deployment of bottom mounted passive acoustic monitoring units

between 2012 and 2013 revealed the presence humpback whale song in the Gulf of Masirah from early December through to late June (Cerchio et al. 2016).
As with mating, calving of ASHW has not been directly observed. The Oman Cetacean Database (OMCD) reveals that 27% (n=37) of individuals that have been observed and biopsied in the Gulf of Masirah have been females, (39%= male and 33% unknown) (OMCD 2016). Based on the occurrence of adult females in the area during the breeding and calving season it is hypothesised that these are either recently pregnant or in late pregnancy stages. Further interrogation of sightings data in the OMCD reveals that mother-calf pairs have been observed on 15 separate occasions in Oman waters. Seven of these occurred within the boundary of the CHAA, and specifically within the Gulf of Masirah, indicating that the area has ecological function as nursery habitat (OMCD 2016). On one occasion, in March 2012, a mother-calf pair is known to have entered the confines of the Port of Duqm port basin (Port of Duqm Company in lit. to R. Baldwin. March 2012).
Plates 1 and 2: Mother and calf humpback sighted within the Duqm port basin in March 2012 (source: Port of Duqm Company).
KNOWLEDGE GAPS
Detailed information on the ASHW is available as a result of systematic study conducted since 2000 (e.g. Baldwin 2000; Minton et al 2008; Willson et al. 2017; ESO and MECA unpubl. Data; and others). These studies have also revealed information about threats. Still relatively little is known about breeding and feeding behaviours and habitats, and there remain gaps in knowledge of distribution and seasonality of movements. The recent EIAs in the Duqm area have provided little new information. The gaps in our knowledge hinder definition of thorough and comprehensive mitigation and management measures.
CONCLUSIONS AND JUSTIFICATION FOR TIER SELECTION
IFC’s PS6 defines critical habitat as areas of high biodiversity value that satisfy one or more of five Critical Habitat Criteria. PS6 also defines gradients of critical habitat based on the vulnerability and irreplaceability of the site. For the first three criteria numerical thresholds are used to assign a Tier 1 or Tier 2 critical habitat designation. For ASHWs, three of the five critical habitat criteria are relevant (Criteria 1, 2 and 3) the first of which meets the Tier 1 level designation, whist the second and third meet the Tier 2 level designation, as described below:
Criterion 1: Critically Endangered (CR) or Endangered (EN) Species. The CHAA is a centre for distribution of the Endangered ASHW. Tier 1 criterion (a) is met because the habitat sustains more than 10% of the global population of the ‘species’, the later termed a discrete ‘subpopulation’ in this case.

Criterion 2: Endemic/Restricted Range Species. Tier 2 is assigned in this case as the AoI is known to sustain more than 1%, but less than 95%, of the global population of this restricted range species.
Criterion 3: Migratory/ Congregatory Species. The assignation of Tier 2 in this case relates to the CHAA sustaining, on a cyclical or otherwise basis, more than 1%, but less than 95%, of the global population of this migratory species.
Based on these conclusions, there is a requirement to adhere to paragraphs 17-19 of PS6, which includes reference to study of alternative sites, assessment of impacts on the biodiversity values for which the critical habitat was designated, a robust monitoring programme and a mitigation strategy within the context of a Biodiversity Action Plan, including identification of biodiversity offsets if required. Such plans require advance preparation in considerable detail in order to assess whether the necessary requirements can be satisfied for a species meeting the Tier 1 critical habitat designation.
3.2.6 Indian ocean humpback dolphin
LIFE HISTORY AND ECOLOGY
Indian Ocean humpback dolphins are usually seen within a narrow strip of shallow near-shore waters (Ross et al. 1994, Jefferson and Karczmarski 2001), seldom in water deeper than 20-30 m (Karczmarski et al. 2000). Seasonality of occurrence, movements, group sizes, and reproduction has been reported in several studies (e.g. Durham 1994, Karczmarski et al. 1999a, 1999b, Guissamulo 2007). The dolphins appear to be selective in their habitat choice (e.g. Karczmarski et al. 2000; Stensland et al. 2006). Dependence on shallow-water habitats as feeding grounds is often evident throughout the year (Karczmarski and Cockcroft 1999; Karczmarski et al. 2000), although the details of the preferred key habitats may differ between groups and locations (Jefferson and Karczmarski 2001; Atkins et al. 2004; Stensland et al. 2006).
In Oman, identification of fish otoliths (inner ear bones) taken from the stomach contents of this species from the Gulf of Masirah (Ponnampalam et al., 2012) reveals prey to often include fishes of the family Sciaenidae (drums and croakers), demersal species associated with shallow rocky, sand and mud substrate. Similar studies from the south of Oman have also revealed a high incidence of cephalapods and crustaceans in the diet (Baldwin et al., 2004).
Little is known about the life history of this species. Studies in South Africa suggest gestation is 10-12 months (Cockcroft, 1989), with mother-calf association continuing for three to four years (Karczmarski et al., 1999). In Oman, social and/or mating behaviour has been observed in the months of April and May, and the presence of calves has been recorded in April through June, and in October through December (Baldwin et al. 2004).
CONSERVATION STATUS
Humpback dolphins found within the Indian Ocean have recently been taxonomically separated are and now considered a separate species distinct from the Indo-Pacific humpbacked dolphin ((Jefferson and Rosenbaum, 2014). This status has not yet been formally incorporated by the IUCN Red List. However, the conservation status of this species has been reviewed using the Red List criteria in recognition of diminishing abundance and degradation of habitat throughout much of the Indian Ocean (Braulik et al 2016). This recent assessment considers the species to be Endangered (Braulik et al. 2016) based on an estimated decline of at least 50% across its range over three generations.
Abundance estimates exist for South Africa and Southwest Indian Ocean, but no-where else within the range. All those that have been quantitatively evaluated have been small in size, always less than 500 and usually fewer than 200, and the evidence suggests that the species is not abundant anywhere within its range (Braulik et al. 2015).

The nearshore distribution of this species puts it within range of artisanal fisheries with gill nets posing a high risk of bycatch. Within Oman a high incidence of beach cast specimens results from interactions with fisheries (Collins et al. 2002). Loss of nearshore habitats due to coastal development is also a noted feature of the Arabian region in general (Baldwin et al. 2004), with dredging, land reclamation, construction blasting, port and harbour construction, vessel traffic, oil and gas exploration related activities, and other activities, all occurring in humpback dolphin habitat (IWC, 2002). Range wide mortality from bycatch alone is several orders beyond the limit for a sustainable population and leads experts to conclude the species is almost certainly decreasing (Friedmann and Daly, 2004; Reeves et al., 2008).
GLOBAL AND NATIONAL DISTRIBUTION
Indian Ocean humpback dolphins occur along the western periphery of the Indian Ocean from False Bay in South Africa in the south west of the range through to the most southern tip of India in the north west of the range (
Figure 3.10). Distribution covers south and east Africa, the Middle East and South Asia with this range including the west coast of Madagascar, Red Sea, Arabian Sea and Arabian Gulf. The level of knowledge is greatest in the South West Indian Ocean, South Africa and Oman (Braulik et al. 2015). Existence of pockets of suitable habitat, local extirpation and range reductions are most likely the key factors accounting for their disjunct distribution (IWC, 2002). Within the western Indian Ocean genetic data suggests significant population segregation between Oman, Zanzibar and South Africa that is correlated with large scale oceanographic regimes.

Figure 3.10: The assumed distribution of the Indian Ocean humpback dolphin (Sousa plumbea). (Source: Braulik et al. 2016).
Indian Ocean humpback dolphins are one of the most commonly encountered cetacean species in Oman, and its distribution, while seemingly absent from the Gulf of Oman, appears to be continuous along the Arabian Sea coast of the Sultanate (Salm et al. 1993; Baldwin & Salm 1994; Baldwin et al. 2004; Minton 2004).
Humpback dolphins are known for their narrow habitat preference. Results of surveys in 2000-2003 in Oman confirmed that sighting rates for this species increase with proximity to the shore (Minton et al., 2011). Although usually found in water depths of 20m or less, this species has been sighted in Oman in water depths greater than 40m in certain, restricted locations (Baldwin et al. 2004). The migration and movements of animals in Oman have not yet been studied, but elsewhere in its range S. plumbea populations are apparently comprised of long-term residents that show a limited home range, in the order of tens to hundreds of kilometres (Guissamulo and Cockroft, 2004; Karczmarski et al., 1999; Keith et al., 2002; Parsons, 1998).
Very strong population structure has been defined from genetic study of this species in Oman, including animals sampled from the Gulf of Masirah (Mendez et al., 2013). The study also showed that the population sampled in Oman has the highest genetic diversity in the Western Indian Ocean region (Mendez et al., 2011).
DISTRIBUTION WITHIN CHAA
A total of 40 sightings of humpback dolphins have been recorded from incidental and dedicated sightings from vessel surveys between 1986 and 2006 within the AoI. Group sizes range between one and one hundred individuals (OMCD 2016). Most sightings (n=22) were of groups of 10 animals or

less, with 16 sightings of between 11 and 50 individuals and two sightings made up of group numbers between 60 and 100 animals (OMCD).
Within the Gulf of Masirah, Indian Ocean humpback dolphins have been sighted off the west coast of Masirah, Bar al Hikman, the Ghabbhat Hashish and in several locations between Ras bin Tawt and Ras Madrakah, including around the Port of Duqm (OMCD). This indicates a near continuous coastal distribution in the area (Figure 3-11). Frequent year round sightings have been made from shore-based observations from Duqm south to Ras Markaz. A key habitat identified in 2002 was the northern part of Duqm bay (now the central location of the port itself) (Minton, 2004).
Based on the fact that Indian Ocean humpback dolphins typically exhibit limited home ranges (Baldwin 2003) it can be inferred that all ecological requirements for the species are likely to be available within the CHAA.

Figure 3-11: Distribution of Indian Ocean humpback dolphin based on sightings and strandings records
KNOWLEDGE GAPS
There is very little information available on the Indian Ocean humpback dolphin. Most of the information is dated and little of it is detailed. No dedicated study of this species has been conducted in Oman and most records are therefore incidental. The gaps in our knowledge hinder definition of thorough and comprehensive mitigation and management measures.
CONCLUSIONS AND JUSTIFICATION FOR TIER SELECTION
IFC’s Performance Standard 6 defines critical habitat as areas of high biodiversity value that satisfy one or more of five Critical Habitat Criteria. PS6 also defines gradients of critical habitat based on the vulnerability and irreplaceability of the site. For the first three criteria numerical thresholds are used to assign a Tier 1 or Tier 2 critical habitat designation. For Indian Ocean humpback dolphin, two of the five critical habitat criteria are relevant (Criteria 1 and 2), both of which meet the Tier 2 level designation, as described below:
Criterion 1: Critically Endangered (CR) or Endangered (EN) Species. The AoI is known to be populated by the Endangered Indian Ocean humpback dolphin. Tier 2 criterion (c) is met because the habitat supports regular occurrence of one or more individuals.
Criterion 2: Endemic/Restricted Range Species. Tier 2 (b) is assigned in this case as the CHAA is considered to sustain more than 1%, but less than 95%, of the global population of this restricted range species.
Based on these conclusions, there is a requirement to adhere to paragraphs 17-19 of PS6, which includes amongst other requirements includes reference to the assessment of impacts on the biodiversity values for which the critical habitat was designated, a robust monitoring programme and a mitigation strategy within the context of a Biodiversity Action Plan, including identification of biodiversity offsets, if required.
3.2.7 Hawksbill turtle
LIFE HISTORY AND ECOLOGY
Hawksbill turtles mature very slowly, taking 20 to 40 years, and so are long-lived (Chaloupka and Musick 1997). Age to maturity in the Indo-Pacific is at the upper end of this scale, requiring a minimum of 30-35 years (Limpus 1992; Limpus and Miller 2000; Mortimer et al. 2002, 2003). This makes populations more sensitive to potential decline as juveniles face the threat of mortality for many years before they are able to reproduce. Once mature, active nesting by females continues over a period of at least 17-20 years in the Indo-Pacific (Mortimer and Bresson 1999; Limpus 1992). Data specific to Oman on this topic are not available.
Hawksbills nest on insular (island) and mainland sandy beaches throughout the tropics and subtropics. They are highly migratory and use a wide range of broadly separated localities and habitats during their lifetimes (for review see Witzell 1983). Available data indicate that newly emerged hatchlings enter the sea and are carried by offshore currents into major gyre systems where they remain until reaching a carapace length of some 20 to 30 cm. At that point they recruit into a neritic (coastal) developmental foraging habitat that may comprise coral reefs or other hard bottom habitats, sea grass, algal beds, such as that found in the Gulf of Masirah.
Once sexually mature, hawksbills undertake breeding migrations between foraging grounds and breeding areas at intervals of several years (Witzell 1983, Dobbs et al. 1999, Mortimer and Bresson 1999). In Oman these migrations are known to have both a local component (e.g. nesting on Masirah Island and feeding in the Gulf of Masirah) and a wider, national component (e.g. nesting at the Daymaniyat Islands and, again, foraging in the Gulf of Masirah) as demonstrated by satellite tracking studies.
Global population genetic studies have demonstrated the tendency of female sea turtles to return to breed at their natal rookery (Bowen and Karl 1997), even though as juveniles they may have foraged at developmental habitats located hundreds or thousands of kilometers from the natal beach. While hawksbills undertake long migrations, some portion of immature animals may settle into foraging habitats near their beaches of origin (Bowen et al. 2007). In Oman, all adult females tagged to date have remained in Omani waters, often using the Gulf of Masirah for foraging as described above.
Hawksbills are known to be important components of healthy coral reef ecosystems and are primarily omnivorous in the Indo-Pacific (Bjorndal and Jackson 2003). In Oman they are thought to consume a combination of forage including sponges, soft corals and other benthic reef organisms (Salm 1991).
CONSERVATION STATUS
The global status of hawksbill turtles, as listed by the IUCN Red List is Critically Endangered, reflecting a low population size in decline (Mortimer and Donnelly, 2008). With respect to IFC GN6 guidance document, this means that it is facing an extremely high risk of extinction in the wild. It is the highest risk category assigned by the IUCN Red List for wild species.
Analysis of historic and recent published and unpublished global accounts indicate extensive subpopulation declines of hawksbill turtles in all major ocean basins over the last three generations as a result of over-exploitation of adult females and eggs at nesting beaches, degradation of nesting habitats, take of juveniles and adults in foraging areas, incidental bycatch mortality relating to fisheries, and degradation of marine habitats (Mortimer and Donnelly, 2008). Today, some protected populations are stable or increasing, but the overall decline of the species, when considered over a period of three generations, has been in excess of 80%. The greatest decline has occurred in the Indian Ocean, where a decline of 93.8% over the past three generations has been calculated (Mortimer and Donnelly, 2008).
Almost all of the threats described above apply in Oman, where degradation of nesting habitat due to coastal development and incidental mortality as a result of fisheries are thought to be the most important impacts (Pilcher et al., 2014). The hawksbill turtle population of Oman has been recognised as a globally significant population of high conservation priority (IUCN 1991). Oman is one of few countries in the world that still has large populations of turtles (Baldwin, 1999). However, the current status, and trend, of hawksbill turtle populations in Oman is not known. Indeed, such figures are available only for the loggerhead turtle (see below) which reveal a significant and very substantial decline (over 70%) in the nesting female population over the past three decades.
GLOBAL AND NATIONAL DISTRIBUTION
The hawksbill turtle has a circumglobal distribution throughout tropical and, to a lesser extent, subtropical waters of the Atlantic Ocean, Indian Ocean, and Pacific Ocean. Hawksbills are migratory and individuals undertake complex movements through geographically disparate habitats during their lifetimes. Hawksbill nesting occurs in at least 70 countries, although much of it now only at low densities. Their movements within the marine environment are less understood, but hawksbills are believed to inhabit coastal waters in more than 108 countries (Groombridge and Luxmoore 1989, Baillie and Groombridge 1996).
In Oman, hawksbills nest on beaches in Musandam in the very north, to as far south as Dhofar, though nesting here is in very low numbers. The main concentrations of nesting females occur at the Daymaniyat Islands, where between 250-350 females nest annually (making this small site one of the densest nesting locations by this species in the world) (Salm 1991; Baldwin 1999), and at Masirah Island, where upwards of 125 females nest annually (Ross and Barwani 1982). Other key nesting sites include the Muscat area around Bandar Jissah and Bandar Khayran and in the Gulf of Masirah at Bar al Hikman and between Ras bin Tawt and Ras Madrakah (IUCN, 1991). Nesting peaks in April-May (Baldwin 1999) but at hawksbills have been recorded nesting year round at some locations in Oman (MECA unpubl. data).

Foraging largely occurs in the Gulf of Masirah (Pilcher et al. 2014), but has been observed in other parts of Oman, such as around reefs off Muscat to the north (Salm and Salm 1991).

DISTRIBUTION WITHIN CHAA
As described above, hawksbills nest at Masirah Island and in the Gulf of Masirah at Bar al Hikman and between Ras bin Tawt and Ras Madrakah (IUCN, 1991) (

Figure 3-12). Nesting is still known at all of these sites (ESO unpubl. data) and was recorded during the EIA studies for Duqm Refinery Project and some of the Associated Facilities. Nesting occurs at many different types of beaches in the CHAA, including pocket beaches in bays and along open shoreline. Nesting is disparate and not enough intensive, long-term study has been conducted to determine all nesting locations or the seasonality of nesting. It is interesting to note, however, that in at least two locations in Oman where continuous monitoring has been undertaken for multiple years (Daymaniyat Islands and Bar al Jissah) nesting has been found to occur year round, every year (MECA unpubl. data).
At Masirah, the numbers of nesting females appears to have remained similar to that recorded in the late 1970s, although the population trend is impossible to verify without long-term monitoring as there is a very high inter-annual variation in nesting (ESO unpubl. data). It is possible, however, that Masirah Island is more important to nesting hawksbills than has previously been thought; an estimated 405 females nested there in 2016 (ESO unpubl. data).
Hawksbills also use the Gulf of Masirah as a foraging habitat. This part of Oman appears to be favoured for foraging by hawksbills that nest both nearby (e.g. at Masirah Island) and further away (e.g. Daymaniyat Islands) as revealed by results of satellite tracking.
Satellite telemetry studies were undertaken on a total of 27 hawksbills between 2010 and 2013, with 15 turtles tagged from the Daymaniyat Islands (to the north of Muscat) and 12 turtles from Masirah

Island (Pilcher et al., 2014). Plotted locations of final foraging areas are shown in
Figure 3-12. Analysis of density based on best daily location point data per individual turtle per day revealed that 12 of the turtles from Daymaniyat Islands and 12 from Masirah Island passed into the

Gulf of Masirah post nesting. The data also show that there is activity in this area year-round. Core habitats were noted from the southern tip of Masirah (in close proximity to nesting areas) and in the reef shallows of Bar al Hikman and Sif-bu-Sifa offshore reefs northeast of Duqm. All individuals demonstrated high site fidelity over foraging grounds.

Figure 3-12: Distribution of hawksbill turtles including nesting locations and post-nesting migrations obtained using satellite telemetry studies

Migratory routes to and from other breeding and foraging areas are likely to cross many parts of the CHAA and hatchlings and juveniles can be expected to disperse widely throughout the area from widely separated nesting sites.
KNOWLEDGE GAPS
Relatively little is known about hawksbill turtles in the CHAA and in Oman in general. Most information comes from studies conducted around Masirah Island, Daymaniyat Islands and the Muscat area and is limited to basic monitoring data of nesting turtles only (MECA and ESO unpubl. data.). The recent EIAs in the Duqm area have provided some new information, but this is limited to records of nesting inferred from tracks on beaches. The only other recent available data is from satellite tracking studies (Pilcher et al. 2014) which provides some insight into migratory routes and foraging habitats for a small sample of the population. All other data, largely limited to nesting records, is over 20 years old. Current knowledge gaps hinder definition of thorough and comprehensive mitigation and management strategy for this species.
CONCLUSIONS AND JUSTIFICATION FOR TIER SELECTION
IFC’s Performance Standard 6 defines critical habitat as areas of high biodiversity value that satisfy one or more of five Critical Habitat Criteria. PS6 also defines gradients of critical habitat based on the vulnerability and irreplaceability of the site. For the first three criteria numerical thresholds are used to assign a Tier 1 or Tier 2 critical habitat designation. For hawksbill turtles, two of the five Critical Habitat Criteria are relevant (Criteria 1 and 3) both of which meet the Tier 2 level designation, as described below:
Criterion 1: Critically Endangered (CR) or Endangered (EN) Species. The CHAA contains breeding and foraging habitat used by the Critically Endangered hawksbill turtle. Tier 2 criterion (c) is met because the habitat supports the regular occurrence of one or more individuals of this CR species.
Criterion 3: Migratory/Congregatory species. The assignation of Tier 2 in this case relates to the CHAA sustaining, on a cyclical or otherwise basis, more than 1% of the global population of this migratory species.
3.2.8 Loggerhead Turtle
LIFE HISTORY AND ECOLOGY
The loggerhead turtle (Caretta caretta) nests on insular and mainland sandy beaches throughout the temperate and subtropical regions worldwide. Like most turtles, loggerheads are highly migratory and use a wide range of broadly separated localities and habitats during their lifetimes (Bolten and Witherington 2003). Upon leaving the nesting beach, hatchlings begin an oceanic phase in major current systems (gyres) that serve as open-ocean developmental grounds (Bolten and Witherington 2003; Putman and Mansfield, 2015). After 4-19 years in the oceanic zone, loggerheads recruit to neritic developmental areas rich in benthic prey or epipelagic prey where they forage and grow until maturity at 10–39 years (Avens and Snover, 2013). In Oman, on reaching sexual maturity loggerhead turtles undertake breeding migrations between foraging grounds (distributed throughout the region, but centered off Oman and Yemen), and nesting areas, primarily at Masirah Island. Remigration intervals of loggerhead turtles are of one to several years with a mean of 2.5–3 years for females (Schroeder et al., 2003) while males would have a shorter remigration interval (e.g., Hays et al. 2010, Wibbels et al., 1990). On Masirah Island, females nest on average 5.5 times per year (Tucker et al. 2013). Migrations are carried out by both males and females and may traverse oceanic zones spanning hundreds to thousands of kilometres (Plotkin 2003). During non-breeding periods adults reside at coastal neritic feeding areas that sometimes coincide with juvenile developmental habitats (Bolten and Witherington, 2003).

CONSERVATION STATUS
The loggerhead turtle is considered globally as Vulnerable under current IUCN Red List Criteria (criterion A2b). However, it is recognised that the loggerhead turtle comprises 10 subpopulations that vary widely in population size, geographic range, and population trends, and are the appropriate units for assessment of global conservation status for this species (Wallace et al., 2010, 2011). Each of these 10 subpopulations have been formally assessed and given their own status listing. The IUCN Red List specifically states the following:
“the global listing is not an appropriate representation of the conservation status of the biologically relevant subpopulations that make up the global Loggerhead Turtle population. Subpopulation assessments demonstrated wide variation not only in status of individual subpopulations (as indicated by IUCN Red List Categories), but also in the criteria under which the individual subpopulations qualified for a threatened category. For these reasons, the subpopulation-level assessments for the Loggerhead Turtle should be given priority in evaluating the true global conservation status of this species.” (Casale, 2015).
One of the 10 subpopulations is the Northwest Indian Ocean loggerhead turtle subpopulation which nests in Oman and Yemen. Genetic markers indicate that this subpopulation represents a distinct subpopulation or regional management unit (Shamblin et al., 2014, Wallace et al. 2010). The Masirah island stock probably represents over 90% of the subpopulation and has experienced a massive decline in the past few decades, which has recently accelerated. Based largely on this, the Northwest Indian Ocean loggerhead turtle subpopulation qualifies for the category Critically Endangered according to IUCN Red List criterion A4, sub-criterion (b). According to the IFC GN6 guidance document, this means that it is facing an extremely high risk of extinction in the wild. It is the highest risk category assigned by the IUCN Red List for wild species.
Threats to loggerhead turtles in the CHAA and in Oman in general have been documented (ESO unpubl. report to MECA) and are summarised below.
Threats in the beach environment:
Light pollution;
Coastal construction;
Vehicle traffic;
Fisheries activities on beaches;
Harvest of eggs;
Beach recreation;
Beach pollution (including that from oil spill);
Overgrazing;
Vegetation removal/planting;
Erosion;
Sand mining and beach nourishment;
Predation; and
Climate change.
Threats in the marine environment:
Fisheries bycatch;
Habitat degradation by fisheries;

Harvest of adult sea turtles;
Pollution at sea (including that from oil spill);
Vessel collision;
Dredging and other marine construction works;
Disease/pathogens; and
Changes in trophic dynamics.
The impacts of fisheries activities on loggerheads have been a more recent focus of study at Masirah Island and the Gulf of Masirah (Willson et al., 2015). This involved telemetry studies combined with mapping of fisheries effort to reveal co-occurrence as well as interviews with fishermen. The results revealed a preliminary estimate of 1,640-1,770 loggerheads bycaught every year in the skiff gill net fishery alone. The bycatch from dhow fisheries is not known, but currently under study (ESO, unpublished data), and is likely to be higher given the increased effort, endurance and range of this fleet.
GLOBAL AND NATIONAL DISTRIBUTION
The loggerhead turtle is globally distributed throughout the subtropical and temperate regions of the Mediterranean Sea and Pacific, Indian, and Atlantic Oceans (Wallace et al. 2010). Within its range, 10 different genetic stocks are recognised including those in: North West Atlantic Ocean, North East Atlantic Ocean, South West Atlantic Ocean, Mediterranean Sea, North East Indian Ocean, North West Indian Ocean, South East Indian Ocean, South West Indian Ocean, North Pacific Ocean, and South Pacific Ocean. The IUCN Red List evaluation notes the global population size is unknown although estimates the number of females nesting annually is between 36,000 and 67,000 (Casale et al, 2015). In Oman, loggerhead turtles are widely distributed, having been documented from Musandam, in the far north to the Oman/Yemen border in the south (Salm, 1991; Baldwin, 1999). The centre of their distribution, however, is around Masirah Island and in the Gulf of Masirah. Over 90% of females (approx. 10,000-14,000 individuals annually (Wilson et al., 2015)) nest in this location, with much smaller numbers nesting primarily at the Hallaniyat Islands and mainland Dhofar. Foraging habits and locations of loggerhead turtles are not well known, but telemetry studies (ESO unpubl. data) reveal that adult females range mostly within Omani and Yemeni waters (Figure 13-3), spending most of their time in deep, offshore waters. However, significant amounts of time are also spent migrating along shorelines, including through the CHAA. Juvenile loggerhead turtles from Oman have been documented as far afield as La Reunion and Western Australia, indicating that hatchling dispersal and juvenile ranging are much more extensive than during the adult phase (ESO unpubl. data).
DISTRIBUTION WITHIN CHAA
At least 40% of global loggerhead turtle nesting activity was previously thought to occur on Masirah Island (Environment Society of Oman (ESO), unpublished data). Initial surveys conducted from 1978 (Ross and Barwani, 1982) estimated 30,000 or more female loggerheads nesting at Masirah island. A comparison of equivalent historical and recent nesting trend data of index beaches at Masirah Island indicates current nesting is now at one third (10-14,000 females annually) of the original number estimated in the 1970’s and 1980’s (Witherington et al., 2015). Marginal loggerhead nesting habitat is also known to occur between Ras Madrakah and Ras bin Tawt with estimates of 100 nests/year reported by Salm (1991). With a global estimate from 36- 67,000 nesting females and Masirah estimate at 10-14,000 it is estimated that 15 - 38% of the global population of adult females nest on the island and the same proportion of males and females originate from this rookery. Nesting by loggerhead turtles at Masirah mostly occurs between the end of April and beginning of September with a peak in the first two weeks of June (Willson et al., 2015). The incubation period of 6-8 weeks implies that hatchlings will disperse to sea between June and November, which coincides

with south west monsoon currents that will take them in a northeasterly direction, away from the Gulf of Masirah. Movements of adult females in the inter-nesting and post-nesting periods is described from a satellite telemetry study conducted on Masirah Island where 44 turtles were instrumented between 2006 and 2012 (Willson et al., 2015). The full regional extent of turtle movements post nesting is shown in
Figure 3-13, with turtles distributing as far as the Arabian Gulf and Red Sea, whilst the predominant area of post migration movement is to the Gulf of Aden between Yemen, Oman and Socotra.

Figure 3-13: Adult female loggerhead turtle distribution based on telemetry studies conducted between 2006 and 2012 (ESO unpubl. data)
The results also reveal high density use of habitat within the CHAA (Figure 3-14). The results are temporally biased: they only show movements of those animals that have already arrived on the island (tagged on their first nesting event of the season), and exclude movements prior to the beginning of the season. Furthermore, females were only tagged from the north end of the island. Movement towards Masirah Island by females able to breed should be expected to occur at least two months prior to April, and is likely to include passage through the Gulf of Masirah from foraging grounds to the south. Females leave the island between July and September and head south. This route predominantly takes them along the eastern fringe of the Gulf of Masirah.

Figure 3-14: Kernel density plots of best daily locations from telemetry studies, showing monthly distribution of adult female loggerhead turtles in the CHAA between 2006 and 2012 (ESO unpubl. data)
Habitat utilisation by this species is understood to be predominantly seasonal based on results of telemetry data. This is expected to relate to turtles transiting through the area on migration to and from nesting at Masirah Island (Willson et al., 2015). Although an important migration route, the Gulf of Masirah is not expected to be an important foraging destination for adult female turtles based on these results. However, the occurrence of male turtles or sub-adults in the area is not well known, due to a lack of study on these population segments.

Overall distribution of loggerheads in the CHAA is depicted in
Figure 3-15 below.

Figure 3-15: Distribution of loggerhead turtles in the CHAA including nesting locations and post-nesting migrations obtained using satellite telemetry studies.

KNOWLEDGE GAPS
Detailed study of the Masirah Island nesting population of loggerhead turtles is available as a result of systematic study conducted since 2006 (Casale, 2015; Willson et al., 2015; ESO and MECA unpubl. data). Much less is known about foraging habitat except for that generated during investigation of post-nesting migrations of adult female loggerheads during satellite tracking studies (Casale 2015; Willson et al. 2015; ESO and MECA unpubl. data). These studies have also revealed information about threats to loggerhead turtles, although this knowledge is largely confined to Masirah Island. Almost nothing is known about the pre--adult life history stage of loggerhead turtles or about males. The EIAs in the Duqm area have provided no new information. All other data on loggerhead turtles (which is limited) comes mostly from IUCN Coastal Zone Management studies conducted in the late 1980s/early 1990s (Salm 1991). Knowledge gaps are a constraint on definition of a thorough and comprehensive mitigation and management strategy for this species.
CONCLUSIONS AND JUSTIFICATION FOR TIER SELECTION
IFC’s PS6 defines critical habitat as areas of high biodiversity value that satisfy one or more of five Critical Habitat Criteria. PS6 also defines gradients of critical habitat based on the vulnerability and irreplaceability of the site. For the first three criteria numerical thresholds are used to assign a Tier 1 or Tier 2 critical habitat designation. For loggerhead turtles, two of the five Critical Habitat Criteria are relevant (Criteria 1 and 3) the first of which meets the Tier 1 level designation, whist the second meets the Tier 2 level designation, as described below:
Criterion 1: Critically Endangered (CR) or Endangered (EN) Species. The CHAA contains breeding and foraging habitat used by the Critically Endangered loggerhead turtle. Tier 1 criterion (a) is met because the habitat sustains more than 10% of the global population of the species, and 90% of the relevant regional management unit/subpopulation (North West Indian Ocean subpopulation), which is Critically Endangered.
Criterion 3: Migratory/Congregatory species. The assignation of Tier 2 in this case relates to the CHAA sustaining, on a cyclical or otherwise basis, more than 1%, but less than 95%, of the global population of this migratory species.
Based on these conclusions, there is a requirement to adhere to paragraphs 17-19 of PS6, which includes reference to assessment of impacts on the biodiversity values for which the critical habitat was designated, a robust monitoring programme and a mitigation strategy within the context of a Biodiversity Action Plan, including identification of biodiversity offsets if required. Recommendations for formulation of such a Biodiversity Action Plan are provided under ‘Strategic Recommendations’ in Section 4. It is key to note that these requirements sit beyond the sphere of direct Project control and impacts driving this requirement are only partly related to the Project.
It should, however, be noted that the AF influence on loggerhead turtle nesting sites is largely limited to crude oil spill, which under worst case modelled scenarios would reach nesting beaches to the south of Ras Markaz. This should be taken into consideration when evaluating the implications of the CHA and in defining mitigation and/or offset action.
3.2.9 Green Turtle
LIFE HISTORY AND ECOLOGY
Green turtles are among the most highly migratory of all the turtles and use a wide range of broadly separated localities and habitats during their lifetimes (for review see Hirth, 1997). Upon leaving the nesting beach, it has been hypothesized that hatchlings begin an oceanic phase (Carr 1987), perhaps floating passively in major current systems (gyres) that serve as open-ocean developmental grounds (Carr and Meylan, 1980; and Witham, 1991). After a number of years in the oceanic zone, these turtles recruit to neritic developmental areas rich in seagrass and/or marine algae where they forage and grow until maturity (Musick and Limpus, 1997). Upon attaining sexual maturity green turtles

commence breeding migrations between foraging grounds and nesting areas that are undertaken every few years (Hirth 1997). Age to maturity for the species appears to be the longest of any sea turtle (Hirth 1997) sometimes requiring 50 years. Estimates of reproductive longevity range from 17 to 23 years (Carr et al. 1978, Fitzsimmons et al. 1995). Migrations are carried out by both males and females and may traverse oceanic zones, often spanning thousands of kilometers (Carr, 1986; Mortimer and Portier, 1989). During non-breeding periods adults reside at coastal neritic feeding areas that sometimes coincide with juvenile developmental habitats (e.g., Limpus et al., 1994, Seminoff et al., 2003). In Oman, juveniles/sub-adults are commonly seen in shallow waters along rocky shorelines where they forage (Baldwin 1995).
CONSERVATION STATUS
The green turtle is currently categorized as Endangered by the IUCN Red List of Threatened Species (Seminoff, 2004). On-going revision of the IUCN Red List will segregate the population into discrete management units one of which is likely to be the Northern Indian Ocean management unit. According to the IFC GN6 guidance document the Endangered listing means that it is facing a very high risk of extinction in the wild. It is the second highest risk category assigned by the IUCN Red List for wild species.
Analysis of historic and recent published accounts indicate extensive subpopulation declines in all major ocean basins over the last three generations as a result of overexploitation of eggs and adult females at nesting beaches, juveniles and adults in foraging areas, and, to a lesser extent, incidental mortality relating to marine fisheries and degradation of marine and nesting habitats. Analyses of subpopulation changes at 32 Index Sites distributed globally show a 48% to 67% decline in the number of mature females nesting annually over the last three generations.
In Oman, data from nesting beach monitoring at Ras al Hadd (350 km to the north east of Duqm) collected over the past 30 years (MECA unpubl. data) have yet to be analysed and the trend of the population is therefore unknown. However, the population abundance of green turtles has been previously estimated at between 12-20,000 females based on annual nest counts at Ras al Hadd alone. This constitutes a relatively high proportion (14-23%) of the total global adult female population, which has been estimated at 88,520 nesting females (Spotila, 2004). Oman therefore has an important role to play in the conservation of this species.
Up to 8,000 green turtles per year are bycaught in the area around Masirah Island and in the Gulf of Masirah, mostly in gill nets deployed by the artisanal skiff fishery (Willson et al., 2015). Ministry of Agriculture and Fish Wealth annual statistics show the artisanal skiff gill net fishery to be prevalent throughout the Gulf of Masirah for much of the year (MAFW, 2013) and as such it is likely this activity has been exerting a significant population level threat to green turtles in the region since the motorization of the artisanal fishery in the mid to late 1980’s (IUCN, 1991). Siddeek and Baldwin (1996) projected simulated fishing related mortality and directed hunting captures using a stage class matrix model for green turtles in Oman. The study concluded a maximum take and accidental drowning rate of 268 female turtles per year for a positive population growth rate. The study indicates that the existing accidental and targeted takes of green turtles in Oman far exceeds a sustainable level for a viable population.
Other threats to green turtles in Oman are similar to those listed above for loggerhead turtles, including both threats on nesting beaches and on the marine environment, although the severity and magnitude of threats differs for each species.
GLOBAL AND NATIONAL DISTRIBUTION
The green turtle has a circumglobal distribution, occurring throughout tropical and, to a lesser extent, subtropical waters (Atlantic Ocean – eastern central, northeast, northwest, southeast, southwest, western central; Indian Ocean – eastern, western; Mediterranean Sea; Pacific Ocean – eastern central, northwest, southwest, western central). Green turtles are highly migratory and they undertake complex movements and migrations through geographically disparate habitats. Nesting occurs in

more than 80 countries worldwide (Hirth 1997). Their movements within the marine environment are less understood but it is believed that green turtles inhabit coastal waters of over 140 countries (Groombridge and Luxmoore 1989).
In Oman, green turtles are truly ubiquitous occurring from Musandam in the north to the Dhofar-Yemen border in the south and are a common sight in coastal waters (Baldwin, 1999). Nesting occurs on approximately 275 beaches in Oman from Musandam to Dhofar (Salm, 1991) though is centred at Ras al Hadd where approximately 90-95% of Oman’s nesting occurs.
Foraging green turtles occur throughout shallow coastal waters in Oman wherever algae and seagrasses occur. Highest densities of foraging green turtles have been recorded in Dhofar and in the Gulf of Masirah (Salm 1991; and Ross, 1985).
DISTRIBUTION WITHIN CHAA
Salm (1991) documents nesting broadly spread around the periphery of the Gulf of Masirah at a relatively low to medium density for this species. Annual estimates for the number of nests at main nesting sites include 500/year at Ras Madrakah, between 240/year between Duqm and Ras bin Tawt, and 220/year at Bar al Hikman (Salm 1991). Further important green turtle nesting occur at the southern and eastern shores of Masirah island (n=200-500 nests/year) (MECA/ESO unpublished data). Combining these data provides a maximum estimate of 1,500 turtle nests per year on beaches of the CHAA. Although nesting occurs year round at Ras al Hadd, nesting is largely restricted to the

period June-October at Masirah Island.
Figure 3-16 depicts the overall distribution of nesting green turtles in the CHAA.

Figure 3-16: Distribution of green turtles nesting locations in the CHAA

Of six turtles tracked using satellite tags deployed in July 2016 at Ras al Hadd, three individuals passed through the CHAA on post-nesting migration (EWS-WWF unpubl. data). One remained in the CHAA for over three months are remained there until tag transmission terminated. This provides further indication of the importance of the area for foraging by green turtles.
Studies conducted in the Masirah channel (Ross 1985) document foraging items to include seagrasses (Halophila ovalis, Halodule uninervis) and algae (Chaetomorpha aera and Sargassum illicifolium). Within the Masirah channel alone, a conservative count from aerial surveys of green turtles in this area was estimated at 1,000-3,000 individuals equating to 100-300 turtles/km
2 (Ross,
1985). The sex ratio of turtles in this area was found to be equal with capture studies showing individuals had a two week residency period, suggesting high mobility during foraging.
Juveniles and sub-adults, as well as migrating adults, can be expected to occur in high numbers throughout the CHAA. Capture studies in the Masirah Channel encountered sizes from 30-110 cm (Ross, 1985). Beach surveys reveal high numbers of strandings of green turtles, especially juveniles), along beaches from Bar al Hikman to Duqm (ESO unpubl. data) including high densities along beaches south of Ras bin Tawt, where approximately 10 stranded green turtles were encountered per kilometre on average over a 5 kilometre stretch of shoreline in 2015 (Five Oceans Environmental Services, 2015).
KNOWLEDGE GAPS
Relatively little is known about green turtles in the CHAA and in Oman most recent data, restricted largely to nesting records, comes from Ras al Hadd (MECA and ESO unpubl. data.) or, at Masirah Island, from fisheries bycatch studies (Willson et al. 2015; ESO unpubl. data). The recent EIAs in the Duqm area have provided some new information, but this is mostly limited to records of strandings, nesting inferred from tracks on beaches and infrequent sightings at sea. The only other recent available data is from satellite tracking studies (EWS-WWF unpubl. data) which provides some insight into migratory routes and forgaing habitats for a very small sample of the population. All other data, which is predominantly results of nesting beach and foraging surveys, is over 20 years old. Knowledge gaps are a constraint on definition of a thorough and comprehensive mitigation and management strategy for this species.
CONCLUSIONS AND JUSTIFICATION FOR TIER SELECTION
IFC’s PS 6 defines critical habitat as areas of high biodiversity value that satisfy one or more of five Critical Habitat Criteria. PS6 also defines gradients of critical habitat based on the vulnerability and irreplaceability of the site. For the first three criteria numerical thresholds are used to assign a Tier 1 or Tier 2 critical habitat designation. In the case of green turtles, two of the five Critical Habitat Criteria are relevant (Criteria 1 and 3) both of which meet the Tier 2 level designation, as described below:
Criterion 1: Critically Endangered (CR) or Endangered (EN) Species. The CHAA contains breeding and foraging habitat used by the Endangered green turtle. Tier 2 criterion (c) is met because the habitat supports the regular occurrence of one or more individuals of this EN species; and
Criterion 3: Migratory/Congregatory species. The assignation of Tier 2 in this case relates to the CHAA sustaining, on a cyclical or otherwise basis, more than 1% of the global population of this migratory species.
Based on these conclusions, there is a requirement to adhere to paragraphs 17-19 of PS6, which includes reference to assessment of impacts on the biodiversity values for which the critical habitat was designated, a robust monitoring programme and a mitigation strategy within the context of a Biodiversity Action Plan, including identification of biodiversity offsets if required.

3.2.10 Marine Environment Critical Habitat Summary
There are many marine species listed by IUCN’s Red List that are known to occur within the CHAA. Of the five species evaluated as part of this assessment, two species, the Arabian Sea humpback whale and the loggerhead turtle, meet the Tier 1 critical habitat criteria whereas the other three are assessed to be Tier 2.
It should be noted that whilst the science and logic behind these results are thought to be comprehensive and robust, the extent of the CHAA has been determined largely by the results of oil spill modelling which implies a relatively expansive CHAA relative to the direct project risk. Some other impacts may extend to similar distances from the project site (e.g. noise, ship strikes) but most will be more localised. This should be taken into account when considering the implications of the results of this CHA and the focus of mitigation/offset actions required.

4 RECOMMENDATIONS
The following recommendations have been divided into two categories:
Project and AF related recommendations – factors that DRPIC has direct influence or control over. Factors relating to significant ecological impacts on critical habitat triggering species identified in ecological impact assessment.
Strategic recommendations – issues affecting critical habitat triggering species that the Project and AFs may affect in a cumulative way but which mainly relate to other industrial developments and wider spatial planning of the terrestrial and marine zone.
In practice, it is difficult to separate Project related from strategic issues. However it is understood a strategic approach to addressing impacts will take time to develop and there will be the requirement to address specific mitigation requirements impacts immediately, such as during the construction phase.
In the first category, DRPIC will seek mitigation for these issues through implementation of the Project ESMP. In the second category, DRPIC will seek to influence and address these issues through consultation and advocacy with a broad range of stakeholders. The CHAA of projects and AFs extends beyond the jurisdiction of SEZAD alone and are also shared with other industries and community activities within the area.
Project Related Recommendations
DRPIC should commission detailed pre-construction botanical surveys at each of the locations where the Project and AF footprint intersects with an area of potential suitable critical habitat for the endemic plant species identified in this CHA. The results shall form the basis for a mitigation plan that is compliant with the requirements of IFC PS6 and could be used to inform a net grain strategy (will require development of a suitable metric as recommended in Technical Appendix E: Biodiversity Offsetting Framework). An inventory of locations where the Project Footprint overlpas an area of potentially terrestrial habitat is provided at the end of this document and will also be listed in the Project Biodiversity Management Plan.
DRPIC should deploy construction phase and operational phase mitigation to address potential indirect disturbance associated with marine facilities under its direct control: the Refinery; the Ras Markaz Single Point Mooring facility; and the Product Export Terminal. Measures to address disturbance arising from artificial lighting, noise and vibration and visual disturbance associated with personnel and vehicles should be managed within thresholds which do not alter the behaviour or habitat use of species triggering CHA (further recommendations are provided in Section 5 of the main chapter).
DRPIC should agree a code of conduct for avoidance of marine mammal and turtle collisions and minimum safety standards relating to pollution for all vessels importing and exporting oil products to/from the Refinery.
Through biodiversity offsetting approaches (see Technical Appendix E: Biodiversity Offsetting Framework) DRPIC should contribute to primary research and management and mitigation of strategic biodiversity conservation issues associated with both marine and terrestrial zones (see below).
Strategic Initiative Approach

Although the project and AFs are challenged by specific elements of the IFC PS6 with respect to the CHAA overlap with critical habitat, an opportunity exists for DRPIC to front an industry lead approach to address strategic environmental management responsibilities. A mechanism such as an industry association and fund (representing proportional interests) would provide a direct means for companies such as DPRIC to guide resources directly into addressing associated impacts. CSR activities may be undertaken as a gesture to support local community projects but should not be considered a replacement for a coordinated and structured approach to environmental mitigation offset and monitoring activities.
It is intended tha that the strategic initiative would be comprised of key stakeholders including: MECA; and Office of the Conservation of the Environment (OCE, Diwan of the Royal Court); the Oman Botanic Garden; SEZAD; other Al Wusta local Govenrment agencies; the Port of Duqm Authority; all AF developers and DRPIC.
With respect to the marine environment, development of the strategic initiative approach could be supported by the IUCN whom have been active in formation of ‘advisory panels’ that guide mitigation and monitoring through linking industry together government, conservation and research interests, (Martin-Mehers, 2016). In the case of the Western Grey Whale, an IUCN advisory panel has contributed to the development of a Conservation Management Plan and an IFC guided approach to address environmental responsibilities of the developers of the Sakhalin oil field within an area of critical habitat.
Progress with the Western Grey Whale advisory panel and consideration of similar conservation concerns for the ASHW has previously resulted in members of the International Whaling Committee Scientific Committee advising for a similar initiative to address critical habitat in the Gulf of Masirah:
‘…consideration of the formation of an independent advisory panel along the lines of that developed for the western gray whale… to focus on key areas where threats are occurring concurrently and provide expert advice on conservation management and research’ (IWC, 2015).
Other Strategic Recommendations
In addressing IFC PS6 conditions, DPRIC and lenders to evaluate financial framework for contribution towards a strategic initiative based environmental monitoring and mitigation approach (such as the industry association). Costings to include options, development and facilitation.
DPRIC to propose and present strategic initiative concept and strategic options to SEZAD, other Omani Government bodies and interested industries.
Formally establish the initiative or the agreed mechanism through which DPRIC will finance activities of strategic responsibility.
The strategic initiative should commission research to define likely impact scenario for noise, wildlife strikes and oil spills from ships in transit through the Gulf of Masirah associated with AFs and wider shipping operations. This information is essential to accurate define the CHAA for relevant marine species and ultimate to devise effective mitigation approaches. Information from ecological research should be made available to developers carrying out EIA studies in the Gulf of Masirah. SEZAD and Omani Government bodies (such as the authority responsible for coordinating spatial planning in the Sultanate, the Supreme Council for Planning) should develop a zoning strategy to guide developers to avoid critical habitat, this may require designation of marine protected areas where no development or commercial use is permitted.
The strategic initiative including SEZAD, Omani Government bodies and industrial bodies should produce and publish an oil spill response plan identifying the most sensitive biodiversity areas.

The strategic initiative including SEZAD and Omani Government bodies (principally MECA and Office of the Conservation of the Environment (OCE, Diwan of the Royal Court) in collaboration with the Oman Botanic Garden) should commission research to better understand the distribution and abundance of all endemic plant and mammal species identified in Table 3.2 which could potentially trigger CHA according to IFC PS6.
With reference to both the terrestrial and marine zones, the strategic initiative should consider offsetting approaches to address cumulative impacts on critical habitat for the species identified in this document (see Technical Appendix E: Biodiversity Offsetting Framework). Such an approach could be linked to a government lead region-wide/Gulf of Masirah wide zoning strategy with designated zones where different activities are prohibited or permitted. Implementation of an offsetting strategy may also offer a potential source of funding for conservation measures and would also provide a strategic framework to provide assurance to potential project funders (particularly those requiring compliance with IFC PS6) as implementation of the Duqm Special Economic Zone masterplan is progressed.


5 LOCATIONS WHERE THE PROJECT FOOTPRINT OVERLAPS AN AREA OF POTENTIAL CRITICAL HABITAT POIN
T ID POLYG
ON ID LATITUDE LONGITUDE DMU SPECIES
1 1 19.71935325760 57.64452913060 Mountains and rocky terrain Salsola omanensis
2 1 19.71950549830 57.64777543130 Mountains and rocky terrain Salsola omanensis
3 1 19.71896797370 57.64780353580 Mountains and rocky terrain Salsola omanensis
4 1 19.71881573310 57.64455724590 Mountains and rocky terrain Salsola omanensis
5 2 19.69728197470 57.63843102180 Gravel and Sand Plains Salsola omanensis
6 2 19.72229467790 57.63910630990 Gravel and Sand Plains Salsola omanensis
7 2 19.72220527170 57.64279679300 Gravel and Sand Plains Salsola omanensis
8 2 19.69719259820 57.64212093240 Gravel and Sand Plains Salsola omanensis
9 3 19.72071252610 57.66018210770 Gravel and Sand Plains Salsola omanensis
10 3 19.72070379680 57.66254880680 Gravel and Sand Plains Salsola omanensis
11 3 19.71873480930 57.66254069430 Gravel and Sand Plains Salsola omanensis
12 3 19.71874353770 57.66017402410 Gravel and Sand Plains Salsola omanensis
13 4 19.66550124170 57.64541708730 Gravel and Sand Plains Salsola omanensis
14 4 19.66445220870 57.64824679410 Gravel and Sand Plains Salsola omanensis
15 4 19.66269253180 57.64751984250 Gravel and Sand Plains Salsola omanensis
16 4 19.66374155290 57.64469016110 Gravel and Sand Plains Salsola omanensis
17 5 19.66601799150 57.64571402790 Gravel and Sand Plains Salsola omanensis
18 5 19.66610239410 57.64575603910 Gravel and Sand Plains Salsola omanensis
19 5 19.66606409010 57.64584179460 Gravel and Sand Plains Salsola omanensis
20 5 19.66597968750 57.64579978340 Gravel and Sand Plains Salsola omanensis
21 6 19.18920556440 57.73303835220 Gravel and Sand Plains Salsola omanensis
22 6 19.18574434130 57.73744069150 Gravel and Sand Plains Salsola omanensis
23 6 19.18214284950 57.73430408940 Gravel and Sand Plains Salsola omanensis
24 6 19.18560399760 57.72990177480 Gravel and Sand Plains Salsola omanensis
25 7 19.18817152920 57.72663506000 Gravel and Sand Plains Salsola omanensis
26 7 19.19165198780 57.72966533840 Gravel and Sand Plains Salsola omanensis
27 7 19.18955574150 57.73233240770 Gravel and Sand Plains Salsola omanensis
28 7 19.18607532670 57.72930211490 Gravel and Sand Plains Salsola omanensis
29 8 19.20189605110 57.71663054310 Gravel and Sand Plains Salsola omanensis
30 8 19.19162066440 57.72970516570 Gravel and Sand Plains Salsola omanensis
31 8 19.18814020510 57.72667477390 Gravel and Sand Plains Salsola omanensis
32 8 19.19841537680 57.71360022250 Gravel and Sand Plains Salsola omanensis
33 9 19.21367824340 57.70163522100 Gravel and Sand Plains Salsola omanensis
34 9 19.19904033140 57.72026473960 Gravel and Sand Plains Salsola omanensis
35 9 19.19555973580 57.71723445460 Gravel and Sand Plains Salsola omanensis

POIN
T ID POLYG
ON ID LATITUDE LONGITUDE DMU SPECIES
36 9 19.21019734140 57.69860503800 Gravel and Sand Plains Salsola omanensis
37 10 19.71310613780 57.63870119060 Gravel and Sand Plains Salsola omanensis
38 10 19.69255854030 57.63899834870 Gravel and Sand Plains Salsola omanensis
39 10 19.69245643420 57.63114126550 Gravel and Sand Plains Salsola omanensis
40 10 19.71300404670 57.63084310360 Gravel and Sand Plains Salsola omanensis
41 11 19.17213641960 57.73384852170 Gravel and Sand Plains Salsola omanensis
42 11 19.17439853740 57.75164478420 Gravel and Sand Plains Salsola omanensis
43 11 19.16337389730 57.75319617400 Gravel and Sand Plains Salsola omanensis
44 11 19.16111188820 57.73540108490 Gravel and Sand Plains Salsola omanensis
45 12 19.17579373420 57.75711406750 Gravel and Sand Plains Salsola omanensis
46 12 19.17754228000 57.76152810780 Gravel and Sand Plains Salsola omanensis
47 12 19.17450839280 57.76285917070 Gravel and Sand Plains Salsola omanensis
48 12 19.17275987600 57.75844519960 Gravel and Sand Plains Salsola omanensis
49 13 19.69406563460 57.64521654520 Gravel and Sand Plains Salsola omanensis
50 13 19.70939274550 57.64550953250 Gravel and Sand Plains Salsola omanensis
51 13 19.70936002830 57.64741693140 Gravel and Sand Plains Salsola omanensis
52 13 19.69403292560 57.64712376270 Gravel and Sand Plains Salsola omanensis
53 14 19.68200513560 57.67586450920 Gravel and Sand Plains Salsola omanensis
54 14 19.68518589240 57.68198606130 Gravel and Sand Plains Salsola omanensis
55 14 19.68200639470 57.68382736970 Gravel and Sand Plains Salsola omanensis
56 14 19.67882569710 57.67770590620 Gravel and Sand Plains Salsola omanensis
57 15 19.69252565730 57.64811153730 Gravel and Sand Plains Salsola omanensis
58 15 19.68117590440 57.64971050720 Gravel and Sand Plains Salsola omanensis
59 15 19.68093693700 57.64781988960 Gravel and Sand Plains Salsola omanensis
60 15 19.69228667700 57.64622078780 Gravel and Sand Plains Salsola omanensis
61 16 19.70907302720 57.64547019940 Gravel and Sand Plains Salsola omanensis
62 16 19.71495812730 57.64558280590 Gravel and Sand Plains Salsola omanensis
63 16 19.71492481380 57.64752342120 Gravel and Sand Plains Salsola omanensis
64 16 19.70903971700 57.64741074390 Gravel and Sand Plains Salsola omanensis
65 17 19.71749384730 57.62861260850 Gravel and Sand Plains Salsola omanensis
66 17 19.71803713550 57.64230239990 Gravel and Sand Plains Salsola omanensis
67 17 19.71302850190 57.64252382980 Gravel and Sand Plains Salsola omanensis
68 17 19.71248521850 57.62883446510 Gravel and Sand Plains Salsola omanensis
69 18 19.72439858360 57.62930794070 Gravel and Sand Plains Salsola omanensis
70 18 19.72435389910 57.63912497720 Gravel and Sand Plains Salsola omanensis
71 18 19.71748307400 57.63908989710 Gravel and Sand Plains Salsola omanensis
72 18 19.71752774490 57.62927328000 Gravel and Sand Plains Salsola omanensis
73 19 19.65910546370 57.66181635570 Gravel and sand plains Salsola omanensis
74 19 19.65606670990 57.67001016650 Gravel and sand plains Salsola omanensis
75 19 19.65458062680 57.66939604400 Gravel and sand plains Salsola omanensis
76 19 19.65761935130 57.66120229530 Gravel and sand plains Salsola omanensis
77 20 19.65927649700 57.67012525350 Gravel and sand plains Salsola omanensis

POIN
T ID POLYG
ON ID LATITUDE LONGITUDE DMU SPECIES
78 20 19.65740565990 57.67073184530 Gravel and sand plains Salsola omanensis
79 20 19.65721203540 57.67006644810 Gravel and sand plains Salsola omanensis
80 20 19.65908287060 57.66945984920 Gravel and sand plains Salsola omanensis
81 21 19.75178792890 57.60248602590 Wadis and other temporary watercourses
Ochradenus harsusiticus
82 21 19.74625106480 57.60818744740 Wadis and other temporary watercourses
Ochradenus harsusiticus
83 21 19.74431913920 57.60609452850 Wadis and other temporary watercourses
Ochradenus harsusiticus
84 21 19.74985593790 57.60039309940 Wadis and other temporary watercourses
Ochradenus harsusiticus
85 22 19.25790787900 57.65854592210 Wadis and other temporary watercourses
Ochradenus harsusiticus
86 22 19.25019122790 57.65905634290 Wadis and other temporary watercourses
Ochradenus harsusiticus
87 22 19.24990124290 57.65419711810 Wadis and other temporary watercourses
Ochradenus harsusiticus
88 22 19.25761788740 57.65368646990 Wadis and other temporary watercourses
Ochradenus harsusiticus
89 23 19.27496244130 57.62119935470 Wadis and other temporary watercourses
Ochradenus harsusiticus
90 23 19.27947802890 57.62131424980 Wadis and other temporary watercourses
Ochradenus harsusiticus
91 23 19.27939946810 57.62473682060 Wadis and other temporary watercourses
Ochradenus harsusiticus
92 23 19.27488388520 57.62462183190 Wadis and other temporary watercourses
Ochradenus harsusiticus
93 24 19.32117517930 57.60422485560 Wadis and other temporary watercourses
Ochradenus harsusiticus
94 24 19.29918436390 57.60992538680 Wadis and other temporary watercourses
Ochradenus harsusiticus
95 24 19.29809886470 57.60528000380 Wadis and other temporary watercourses
Ochradenus harsusiticus
96 24 19.32008955340 57.59957888030 Wadis and other temporary watercourses
Ochradenus harsusiticus
97 25 19.37626968410 57.59341549400 Wadis and other temporary watercourses
Ochradenus harsusiticus
98 25 19.37371297850 57.59372660090 Wadis and other temporary watercourses
Ochradenus harsusiticus
99 25 19.37364499090 57.59310625060 Wadis and other temporary watercourses
Ochradenus harsusiticus
100 25 19.37620169570 57.59279513410 Wadis and other temporary watercourses
Ochradenus harsusiticus
101 26 19.38997917800 57.59277045670 Wadis and other temporary watercourses
Ochradenus harsusiticus
102 26 19.37666513020 57.59348751960 Wadis and other temporary watercourses
Ochradenus harsusiticus
103 26 19.37643452680 57.58873438540 Wadis and other temporary watercourses
Ochradenus harsusiticus
104 26 19.38974856630 57.58801693600 Wadis and other temporary watercourses
Ochradenus harsusiticus
105 27 19.38985390930 57.59277821300 Wadis and other temporary watercourses
Ochradenus harsusiticus

POIN
T ID POLYG
ON ID LATITUDE LONGITUDE DMU SPECIES
106 27 19.38461618360 57.59305919410 Wadis and other temporary watercourses
Ochradenus harsusiticus
107 27 19.38453339150 57.59134556100 Wadis and other temporary watercourses
Ochradenus harsusiticus
108 27 19.38977111620 57.59106452510 Wadis and other temporary watercourses
Ochradenus harsusiticus
109 28 19.46870927790 57.58058705200 Wadis and other temporary watercourses
Ochradenus harsusiticus
110 28 19.46318438040 57.58143792670 Wadis and other temporary watercourses
Ochradenus harsusiticus
111 28 19.46253146770 57.57672592190 Wadis and other temporary watercourses
Ochradenus harsusiticus
112 28 19.46805634750 57.57587488960 Wadis and other temporary watercourses
Ochradenus harsusiticus
113 29 19.50496383260 57.56872412970 Wadis and other temporary watercourses
Ochradenus harsusiticus
114 29 19.48954465840 57.57211997110 Wadis and other temporary watercourses
Ochradenus harsusiticus
115 29 19.48859204410 57.56731044090 Wadis and other temporary watercourses
Ochradenus harsusiticus
116 29 19.50401114060 57.56391415870 Wadis and other temporary watercourses
Ochradenus harsusiticus
117 30 19.53788129730 57.56323411650 Wadis and other temporary watercourses
Ochradenus harsusiticus
118 30 19.54035785970 57.56984614950 Wadis and other temporary watercourses
Ochradenus harsusiticus
119 30 19.53802366090 57.57081880210 Wadis and other temporary watercourses
Ochradenus harsusiticus
120 30 19.53554713140 57.56420685130 Wadis and other temporary watercourses
Ochradenus harsusiticus
121 31 19.58809766450 57.56754117130 Wadis and other temporary watercourses
Ochradenus harsusiticus
122 31 19.58787700710 57.57234404640 Wadis and other temporary watercourses
Ochradenus harsusiticus
123 31 19.58686732530 57.57229239010 Wadis and other temporary watercourses
Ochradenus harsusiticus
124 31 19.58708798060 57.56748954470 Wadis and other temporary watercourses
Ochradenus harsusiticus
125 32 19.58396633550 57.56646355700 Wadis and other temporary watercourses
Ochradenus harsusiticus
126 32 19.58477469950 57.57157048960 Wadis and other temporary watercourses
Ochradenus harsusiticus
127 32 19.58334273770 57.57182278880 Wadis and other temporary watercourses
Ochradenus harsusiticus
128 32 19.58253437970 57.56671590050 Wadis and other temporary watercourses
Ochradenus harsusiticus
129 33 19.58257921890 57.56672328550 Wadis and other temporary watercourses
Ochradenus harsusiticus
130 33 19.58295924190 57.56678587530 Wadis and other temporary watercourses
Ochradenus harsusiticus
131 33 19.58295649190 57.56680446270 Wadis and other temporary watercourses
Ochradenus harsusiticus
132 33 19.58257646890 57.56674187280 Wadis and other temporary watercourses
Ochradenus harsusiticus

POIN
T ID POLYG
ON ID LATITUDE LONGITUDE DMU SPECIES
133 34 19.57747928700 57.56514940120 Wadis and other temporary watercourses
Ochradenus harsusiticus
134 34 19.57996872760 57.57098937880 Wadis and other temporary watercourses
Ochradenus harsusiticus
135 34 19.57873634020 57.57157412450 Wadis and other temporary watercourses
Ochradenus harsusiticus
136 34 19.57624691730 57.56573418350 Wadis and other temporary watercourses
Ochradenus harsusiticus
137 35 19.57904519050 57.57094211610 Wadis and other temporary watercourses
Ochradenus harsusiticus
138 35 19.57967830230 57.57104640200 Wadis and other temporary watercourses
Ochradenus harsusiticus
139 35 19.57967512140 57.57106789770 Wadis and other temporary watercourses
Ochradenus harsusiticus
140 35 19.57904200970 57.57096361180 Wadis and other temporary watercourses
Ochradenus harsusiticus
141 36 19.59349639090 57.57256159270 Wadis and other temporary watercourses
Ochradenus harsusiticus
142 36 19.59534763250 57.57258050260 Wadis and other temporary watercourses
Ochradenus harsusiticus
143 36 19.59534749990 57.57259495750 Wadis and other temporary watercourses
Ochradenus harsusiticus
144 36 19.59349625830 57.57257604740 Wadis and other temporary watercourses
Ochradenus harsusiticus
145 37 19.59167804850 57.56740583170 Wadis and other temporary watercourses
Ochradenus harsusiticus
146 37 19.59786071900 57.57202151270 Wadis and other temporary watercourses
Ochradenus harsusiticus
147 37 19.59617047950 57.57454216010 Wadis and other temporary watercourses
Ochradenus harsusiticus
148 37 19.58998787370 57.56992643460 Wadis and other temporary watercourses
Ochradenus harsusiticus
149 38 19.61682717890 57.56970423120 Wadis and other temporary watercourses
Ochradenus harsusiticus
150 38 19.62339370000 57.57313917960 Wadis and other temporary watercourses
Ochradenus harsusiticus
151 38 19.62138791030 57.57740946760 Wadis and other temporary watercourses
Ochradenus harsusiticus
152 38 19.61482147250 57.57397439300 Wadis and other temporary watercourses
Ochradenus harsusiticus
153 39 19.64049400480 57.57579581700 Wadis and other temporary watercourses
Ochradenus harsusiticus
154 39 19.64496905340 57.58210657700 Wadis and other temporary watercourses
Ochradenus harsusiticus
155 39 19.64181964550 57.58459441780 Wadis and other temporary watercourses
Ochradenus harsusiticus
156 39 19.63734468120 57.57828371690 Wadis and other temporary watercourses
Ochradenus harsusiticus
157 40 19.64618559510 57.57747104610 Wadis and other temporary watercourses
Ochradenus harsusiticus
158 40 19.65091306690 57.57782588510 Wadis and other temporary watercourses
Ochradenus harsusiticus
159 40 19.65059263410 57.58258117920 Wadis and other temporary watercourses
Ochradenus harsusiticus

POIN
T ID POLYG
ON ID LATITUDE LONGITUDE DMU SPECIES
160 40 19.64586517500 57.58222620210 Wadis and other temporary watercourses
Ochradenus harsusiticus
161 41 19.71830952020 57.62415802040 Wadis and other temporary watercourses
Ochradenus harsusiticus
162 41 19.71576087430 57.62530844670 Wadis and other temporary watercourses
Ochradenus harsusiticus
163 41 19.71501049610 57.62345478530 Wadis and other temporary watercourses
Ochradenus harsusiticus
164 41 19.71755913100 57.62230433420 Wadis and other temporary watercourses
Ochradenus harsusiticus
165 42 19.71764680290 57.60251285160 Wadis and other temporary watercourses
Ochradenus harsusiticus
166 42 19.71759674070 57.61387608120 Wadis and other temporary watercourses
Ochradenus harsusiticus
167 42 19.71308005060 57.61385373510 Wadis and other temporary watercourses
Ochradenus harsusiticus
168 42 19.71313010290 57.60249082450 Wadis and other temporary watercourses
Ochradenus harsusiticus
169 43 19.75367930650 57.60505890730 Wadis and other temporary watercourses
Ochradenus harsusiticus
170 43 19.74801463830 57.60994813050 Wadis and other temporary watercourses
Ochradenus harsusiticus
171 43 19.74696023930 57.60858533090 Wadis and other temporary watercourses
Ochradenus harsusiticus
172 43 19.75262487140 57.60369608960 Wadis and other temporary watercourses
Ochradenus harsusiticus
173 44 19.48486780670 57.57432009450 Mountains and rocky terrain Egyptian Vulture, Salsola omanensis
174 44 19.48438177520 57.57463105470 Mountains and rocky terrain Egyptian Vulture, Salsola omanensis
175 44 19.48417912720 57.57427889620 Mountains and rocky terrain Egyptian Vulture, Salsola omanensis
176 44 19.48466515820 57.57396793530 Mountains and rocky terrain Egyptian Vulture, Salsola omanensis
177 45 19.48419041420 57.57495032120 Mountains and rocky terrain Egyptian Vulture, Salsola omanensis
178 45 19.48342852330 57.57506234370 Mountains and rocky terrain Egyptian Vulture, Salsola omanensis
179 45 19.48334966550 57.57446605110 Mountains and rocky terrain Egyptian Vulture, Salsola omanensis
180 45 19.48411155610 57.57435402580 Mountains and rocky terrain Egyptian Vulture, Salsola omanensis
181 46 19.49474888700 57.57092401980 Mountains and rocky terrain Egyptian Vulture, Salsola omanensis
182 46 19.49033840940 57.57184563810 Mountains and rocky terrain Egyptian Vulture, Salsola omanensis
183 46 19.48996139770 57.56983952610 Mountains and rocky terrain Egyptian Vulture, Salsola omanensis
184 46 19.49437186650 57.56891785500 Mountains and rocky terrain Egyptian Vulture, Salsola omanensis
185 47 19.49234294570 57.57086884600 Mountains and rocky terrain Egyptian Vulture, Salsola omanensis
186 47 19.48526979830 57.57403118960 Mountains and rocky terrain Egyptian Vulture, Salsola omanensis

POIN
T ID POLYG
ON ID LATITUDE LONGITUDE DMU SPECIES
187 47 19.48340792550 57.56940103460 Mountains and rocky terrain Egyptian Vulture, Salsola omanensis
188 47 19.49048099770 57.56623852150 Mountains and rocky terrain Egyptian Vulture, Salsola omanensis
189 48 19.50000713690 57.56768739190 Mountains and rocky terrain Egyptian Vulture, Salsola omanensis
190 48 19.49241406740 57.57067523480 Mountains and rocky terrain Egyptian Vulture, Salsola omanensis
191 48 19.49104915460 57.56681824680 Mountains and rocky terrain Egyptian Vulture, Salsola omanensis
192 48 19.49864216550 57.56383024550 Mountains and rocky terrain Egyptian Vulture, Salsola omanensis
193 49 19.61055048200 57.56781560860 Mountains and rocky terrain Egyptian Vulture, Salsola omanensis
194 49 19.61241406410 57.56792206750 Mountains and rocky terrain Egyptian Vulture, Salsola omanensis
195 49 19.61238464630 57.56849551160 Mountains and rocky terrain Egyptian Vulture, Salsola omanensis
196 49 19.61052106460 57.56838904620 Mountains and rocky terrain Egyptian Vulture, Salsola omanensis
197 50 19.61837005210 57.57051127790 Mountains and rocky terrain Egyptian Vulture, Salsola omanensis
198 50 19.61764793830 57.57204869570 Mountains and rocky terrain Egyptian Vulture, Salsola omanensis
199 50 19.61630580410 57.57134663720 Mountains and rocky terrain Egyptian Vulture, Salsola omanensis
200 50 19.61702791170 57.56980922870 Mountains and rocky terrain Egyptian Vulture, Salsola omanensis
201 51 19.59760754120 57.56782469750 Mountains and rocky terrain Egyptian Vulture, Salsola omanensis
202 51 19.59969727270 57.56783202360 Mountains and rocky terrain Egyptian Vulture, Salsola omanensis
203 51 19.59969599810 57.56823664850 Mountains and rocky terrain Egyptian Vulture, Salsola omanensis
204 51 19.59760626680 57.56822931710 Mountains and rocky terrain Egyptian Vulture, Salsola omanensis
205 52 19.56901847340 57.56481077360 Mountains and rocky terrain Egyptian Vulture, Salsola omanensis
206 52 19.57376809480 57.56520024570 Mountains and rocky terrain Egyptian Vulture, Salsola omanensis
207 52 19.57361488920 57.56727960920 Mountains and rocky terrain Egyptian Vulture, Salsola omanensis
208 52 19.56886527370 57.56689007680 Mountains and rocky terrain Egyptian Vulture, Salsola omanensis
209 53 19.56681815330 57.56868349950 Mountains and rocky terrain Egyptian Vulture, Salsola omanensis
210 53 19.57039796920 57.56897708170 Mountains and rocky terrain Egyptian Vulture, Salsola omanensis
211 53 19.57034476710 57.56969908620 Mountains and rocky terrain Egyptian Vulture, Salsola omanensis
212 53 19.56676495280 57.56940548820 Mountains and rocky terrain Egyptian Vulture, Salsola omanensis
213 54 19.72428741690 57.62654870170 Mountains and rocky terrain Salsola omanensis

POIN
T ID POLYG
ON ID LATITUDE LONGITUDE DMU SPECIES
214 54 19.71662653530 57.62994041150 Mountains and rocky terrain Salsola omanensis
215 54 19.71595293580 57.62824380460 Mountains and rocky terrain Salsola omanensis
216 54 19.72361378770 57.62485202620 Mountains and rocky terrain Salsola omanensis
217 55 19.74358325900 57.61267273470 Mountains and rocky terrain Salsola omanensis
218 55 19.74216269670 57.62259822760 Mountains and rocky terrain Salsola omanensis
219 55 19.73947525740 57.62216911480 Mountains and rocky terrain Salsola omanensis
220 55 19.74089579200 57.61224378270 Mountains and rocky terrain Salsola omanensis
221 56 19.66143396780 57.58253107530 Mountains and rocky terrain Salsola omanensis
222 56 19.64990144490 57.58279213910 Mountains and rocky terrain Salsola omanensis
223 56 19.64980130220 57.57786659810 Mountains and rocky terrain Salsola omanensis
224 56 19.66133382710 57.57760518200 Mountains and rocky terrain Salsola omanensis
225 57 19.63255756970 57.57644802510 Mountains and rocky terrain Salsola omanensis
226 57 19.64147615690 57.57711755770 Mountains and rocky terrain Salsola omanensis
227 57 19.64115565850 57.58187231030 Mountains and rocky terrain Salsola omanensis
228 57 19.63223709530 57.58120251750 Mountains and rocky terrain Salsola omanensis
229 58 19.60858804970 57.57262918450 Mountains and rocky terrain Salsola omanensis
230 58 19.60308610920 57.57260982260 Mountains and rocky terrain Salsola omanensis
231 58 19.60309042180 57.57124339350 Mountains and rocky terrain Salsola omanensis
232 58 19.60859236370 57.57126270900 Mountains and rocky terrain Salsola omanensis
233 59 19.62649747540 57.57681786260 Mountains and rocky terrain Salsola omanensis
234 59 19.63020034090 57.57825367910 Mountains and rocky terrain Salsola omanensis
235 59 19.62929879510 57.58084329310 Mountains and rocky terrain Salsola omanensis
236 59 19.62559595110 57.57940742630 Mountains and rocky terrain Salsola omanensis
237 60 19.70757690440 57.64623710890 Mountains and rocky terrain Salsola omanensis
238 60 19.71069300010 57.64625699970 Mountains and rocky terrain Salsola omanensis
239 60 19.71068620990 57.64744230420 Mountains and rocky terrain Salsola omanensis
240 60 19.70757011500 57.64742239050 Mountains and rocky terrain Salsola omanensis
241 61 19.70810762150 57.64632506280 Mountains and rocky terrain and gravel and sand plains
Salsola omanensis
242 61 19.70706403050 57.64737301580 Mountains and rocky terrain and gravel and sand plains
Salsola omanensis
243 61 19.70706400520 57.64737298770 Mountains and rocky terrain and gravel and sand plains
Salsola omanensis
244 61 19.70810759620 57.64632503480 Mountains and rocky terrain and gravel and sand plains
Salsola omanensis
245 62 19.70814766360 57.64732457770 Mountains and rocky terrain Salsola omanensis
246 62 19.69344916100 57.64798142390 Mountains and rocky terrain Salsola omanensis
247 62 19.69336166570 57.64579903930 Mountains and rocky terrain Salsola omanensis
248 62 19.70806016600 57.64514199370 Mountains and rocky terrain Salsola omanensis
249 63 19.18292237090 57.74717338610 Mountains and rocky terrain Salsola omanensis
250 63 19.16985442460 57.74862329920 Mountains and rocky terrain Salsola omanensis
251 63 19.16907558020 57.74085019410 Mountains and rocky terrain Salsola omanensis
252 63 19.18214348650 57.73939967020 Mountains and rocky terrain Salsola omanensis
253 64 19.18153155210 57.73412434490 Mountains and rocky terrain Salsola omanensis

POIN
T ID POLYG
ON ID LATITUDE LONGITUDE DMU SPECIES
254 64 19.18626733340 57.73570444840 Mountains and rocky terrain Salsola omanensis
255 64 19.18530052120 57.73891404640 Mountains and rocky terrain Salsola omanensis
256 64 19.18056476970 57.73733386240 Mountains and rocky terrain Salsola omanensis
257 65 19.19848957140 57.71946415020 Mountains and rocky terrain Salsola omanensis
258 65 19.19525587810 57.72719649940 Mountains and rocky terrain Salsola omanensis
259 65 19.19310884980 57.72620171720 Mountains and rocky terrain Salsola omanensis
260 65 19.19634249920 57.71846944580 Mountains and rocky terrain Salsola omanensis
261 66 19.40255544690 57.58903025890 Mountains and rocky terrain Salsola omanensis
262 66 19.39849408200 57.58925036730 Mountains and rocky terrain Salsola omanensis
263 66 19.39841119620 57.58755191760 Mountains and rocky terrain Salsola omanensis
264 66 19.40247256020 57.58733176700 Mountains and rocky terrain Salsola omanensis
265 67 19.41173818160 57.58850870860 Mountains and rocky terrain Salsola omanensis
266 67 19.40310720020 57.59352901260 Mountains and rocky terrain Salsola omanensis
267 67 19.40150010100 57.59046010960 Mountains and rocky terrain Salsola omanensis
268 67 19.41013100200 57.58543968810 Mountains and rocky terrain Salsola omanensis
269 68 19.40722697170 57.58725540760 Mountains and rocky terrain Salsola omanensis
270 68 19.40074896210 57.59106182810 Mountains and rocky terrain Salsola omanensis
271 68 19.39970172210 57.58908227890 Mountains and rocky terrain Salsola omanensis
272 68 19.40617969240 57.58527580200 Mountains and rocky terrain Salsola omanensis
273 69 19.41274765050 57.59155890160 Mountains and rocky terrain Salsola omanensis
274 69 19.40726115360 57.59185416570 Mountains and rocky terrain Salsola omanensis
275 69 19.40711840210 57.58890824360 Mountains and rocky terrain Salsola omanensis
276 69 19.41260489680 57.58861288070 Mountains and rocky terrain Salsola omanensis
277 70 19.44805212430 57.58272885860 Mountains and rocky terrain Salsola omanensis
278 70 19.44368675060 57.58287377910 Mountains and rocky terrain Salsola omanensis
279 70 19.44360908620 57.58027462990 Mountains and rocky terrain Salsola omanensis
280 70 19.44797445970 57.58012963990 Mountains and rocky terrain Salsola omanensis
281 71 19.45734937630 57.58241961950 Mountains and rocky terrain Salsola omanensis
282 71 19.45092444270 57.58263339800 Mountains and rocky terrain Salsola omanensis
283 71 19.45086032890 57.58049230720 Mountains and rocky terrain Salsola omanensis
284 71 19.45728526210 57.58027844430 Mountains and rocky terrain Salsola omanensis
285 72 19.46127525320 57.58173240600 Mountains and rocky terrain Salsola omanensis
286 72 19.45829091090 57.58219295400 Mountains and rocky terrain Salsola omanensis
287 72 19.45809635500 57.58079173020 Mountains and rocky terrain Salsola omanensis
288 72 19.46108069440 57.58033115700 Mountains and rocky terrain Salsola omanensis
289 73 19.45826978210 57.57827625280 Mountains and rocky terrain Salsola omanensis
290 73 19.45561133430 57.57859448750 Mountains and rocky terrain Salsola omanensis
291 73 19.45551678520 57.57771664930 Mountains and rocky terrain Salsola omanensis
292 73 19.45817523180 57.57739840040 Mountains and rocky terrain Salsola omanensis
293 74 19.46113343350 57.57880595160 Mountains and rocky terrain Salsola omanensis
294 74 19.46149662590 57.57880724130 Mountains and rocky terrain Salsola omanensis
295 74 19.46149545780 57.57917275240 Mountains and rocky terrain Salsola omanensis

POIN
T ID POLYG
ON ID LATITUDE LONGITUDE DMU SPECIES
296 74 19.46113226540 57.57917146180 Mountains and rocky terrain Salsola omanensis
297 75 19.46489795190 57.57972228460 Mountains and rocky terrain Salsola omanensis
298 75 19.46189002880 57.58014506670 Mountains and rocky terrain Salsola omanensis
299 75 19.46170401150 57.57867407460 Mountains and rocky terrain Salsola omanensis
300 75 19.46471193190 57.57825126570 Mountains and rocky terrain Salsola omanensis
301 76 19.46830739170 57.57670072920 Mountains and rocky terrain Salsola omanensis
302 76 19.46774797050 57.58108988430 Mountains and rocky terrain Salsola omanensis
303 76 19.46653161770 57.58091753780 Mountains and rocky terrain Salsola omanensis
304 76 19.46709103400 57.57652841470 Mountains and rocky terrain Salsola omanensis
305 77 19.47315554260 57.57667480520 Mountains and rocky terrain Salsola omanensis
306 77 19.47144261050 57.57832324390 Mountains and rocky terrain Salsola omanensis
307 77 19.47086000040 57.57765024400 Mountains and rocky terrain Salsola omanensis
308 77 19.47257292650 57.57600180380 Mountains and rocky terrain Salsola omanensis
309 78 19.47121745640 57.57916438410 Mountains and rocky terrain Salsola omanensis
310 78 19.47080944400 57.58041044880 Mountains and rocky terrain Salsola omanensis
311 78 19.47039289180 57.58025882440 Mountains and rocky terrain Salsola omanensis
312 78 19.47080090310 57.57901276250 Mountains and rocky terrain Salsola omanensis
313 79 19.51895937150 57.56302448700 Mountains and rocky terrain Salsola omanensis
314 79 19.51109665200 57.56433469000 Mountains and rocky terrain Salsola omanensis
315 79 19.51036332850 57.55944040540 Mountains and rocky terrain Salsola omanensis
316 79 19.51822601890 57.55812996970 Mountains and rocky terrain Salsola omanensis
317 80 19.56545252630 57.56592048030 Mountains and rocky terrain Salsola omanensis
318 80 19.56467588490 57.56937417910 Mountains and rocky terrain Salsola omanensis
319 80 19.56302922180 57.56896205380 Mountains and rocky terrain Salsola omanensis
320 80 19.56380585460 57.56550838770 Mountains and rocky terrain Salsola omanensis
321 81 19.56564866120 57.56349571360 Mountains and rocky terrain Salsola omanensis
322 81 19.56859401450 57.56558207750 Mountains and rocky terrain Salsola omanensis
323 81 19.56766384670 57.56704353990 Mountains and rocky terrain Salsola omanensis
324 81 19.56471851040 57.56495716230 Mountains and rocky terrain Salsola omanensis
325 82 19.56773527540 57.56741153370 Mountains and rocky terrain Salsola omanensis
326 82 19.56959612630 57.56882836690 Mountains and rocky terrain Salsola omanensis
327 82 19.56918886740 57.56942369240 Mountains and rocky terrain Salsola omanensis
328 82 19.56732802110 57.56800685620 Mountains and rocky terrain Salsola omanensis
329 83 19.61496127960 57.57200776800 Mountains and rocky terrain Salsola omanensis
330 83 19.61375132800 57.57212701600 Mountains and rocky terrain Salsola omanensis
331 83 19.61365127750 57.57099653390 Mountains and rocky terrain Salsola omanensis
332 83 19.61486122870 57.57087727750 Mountains and rocky terrain Salsola omanensis
333 84 19.62230596330 57.57135175170 Mountains and rocky terrain Salsola omanensis
334 84 19.62324186860 57.57459960600 Mountains and rocky terrain Salsola omanensis
335 84 19.62179834910 57.57506287210 Mountains and rocky terrain Salsola omanensis
336 84 19.62086245130 57.57181504460 Mountains and rocky terrain Salsola omanensis
337 85 19.64676629350 57.57759692030 Mountains and rocky terrain Salsola omanensis

POIN
T ID POLYG
ON ID LATITUDE LONGITUDE DMU SPECIES
338 85 19.64714658950 57.58053088470 Mountains and rocky terrain Salsola omanensis
339 85 19.64657168510 57.58061389960 Mountains and rocky terrain Salsola omanensis
340 85 19.64619139020 57.57767994560 Mountains and rocky terrain Salsola omanensis
341 86 19.64228237240 57.57633588700 Mountains and rocky terrain Salsola omanensis
342 86 19.64750146920 57.58176663090 Mountains and rocky terrain Salsola omanensis
343 86 19.64603994910 57.58333135930 Mountains and rocky terrain Salsola omanensis
344 86 19.64082089870 57.57790061660 Mountains and rocky terrain Salsola omanensis
345 87 19.65052764450 57.57779699110 Mountains and rocky terrain Salsola omanensis
346 87 19.65020718060 57.58255221710 Mountains and rocky terrain Salsola omanensis
347 87 19.64653365770 57.58227634670 Mountains and rocky terrain Salsola omanensis
348 87 19.64685411170 57.57752122810 Mountains and rocky terrain Salsola omanensis
349 88 19.66667616820 57.58114236110 Mountains and rocky terrain Salsola omanensis
350 88 19.65880450990 57.58237779750 Mountains and rocky terrain Salsola omanensis
351 88 19.65813874950 57.57765142240 Mountains and rocky terrain Salsola omanensis
352 88 19.66601038170 57.57641575850 Mountains and rocky terrain Salsola omanensis
353 89 19.66809572510 57.57601440770 Mountains and rocky terrain Salsola omanensis
354 89 19.66860156660 57.57900905860 Mountains and rocky terrain Salsola omanensis
355 89 19.66648993150 57.57940652440 Mountains and rocky terrain Salsola omanensis
356 89 19.66598409550 57.57641191180 Mountains and rocky terrain Salsola omanensis
357 90 19.66835925700 57.57619392840 Mountains and rocky terrain Salsola omanensis
358 90 19.67018478450 57.57746697880 Mountains and rocky terrain Salsola omanensis
359 90 19.66941722440 57.57869355420 Mountains and rocky terrain Salsola omanensis
360 90 19.66759170570 57.57742049640 Mountains and rocky terrain Salsola omanensis
361 91 19.67338777240 57.57836823010 Mountains and rocky terrain Salsola omanensis
362 91 19.66903303020 57.57907546170 Mountains and rocky terrain Salsola omanensis
363 91 19.66858272100 57.57598560070 Mountains and rocky terrain Salsola omanensis
364 91 19.67293745330 57.57527828700 Mountains and rocky terrain Salsola omanensis
365 92 19.67822170840 57.57786181420 Mountains and rocky terrain Salsola omanensis
366 92 19.67260009210 57.57926920650 Mountains and rocky terrain Salsola omanensis
367 92 19.67178646340 57.57564737580 Mountains and rocky terrain Salsola omanensis
368 92 19.67740805490 57.57423986260 Mountains and rocky terrain Salsola omanensis
369 93 19.67896895540 57.57429858450 Mountains and rocky terrain Salsola omanensis
370 93 19.67929682690 57.57654832950 Mountains and rocky terrain Salsola omanensis
371 93 19.67792331620 57.57677141890 Mountains and rocky terrain Salsola omanensis
372 93 19.67759544710 57.57452169280 Mountains and rocky terrain Salsola omanensis
373 94 19.67962533680 57.57464820510 Mountains and rocky terrain Salsola omanensis
374 94 19.67906338970 57.57473948550 Mountains and rocky terrain Salsola omanensis
375 94 19.67899843380 57.57429379600 Mountains and rocky terrain Salsola omanensis
376 94 19.67956038070 57.57420251400 Mountains and rocky terrain Salsola omanensis
377 95 19.68662020810 57.57605991260 Mountains and rocky terrain Salsola omanensis
378 95 19.68001905580 57.57713211840 Mountains and rocky terrain Salsola omanensis
379 95 19.67959137630 57.57419747940 Mountains and rocky terrain Salsola omanensis

POIN
T ID POLYG
ON ID LATITUDE LONGITUDE DMU SPECIES
380 95 19.68619251430 57.57312515520 Mountains and rocky terrain Salsola omanensis
381 96 19.70743808260 57.57238122070 Mountains and rocky terrain Salsola omanensis
382 96 19.70599774160 57.57485492620 Mountains and rocky terrain Salsola omanensis
383 96 19.70467031130 57.57399317910 Mountains and rocky terrain Salsola omanensis
384 96 19.70611064030 57.57151948560 Mountains and rocky terrain Salsola omanensis
385 97 19.71038869890 57.57202856540 Mountains and rocky terrain Salsola omanensis
386 97 19.71071273710 57.57438011570 Mountains and rocky terrain Salsola omanensis
387 97 19.70897948120 57.57464640330 Mountains and rocky terrain Salsola omanensis
388 97 19.70865544580 57.57229487790 Mountains and rocky terrain Salsola omanensis
389 98 19.71688505810 57.64797668000 Mountains and rocky terrain Salsola omanensis
390 98 19.71695058500 57.65962935120 Mountains and rocky terrain Salsola omanensis
391 98 19.71506051670 57.65964113450 Mountains and rocky terrain Salsola omanensis
392 98 19.71499498670 57.64798860030 Mountains and rocky terrain Salsola omanensis
393 99 19.17120953270 57.74533551540 Mountains and rocky terrain Salsola omanensis
394 99 19.17484806090 57.76207997590 Mountains and rocky terrain Salsola omanensis
395 99 19.16715246380 57.76393157320 Mountains and rocky terrain Salsola omanensis
396 99 19.16351407640 57.74718786210 Mountains and rocky terrain Salsola omanensis
397 100 19.17425222650 57.76022509340 Mountains and rocky terrain Salsola omanensis
398 100 19.17551113020 57.76213490680 Mountains and rocky terrain Salsola omanensis
399 100 19.17447297100 57.76289283720 Mountains and rocky terrain Salsola omanensis
400 100 19.17321407480 57.76098303050 Mountains and rocky terrain Salsola omanensis
401 101 19.17497680570 57.76310801500 Mountains and rocky terrain Salsola omanensis
402 101 19.17526663690 57.76354771420 Mountains and rocky terrain Salsola omanensis
403 101 19.17502224690 57.76372613410 Mountains and rocky terrain Salsola omanensis
404 101 19.17473241610 57.76328643520 Mountains and rocky terrain Salsola omanensis
405 102 19.17590986160 57.76296899850 Mountains and rocky terrain Salsola omanensis
406 102 19.17588383480 57.76372113390 Mountains and rocky terrain Salsola omanensis
407 102 19.17544835790 57.76370444270 Mountains and rocky terrain Salsola omanensis
408 102 19.17547438450 57.76295230920 Mountains and rocky terrain Salsola omanensis
409 103 19.74792405050 57.60354852850 Gravel and sand plains and wadis and other temporary watercourses
Salsola omanensis, Ochradenus harsusiticus
410 103 19.74794580550 57.60356833310 Gravel and sand plains and wadis and other temporary watercourses
Salsola omanensis, Ochradenus harsusiticus
411 103 19.74792815710 57.60358995900 Gravel and sand plains and wadis and other temporary watercourses
Salsola omanensis, Ochradenus harsusiticus
412 103 19.74790640210 57.60357015440 Gravel and sand plains and wadis and other temporary watercourses
Salsola omanensis, Ochradenus harsusiticus
413 104 19.72400034990 57.63613917860 Gravel and sand plains Salsola omanensis
414 104 19.72438455530 57.63831765850 Gravel and sand plains Salsola omanensis
415 104 19.72348315130 57.63849493790 Gravel and sand plains Salsola omanensis
416 104 19.72309894770 57.63631646990 Gravel and sand plains Salsola omanensis

POIN
T ID POLYG
ON ID LATITUDE LONGITUDE DMU SPECIES
417 105 19.69731465930 57.63076399420 Gravel and sand plains Salsola omanensis
418 105 19.71300404670 57.63084310360 Gravel and sand plains Salsola omanensis
419 105 19.71296831660 57.63870318370 Gravel and sand plains Salsola omanensis
420 105 19.69727895390 57.63862330820 Gravel and sand plains Salsola omanensis
421 106 19.70941119140 57.64628978010 Gravel and sand plains Salsola omanensis
422 106 19.69601071310 57.64664296250 Gravel and sand plains Salsola omanensis
423 106 19.69598091500 57.64538272800 Gravel and sand plains Salsola omanensis
424 106 19.70938139390 57.64502944050 Gravel and sand plains Salsola omanensis
425 107 19.71243677790 57.64621035430 Gravel and sand plains Salsola omanensis
426 107 19.70911020840 57.64629774970 Gravel and sand plains Salsola omanensis
427 107 19.70909238310 57.64554131200 Gravel and sand plains Salsola omanensis
428 107 19.71241895270 57.64545390100 Gravel and sand plains Salsola omanensis
429 108 19.71750934920 57.62900285970 Gravel and sand plains Salsola omanensis
430 108 19.71803713550 57.64230239990 Gravel and sand plains Salsola omanensis
431 108 19.71302850190 57.64252382980 Gravel and sand plains Salsola omanensis
432 108 19.71250072030 57.62922470410 Gravel and sand plains Salsola omanensis
433 109 19.72402220150 57.62930604170 Gravel and sand plains Salsola omanensis
434 109 19.72397751770 57.63912305520 Gravel and sand plains Salsola omanensis
435 109 19.71748307400 57.63908989710 Gravel and sand plains Salsola omanensis
436 109 19.71752774490 57.62927328000 Gravel and sand plains Salsola omanensis
437 110 19.68310552340 57.57362660340 Mountains and rocky terrain Egyptian Vulture, Salsola omanensis
438 110 19.68502862810 57.57368551520 Mountains and rocky terrain Egyptian Vulture, Salsola omanensis
439 110 19.68502862730 57.57368554460 Mountains and rocky terrain Egyptian Vulture, Salsola omanensis
440 110 19.68310552260 57.57362663280 Mountains and rocky terrain Egyptian Vulture, Salsola omanensis
441 111 19.55871740510 57.57264857280 Mountains and rocky terrain Egyptian Vulture, Salsola omanensis
442 111 19.53987471280 57.57352474550 Mountains and rocky terrain Egyptian Vulture, Salsola omanensis
443 111 19.53953632370 57.56543175590 Mountains and rocky terrain Egyptian Vulture, Salsola omanensis
444 111 19.55837900100 57.56455464330 Mountains and rocky terrain Egyptian Vulture, Salsola omanensis
445 112 19.55369902950 57.56566074570 Mountains and rocky terrain Egyptian Vulture, Salsola omanensis
446 112 19.55328779900 57.56721321960 Mountains and rocky terrain Egyptian Vulture, Salsola omanensis
447 112 19.55239995270 57.56695151280 Mountains and rocky terrain Egyptian Vulture, Salsola omanensis
448 112 19.55281118080 57.56539904660 Mountains and rocky terrain Egyptian Vulture, Salsola omanensis
449 113 19.70195206790 57.63363792330 Mountains and rocky terrain Salsola omanensis
450 113 19.69850278290 57.63678212510 Mountains and rocky terrain Salsola omanensis
451 113 19.69804208600 57.63621868270 Mountains and rocky terrain Salsola omanensis

POIN
T ID POLYG
ON ID LATITUDE LONGITUDE DMU SPECIES
452 113 19.70149136140 57.63307447720 Mountains and rocky terrain Salsola omanensis
453 114 19.70195206790 57.63363792330 Mountains and rocky terrain and gravel and sand plains
Salsola omanensis
454 114 19.69850278290 57.63678212510 Mountains and rocky terrain and gravel and sand plains
Salsola omanensis
455 114 19.69804208600 57.63621868270 Mountains and rocky terrain and gravel and sand plains
Salsola omanensis
456 114 19.70149136140 57.63307447720 Mountains and rocky terrain and gravel and sand plains
Salsola omanensis
457 114 19.69619384590 57.64663814250 Mountains and rocky terrain and gravel and sand plains
Salsola omanensis
458 115 19.69516571750 57.64666520260 Mountains and rocky terrain and gravel and sand plains
Salsola omanensis
459 115 19.69514293900 57.64570052710 Mountains and rocky terrain and gravel and sand plains
Salsola omanensis
460 115 19.69617106740 57.64567346080 Mountains and rocky terrain and gravel and sand plains
Salsola omanensis
461 115 19.71644055920 57.62914239900 Mountains and rocky terrain and gravel and sand plains
Salsola omanensis
462 116 19.71754300030 57.62923629620 Mountains and rocky terrain and gravel and sand plains
Salsola omanensis
463 116 19.71751626340 57.62958633420 Mountains and rocky terrain and gravel and sand plains
Salsola omanensis
464 116 19.71641382250 57.62949243460 Mountains and rocky terrain and gravel and sand plains
Salsola omanensis
465 116 19.64150204020 57.57705749020 Mountains and rocky terrain and wadis and other temporary watercourses
Salsola omanensis
466 117 19.64425479230 57.58103403900 Mountains and rocky terrain and wadis and other temporary watercourses
Salsola omanensis
467 117 19.64368501920 57.58147343260 Mountains and rocky terrain and wadis and other temporary watercourses
Salsola omanensis
468 117 19.64093227650 57.57749689090 Mountains and rocky terrain and wadis and other temporary watercourses
Salsola omanensis
469 117 19.64235604160 57.57718358950 Mountains and rocky terrain and wadis and other temporary watercourses
Salsola omanensis
470 118 19.65109495660 57.57783727470 Mountains and rocky terrain and wadis and other temporary watercourses
Salsola omanensis
471 118 19.65088859130 57.58091044580 Mountains and rocky terrain and wadis and other temporary watercourses
Salsola omanensis
472 118 19.64214969140 57.58025659570 Mountains and rocky terrain and wadis and other temporary watercourses
Salsola omanensis
473 118 19.63770964260 57.57795819030 Mountains and rocky terrain and wadis and other temporary watercourses
Salsola omanensis
474 119 19.64143014530 57.57816111660 Mountains and rocky terrain and wadis and other
Salsola omanensis

POIN
T ID POLYG
ON ID LATITUDE LONGITUDE DMU SPECIES
temporary watercourses
475 119 19.64124806010 57.58187925130 Mountains and rocky terrain and wadis and other temporary watercourses
Salsola omanensis
476 119 19.63752756380 57.58167623980 Mountains and rocky terrain and wadis and other temporary watercourses
Salsola omanensis
477 119 19.70794987260 57.64623948950 Mountains and rocky terrain Salsola omanensis
478 120 19.71069300010 57.64625699970 Mountains and rocky terrain Salsola omanensis
479 120 19.71068621020 57.64744226650 Mountains and rocky terrain Salsola omanensis
480 120 19.70794308330 57.64742473610 Mountains and rocky terrain Salsola omanensis
481 120 19.70814469900 57.64732843670 Mountains and rocky terrain Salsola omanensis
482 121 19.69392274440 57.64791469920 Mountains and rocky terrain Salsola omanensis
483 121 19.69387789580 57.64670192520 Mountains and rocky terrain Salsola omanensis
484 121 19.70809984960 57.64611555550 Mountains and rocky terrain Salsola omanensis
485 121 19.64074731010 57.57706283880 Mountains and rocky terrain and wadis and other temporary watercourses
Salsola omanensis
486 122 19.64075698110 57.57706356470 Mountains and rocky terrain and wadis and other temporary watercourses
Salsola omanensis
487 122 19.64075696130 57.57706385870 Mountains and rocky terrain and wadis and other temporary watercourses
Salsola omanensis
488 122 19.64074729030 57.57706313280 Mountains and rocky terrain and wadis and other temporary watercourses
Salsola omanensis
489 122 19.64819086980 57.58105815450 Mountains and rocky terrain and wadis and other temporary watercourses
Salsola omanensis
490 123 19.64949630250 57.58135315190 Mountains and rocky terrain and wadis and other temporary watercourses
Salsola omanensis
491 123 19.64926443300 57.58249630660 Mountains and rocky terrain and wadis and other temporary watercourses
Salsola omanensis
492 123 19.64795900240 57.58220130050 Mountains and rocky terrain and wadis and other temporary watercourses
Salsola omanensis
493 123 19.72400241330 57.63642229240 Gravel and Sand Plains Salsola omanensis
494 124 19.72401149630 57.63766980300 Gravel and Sand Plains Salsola omanensis
495 124 19.72399798110 57.63766991270 Gravel and Sand Plains Salsola omanensis
496 124 19.72398889810 57.63642240220 Gravel and Sand Plains Salsola omanensis
497 124 19.72400241330 57.63642229240 Gravel and Sand Plains Salsola omanensis
498 125 19.72401149630 57.63766980300 Gravel and Sand Plains Salsola omanensis
499 125 19.72399798110 57.63766991270 Gravel and Sand Plains Salsola omanensis
500 125 19.72398889810 57.63642240220 Gravel and Sand Plains Salsola omanensis
501 126 19.72400241330 57.63642229240 Gravel and sand plains Salsola omanensis
502 126 19.72401149630 57.63766980300 Gravel and sand plains Salsola omanensis

POIN
T ID POLYG
ON ID LATITUDE LONGITUDE DMU SPECIES
503 126 19.72399798110 57.63766991270 Gravel and sand plains Salsola omanensis
504 126 19.72398889810 57.63642240220 Gravel and sand plains Salsola omanensis
505 127 19.67245274330 57.57589912920 Mountains and rocky terrain Egyptian Vulture, Salsola omanensis
506 127 19.66870682370 57.57650754300 Mountains and rocky terrain Egyptian Vulture, Salsola omanensis
507 127 19.66862964240 57.57597797980 Mountains and rocky terrain Egyptian Vulture, Salsola omanensis
508 127 19.67237556060 57.57536955390 Mountains and rocky terrain Egyptian Vulture, Salsola omanensis
509 128 19.67245274330 57.57589912920 Mountains and rocky terrain Egyptian Vulture, Salsola omanensis
510 128 19.66870682370 57.57650754300 Mountains and rocky terrain Egyptian Vulture, Salsola omanensis
511 128 19.66862964240 57.57597797980 Mountains and rocky terrain Egyptian Vulture, Salsola omanensis
512 128 19.67237556060 57.57536955390 Mountains and rocky terrain Egyptian Vulture, Salsola omanensis
513 129 19.68696581320 57.57337085070 Mountains and rocky terrain Egyptian Vulture, Salsola omanensis
514 129 19.68315853940 57.57398933190 Mountains and rocky terrain Egyptian Vulture, Salsola omanensis
515 129 19.68310567520 57.57362660810 Mountains and rocky terrain Egyptian Vulture, Salsola omanensis
516 129 19.68691294800 57.57300811840 Mountains and rocky terrain Egyptian Vulture, Salsola omanensis
517 130 19.68696581320 57.57337085070 Mountains and rocky terrain Egyptian Vulture, Salsola omanensis
518 130 19.68315853940 57.57398933190 Mountains and rocky terrain Egyptian Vulture, Salsola omanensis
519 130 19.68310567520 57.57362660810 Mountains and rocky terrain Egyptian Vulture, Salsola omanensis
520 130 19.68691294800 57.57300811840 Mountains and rocky terrain Egyptian Vulture, Salsola omanensis
521 131 19.69110962950 57.57293498710 Mountains and rocky terrain Egyptian Vulture, Salsola omanensis
522 131 19.68915556130 57.57312670050 Mountains and rocky terrain Egyptian Vulture, Salsola omanensis
523 131 19.68911256020 57.57263814010 Mountains and rocky terrain Egyptian Vulture, Salsola omanensis
524 131 19.69106662800 57.57244642090 Mountains and rocky terrain Egyptian Vulture, Salsola omanensis
525 132 19.69110962950 57.57293498710 Mountains and rocky terrain Egyptian Vulture, Salsola omanensis
526 132 19.68915556130 57.57312670050 Mountains and rocky terrain Egyptian Vulture, Salsola omanensis
527 132 19.68911256020 57.57263814010 Mountains and rocky terrain Egyptian Vulture, Salsola omanensis
528 132 19.69106662800 57.57244642090 Mountains and rocky terrain Egyptian Vulture, Salsola omanensis
529 133 19.70712539820 57.57228949140 Mountains and rocky terrain Egyptian Vulture, Salsola omanensis
530 133 19.70649586840 57.57420715740 Mountains and rocky terrain Egyptian Vulture,

POIN
T ID POLYG
ON ID LATITUDE LONGITUDE DMU SPECIES
Salsola omanensis
531 133 19.70526253900 57.57375574200 Mountains and rocky terrain Egyptian Vulture, Salsola omanensis
532 133 19.70589206370 57.57183808860 Mountains and rocky terrain Egyptian Vulture, Salsola omanensis
533 134 19.70712539820 57.57228949140 Mountains and rocky terrain Egyptian Vulture, Salsola omanensis
534 134 19.70649586840 57.57420715740 Mountains and rocky terrain Egyptian Vulture, Salsola omanensis
535 134 19.70526253900 57.57375574200 Mountains and rocky terrain Egyptian Vulture, Salsola omanensis
536 134 19.70589206370 57.57183808860 Mountains and rocky terrain Egyptian Vulture, Salsola omanensis
537 135 19.55350944520 57.56540056220 Mountains and rocky terrain Egyptian Vulture, Salsola omanensis
538 135 19.55405014240 57.56734868210 Mountains and rocky terrain Egyptian Vulture, Salsola omanensis
539 135 19.55254103660 57.56781476040 Mountains and rocky terrain Egyptian Vulture, Salsola omanensis
540 135 19.55200034400 57.56586665740 Mountains and rocky terrain Egyptian Vulture, Salsola omanensis
541 136 19.55351396460 57.56540296560 Mountains and rocky terrain Egyptian Vulture, Salsola omanensis
542 136 19.55336143710 57.56572212410 Mountains and rocky terrain Egyptian Vulture, Salsola omanensis
543 136 19.55322524410 57.56564969570 Mountains and rocky terrain Egyptian Vulture, Salsola omanensis
544 136 19.55337777150 57.56533053750 Mountains and rocky terrain Egyptian Vulture, Salsola omanensis
545 137 19.55408073580 57.56719642880 Mountains and rocky terrain Egyptian Vulture, Salsola omanensis
546 137 19.55266329830 57.56785504950 Mountains and rocky terrain Egyptian Vulture, Salsola omanensis
547 137 19.55228650490 57.56695269010 Mountains and rocky terrain Egyptian Vulture, Salsola omanensis
548 137 19.55370393920 57.56629406280 Mountains and rocky terrain Egyptian Vulture, Salsola omanensis
549 138 19.64312960370 57.57724165380 Mountains and rocky terrain Salsola omanensis
550 138 19.64525619990 57.57740128130 Mountains and rocky terrain Salsola omanensis
551 138 19.64518544490 57.57845136030 Mountains and rocky terrain Salsola omanensis
552 138 19.64305884990 57.57829171910 Mountains and rocky terrain Salsola omanensis
553 139 19.64312960370 57.57724165380 Mountains and rocky terrain Salsola omanensis
554 139 19.64525619990 57.57740128130 Mountains and rocky terrain Salsola omanensis
555 139 19.64518544490 57.57845136030 Mountains and rocky terrain Salsola omanensis
556 139 19.64305884990 57.57829171910 Mountains and rocky terrain Salsola omanensis
557 140 19.64312960370 57.57724165380 Mountains and rocky terrain Salsola omanensis
558 140 19.64525619990 57.57740128130 Mountains and rocky terrain Salsola omanensis
559 140 19.64518544490 57.57845136030 Mountains and rocky terrain Salsola omanensis
560 140 19.64305884990 57.57829171910 Mountains and rocky terrain Salsola omanensis
561 141 19.64312960370 57.57724165380 Mountains and rocky terrain Salsola omanensis

POIN
T ID POLYG
ON ID LATITUDE LONGITUDE DMU SPECIES
562 141 19.64525619990 57.57740128130 Mountains and rocky terrain Salsola omanensis
563 141 19.64518544490 57.57845136030 Mountains and rocky terrain Salsola omanensis
564 141 19.64305884990 57.57829171910 Mountains and rocky terrain Salsola omanensis
565 142 19.64620869550 57.57720380160 Mountains and rocky terrain Salsola omanensis
566 142 19.64732875020 57.58039988940 Mountains and rocky terrain Salsola omanensis
567 142 19.64571609470 57.58102949400 Mountains and rocky terrain Salsola omanensis
568 142 19.64459605030 57.57783343440 Mountains and rocky terrain Salsola omanensis
569 143 19.64620869550 57.57720380160 Mountains and rocky terrain Salsola omanensis
570 143 19.64732875020 57.58039988940 Mountains and rocky terrain Salsola omanensis
571 143 19.64571609470 57.58102949400 Mountains and rocky terrain Salsola omanensis
572 143 19.64459605030 57.57783343440 Mountains and rocky terrain Salsola omanensis
573 144 19.64620869550 57.57720380160 Mountains and rocky terrain Salsola omanensis
574 144 19.64732875020 57.58039988940 Mountains and rocky terrain Salsola omanensis
575 144 19.64571609470 57.58102949400 Mountains and rocky terrain Salsola omanensis
576 144 19.64459605030 57.57783343440 Mountains and rocky terrain Salsola omanensis
577 145 19.64620869550 57.57720380160 Mountains and rocky terrain Salsola omanensis
578 145 19.64732875020 57.58039988940 Mountains and rocky terrain Salsola omanensis
579 145 19.64571609470 57.58102949400 Mountains and rocky terrain Salsola omanensis
580 145 19.64459605030 57.57783343440 Mountains and rocky terrain Salsola omanensis
581 146 19.64209657580 57.57646003290 Mountains and rocky terrain Salsola omanensis
582 146 19.64639357270 57.58042681620 Mountains and rocky terrain Salsola omanensis
583 146 19.64515768450 57.58191824740 Mountains and rocky terrain Salsola omanensis
584 146 19.64086072020 57.57795145670 Mountains and rocky terrain Salsola omanensis
585 147 19.64209657580 57.57646003290 Mountains and rocky terrain Salsola omanensis
586 147 19.64639357270 57.58042681620 Mountains and rocky terrain Salsola omanensis
587 147 19.64515768450 57.58191824740 Mountains and rocky terrain Salsola omanensis
588 147 19.64086072020 57.57795145670 Mountains and rocky terrain Salsola omanensis
589 148 19.64209657580 57.57646003290 Mountains and rocky terrain Salsola omanensis
590 148 19.64639357270 57.58042681620 Mountains and rocky terrain Salsola omanensis
591 148 19.64515768450 57.58191824740 Mountains and rocky terrain Salsola omanensis
592 148 19.64086072020 57.57795145670 Mountains and rocky terrain Salsola omanensis
593 149 19.64685411170 57.57752122810 Mountains and rocky terrain Salsola omanensis
594 149 19.65052764450 57.57779699110 Mountains and rocky terrain Salsola omanensis
595 149 19.65028754790 57.58135985850 Mountains and rocky terrain Salsola omanensis
596 149 19.64661402250 57.58108401510 Mountains and rocky terrain Salsola omanensis
597 150 19.64685411170 57.57752122810 Mountains and rocky terrain Salsola omanensis
598 150 19.65052764450 57.57779699110 Mountains and rocky terrain Salsola omanensis
599 150 19.65028754790 57.58135985850 Mountains and rocky terrain Salsola omanensis
600 150 19.64661402250 57.58108401510 Mountains and rocky terrain Salsola omanensis
601 151 19.64685411170 57.57752122810 Mountains and rocky terrain Salsola omanensis
602 151 19.65052764450 57.57779699110 Mountains and rocky terrain Salsola omanensis
603 151 19.65028754790 57.58135985850 Mountains and rocky terrain Salsola omanensis

POIN
T ID POLYG
ON ID LATITUDE LONGITUDE DMU SPECIES
604 151 19.64661402250 57.58108401510 Mountains and rocky terrain Salsola omanensis
605 152 19.65856940860 57.57791581690 Mountains and rocky terrain Salsola omanensis
606 152 19.65755417560 57.58331883210 Mountains and rocky terrain Salsola omanensis
607 152 19.65447246770 57.58267357970 Mountains and rocky terrain Salsola omanensis
608 152 19.65548767910 57.57727066250 Mountains and rocky terrain Salsola omanensis
609 153 19.65856940860 57.57791581690 Mountains and rocky terrain Salsola omanensis
610 153 19.65755417560 57.58331883210 Mountains and rocky terrain Salsola omanensis
611 153 19.65447246770 57.58267357970 Mountains and rocky terrain Salsola omanensis
612 153 19.65548767910 57.57727066250 Mountains and rocky terrain Salsola omanensis
613 154 19.65856940860 57.57791581690 Mountains and rocky terrain Salsola omanensis
614 154 19.65755417560 57.58331883210 Mountains and rocky terrain Salsola omanensis
615 154 19.65447246770 57.58267357970 Mountains and rocky terrain Salsola omanensis
616 154 19.65548767910 57.57727066250 Mountains and rocky terrain Salsola omanensis
617 155 19.63349841730 57.57696980810 Mountains and rocky terrain Salsola omanensis
618 155 19.64144591060 57.57756651720 Mountains and rocky terrain Salsola omanensis
619 155 19.64115564420 57.58187230950 Mountains and rocky terrain Salsola omanensis
620 155 19.63320817040 57.58127539040 Mountains and rocky terrain Salsola omanensis
621 156 19.63349841730 57.57696980810 Mountains and rocky terrain Salsola omanensis
622 156 19.64144591060 57.57756651720 Mountains and rocky terrain Salsola omanensis
623 156 19.64115564420 57.58187230950 Mountains and rocky terrain Salsola omanensis
624 156 19.63320817040 57.58127539040 Mountains and rocky terrain Salsola omanensis
625 157 19.63349841730 57.57696980810 Mountains and rocky terrain Salsola omanensis
626 157 19.64144591060 57.57756651720 Mountains and rocky terrain Salsola omanensis
627 157 19.64115564420 57.58187230950 Mountains and rocky terrain Salsola omanensis
628 157 19.63320817040 57.58127539040 Mountains and rocky terrain Salsola omanensis
629 158 19.55670991280 57.56894705560 Mountains and rocky terrain Salsola omanensis
630 158 19.55643295000 57.56976511540 Mountains and rocky terrain Salsola omanensis
631 158 19.55578056170 57.56951932100 Mountains and rocky terrain Salsola omanensis
632 158 19.55605752330 57.56870126400 Mountains and rocky terrain Salsola omanensis
633 159 19.55670991280 57.56894705560 Mountains and rocky terrain Salsola omanensis
634 159 19.55643295000 57.56976511540 Mountains and rocky terrain Salsola omanensis
635 159 19.55578056170 57.56951932100 Mountains and rocky terrain Salsola omanensis
636 159 19.55605752330 57.56870126400 Mountains and rocky terrain Salsola omanensis
637 160 19.68984283040 57.57284295880 Mountains and rocky terrain Salsola omanensis
638 160 19.68994506450 57.57286492470 Mountains and rocky terrain Salsola omanensis
639 160 19.68994216490 57.57287996840 Mountains and rocky terrain Salsola omanensis
640 160 19.68983993070 57.57285800260 Mountains and rocky terrain Salsola omanensis
641 161 19.68786495050 57.57032748910 Mountains and rocky terrain Salsola omanensis
642 161 19.69163008680 57.57249932200 Mountains and rocky terrain Salsola omanensis
643 161 19.69000697840 57.57563582310 Mountains and rocky terrain Salsola omanensis
644 161 19.68624188070 57.57346394100 Mountains and rocky terrain Salsola omanensis
645 162 19.70935799380 57.57706328780 Wadis and other temporary Ochradenus

POIN
T ID POLYG
ON ID LATITUDE LONGITUDE DMU SPECIES
watercourses harsusiticus
646 162 19.69226728590 57.57713299490 Wadis and other temporary watercourses
Ochradenus harsusiticus
647 162 19.69224946460 57.57228146370 Wadis and other temporary watercourses
Ochradenus harsusiticus
648 162 19.70934018360 57.57221124140 Wadis and other temporary watercourses
Ochradenus harsusiticus
649 163 19.71423442200 57.57718124020 Wadis and other temporary watercourses
Ochradenus harsusiticus
650 163 19.71323896550 57.57738768630 Wadis and other temporary watercourses
Ochradenus harsusiticus
651 163 19.71318858510 57.57711681440 Wadis and other temporary watercourses
Ochradenus harsusiticus
652 163 19.71418404130 57.57691036670 Wadis and other temporary watercourses
Ochradenus harsusiticus
6 REFERENCES
TERRESTRIAL ENVIRONMENT
5OES. 2015. PDCs Port of Duqm and medium industrial zone winter terrestrial ecological baseline survey. Unpublished technical report
Al Fazari, W. A. & McGrady, M.J. 2016. Counts of Egyptian Vultures Neophron percnopterus and other avian scavengers at Muscat’s municipal landfill, Oman, November 2013–March 2015. Sandgrouse 38: 99-105
Angelov, I., Yotsova, T., Sarrouf, M. & McGrady, M. J. 2013. Large increase of the Egyptian Vulture Neophron percnopterus population on Masirah Island, Oman. Sandgrouse 33: 140-152.
APLIC (Avian Powerline Interaction Committee). 2006. Suggested practices for avian protection on powerlines: the state of the art in 2006. Edison Electricity Institute, APLIC and the California Energy Commission. Washington DC and Sacramento, CA, USA.
BirdLife International. 2017. Species factsheet: Neophron percnopterus. Downloaded from http://www.birdlife.org on 04/05/2017.
Cuthbert, R., Green, R. E., Ranade, S., Saravanan, S., Pain, D.J., Prakash, V. & Cunningham, A. 2006. Rapid population declines of Egyptian vulture (Neophron percnopterus) and red-headed vulture (Sarcogyps calvus) in India. Anim. Conserv. 9: 349-354.
Ekstrom, J., Bennum, L & Mitchell, R. 2015. A cross-sector guide for the implementing the mitigation hierarchy. Unpublished report by The Biodiversity Consultancy
Eriksen, J. & Victor, R. 2013. Oman Bird List. Center of Environmental Studies and Research, Sultan Qaboos University. Muscat, Oman.
Fisher, M., Ghazanfar, S and Spalton A. 1999. The natural history of Oman: A festschrift for Michael Gallagher. Backhuys Publishers, Leiden.

Gangoso, L., Palacios, C.-J. 2005. Ground nesting by Egyptian Vultures (Neophron percnopterus) in the Canary Islands. Journal of Raptor Research 39: 186-187.
Ghazanfar, S. 2003. Flora of Oman vol 1 Piperaceae-Primulaceae. Scripta Botanica Belgica 25
HMR. 2015a. Duqm Oil Refinery EIA: Appendix A Environmental Baseline Survey. Unpublished technical report.
HMR. (2015). Document No 3514-EIA-01 Environmental Impact Assessment Study Report - Duqm Refinery; Project No: HMR #3514.
HMR. 2015e. Services corridor EIA. Unpublished technical report.
IFC 2012. Performance Standard 6. Biodiversity conservation and sustainable management of living natural resources. http://www.ifc.org/wps/wcm/connect/bff0a28049a790d6b835faa8c6a8312a/PS6_English_2012.pdf?MOD=AJPERES Accessed 1 May 2017
ISO. (1987). ISO 1996-2:1987 Description and measurement of environmental noise — Part 2: Guide to the acquisition of data pertinent to land use. Geneva: International Standards Organisation. 5OES. 2011. Duqm Industrial Zone EIA. Unpublished technical report
Jennings, M.C. 2010. Atlas of the breeding birds of Arabia. Fauna of Arabia, Vol. 25, 772pp.
Mallon, D. and Budd, K. (eds). 2011. Regional Red List Status of Carnivores in the Arabian Peninsula. Cambridge, UK and Gland Switzerland: IUCN, and Sharjah, UAE: Environment and Protected Areas Authority
Margalida, A.; Bogliani, G.; Bowden, C. G. R.; Donázar, J. A.; Genero, F.; Gilbert, M.; Karesh, W. B.; Kock, R.; Lubroth, J.; Manteca, X.; Naidoo, V.; Neimanis, A.; Sánchez-Zapata, J. A.; Taggart, M. A.; Vaarten, J.; Yon, L.; Kuiken, T.; Green, R. E. 2014. One health approach to use of veterinary pharmaceuticals. Science 346: 1296-1298.
Markandya, A., Taylor, T., Longo, A., Murty, M.N., Murty, S. & Dhavala, K. 2008. Counting the cost of vulture decline—an appraisal of the human health and other benefits of vultures in India. Ecological economics 67: 194-204.
Oppel, S., Dobrev, V., Arkumarev, V., Saravia, V., Bounas, A., Kret, E., Velevski, M., Stoychev, S. & Nikolov, S.C. 2015. High juvenile mortality during migration in a declining population of a long-distance migratory raptor. Ibis 157: 545-557.
Patzelt, A. 2014. Oman Plant Red Data Book. Oman Botanic Garden Publication no. 1, Diwan of the Royal Court, Sultanate of Oman
Prinsen, H.A.M., Smallie, J.J., Boere, G.C. & Píres, N. (Compilers) 2012. Guidelines on How to Avoid or Mitigate Impact of Electricity Power Grids on Migratory Birds in the African-Eurasian Region. AEWA Conservation Guidelines No. 14, CMS Technical Series No. 29, AEWA Technical Series No. 50, CMS Raptors MOU Technical Series No. 3, Bonn, Germany.
Rogers, T. D. 1988. A new list of the birds of Masirah Island, Sultanate of Oman. Oman Bird Record Committee.
MARINE ENVIRONMENT
CETACEANS
Al-Jufaili, S., 2014. Seasonal and Interannual Changes of Indian OilSardine, Sardinella longiceps, Landings in the Governorate of Muscat (the Sea of Oman). MarineFisheries Review, 76(3), pp.50-60. Piontkovski, S.A. and Al-Oufi, H.S., 2014. Oxygen minimum zone and fish landings along the Omani shelf.Journal of Fisheries and Aquatic Science, 9(5), p.294.

Bailey H, Mate B, Palacios D, Irvine L, Bograd S, Costa D. 2009 Behavioural estimation of blue whale movements in the Northeast Paci c from state-space model analysis of satellite tracks. Endangered Species Res. 10, 93–106. (doi:10.3354/esr00239)
Baird, S.J., N. Bagley, J.A. Devine, S. Gauthier and J. McKoy et al., 2009. Fish resources of the Arabian Sea coast of Oman: Habitat, biodiversity and oceanography. Technical Report 5, Final Report Prepared for the Sultanate of Oman, Ministry of Fish Wealth (MFW), Muscat, pp: 1-163.
Baldwin, R. M. 2000. Oman's humpback whales (Megaptera novaeangliae) The Journal of Oman Studies 11 11-18.
Baldwin, R. M. 2003. Whales and Dolphins of Arabia. Mazoon Printing Press, Muscat, Oman. 116pp. Baldwin, R.M., Gallagher, M.D. and Van Waerebeek, K. 1999. A review of cetaceans from waters off the Arabian Peninsula. In: Oman’s Natural History, eds. Fisher, M., Spalton, A. and Gazanfar, S.,Backhuys Publishers, Leiden. Pp. 161-189.
Baldwin, R.M., Gallagher, M.D. and Van Waerebeek, K. 1999. A review of cetaceans from waters off the Arabian Peninsula. In: Oman’s Natural History, eds. Fisher, M., Spalton, A. and Gazanfar, S., Backhuys Publishers, Leiden. Pp. 161-189.
Baldwin, R.M., Collins, M., Van Waerebeek, K., Minton, G., 2004. The Indo-Pacific humpback dolphin of the Arabian region: a status review. Aquat. Mamm. 30, 111–124.
Baldwin, R. M. Collins, T., Minton, G., Willson, A., Corkeron, P. 2011. Arabian Sea humpback whales2011 update: Resights bubble feeding and hotspots. Paper submitted to the International Whaling Commission Scientific Committee, IWC Norway, 30 May – 11 June. SC/63/SH27 (Available from IWC Office)
Bloomberg (22nd April 2016) Masirah Oil Limited Completes Drilling of the Manarah-1 Well in Block 50. http://www.bloomberg.com/research/stocks/private/snapshot.asp?privcapId=252127255
Braulik, G.T., Findlay, K.P., Cerchio, S., Baldwin, R.M. 2016. Assessment of the conservation status of the Indian Ocean Humpback dolphin Sousa plumbea using the IUCN Red List Criteria, in: Humpback Dolphins (Sousa spp.): Current Status and Conservation. Eds T.A. Jefferson, B.E. Curry, Advances in Marine Biology.
Brown, S.G. 1957. Whales observed in the Indian Ocean. Notes on their distribution. Mar. Obs. 27(177): 157–65.
Clapham, P.J., Young, S.B. and Brownell, R.L., 1999. Baleen whales: conservation issues and the status of the most endangered populations. Mammal review, 29(1), pp.37-62.
Cockcroft, V.G., 1989. Biology of Indopacific humpback dolphins (Sousa plumbea) off Natal,South Africa. In: Paper presented at the Eight Biennial Conference on the Biology ofMarine Mammals, Pacific Grove, CA (unpublished). Available at http://www.marinemammalscience.org.
Collins, T., Minton, G., Baldwin, R., Van Waerebeek, K., Hywel Davies, A., Cockroft, V.,2002. A preliminary assessment of the frequency, distribution and causes of mortality of beach cast cetaceans in the Sultanate of Oman, January 1999 to February 2002. In: Paper SC/54/O4 presented to the IWC Scientific Committee, May 2002 (unpublished). 13 pp (available from the Office of this Journal).
Corkeron, P, Minton, G., Collins, T., Findlay, K., Willson, A., and Baldwin., R . 2011. Spatial models of sparse data to inform cetacean conservation planning: an example from Oman. Endangered Species Reseearch Vol. 15:39-52.
Environment Soceity of Oman, 2015. Annual Report pp18. Freitas, C., Lydersen, C., Fedak, M.A. and Kovacs, K.M. 2008. A simple new algorithm to filter marinemammal Argos locations. Marine Mammal Science, 24: 315-325.
Evangelista, J., 2002. Scaling the tanker market. Surveyor (American Bureau of Shipping), 4, pp.5-8.

Friedmann, Y., Daly, B., 2004. Red Data Book of the Mammals of South Africa: A Conservation Assessment. CBSG southern Africa. Conservation Breeding Specialist Group (SSC/IUCN) Endangered Wildlife Trust, Johannesburg, South Africa.
Harris, P.T., Macmillan-Lawler, M., Rupp, J. & Baker, E.K. (2014) Geomorphology of the oceans. Marine Geology, 352, 4–24.
IUCN. 1986. Oman Coastal Zone Management Plan: Greater Capital Area. IUCN, Gland, Switzerland. 79pp.
International Whaling Commission. 2015. Report of the Scientific Committee. IWC/66/Rep01(2015). International Whaling Commission San Diego, CA, USA, 2015, (available from IWC office).
IWC, 2002. Annex K. Report of the standings sub-committee on small cetaceans. J. Cetac.Res. Manag. 4 (Suppl.), 325–338
Jabado, R.W, and Ebert, D. A., (2015). Sharks of the Arabian Seas: an identification guide. International Fund for Animal Welfare, Dubai, UAE. 240pp
Jefferson,T.A.,Rosenbaum,H.C., 2014.Taxonomic revision of the humpback dolphins (Sousa spp.), and description of a new species from Australia. Mar. Mamm. Sci. 30, 1494–1541.
Karczmarski, L., 1996. Ecological Studies of Humpback Dolphins Sousa chinensis in the Algoa Bay region, eastern cape, South Africa., In Faculty of Science. University of Port Elizabeth.
Karczmarski, L., Winter, P.E.D., Cockroft, V.G., McLachlan, A., 1999. Population analyses of Indo-Pacific humpback dolphins Sousa chinensis in Algoa Bay, Eastern Cape, South Africa. Mar. Mamm. Sci. 15, 1115–1123.
Kennedy, A.S., Zerbini, A.N., Vásquez, O.V., Gandilhon, N., Clapham, P.J. and Adam., O. 2013. Local and migratory movements of humpback whales (Megaptera novaeangliae) satellite-tracked in the North Atlantic Ocean. Canadian Journal of Zoology, 2014, 92:9-18, 10.1139/cjz-2013-0161
Martin-Mehers, G. 2016. Western Grey Whales Advisory Pannel: Stories of Influence. IUCN, WWF, IFAW. 38 pages.
Mendez, M., Subramanian, A., Collins, T., Minton, G., Baldwin, R., Berggren, P., Sa¨rnblad, A., Amir, O.A., Peddemors, V.M., Karczmarski, L., Guissamulo, A.,Rosenbaum, H.C., 2011. Molecular ecology meets remote sensing: environmental drivers to population structure of humpback dolphins in the Western Indian Ocean. Heredity, 107, 349–361.
Mikhalev, Y. A. 1997. Humpback whales Megaptera novaeangliae in the Arabian Sea. Marine Ecology Progress Series 149:13-21.
Mikhalev, Y. A. 2000. Whaling in the Arabian Sea by the whaling fleets Slava and Sovetskaya Ukraina. In: Tormosov, D.D., Mikhalev, Y.A., Best, P.B., B., Zemsky, V.A., Sekiguchi, K., and Brownell Jr, R.L., editors. Soviet Whaling Data [1949-1979]. Moscow: Center for Russian Environmental Policy, Marine Mammal Council. p 141-181.
Minton, G., Collins, T. J. Q., Pomilla, C., Findlay, K. P., Rosenbaum, H. C., Baldwin, R., and Brownell Jr, R. L. 2008. Megaptera novaeangliae, Araiban Sea subpopulation. IUCN Red List of Threatened Species http://www.iucnredlist.org/details/132835.
Minton, G., T. J. Q. Collins, K. P. Findlay & R. Baldwin (2010) Cetacean distribution in the coastal waters of the Sultanate of Oman. Journal of Cetacean Research and Management, 11, 301-313.
Minton, G., T. J. Q. Collins, K. P. Findlay, P. J. Ersts, H. C. Rosenbaum, P. Berggren & R. M. Baldwin (2011) Seasonal distribution, abundance, habitat use and population identity of humpback whales in Oman. Journal of Cetacean Research and Management, Special Issue on Southern Hemisphere Humpback Whales, 185–198.
Minton, G., Reeves, R., Collins, T. and Willson, A. 2015. Report on the Arabian Sea Humpback Whale Workshop: Developing a collaborative research and conservation strategy. Dubai, 27-29 January 2015

Papastavrou. V and Van Waerebeek. K. (1997). A Note on the Occurrence of Humpback Whales (Megaptera novaeangliae) in Tropical and Subtropical Areas: The Upwelling Link. Paper SC/48/O 39 presented to the International Whaling Commission Scientific Committee, (available from the IWC Office).
Pomilla, C. Amaral, A., Collins, T., Minton, G., Findlay, K., Leslie, M., Ponnampalam, L., Baldwin, R.,Rosenbaum, H. 2014. The World’s Most Isolated and Distinct Whale Population? Humpback Whales of the Arabian Sea. PLoS ONE, 9(12), p.e114162. Available at: http://dx.plos.org/10.1371/journal.pone.0114162.
Ponnampalam, Louisa S., Tim J.Q. Collins, Gianna Minton, Isabelle Schulz, Howard Gray, Rupert F. G. Ormond and Robert M. Baldwin. 2012. Stomach contents of small cetaceans stranded along the Sea of Oman and Arabian Sea coasts of the Sultanate of Oman. Journal of the Marine Biological Association of the United Kingdom, 92, pp 16991710 doi:10.1017/ S0025315411002104
Read, A.J., 2008. The looming crisis: interactions between marine mammals and fisheries. Journal of Mammalogy, 89(3), pp.541-548.
Reeves, R.R., Leatherwood, S. and Papastavrou, V. 1991. Possible stock affinities of humpback whales in the northern Indian Ocean. pp.259–70. In: Leatherwood, S. and Donovan, G. (eds). Cetaceans and Cetacean Research in the Indian Ocean Sanctuary: Marine mammal technical report number 3. UNEP, Nairobi, Kenya. United Nations Environment Programme, Marine Mammal Technical Report Number 3.
Reeves, R.R., Leatherwood, S. and Papastavrou, V. 1991. Possible stock affinities of humpback whales in the northern Indian Ocean. pp.259–70. In: Leatherwood, S. and Donovan, G. (eds). Cetaceans and Cetacean Research in the Indian Ocean Sanctuary: Marine mammal technical report number 3. UNEP, Nairobi, Kenya. United Nations Environment Programme, Marine Mammal Technical Report Number 3.
Reeves, R.R., Dalebout, M.L., Jefferson, T.A., Karczmarski, L., Laidre, K., O’Corry-Crowe, G., Rojas-Bracho, L., Secchi, E.R., Slooten, E., Smith, B.D., Wang, J.Y., Zhou, K., 2008. Sousa chinensis. IUCN 2013. IUCN Red List of Threatened Species. Version 2013.2. Downloaded on 04 February 2014, www.iucnredlist.org.
Robbins, J., Zerbini, A. N., Gales, N., Gulland, F. M. D., Double, M., Clapham, P., Andrews-Goff, V., Kennedy, A.S., Landry, S., Matilla, D. K. and Tackaberry, J. 2013. Satellite tag effectiveness and impacts on large whales: preliminary results of a case study with Gulf of Maine humpback whales. Paper SC/65a/SH05 presented to the International Whaling Commission Scientific Committee, Jeju, South Korea, June 2013. 10pp. (Available from the IWC Office)
Rosenbaum, H. C., Maxwell, S.M., Kershaw, F., Mate, B. 2014. Long-range movement of humpback whales and their overlap with anthropogenic activity in the South Atlantic Ocean. Conservation Biology. 2014 Apr;28(2):604-15. doi: 10.1111/cobi.12225. Epub 2014 Feb 4.
Salm, R. V., R. A. C. Jensen, and V. Papastavrou. 1993. Marine fauna of Oman: Cetaceans, turtles, seabirds and shallow water corals. Pages 1-66. IUCN, Gland, Switzerland.
Sherman, L., 2006. Tracking the great whales. Terra. Oregon State University 1 (2), 1–8. Slijper, E.J., van Utrecht, W.L. and Naaktgeboren, C. 1964. Remarks on the distribution and migration ofwhales, based on observations from Netherlands ships. Bijdr. Dierkd. 34: 3–93.
Thomas, P.O., Reeves, R.R. and Brownell, R.L., 2015. Status of the world's baleen whales. Marine Mammal Science.
Van Bressem, M.F., Minton, G., Collins, T., Willson, A., Baldwin, R andVan Warebeek, K. 2014. Tatoo-like skin disease in the endangered subpopulation of the Humpback Whale, Megaptera novaeangliae, in Oman (Cetacea: Balaenopteridae). Zoology in the Middle East, 2014. http://dx.doi.org/10.1080/09397140.2014.994316

Willson, A., Baldwin, R., Minton, G. and Collins, T. 2012. Arabian Sea humpback whale research update for 2011/2012. Paper SC/64/SH30 presented to the International Whaling Commission Scientific Committee, Panama June 2012, (available from the IWC Office).
Willson, A., Baldwin, R., Minton, G., Gray, H., Findlay, K., Collins, T. 2013. Arabian Sea humpback whale research update for 2012/13. Paper SC/65a/SH06 presented to the International Whaling Commission Scientific Committee, Jeju, South Korea, June 2013. 08pp. (Available from the IWC Office).
Willson, A., Collins, T. Baldwin, R., Cerchio, S., Geyer, Y., Godley B., Gray, H., Al-Harthi, S., Minton, Al-Zehlawi, N., M.Witt., Rosenbaum, H., Zerbini, A. 2014. Preliminary results and first insights from satellite tracking studies of male Arabian Sea humpback whales. Paper SC/65b/SH19 presented to the International Whaling Commission Scientific Committee, Slovenia, May 2014. (Available from the IWC Office).
Willson, A., Baldwin, R., Cerchio, S., Collins, T. Findlay, K., Gray, H., Godley B., Al-Harthi, S., Kennedy, A., Minton, G., Zerbini, A and Witt, M. 2015. Research update of satellite tracking studies of male Arabian Sea humpback whales; Oman. Paper SC/66a/SH22 presented to the International Whaling Commission Scientific Committee, San Diego, May 2015. (Available from the IWC Office).
Witt, M.J. Broderick, A. C., Coyne, M. S., Formia, A., Ngouessono, S., Parnell, R. J., Sounguet., G., and Godley. 2008. Satellite tracking highlights difficulties in the design of effective protected areas for Critically Endangered leatherback turtles Dermochelys coriacea during the inter-nesting period. Oryx, 42(02), pp.296-300.
Witteveen, B.H., Foy, R.J., Wynne, K.M. and Tremblay, Y., 2008. Investigation of foraging habits and prey selection by humpback whales (Megaptera novaeangliae) using acoustic tags and concurrent fish surveys. Marine Mammal Science, 24(3), pp.516-534.
Wray, P. and Martin, K.R. 1983. Historical whaling records from the western Indian Ocean. Rep. int. Whal. Commn (special issue) (5): 213–41.
TURTLES
Avens, L. and Snover, M.L. 2013. Age and age estimation in sea turtles. In: J. Wyneken, K.J. Lohmann & J.A. Musick (ed.), The biology of sea turtles. Volume III., pp. 97-133. CRC Press, Boca Raton, FL, USA.
Baillie, J. and Groombridge, B. (eds). 1996. 1996 IUCN Red List of Threatened Animals. pp. 378. International Union for Conservation of Nature, Gland, Switzerland and Cambridge, UK.
Baldwin, R.M. 1999. The ecology and conservation status of sea turtles of Oman. In: The Natural History of Oman: A Festschrift for Michael Gallagher. M. Fisher, S.A. Gazanfar and J.A. Spalton (eds), pp89-98. Backhuys publishers, Leiden.
Baldwin, R.M. & Al-Kiyumi, A. 1996. Marine Turtles of the Sultanate of Oman. National Report, Northern Indian Ocean, Sea Turtle Workshop and Strategic Planning Session, January 13-18, 1996. Unpublished Report.
Baldwin, R., G.R. Hughes, and R.I.T. Prince. 2003. Loggerhead turtles in the Indian Ocean. Pages 218-232 in Bolten, A.B. and B.E. Witherington (editors). Loggerhead Sea Turtles. Smithsonian Institution Press, Washington, D.C.
Bjorndal, K.A. and Jackson, J.B.C. 2003. Role of sea turtles in marine ecosystems-reconstructing the past. In: P.L. Lutz, J.A. Musick and J. Wyneken (eds), Biology of Sea Turtles, Vol. II, pp. 259-273. CRC Press, Boca Raton.
Bolten, A.B. and Witherington, B.E. 2003. Loggerhead Sea Turtles. Smithsonian Books, Washington, D.C., USA.

Bowen, B.W. and Karl, S.A. 1997. Population genetics, phylogeography, and molecular evolution. In: Lutz, P.L. and Musick, J.A. (eds), The Biology of Sea Turtles, pp. 29-50. CRC Press, Boca Raton.
Bowen, B.W., Grant, W.S., Hillis-Starr, Z., Shaver, D.J., Bjorndal, K.A., Bolten, A.B. and Bass, A.L. 2007. Mixed Stock analysis reveals the migrations of juvenile hawksbill turtles (Eretmochelys imbricata) in the Caribbean Sea. Molecular Ecology 16: 49-60.
Carr, A. 1987. New perspectives on the pelagic stage of sea turtle development. Conservation Biology 1: 103.
Carr, A. and Meylan, A.B. 1980. Evidence of passive migration of green turtle hatchlings in Sargassum. Copeia 1980: 366-368.
Carr, A. 1986. The Sea Turtle: So Excellent a Fishe. University of Texas Press, Austin. 280 pp.
Casale, P. 2015. Caretta caretta (North West Indian Ocean subpopulation). The IUCN Red List of Threatened Species 2015: e.T84127873A84127992. http://dx.doi.org/10.2305/IUCN.UK.2015-4.RLTS.T84127873A84127992.en. Downloaded on 16 June 2017.
Conant, T.A., P.H. Dutton, T. Eguchi, S.P. Epperly, C.C. Fahy, M.H. Godfrey, S.L. MacPherson, E.E. Possardt, B.A. Schroeder, J.A. Seminoff, M.L. Snover, C.M. Upite, and B.E. Witherington. 2009. Loggerhead sea turtle (Caretta caretta) 2009 status review under the U.S. Endangered Species Act. Report of the Loggerhead Biological Review Team to the National Marine Fisheries Service, August 2009. 222 pages.
Chaloupka, M.Y. and Musick, J.A. 1997. Age, growth, and population dynamics. In: P.L. Lutz and J.A. Musick (eds) The Biology of Sea Turtles, pp. 233-273. CRC Press, Boca Raton, Florida.
Dobbs, K.A., Miller, J.D., Limpus, C.J. and Landry Jr, A.M. 1999. Hawksbill turtle, Eretmochelys imbricata, nesting at Milman Island, northern Great Barrier Reef, Australia. Chelonian Conservation and Biology 3(2): 344-361.
Fefer, S and Manski, D. 2009. U.S. Department of Interior Technical Assistance Assessment. Daymmaniyat Islands and Ras al Hadd Turtle Nature Reserves, Oman. Unpublished report submitted to Ministry of Environment and Climate Affairs, Oman. 75pp.
Five Oceans Environmental Services. 2015. Specialist inputs to Port of Duqm EIA surveys. Unpublished report submitted to Royal Haskonign DHV, Oman. pp 72.
Groombridge, B. and Luxmoore, R. 1989. The Green Turtle and Hawksbill (Reptilia: Cheloniidae): World Status, Exploitation and Trade. Secretariat of the Convention on International Trade in Endangered Species of Wild Fauna and Flora, Lausanne, Switzerland, 601 pp.
Hays, G.C., Fossette, S., Katselidis, K.A., Schofield, G. and Gravenor, M.B. 2010. Breeding periodicity for male sea turtles, operational sex ratios, and implications in the face of climate change. Conservation Biology 24: 1636-1643.
Hirth, H.F. 1997. Synopsis of the biological data on the green turtle, Chelonia mydas (Linnaeus 1758). United States Fish and Wildlife Service Biological Report 97-1. 120 pp
Hutchinson, J. & Simmonds, M. (1992) Escalation of threats to marine turtles. Oryx 26(2) 95-102.
IUCN 1986. The Proposed Daymaniyat Islands National Nature Reserve Management Plan. Unpublished report submitted to the Ministry of Commerce and Industry, Sultanate of Oman. pp45.
IUCN. 1991. Turtles in Oman. Status, Threats and Management Options. Scientific results of the IUCN Coastal Zone Management Project. CZMP4:F11. IUCN, Gland, Switzerland. 32 pp.
Limpus, C.J. 1992. The hawksbill turtle, Eretmochelys imbricata, in Queensland: population structure within a southern Great Barrier Reef ground. Wildlife Research 19: 489-506.
Limpus, C.J. and Miller, J.D. 2000. Final Report for Australian Hawksbill Turtle Population Dynamics Project. A Project Funded by the Japan Bekko Association to Queensland Parks and Wildlife Service. Dr. Colin J. Limpus and Dr. Jeffrey D. Miller, Planning and Research Division,

Queensland Parks and Wildlife Service, P.O. Box 155, Brisbane Albert Street, Qld 4002, Australia.
Limpus, C.J., Couper, P.J. and Read, M.A. 1994. The green turtle, Chelonia mydas, in Queensland: population structure in a warm temperate feeding area. Memoirs of the Queensland Museum 35: 139-154.
Meylan, A.B., & Donnelly, M. 1999. Status justification for listing the hawksbill turtle (Eretmochelys imbricata) as Critically Endangered on the 1996 IUCN Red List of Threatened Animals. Chelonian Conservation and Biology 3(2): 200-224.
Mortimer, J.A & Donnelly, M. (IUCN SSC Marine Turtle Specialist Group). 2008. Eretmochelys imbricata. The IUCN Red List of Threatened Species 2008: e.T8005A12881238. http://dx.doi.org/10.2305/IUCN.UK.2008.RLTS.T8005A12881238.en. Downloaded on 16 June 2017.
Mortimer, J.A., Collie, J.,Jupiter, T. Chapman, R. Liljevik, A. and Betsy, B. 2003. Growth rates of immature hawksbills (Eretmochelys imbricata) at Aldabra Atoll, Seychelles (Western Indian Ocean). In: J.A. Seminoff (ed.), Proceedings of the Twenty-Second Annual Symposium on Sea Turtle Biology and Conservation, pp. 247.
Mortimer, J.A., Day, M. and Broderick, D. 2002. Sea turtle populations of the Chagos Archipelago, British Indian Ocean Territory. In: A. Mosier, A. Foley and B. Brost (eds), Proceedings of the Twentieth Annual Symposium on Sea Turtle Biology and Conservation, pp. 47-49.
Mortimer, J. and Bresson, R. 1999. Temporal distribution and periodicity in hawksbill turtles (Eretmochelys imbricata) nesting at Cousin Island, Republic of Seychelles, 1971-1997. Chelonian Conservation and Biology 3(2): 318-325.
Mortimer, J.A. and Portier, K.M. 1989. Reproductive homing and internesting behaviour of the green turtle (Chelonia mydas) at Ascension Island, South Atlantic Ocean. Copeia 1989: 962.
Musick, J.A. and Limpus, C.J. 1997. Habitat utilization and migration in juvenile sea turtles. In: P.L. Lutz and J.A. Musick (eds) The Biology of Sea Turtles, pp. 137-164. CRC Press, Boca Raton, Florida.
Pilcher, N. J., Antonopoulou, M., Perry, L., Abdel-Moati, M. A., Al Abdessalaam, T. Z., Albeldawi, M., Baldwin, R., et al. 2014. Identification of Important Sea Turtle Areas (ITAs) for hawksbill turtles in the Arabian Region. Journal of Experimental Marine Biology and Ecology, 460, 89-99.
Plotkin, P. 2003. Adult migrations and habitat use. In: P.L. Lutz, J.A. Musick & J. Wyneken (ed.), The Biology of Sea Turtles. Volume II, pp. 225-241. CRC Marine Biology Series, CRC Press, Inc., Boca Raton, London, New York, Washington D.C.
Rees, A. F., Kiyumi, A., Broderick, A. C., Papathanasopoulou, N., Godley, B. J. 2012 Conservation Related insights into the behaviour of the olive ridley sea turtle Lepidochelys olivacea nesting in Oman. Marine Ecology Progress Series 450:195-205.
Rhodin, A.G.J. & Pritchard, P.C.H.(eds.). 1999. Special Focus Issue: The Hawksbill Turtle, Eretmochelys imbricata. Chelonian Conservation and Biology 3(2):169-388.)
Ross, J. P. 1979. Sea Turtles in the Sultanate of Oman. Manuscript Report of IUCN/WWF Project 1320.
Ross J. P. 1998. Estimations of the nesting population size of loggerhead sea turtles, Caretta caretta, Masirah Island, Sultanate of Oman. Pages 84-87 in Epperly, S. P. ,Braun, J. Compilers, Proceedings of the Seventeenth Annual Sea Turtle Symposium. NOAA Technical Memorandum NMFS-SEFSC-415.
Ross J. P., and M. A. Barwani. 1982. Review of turtles in the Arabian Area. Pages 373-383 in K. A. Bjorndal, editor. Biology and conservation of sea turtles. Smithsonian Institution Press, Washington, D.C.
Ross, J.P. 1985. Biology of the green turtle, Chelonia mydas, on an Arabian feeding ground, J. Herpetol., 19, 459, 1985

Salm, R.V. & Salm, S.W. 1991. Sea turtles in the Sultanate of Oman. Muscat: Mazoon Printing Press.
Salm, R.V. (1991). Turtles in Oman. Status, Threats and Management Options. Manuscript report of IUCN Coastal Zone Management Project CZMP4:F11. 32pp.
Salm, R.V., Jensen, R.A.C. & Papastavrou, V.A. (1993). Marine Fauna of Oman: Cetaceans, Turtles, Seabirds and Shallow Water Corals. IUCN, Gland, Switzerland. 66 pp.
Salm, R.V. & Salm, S.W. (1991). Sea turtles in the Sultanate of Oman. Muscat: Mazoon Printing Press.
Salm, R. V., R. A. C. Jensen, and V. Papastavrou. 1993. Marine fauna of Oman: Cetaceans, turtles, seabirds and shallow water corals. Pages 1-66. IUCN, Gland, Switzerland.
Seminoff, J.A. (Southwest Fisheries Science Center, U.S.). 2004. Chelonia mydas. The IUCN Red List of Threatened Species 2004: e.T4615A11037468. http://dx.doi.org/10.2305/IUCN.UK.2004.RLTS.T4615A11037468.en. Downloaded on 16 June 2017.
Seminoff, J.A., Jones, T.T., Resendiz, A., Nichols, W.J. and Chaloupka, M.Y. 2003. Monitoring green turtles (Chelonia mydas) at a coastal foraging area in Baja California, Mexico: multiple indices describe population status. Journal of the Marine Biological Association of the United Kingdom 83: 1355-1362.
Schroeder, B.A., Foley, A.M. and Bagley, D.A. 2003. Nesting patterns, reproductive migrations, and adult foraging areas of Loggerhead Turtles. In: A.B. Bolten & B.E. Witherington (ed.), Loggerhead Sea Turtles, pp. 114-124. Smithsonian Books, Washington, D.C.
Shamblin, B.M., Bolten, A.B., Abreu-Grobois, F.A., Bjorndal, K.A., Cardona, L., Carreras, C., Clusa, M., Monzón-Argüello, C., Nairn, C.J., Nielsen, J.T., Nel, R., Soares, L.S., Stewart, K.R., Vilaça, S.T., Türkozan, O., Yilmaz, C. and Dutton, P.H. 2014. Geographic patterns of genetic variation in a broadly distributed marine vertebrate: new insights into Loggerhead Turtle stock structure from expanded mitochondrial DNA sequences. PLoS ONE 9: e85956.
Sideek, S.M and Baldwin, R.M. 1996. Application of stage class matrix model in managing Oman green turtle (Chelonia mydas) population. Herpetological Journal, 6: 1-8.
Spotila, J. R. (2004). Sea turtles: A complete guide to their biology, behavior, and conservation. JHU Press.
Tucker, A.D., Baldwin, R., Willson, A., Al-Kiyumi, A., Schroeder, B., Possardt, E. and Witherington, B. 2013. Preliminary estimates for loggerhead clutch frequency from Masirah, Oman derived from satellite tracking. In: T. Tucker, L. Belskis, A. Panagopoulou, A. Rees, M. Frick, K. Williams, R. Leroux & K. Stewart (ed.), Proceedings of the 33rd Annual Symposium on Sea Turtle Biology and Conservation. NOAA Tech. Mem NMFS-SEFSC-645: 243.
Wallace, B.P., DiMatteo, A.D., Bolten, A.B., Chaloupka, M.Y., Hutchinson, B.J., Abreu-Grobois, F.A., Mortimer, J.A., Seminoff, J.A., Amorocho, D., Bjorndal, K.A., Bourjea, J., Bowen, B.W., Briseño-Dueñas, R., Casale, P., Choudhury, B.C., Costa, A., Dutton, P.H., Fallabrino, A., Finkbeiner, E.M., Girard, A., Girondot, M., Hamann, .M, Hurley, B.J., López-Mendilaharsu, M., Marcovaldi, M.A., Musick, J.A., Nel, R., Pilcher, N.J., Troëng, S., Witherington, B. and Mast, RB. 2011. Global conservation priorities for marine turtles. PLoS ONE 6(9): e24510. doi:10.1371/journal.pone.0024510.
Wallace, B.P., DiMatteo, A.D., Hurley, B.J., Finkbeiner, E.M., Bolten, A.B., Chaloupka, M.Y., Hutchinson, B.J., Abreu-Grobois, F.A., Amorocho, D., Bjorndal, K.A., Bourjea, J., Bowen, B.W., Briseño-Dueñas, R., Casale, P., Choudhury, B.C., Costa, A., Dutton, P.H., Fallabrino, A., Girard, A., Girondot, M., Godfrey, M.H., Hamann, M., López-Mendilaharsu, M., Marcovaldi, M.A., Mortimer, J.A., Musick, J.A., Nel, R., Pilcher, N.J., Seminoff, J.A., Troëng, S., Witherington, B. and Mast, R.B. 2010. Regional Management Units for marine turtles: A novel framework for prioritizing conservation and research across multiple scales. PLoS ONE 5(12): e15465. doi/10.1371/journal.pone.0015465.

Wibbels, T., Owens, D.W., Limpus, C.J., Reed, P.C. and Amoss, M.S. 1990. Seasonal changes in serum gonadal steroids associated with migration, mating, and nesting in the loggerhead sea turtle (Caretta caretta). General and Comparative Endocrinology 79: 154-164.
Willson, A., Tiwari, M., Baldwin, B., Al Kiyumi, A., Al Harthi, S., Bulushi, Witherington, B., A., Possardt, E. 2015. Spatial analysis of satellite tracking of female loggerheads Masirah Island Oman; application and utility in evaluating fisheries co-occurrence for the assessment of bycatch. 35th ISTS Symposium on Sea Turtle Biology and Conservation, Dalaman, Turkey.
Witham, R. 1991. On the ecology of young sea turtles. Florida Science 54: 179.
Witherington, B., Willson, A., Baldwin, B., Al Kiyumi, A., Al Harthi, S., Bulushi, A., Possardt, E. 2015. Comparison of recent and historical surveys of loggerhead sea turtle nesting on beaches of Masirah Island, Sultanate of Oman. 35th ISTS Symposium on Sea Turtle Biology and Conservation, Dalaman, Turkey.
Witzell, W.N. 1983. Synopsis of biological data on the Hawksbill Turtle, Eretmochelys imbricata (Linnaeus, 1766). FAO Fisheries Synopsis No. 137.

APPENDIX D-4
APPENDIX 7.4: INVASIVE ALIEN SPECIES

Project Title WSP Client Name Project No 70029220141-00000-00 Confidential
TECHNICAL APPENDIX: INVASIVE ALIEN SPECIES STRATEGY
1. INTRODUCTION
Duqm Refinery and Petrochemical Industries Company LLC (DRPIC) is developing the Duqm Refinery Project (the “Project”) located within the Special Economic Zone at Duqm (Duqm SEZ). The Project comprises the Refinery and Offsite Facilities:
230,000 barrels per day (BPD) complex refinery and on-site utilities, infrastructure and storage (the ‘Refinery’);
Product export terminal (‘Export Terminal’) at the Port of Duqm;
Crude storage facility at the Ras Markaz crude oil terminal (the ‘DRPIC Ras Markaz Crude Storage Facility’); and
28” 80km Crude pipeline from Ras Markaz to the Refinery (‘DRPIC Crude Pipeline’ and together with the DRPIC Ras Markaz Crude Storage Facility and the Export Terminal, the ‘Offsite Facilities’).
As part of Project Financing, the Lenders’ Independent Environmental and Social Consultant identified the need to provide details of mitigation to be followed to address both marine and terrestrial invasive alien species (IAS).
2. INTERPRETATION OF LENDERS’ REQUIREMENTS – INVASIVE ALIEN SPECIES STRATEGY
The Project Lenders’ independent ESDD Report (Ramboll Environ, 2016) states the following in
relation to IAS:
“There is generally little mention of invasive alien species in the assessments. Given the habitats present, few are believed likely to be present within the terrestrial areas. However construction activities have the potential to introduce them. The seawater intake EIA does identify a likely low significance impact of the introduction of marine exotic species as a result of ships’ hulls and ballast waters. No mitigation for the impact is described.” (Row 58, p.73)
For the purpose of this report, an invasive species is defined as a plant, fungus, animal or microorganism that is not a native species to Oman (an alien or introduced species); it will have a tendency to reproduce and be distributed beyond its point of introduction to a degree believed to cause damage to the environment, human economy and/or human health. Not all alien species become invasive. A species could be an alien introduction to Oman but not regarded as damaging to the native environment. This document focusses solely on species which are IAS.
The Lender’s Report requests that an IAS strategy is prepared which provides:
“…details of mitigation measures to be followed to address the issue of both marine and terrestrial alien species.”
The four Project ESIAs do not provide a comprehensive inventory of IAS which may occur in the Project Area. Also absent in the ESIAs is an assessment of the risk/potential for different IAS to

Project Title WSP Client Name Project No 70029220141-00000-00 Confidential
be spread, or introduced by, activities associated with the Project. To address this information gap, this document provides a scoping review of different potential IAS in the Project Area and a risk rating of their likelihood that they could be introduced or exacerbated by Project construction or operation activities.
The final section of this document provides a series of recommendations to address potential IAS issues. Detailed management/mitigation actions to address IAS are provided in the Biodiversity Management Plan, rather than in this IAS strategy so that all biodiversity mitigation issues are integrated in a single place.
3. METHODOLOGY
A provisional list of IAS for Oman was obtained by searching a range of data sources including:
Invasive Species Specialist Group Global Invasive Species Database (International Union for the Conservation of Nature, 2017);
Sultanate of Oman - 5th National Report to the Convention on Biological Diversity
(Ministry of Environment and Climate Affairs, 2014); and
Sultanate of Oman – National Biodiversity Strategy and Action Plan (Ministry of Regional Municipalities, Environment and Water Resources, 2001)
Al-Yamani, F., Skryabin, V., Durvasula, S.R.V., (2015). Suspected ballast water introductions in the Arabian Gulf. Aquatic Ecosystem Health & Management 18, 282–289.
Hamza, (2006). Observations on transported exotic plankton species to UAE coastal waters by gas tankers ballast water, in: Living Marine Ecosystem Diversity in the Arabian Gulf: Threats and Conservation. A. Tubielewicz (Ed.).
For each potential IAS, the following information was evaluated to provide a Red/Amber/Green (RAG) risk rating:
Species name/group – scientific name and taxon group (e.g. mammal, plant);
Pathway source – identification of the most likely source of infestation associated with Project activities (e.g. ballast water, ship hull colonist, natural colonist); and
Project element – identification of the Project element applicable to the species in question (e.g. certain species are purely terrestrial).
The RAG rating is defined as follows. RAG ratings incorporate advice provided by the International Petroleum Industry Environmental Conservation Association (IPIECA; 2010)
1.
The term Project Area is the physical footprint of the Refinery, the Off-site Facilities or the AFs in both the terrestrial and marine environment; and a broad zone in the Gulf of Masirah, defined by a worst case oil spill model, which has been used as a proxy to indicate the likely area over which shipping movements associated with the Project may occur. This definition accords with the definition of Area of Influence (AoI) provided in Section 2.3 of the biodiversity assessment.
Table D-1: RAG Risk Rating Definitions
RAG RISK
RATING DESCRIPTION
Green IAS colonisation likely to be beyond the sphere of influence of the Project for a number of reasons
1 IPIECA is the global oil and gas industry association for environmental and social issues.

Project Title WSP Client Name Project No 70029220141-00000-00 Confidential
RAG RISK
RATING DESCRIPTION
including a the specie in question is widespread IAS which is present everywhere in the region from unrelated sources of colonisation/regional ecosystem change (e.g. climate change); Or The IAS is not sensitive/unlikely to respond (e.g. population growth; range expansion) to any environmental changes that may be caused by the Project; Or Habitat for the IAS unlikely to be present in the Duqm region or to be affected by the Project.
Amber
The IAS is relatively easily controlled by implementation of basic precautionary or hygiene measures which may be implemented during Project construction or operation.
Red
The IAS may be present in the Project area and, based on available knowledge of its ecology, it is likely to be highly invasive, could be specifically introduced or exacerbated by Project activities and could significantly damage native biodiversity. Or An IAS that is relatively hard to control if introduced and would significantly damage native Omani biodiversity. Even if IAS introduction is not a high probability as a result of Project construction or operational activities.
4. LIMITATIONS
The provisional list of IAS is unlikely to be comprehensive as data is not collated at a national or regional scale in Oman. IAS data is largely opportunistic and incidental where it occurs.
Due to lack of coverage in the Project EIAs the potential distribution of IAS is unknown for the Project Area. However, the site verification survey undertaken to inform the Project (Technical Appendix A: Survey Record) recorded incidental occurrences of some IAS present in the project site. Whilst the verification surveys did not find any significant IAS infestations they only covered a small portion of the Project area and did not include the marine environment.
Knowledge of terrestrial and avian IAS ecology is limited to that which can be obtained from incidental observations and the referenced sources outlined in this document. For certain IAS, their ecology and behaviour in their native range may not be reflective of their response to introduction to a non-native environment. For both these reasons terrestrial IAS responses in relation to the Project cannot always be confidently predicted. A precautionary approach has therefore been adopted where uncertainty exists. A less clear picture exists for marine IAS, where survey methods are more complicated, taxonomy is more difficult with fewer taxonomists available to carry out the necessary identification work, and there is a poorly developed inventory of marine species in Oman, particularly for invertebrates and planktonic species i.e. the groups most likely to be introduced in ballast water.

Project Title WSP Client Name Project No 70029220141-00000-00 Confidential
Table D-2: IAS RAG Risk Rating
SPECIES NAME GROUP VECTOR SOURCE PROJECT
ELEMENT ASSESSMENT / RAG RATING
Terrestrial Species
Indian mynah (Acridotheres tristis)
Bird Natural colonisation, international shipping
Refinery DRPIC Ras Markaz Crude Storage Facility DRPIC Crude Pipeline Labour Camps
Competition with native species of bird for food and resources. Colonisation likely to be beyond the sphere of influence of the Project – this bird is already present across Oman.
Agave (Agave americana) Plant Potential for importation with soil
Refinery DRPIC Ras Markaz Crude Storage Facility DRPIC Crude Pipeline
This species may be introduced through importation of soil for construction which contain its seeds. Once introduced it may compete with native species of plant for resources (e.g. water, light, space). Introduction risk can be controlled through management and checking of soil sources to ensure they are not contaminated and monitoring locations where soil is imported for evidence of infestation. Spot treatment may then be applied.
Mesquite (Prosopis juliflora) Plant
Natural colonisation from source population previously recorded in the Duqm Area
Refinery DRPIC Ras Markaz Crude Storage Facility DRPIC Crude Pipeline Labour Camps
Competition with native tree species’ water resources, and forms thickets that out compete native species and reduce value of forage for livestock and wildlife. Particularly problematic if it gets into wadi courses as it has already done near Duqm. Existing knowledge suggests that colonisation may be exacerbated by soil disturbance brought about by Project construction which may create niches for this species to colonise the Project Area. Introduction of this species may be controlled by adopting a range of measures including: i) monitoring and decontamination of vehicles that may have come into contact with areas where it is known to grow; ii) detailed mapping of the intended construction footprint to identify any infestations – then applying spot-treatment (herbicide); iii) implementation of an integrated management programme that may involve mechanical removal of plants and regular check-ups to clear new saplings that may emerge from seeds; iv) discourage workers from cultivating the species around Labour Camps and other facilities (Insall, 2006); v) ensuring construction vehicles designated access routes and do not venture across desert habitats.
Ghuwayf/Speed Tree Plant Potential for importation Refinery This species may be introduced through importation of soil for construction

Project Title WSP Client Name Project No 70029220141-00000-00 Confidential
SPECIES NAME GROUP VECTOR SOURCE PROJECT
ELEMENT ASSESSMENT / RAG RATING
(Leucaena leucocephala) with landscaping soil or on vehicles that have come into contact with the species
DRPIC Ras Markaz Crude Storage Facility DRPIC Crude Pipeline Labour Camps
which contain its seeds. Once introduced it may compete with native species of plant for resources (e.g. water, light, space). This species is not through to have yet invaded to the extent of Prosopis juliflora but it grows and spreads rapidly through seeds falling on the
ground. Control of this species may be achieved by following the protocol outlined in this table for Prosopis juliflora.
Indian house-crow (Corvus splendens)
Bird Natural colonisation, international shipping
Refinery DRPIC Ras Markaz Crude Storage Facility DRPIC Crude Pipeline Labour Camps
Competition with native bird species for food and resources. Predation of native bird chicks. Colonisation likely to be beyond the sphere of influence of the Project – this bird is already present across Oman.
Speargrass/cogon grass (Imperata cylindrical)
Plant Potential for importation with soil
Refinery DRPIC Ras Markaz Crude Storage Facility DRPIC Crude Pipeline
Competition with native species of plant for resources (e.g. water, light, space). . Introduction risk can be controlled through management and checking of soil sources to ensure they are not contaminated and monitoring locations where soil is imported for evidence of infestation. Spot treatment may then be applied.
Bitter lettuce (Launaea intybacea)
Plant Potential for importation with soil
Refinery DRPIC Ras Markaz Crude Storage Facility DRPIC Crude Pipeline
Competition with native species of plant for resources. Introduction risk can be controlled through management and checking of soil sources to ensure they are not contaminated and monitoring locations where soil is imported for evidence of infestation. Spot treatment may then be applied.
Longhorn crazy ant (Paratrechina longicornis)
Insect
Natural colonisation, international shipping, movement of human migrants
Refinery DRPIC Ras Markaz Crude Storage Facility DRPIC Crude Pipeline Labour Camps
Competition with native species of mammal for food and resources. Human migrant population (labour camp) may import this species accidentally. Control via screening and monitoring.

Project Title WSP Client Name Project No 70029220141-00000-00 Confidential
SPECIES NAME GROUP VECTOR SOURCE PROJECT
ELEMENT ASSESSMENT / RAG RATING
Rose-ringed parakeet (Psittacula krameri)
Bird Natural colonisation, international shipping
Refinery DRPIC Ras Markaz Crude Storage Facility DRPIC Crude Pipeline Labour Camps
Competition with native species of bird for food and resources, and potential vector for spread of Prosopis juliflora.
Colonisation likely to be beyond the sphere of influence of the Project - bird is already present across Oman.
The flowerpot snake (Ramphotyphlops braminus)
Reptile International shipping; importation of plant stock for landscaping puposes
Refinery DRPIC Ras Markaz Crude Storage Facility DRPIC Crude Pipeline Labour Camps
This species is reputed to be a common introduction to the U.S., South Africa and other countries which are outside of its non-native range owing to its very small size (less than 20 cm) and ability to conceal itself in horticultural products. It is also highlighted by the IUCN as a possible introduction risk for Oman. Available evidence suggests that this species is unlikely to causes significant effects on native biodiversity in the Duqm region as its habitat requirements do not appear to include highly arid ecosystems. In addition, there is no evidence to suggest that where introduced (e.g. in the US and South Africa), it competes with native reptile populations or significantly depredates native invertebrate communities.
Asian hornet shrew/brown musk shrew (Suncus murinus)
Mammal International shipping, movement of human migrants
Refinery DRPIC Ras Markaz Crude Storage Facility DRPIC Crude Pipeline Labour Camps
Competition with native species of mammal for food and resources. Tends to associated with human habitation and activity. Human migrant population (labour camp) may import this species accidentally. Control via screening and monitoring.
Tramp ant (Tapinoma melanocephalum)
Insect International shipping, movement of human migrants
Refinery DRPIC Ras Markaz Crude Storage Facility DRPIC Crude Pipeline Labour Camps
Competition with native species of mammal for food and resources. Human migrant population (labour camp) may import this species accidentally. Control via screening and monitoring.
Red palm mite (Raoiella indica)
Arachnid Pest of the fruit trade. Importation of infected
Labour Camps Blight of food crops. Damage and death of date palms (Phoenix dactylifera)

Project Title WSP Client Name Project No 70029220141-00000-00 Confidential
SPECIES NAME GROUP VECTOR SOURCE PROJECT
ELEMENT ASSESSMENT / RAG RATING
produce. Colonisation likely to be beyond the sphere of influence of the Project as date palms will not be used in landscaping planting as they are relatively water intensive crops.
Red Palm Weevil (Rhynchophorus
ferrugineus) Beetle
Transfer of date palms for landscaping
Landscaped areas
Blight of food crops. Damage and death of date palms (Phoenix dactylifera) Colonisation likely to be beyond the sphere of influence of the Project as date palms will not be used in landscaping planting as they are relatively water intensive crops.
Marine Species
Cochlodinium polikrikoides (a primitive species of Eukaryotic/cellular organism)
Dinoflagellate Ballast water
Ras Markaz Crude Storage Facility Export Terminal
This species may be introduced by contaminated ballast water associated with oil import and export. This species may causes an extensive algal bloom, such as occurred in Oman Aug 2008 – June 2009 (Al Azri et al., 2014). When in bloom this species has been linked to mass fish kill incidents, damage to coral reefs, and interference with desalinization plants.
List of 14 marine species given in Al Yamani et al (2015) ranging from microalgae to fish
Various Ballast water
Ras Markaz Crude Storage Facility Export Terminal
A range of effects leading to ecosystem disruption from fouling, toxins and predation pressure on native biodiversity. The Port of Duqm has a draft set of Port Rules & Regulations (Port of Duqm, 2016) that includes a section (2.10.6) on water. It specifies that the discharge of ballast water shall only be conducted through Ballast Water Management in terms of a range of stated provisions, for example, vessels from overseas port of call conducting ballast water exchange at least 200 nautical miles (nm) from the nearest land and in water at least 200m depth, or if this is not possible at least 50 nm in the same depth.

Project Title WSP Client Name Project No 70029220141-00000-00 Confidential
5. RECOMMENDATIONS FOR INCORPORATION IN BIODIVERSITY MANAGEMENT PLAN
The following recommendations have been divided into two categories:
Project related recommendations – factors that DRPIC has direct influence or control over.
Strategic recommendations – factors and conservation issues which the Project may effect in a cumulative way but relating more to regional planning and Government policy.
In the first category, DRPIC will seek to mitigation for these issues through implementation of the Project ESMP. In the second category, DRPIC will seek to influence and address these issues through consultation and advocacy with SEZAD and potentially through Coporate Social Responsbilty (CSR) initiatives.
Project Related Recommendations
1. Soil biosecurity and hygiene – the review of terrestrial IAS has signposted a possible vector source for the introduction of invasive plant species as contaminated soil. When any topsoil (including plants imported with top soil) is imported into the Project environment for landscaping or structural engineering purposes, the EPC Contractor must seek appropriate assurance (and evidence) from the soil source provider (or provide a guarantee if winning the soil itself) to ensure it is free from IAS contamination. Regular monitoring by a suitable qualified ecologist of areas of soil importation should be undertaken during the construction phase and for an appropriate period thereafter (approximately 3 – 5 years). Monitoring should aim to identify any non-native plant infestations. These may then be targeted for appropriate spot-treatment (e.g. herbicide application).
2. Vehicles – construction vehicles should be subjected to regular inspections to ensure that they are not acting as vectors of invasive plant species, particularly in cases where they may come into contact with established IAS such as Prosopis juliflora. Vehicles most likely to act as vectors are those regularly parked under P. juliflora trees (e.g. in Muscat). Vehicles should be appropriately cleaned prior to importation into the DSEZ. Construction vehicles should be restricted to designated construction access routes to minimise the possibile spread of IAS.
3. Disturbance – the review of terrestrial IAS highlights the potential for soil disturbance caused by construction activities to create the conditions favourable to ruderal plant species and non-native shrubs such as Prosopis juliflora. Soil disturbance is an inherent part of construction, therefore, regular monitoring should be undertaken to assess colonisation by mesquite or other ruderal plants during the construction phase and for a period until native vegetation has recolonized the construction footprint (approximately three to five years).
4. IAS treatment strategy – the appointed EPC contractor should have a strategy for treating infestations of non-native plant and animal species. The strategy should identify necessary treatment approaches and methods should an infestation be detected. The strategy should also detail the necessary equipment, products and specialised personnel required. Appropriate integrated control measures may include treatment with an appropriate herbicide or physical uprooting and removal (for localised instances) and safe disposal where no danger of recolonization can emanate. Regular monitoring of infestation sites needs to be conducted in order to ensure that new saplings germinating from the seedbank are removed before the infestation is re-established. This process may take several years.
5. Labour Camps – The Labour camps will be a key source of foreign migrants who may inadvertently import non-native plants and animals into the Project Area. Foreign

Project Title WSP Client Name Project No 70029220141-00000-00 Confidential
labourers may also deliberately import foreign plant species to cultivate around their living quarters. Large aggregations of workers are likely to generate refuse, which although unlikely to cause the introduction of any IAS, may create habitat conditions suitable for scavenging IAS (e.g. birds) or IAS that benefit from soil/ground disturbance. Monitoring effort should be directed at these locations; effective waste removal and storage; and potential screening of any imported food produce.
6. Records – should be kept (by the EPC Contractor) of all terrestrial IAS sightings (plants, birds, mammals etc.) for collation and submission to DRPIC and for the regional planning authority (SEZAD). Data can be used to inform cumulative assessment of other development schemes in the Duqm area and for IAS surveillance purposes.
7. Assurance of ballast water procedures – DRPIC should carry out assurance across its shipping supply chain to ensure import and export vessels are fully compliant with Port of Duqm ballast water treatment and use requirements and International Maritime Organisation requirements.
8. Ballast water risk assessment - Request confirmation from Port of Duqm that they have undertaken a ballast water risk assessment for all shipping under ballast arriving at Duqm using the Globallast system or equivalent. Vessels will include unladen or partially laden oil tankers arriving at the loading terminal and at Ras Markaz, as well as vessels requiring dry docking at ODC.
9. Ballast water management protocols - Request confirmation from Port of Duqm that ballast water management protocols for ships arriving at Port of Duqm are aligned with i) ROPME ballast water management protocols, ii) International Convention for the Control and Management of Ships’ Ballast Water and Sediments (BWM Convention), which will come into force on 8 September 2017. Put in place necessary administrative and management structures to implement and ensure compliance with the applicable ballast water management protocols.
Strategic Recommendations
10. Marine IAS monitoring – DRPIC should lobby the Port of Duqm and regional authorities (e.g. SEZAD) to establish a marine IAS monitoring programme to species level of key groups of IAS most likely to be transported in ballast water. The monitoring programme should be established in the vicinity of Duqm Port (e.g. breakwaters, surrounding seabed) as well as at Ras Markaz (hard and soft subtidal habitats).

Project Title WSP Client Name Project No 70029220141-00000-00 Confidential
6. REFERENCES
Al-Azri, A.R., Piontkovski, S.A., Al-Hashmi, K.A., Goes, J.I., Gomes, H.R., Gilbert, P.M., (2014). Mesoscale and Nutrient Conditions Associated with the Massive 2008 Cochlodinium polykrikoides Bloom in the Sea of Oman/Arabian Gulf. Estuaries and Coasts 37.
Al-Yamani, F.Y., Skryabin, V., Durvasula, R.V. (2015). Suspected ballast water introductions in the Arabian Gulf. Aquatic Ecosystem Health and Management 18 (3): 282-289.
Hamza, 2006. Observations on transported exotic plankton species to UAE coastal waters by gas tankers ballast water, in: Living Marine Ecosystem Diversity in the Arabian Gulf: Threats and Conservation. A. Tubielewicz (Ed.).
Insall, D. (2006). Landscaping with Omani wild trees. Published by the Environment Society of Oman
International Petroleum Industry Environmental Conservation Association (IPIECA) (2010). Alien invasive species and the oil and gas industry: Guidance for prevention and management.
International Union for the Conservation of Nature - Invasive Species Specialist Group Global Invasive Species Database (2017). [on-line] http://www.iucngisd.org/gisd/index.php (accessed June 2017).
Ministry of Environment and Climate Affairs (MECA). (2014), 5th National Report to the
Convention on Biological Diversity. Government of Sultanate of Oman, Muscat.
Port of Duqm (Draft, version 2016). Text extract Section 2.10 Environment in the port (pp.71-74). In Port of Duqm’s Port Rules and Regulations. Port of Duqm, Duqm, Oman.
Sultanate of Oman – National Biodiversity Strategy and Action Plan (Ministry of Regional Municipalities, Environment and Water Resources, 2001)

APPENDIX D-5
APPENDIX 7.5: BIODIVERSITY OFFSET FRAMEWORK

Duqm Refinery WSP DRPIC Project No 70029220 Confidential JuneJuly 2017
TECHNICAL APPENDIX: BIODIVERSITY OFFSETTING FRAMEWORK
1. BACKGROUND
Duqm Refinery and Petrochemical Industries Company LLC (DRPIC) is developing the Duqm Refinery Project (the “Project”) which comprises the Refinery and Offsite Facilities:
230,000 barrels per day (BPD) complex refinery and on-site utilities, infrastructure and storage (the ‘Refinery’);
Product export terminal (‘Export Terminal’) at the Port of Duqm;
Crude storage facility at the Ras Markaz crude oil terminal (the ‘DRPIC Ras Markaz Crude Storage Facility’); and
28” 80km Crude pipeline from Ras Markaz to the Refinery (‘DRPIC Crude Pipeline’ and together with the DRPIC Ras Markaz Crude Storage Facility and the Export Terminal, the ‘Offsite Facilities’).
As part of Project Financing, the Lenders’ Independent Environmental and Social Consultant identified a number of areas in the Project ESIA Reports and Project documentation that require supplementing and/or enhancing to bring them up to Lender standards. This included the need to provide a consolidated biodiversity assessment incorporating a biodiversity no net loss strategy to enable compliance the International Financial Corporation’s Performance Standard 6 (IFC PS6).
2. INTERPRETATION OF LENDERS’ REQUIREMENTS – BIODIVERSITY OFFSETTING FRAMEWORK
The independent ESDD Report (Ramboll Environ, 2016) identified the need to consider how no net loss of natural habitat (see definition of natural habitat in Table 1) would be achieved for the Project in order to comply with the IFC’s PS6:
“Assessments should be updated to address the concept of natural habitat as set out in International IFC PS6 Paragraph 13, particularly to outline how no net loss of those habitats would be achieved. Measures included in the EIAs at present fall short of no net loss, they are mitigation to minimise the loss of vegetation or avoid direct mortality of fauna”. (Row 55, p.92).
The Project will directly affect the following natural habitats (as defined by IFC PS6). See Table E.4 in this document for habitat areas present in the Project Footprint and 0.25 km survey area. See Technical Appendix B: Harmonisted Habitat Mapping for habitat defintions. Note that these areas present in Table E.4 are not necessarily reflective of permanent habitat loss associated with Project construction as some habitat will be restored post-Project construction (e.g. restoration of habitat including plating of native trees above the buried DRPIC Crude Oil pipeline which will be buried benath the ground surface):
Gravel & sand plains with dwarf shrub cover (accounts for approximately 65% of the Project Footprint);
Gravel & sand plains with trees;
Rocky mountain & escarpment;
Rocky outcrops & gravel hills;

Duqm Refinery WSP DRPIC Project No 70029220 Confidential JuneJuly 2017
Vegetated dune;
Vegetated sabkha;
Wadis in close association with mountains; and
Wadis in open terrain.
The review of the Project Lenders’ requirements has highlighted that other elements of the broader topic area of biodiversity offsetting may also apply to the Project in order to comply with IFC PS6. Specifically, IFC PS6 requires the adoption of a biodiversity offsetting approach to address potential impacts on species for which critical habitat exists in the Project area (see definition of critical habitat in Table 1). In relation to potential impacts on critical habitat, IFC PS6 states that developers may need to demonstrate a net gain (i.e. beyond no net loss) in biodiversity (see definition of net gain in Table 1). A critical habitat assessment (CHA) is provided in Technical Appendix C.
Although biodiversity offsets may have been delivered in relation to a number of different development projects in Oman, at present there is no formal Government policy or best practice for biodiversity offsetting in Oman. This situation is the same for Duqm Special Economic Zone (Duqm SEZ) where no specific biodiversity compensation or offsetting policy exists. The use of constructed wetland technologies to treat wastewater has been trialled as a system for the beneficial use of wastewater associated with oil refining at the Nimr oilfield south of Ras Madrakah(Breuer, 2011). Reedbed habitat has been created in the Nimr oilfield where previously, this habitat could not survive due to the arid conditions. Although reedbed creation is a potential opportunity in relation to the Project, no loss of reedbed vegetation will be associated with the Project and thus this would be a potential biodiversity enhancement opportunity, or an ‘out of kind’ offset (see definitions herein) rather than an offset to compensate for Project impacts. Deploying artificial reefs to create new reef habitat has been utilised in other states in the region including Abu Dhabi and Bharain (The National, 2017) and other areas in Oman, again these measures would constitute an ‘out of kind’ offset if implemented in relation to the Project, as no reef loss is envisaged. Table E.4 lists the habitats in the Project Footprint and 0.25 km survey area. The Project will not result in an direct loss of marine habitat as the Export Terminal and Ras Markaz Single Point Mooring facility are both AFs.
Related to the lack of a formal policy/procedure for biodiversity offsetting in Oman, a number of other factors must be considered before biodiversity offsets can be delivered. These include:
The complexity of the land tenure in the Duqm area and plans for development expansion (i.e. the strategic relationship between the Project and other developments within the SEZAD area). There would be little point in DRPIC delivering an offset on land which is later developed, subject to potential impact from third party development, or over which it doesn’t have some measure of control;
There are gaps in the ecological data coverage of key species and habitats in the region as a whole – in order to best target habitat creation or conservation management the distribution and habitat use of key species needs to be better understood;
There is a need to fully engage with Governmental, non-Government organisations and local community stakeholders to ensure potential offsets are delivered with consent and buy-in from those potentially affected by them (both benefiting from them or potential suffering a loss arising from the creation of a biodiversity offset);
When considering the multiple species which may trigger critical habitat in the Project Area and particularly the area in which Associated Facilities are proposed or operational, there is a requirement to adopt a coordinated approach which is beyond the scope of the Project – this needs to be agreed at a strategic level with Government authorities before offsetting solutions can be delivered; and

Duqm Refinery WSP DRPIC Project No 70029220 Confidential JuneJuly 2017
In compiling a biodiversity offsetting strategy, the need for the project proponent and the lender to agree in principle on the focus of the initiative (e.g. habitat, species), the principles, goals, targets and indicators to be adopted and commitment to gain support and buy-in from interested parties.
In summary, the Lenders’ report asks for consideration of no net loss of biodiversity only in connection with natural habitat affected by the Project. However, by virtue of the fact that the Lenders’ report asks for compliance with PS6 in general; and because the CHA (Technical Appendix C: CHA) identifies the presence of critical habitat for a number of species in the Project Area - a broader application of biodiversity offsetting may need to be applied, full delivery of which sits partly outside DRPICs sphere of influence and involves those constructing and operating Associated Facilities, other SEZ development and DRPICs wider supply chain include shipping operations. Furthermore, there are several political, stakeholder related and technical issues that need to be further researched before biodiversity offsetting can be adopted for the Project.
For the above reasons a biodiversity offsetting framework for the Project has been produced which is a first step in deriving a detailed biodiversity offsetting strategy in the future.
3. PURPOSE OF THIS BIODIVERSITY OFFSETTING FRAMEWORK
This biodiversity offsetting framework identifies issues and actions that should be adopted to apply a biodiversity offsetting approach to deal with potential significant, residual ecological impacts on natural habitat and critical habitat which are identified in the main biodiversity assessment. It does this by:
1. Defining key terms and concepts;
2. Identifying principal sources of guidance and best practice;
3. Setting-out a framework of recommendations which DRPIC can pursue to take forward biodiversity offsetting ideas and initiatives, including the requirement to engage with Government, NGOs and the developers of Associated Facilities which may also cause an ecological impact;
4. Identifying key stakeholders required to develop and implement biodiversity offsetting; and
5. Producing a preliminary inventory of natural habitat features and species triggering critical habitat relating to the Project for consideration in developing a detailed strategy for biodiversity offsetting.
The Biodiversity Management Plan (BMP) for the Project will also make reference to the set of reports comprising the Biodiversity work collated for the Consolidated ESIA, of which this Appendix is one. The BMP is a practical DRPIC document used by the EPC Contractors during construction and commissioning to ensure activities are in line with Project requirements and commitments. It is therefore important that the EPC Contractors are aware of the issues and aspects relating to the topic of biodiversity offsetting, as addressed in this Appendix.
4. DEFINITION OF KEY TERMS AND CONCEPTS
The following terms and concepts relating to biodiversity offsetting will be used throughout this document.
Table E-1: Biodiversity Offsetting Terms and Concepts
TERM DEFINITION AND/OR DESCRIPTION
The mitigation
hierarchy
The ecological mitigation hierarchy is a core principle of biodiversity offsetting. It has
been defined variously by different bodies (e.g. the International Finance
Corporation (IFC) and the Business and Biodiversity Offsets Programme, BBOP). It
states that new developments should adopt the following step-by-step process in

Duqm Refinery WSP DRPIC Project No 70029220 Confidential JuneJuly 2017
TERM DEFINITION AND/OR DESCRIPTION
relation to potential ecological impacts.
1. Avoid through project design;
2. Minimise by adopting measures to reduce or abate potential ecological
impacts (sometime referred to as mitigation);
3. Rehabilitate/restore natural habitats once development has occurred
4. Compensate/offset for ecological impacts by creating new habitats or
increasing the quality/condition of existing habitats.
Measures to ensure avoidance and minimisation of ecological impacts are contained
in the Project BMP.
Biodiversity
offsetting
Biodiversity offsetting is the process of design and delivery of biodiversity offsets.
BBOP define biodiversity offsets as:
“Biodiversity offsets are measurable conservation outcomes resulting from actions
designed to compensate for significant residual adverse biodiversity impacts arising
from project development after appropriate prevention and mitigation measures have
been taken. The goal of biodiversity offsets is to achieve no net loss and preferably a
net gain of biodiversity on the ground with respect to species composition, habitat
structure, ecosystem function and people’s use and cultural values associated with
biodiversity.” (BBOP, 2012: pg. 1).
Within the mitigation hierarchy, offsets are seen as: “a specific kind of compensation
designed to achieve no net loss or a net gain of biodiversity, while compensation
may not achieve no net loss” (BBOP, 2012: pg. 2).
A key aspect of biodiversity offsetting is the need to measure conservation losses
and balance these with gains using a quantifiable metric.
Biodiversity offsets may be physical actions involving the acquisition and
management of land. They may equally be procedural or organisational
interventions (such as contributing to strategic/regional nature conservation projects)
aimed at increasing the conservation status of species or habitats.
Biodiversity No Net
Loss/Biodiversity Net
Gain
Biodiversity no net loss is a biodiversity offsetting objective which aims to secure no
net change of biodiversity: “on the ground with respect to species composition,
habitat structure, ecosystem function and people’s use and cultural values
associated with biodiversity”.
Biodiversity net gain is an offsetting objective which aims to secure a net increase in
biodiversity (e.g. structure, function, species composition).
No net loss and net gain are typically quantified using a biodiversity metric as a
surrogate for ‘biodiversity’.
IFC Performance
Standard 6 (PS6)
The IFC has produced a Sustainability Framework which articulates the IFC’s
strategic commitment to sustainable development. PS 6 of the IFC’s framework
recognizes that protecting and conserving biodiversity, maintaining ecosystem
services, and sustainably managing living natural resources are fundamental to
sustainable development. Among other requirements, PS6 notes the following in
relation to biodiversity offsetting:
“In areas of natural habitat, mitigation measures will be designed to achieve no net
loss of biodiversity where feasible” (IFC, 2012: pg. 3).

Duqm Refinery WSP DRPIC Project No 70029220 Confidential JuneJuly 2017
TERM DEFINITION AND/OR DESCRIPTION
“[In areas of Critical Habitat] …the project’s mitigation strategy will be described in a
Biodiversity Action Plan and will be designed to achieve net gains of those
biodiversity values for which the critical habitat was designated” (IFC, 2012: pg. 3).
PS6 define no net loss as:
“the point at which project-related impacts on biodiversity are balanced by measures
taken to avoid and minimize the project’s impacts, to undertake on-site restoration
and finally to offset significant residual impacts, if any, on an appropriate geographic
scale (e.g., local, landscape-level, national, regional)” (IFC, 2012: pg. 3).
PS6 defines net gain as:
“Net gains are additional conservation outcomes that can be achieved for the
biodiversity values for which the critical habitat was designated. Net gains may be
achieved through the development of a biodiversity offset and/or, in instances where
the client could meet the requirements of paragraph 17 of this Performance
Standard without a biodiversity offset, the client should achieve net gains through
the implementation of programs that could be implemented in situ (on-the-ground) to
enhance habitat, and protect and conserve biodiversity” (IFC, 2012: pg. 4).
Natural Habitat
PS6 defines natural habitat as: “areas composed of viable assemblages of plant
and/or animal species of largely native origin, and/or where human activity has not
essentially modified an area’s primary ecological functions and species
composition.”
Modified Habitat
PS6 defines modified habitat as: “areas that may contain a large proportion of plant
and/or animal species of non-native origin, and/or where human activity has
substantially modified an area’s primary ecological functions and species
composition. Modified habitats may include areas managed for agriculture, forest
plantations, reclaimed coastal zones, and reclaimed wetlands.” (IFC, 2012: pg. 3).
Critical Habitat
PS6 defines critical habitat as: “areas with high biodiversity value, including (i)
habitat of significant importance to Critically Endangered and/or Endangered11
species; (ii) habitat of significant importance to endemic and/or restricted-range
species; (iii) habitat supporting globally significant concentrations of migratory
species and/or congregatory species; (iv) highly threatened and/or unique
ecosystems; and/or (v) areas associated with key evolutionary processes. All
conservation status listing relate to the International Union for the Conservation of
Nature (IUCN) categories.” (IFC, 2012: pg. 4).
Biodiversity metric A metric is a mathematical tool that allows biodiversity losses and compensation to
be measured.
In kind offset
Provision of compensatory habitat or conservation actions which are like-for-like in
directly addressing the ecological feature or function which is subject to an impact
(e.g. loss of wadi vegetation to be compensated by fostering the growth of new wadi
vegetation).
Out of kind offset
Provision of compensatory habitat or conservation actions which are not like-for-like
in that they are spatially removed or of a different type or function from the feature
subject to an ecological impact.
5. PRINCIPAL SOURCES OF GUIDANCE AND BEST PRACTICE
The key source of information and standards about biodiversity offsetting is presented by BBOP. BBOP has produced a comprehensive guidance library covering all aspects of offsetting practice

Duqm Refinery WSP DRPIC Project No 70029220 Confidential JuneJuly 2017
and implementation. A directory to the various guidance documentation is provided on the BBOP website (BBOP, 2017).
The IFC has provided guidance on implementation of PS6 which includes detail on how the concepts of net gain and no net loss should be interpreted (IFC, 2012b).
The UK model which is focussed on delivering offsets for impacts on habitats is explained in a series of publications issued by the UK Department of Agriculture Food and Rural Affairs (DEFRA 2011, DEFRA, 2012). The UK model does not incorporate offsetting for species at present but is relatively simple to add to any context where land take on natural habitats is occurring. It employs a simple metric to determine the area of offset that must be delivered to compensate for habitat damaged or removed by a development. The metric is based on a scoring system derived from multiplying the area of habitat lost by its condition and by its uniqueness or replaceability in terms nature conservation. Similar habitat based metric approaches have been extensively used in Australia and in the United States of America (these are reviewed by BBOP).
The review of principal sources of guidance and best practice has not revealed any specific biodiversity offsetting best practice that has emerged for Arabia or any particular approaches which are most suitable for arid ecosystems or applicable to marine species (e.g. cetaceans) such as those identified in the CHA (Technical Appendix C). As part of the development of a biodiversity offsetting strategy for the Project a thorough review of regional case studies would assist adoption of the most appropriate model for the Duqm region.
6. BIODIVERSITY OFFSETTING FRAMEWORK
The following framework has been derived on the basis of experience in delivering offsetting projects in a UK and in an international context utilizing BBOP and IFC guidance. The various elements in the framework are entitled ‘steps’ but should not be seen a linear stages that need to be progressed in strict sequence. Progress towards delivery of a detailed biodiversity offsetting strategy may be achieved by addressing different elements as opportunities arise and to best fit with the Project and planning programme.

7
Duqm Refinery WSP DRPIC Project No 70029220 Confidential July 2017
Table E-2: Project Offsetting Road Map
STAGE RECOMMENDED ACTIONS STAKEHOLDERS WITH
GREATEST INFLUENCE ON
THIS STAGE INFORMATION REQUIREMENTS
Step 1: Define off-setting principles
BBOP (among other bodies) has set out a clear set of principles to be adopted by those seeking to use offsetting as part of their wider approach to delivery of ecological mitigation. The BBOP principles are founded on protection of those the most critical ecological resources, strict adherence to the ecological mitigation hierarchy; and adopting an open, transparent and auditable approach to offset selection and delivery. There is a certain amount of negative press surrounding the practice of biodiversity offsetting. Among other criticisms, this is part founded on a perception that offsetting offers developers a ‘licence to trash’ natural ecosystems. If uncontrolled, the negative association with offsetting may have significant public relations connotations for a developer advocating an offsetting approach. A negative association with offsetting may be equally damaging for attracting future inward investment – particularly where compliance with IFC PS6 is a requirement. Equally poorly designed and delivered offsets could alienate a local community in which a development is based or result in negative perceptions should the offset not “deliver” on the predicted offset benefits. It is recommended that DRPIC set out and agree guiding principles for offsetting as part of their Corporate Social Responsibility policy to address these potential risks. BBOP has established 10 guiding principles which should form a starting point for consideration relating to the Project:
1. Adherence to the mitigation hierarchy - avoidance and mitigation first and offsetting as a
DRPIC to agree offsetting principles with SEZAD, MECA (if applicable) and relevant stakeholder groups.
DRPIC/SEZAD/MECA
Technical note on suitable offsetting principles for consideration by DRPIC and to secure agreement/acceptance from SEZAD and MECA (if applicable). Guidance from SEZAD / MECA on approach.

8
Duqm Refinery WSP DRPIC Project No 70029220 Confidential July 2017
STAGE RECOMMENDED ACTIONS STAKEHOLDERS WITH
GREATEST INFLUENCE ON
THIS STAGE INFORMATION REQUIREMENTS
last resort. 2. Limits to what can be offset – exclude certain,
irreplaceable habitats and species features (those which cannot be recreated) from offsetting.
3. Landscape context - A biodiversity offset should take into account available information on the full range of biological, social and cultural values of biodiversity and the local ecosystem.
4. No net loss/net gain – the aim should be to achieve no net loss or preferably net gain of biodiversity as measured by a biodiversity metric.
5. Additional conservation outcomes - A biodiversity
offset should achieve conservation outcomes above and beyond results that would have occurred if the offset had not taken place.
6. Stakeholder participation – Be democratic. Fully include relevant location community and conservation groups.
7. Equity: Biodiversity offsets should be designed and implemented in an equitable manner which respecting legal and customary arrangements and considers recognised rights of indigenous peoples and local communities.
8. Long-term outcomes – biodiversity offsets should incorporate monitoring and adaptive management to ensure they provide biodiversity benefits into the long-term; preferably in perpetuity.
9. Transparency - The design and implementation of a biodiversity offset, and communication of its results to the public, should be undertaken in a transparent and timely manner.
10. Science and traditional knowledge – offset design and implementation should be respectful of scientific and traditional sources of knowledge.
Step 2: Engaging with stakeholders

9
Duqm Refinery WSP DRPIC Project No 70029220 Confidential July 2017
STAGE RECOMMENDED ACTIONS STAKEHOLDERS WITH
GREATEST INFLUENCE ON
THIS STAGE INFORMATION REQUIREMENTS
Engagement with stakeholders should be undertaken to:
a) Define and agree offsetting principles; b) Agree local nature conservation priorities; c) Identify potential offset sites and providers.
Produce an inventory of potential stakeholders. Consult with stakeholder groups. SEZAD to provide list of tenants and potential stakeholders (including other developers).
DRPIC, SEZAD
Land owners, tenants and developers;
Inventory of potential conservation organisations with an interest in management, delivery or monitoring of offset sites.
Step 3: Quantify loss of natural habitat and critical habitat associated with the Project and define offset requirement
A hallmark of a biodiversity offsetting approach is that changes in biodiversity must be quantified. In order to achieve this, a metric must be selected which is appropriate to the local ecosystem; and reflects the offsetting principles agreed for the project. A number of metrics have been developed for different applications – a detailed review has been undertaken by BBOP (2009). Many metrics convert ecological data into ‘biodiversity units’ as a surrogate measure for biodiversity. Units present before and after development can be an effective guide to the size and type of offset required. Many biodiversity metrics rely on basic habitat information. Habitat area and condition are two basic criteria that can be used as a surrogate for quantification of biodiversity change. For example, this approach has been adopted in a UK context by DEFRA.
Develop a biodiversity metric in consultation with stakeholder organisations (different approaches may be required for the terrestrial and marine environments). Produce a detailed baseline habitat map for the terrestrial and marine elements of the Project. Agree a habitat typology to be used for the Project Area with stakeholders (e.g. Brown and Boer, 2004). Undertake a baseline biodiversity unit calculation for the Project.
DRPIC, SEZAD
BBOP information and guidance on biodiversity metrics including criteria to assign habitat scores to support the prioritisation process;
Habitat mapping for the Project area (see Technical Appendix B: Harmonised Habitat Mapping).
In order to utilise a habitat based metric to quantify ‘biodiversity’ information is typically required for both habitat type and its condition (e.g. good, degraded, recofering etc.) However, this requirement will be influenced by what metric is selected/designed for the Duqm area.
Step 4: Informing environmental mitigation design
Application of the offsetting principles agreed at the outset; knowledge of the quantity of biodiversity units likely to be impacted (the baseline biodiversity calculation); and identification of suitable offsetting locations with stakeholders will enable design of a robust ecological mitigation strategy.
SEZAD to publish strategic biodiversity network/green infrastructure plan for the region. Produce an integrated ecological mitigation plan specifying new areas of habitat which are to be created or managed differently. Consult on proposed mitigation strategy.
SEZARD, , stakeholder groups
Biodiversity opportunity and critical habitat mapping study across SEZAD region including both terrestrial and marine areas. Habitat mapping of mitigation land or marine zone area to indicate habitat creation aims and objectives. Consultation inputs from stakeholder groups.
Step 5: Calculating the potential biodiversity units of Project and offset sites

10
Duqm Refinery WSP DRPIC Project No 70029220 Confidential July 2017
STAGE RECOMMENDED ACTIONS STAKEHOLDERS WITH
GREATEST INFLUENCE ON
THIS STAGE INFORMATION REQUIREMENTS
When a mitigation strategy has been finalised, the biodiversity metric which was developed as part of the Step 3 works should be re-run to demonstrate the number of biodiversity units generated by selected mitigation actions. An assessment can be made at this stage, whether no net loss or a net gain (of biodiversity units) has been achieved. Mitigation plan can be updated to reflect to meet no net loss or net gain targets.
Undertake an operational Project biodiversity unit calculation for the Project. In the case that the offset proposal is defined as a contribution to a strategic conservation initiative which is not within DRPIC ownership or control (e.g. a programme to reinstate native vegetation in an area that has been overgrazed conducted by a third party conservation organisation) – the metric developed as part of Stage 3 could be used to quantify the increase in biodiversity value of a third party organisation’s land to ascertain if no net loss or net gain has been acheived.
DRPIC, stakeholder groups
Habitat mapping of mitigation land to indicate habitat creation aims and objectives.
Step 6: Selection of offset providers and setting up legal/delivery agreements
Consultation with stakeholders and land owners should be undertaken to agree and implement legal delivery mechanisms, management agreements and to arrange offset financing.
Consultation and negotiation with offset providers.
SEZAD, DRPIC N/A
Step 7: Monitoring, review and evaluation
A monitoring strategy should be developed to monitor the success of the biodiversity offset and to ensure that management is effective at preserving its biodiversity importance. Clear goals should be defined for DRPIC, stakeholder oganisations and regulatory bodies to monitor its success. Adaptive management should be undertaken subject to the outcome of ecological monitoring studies.
Produce and implement monitoring strategy. DRPIC, stakeholder groups
N/A

11
Duqm Refinery WSP DRPIC Project No 70029220 Confidential July 2017
7. IDENTIFICATION OF POTENTIAL OFFSETTING STAKEHOLDERS
Table E-3 sets out stakeholders who will require engagement and consultation in order to develop a biodiversity offsetting strategy for the Project Area.
Table E-3: Potential Biodiversity Offsetting Stakeholders: Potential Stakeholders in Biodiversity Offsetting Stakeholder/Stakeholder Group
STAKEHOLDER GROUP AREA OF INFLUENCE ROLE
Ministry of Environment
and Climate Affairs
Government policy, management of
protected areas and
onshore/offshore (outside Duqm
SEZ) environmental authority.
Government policy, direction and
funding. Offsetting scheme regulator
(outside SEZ). Strategic allocation of
offset land within Duqm SEZ.
Office for Conservation of
the Environment, Diwan of
Royal Court
Government policy, protected areas
and wildlife management and
research (e.g. Al Wusta Wildlife
Reserve)
Biodiversity conservation including
protected areas management and
wildlife research. Government policy.
Special Economic Zone in
Duqm Authority (SEZAD)
Duqm SEZ authority and strategic
planner, environmental regulator for
Duqm SEZ.
Offsetting scheme regulator. Strategic
allocation of offset land within Duqm
SEZ.
Critical habitat assessment of strategic
development plans and identification of
likely mitigation and compensation
objectives. Strategic broker for
offsetting finances.
DRPIC Project area
Funding and management of potential
offsets to address impacts specifically
associated with the Project.
Other developers/oil and
gas industries/residential
and business commercial
industries
Various locations in the Duqm SEZ
area.
Funding and management of potential
offsets areas to address impacts
specifically associated with existing and
future developments.
Tourism industry (to
include Ministry of
Tourism, Omran,
developers, operators)
Development of business streams
around natural habitats/funding of
offsets
Beneficiaries of biodiversity offsets
(tourist attractions). Potential funders of
biodiversity offsets (e.g. ecotourism).
Fisherman, farmers and
pastoralists
These land/sea users could
contribute to delivery of offsets by
adapting their management of
marine or terrestrial recources
possibly by accepting payment
from those requiring an offset.
Responsible for delivery of habitat
management or adapting land
management to enable ecological gain
(e.g. modifying grazing regimes).
Potential beneficiaries of biodiversity
offsets.
Nature Conservation Non-
Governmental
Organisations
Delivery of offset projects by
adapting land/sea nature
conservation projects /land
management. Technical knowledge
of nature conservation initiatives.
Provision of third party verification of
offset success.
Potential offset management agencies.
Provision of scientific expertise and
advice.
Consultants, biodiversity
offsetting brokers Contract/project specific.
Quantification and definition of offsets.
Technical advice. Stakeholder
consultation.

12
Duqm Refinery WSP DRPIC Project No 70029220 Confidential July 2017
8. REVIEW OF ECOLOGICAL FEATURES POTENTIALLY TRIGGERING AN OFFSETTING REQUIREMENT IN THE PROJECT AREAS
The following list of habitats and species has been extracted from the main Biodiversity Chapter and accompanying Technical Appendix series (particularly the Harmonised Habitat Mapping in Technical Appendix B and the Critical Habitat Assessment in Technical Appendix C).
A list of natural habitats as defined by PS6, triggering the requirement to achieve no net loss is as follows. Note – the Study Area in this context is the area within the Project footprint and a 0.25 km zone around this. This is not the area of habitat loss.
Approaches to deliver offset potential residual impacts on natural habitats could be delivered by adopting a habitat based metric similar to the US, UK and Australian models (adapted to the local context). However, a first step would be to provide an accurate habitat loss estimate for the Project taking into consideration permanent loss and habitats which are restored post-construction to define an accurate offset requirement.
Table E-4: Habitats and Species in Duqm Area
HABITAT TYPE
AREA IN KM2 IN
THE STUDY
AREA
PERCENTAGE OF
OVERALL STUDY
AREA
DISTRIBUTION WITHIN THE PROJECT FOOTPRINT
Gravel &
sand plains
with dwarf
shrub cover
31.28 65.41
Along the length of the pipeline, dominant habitat at both
constructions camps and along part of service corridor close
to oil refinery. Co-dominant habitat at Ras Markaz crude oil
park
Gravel &
sand plains
with trees
2.23 4.66 Scattered locations along the pipeline
Rocky
mountain &
escarpment
0.96 2.01 A few locations along pipeline north of Haima road junction
Rocky
outcrops &
gravel hills
5.97 12.48
Scattered locations including services corridor, construction
camp 2, Ras Markaz crude oil park and along the length of
the pipeline
Vegetated
dune 0.05 0.10 Ras Markaz crude oil park
Vegetated
sabkha 1.73 3.62
Co-dominant habitat along the services corridor. Also
present where pipeline turns east and heads towards
construction camp 1
Wadis in
close
association
with
mountains
0.3 0.63 Just north of Haima road junction
Wadis in
open terrain 5.3 11.08
Scattered along length of the pipeline. Also in NE corner of
construction camp 2
A list of species which may trigger the requirement as per IFC PS6 to achieve net gain of critical habitat is stated in table E5 (terrestrial) and E6 (marine). As noted in the biodiversity chapter and the CHA (Technical Appendix C). The several endemic plant species which are listed have relatively well defined habitat requirements although recent distribution data is lacking (see Technical Appendix C). Approaches to deliver offset potential residual impacts on these could be delivered by adopting a habitat based metric similar to the US, UK and Australian models (adapted to the local context).

13
Duqm Refinery WSP DRPIC Project No 70029220 Confidential July 2017
However, the majority of these species listed in table E5 are extremely wide-ranging (e.g. predatory mammals) or make use of the entire Gulf of Masirah (e.g. cetacean species, turtle species). Arriving at suitable conservation approaches for these species, and potential offsetting projects is a cumulative issue relating to all users and potential developers within the Duqm SEZ and the marine environment. When considering the multiple species which may trigger critical habitat in the Project Area and particularly the area in which Associated Facilities are proposed or operational, there is a requirement to adopt a coordinated approach which is beyond the scope of the Project – this needs to be agreed at a strategic level with Government authorities before offsetting solutions can be effectively delivered.
Table E-5: Inventory of Terrestrial Species Triggering Critical Habitat which may be affected by the Project and Associated Facilities
SPECIES/FEATURE FEATURE TYPE ENDEMISM (OMAN
OR REGIONAL)
OMAN
STATUS REGIONAL STATUS GLOBAL STATUS
Salsola omanensis Plant Endemic NE NE VU
Ochradenus
harsusiticus Plant Endemic NE NE VU
Pycnocycla sp. nov. Plant Endemic Dd NE NE
Campylanthus
sedoides Plant Endemic NE NE NT
Convolvulus
oppositifolius Plant Endemic NE NE NT
Pulicaria pulvinata Plant Endemic NE NE NT
Striped hyaena
(Hyaena hyaena) Mammal N/A CR
1 EN
2 NT
Arabian wolf
(Canis lupus arabs) Mammal N/A EN
1 EN
2 LC
Rüppell's sand fox
(Vulpes rueppellii) Mammal N/A EN
1 LC
2 LC
Caracal
(Caracal caracal) Mammal N/A EN
1 LC
2 LC
Ibex
(Capra ibex) Mammal N/A EN
1 NE VU
Wetland bird
assemblage using
Duqm IBA
Bird N/A N/A N/A N/A
Table E-6: Inventory of Marine Species Potentially Triggering Critical Habitat which may be affected by the Project and Associated Facilities
SPECIES
FEATURE TYPE OMAN STATUS REGIONAL STATUS GLOBAL STATUS
Arabian long-beaked common dolphin Delphinus capensis tropicalis
Cetacean NE NE DD
Blue Whale Balaenoptera musculus
Cetacean NE NE EN
Bryde's Whale Balaenoptera edeni
Cetacean NE NE DD
Cuvier's beaked whale Ziphius cavirostris
Cetacean NE NE LC

14
Duqm Refinery WSP DRPIC Project No 70029220 Confidential July 2017
SPECIES
FEATURE TYPE OMAN STATUS REGIONAL STATUS GLOBAL STATUS
Dwarf sperm whale Kogia sima
Cetacean NE NE DD
False killer whale Pseudorca crassidens
Cetacean NE NE DD
Humpback whale Megaptera novaeangliae
Cetacean NE EN LC
Indian Ocean humpback dolphin Sousa plumbea
Cetacean NE NE EN*
Indo-pacific bottlenose dolphin Tursiops aduncus
Cetacean NE NE DD
Orca Orcinus orca
Cetacean NE NE DD
Pygmy killer whale Feresa attenuata
Cetacean NE NE DD
Risso's Dolphin Grampus griseus
Cetacean NE NE LC
Rough toothed dolphin Steno bredanensis
Cetacean NE NE LC
Sperm Whale Physeter macrocephalus
Cetacean NE NE VU
Spinner Dolphin Stenella longirostris
Cetacean NE NE DD
Pantropical Spotted Dolphin Stenella attenuata
Cetacean NE NE LC
Hawksbill turtle Eretmochelys imbricata
Turtle NE NE CR
Green turtle Chelonia mydas
Turtle NE NE EN
Leatherback turtle Dermochelys coriacea
Turtle NE CR VU
Loggerhead turtle Caretta caretta
Turtle NE CR VU
Olive Ridley turtle Lepidochelys olivacea
Turtle NE NE VU

15
Duqm Refinery WSP DRPIC Project No 70029220 Confidential July 2017
SPECIES
FEATURE TYPE OMAN STATUS REGIONAL STATUS GLOBAL STATUS
Oman Butterflyfish Chaetodon dialeucos
Fish NE NE LC
Yellow-bellied sea snake Pelamis platura
Snake NE NE LC
A coral species Dipsastraea favus
Hard coral NE NE NE
A coral species Favites pentagona
Hard coral NE NE LC
Cabage Coral Montipora foliosa
Hard coral NE NE NT
A coral species Platygyra daedalea
Hard coral NE NE LC
A coral species Plesiastrea versipora
Hard coral NE NE LC
A coral species Porites lobata
Hard coral NE NE NT
A coral species Stylophora pistillata
Hard coral NE NE NT
A coral species Turbinaria mesenterena
Hard coral NE NE VU
A coral species Turbinaria peltata
Hard coral NE NE VU
Cabbage leather coral Sinularia brassica
Soft Coral NE NE NE
Arabian cushion star Culcita coriacea
Marine Fauna NE NE NE
Spiny cushion star Culcita schmideliana
Marine Fauna NE NE NE
Indian Sea Star Fromia indica
Marine Fauna NE NE NE
A starfish Linckia multifora
Marine Fauna NE NE NE
Lollyfish Holothuria atra
Marine Fauna NE NE LC
Tiger-tail sea cucumber Holothuria hilla
Marine Fauna NE NE LC
White thread fish Holothuria leucospilota
Marine Fauna NE NE LC
Macroalgae Nizamuddinia
Macroalga NE NE NE
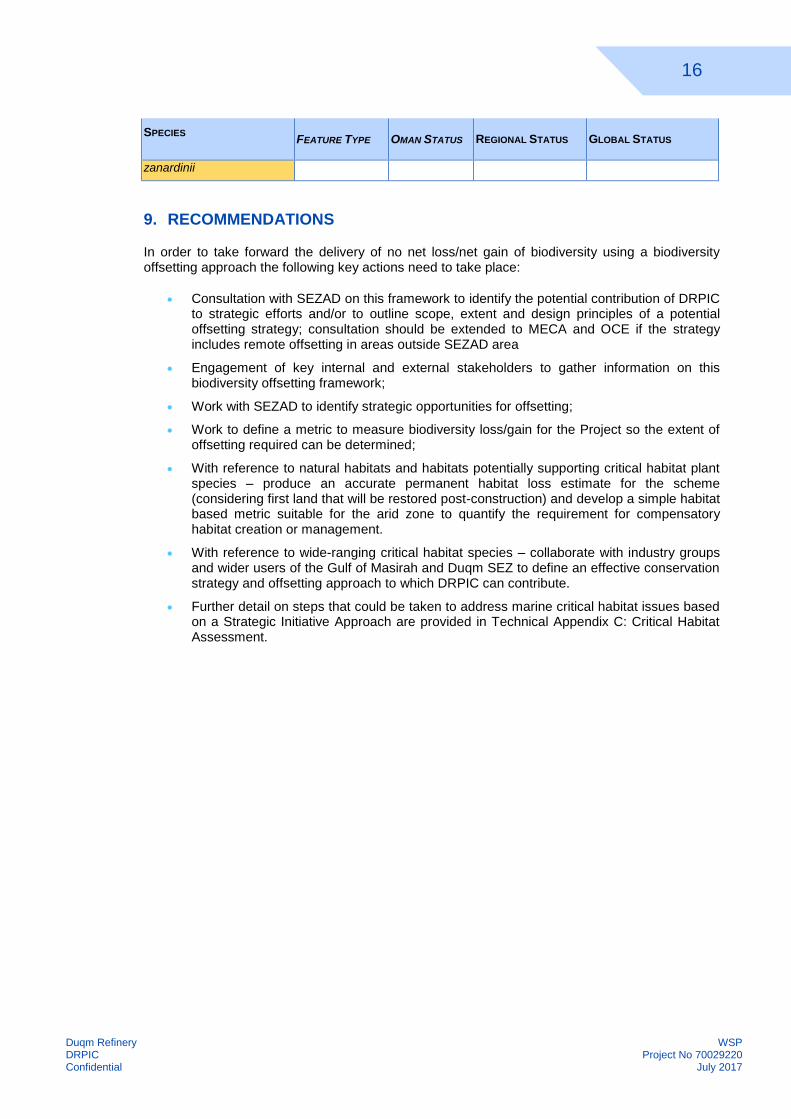
16
Duqm Refinery WSP DRPIC Project No 70029220 Confidential July 2017
SPECIES
FEATURE TYPE OMAN STATUS REGIONAL STATUS GLOBAL STATUS
zanardinii
9. RECOMMENDATIONS
In order to take forward the delivery of no net loss/net gain of biodiversity using a biodiversity offsetting approach the following key actions need to take place:
Consultation with SEZAD on this framework to identify the potential contribution of DRPIC to strategic efforts and/or to outline scope, extent and design principles of a potential offsetting strategy; consultation should be extended to MECA and OCE if the strategy includes remote offsetting in areas outside SEZAD area
Engagement of key internal and external stakeholders to gather information on this biodiversity offsetting framework;
Work with SEZAD to identify strategic opportunities for offsetting;
Work to define a metric to measure biodiversity loss/gain for the Project so the extent of offsetting required can be determined;
With reference to natural habitats and habitats potentially supporting critical habitat plant species – produce an accurate permanent habitat loss estimate for the scheme (considering first land that will be restored post-construction) and develop a simple habitat based metric suitable for the arid zone to quantify the requirement for compensatory habitat creation or management.
With reference to wide-ranging critical habitat species – collaborate with industry groups and wider users of the Gulf of Masirah and Duqm SEZ to define an effective conservation strategy and offsetting approach to which DRPIC can contribute.
Further detail on steps that could be taken to address marine critical habitat issues based on a Strategic Initiative Approach are provided in Technical Appendix C: Critical Habitat Assessment.

17
Duqm Refinery WSP DRPIC Project No 70029220 Confidential July 2017
REFERENCES
Baldwin, R., Willson, A. and Collins, T. (2015). Watching out for whales: industry responsibility to address threats to Arabian Sea humpback whales in the Gulf of Masirah, Oman. Paper SC/66a/SH23 presented to the International Whaling Commission Scientific Committee, San Diego, May 2015. (Available from the IWC Office).
Breuer, R (2011). Nimr Water Treatment Project Oman [on-line] http://www.bauer.de/export/shared/documents/pdf/bre/project_sheets/bre_nimrpaper_en.pdf (accessed July 2017).
Brown, G. and Boer, B. (2004). Interpretation Manual of the Major Terrestrial Natural and Semi-natural habitat Types of Abu Dhabi Emirate. Environmental Research and Wildlife Development Agency.
Business and Biodiveresity Offsets Programme (2009). Biodiversity Offset Design Handbook and Appendices. BBOP, Washington, D.C.
Business and Biodiversity Offsets Programme (2012). Guidance Notes to the Standard on Biodiversity Offsets. BBOP. Washington DC.
Business and Biodiversity Offsets Programme (2017). Biodiversity Offsetting Standards and Guidance [on-line] http://bbop.forest-trends.org/pages/guidelines (accessed June 2017).
Business and Biodiversity Offsets Programme. (2013). To No Net Loss and Beyond: An Overview of the Business and Biodiversity Offsets Programme. BBOP. Washington DC.
CMS (2015). An Experimental Success: Entanglement & Stranding Response Training in Oman. 23rd November 2015. http://www.cms.int/en/news/experimental-success-entanglement-stranding-response-training-oman
DEFRA (2012). Biodiversity Offsetting Pilots, Technical Paper: the metric for the biodiversity offsetting pilot in England March.
DEFRA (July, 2011). Biodiversity offsetting: Guiding principles for biodiversity offsetting. DEFRA. London
Environment Society of Oman, (2015). Annual Report pp 18.
Environment Society of Oman, (2016). Annual Report. Pp 18
Environment Society of Oman, (2017). Masirah Community Fisheries Project. Project Report. 30th May 2017.
EWS-WWF, 2017. Viability Assessment of Biodiversity Conservation Targets. Unpublished report, June 2017. Pp 134.
Five Oceans Environmental Services. (in press). Ground truthing of hawksbill turtle foraging sites in the Gulf of Masirah, Oman. Report to EWS-WWF.
International Financial Corporation (2012). Performance Standard 6: Biodiversity Conservation and Sustainable Management of Living Natural Resources. IFC.
International Financial Corporation (2012b). Guidance Note 6: Performance Standard 6 - Biodiversity Conservation and Sustainable Management of Living Natural Resources. IFC.

18
Duqm Refinery WSP DRPIC Project No 70029220 Confidential July 2017
International Whaling Committee, (2015). Report of the Scientific Committee. IWC/66a/Rep01 (2015) Rev1. San Diego, USA, 19 May – 3 June 2015.
International Whaling Committee, (2017). Report of the Scientific Committee. IWC/67/Rep01 (2017) Rev 1. Bled, Slovenia, 9-21 May 2017.
Martin-Meher, G. (2016). Western Grey Whales Advisory Panel: Stories of Influence. IUCN, WWF, IFAW. 38 pages.
Minton, G., Reeves, R., Collins, T. and Willson, A. 2015. Report on the Arabian Sea Humpback Whale Workshop: Developing a collaborative research and conservation strategy. Dubai, 27-29 January 2015
Pilcher, N.J., Antonopoulou, M., Perry, L., Abdel-Moati, M.A., Al Abdessalaam, T.Z., Albeldawi, M., Al Ansi, M., Al-Mohannadi, S.F., Al Zahlawi, N., Baldwin, R. and Chikhi, A., 2014. Identification of important sea turtle areas (ITAs) for hawksbill turtles in the Arabian Region. Journal of Experimental Marine Biology and Ecology 460, pp.89-99.
Ramboll Environ (2016). Duqm Refinery: Environmental and Social Due Diligence – Phase 1 Report. A Report for Duqm Refinery Project Lenders.
Special Economic Zone Authority at Duqm (2016). Biodiversity Protection Technical Note. SEZAD.
The National (7th March 2017). Artificial reefs will boost marine life in Arabian Gulf. [on-line]
https://www.thenational.ae/uae/environment/artificial-reefs-will-boost-marine-life-in-arabian-gulf-1.44041 (accessed July 2017).
Western Grey Whale Advisory Panel, (2016). Report of the IFC Performance Standards Task Force of its 1
st Meeting. 20 May 2016. Gland, Switzerland.
Yemen LNG, (2008). Yemen LNG Company Biodiversity Action Plan. A model for Managing Biodiversity in a Sensitive Environment. October, 2008.

APPENDIX D-6
APPENDIX 7.6: ECOSYSTEM SERVICES ASSESSMENT

Duqm Refinery WSP DRPIC Project No 70029220 Confidential August 2017
TECHNICAL APPENDIX: ECOSYSTEM SERVICES ASSESSMENT
1. INTRODUCTION
Duqm Refinery and Petrochemical Industries Company LLC (DRPIC) is developing the Duqm Refinery Project (the ‘Project’) located within the Special Economic Zone at Duqm (Duqm SEZ). The Project comprises the Refinery and Offsite Facilities:
230,000 barrels per day (BPD) complex refinery and on-site utilities, infrastructure and storage (the ‘Refinery’);
Product export terminal (‘Export Terminal’) at the Port of Duqm;
Crude storage facility at the Ras Markaz crude oil terminal (the ‘DRPIC Ras Markaz Crude Storage Facility’); and
28” 80km Crude pipeline from Ras Markaz to the Refinery (‘DRPIC Crude Pipeline’ and together with the DRPIC Ras Markaz Crude Storage Facility and the Export Terminal, the ‘Offsite Facilities’).
As part of Project financing, the Lenders’ ESDD Report (Ramboll Environ, 2016) identified the need to provide details of potential impacts on ecosystem services arising from the Project.
2. INTERPRETATION OF LENDERS’ REQUIREMENTS – ECOSYSTEM SERVICE ASSESSMENT
The Project Lenders’ independent Environment and Social Due Diligence report (Ramboll Environ, Dec. 2016) states the following in relation to ecosystem services:
“There is little or no mention of the concept of ecosystem services throughout the various assessments. Natural resources are discussed but often these sections describe the hydrocarbons to be processed by the proposed project rather than the resources of the sites or area.” (Row 59, p.73)
The Lender’s report requires DRPIC to:
“Complete an ecosystem services assessment which includes consultation to ascertain levels of livelihood dependence.”
For the purpose of this assessment, ecosystem services are defined following the definition used in the International Financial Corporation Performance Standard 6 (IFC PS6):
“Ecosystem services are the benefits that people, including businesses, derive from ecosystems. Ecosystem services are organized into four types: (i) provisioning services, which are the products people obtain from ecosystems; (ii) regulating services, which are the benefits people obtain from the regulation of ecosystem processes; (iii) cultural services, which are the nonmaterial benefits people obtain from ecosystems; and (iv) supporting services, which are the natural processes that maintain the other services” (IFC PS6, 2012: pg. 1).

Duqm Refinery WSP DRPIC Project No 70029220 Confidential August 2017
3. METHODOLOGY
DATA SOURCES
The following desktop sources of information were used to inform this assessment:
Aerial imagery;
5th National Report to the Convention on Biological Diversity (MECA, 2014); and
Ministry of Tourism, Sultanate of Oman website (Ministry of Tourism, 2017).
Desktop sources of information were supplemented by the following primary survey information collated and prepared as part of the Consolidated ESIA:
Biodiversity Assessment – Technical Appendix A contains a survey record. Alongside biodiversity ground truthing surveys, incidental observations were gathered of settlements, grazing, fishing and other ‘ecosystem benefits’ being utilised or derived by the location population in the project area.;
Socio-economic and health baseline, including ecosystem services – a series of structured and informal interview and questionnaire surveys were carried out targeting local residents in the principle settlements surrounding the refinery (Al Tayari, Nafun and Duqm) and surveying members of the fishing community based at Nafun;
Enhanced Cultural Heritage baseline – historic desk-top studies and field survey along 80 km linear transect (DRPIC Crude Oil Pipeline ROW) inspected for, inter alia, National Archaeological and Environmental Heritage Sites. The heritage assessment was compiled using historic desk top studies carried out within the vicinity of the site and a field survey of a proposed pipeline corridor completed by Dr. Yamandú Hilbert in April 2017.
Landscape and Visual Intrusion baseline and impact appraisal – desktop study supported by teams visiting Duqm to establish Landscape Character Areas (LCA) and potential receptors. Visual amenity effects on a small number of visual receptors and landscape effects due to the change in character of the natural coastal areas were documented.
Greenhouse gas Emissions Report. (DRPIC Ref. 03-CL-Tech/GHG)
4. ECOSYSTEM SERVICE CATEGORISATION AND PRIORITISATION
A provisional inventory of ecosystem services was compiled by reviewing the above listed data sources. The list was expanded by including other ecosystem services likely to be relevant to arid ecosystems such as those found in Oman using available ecosystem typologies in the Millennium Ecosystem Assessment series of publications and in the guidance document prepared to accompany IFC PS6 (IFC, 2012b). The provisional ecosystem service inventory is presented in Table F-1.
Following IFC guidance (IFC, 2012b), ecosystem services were then categorized as follows:
Type I: Provisioning, regulating, cultural and supporting ecosystem services, over which DRPIC has direct management control or significant influence, and where impacts on such services may adversely affect communities.
Type II: Provisioning, regulating, cultural and supporting ecosystem services, over which the DRPIC has direct management control or significant influence, and on which the project directly depends for its operations.
N/A: Ecosystem services outside the sphere of control of the Project.

Duqm Refinery WSP DRPIC Project No 70029220 Confidential August 2017
Each ecosystem service was then prioritised as follows (IFC, 2012b):
Type 1 ecosystem services will be considered a priority if:
− Project operations are likely to result in a significant impact on the ecosystem service;
− The impact will result in a direct adverse impact on affected communities’ livelihood, health, safety and/or cultural heritage; and
− The project has direct management control or significant influence over the service.
Type II ecosystem services will be considered priority if:
− The project directly depends on the service for its primary operations; and
− The project has direct management control or significant influence over the service.
Prioritisation of an ecosystem service is a technique for screening or ‘flagging’ potential ecosystem services which may be significantly impacted by a project and highlighting where mitigation efforts should best be directed to preserve ecosystem service function. The prioritisation exercise clearly distinguishes between potential impacts on ecosystem services which are attributable to the Project and those that are likely to be attributable to Associated Facilities (AF). The four Project elements are defined in Table 1.1 of the main biodiversity assessment:
Duqm Refinery;
Crude oil storage tanks (at the Ras Markaz Crude Oil Storage Terminal, an AF);
DRPIC Crude Pipeline; and
Product Export Terminal.
AFs are listed and defined in Table 1.1 of the main biodiversity assessment. When assessing potential operational impacts on ecosystem services ‘normal Project activities’ are assessed. Risks associated with accidental/catastrophic oil spill into the marine environment are not considered in this assessment. However, it is acknowledged that low likelihood/high magnitude oil spill event may significantly disrupt provision of an ecosystem service and this is considered in Section 5.

Project Title WSP DRPIC Project No 70029220 Confidential August 2017
Table F-1: Ecosystem Service Assessment
PROJECT ELEMENT > ECOSYSTEM SERVICE TYPE POTENTIAL ECOSYSTEM SERVICE
BENEFICIARY
REFINERY EXPORT TERMINAL CRUDE OIL STORAGE TANKS (AT
THE RAS MARKAZ CRUDE OIL
STORAGE TERMINAL
DRPIC CRUDE PIPELINE PRIORITY ECOSYSTEM SERVICE
RELEVANT TO THE PROJECT
SUPPORTING SERVICES
Soil formation Type 1 Human population, native
biodiversity
Localised modification of the soil profile caused by Project construction may reduce future agricultural or alternative land use in the
affected area by altering soil nutrient and structural characteristics. This impact on ecosystem service provision will apply only to the
Project footprint which represents a small proportion of the overall soil resource in the Duqm region. The arid environment in the
Duqm area does not support intensive agricultural land uses – there are no beneficiary groups which will be markedly impacted,
especially in light that as a Special Economic Zone any activity is controlled by SEZAD. Project construction is unlikely to significantly
affect ecosystem service provision to potential beneficiary groups.
Non-priority.
Nutrient cycling N/A Human population, native
biodiversity
Soils in arid areas tend to be nutrient poor with low nutrient flux, and no specific soil nutrient cycling systems have been identified at
any of the project sites, other than the wetlands at the Duqm Important Bird Ares (IBA). In contrast to local soils, coastal seawater in
the project area tends to be well supplied with nutrients with inputs from upwelling at Ras Madrakah and then recycled locally.
Nutrient cycling onshore and off are unlikely to be affected by project construction or normal operational activities.
Non-priority.
Primary production N/A Human population, native
biodiversity
Primary productivity on land is limited by dry conditions and low soil nutrient concentrations. Vegetation across all project sites is
sparse, particularly at Ras Markaz. Primary productivity may be affected in the immediate vicinity of the project areas during the
construction phase by dust emissions which could smother plants, preventing their growth. In addition , lichen communities
potentially presence in the limestone hills of the Jiddat al Hariziz are potentially sensitive to air emissions from Project activities.
Marine primary productivity is high in coastal waters but is unlikely to be affected by Project construction or normal operational
activities. Marine nutrient cycling could be significantly impacted by accidental oil spill because of its effect on light penetration into
ocean surface waters.
Non-priority.
Hydrological cycles Type 1 Native Biodiversity (birds at the
Duqm IBA)
Natural habitat – intertidal
habitat and wetlands
Biodiversity associated with
wadi systems.
A diversion channel, Dangert Channel, has been construction in
the SEZAD Industrial Area to divert wadi flows around the
industrial area to points of discharge to the marine environment,
following the original wadi flow pathways. This will change the
flood water discharge characteristics to the shoreline (including
the formation of temporary brackish ponds after rain and the
supply of sediments to the beach). It is possible that these
hydrological changes may alter the distribution and abundance
of bird foraging habitats. Fluvial engineering of flood water
around the entire industrial zone was implemented by SEZAD
prior to allocation of land to the Project for Refinery construction.
As such this environmental change is not within the control of
Project activities. Diversion of wadi flows around the Refinery is
not considered an Associated Facility in relation to assessment
of ecosystem service effects according to IFC PS6. It is not
considered further in this assessment.
Diversion of the flows within Wadi Saay around the northern
breakwater of the port will alter the flow of flood water into the
creeks and mudflats of the Duqm IBA. In addition, creation of
coatal flood protection for the Export |Terminal will reduce the
exchange of sea water between lagoons in the high-tidal
lagoons in the Dum IBA. The primary loss of ecosystem
services is the infilling of a portion of the Duqm IBA, with the
redirection flows around the northern breakwater and creation of
coastal flood defences therefore being secondary (although
holding potential for the supply of flood water to a new portion of
coast which may eventually develop increased value as bird
habitat).
The creation of the Export terminal (along with flood protection
and hydrological diversion) is under the direct control of SEZAD
and the PDA. The Project will adopt a tenancy for the use of the
No significant wadi systems
exist within the Ras Markaz
storage facility project footprint.
No significant alteration of
ecosystem service provision is
likely.
The crude pipeline intersects
numerous wadi systems along its
length.
PRIORITY – Alteration of the
hydrology of the inter-tidal area
around the Port of Duqm is
outside the scope of Project
influence as it is an AF.
However, as a key user of the
newly created Export terminal
(by tenancy to the PDA) DRPIC
should seek assurances from
SEZAD and the PDA that
measures are being adopted to
mitigate for the loss of bird
habitat in Duqm IBA
(strategically or at the local
scale). This may include a
strategy for replacement of
damaged or degraded wetland
bird habitats.

Project Title WSP DRPIC Project No 70029220 Confidential August 2017
PROJECT ELEMENT > ECOSYSTEM SERVICE TYPE POTENTIAL ECOSYSTEM SERVICE
BENEFICIARY
REFINERY EXPORT TERMINAL CRUDE OIL STORAGE TANKS (AT
THE RAS MARKAZ CRUDE OIL
STORAGE TERMINAL
DRPIC CRUDE PIPELINE PRIORITY ECOSYSTEM SERVICE
RELEVANT TO THE PROJECT
shipping berth and export facilities. However, hydrological
impacts associated with construction relate to the activities of
SEZAD and PDA.
PROVISIONING SERVICES
Food production Type 1 Human population The Project is unlikely to have any significant effect on food production as no prime agricultural land will be degraded. Non-priority.
Fresh water Type 1 Freshwater biodiversity, human
population
Numerous small drainage channels and wadi systems bisected
the refinery plot. These have now been diverted into the larger
wadi system via a major channel which will provide reduced
area for grazing after rain. The socio-economic survey did not
record extensive use of this area by local communities for
grazing. Alternate, post rainfall, grazing resources associated
with ephemeral wadis are relatively frequent in the Duqm
region.
No significant wadi systems
exist within the Ras Markaz
storage facility project footprint.
No significant alteration of
ecosystem service provision is
likely.
The crude pipeline will be buried
below ground for the majority of its
approximate 60 km span. Where
the pipeline crosses wadi systems
there is scope for significant
disruption of local hydrological flows
and sedimentation/erosion patterns
which could propagate up and
down stream. This may affect
freshwater biodiversity depending
on seasonal flooding wadi systems
and local settlements/herders who
rely on floodwaters to stimulate
seasonal grazing opportunities for
their livestock.
PRIORITY – the DRPIC crude
oil pipeline is likely to be buried
below ground for the majority of
its length. However, during the
construction phase there will be
excavations through wadi
systems. In certain places the
DRPIC crude oil pipeline may
need to be supported across a
wadi system or elevated above
ground surface (depending on
the topography). Construction
techniques and design
measures should be adopted to
avoid disruption of hydrological
and sedimentaty flows.
Fuelwood production Type 1 Rural settlements and other
residents
The Project only requires localised removal of woody vegetation (particularly in wadi crossings) and then only in the construction
phase. There is little scope for Project construction to alter provision of this ecosystem service. The Project will comply with national
legislation to protected trees.
Non-priority.
Grazing land Type 1 Rural settlements and other
residents
Refinery construction has
removed several square
kilometres of informal livestock
grazing land. However, this
resource remains extensive
elsewhere in the Project area. It
should be noted that while the
SEZAD area has been
designated for industrial and
urban development, in practice
grazing is permitted and occurs
on as yet undeveloped land.
Export terminal construction will
remove < 1 square kilometre of
informal livestock grazing land.
However, this resource remains
extensive elsewhere in the
Project area.
Crude storage facility
construction will remove a
small area of informal livestock
grazing land. However, this
resource remains extensive
elsewhere in the Project area.
Construction and operation has the
potential to act as a barrier for
animal movements once
constructed, which would reduce
access to grazing areas for
livestock and wildlife. If buried the
pipeline will have little impact. If
above ground its barrier effect
should be mitigated by regular,
effectively designed animal (and
vehicle) crossing points.
Non-priority.
Unlikely to significantly affect
provision of this ecosystem
service. A measure of reduced
access to grazing areas, and a
reduced standing stock may
improve quality of grazing
overall.
Livestock rearing (camels and
goats)
Type 1 Rural settlements and other
residents
Social surveys of residents of Al Tayari, Nafun and Duqm/Saay area (WSP, 2017b) reveal informal livestock raising (camel and goat
rearing) to be a widespread ecosystem service provided in the area, and it is assumed to be valued by the population of all
settlements in the Project Area. The desert environment will remain extensive even after Project construction and thus depletion of
grazing/animal rearing resources is unlikely to be an economically significant impact associated with the Project. However,
consideration should be given to impacts such as loss of traditional agricultural activity and knowledge (i.e. cultural impact),
severance or reduction of access to grazing areas by project infrastructure; and potential road traffic incidents between Project
vehicles and livestock. The socio-economic and health assessment concluded that a third of respondents claimed some income from
grazing. Although grazing was not cited as a primary source of income, the social surveys found that grazing may provide a key
source of income (e.g. selling/buying camels, meat and other products) at certain times of year when other seasonal income sources
are scare. Livestock rearing was thus considered an important source of household income. In addition, graziers may suffer an
opportunity cost of having to import animal feed where natural grazing is not available.
PRIORITY – It is recommended
that communal area for grazing
is provided for local community
use (see recommendations in
the socio-economic and health
assessment).
Fish production Type 1 (SEZAD – Associated
Facility)
Fishing industry, local
settlements
Fish production is unlikely to be
impacted by construction or
normal project activities,
however, there is potential for
Associated Facility (Marine),
Project (Topsides) and Non-
Project (Port): This Project
element is located within the
Associated Facility:
Construction and normal
operation of this facility is
unlikely to affect fish
The majority of this Project element
is not in close proximity to the
marine environment. No significant
effect on fisheries ecosystem
PRIORITY – further
assessment of fishery impacts
linked DIPWP Associated
Facility and future dredging

Project Title WSP DRPIC Project No 70029220 Confidential August 2017
PROJECT ELEMENT > ECOSYSTEM SERVICE TYPE POTENTIAL ECOSYSTEM SERVICE
BENEFICIARY
REFINERY EXPORT TERMINAL CRUDE OIL STORAGE TANKS (AT
THE RAS MARKAZ CRUDE OIL
STORAGE TERMINAL
DRPIC CRUDE PIPELINE PRIORITY ECOSYSTEM SERVICE
RELEVANT TO THE PROJECT
the cooling water system, an
Associated Facility, to reduce
fish production because of
entrainment.
The fishing community near the
refinery will be displaced. This
will have positive and negative
consequences: it is hoped that
the expat (largely Bengali)
community will be re-housed in
permanent and better designed
facilities which will remove
significant waste issues
associated with the ad
hoc/unplanned compound that
exists today and affect the
coast and marine environment.
However, the new location will
be away from the beach and
landing site, so will affect
operational efficiency to some
extent.
port boundaries in which fishing
is prohibited. Dredging,
disposal of dredged material
and marine fill material borrow
areas will impact the marine
environment, including fish
habitats. Similar habitat exists
in the vicinity so the impact is
unlikely to be significant other
than in the immediate footprint
of these area extending out to
the zone of impact of the
sediment plume. No
permanent effect on fisheries
ecosystem service provision
predicted, and recovery after
initial disturbance is likely
unless further use of disposal
and borrow area occurs.
However, the port has been
used as a sheltered anchorage
for the dhow fishing fleet during
bad weather. During
construction and operation this
service will no longer be
available except in
emergency/extreme scenarios
(e.g. cyclone). Until the
dedicated fishery harbour is
built, in the short-term, the
dhow fleet may be at risk
during inclement weather.
productivity in the area and the
exclusion area around the
SPMs will effectively close the
area to fishing (i.e. serve as a
fisheries reserve). However,
the project introduces the risk
of oil pollution (small volume,
chronic operational spills and
large volume acute accidental
spills) which have the potential
to negatively and significantly
impact fish production, as well
as affecting the fishery.
The facility is located at the
southern end of a 6 km long
beach, the northern end of
which is a major landing site for
inshore skiffs. No change is
expected for this northern
landing site by the Project or
Associated Facilities.
service provision predicted. activities is required to design
mitigation measures and
compensate any residual
impact. Further assessment is
likely to fall within the remit of
SEZAD or the Port of Duqm
Authority (PDA) who control
and plan these activities and
not the Project.
The Project will operate only
the topsides of the Export
Terminal under a Sub-Usufruct
Agreement with Port of Duqm.
In addition, DIPWP will be
operated as an Associated
Facility. However, DRPIC
should seek assurance that
marine ecosystem issues are
being assessed, controlled and
appropriately mitigated (if
necessary). This may involve
encouraging AF operators to
carry out appropriate
monitoring activities and the
need to audit data collected by
AF operators as part of Project
environmental due diligence..
Control of use of the port by
fishermen is under the control
of the PDA and is not within the
sphere of influence of the
Project.
REGULATING SERVICES
Climate regulation Type 1 Human population Project activities will increase the supply chain of fossil fuels to energy markets, and while the end consumer is ultimately responsible
for consumption of fossil fuels and the GHG emissions that arise, the Project is responsible for the GHG emissions arising from the
construction and operation of the Project facilities across the 30 year design life.
The Project will form part of the global production and supply system for the fossil fuels upon which society currently depends,
however, the Project recognises, and has estimated, its relative contribution towards global warming and Oman’s own designated
climate change targets. Direct GHG emissions from the Project are relatively small in global terms but will have a tangible impact on
Oman’s contributions.
Heat island effect arising from project facilities is negligible in the context of development in the SEZAD area.
PRIORITY – Strategic issue
subject to national Government
management/policy.
Water regulation N/A Non-priority.
Water purification Type 1 Freshwater biodiversity, human
population
Infiltration of run off through wadi bed sediments provides a purification service for groundwater. Groundwater in the Duqm area is
only used for agricultural applications, with most wells (and associated camel and goat rearing pens) being found in Wadi Saay. An
alternative (albeit commercial) resource is produced by desalinating seawater and distributed through the mains water supply
network, which provides high quality and secure water for human and, if essential, agricultural use. Water purification service will not
be affected during normal operations, but the oil pipeline introduces the risk of spills and potential contamination of groundwater.
PRIORITY – Design of the
pipeline must minimise the risk
of loss of containment,
particularly at wadi crossings
and areas where pipeline
rupture could result in flow of

Project Title WSP DRPIC Project No 70029220 Confidential August 2017
PROJECT ELEMENT > ECOSYSTEM SERVICE TYPE POTENTIAL ECOSYSTEM SERVICE
BENEFICIARY
REFINERY EXPORT TERMINAL CRUDE OIL STORAGE TANKS (AT
THE RAS MARKAZ CRUDE OIL
STORAGE TERMINAL
DRPIC CRUDE PIPELINE PRIORITY ECOSYSTEM SERVICE
RELEVANT TO THE PROJECT
spilt product into drainage
channels and wadi network.
CULTURAL SERVICES
Recreation and ecotourism Type 1 Tourist industry, local tourist
industries (Potential)
Scenic effect on coastal
bay/beach scenery in the Duqm
area. Industrial backdrop to the
Rock Garden heritage feature.
Noise affecting location
tranquillity. Although little use
by tourists is evident at this
location. No tourist facilities
are present. In addition,
significant urban and industrial
development is already being
progressed by SEZAD in this
zone with the Project not the
most immediate backdrop.
Scenic effect on coastal
bay/beach scenery in the Duqm
area in general, and loss of
significant area of the Duqm
IBA, which has diminished
potential as an eco-tourism
attractor. Although little use by
tourists is evident at this
location. No tourist facilities
are present.
Scenic effect on coastal
bay/beach scenery of the Ras
Markaz headland. Although
little use by tourists is evident
at this location. No tourist
facilities are present.
Generally – the pipeline passes
through largely uninhabited desert.
Low potential for tourist recreation
use. The pipeline will be buried and
thus the visual impact will only last
for the construction phase.
PRIORITY – SEZAD allocated
the Project to development
plots which were sited in
proximity to potential tourist
and recreational resources. It
is evident that macro-Project
siting is not something that can
be influenced by the Project.
Where possible, project green
infrastructure should be used to
provide screening or to soften
the backdrop of hard, above
ground infrastructure on
heritage and recreation assets
(e.g. Al Wusta Wildlife Reserve,
coastal scenery, eco-tourism
opportunities, recreational
fishing etc.). .
Sense of place Type 1 Rural settlements and other
residents
Refinery construction will be
out-of-scale with low-lying
character of area.
Light from the flare stack may
be visible at night, particularly
at sea. However, the flare is
only for use in emergency
upset conditions and is not
likely to be a marked source of
light pollution at night.
Construction confined to
existing Port area.
Associated Facility:
Construction will radically alter
the coastal landscape of the
Ras Markaz headland and bay
area – although as noted in the
landscape and visual
assessment the DRPIC tanks
themselves are set back
approximately 2 km from the
sea..
When operational the majority of
the crude pipeline will be buried
below ground and is unlikely to
degrade the tranquillity and
‘naturalness’ of the desert
environment.
PRIORITY – Spatial planning is
the responsibility of SEZAD
and thus much of the
landscape and visual impact is
outside of the sphere of
influence of the Project as it
relates to the allocation of
development plots to different
industrial uses.
DRPIC should implement
measures to ‘soften’ the
landscape impact of the
refinery to mitigate the
degradation of the sense- of-
place ecosystem service
through use of green
infrastructure. DRPIC should
seek assurances from OTTCO
that similar measures are in
place for the wider tank storage
facility.
Reputation as a pristine fishing
area
Type 1 Current and future fisheries Associated Facility activities introduce the risk of pollution to an area previously remote from industrial activity including the oil
industry. Pollution includes both toxic contaminants such as fuel oils and chemicals and non-toxic contaminants such as sediment
arising from maintenance dredging activities and potential changes in the thermal properties of the sea linked to cooling water
discharge. Introduction of non-native invasive biological contaminants associated with ballast water are also a risk to the pristine
fishing environment.
.
PRIORITY –
The general issue of marine
pollution is one of wider
commercial use of the marine
zone and sites outside direct
Project influence however the

Project Title WSP DRPIC Project No 70029220 Confidential August 2017
PROJECT ELEMENT > ECOSYSTEM SERVICE TYPE POTENTIAL ECOSYSTEM SERVICE
BENEFICIARY
REFINERY EXPORT TERMINAL CRUDE OIL STORAGE TANKS (AT
THE RAS MARKAZ CRUDE OIL
STORAGE TERMINAL
DRPIC CRUDE PIPELINE PRIORITY ECOSYSTEM SERVICE
RELEVANT TO THE PROJECT
The Project but moreover the Associated Facilities may introduce the risk and perception of contamination in the area which may
affect the market value of fisheries products landed in Duqm. This issue will intensify and consolidate significantly in case of any
significant pollution event.
Project will ensure that it’s
discharges meet Project
Standards which is the more
stringent between Omani and
IFC guidelines.
The DIPWP will be operated
as an Associated Facility and is
not directly within Project
control. DRPIC should seek
assurance that marine
ecosystem issues are being
assessed, controlled and
appropriately mitigated (if
necessary).
An appropriate response may
need to be coordinated by
SEZAD and Government
agencies responsible for
management of the marine
environment. Suitable actions
may include a marine
monitoring scheme to regulate
industrial use of the marine
zone and development of
emergency response plans to
address oil spill.

9
Dqum Refinery WSP DRPIC Project No 70029220 Confidential August 2017
5. RECOMMENDATIONS
The following recommendations arise from the ecosystem service prioritisation exercise and are divided into two categories:
Project related recommendations – factors that DRPIC has influence or direct control over; and
Strategic recommendations – factors which the Project may affect in a cumulative way (with AFs and other developments in the DSEZ) but which relate mainly to regional planning and Government policy.
In the first category, DRPIC will seek to mitigation for these issues through implementation of the Project ESMP. In the second category, DRPIC will seek to influence (where possible) and address these issues through consultation and advocacy with SEZAD and potentially through Corporate Social Responsibly (CSR) initiatives.
Further recommendations are provided for how DRPIC might use CSR and environmental initiatives to contribute to safeguarding ecosystem service provision and in relation to DRPICs potential responsibility for addressing accidental oil spill risk and its potential impact on marine ecosystem service provision at Associated Facilities.
PROJECT-RELATED
1. The Community Health and Safety Management Plan in the ESMP contains measures to ensure any barrier effect that may impede movement of livestock during the construction phase of the DRPIC crude import pipeline is minimised.
2. The DRPIC Crude Oil Pipeline is primarily buried below ground for the majority of its length. However, during the construction phase there will be excavations through wadi systems. In certain places the DRPIC crude oil pipeline may need to be supported across a wadi system or elevated above ground surface (depending on the topography). DRPIC should ensure methods adopted by the EPC contractor are designed to avoid disruption of hydrological cycle ecosystem service provision.
3. To mitigate adverse impacts on the livestock rearing ecosystem service, it is recommended that the Project encourages SEZAD to provide a communal area for grazing for local community use (see recommendations in the socio-economic and health assessment).
4. Project green infrastructure should be used to provide screening or to soften the backdrop of hard, above ground infrastructure on heritage and recreation assets (e.g. Al Wusta Wildlife Reserve, coastal scenery, eco-tourism opportunities, recreational fishing etc.).
STRATEGIC
5. Alteration of the hydrology of the intertidal area around the Port of Duqm is outside the scope of Project influence. However, as a key user of the newly created Export terminal (by tenancy to the PDA) DRPIC should seek assurances from SEZAD and the PDA that measures are being adopted to mitigate for the loss of bird habitat in Duqm IBA (strategically or at the local scale). This may include a strategy for replacement of damaged or degraded wetland bird habitats and implementation of a management plan for the un-impacted portion of the Duqm IBA.
6. Further assessment is required of fishery impacts linked to the DIPWP ( Associated Facility); future dredging activities which may be undertaken by the PDA; and possible toxic inputs or introductions of invasive species to the marine environment by import and export vessels. Assessment findings should be used to design mitigation measures and compensate any deleterious impacts on fishery ecosystem service provision. Further assessment falls within

10
Dqum Refinery WSP DRPIC Project No 70029220 Confidential August 2017
the remit of SEZAD and the PDA who control and plan these activities and not the Project. DRPIC should seek assurance that potential marine ecosystem pollution impacts are being assessed, controlled and appropriately mitigated (if necessary). This may involve encouraging AF operators to carry out appropriate impact assessment and monitoring activities and the need to audit data collected by AF operators as part of Project environmental due diligence.
7. DRPIC should seek assurances from OTTCO that appropriate landscaping and/or design measures are in place for the wider tank storage facility to partially mitigate the impact on sense of place ecosystem service provision.
ACCIDENTAL OIL SPILL
8. Accidental oil spill is likely to be the single biggest factor which could degrade ecosystem service provision in the marine environment across a broad range of ecosystem service types. The responsibility to address oil spill risk rests with the strategic regulators of the marine environment including SEZAD and the PDA (and MECA outside of the SEZ). DPRIC should embed auditing of its oil supply chain in its environmental due diligence protocols to ensure appropriate oil spill avoidance and emergency response measures are in place. Along with SEZAD, the PDA and OTTCO, DRPIC should contribute to oil spill emergency response requirements.
OTHER MEASURES
9. DRPIC should explore the potential for CSR activities around developing provision of an artificial reef program to benefit local fisheries.
10. As a CSR activity in coordination with SEZAD, DRPIC may seek to engage with emerging Omani eco-tourism operators working in the Duqm area to develop business skills, facilities and attractions in the vicinity of the project activities under SME initiatives. Attractions in the area which may be developed or enhanced include the Duqm IBA, recreational fishing and marine wildlife watching, Al Wusta Wildlife Reserve, Duqm Rock Garden.

11
Dqum Refinery WSP DRPIC Project No 70029220 Confidential August 2017
REFERENCES
International Financial Corporation (2012). Performance Standard 6: Biodiversity Conservation and Sustainable Management of Living Natural Resources. IFC.
International Financial Corporation (2012b). Guidance Note 6: Performance Standard 6 - Biodiversity Conservation and Sustainable Management of Living Natural Resources. IFC.
Millennium Ecosystem Assessment (2005). Ecosystems and human well-being. MEA.
Ministry of Environment and Climate Affairs (MECA). (2014), 5th National Report to the
Convention on Biological Diversity. Government of Sultanate of Oman, Muscat.
Ministry of Tourism, Sultanate of Oman website (Ministry of Tourism, 2017). https://www.omantourism.gov.om/wps/portal/mot/tourism/oman/home (accessed June 2017).
Ramboll Environ (December, 2016). Duqm Refinery Environmental and Social Due Diligence: Phase 1 Report. Report prepare on behalf of project lenders.
WSP (2017a). Biodiversity Assessment: DRPIC Project Cluster Consolidated Impact Assessment - Duqm Refinery Project, Oman – Technical Appendix A. DRPIC
WSP (2017b). Socio-economic and health baseline: Duqm Refinery Project, Oman - Consolidated Environmental and Social Impact Assessment. DRPIC

Appendix E
APPENDICES FOR SECTION 8 – SOCIO-ECONOMICS AND HEALTH

APPENDIX E-1
APPENDIX 8.1: SOCIO-ECONOMIC AND HEALTH BASELINE REPORT

REPORT NO 70029220-05-C-BASE/SOC
SOCIO-ECONOMIC AND HEALTH BASELINE DUQM REFINERY PROJECT, OMAN
CONSOLIDATED ENVIRONMENTAL AND SOCIAL IMPACT ASSESSMENT (ESIA)
CONFIDENTIAL JULY 2017

Confidential Project no: 70029220 Date: July 2017
– WSP 6 Devonshire Square London, EC2M 4YE Tel: +44 (0)20 7337 1700 www.wsp.com
SOCIO-ECONOMIC AND HEALTH BASELINE
DUQM REFINERY PROJECT, OMAN
Duqm Refinery & Petrochemical Industries Company

Q U A L I T Y M A N A G E M E N T
ISSUE/REVISION FIRST ISSUE REVISION 1 REVISION 2
Remarks Draft Draft Rev. 1 Final, Rev.2
Date 13 July 2017 25 July 2017 31 July 2017
Project number 70029220 70029220 70029220
Report number 70029220-102 70029220-102 70029220-102
File reference Project drive Project drive Project drive

iii
Duqm Refinery Project WSP
DRPIC Project No 70029220 Confidential July 2017
TABLE OF CONTENTS 1 INTRODUCTION ...........................................................................5
1.1 BACKGROUND .............................................................................................. 5
1.2 PROJECT DESCRIPTION .............................................................................. 5
1.3 PREVIOUS BASELINE WORK ....................................................................... 7
1.4 SCOPE OF REPORT ...................................................................................... 7
2 SURVEY IMPLEMENTATION ......................................................8
2.1 APPROACH AND SCOPE TO SOCIO-ECONOMIC SURVEY (HOUSEHOLD AND FISHERMEN SURVEYS) ............................................... 8
2.2 GOVERNMENT-LED RESETTLEMENT IN THE AREA ............................... 10
2.3 IMPLEMENTATION OF THE SURVEYS AND INTERVIEWS ........................ 10
3 GENERAL POPULATION PROFILE ..........................................11
3.1 DEMOGRAPHICS AND GENDER DATA ...................................................... 11
3.2 EDUCATION ................................................................................................. 12
3.3 UNEMPLOYMENT ........................................................................................ 12
3.4 ASSET OWNERSHIP ................................................................................... 13
3.5 INCOME ....................................................................................................... 13
3.6 HEALTH ....................................................................................................... 13
4 HOUSEHOLD SURVEY RESULTS AND ANALYSIS ................16
4.1 GENERAL .................................................................................................... 16
4.2 DEMOGRAPHIC PROFILE OF RESPONDENTS .......................................... 17
4.3 EDUCATION ................................................................................................. 18
4.4 EMPLOYMENT ............................................................................................. 18
4.5 ASSET OWNERSHIP ................................................................................... 18
4.6 HOUSEHOLD INCOME AND EXPENDITURES ............................................ 19
4.7 HEALTH SITUATION .................................................................................... 21

iv
Duqm Refinery Project WSP
DRPIC Project No 70029220 Confidential July 2017
4.8 PROJECT EXPECTATIONS ......................................................................... 21
5 FISHERMEN SURVEY RESULTS AND ANALYSIS ..................21
5.1 GENERAL .................................................................................................... 21
5.2 FISHERMEN SURVEY AND APPROACH .................................................... 22
6 CONCLUSIONS ..........................................................................24
7 REFERENCES............................................................................25

5
Duqm Refinery Project WSP
DRPIC Project No 70029220 Confidential July 2017
1 INTRODUCTION
1.1 BACKGROUND
Duqm Refinery and Petrochemical Industries Company LLC (DRPIC) is developing the Duqm Refinery Project (the “Project”) located within the Special Economic Zone at Duqm (Duqm SEZ). The Project is a joint venture between Oman Oil Company (OOC) and Kuwait Petroleum (Europe) B.V. (KPE) to develop, build, own and operate an export refinery complex, with each shareholder holding 50% interest. A minority of the Project Company may be owned by one or more strategic or financial investors in the future. The Project comprises the Refinery and Offsite Facilities:
230,000 BPD complex refinery and on-site utilities, infrastructure and storage (the “Refinery”);
Product export terminal (“Export Terminal”) at the Port of Duqm; Crude storage facility at the Ras Markaz crude oil terminal (the “DRPIC Ras Markaz Crude
Storage Facility”); and 28” 80km Crude pipeline from Ras Markaz to the Refinery (“DRPIC Crude Pipeline” and
together with the DRPIC Ras Markaz Crude Storage Facility and the Export Terminal, the “Offsite Facilities”).
The Duqm Refinery Project, one of several industrial projects in land allocated within the Duqm Industrial Zone, is a key project in the Special Economic Zone that will serve as the economic springboard for Duqm’s transformation into one of the largest industrial and commercial hubs in the region. In March 2017, WSP UK Ltd. (WSP) was commissioned by DRPIC to carry out the development of a supplementary package of information comprising environmental, social and health assessment documentation in order to provide a holistic summary of the Project while consolidating the aspects, impacts and mitigation from historical reports and new data. This is to be supplemented with technical reports where required, including this report. This report presents the methodology and results of an investigation into socio-economic and health aspects to inform a consolidated social baseline around the geographic area of the Project components comprising the proposed Refinery at Duqm, Oman.
1.2 PROJECT DESCRIPTION
A more detailed description of the Duqm Refinery Project – comprising the Refinery itself and its Off-site Facilities (i.e. the “Funded Project”) – provides more context for socio-economic information. The involvement of lenders has also identified the need for the Consolidated ESIA to take into account “Associated Facilities” (AF) – developments being progressed by third parties that will contribute services and/or functions to the Duqm Refinery Project. The components of both the Project and its AFs are described in Table 1.1.

6
Duqm Refinery Project WSP
DRPIC Project No 70029220 Confidential July 2017
Table 1.1: Duqm Refinery Project and AFs
PROJECT COMPONENT DESCRIPTION
Duqm Refinery
A 230,000 BDP complex refinery on a plot of 9km2 area to the north of the main industrial area within the Special Economic Zone at Duqm (Duqm SEZ). This includes:
Site clearance and levelling (completed in late 2016)
Product pipelines and service lines to the Export Terminal
Construction accommodation/workers’ camps
Laydown areas.
Off-site Facilities
i. Crude storage facility at the Ras Markaz (RM) Crude Oil Terminal: eight tanks located within, and part of the wider Tank Farm, approx. 80km from the Refinery. The large-scale Tank Farm (Oman Oil Tank Terminal Company, OTTCO) in its entirety is not part of the Project.
ii. ‘DRPIC Crude Pipeline’: 28-inch diameter 80km crude oil import pipeline to transport crude oil from RM to Duqm Refinery.
iii. Product ‘Export Terminal’: on the lee breakwater of Port of Duqm, immediately to the south-east of the Refinery plot. Topside works only, i.e., to establish storage for products and export handling facilities.
Associated Facilities
i. Natural gas spur line/metering station used to supply gas feedstock to DR from the national gas network (Oman Gas Company, OGC)
ii. Export pipeline corridor – Construction of the corridor and infrastructure, i.e., pipe supports, bridges, fencing drainage, etc., including pipeline and services themselves under the Refinery. (Under SEZAD/Marafiq responsibility). Note: SEZAD has overall responsibility for the Pipeline Corridor, excluding the DR pipelines and cables, extending from the Refinery Boundary Marker fence-line to the Port fence-line.
iii. The marine scope including dredging and reclamation and jetty and quay wall construction of the Duqm Export Terminal. (SEZAD).
iv. Haul road or dedicated lane (on Existing Road) for solid product from DR to the Duqm Export Terminal. (SEZAD).
v. Duqm Integrated Power and Water Plant (DIPWP) supplying electricity and desalinated water to DR (and in the future other consumers in the DSEZ. (Marafiq, also known as Central Utilities Company, CUC). Note that this now includes items vi and vii below.
vi. Seawater supply network (to DIPWP). (Marafiq).
vii. Common wastewater outfall for industrial zone users. (SEZAD).
viii. Offshore oil import facilities (including offshore single point mooring (SPM) and crude oil pipeline to shore at RM. (OTTCO).

7
Duqm Refinery Project WSP
DRPIC Project No 70029220 Confidential July 2017
1.3 PREVIOUS BASELINE WORK
Some high level socio-economic details are included in local EIAs prepared earlier for various project components, however certain key local EIAs (i.e. EIA Study for Duqm Refinery, 2015 and EIA Study for Duqm Industrial Free Zone Masterplan, 2011) do not include sufficient socio-economic baseline or heath data. In addition, national social statistics are being regularly updated and as a consequence the earlier high level socio-economic details can be considered outdated. This report supplements the existing high level socio-economic data and provides more granulation on the socio-economic profile of local communities in the project area.
1.4 SCOPE OF REPORT
The Lenders’ Independent Environmental and Social Due Diligence review, undertaken by Ramboll Environ in 2016 identified a number of data gaps relating to socio-economic aspects of the Project. The review stated:
“The social baseline report does not provide detail on the socio-economic characteristics of the Project affected settlements and therefore does not provide an adequate baseline for the purposes of monitoring of Project impacts. This is of significance in two areas: community health profiling (which is likely to be affected by the Duqm Refinery Project); and understanding levels of livelihood dependencies on ecosystem services (which are likely to be affected by Associated Facilities)”.
This report on the socio-economic baseline in and around Duqm provides a description of the socio-economic profile of the local communities, briefly describes the survey methodology and focuses on the survey results which form the socio-economic and health baseline in the Project area (see Figure 1).
Figure 1.1: Schematic Plan of the funded project components

8
Duqm Refinery Project WSP
DRPIC Project No 70029220 Confidential July 2017
The limitations of the survey are discussed in Section 2.3 of this Report. The funded components of the project include the following elements: The Refinery (including land clearance, product pipelines and service lines from refinery to
Duqm Export Terminal and construction accommodation camps including laydown areas) Ras Markaz Crude Oil Storage Terminal (dedicated eight tank area and essential infrastructure
only) Crude Import Pipeline (Ras Markaz to Duqm Refinery) Duqm Export Terminal (topside only, comprising Products Storage & Export Facilities).
2 SURVEY IMPLEMENTATION
2.1 APPROACH AND SCOPE TO SOCIO-ECONOMIC SURVEY (HOUSEHOLD AND FISHERMEN SURVEYS)
The purpose of the socio-economic survey was to facilitate closing gaps and uncertainties in the existing social baseline in order to subsequently provide a robust socio-economic assessment that will meet international standards, guidance and best practices requirements.
The socio-economic surveys were carried out by experienced Omani surveyors, including a female from 5OES in conjunction with the lead social specialist from WSP. The local surveyors took part in a pre-survey briefing workshop in Muscat and Duqm and mobilize for survey work locally in Duqm together. The surveyors carried out the survey work via face-to-face visits with two approved questionnaires (one for households and another for fishermen - see Appendix A), where both questionnaires included questions on elements of ecosystem services and their use by local residents. Both questionnaires are based on tried and tested socio-economic questionnaires that have been used previously in Oman but also include modifications suggested by DRPIC and SEZAD to enhance the tailor-made approach for this survey effort. The English language questionnaires were translated into Arabic for delivery in the targeted areas and the outputs translated back into English for analysis. In planning the socio-economic and health surveys, consideration was given to both Duqm and the wider Duqm area by considering the range of settlements within the wider area. This included reviewing the information on receptors in previous EIA Reports. Following this review, the team carrying out the local surveys targeted the following four key areas:
Nafun village;
Al Tayari;
Representatives of smaller settlements, individual residences in the wider Duqm area ); and
The fishermen group at Antoot.
In being physically present in the area during the survey period, the surveyors were able to gather information and opinions of representatives of smaller settlements from the wider Duqm area, by engaging with, for example, women attending the Women’s Event, local teachers and school assistance, policemen from Royal Omani Police and hotel guests.

9
Duqm Refinery Project WSP
DRPIC Project No 70029220 Confidential July 2017
The previous EIA work (see References) and ESDD (Ramboll Environ, 2016) confirmed that there are no Indigenous People in Duqm and the wider Duqm area, and thus, these have been scoped out. The situation is the same for traditional nomadic bedu who are not present in the study area. There are seasonal and transient visitors, travelling to Duqm for reasons such as family connections, taking a break from a city or for fishing; these are not traditional bedu. The local surveyors checked with potential interviewees whether the timing was convenient to answer the questionnaire and if asked to come later, an alternative visit was scheduled. Care was taken to approach fishermen to try to increase the response rate among fishermen, for instance where they might not be fully registered. For the household survey, and as is typical for similar projects aligning with international standards, the planned coverage is 5-10% of the population in densely populated (often urban) areas and the survey team was aiming for up to 15% coverage. For the fishermen’s survey, the surveyors were aiming to collect approximately eight questionnaires in the Antoot area.
Figure 2-11 shows the approximate locations where the survey team conducted the socio-economic surveys. Household surveys were undertaken at Nafun, Al Tayari and in the wider Duqm Area. The survey of fishermen was undertaken in the fishermen’s area near the beach at Antoot.
Figure 2-1 Nafun, Antoot and Al Tayari locations in the Project area
The survey included a series of structured interviews with local residents and informal discussions with local families in the Project area to obtain an understanding of their socio-economic settings and assess their needs, values, livelihood strategies, and expectations about the Project. The household questionnaire used in Al Tayari, Nafun and Duqm was designed to be coded for efficient analysis of the collected data, and included questions on:

10
Duqm Refinery Project WSP
DRPIC Project No 70029220 Confidential July 2017
Demographic profile (e.g. age, gender, family structure); Occupational profile, employment and income sources and expenditure; Education (all levels); Asset ownership (including cars, household technology, etc); Health data, and Project Awareness, concerns and expectations.
The questionnaire for fishermen used in Antoot was designed to collect general information about fishing activities, average earning amounts, equipment used, information on catch and expectations from the project.
2.2 GOVERNMENT-LED RESETTLEMENT IN THE AREA
In Al-Tayari, the resettlement process affects about 100 families and the Government identified all owners and their potentially affected assets through an asset survey and satellite imagery. The survey team learned that by spring 2017 all the affected households have already received their compensation. Over 800 compensation claims by Al Tayari residents were processed for all types of affected assets including improvements on land (e.g. irrigation schemes), various structures/sheds, animal enclosures and trees/plants. In addition, the Government commissioned a new development of modern houses, located approximately 15km from the Duqm airport. The development has been known as ’150 Villas’ but also referred to as 150 Housing Units. Each affected family will receive a new replacement house (villa) each containing six bedrooms some with ensuite bathrooms. The 150 Housing Units settlement is nearly complete and soon will start to receive the Al-Tayari and Nafun families. In Nafun, around 40 families are affected by the process. To identify all affected owners and their assets, and to define the compensation amounts, a new Compensation and Evaluation Committee was formed at the end of 2016. In summer 2017, it will proceed with the collection of satellite imagery in the Nafun area. The Committee will include the Wali office, Minister of Regional Municipality and Water Resources, MoH, Oman Royal Police and SEZAD. In addition to compensation, each affected Nafun family will also be offered a replacement house in the 150 Housing Units area. The authorities hope that the resettlement process in the Al Tayari and Nafun areas will be finished by the end of 2017. More details on the resettlement process can be found in the Resettlement Statement (DRPIC Report Ref 10-CL-Tech/Res).
2.3 IMPLEMENTATION OF THE SURVEYS AND INTERVIEWS
Since the start of the resettlement process, households in the Al Tayari and Nafun areas have already been surveyed a number of times by SEZAD and other Government Ministries involved in the process. Additionally, all the previous ESIAs that have been undertaken in the Duqm area also could have contributed to survey fatigue. As a result, a comparatively high percentage of households declined to participate in the surveys (approximately 42% of households approached) for the Consolidated ESIA. General survey-fatigue among the surveyed households was a consequence of these circumstances. 85 individuals were approached by surveyors and 36 of them declined to take part in the surveys. Overall, 49 completed household questionnaires were obtained by the team which resulted in a response rate of 58%. As a separate task, eight fishermen were approached through fishermen survey but only five fishermen agreed to be interviewed.
As a result, the achieved sample represents 8% of the targeted households which, as mentioned, is believed to be due to survey fatigue, over the long-term, amongst the surveyed households.

11
Duqm Refinery Project WSP
DRPIC Project No 70029220 Confidential July 2017
The “raw” data obtained during the household survey and fishermen survey, were first checked for quality and then uploaded into an Excel spreadsheet which was later analysed.
The targeted communities in Al Tayari and Nafun were interviewed during working hours and also in the evenings, to ensure that various groups of respondents are available for the survey. Schools and governmental offices, as well as mosques were all visited in Duqm during the survey. To ensure wider gender participation and to capture the views of both men and women, the survey team also visited a number of households separately in Al Tayari and Nafun. A local women’s group was also visited in Duqm to ensure participation of women from all educational backgrounds. Literacy levels did not present an issue during the survey, as all questions were explained during the survey interviews and surveyors wrote down the respondents’ answers. To address some respondents’ sensitivity about answering personal questions (e.g. on income sources, salaries, land ownership), a short introduction about the purpose of the survey was given to all groups at the beginning of the interview. The survey team included both men and women to ensure a gender-balanced approach to the survey. During the survey of fishermen, the surveyors visited the Antoot area early in the morning and also later in the evening to ensure that fishermen were available for interviews before leaving for the sea, and also upon their return.
3 GENERAL POPULATION PROFILE
3.1 DEMOGRAPHICS AND GENDER DATA
Oman’s total population has been recorded as 3,992,893, where 57% of the population are Omanis and 43% represent overseas workers (NCSI Oman, 2015). The national gender statistics show that the total population is distributed as 35% women and 65% men. The higher proportion of men in Oman is explained by the sizeable population of foreign workers who often tend to be men within the 20-40 years age bracket. The Al Wusta Governorate is spread over 79,700 km2 and consists of four Wilayats: Hayma, Muhut, Ad Duqm and Al Jazir, with the total population in the Governorate of 40,936 people (or 1% of the total population) and a population density of only 0.5 ppl/km2. The total population in the Al Wusta Governorate is split: 54% Omanis and 46% foreign workers or expats. This illustrates a slightly higher presence of foreign workers in the Governorate compared with the average national level NCSI, 2015). The population of the Ad Duqm area shows the same trend, where the total population of 8,559 people (or 0.2% of the total population) is split: 52% Omani and 48% foreign citizens. At the national level, in 2015 over 28% of the total population in Oman was represented by the youth demographic and children who, under the national statistics, fall into the 1-19 years’ old age range. Importantly, over 57% of the total population are 20-44 year olds, where there are two foreign workers/expats for every Omani in the same age category. In Oman, only 2.4% of the total population falls within the above 65 years of age category. Comparatively, in Al Wusta, 24% of the Governorate population are 1-19 year olds (lower than the national average), over 63% are 20-44 year olds (higher than the national average), over 10% of the Governorate population are 45-64 year olds and 3.3% of people are over 65 (higher than the national average).

12
Duqm Refinery Project WSP
DRPIC Project No 70029220 Confidential July 2017
At the national level, out of a total number of individuals claiming welfare benefits in Oman, 39% claim on the basis of mental disability (dementia and other related diseases), 31.2% of social welfare payments in the country are claimed on the basis of other types of disabilities and 15% of the social welfare payments are claimed by divorcees (mainly women). In contrast, the top three social welfare payment claims in the Al Wusta Governorate are: 40.5% for mental disability (this much higher rate can be explained by Al Wusta’s slightly longer than average national life expectancy), 27% for other types of disabilities (lower than national) and 21% for divorced (much higher than the average national rate).
3.2 EDUCATION
Based on World Bank Data from 2015, the basic literacy level in Oman is recorded as close to 89%, an increase from the 2010 level of 87%. The National Census data from 2010 shows that approximately 79% of the total population finished school and approximately 10% of the total population holds a Bachelor degree or higher. At the national level, the educational status varies according to the place of residence. Based on the national data (NCSI, 2016), around 30.5% of the households residing in rural areas has at least one family member who is illiterate, while the same is true only for 13.6% households in urban areas. No government-collected data could be found on the literacy levels in Al Wusta. Desktop research on literacy levels in the region showed that although Al-Wusta has 23 basic education schools in the region (NCSI, 2015), the level of literacy is generally quite poor, when compared to the national figures. This situation was reflected in the research results carried out in 2013 in the region and published in the Asian Fisheries Society publication, “Gender in Aquaculture and Fisheries: Navigating Change”, 2014. The results of the survey which covered only women in Al Wusta, showed that with 40% of local women engaged in providing services for the fishing sector, are illiterate and a further 40% only attained preparatory, or lower level schooling. As a rule, literacy rates in coastal areas in developing nations are commonly considered to be low (Akpaniteaku et al., 2005; FAO, 2006; and Maddox, 2007).
3.3 UNEMPLOYMENT
Data from 2015 provided by the National Centre of Statistic Information of Oman showed that unemployment at national levels stood at 11.75%, a decrease from a rate of 14.4% in 2003. The ratio of Omani workers varies within the public and the private sectors. Omanis constitute 85% of the workforce in the public sector, but only 11% in the private sector. Unemployment among nationals is an issue of concern to the Government. Unemployment especially affects young males entering the labour market who have secondary level education or less according to a study by the Gulf Investment Corporation (2014). The youth (19-25) national unemployment rate was 23% in 2013. Population growth, increase in female participation rates and contraction of the traditional sectors are factors contributing to changes in the unemployment for male nationals. It must be noted that the National Centre for Statistics and Information (NCSI) does not regularly collect the data on unemployment in the country and as a result it is rather challenging to find reliable and recent national statistics on unemployment in Oman.
Instead, the NCSI regularly collects information on job seekers who are defined mainly as graduates or those who graduated recently and are in the process of seeking their first job.
According to the data released by NCSI, the governorate–wise number of job-seekers was as follows by the end of 2016 (Time of Oman, 2017): North Al Batinah (9,544), Muscat (5,359), South

13
Duqm Refinery Project WSP
DRPIC Project No 70029220 Confidential July 2017
Al Batinah (5,132), Al Dakhiliyah (5,025), Dhofar (4,521), Al Dhahirah (3,750), North Al Sharqiyah (2,994), Al Buraimi (1,684), Musandam (794) and Al Wusta (346).
3.4 ASSET OWNERSHIP
Based on the data obtained from the Final Findings of the Household Expenditure and Income Survey (2012), households in Al Wusta have the highest house ownership comparing with the rest of the country. National data indicated that 97.3% of households in the Sultanate have mobile phones and 96.5% have televisions. A majority of households (more than 80%) own at least one computer (e.g. desktop, laptop or tablet), with no noticeable difference between urban and rural areas. The Internet is mainly accessed through mobile phones (48%), followed by fixed wireless broadband (35%) and narrow band analogue modem (17%). Based on national 2015 statistics, around 60% of households do not have Internet connections, out of which 42% do not have Internet access due to lack of coverage, 32% due to high price of services, 25% due to lack of knowledge and skills, and lack of need and high cost of the equipment. Fixed telephone lines were present in 73.5% of homes across Oman at the end of 2016. At the national level, home ownership among Omani households stood at 82.2%.
3.5 INCOME
Based on 2012 national statistics (NCSI, 2013), the average monthly salary of employed individuals in the Sultanate of Oman was reported to be the following (in 2012 values):
For an Omani citizen with primary/preparatory level of education – average monthly salary of Omani Riyals (OMR) 466;
With College/Diploma level of education – average monthly salary of OMR 787; and
Bachelor and above, average monthly salary of around OMR 1,050.
The same report states that in 2012, 40% of Omani households had a monthly income of OMR 1,100 or more compared to only 16.3% of expatriate households The highest household monthly income was registered in the Muscat Governorate, while the Al Wusta Governorate had the lowest average household income in the country (2012), OMR 856, with an average expenditure level of OMR 513 in rural areas. Adjusting these figures for compound inflation in the country (2012-2017), the average household income in Al Wusta estimated by the National Statistics Centre stands at approximately OMR 1,005/month with an average expenditure level of OMR 602/month. Based on the obtained data, around 30% of the expenditure at the national level is typically spent on food, 16% on housing/rent (this percentage is lower in Al Wusta due to higher house ownership), and around 13% on transportation.
3.6 HEALTH
Based on Oman’s country profile with the World Health Organisation (WHO, 2014), non-communicable diseases (NCDs) cause 68% of total deaths in the country and 18% of these deaths occur amongst people between the ages of 30 and 70 years’ old. This means that nearly one of every five Omani adults dies from NCDs.

14
Duqm Refinery Project WSP
DRPIC Project No 70029220 Confidential July 2017
In April 2016 the United Nations Interagency Task Force on the Prevention and Control of Non-communicable Diseases (NCDs) carried out a joint mission to Oman to support the Government of Oman in their efforts to tackle NCDs. The Joint Mission learned that despite recent progress in addressing NCDs and their risk factors, the large majority of Omani adults have insufficient intake of fruits and vegetables, that 40% are physically inactive and one in seven Omani men use tobacco. More than 40% of adult Omanis have hypertension and 12% have been diagnosed with diabetes.
The 2014 national NCD data published by WHO is presented below.
Figure 3.1: National mortality rates from Non-communicable diseases (WHO, 2014)
Based on the national health research results published by the Sultan Qaboos University (2014) regarding the amount of exercise and physical activity in the country, two particular diseases – Type II diabetes and cardiovascular disease were noted as presenting major public health challenges. The health assessment results demonstrate that among adults, 33% of men and 41% of women do not regularly engage in physical exercise. The lack of physical activities is even higher among young people of college age: 43% of young men and 57.8% of young women in the Sultanate of Oman do not exercise. The national statistics data shows that there are currently three hospitals in Al Wusta which accommodate 68 beds for patients, while there is only one hospital in Duqm with eight beds. Based on the number of deaths recorded in the national hospitals (i.e. those that do not operate privately), there was only one recorded death in the Al-Wusta region in 2014, which resulted from a disease of the circulatory system. There are four private pharmacies but no dental clinics in Al Wusta. Based on the latest UNICEF Report on the health data of children and women in Oman (May 2017), Oman has seen a gradual decline in diarrhoeal diseases. The downward trends in diarrhoeal diseases indicate a better and cleaner environment for young children. The change also reflects better knowledge amongst caregivers and health service workers, all of which may be attributed to the overall socio-economic progress of the country. All these improvements have contributed to the decline in infant and under-five mortality rates. Nonetheless, the diarrhoea incidence rates in 2012-2014 were still relatively high (254 per thousand children under the age of five years). The diarrhoea rates are much higher in North Ash Sharqiyah, Al Wusta, Musandam and South Ash Sharqiyah (350-450 cases per thousand children under the age of five).

15
Duqm Refinery Project WSP
DRPIC Project No 70029220 Confidential July 2017
Based on the same UNICEF report, Oman aims to have 90% of its population connected to the water network by 2035. Oman has been experiencing in the last few years a rapid and continuous growth of water demand: an average of 15 % increase per year, as a result of its robust growth. For household use, the piped network currently reaches 57 % of occupied housing units (dwelling places or dwellings). If access to public water points is also counted, then 77 % of dwellings are served by pipes in homes or by public water points. The coverage by the piped network is lower than the national average in Al Wusta, Ash Sharqiyah, Adh Dhahirah, Ad Dakhliyah and Al Batinah; however, Al Wusta has a high proportion of households served by public water points. The Oman governorates most affected by obesity and overweight are also those most affected by stunting. For example, Al Wusta and Musandam have much higher proportions of overweight and obese children than the other governorates: 8 and 9 % respectively, compared to below 2 % for South Ash Sharqiyah, Dakhliyah, Adh Dhahirahb and South Batinah. Thus, Musandam and Al Wusta are the top two provinces in overweight and obesity amongst children as well as being amongst the three governorates with highest levels of stunting. Oman has higher rates of obesity than many OECD countries. 30 % of Omanis above age 18 are overweight and 24 % are obese, whilst amongst adults above 40 years, over one-third is overweight and another third (34 %) is obese. This is higher than the OECD average, where obese adults (not just overweight) constitute 23 % of the adult population. These obesity rates are documented in the Annual Health Reports of the Ministry of Health as well as in the World Health Survey (2012). Based on the 2014 data published by the Communicable Disease Surveillance and Control Department (MoH), the Al Wusta Governorate had the second highest rate of viral hepatitis A cases among the local population (104 cases in 2014), with the highest number of cases registered in Muhut and Duqm (CDSC Oman, 2012). On the positive side, the Al Wusta Governorate had the second lowest national level of protein energy malnutrition and anaemia among children under five years of age. The Governorate also has the second lowest national rate of divorces and crimes (Statistical Year Book, 2015).

16
Duqm Refinery Project WSP
DRPIC Project No 70029220 Confidential July 2017
4 HOUSEHOLD SURVEY RESULTS AND ANALYSIS
4.1 GENERAL
Despite Duqm’s distance from other strongholds of national economy, the region has seen significant recent growth; the population of the Al Wusta region increased from 25,499 in 2006 to 40,936 in 2014 (National Statistics, 2015), an increase of 60.5% compared to the population increase of Oman which was 54.9%. In addition, the development of the Duqm Port required moving fishermen from port area to the beach area known as Antoot. From there, they are to be moved to the New Fishing Harbour south of Port Duqm. This will affect fishermen who regularly fish and store their boats and equipment on the beach close to Antoot. Based on the site observations in March 2017, it is estimated that around 20 individual fishermen (but not households) will be affected by the move to the Fishing Harbour. Al Tayari, Nafun and Antoot settlements are located within the area being considered for study, and all three settlements as well the wider Duqm area were surveyed in April 2017 to obtain the necessary socio-economic baseline data.
4.1.1 SEZAD
The Special Economic Zone Authority at Duqm (SEZAD) was established in 2011 by the Royal Decree 119/2011 and as a financially and administratively independent entity, is responsible for development activities in Duqm. It has, for the purpose of achieving its objectives, the right to own various assets, the right to manage and dispose of such assets, to carry out business and to undertake all necessary acts to achieve its objectives, and to commence necessary activities to achieve such objectives. As a result, SEZAD has legal powers and rights to initiate the land acquisition and expropriation process in the special economic area. It is currently implementing the resettlement process on Al Tayari and Nafun (also known as Nufoon) on behalf of the Government.
4.1.2 ADMINISTRATIVE SETTING
Al Wusta is one of the governorates of Oman, with Haima being its capital The main wilayats (or Provinces) of the Governorate include:
Haima – the centre of the Al Wusta Governorate and a commercial centre. It is located on the highway connecting Muscat with Salalah.
Al Duqm (also known as Wadi Say) – the Second regional centre of the Governorate and is the coastal centre of the Governorate.
Mahut – the second most populous wilayat in the Governorate; and
Al Jazur – the smallest of the four wilayats in the Governorate.

17
Duqm Refinery Project WSP
DRPIC Project No 70029220 Confidential July 2017
Figure 4.1: Location of four wilayats in the Al Wusta region
The Al Wusta communities are slowly adjusting to the changes in the region as a result of the on-going development of SEZAD and the corresponding changes from a traditional to faster-paced contemporary way of life associated with industrial and infrastructure development.
4.2 DEMOGRAPHIC PROFILE OF RESPONDENTS
Both women and men were encouraged to participate in the household survey which resulted in 69.4% of men and 22.4 % of women answering the questionnaire, whilst 8.2% of respondents chose not to disclose their gender. Of the respondents, over 41% were living in the Duqm area, just over 32% in Nafun to the north and 26% in Al Tayari to the south. Of the respondents, 43% were 21-35 years of age, 20% were 36-45 year olds, 20.2% were 46-55 year olds and 10.2% were 56-75. Under 7% chose not to disclose their age. Around three quarters of all respondents were noted as being in their mid-20s to mid-50s (see Figure 3 below). 6% of respondents reported that a woman or widow was the head of the household.
Figure 4.2: Demographic profile of respondents (years of age)
Demographics of Respondents
21-35
36-55
56-75
Not Disclosed

18
Duqm Refinery Project WSP
DRPIC Project No 70029220 Confidential July 2017
4.3 EDUCATION
The educational profile of the respondents revealed that 18.4% had not finished their basic schooling or had no education which is higher than the national average of 11%. Further survey results showed that 32.7% reported to have up to high school level education and 20.4% as having a diploma as their highest education level; there were no respondents reporting having a Bachelor’s degree, which contrast to the 10% of the national population reported to have such a qualification.
Figure 4.3: Reported educational level among respondents
The majority of respondents within the 56-75 age group reported having had no form of education (80%). However, those in the 21-35 year age bracket had either a high school education (52.4%) or diploma (19%), with nearly a quarter of 21-35 year old respondents choosing not to provide a response (23.8%). Such relatively high number of young people declining to reveal their education attainment is relatively unusual and created a feeling among the survey team that the real level of illiteracy or low levels of educational attainment could be even higher than the one reported by respondents.
4.4 EMPLOYMENT
Of those surveyed, 53.1% declared their employment status and of these 11.5% were unemployed; a rate which reflects the national level of unemployment. Of those who were currently employed, the average salary was 1,061.30 OMR with the highest salary being 6,000 OMR and the lowest being 250 OMR/month. In addition to formal employment/occupation, the interviewees reported the following top five methods to supplement their income:
Camels and goats (selling and racing of);
Renting property;
Fishing related activities;
Social security benefits, and
Financial help from family.
4.5 ASSET OWNERSHIP
The recent increase in population and the push for economic development in the Region may have increased the opportunities for investment in residential developments and commercial properties, as opposed to buying agricultural land. All of the surveyed respondents are currently living in the houses that belong to them (owner-occupiers), whilst 50% owned camels and 89% owned goats,
Education Level of Respondents
None
Primary
High School
Diploma
Not Disclosed

19
Duqm Refinery Project WSP
DRPIC Project No 70029220 Confidential July 2017
which demonstrates how important animal husbandry is for supplementary income in the survey area. Over 76% of respondents have no access to the internet in their homes and over 91% of respondents confirmed that they have no landline telephone in their homes. This is a comparatively higher rate of homes not connected to a fixed landline in contrast to the national average rate. However, over 95% of respondents confirmed that they owned a mobile phone, whilst 93.5% had a television and almost 64% had a satellite dish which allows them to watch a much wider number of channels, both national ones and also those from the Gulf Cooperation Council (GCC) countries. Car ownership amongst the surveyed households stood at 87%, which is slightly lower than the national car ownership level amongst Omani households (89.6%) but nearly twice the registered car ownership among expat households in Oman (44.1%). The survey asked respondents to list any areas of cultural heritage within the area. Exactly half the respondents stated that there were areas of cultural significance located nearby, whilst half stated that there were not. Areas of cultural heritage reported included the well-known Rock Garden and old houses built of clay; the distance of these areas from the surveyed households ranged from 3km to 20km. Respondents were also asked the distance to the nearest cemetery from their home, this ranged from 1km to 13km, with an average of 3.1km.
4.6 HOUSEHOLD INCOME AND EXPENDITURES
In this section of the survey only 34 people chose to respond to questions relating to their household income and expenses (69% response rate); this is typically a difficult question which people often find challenging to discuss and therefore may choose to opt out of answering. Of the respondents who agreed to provide details of their income, 23.5% declared that their salaries is the only type of regular income, over 44% of respondents reported to supplement their regular salaries with alternative income-generating activities, whilst 32.4% regularly receive their income solely from ‘alternative’ activities. It is highly unlikely that nearly a third of respondents who agreed to discuss their income with the survey team, actively chose to forgo employment as their main source of income. Instead, the general feeling among the survey team was that this group of people might find it difficult to find permanent employment due to a lack of education/skills or job opportunities in the area.
Figure 4.4: Details on income types
The following alternative forms of income (separate from occupational/salaried employment) were reported by the respondents who regularly source their income from one or more of these activities, as detailed in Table 4.1 below.
Percentage of households supported by each income type
Alternative Forms ofIncome
Occupational Income
Both Alternative andOccupational Income

20
Duqm Refinery Project WSP
DRPIC Project No 70029220 Confidential July 2017
Table 4.1: Details on Alternative Sources of Income
ALTERNATIVE SOURCE OF INCOME HOUSEHOLDS RECEIVING INCOME FROM THESE ACTIVITIES
Agriculture/Collecting Medicinal Plants/Herbs 0
Camels & Goats 29.4%
Renting assets/property 38.2%
Fishing 8.8%
Social Security Benefits1 32.4%
Financial support from family 2.9%
Inheritance/scholarships 5.9%
NB: please note that some households derive income from more than one “alternative” activity From the obtained information, the top three most popular income supplementing activities (or in cases, alternative ways to earn a living) in the study area are: (a) renting assets/property, (b) social security benefits and (c) selling racing camels and raising goats. With only over 10% of respondents being in the 56-75 age group eligible to receive state pension, and one of the lowest birth rate in the country2, this data could indicate that a third of respondents who receive social benefits would fall under the definition of “vulnerable” group”, which typically include widows/widowers, elderly, disabled, orphans, etc. For those who agreed to discuss their income with the surveyors, the average revealed household income obtained from all types of income-generating activities totalled 1,967 OMR/month, which is much higher than the average estimated 1,005 OMR/month income in Al Wusta as per the official National Household Income data. This higher than average (total) household income among the interviewees does not seem to match the lower than average national education level among the same group of people. The WSP team has the following explanations for this disparity. Based on the information received from the respondents during the survey (and verified by the number of observed animal enclosures located close to the surveyed properties), the team learned that raising camels and renting property is a lucrative business among local communities, where for example, a well raised and groomed camel can be sold for a very high price. In this situation, the proceeds of the sale can often provide ten to 12 months’ income for an average local household. This type of business activity does not require any educational attainment and yet can provide significant and relatively regular annual income. Approximately 80% of respondents were willing to answer questions relating to their expenditure. Of these respondents approximately 72% confirmed that food was the item they primarily spent most of their money on, which was expected to be the most popular answer. The respondents were asked to state how much they spend on their main expenditure; the average amount across the respondents was just over 644 OMR. The next most important expenditures for the respondents appeared to be ‘other’, an answer given by over 23% of respondents, ‘services’ which was given by 5% of respondents and ‘health’ which was noted by just one respondent.
1 Social welfare system in Oman provides benefits to orphans, the disabled, widows/widowers, divorced women, unmarried girls, the elderly/pensioners and prisoner’s families. 2 Al Wusta Governorate: 1.8% of total births in the country for the last 12 months, Times of Oman, 2016

21
Duqm Refinery Project WSP
DRPIC Project No 70029220 Confidential July 2017
4.7 HEALTH SITUATION
It was reported that just over 20% of the households support a family member who had a disability or illness, whilst over 60% reported having no illness or disability and 16% chose not to answer. The respondents listed the following top three diseases to have affected members of their household in the past three years: diabetes, hepatitis and asthma. The survey asked questions regarding recent deaths in families and their causes. Over 64% of the respondents stated that there had been no deaths in the past year whilst almost 35% reported that there had been one death in the household; these were reported to be mainly due to illness and old age.
4.8 PROJECT EXPECTATIONS
All respondents were aware about the Project, of which most of them have primarily learnt about through newspaper articles, but around a third had learned about the Refinery through friends and family (or their connection with the Omani Woman Association supported by DRPIC’s Corporate Social Responsibility (CSR) activities), as well as colleagues or classmates and the television. Around 80% of the respondents had a positive attitude towards the Project and just over 14% had a neutral opinion of it. The positive opinions were largely reported to be due to expectations related to an increase in the number of available jobs for young Omanis as well as the Project to contribute to the development of a kindergarten or a school, or a new hospital in the Duqm area. Only 6% of respondents reported expecting some negative impacts from the Project; these included worries about air quality, concerns over traffic accidents and an increase in the number of foreign manual labourers to the area. It is interesting to note that none of the respondents expressed concerns related to fishing-related or other income-generating activities potentially being interrupted by the Project.
5 FISHERMEN SURVEY RESULTS AND ANALYSIS
5.1 GENERAL
In addition to the household survey in Nafun, Al Tayari and Duqm, five fishermen from the area were surveyed regarding their use and ownership of boats, the cost of fishing activities, information relating to catches and their opinion of the impact that the Project may have on their trade. The fishermen interviewed were from the following local settlements: Antoot, Antoot-Saai, and Al Shuayr. The fisheries sector still accounts for only a small share of GDP. Government revenues from the fishery sector are minimal and reported to be US$2.4 million per annum. In contrast, current government expenditures on fisheries for infrastructure, monitoring and other services are estimated to be on the order of 50% of gross ex-vessel revenues (World Bank Group, 2015). The volume of fish exports has also been steadily increasing over the past ten years—ranging from 62 million (M) tonnes (t) in 2002 to 132Mt in 2014. In 2011, half of exports were to the United Arab Emirates, where there is strong demand for seafood. The current growth of fish exports is mainly

22
Duqm Refinery Project WSP
DRPIC Project No 70029220 Confidential July 2017
from artisanal fishing, a sub-sector that has remained important, post-development of the Port/Dry Dock. Based on the World Bank assessment, despite a plethora of new ports, fishermen still prefer to land their catch on beaches in proximity to where they live and make their own arrangements for the sale of fish which limits opportunity for quality improvement and value addition and often results in over-fishing. Based on discussions with stakeholders and fishermen in 2014, the World Bank specialists concluded that fishermen in Oman tend to perceive the new fishing facilities tend to be more suitable for commercial boats, and often lack a cluster of services that would attract the artisanal sector. The same stakeholder consultations session for the World Bank study revealed that the pool of Omanis living in coastal areas and who traditionally provided the core of the small-scale inshore fishing sector, has shrunk dramatically in recent years, and this decline is expected to continue. Although detailed employment data is lacking, one clear fact is that fewer young Omanis wish to enter the traditional skiff sector as full-time fishermen. This is not surprising when remuneration for boat crew can be as low as 200 to 300 OMR per month (based on the WB 2015 data). While some may be prepared to engage in part-time fishing, perhaps supporting family traditions, many Omanis living in the coastal area are pursuing alternative employment opportunities and have aspirations for a lifestyle with greater economic reward.
5.2 FISHERMEN SURVEY AND APPROACH
Of surveyed fishermen, three boats were owned, with one fisherman owning a dhow (a traditional Arabic sailing vessel) in addition to his boats and one managing several other boats as well as owning his own. Most of the surveyed fishermen reported sharing ownership of their boats with other fishermen while just over a third stated that they or their family owned the boats. In terms of funding their boat purchases most of them took out a loan, one fisherman used family savings and another one used personal savings. All interviewed fishermen send their boats into the sea with predominantly expatriate labour. All the boats owned were reported to be made of fibreglass and the fishermen all reported using fishing nets, with some also using long lines and hand lines in addition to the nets. Each of the respondents stated that they tend to fish or go onto the sea every day, with a few noting that this would always be subject to weather conditions. The costs to run the boats varied significantly between fishermen with fuel costs per boat, ranging from 25 OMR to 100 OMR/day. The cost of ice used to preserve the fish once caught was reported to range from 13 to 400 OMR, with an average of 143 OMR. The fishermen were asked several questions regarding the maintenance of the boats which showed that the cost of spare parts and repairs could reach up to 500 OMR, the cost of ropes and nets ranges from 50 OMR/month to 500 OMR/season whilst additional costs can include expat visas for workers/seasonal fishermen hired to help during high fishing season (140 OMR each) or may be paid for by the boat owner instead. All of the respondents confirmed that they are not a member of a local Fishermen Association or Cooperative. The fishing season for lobster for example lasts two months (March and April), and also two months for shrimp fishing (September and October). The second section of the survey questioned fishermen on their catches. When asked how far they travelled to fish, 100% of the respondents confirmed that this very much depended on the weather and the sea conditions. Those who fish in boats noted that they would generally go out to sea between 05.00 and 08.00 hours and return between 17.00 and 18.00 hours; the respondent who also reported using a dhow, stated that when using this vessel he would take it out at 17.00 hours and return the next morning around 08.00.

23
Duqm Refinery Project WSP
DRPIC Project No 70029220 Confidential July 2017
The fishermen were asked which species of fish they catch; the most common include: Spotted grunt, Sardines, Hilsa, Lobster, Shrimps, Mackerel, Catfish and Cuttlefish. All of the fishermen reported sardines as being one of their most frequent catches with the weight of sardine catches ranging from 2,000kg to 10,000kg /month with a reported value of 5 OMR/kg. The average catch weighs 3,083kg and catches ranged from 20kg to 20,000kg depending on the catch and species.
Figure 4.5: Main catch of fishermen by species details
All of the fishermen confirmed that their catches are not consumed solely by their families, but instead they also provide a form of income. The amount of gross income from fishing activities alone ranged from 200 to 700 OMR per month, with an average gross monthly income among interviewed fishermen of 380 OMR/month. The survey showed that most of the surveyed fishermen had no other means of income in addition to fishing, whilst two of them also earn a salary as well as their fishing income. All of the fishermen reported that they have an agreement with a local fish trader registered in Duqm. The fishermen were asked their opinion about the state of fishing resources over the past five years. They unanimously agreed that the productivity of fish in the area had decreased and that the amount they were catching per trip had also decreased. In terms of fish resource diversity the opinions were split, with the majority believing they had decreased and two of them stating that they were stable. Similarly, based on their observations of general pollution in the sea, most were of the opinion that pollution of the sea had increased. The final section of the fishermen survey asked about attitudes to the Project. All of the fishermen reported to be aware of the Project and all had heard about the Project through friends, although some had also heard about it through their offices and the media. All interviewed fishermen had a negative opinion of the Project, although a couple of them noted the likelihood of job opportunities resulting from the general development in Duqm. The main concerns across the fishermen stemmed from a lack of areas to fish in and to land their boats at, particularly as the new Fishery Harbour is not ready.
Spotted Grunt13%
Sardine33%Hilsa
20%Lobster
6%
Shrimps7%
Cuttlefish7%
Mackerel7%
Catfish7%
Species of fish caught most frequently
Spotted Grunt
Sardine
Hilsa
Lobster
Shrimps
Cuttlefish
Mackerel

24
Duqm Refinery Project WSP
DRPIC Project No 70029220 Confidential July 2017
6 CONCLUSIONS
It is clear that the ongoing surveys in the area, particularly in Nafun and Al Tayari, may be affecting the local people’s willingness to engage fully in the survey and resulted in a lower than expected response for the household survey . Two thirds of those who agreed to be interviewed were men and one third of respondents were women. A significant proportion of the respondents were aged in their twenties to early fifties, highlighting that the area has a proportionally high number of people at working age. This may explain why there is a largely positive attitude (85%) towards the Project among the surveyed households, with high project expectations for increased numbers of jobs, improved infrastructure and a new hospital. It is interesting to note that nearly 20% of all respondents had no or unfinished education. However, because 24% of respondents refused to provide their education details, the real number of local people with no or low level of attainment could be much higher than stated. Over 80% of respondents over 56 years old admitted that they had no education. This current low level of education among interviewees does not necessarily translate into low levels of income for each of the surveyed households. This is largely because the traditional income generating activities (fishing and cattle raising and selling) allow local families to generate income without requiring any form of formal education. High levels of cattle ownership and renting property for supplementing income (including renting houses and fishing boats) among interviewees indeed support this conclusion. A variety of illnesses were reported amongst the households, with high levels of hepatitis A and also diabetes and asthma noted to have impacted members of the surveyed households in the last three years. The birth rates are quite low in the project area however there is relatively high reliance on social welfare payments among the households covered by the survey. This corresponds with the fact that every fifth respondents reported to have at least one member of their family with a serious health condition/disease. Of the surveyed households, 6% are led by widows or divorced women. Attitudes towards the Project amongst the fishermen were largely negative as they believe it will directly affect their fishing and therefore their income, although the possibility of new jobs from the Project was also noted in the fishermen surveys. Overall, the average monthly income reported by the surveyed fishermen is in line with the average national monthly income. It is interesting to note that most of the surveyed fishermen confirmed that the fishing productivity and catch sizes are decreasing. As such, both the local fishermen’s livelihood and food supply might not be sustainable. Across both the main survey and the fishermen surveys the overwhelming majority of the respondents were aware of the Project, highlighting that there has been good coverage and resulting awareness of the proposed Project in the area so far. Camel and goat rearing is an essential livelihood activity which can have a large influence over local households’ incomes, and the lack of animal enclosures at the 150 Housing Units settlement could delay the Nafun and Al Tayari families moving into their new homes. Importantly, the survey provided a valuable insight into socio-economic profile of local residents and also their project-related concerns and expectations. As mentioned in Section 4.8, the minority of the surveyed households (6%) are concerned about air emissions and pollution that will be generated by the project, as well as workers influx. At the same time 80% of respondents have

25
Duqm Refinery Project WSP
DRPIC Project No 70029220 Confidential July 2017
positive attitude towards the project and expect it to generate new jobs,and contribute to the development of a kindergarten or a school, or a new hospital in the Duqm area. These four main social “themes” will be incorporated into the Social Management Plan, to be monitored by DRPIC throughout the project life-cycle and reported to the Lenders.
7 REFERENCES Akpaniteaku, R.C., M. Weimin and Y. Xinhua (2005): Evaluation of the contribution of fisheries
and aquaculture to food security in developing countries. NAGA 28:28-32. Maddox, B. (2007): Literacy in fishing communities. FAO/SFLP/DFID. 20 pp. 2. Asian Fisheries Society (2014): Gender in Aquaculture and Fisheries: Navigating Change. AFS. Communicable Disease Surveillance & Control, Oman (2012):
http://www.cdscoman.org/uploads/cdscoman/WilayatWise2012.pdf Five Oceans LLC (2011, June), Duqm Industrial and Free Zone Masterplan – Environmental
Impact Assessment (EIA). Final EIA Report Rev 02 for Jurong Consultants Pte Ltd (Oman branch), Muscat, Oman.
FAO (2006) data, Oman. Fleitmann, D. & Matter, A. 2009. The speleothem record of climate variability in Southern Arabia.
Comptes Rendus Geoscience 341: 633-642. HMR Consultants (2014, Dec.), Duqm Refinery Environmental Impact Assessment (EIA) Study
Report. DRPIC Document No.: DRP001-EIA-RPT-Z-000-001. HMR Document No.: 3514-EIA-01. HMR, Muscat, Oman.
HMR Consultants (2014, Dec.), Environmental Impact Assessment (EIA) Study Report for Duqm
Refinery Construction Camp. Document No.: 3514-EIA-02. HMR #3514. HMR, Muscat, Oman.
NCSI – National Centre for Statistics and Information, Oman (2013): The Final Findings of the
National Household Expenditure and Income survey NCSI - National Centre for Statistics and Information, Oman (2015): National Statistical Year
Book 2015. NCSI, Oman. NCSI - National Centre for Statistics and Information, Oman (2016): Data and statistics: National
Statistical Year Book 2016. NCSI, Oman. Sultan Qaboos University (2014) National Strategy for Promoting Physical Activity in Oman. Medical Journal Times of Oman, newspaper (2016, 25 September), article. Times of Oman (2017, 15 January), article

26
Duqm Refinery Project WSP
DRPIC Project No 70029220 Confidential July 2017
World Bank Group (2015): National Statistics for Oman. http://data.worldbank.org/indicator/SE.ADT.LITR.ZS
World Bank Group (2015): Sustainable Management of the Fisheries Sector in Oman WorleyParsons Oman Engineering LLC (2015, 22 Sep.), Duqm Liquid Bulk Berths Project,
Environmental Impact Assessment Report. Document No.: SEZAD-DPTC-00-WP-EV-REP-3001-B2. WP, Muscat, Oman.

Appendix A
SOCIO-ECONOMIC SURVEY QUESTIONNAIRES

APPENDIX A-1 SOCIO-ECONOMIC HOUSEHOLD
QUESTIONNAIRE

Date: ___________________; Time:____________________; Name(s) of surveyor:__________________________
Page 1 of 2
SECTION 1: General Details
1. Address of the surveyed Household (HH)/Settlement: ____________________________________________
2. Full name of the head of the HH: ___________________________ 3. HH Composition: questions below_
1 (Head of HH) 2nd
member 3rd
member 4th
member 5th
member
Relationship to HH Head - See codes below
N/A
Age
Gender (M/F)
Primary occupation See codes below
Educational level See codes below
How long have you been living here
Relationship to Household Head: 1: Spouse 2: Son or Daughter 3: Father or Mother 4: Brother or Sister 5:Other Primary Occupation: 1. Farmer 2. Pensioner 3. Unemployed 4. Civil Servant 5. Business/Trade) 6. Other Educational Level: 1. Primary 2. Secondary 3. Technical Diploma 4. Higher (univ./institute) 5. None (primary not completed)
4. Does your HH own one or several of the following items (Yes=1, No=0) 5. What is your most important item of expenditures? ____________________________________________________
1. Food 2. Housing 3. Schooling or university expenses 4. Utilities 5. Health 6. Business Expenditures 7.Other 6. How much on average do you spend monthly on these items (in Omani Rial/OR)? _______________________________________________________________________________________________ 7. What is the main source of fresh water for your HH? 1. Water from the lorry that regularly brings water, 2. Freshwater lense nearby, 3. Water well, 4.Other _______________________________________________________________________________________________ 8. How much do you pay monthly for water and wastewater?____________________________________________
SECTION 2: House Ownership 9. Houses or Structures
Location (Village)
Construction type: Permanent /immovable structure (P)
Not Permanent) (NP)
Ownership Status: (Owner/ Co-Owner/Tenant)
Condition
P NP O CO T/COT
P NP O CO T/COT
SECTION 3: Income Sources 10. Income details, estimates
Item Description In Omani Rial, 2017 (could be an estimate, also put 0 if the answer is No to certain categories)
Income from Household Activities
Agriculture/ Farming (if applicable) or collecting any ecosystem services goods (e.g. honey, herbs)
Income from raising and selling cattle (eg Camels or Goats, if applicable – also includes camel racing)
Colour TV Satellite Dish Telephone Mobile phone Internet Radio
Personal computer Washing machine Refrigerator Goat Car Camel

Date: ___________________; Time:____________________; Name(s) of surveyor:__________________________
Page 2 of 2
Item Description In Omani Rial, 2017 (could be an estimate, also put 0 if the answer is No to certain categories)
Income from fishing – if a member of this HH is engaged in small-scale (non-licensed) fishing
Property Income
Rent received from rented property (land, housing)
Benefits
Social security benefits/benefits received by the family from the State
Remittances and assistance received from other family members
Other (inheritance, alimony, scholarships, etc)
Employment
Formal employment income (indicate type of work)
TOTAL
SECTION 4: Health 11. Are there disabled or chronically ill people in the household? YES NO 12. If YES: - Type of disability/illness: _____________________________________________________ 13. Number of births & deaths over the last 12 months in the household:
- Births: - Deaths: Cause: _________________________________________
14. What are the most common diseases that affect the family (last 3 years)?
- ________________________________________________________ - _________________________________________________________________________
15. Is this a household where a woman is a head of the Household (widow, etc?) YES NO
SECTION 5: Expectations and Concerns about the Project 16. Attitude towards the Project:
16.1 Are you aware of the proposed Duqm Refinery Project? Yes -1, No -0 16.2 If Yes, Source of information, how did you find out about it_________________________________ 16.3 What is your opinion about the project? Positive -0, Negative – 1, Neutral-2 16.4 If positive, what positive impacts do you expect from it? ___________________________________ 16.5 If negative, what negative impacts do you expect from it? ___________________________________
SECTION 6: Cultural Heritage 17. Are you aware about the following:
17.1 Any cultural heritage or archaeological places of significance within your area? Yes -1, No -0 17.2 If Yes, please name them ______________________________________________________________ 17.3 (if Yes in 16.1), Estimated distance to this place (in km) or name the settlement where they are located_________________________________________________________________________________ 17.4 Where is the nearest cemetery from here (estimated distance in km)____________________________

APPENDIX A-2 QUESTIONNAIRE USED FOR SURVEY OF
FISHERMEN

Date: ___________________; Time:____________________; Name(s) of surveyor:_______________________
Fishermen Survey for the Duqm Refinery Project, Oman
SECTION 1: General Data and Fishing Equipment Information
1. Settlement /Location of the interview: ______________________________________________ 2. Full name of the interviewed fisherman (could be anonymous)___________________________ 3. How many boats do you personally own?__________________________________________ 4. For the boat that you use, what is the type of this main boat:__________________________ (1.wooden, 2.fiberglass, 3. other)
5. Do you own this boat yourself or do you share it with others:__________________________ (1.share it with others, 2.it belongs to me/my family only, 3.owned by someone else)
6. If you paid for the boat yourself, what was the source of funds to pay for the boat:_________ (1. family savings, 2. loan, 3. personal savings, etc) 7. Types of fishing gear you most often use to catch fish:_______________________________ (1.net, 2.fishing rods, 3.both, 4.other gear) 8. Number of people/crew on the boat that you use:____________________________________ 9. How often do you fish/go onto the sea?_____________________________________________ (1.daily, 2.every second day, 3.every 2 days, 4.weekly) 10. Fuel/Oil for the main boat (if used), cost:__________________________________________ 11. Food, cost: __________________________________________________________________ 12. Ice for fish (if used), cost:_______________________________________________________ 13. Boat repair and maintenance details (if it is you who pays for it): a. Spare parts/Repairs, cost:________________________________________________________ b. Net and ropes, cost:_____________________________________________________________ c. Other consumables, cost: ________________________________________________________ 14. Do you belong to any local Fishermen Association/Cooperative:____________(1. YES, 2. NO)
SECTION 2: Catch Information
15. Fishing Territory, how far do you go in your main boat to fish in the sea: ________________ (estimate: 1.minimum 2 km, 2.over 5 km, 3.it depends on the season and sea) 16. Time to go into the sea:______________________ Time to return: _____________________ 17. MONTHLY. Main types of fish that you catch most often:_____________________________
a. Fish/species:_______________ Wt/kg: ________ Value/OR:_____________
b. Fish/species:_________________ Wt/kg: ________ Value/OR:_____________

Date: ___________________; Time:____________________; Name(s) of surveyor:_______________________
c. Fish/species:_________________ Wt/kg: ________ Value/OR:_____________
d. Fish/species:_______________ Wt/kg: ________ Value/OR:____________ 18. Typically, all of my catch is eaten by my family/myself: __________________(1. Yes, 2. No) 19. Estimated monthly average Income (resulting from fishing activities only):______________ 20. I have other sources of income when I do not fish, estimate:___________________________ 21. Do you have any agreement or a contract with a local fish trader:____________(1. Yes, 2. No) 22. What is your opinion about fish resources during the last five years:
a) Productivity of fish: 1.Increase 2.Decrease 3.Stable 4.No idea b) Amount of catch per effort/boat trip: 1.Increase 2.Decrease 3.Stable 4.No idea
c) Diversity of fish resources: 1.Increase 2.Decrease 3.Stable 4.No idea
d) Lagoon and sea water pollution: 1.Increase 2.Decrease 3.Stable 4.No idea
SECTION 3: Expectations and Concerns about the Project
23. Attitude towards the Project: a. Are you aware of the proposed Duqm Refinery Project?______________________1. Yes, 2. No b. If Yes, Source of information, how did you find out about it____________________________ (1. Friends, 2. Consultations with Duqm Refinery, 3. Someone mentioned it) c. What is your opinion about the project? (1. Positive, 2. Negative, 3. Neutral)
d. If positive, what positive impacts do you expect from it? ____________________________ e. If negative, what negative impacts do you expect from it? ___________________________

Appendix F
APPENDICES FOR SECTION 9 – CULTURAL HERITAGE

APPENDIX F-1
APPENDIX 9.1: CULTURAL HERITAGE BASELINE AND SURVEY REPORT

REPORT NO 70029220-102-BS01
ENVIRONMENTAL BASELINE: CULTURAL HERITAGE DUQM REFINERY PROJECT, OMAN
CONSOLIDATED ENVIRONMENTAL AND SOCIAL IMPACT ASSESSMENT (ESIA)
CONFIDENTIAL JULY 2017

Draft Confidential Project no: 70029220 Date: July 2017
WSP 6 Devonshire Square London, EC2M 4YE Tel: +44 (0)20 7337 1700 www.wsp.com
ENVIRONMENTAL BASELINE: CULTURAL HERITAGE
DUQM REFINERY PROJECT, OMAN
Duqm Refinery & Petrochemical Industries Company

Q U A L I T Y M A N A G E M E N T
ISSUE/REVISION FIRST ISSUE REVISION 1 REVISION 2 REVISION 3
Remarks DRAFT FINAL
Date 21/06/17 30/06/17
Project number 70029220 70029220
File reference Project drive Project drive

iii
Duqm Refinery Project WSP
DRPIC Project No 70029220 Confidential June 2017
TABLE OF CONTENTS 1 INTRODUCTION ...........................................................................2
1.1 BACKGROUND .............................................................................................. 2
1.2 PREVIOUS BASELINE WORK ....................................................................... 2
1.3 SCOPE OF REPORT ...................................................................................... 2
1.4 PROJECT OVERVIEW ................................................................................... 2
2 STUDY BACKGROUND ...............................................................4
2.1 PREVIOUS ARCHAEOLOGICAL RESEARCH IN THE HUQF ........................ 4
2.2 EXISTING BASELINE INFORMATION ........................................................... 6
2.3 GENERAL SIGNIFICANCE........................................................................... 13
3 METHODOLOGY ........................................................................14
3.1 GUIDANCE ................................................................................................... 14
3.2 PROCEDURE ............................................................................................... 14
4 NEW ARCHAEOLOGICAL SITES .............................................15
4.1 SURVEY RESULTS ...................................................................................... 15
5 GEOLOGICAL SITES .................................................................17
6 MITIGATION STRATEGIES .......................................................18
7 REFERENCES............................................................................22
T A B L E S
TABLE 1-1: DUQM REFINERY PROJECT ......................................................................2
TABLE 2-1: ARCHAEOLOGICAL SITES MAPPED BY THE COPS PROJECT (2008-2009) .............................................................................................8
TABLE 4-1: ARCHAEOLOGICAL SITES, LOCATION, DESCRIPTION, AND MITIGATION RANK...................................................................... 15
TABLE 5-1: LOCATIONS OF GEOLOGICAL INTEREST............................................... 17

iv
Duqm Refinery Project WSP
DRPIC Project No 70029220 Confidential June 2017
TABLE 6-1: SITE ID, INCLUDING RANK AND PROPOSED MITIGATION STRATEGY . 20
F I G U R E S
FIGURE 2-1: MAP ILLUSTRATION OF CONCERNED AREA INCLUDING AL HUQF AND GUNAIM ................................................................................5
FIGURE 2-22: DUQM SIGNIFICANT HERITAGE ASSETS .............................................7
FIGURE 2-33: DUQM SIGNIFICANT HERITAGE ASSETS WITHIN 5 KM BUFFER ZONES ..........................................................................................8
A P P E N D I C E S
A P P E N D I X A ARCHAEOLOGICAL AND GEOLOGICAL FINDSPOTS DOCUMENTED DURING SURVEY
A P P E N D I X B ARCHAEOLOGICAL SITE CALATOUGUE
A P P E N D I X C SITE SURVEY PLATES

1
Duqm Refinery Project WSP DRPIC Project No 70029220 Confidential June 2017

2
Duqm Refinery Project WSP DRPIC Project No 70029220
Confidential June 2017
1 INTRODUCTION
1.1 BACKGROUND
This report presents the methodology and results of an environmental baseline cultural heritage survey carried out around the geographic area of the Duqm Refinery Project, specifically along the pipeline right of way and DRPIC Ras Markaz site as these areas were previously unsurveyed. .
1.2 PREVIOUS BASELINE WORK
The initial archaeological assessment of southern Huqf was conducted by the Central Oman Palaeolithic Survey (COPS) project, directed by Dr. Reto Jagher (University of Basel). COPS overlaps, in part, with the Duqm Industrial Development Zone (IDZ), where Jagher mapped sixteen archaeological findspots in the southern part of the zone. To assess the rest of the IDZ, Five Oceans Environmental Services was commissioned to undertake a comprehensive survey of the area, carried out by David Insall from May 17th-21st, 2010, with a second visit July 28th-30th, 2010 (5OES #3046). The survey identified 182 heritage sites within the IDZ (Figure 2-2). These included cemeteries, enclosures, lithic scatters, graves, shell middens, temporary mosques, potsherds, structures, triliths, and isolated graves (Table 1). In addition, field survey was undertaken conducted by Dr. Yamandú Hilbert from 23/04/2017 to 27/04/2017 along the underground pipeline route and is referenced in this report. The results of this survey have been compiled into the Duqm Gazetteer.
1.3 SCOPE OF REPORT
The following report summarises all of the archaeological findings from field surveys undertaken for or reported in EIA documents pertaining to the IDZ. These surveys were conducted to evaluate the impact on Oman's archaeological heritage and locations of geological significance by infrastructure components to be developed as part of the Duqm Refinery Project in the Wilayat of Ad Duqm, within the Central Oman region (Section 1.4 and Section 7).
1.4 PROJECT OVERVIEW
The Duqm Refinery Project comprises the Refinery itself and its Off-site Facilities (i.e. the “Funded Project”). The components of the Project are described in Table 1-1 below.
Table 1-1: Duqm Refinery Project
PROJECT COMPONENT DESCRIPTION
Duqm Refinery
A 230,000 BDP complex refinery on a plot of 9km2 area to the north of the main industrial area within the Duqm Special Economic Zone. Includes:
Site clearance and levelling (completed in late 2016)
Product pipelines and service lines to the Duqm Export Terminal
Construction accommodation/workers’ camps
Laydown areas
Off-site Facilities
i. Crude storage facility at the Ras Markaz (RM) Crude Oil Terminal: eight tanks located within, and part of the wider Tank Farm, approx. 80km from the Refinery. The large-scale Tank Farm (Oman Oil Tank Terminal Company, OTTCO) in its entirety is not part of the Project.
ii. ‘DRPIC Crude Pipeline’: 28-inch diameter 80km crude oil import pipeline to transport crude oil from RM to Duqm Refinery.

3
Duqm Refinery Project WSP DRPIC Project No 70029220
Confidential June 2017
PROJECT COMPONENT DESCRIPTION
iii. Product ‘Export Terminal’: on the lee breakwater of Port of Duqm, immediately to the south-east of the Refinery plot. Topside works only, i.e., to establish storage for products and export handling facilities. For marine works, see Associated Facilities below.
Associated Facilities
i. Natural gas spur line/metering station used to supply gas feedstock to DR from the national gas network (Oman gas Company, OGC)
ii. Export pipeline corridor – Construction of the corridor and infrastructure (pipe supports, bridges, fencing drainage, etc, including pipeline and services themselves under the refinery) (SEZAD / Marafiq). Note: SEZAD SEZAD have overall responsibility for the Pipeline Corridor, excluding the DR pipelines and cables, extending from the Refinery Boundary Marker fenceline to the Port fenceline.
iii. The marine scope including dredging and reclamation and jetty and quay wall construction of the Duqm Export Terminal. (SEZAD).
iv. Haul road or dedicated lane (on Existing Road) for solid product from DR to Duqm Export Terminal. (SEZAD).
v. Duqm Integrated Power and Water Plant (DIPWP) supplying electricity and desalinated water to DR (and in the future other consumers in DSEZ). (Marafiq, also known as Central Utilities Company, CUC).
vi. Seawater supply network (to DIPWP). (Marafiq).
vii. Common wastewater outfall for industrial zone users. (SEZAD).
viii. Offshore oil import facilities (including offshore single point mooring (SPM) and crude oil pipeline to shore at RM (OTTCO).
The transition from crude oil import (via a Single Point Mooring, (SPM) at Raz Markaz to the export of refined products through the Project facilities follows these key stages:
1. Offload of crude oil from offshore vessel delivery. Crude oil is stored within the crude import and storage facility at Ras Markaz Tank Farm of which only eight crude oil tanks are part of the Project.
2. The oil is transferred to the Duqm Refinery through the 80.7km Crude Import Pipeline. The Duqm Refinery will have a design capacity of 230,000 barrels per day and will produce the following products:
a. Naphtha;
b. Liquid Petroleum Gas (LPG);
c. Jet A-1;
d. Diesel;
e. Heavy Sulphur Fuel Oil (intermittently);
f. Petroleum Coke (Solid); and
g. Sulphur (Solid).
3. Once the crude oil is refined to the final products then these are marine exported via the Duqm Export Terminal. The liquid products are conveyed to the terminal via a pipeline and the solid products via ground transport.

4
Duqm Refinery Project WSP DRPIC Project No 70029220
Confidential June 2017
2 STUDY BACKGROUND
2.1 PREVIOUS ARCHAEOLOGICAL RESEARCH IN THE HUQF
In 1984, a team of Italian researchers investigating bitumen sources in the northern Huqf near Gunaim (formerly Saiwan), discovered the first Palaeolithic site in Oman (Figure 2.1). The findspot is an extensive, dense scatter of stone tools and chipping debris made on locally outcropping chert nodules. Most of the lithic assemblage is comprised of debitage, predominantly flakes and elongated “blade-like” flakes struck from the core using hard hammer percussion. The cores consist of discoids and single-platform, unidirectional blade cores. The blade cores typically have plain striking platforms and primarily show parallel scar patterns on a single working surface. Among the tools, there were most notably sidescrapers and a series of well-made bifaces with flaking scars that suggest a mix of both soft and hard hammer reduction. Although precise dating is impossible because the material was only found on the surface, Biagi (1994) initially attributed the site of Saiwan to the “Upper Acheulean” (late Lower Palaeolithic) time period around 200,000 bp, based on the assemblage’s particular technological and typological characteristics. Subsequent expeditions to Huqf have mapped several hundred sites throughout this area (Whalen, 2003; Rose, 2006, 2007, 2012, 2014a, 2014b, 2014c, 2015; Jagher, 2009; Jagher and Pümpin 2010). These sprawling archaeological landscapes, in some cases dense carpets of chipping debris composed of tens of thousands of artifacts, are linked to chert outcrops occurring within the Khuff and Minjur geological formations. Most known prehistoric sites in this region are stone tool manufacturing zones accumulated by the successive exploitation of this local, abundant high quality raw material.

5
Duqm Refinery Project WSP DRPIC Project No 70029220
Confidential June 2017
Figure 2-1: Map illustration of concerned area including Al Huqf and Gunaim
Scholars have observed widespread and homogenous technological and typological features of the Palaeolithic in Huqf. Rose (2006, 2007, 2014b) describes a series of lithic surface scatters located at the confluence of Wadi Qilfah, Wadi Jumaym and Wadi Tarban approximately 20km northwest of Saiwan, which all exhibit the same technological and typological characteristics as those recorded at the nearby site of Saiwan. Tools such as sidescrapers and cordiform bifacial handaxes, as well as large blades and large, single platform blade cores occur frequently within the assemblages. As there are no absolute dates from these sites, there is disagreement among scholars regarding their age. Earlier publications (e.g. Biagi, 1994; Rose, 2006; Jagher, 2009) tentatively placed this industry between the late Lower Palaeolithic and the Middle Palaeolithic, between roughly 400,000 and 40,000 bp. More recent research analysing the chronology of Palaeolithic industries in Oman, however, suggests they may be much younger, dating to the Late Palaeolithic period from 13,000 to 8,000 bp (Rose et al., nd). In two field seasons between 2007 and 2008, the Central Oman Palaeolithic Survey (COPS) mapped over nearly 300 700 archaeological sites throughout the entire Huqf depression (Jagher, 2009; Jagher and Pümpin 2010). These included Palaeolithic sites with technological affinities to the Saiwan-type, as well as Neolithic stone tool scatters and historic-period features such as stone cairns, stone circles, and
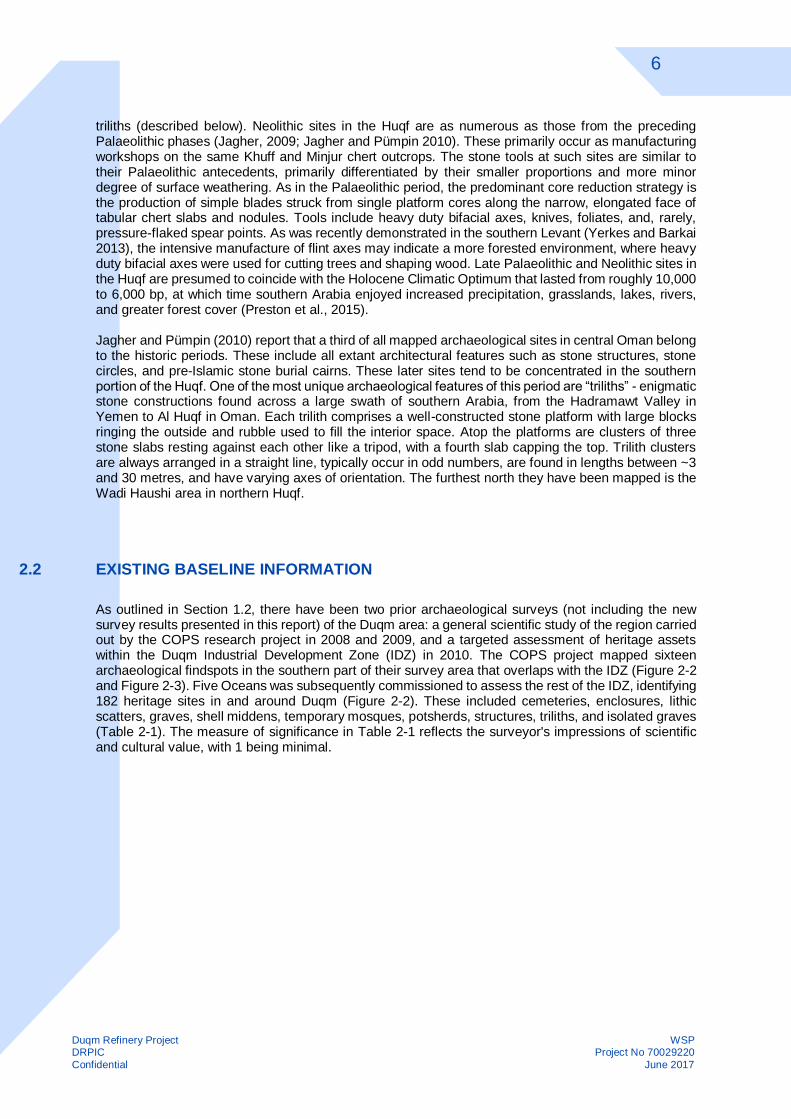
6
Duqm Refinery Project WSP DRPIC Project No 70029220
Confidential June 2017
triliths (described below). Neolithic sites in the Huqf are as numerous as those from the preceding Palaeolithic phases (Jagher, 2009; Jagher and Pümpin 2010). These primarily occur as manufacturing workshops on the same Khuff and Minjur chert outcrops. The stone tools at such sites are similar to their Palaeolithic antecedents, primarily differentiated by their smaller proportions and more minor degree of surface weathering. As in the Palaeolithic period, the predominant core reduction strategy is the production of simple blades struck from single platform cores along the narrow, elongated face of tabular chert slabs and nodules. Tools include heavy duty bifacial axes, knives, foliates, and, rarely, pressure-flaked spear points. As was recently demonstrated in the southern Levant (Yerkes and Barkai 2013), the intensive manufacture of flint axes may indicate a more forested environment, where heavy duty bifacial axes were used for cutting trees and shaping wood. Late Palaeolithic and Neolithic sites in the Huqf are presumed to coincide with the Holocene Climatic Optimum that lasted from roughly 10,000 to 6,000 bp, at which time southern Arabia enjoyed increased precipitation, grasslands, lakes, rivers, and greater forest cover (Preston et al., 2015). Jagher and Pümpin (2010) report that a third of all mapped archaeological sites in central Oman belong to the historic periods. These include all extant architectural features such as stone structures, stone circles, and pre-Islamic stone burial cairns. These later sites tend to be concentrated in the southern portion of the Huqf. One of the most unique archaeological features of this period are “triliths” - enigmatic stone constructions found across a large swath of southern Arabia, from the Hadramawt Valley in Yemen to Al Huqf in Oman. Each trilith comprises a well-constructed stone platform with large blocks ringing the outside and rubble used to fill the interior space. Atop the platforms are clusters of three stone slabs resting against each other like a tripod, with a fourth slab capping the top. Trilith clusters are always arranged in a straight line, typically occur in odd numbers, are found in lengths between ~3 and 30 metres, and have varying axes of orientation. The furthest north they have been mapped is the Wadi Haushi area in northern Huqf.
2.2 EXISTING BASELINE INFORMATION
As outlined in Section 1.2, there have been two prior archaeological surveys (not including the new survey results presented in this report) of the Duqm area: a general scientific study of the region carried out by the COPS research project in 2008 and 2009, and a targeted assessment of heritage assets within the Duqm Industrial Development Zone (IDZ) in 2010. The COPS project mapped sixteen archaeological findspots in the southern part of their survey area that overlaps with the IDZ (Figure 2-2 and Figure 2-3). Five Oceans was subsequently commissioned to assess the rest of the IDZ, identifying 182 heritage sites in and around Duqm (Figure 2-2). These included cemeteries, enclosures, lithic scatters, graves, shell middens, temporary mosques, potsherds, structures, triliths, and isolated graves (Table 2-1). The measure of significance in Table 2-1 reflects the surveyor's impressions of scientific and cultural value, with 1 being minimal.

7
Duqm Refinery Project WSP DRPIC Project No 70029220
Confidential June 2017
Figure 2-22: Duqm Significant Heritage Assets

8
Duqm Refinery Project WSP DRPIC Project No 70029220
Confidential June 2017
Figure 2-33: Duqm Significant Heritage Assets within 5 km Buffer Zones
Table 2-1: Archaeological sites mapped by the COPS project (2008-2009) SITE # UTM GRID REFERENCE SITE FEATURE(S) SIGNIFICANCE (1-5)
1 40 Q 564902 2165712 Trilith 4
2 40 Q 564926 2165778 Pre-Islamic Graves 3
3 40 Q 564723 2165696 Trilith 5
4 40 Q 562294 2162942 Trilith 5
5 40 Q 558721 2159706 Pre-Islamic Graves 3
6 40 Q 558770 2164143 Enclosure 3
7 40 Q 558770 2164143 Lithics 1
8 40 Q 558648 2165255 Enclosure 3
9 40 Q 561951 2168291 Lithics, Pre-Islamic Graves 3
10 40 Q 562015 2168452 Pre-Islamic Graves 3
11 40 Q 562015 2168452 Lithics 1
12 40 Q 562316 2168731 Pre-Islamic Graves 1
13 40 Q 562368 2168815 Lithics 4
14 40 Q 562368 2168815 Enclosure 3
15 40 Q 562479 2168889 Pre-Islamic Graves 3
16 40 Q 562532 2168931 Pre-Islamic Graves 3

9
Duqm Refinery Project WSP DRPIC Project No 70029220
Confidential June 2017
SITE # UTM GRID REFERENCE SITE FEATURE(S) SIGNIFICANCE (1-5)
17 40 Q 562559 2168966 Pre-Islamic Graves 3
18 40 Q 562559 2168966 Temporary Mosque 1
19 40 Q 562641 2169003 Pre-Islamic Graves 3
20 40 Q 562735 2169016 Pre-Islamic Graves 3
21 40 Q 561985 2170068 Lithics 4
22 40 Q 560488 2170139 Triliths, Pre-Islamic Graves 4
23 40 Q 560488 2170139 Lithics 3
24 40 Q 559569 2170001 Pre-Islamic Graves 3
25 40 Q 559600 2169946 Enclosure 2
26 40 Q 559600 2169946 Lithics 2
27 40 Q 559600 2169946 Pre-Islamic Graves 3
28 40 Q 559545 2170007 Pre-Islamic Graves 2
29 40 Q 559343 2169988 Pre-Islamic Graves 3
30 40 Q 558890 2169848 Lithics 2
31 40 Q 559394 2169717 Structure (indeterminate) 2
32 40 Q 559394 2169717 Lithics 3
33 40 Q 563694 2172917 Pre-Islamic Graves 3
34 40 Q 563698 2172952 Pre-Islamic Graves 3
35 40 Q 563691 2172962 Pre-Islamic Graves 3
36 40 Q 563688 2172966 Pre-Islamic Graves 3
37 40 Q 563687 2172979 Pre-Islamic Graves 3
38 40 Q 563676 2172979 Pre-Islamic Graves 3
39 40 Q 564943 2171180 Temporary Mosque 1
40 40 Q 566275 2177005 Pre-Islamic Graves 1
41 40 Q 562342 2183748 Pre-Islamic Graves 3
42 40 Q 562294 2183709 Structure (indeterminate) 1
43 40 Q 562219 2183867 Islamic Graves 3
44 40 Q 562111 2183889 Islamic Graves 3
45 40 Q 562137 2184095 Islamic Graves 3
46 40 Q 560736 2184609 Pre-Islamic Graves 3
47 40 Q 561654 2187744 Trilith 4
48 40 Q 561641 2187755 Islamic Graves 3
49 40 Q 561594 2187944 Islamic Graves 3
50 40 Q 561382 2189295 Pre-Islamic Graves 2
51 40 Q 563449 2187253 Islamic Graves 3
52 40 Q 563883 2186648 Pre-Islamic Graves 3
53 40 Q 563798 2186574 Pre-Islamic Graves 1
54 40 Q 564699 2185252 Pre-Islamic Graves 3
55 40 Q 567098 2185643 Pre-Islamic Graves 3
56 40 Q 573156 2197159 Traditional Ritual Site 5
57 40 Q 568450 2184399 Pre-Islamic Graves 3

10
Duqm Refinery Project WSP DRPIC Project No 70029220
Confidential June 2017
SITE # UTM GRID REFERENCE SITE FEATURE(S) SIGNIFICANCE (1-5)
58 40 Q 568441 2184422 Enclosure 2
59 40 Q 568441 2184380 Pre-Islamic Graves 3
60 40 Q 568608 2186200 Pre-Islamic Graves 3
61 40 Q 568616 2186221 Pre-Islamic Graves 3
62 40 Q 568627 2186219 Pre-Islamic Graves 3
63 40 Q 568638 2186243 Pre-Islamic Graves 3
64 40 Q 568640 2186249 Pre-Islamic Graves 3
65 40 Q 568659 2186253 Pre-Islamic Graves 3
66 40 Q 568831 2186408 Pre-Islamic Graves 3
67 40 Q 568801 2186398 Pre-Islamic Graves 3
68 40 Q 568797 2186392 Pre-Islamic Graves 3
69 40 Q 568769 2186416 Pre-Islamic Graves 3
70 40 Q 568743 2186443 Pre-Islamic Graves 3
71 40 Q 568722 2186477 Pre-Islamic Graves 3
72 40 Q 568724 2186480 Pre-Islamic Graves 3
73 40 Q 568739 2186482 Pre-Islamic Graves 3
74 40 Q 568762 2186500 Pre-Islamic Graves 3
75 40 Q 568792 2186503 Pre-Islamic Graves 3
76 40 Q 568821 2186570 Pre-Islamic Graves 3
77 40 Q 568843 2186577 Pre-Islamic Graves 3
78 40 Q 568797 2186313 Pre-Islamic Graves 3
79 40 Q 568784 2186255 Pre-Islamic Graves 3
80 40 Q 568781 2186249 Pre-Islamic Graves 3
81 40 Q 569041 2186265 Pre-Islamic Graves 3
82 40 Q 569040 2186329 Pre-Islamic Graves 3
83 40 Q 569032 2186353 Pre-Islamic Graves 3
84 40 Q 569172 2186257 Pre-Islamic Graves 3
85 40 Q 570125 2185934 Pre-Islamic Graves 3
86 40 Q 570125 2185934 Pre-Islamic Graves 3
87 40 Q 570115 2185925 Pre-Islamic Graves 3
88 40 Q 570082 2185920 Pre-Islamic Graves 3
89 40 Q 570075 2185934 Pre-Islamic Graves 3
90 40 Q 570063 2185957 Pre-Islamic Graves 3
91 40 Q 570052 2185984 Pre-Islamic Graves 3
92 40 Q 570032 2185970 Pre-Islamic Graves 3
93 40 Q 570032 2185970 Pre-Islamic Graves 3
94 40 Q 569395 2186678 Pre-Islamic Graves 3
95 40 Q 569302 2186677 Pre-Islamic Graves 3
96 40 Q 569289 2186642 Pre-Islamic Graves 3
97 40 Q 569261 2186578 Pre-Islamic Graves 3
98 40 Q 569252 2186531 Pre-Islamic Graves 3

11
Duqm Refinery Project WSP DRPIC Project No 70029220
Confidential June 2017
SITE # UTM GRID REFERENCE SITE FEATURE(S) SIGNIFICANCE (1-5)
99 40 Q 569292 2186513 Pre-Islamic Graves 3
100 40 Q 569173 2187709 Pre-Islamic Graves 3
101 40 Q 569166 2187678 Pre-Islamic Graves 3
102 40 Q 569166 2187678 Pre-Islamic Graves 3
103 40 Q 569173 2187639 Pre-Islamic Graves 3
104 40 Q 569189 2187613 Pre-Islamic Graves 3
105 40 Q 569200 2187608 Pre-Islamic Graves 3
106 40 Q 569206 2187601 Pre-Islamic Graves 3
107 40 Q 569175 2187602 Pre-Islamic Graves 3
108 40 Q 570036 2188166 Pre-Islamic Graves 3
109 40 Q 569582 2188404 Pre-Islamic Graves 3
110 40 Q 569649 2187230 Pre-Islamic Graves 3
111 40 Q 569682 2187278 Pre-Islamic Graves 3
112 40 Q 573390 2195905 Trilith 4
113 40 Q 573384 2195933 Trilith 1
114 40 Q 573382 2195949 Pottery 4
115 40 Q 573495 2195827 Trilith 4
116 40 Q 573392 2195730 Islamic Graves 5
117 40 Q 573542 2195179 Trilith 4
118 40 Q 573561 2195169 Trilith 4
119 40 Q 573534 2194960 Pre-Islamic Graves 4
120 40 Q 573670 2194687 Pre-Islamic Graves 3
121 40 Q 573678 2195114 Trilith 4
122 40 Q 573685 2195180 Trilith 4
123 40 Q 573322 2196034 Trilith 4
124 40 Q 574005 2194178 Trilith 4
125 40 Q 574274 2192932 Trilith 4
126 40 Q 574271 2192942 Trilith 4
127 40 Q 574266 2192963 Trilith 4
128 40 Q 5736722 2192897 Pre-Islamic Graves 3
129 40 Q 574168 2192421 Trilith 4
130 40 Q 574171 2192438 Trilith 4
131 40 Q 574179 2192461 Trilith 4
132 40 Q 574137 2192510 Trilith 3
133 40 Q 574178 2192547 Trilith 4
134 40 Q 574184 2192584 Pre-Islamic Graves 3
135 40 Q 570626 2197081 Pre-Islamic Graves 3
136 40 Q 570670 2197081 Pre-Islamic Graves 3
137 40 Q 570658 2197194 Pre-Islamic Graves 3
138 40 Q 570638 2197312 Pre-Islamic Graves 3
139 40 Q 570610 2197400 Pre-Islamic Graves 3

12
Duqm Refinery Project WSP DRPIC Project No 70029220
Confidential June 2017
SITE # UTM GRID REFERENCE SITE FEATURE(S) SIGNIFICANCE (1-5)
140 40 Q 570599 2197427 Pre-Islamic Graves 3
141 40 Q 570567 2197475 Pre-Islamic Graves 3
142 40 Q 570637 2197358 Temporary Mosque 1
143 40 Q 570754 2197514 Trilith 4
144 40 Q 570106 2199511 Enclosure 3
145 40 Q 571562 2198874 Pre-Islamic Graves 3
146 40 Q 574508 2201213 Trilith 4
147 40 Q 579884 2199993 Pre-Islamic Graves 3
148 40 Q 579118 2198481 Pre-Islamic Graves 3
149 40 Q 579124 2198453 Shell Midden, Pre-Islamic Graves 3
150 40 Q 579122 2198423 Pre-Islamic Graves 3
151 40 Q 578933 2198614 Islamic Graves 4
152 40 Q 578840 2198629 Islamic Graves 4
153 40 Q 578586 2198636 Islamic Graves 4
154 40 Q 578578 2198635 Shell Midden 3
155 40 Q 578306 2198323 Pre-Islamic Graves 3
156 40 Q 578306 2198323 Pre-Islamic Graves 3
157 40 Q 578300 2198324 Pre-Islamic Graves 3
158 40 Q 578310 2198323 Pre-Islamic Graves 3
159 40 Q 578296 2198357 Pre-Islamic Graves 3
160 40 Q 578296 2198357 Pre-Islamic Graves 3
161 40 Q 578302 2198336 Pre-Islamic Graves 3
162 40 Q 579191 2198201 Islamic Graves 5
163 40 Q 579539 2195751 Pre-Islamic Graves 3
164 40 Q 576678 2192289 Islamic Graves 3
165 40 Q 576568 2192444 Islamic Graves 3
166 40 Q 576568 2192444 Pre-Islamic Graves 3
167 40 Q 576180 2192723 Enclosure 3
168 40 Q 576195 2192719 Enclosure 3
169 40 Q 559960 2184996 Pre-Islamic Graves 3
170 40 Q 557728 2186687 Trilith 4
171 40 Q 562160 2184127 Islamic Graves 3
172 40 Q 570785 2196712 Trilith 3
173 40 Q 571416 2200211 Pre-Islamic Graves 3
174 40 Q 575186 2192094 Rock Art 3
175 40 Q 573228 2195555 Traditional Ritual Site, Islamic Graves 5
176 40 Q 562213 2185747 Pre-Islamic Graves 3
177 40 Q 562184 2185817 Pre-Islamic Graves 3
178 Pre-Islamic Graves 2
179 Trilith 3
180 40 Q 561319 2188182 Islamic Graves 4

13
Duqm Refinery Project WSP DRPIC Project No 70029220
Confidential June 2017
SITE # UTM GRID REFERENCE SITE FEATURE(S) SIGNIFICANCE (1-5)
181 40 Q 561319 2188182 Islamic Graves 4
182 40 Q 573268 2186326 Lithics 3
These sites were found to cluster in three general areas within the IDZ. In the northern sector, findspots were located within the Wadis Sidrah and Nafun. These were predominantly Islamic and Pre-Islamic graves, triliths, and a rock art site depicting a human figure holding a large male Nubian ibex (Capra nubiana) on a tether. In the central area, the surveyor identified numerous Islamic and pre-Islamic graves at the edge of the foothills. The highest density of sites was mapped in the southern zone, which included burial mounds, triliths, and flint scatters (Figure 2-2). The report recommends a 40m buffer zone around significant archaeological sites.
The 2014 HMR EIAs assessing the Duqm Refinery and Refinery Construction Camp did not identify any sites that required mitigation. These reports, however, only use the 2008-2009 COPS survey as the basis for their archaeological impact assessments. They do not include results of the 2010 Insall survey, which identified archaeological sites in vicinity of the Refinery Camps, nor was any targeted archaeological survey carried out specifically for this EIA.
The 2015 WorleyParsons EIA report of the Duqm Terminal Liquid Bulk Storage facility found that the development had low archaeological impact, as it is built on reclaimed land. The 2016 WorleyParsons assessment of the Ras Markaz Pipeline did not examine heritage sites along the pipeline development corridor, although Five Ocean's 2010 survey in the area did cover a portion of the right of way. The survey of the entire pipeline right of way was completed by Dr. Yamandú Hilbert from 23/04/2017 to 27/04/2017. The predominant sites within the pipeline development corridor were found to be stone tool manufacturing workshops associated with local outcrops of chert or other siliceous materials. Other archaeological site types included small architectural features such as triliths, stone cairns, hearths, Islamic and pre-Islamic graves, and stone foundation walls.
2.3 GENERAL SIGNIFICANCE
The coast and hinterlands of central Oman are dominated by landscapes of low, eroded hills encompassing a variety of geological exposures and ecosystems. In the northern portion of this area is Al Huqf, an elongated depression generally oriented along a north-south axis, extending some 200km through the eastern portions of Ad Dakhliyiah and Al Wusta regions. It is bounded to the west by a steep limestone escarpment that rises onto the barren Jiddat Al Harrasis plain and to the east by the Indian Ocean littoral. Al Huqf is characterized by a series of low-lying hills, sabkha flats, and an intricate network of widian that debouch southward and ultimately terminate around Duqm. The setting of the central Oman hill country would have been attractive to nomadic hunter-gatherer and pastoral populations throughout human history, as it encompasses a mosaic of terrestrial ecosystems, as well as being in proximity to a rich diversity of coastal resources (Jagher, 2009). Duqm, situated at the outlet of the only major drainage system in central Oman, was likely to have played a particularly important role due to the presence of freshwater in antiquity. While the region is presently governed by a hyperarid climatic regime, there have been multiple phases of increased rainfall over the course of the Pleistocene and Holocene geological ages. Terrestrial archives from lake sediments and cave speleothems show heightened precipitation during the following timeframes: 130,000 – 120,000 years before present (bp), 110,000 to 100,000 bp, 90,000 – 80,000 bp, 60,000 – 55,000 bp, and 8,000 – 5,000 bp (Parker et al., 2006; Parker and Rose, 2008; Fleitmann and Matter, 2009; Preusser, 2009; Rosenberg et al., 2011; Parton et al., 2013; Preston et al., 2015). It is likely that the Huqf was occupied most intensively during these periodic wet periods, called pluvials. A large palaeolake was identified in northern Huqf, dating to the most pronounced pluvial in human history: the Last Interglacial between 130,000 and 100,000 bp (Rosenberg et al., 2012). During this period, the first anatomically modern humans expanded from Africa into southern Arabia, facilitated by the favourable conditions that

14
Duqm Refinery Project WSP DRPIC Project No 70029220
Confidential June 2017
transformed the landscapes into lush grasslands. As such, Duqm and the entire Huqf region are of high scientific value in elucidating the history of our species.
3 METHODOLOGY 3.1 GUIDANCE
3.1.1 International Finance Corporation
The work conducted as part of this study conforms with Performance Standard 8 Cultural Heritage, International Finance Corporation, 2012.
3.2 PROCEDURE
The report has been provided to the Ministry of Heritage and Culture and SEZAD were consulted as part of the overall survey plan. The pipeline survey was conducted along an approximately 80 km linear transect following the development corridor of the planned pipeline. The survey transect extended from the storage facility at Ras Markaz to the refinery (see Figure 2-2 and Figure 2-3). An area of roughly 200m on either side of the survey transect was inspected for locations of archaeological and geological significance. Specific landscape features such as terraces and hilltops were also targeted due to their pre-established archaeological sensitivity. There is presently little vegetation and soil cover on the heavily eroded and deflated limestone bedrock of the study area, allowing for high archaeological visibility and a relatively straight driving path along the development corridor. Although most architectural features are in a poor state of repair, typically not preserved more than 20-50cm in height, the high visibility enabled surveyors to spot architectural features and chipped stone debris scatters from a distance of up to 200m away. Findspots were photographed and recorded on site survey forms (Appendix B); no artefacts were collected. The survey followed the trajectory of the pipeline and examined from the location of the Tank Farm at Ras Markaz to the Duqm Refinery (see also in Figure 2-2). To navigate in the field, surveyors used a digital satellite map overlain with the development corridor. A total of 24 archaeological sites and four sites of geological interest were documented. Archaeological sites included lithic workshops, Islamic and pre-Islamic graves, stone walls, and a trilith site. Sites ranged from within 50m of the corridor of impact to more than 400m away. The distance of each site to the development corridor is presented in Table 2-1. The archaeological phase(s) attributed to each lithic scatter site is based on observations of specific technical features on the waste material as well as classification of tool types. This techno-typological approach examines patterns in both the chipped stone debris and completed tool types to assess the period of lithic production. A tiered ranking system is applied to these archaeological sites, with which to guide future infrastructure development activities. The site rank corresponds with mitigation strategy and is not an indicator of significance.
Rank #1 sites are those with extant architectural features (e.g. triliths, walls, graves, cairns). If working in this area, all standing structures should be delineated with survey flags and there should be no access by light vehicles, heavy vehicles, nor bulldozing within 100m.
Rank #2 sites are high density stone tool scatters in pristine condition that are conscripted and clearly demarcated across the landscape. These findspots should be delineated with survey flags and there should be no access by heavy vehicle nor bulldozing. Light vehicle access is permissible and no buffer zone is required.

15
Duqm Refinery Project WSP DRPIC Project No 70029220
Confidential June 2017
Rank #3 sites are low density and/or sprawling lithic scatters whose limits cannot be easily defined. These landscapes should not be bulldozed, although light and heavy vehicle access is permissible.
Rank #4 sites are isolated or very low density surface lithic scatters that are of minimal scientific value and will not be impacted by construction activities. Table 4-1 lists all of the archaeological sites discovered during the survey, their distance to the impact zone, and mitigation rank. The map of sites presented in Figure 1 depicts the location of findspots along the survey transect.
4 NEW ARCHAEOLOGICAL SITES
4.1 SURVEY RESULTS
The cultural heritage assets identified during survey are shown in Table 4-1.
Table 4-1: Archaeological sites, location, description, and mitigation rank
SITE #
SITE
FEATURES LAT (N) LONG (E) SIZE (SQ M) DENSITY
(ARTIFACTS/SQ M) TIME PERIOD(S)
MITIGATION
RANK
DISTANCE TO
IMPACT ZONE
(M)
DQM01 lithics 19.59091 57.56823 100 4-10 Late Pal.,
Neolithic 3 170
DQM02 lithics 19.58927 57.56620 60 0-3 non-diag.
Holocene 4 360
DQM03 lithics 19.57980 57.56984
n/a isolated Lower Pal. 4 >400
DQM04 lithics 19.56423 57.56656 ? 0-3 non-diag.
Holocene 4 >400
DQM05 lithics 19.55364 57.56948 ? 4-10 non-diag.
Holocene 3 50
DQM06 lithics 19.57122 57.56927 n/a isolated non-diag.
Holocene 4 >400
DQM07
lithics,
structures 19.54445 57.57032 ?
0-3
Neolithic,
Bronze/Iron
Age
1 130
DQM08
lithics,
hearth,
shells
19.54457 57.57009 25 11-50
Neolithic,
Bronze/Iron
Age
1 130
DQM09 stone
cairn(s) 19.51266 57.56126 n/a n/a
Bronze/Iron
Age 1 <50
DQM10 stone
cairn(s) 19.51205 57.56125 n/a n/a
Bronze/Iron
Age 1 <50

16
Duqm Refinery Project WSP DRPIC Project No 70029220
Confidential June 2017
SITE #
SITE
FEATURES LAT (N) LONG (E) SIZE (SQ M) DENSITY
(ARTIFACTS/SQ M) TIME PERIOD(S)
MITIGATION
RANK
DISTANCE TO
IMPACT ZONE
(M)
DQM11 stone
cairn(s) 19.49571 57.56743 n/a n/a
Bronze/Iron
Age 1 <50
DQM12 lithics,
hearth 19.43329 57.58154 10 0-3 Late Pal. 4 >400
DQM13 lithics 19.32171 57.60125 n/a isolated Middle Pal. 4 >400
DQM14 lithics 19.31081 57.60460 n/a isolated non-diag.
Holocene 4 >400
DQM15
lithics,
structures,
shells
19.17716 57.74119 ? 4-10 non-diag.
Holocene 1 <50
DQM16 lithics 19.65763 57.57535 n/a isolated non-diag.
Holocene 4 >400
DQM17 lithics 19.62802 57.57809 30 11-50 Late Pal.,
Neolithic 2 <50
DQM18 lithics,
Trilith 19.62568 57.57666 40 11-50
Middle Pal.,
Neo., Iron Age 1 <50
DQM19 lithics 19.62214 57.57257 200 11-50 Late Pal. 2 >400
DQM20 lithics 19.61743 57.57114 20 4-10 Late Pal. 3 >400
DQM21
lithics,
structures,
grave
19.61471 57.57154 30 4-10 Middle Pal.,
Neolithic 1 <50
DQM22 lithics 19.61173 57.56966 ? 0-3
Lower Pal.,
non-diag.
Holocene
4 >400
DQM23 lithics 19.60331
57.56762 30 4-10
Lower Pal.,
non-diag.
Holocene
3 250
DQM24
lithics,
structures,
hearths
19.58807 57.57014 30 11-50 non-diag.
Holocene 1
<50
A total of 24 archaeological sites were identified, labelled DQM01 to DQM24. The locations of these sites are shown in maps Figure 2-2 and Appendix A. Table 4-1 provides the coordinates, description, mitigation rank, and mitigation strategy for each site. Appendix B includes the survey forms upon which

17
Duqm Refinery Project WSP DRPIC Project No 70029220
Confidential June 2017
individual site data were recorded in the field. Figures 15 to 83 are photographs of the site landscapes and associated artifacts. Nine of the sites (DQM05, DQM09-11, DQM15, DQM17-DQM18, DQM21, and DQM24) are situated within 100m of the development corridor and require specific action described in Section 6 below. The landscapes around the Port, the worker's camps, and the Refinery have already been so heavily altered by construction activities that traces of potential archaeology have been erased. No mitigation strategy is required within these zones (Figure 2.2). Although the coordinates are undocumented, archaeological surveyors observed some areas along the northern section of the transect where bulldozers already excavated the landscape and removed potential archaeological sites prior to survey (Figure 84 and 85). Most archaeological sites mapped during the survey were found in association with naturally occurring conchoidal stone outcrops of chert, flint, quartz, and quartzite (e.g. Figures 11 - 14). These lithic (stone tool) raw material sources were visited repeatedly throughout multiple phases of prehistory and can be easily identified by the abundant vestiges of chipped stone debris littering the landscape surfaces around the outcrops. The majority of lithic sites were found in the northwestern part of the survey area, where the pipeline cuts across an undulating Quaternary alluvial plain that is dissected by a series of seaward streaming wadis. Along this actively eroding landscape, a variety of raw materials are present and were utilized for tool production by early humans and other hominid groups since the Lower Palaeolithic. Three sites (DQM03, DQM22, DQM23) bear evidence for Lower Palaeolithic archaeological remains, including artefacts belonging to a weathered Kombewa flake technology at DQM03 and DQM22, and a weathered handaxe collected at DQM 23 (Figure 81). There are fleeting examples of Middle Palaeolithic cores (DQM13, DQM18, DQM21), however, they have no consistent presence at any one site. Most lithic scatters are attributed to the Late Palaeolithic (13,000 - 8,000 bp) and Neolithic (8,000 - 6,000 bp) periods, which are often difficult to distinguish from one another in this region. It is noteworthy that the majority of the archaeological sites around Duqm seem to coincide with a period of improved environmental conditions during the Holocene, which reached peak rainfall between approximately 10,000 and 6,000 bp (e.g., Fleitmann & Matter, 2009; Preston et al., 2015; Engel et al., 2016).
Architectural structures were mapped at sites DQM07-11, DQM15, DQM18, DQM21, and DQM24, including circular stone cairns, stone fireplaces, circular stone houses, large anchor stones (perhaps for tent poles or livestock enclosures), and a trilith feature. With the exception of DQM07 and DQM08, all of these standing structures are located within 100m of the development corridor and require mitigation suggested below in Section 6. While most of these structural features are non-diagnostic of a specific time period, we can surmise that they post-date the Palaeolithic periods and are the remains of human occupation after 8,000 years ago. The stone cairns likely fall between the Bronze and Iron Ages (5,000 - 2,500 bp). The trilith found at DQM18 (Figures 60 - 62) can be dated to the late Iron Age between approximately 2,500 and 1,500 years ago (Bin 'Aqil & McCorriston 2009).
5 GEOLOGICAL SITES Table 5-1: Locations of geological interest
SITE REFERENCE LAT LONG ELEVATION DESCRIPTION MITIGATION
RANK (n) (e) (masl)
DQM-Spring 1 19.67704 57.57364 56 Active artesian spring system 3
DQM-Spring 2 19.65836 57.57570 45 Active artesian spring system 3
DQM-GEO-1 19.59066 57.60314 47 Fossil-rich limestone beds 3
DQM-Salt Spring 19.69313 57.64155 30 Hyperalkaline spring heads 3

18
Duqm Refinery Project WSP DRPIC Project No 70029220
Confidential June 2017
There are four locations considered to be of potential geological interest (Appendix A): the fossil outcrops, active hyperalkaline spring heads north of Duqm, and artesian springs on the edge of the escarpment (Table 5-1). These loci are unique geological features on the landscapes around Duqm. The limestone fossil beds (Figures 2 to 5) are located east of the pipeline and stretch for approximately five square kilometres around GPS waypoint DQM-GEO 1. The salt domes in the northeast of the survey area (Figure 6 to 9) are active spring heads where mineral rich, saline waters emerge from the underlying sediments. The area around the springs has already been heavily disturbed by various construction projects. On the western side of the survey area, at the foot of the limestone plateau, a series of artesian spring systems were observed (Figure 10). While only one findspot (DQM16) has associated artefacts, the available freshwater from springs along the escarpment makes this a zone of archaeological interest for future research.
6 MITIGATION STRATEGIES Sites designated as Mitigation Rank #4 (9) are either isolated surface finds or are of minimal scientific value; therefore, these do not require any special action at this time (DQM02-04, DQM06, DQM12-14, DQM16, DQM22). Mitigation Rank #3 sites (4), including DQM01, DQM19, DQM20, and DQM23 are lithic findspots more than 100m away from the impact zone. Bulldozing directly on these location should be avoided, but no other action is required. Mitigation Rank #2 sites (2) include DQM05 and DQM17. These are lithic artefact scatters found insitu, which have scientific value for further study. Bulldozing and driving over these sites should beavoided. Both are located within 50m of the development corridor; therefore, it is recommended that asystematic collection of lithic artefacts should first be taken from these findspot to mitigate the loss ofarchaeological data. This should be done in conjunction with the Ministry of Culture and Heritage andSEZAD. Mitigation Rank #1 sites (9) include all of those with stone structures and other standing architecturalfeatures: DQM07-DQM11, DQM15, DQM18, DQM21, and DQM24. These features are an indelible partof Oman's heritage landscapes and should be preserved wherever possible. In addition to the trilitharchitectural feature at DQM 18, there is a clearly delimited lithic scatter associated with it. Thisdiagnostic Iron Age site has considerable value to Oman's heritage. In this case, it is recommended toassess the site further in coordiation with SEZAD and the Ministry of Heritage and Culture along wih a heritage specialist. With the exception of DQM07 and DQM08, all other findspots with structures are within 100m of the development corridor and should be entered into Project mapping and delineated with survey stakes to restrict all access. Overall, the Duqm pipeline archaeological survey has documented areas of potential geological interest, lithic surface scatters, and architectural features indicating that this area was intermittently occupied during the Lower Palaeolithic (1.5 million - 300,000 bp), Middle Palaeolithic (300,000 - 40,000 bp), Late Palaeolithic (13,000 - 8,000 bp), Neolithic (8,000 - 6,000 bp), Bronze (5,000 - 3,500 bp), and Iron Ages (2,500 - 1,500 bp). Some of these sites have value in the development of heritage tourism and for scientific study. Within the Duqm area, SEZAD is the authority on environmental matters. SEZAD have adopted MECA Guidelines for Environmental Impact Assessment, which includes geological assets (including fossils) within the range of resources that are to be assessed. The springs in question are hyper-saline and are therefore not exploitable as water resources and are of less concern or interest to the Directorate of Water Resources in the Ministry of Regional Municipalities and Water Resources. However, around these springs evidence of offerings (clothing, food items) which therefore increase their sensitivity. Sites DQM02-04, DQM06, DQM12-14, DQM16, DQM22 have minimal scientific or heritage value and no action is required. Sites DQM01, DQM19, DQM20, and DQM23 are lithic scatters outside the development area, where bulldozing should be avoided. Sites DQM07-11, DQM15, DQM18, DQM21, and DQM24 have standing architectural features. With the exception of DQM07 and DQM08, which are more than 100m away from the impact zone, these architectural features should be cordoned

19
Duqm Refinery Project WSP DRPIC Project No 70029220
Confidential June 2017
off with survey flags to avoid disturbance. Sites DQM05 and DQM17 are lithic scatters located withinthe impact zone. It is recommended that a systematic collection of artefacts be sampled from thesesites prior to landscape development. Site DQM18 has both a significant late Iron Age architecturalfeature and a scientifically important lithic scatter associated with it; it is suggested to assess the site further in coordination with SEZAD and the Ministry of Heritage and Culture along with a heritage specialist.Table 6-1, below, provides a list of each site along with rank and proposed mitigation strategy.

20
Duqm Refinery Project WSP DRPIC Project No 70029220 Confidential June 2017
Table 6-1: Site ID, including rank and proposed mitigation strategy
Site # Lat (n) Long (e)Elevation
(masl)Size (sq m)Site Features Mitigation Strategy
Density
(artifacts / sq m)Time Period(s)
Mitigation
Rank
Distance to
Development
Corridor (m)DQM01 lithics 19.59091 57.56823 82 100 4-10 Late Pal., Neolithic 3 170 avoid bulldozing
DQM02 lithics 19.58927 57.56620 74 60 0-3 non-diag. Holocene 4 360 no action required
DQM03 lithics 19.57980 57.56984 70 n/a isolated Lower Pal. 4 >400 no action required
DQM04 lithics 19.56423 57.56656 78 ? 0-3 non-diag. Holocene 4 >400 no action required
DQM05 lithics 19.55364 57.56948 93 ? 4-10 non-diag. Holocene 3 50 systematic artefact collection
DQM06 lithics 19.57122 57.56927 78 n/a isolated non-diag. Holocene 4 >400 no action required
DQM07 lithics, structures 19.54445 57.57032 87 ? 0-3 Neolithic, Bronze/Iron Age 1 130 structures cordoned off
DQM08 lithics, hearth, shells 19.54457 57.57009 86 25 11-50 Neolithic, Bronze/Iron Age 1 130 structures cordoned off
DQM09 stone cairn(s) 19.51266 57.56126 93 n/a n/a Bronze/Iron Age 1 <50 structures cordoned off
DQM10 stone cairn(s) 19.51205 57.56125 87 n/a n/a Bronze/Iron Age 1 <50 structures cordoned off
DQM11 stone cairn(s) 19.49571 57.56743 107 n/a n/a Bronze/Iron Age 1 <50 structures cordoned off
DQM12 lithics, hearth 19.43329 57.58154 103 10 0-3 Late Pal. 4 >400 no action required
DQM13 lithics 19.32171 57.60125 99 n/a isolated Middle Pal. 4 >400 no action required
DQM14 lithics 19.31081 57.60460 88 n/a isolated non-diag. Holocene 4 >400 no action required
DQM15 lithics, structures, shells 19.17716 57.74119 96 ? 4-10 non-diag. Holocene 1 <50 structures cordoned off
DQM16 lithics 19.65763 57.57535 34 n/a isolated non-diag. Holocene 4 >400 no action required
DQM17 lithics 19.62802 57.57809 59 30 11-50 Late Pal., Neolithic 2 <50 systematic artefact collection
DQM18 lithics, Trilith 19.62568 57.57666 57 40 11-50 Middle Pal., Neo., Iron Age 1 <50 assess further with design details
DQM19 lithics 19.62214 57.57257 62 200 11-50 Late Pal. 2 >400 systematic artefact collection
DQM20 lithics 19.61743 57.57114 66 20 4-10 Late Pal. 3 >400 avoid bulldozing
DQM21 lithics, structures, grave 19.61471 57.57154 65 30 4-10 Middle Pal., Neolithic 1 <50 structures cordoned off
DQM22 lithics 19.61173 57.56966 64 ? 0-3 Lower Pal., non-diag. Holocene 4 >400 No action required
DQM23 lithics 19.60331 57.56762 70 30 4-10 Lower Pal., non-diag. Holocene 3 250 avoid bulldozing
DQM24 lithics, structures, hearths 19.58807 57.57014 68 30 11-50 non-diag. Holocene 1 <50 structures cordoned off

21
Duqm Refinery Project WSP DRPIC Project No 70029220 Confidential June 2017

22
Duqm Refinery Project WSP DRPIC Project No 70029220
Confidential June 2017
7 REFERENCES Biagi, P. 1994. An Early Palaeolithic site near Saiwan (Sultanate of Oman). Arabian Archaeology and
Epigraphy 5: 81-88. Bin ‘Aqil, A.J. & McCorriston, J. 2009. Prehistoric small scale monument types in Hadramawt
(southern Arabia): convergence in ethnography, linguistics, and archaeology. Antiquity 83: 602-618.
Engel, M., Matter, A., Parker, A.G., Parton, A., Pertaglia, M, Preston, G., and Preusser, F. 2016. Lakes or wetlands? A comment on ‘The middle Holocene climatic records from Arabia: Reassessing lacustrine environments, shift of ITCZ in Arabian Sea, and impacts of the southwest Indian and African monsoons’ by Enzel et al. Global and Planetary Change 148: 258-267.
Five Oceans LLC (2011, June), Duqm Industrial and Free Zone Masterplan – Environmental Impact Assessment (EIA). Final EIA Report Rev 02 for Jurong Consultants Pte Ltd (Oman branch), Muscat, Oman.
Fleitmann, D. & Matter, A. 2009. The speleothem record of climate variability in Southern Arabia. Comptes Rendus Geoscience 341: 633-642.
HMR Consultants (2014, Dec.), Duqm Refinery Environmental Impact Assessment (EIA) Study Report. DRPIC Document No.: DRP001-EIA-RPT-Z-000-001. HMR Document No.: 3514-EIA-01. HMR, Muscat, Oman.
HMR Consultants (2014, Dec.), Environmental Impact Assessment (EIA) Study Report for Duqm Refinery Construction Camp. Document No.: 3514-EIA-02. HMR #3514. HMR, Muscat, Oman.
Jagher, R. 2009. The Central Oman Paleolithic Survey: recent research in southern Arabia and reflection on the prehistoric evidence. In The Evolution of Human Populations in Arabia: Palaeoenvironments, Prehistory, and Genetics, edited by M. Petraglia and J. Rose. Netherlands, Springer, pp. 139-150.
Jagher, R. & Pümpin, C. 2010. A new approach to central Oman prehistory. Proceedings of the Seminar for Arabian Studies 40: 185-200.
Macumber, P. 1999. Geo-archaeological survey of seismic lines in the Jahiz area of central Oman. Petroleum Development of Oman, unpublished report.
Parker, A.G. & Rose, J.I. 2008. Climate change and human origins in southern Arabia. Proceedings of the Seminar for Arabian Studies 38: 25-42.
Parker, A.G., Goudie, A.S., Stokes, S., White, K., Hodson, M.J., Manning, M., & Kennet, D. 2006. A record of Holocene climate change from lake geochemical analyses in southeastern Arabia. Quaternary Research 66: 465-476.
Parton, A.P., Farrant, A.R., Leng, M.L., Schwenninger, J.-L., Rose, J.I., Uerpmann, H.-P., & Parker, A.G. 2013. An early MIS3 pluvial phase within southeast Arabia: climatic and archaeological implications. Quaternary International 300: 62-74.
Preston, G. & Parker, A. 2013. Understanding the evolution of the Holocene Pluvial Phase and its impact on Neolithic populations in south-east Arabia. Arabian Archaeology and Epigraphy 24: 87-94.
Preston, G., Thomas, D., Goudie, A., Atkinson, O., Leng, M., Hodson, M., Walkington, H., Charpentier, V., Méry, S., Borgi, F., and Parker, A.G. 2015. A multi-proxy analysis of the Holocene humid phase from the United Arab Emirates and its implications for southeast Arabia's Neolithic populations. Quaternary International 382: 277-292.
Preusser, F. 2009. Chronology of the impact of Quaternary climate change on continental environments in the Arabian Peninsula. C. R. Geoscience 341: 621-632.
Rose, J.I. 2006. Among Arabian Sands: Defining the Palaeolithic of Southern Arabia. Ph.D. dissertation, Southern Methodist University, Dallas.
Rose, J.I. 2007. The Arabian Corridor Migration Model: archaeological evidence for hominin dispersals into Oman during the Middle and Upper Pleistocene. Proceedings of the Seminar for Arabian Studies 37: 219-237.

23
Duqm Refinery Project WSP DRPIC Project No 70029220
Confidential June 2017
Rose, J.I. 2012. Archaeological assessment of the Wadi Tarban 3D seismic survey area, Block 4. Consolidated Contractors Energy Development (CCED), unpublished report.
Rose, J.I. 2014a. Eastern Block 4 archaeological survey. Consolidated Contractors Energy Development (CCED), unpublished report.
Rose, J.I. 2014b. Archaeological survey report, northern Block 4. Consolidated Contractors Energy Development (CCED), unpublished report.
Rose, J.I. 2014c. Archaeological report on the Eastern Block 4 Pipeline Survey. Contractors Energy Development (CCED), unpublished report.
Rose, J.I. 2015a. Report on the archaeological survey of Block 4, Az Zumayim region. Consolidated Contractors Energy Development (CCED), unpublished report.
Rose, J.I. 2015b. Block 56, Eastern Dhofar and Southeastern Al Wusta Regions, Report on Archaeological Survey. MEDCO Energy International, unpublished report. Rose, J.I., Hilbert, Y.H., Usik, V.I., Blessing, M., Geiling, J-M., & Marks, A.E. nd. Building a
chronology of stone tool industries in Dhofar (South Arabia): from the Lower Palaeolithic to the Neolithic. Unpublished manuscript.
Rosenberg, T., Preusser, F., Fleitmann, D., Schwalb, A., Penkman, K., Schmid, T., Al-Shanti, M., Kadi, K. & Matter, A. 2011. Humid periods in southern Arabia: windows of opportunity for modern human dispersal. Geology 39: 1115-1118.
Rosenberg, T.M., Preusser, F., Blechschmidt, I., Fleitmann, D., Jagher, R. & Matter, R. 2012. Late Pleistocene palaeolake in the interior of Oman: A potential key- area for the dispersal of anatomically modern humans out-of-Africa? Journal of Quaternary Science 27: 13-16.
Whalen, N. 2003. Lower Palaeolithic Sites in the Huqf Area of Central Oman. Journal of Oman Studies 13: 175-182.
Yerkes, R.W. & Barkai, R. 2013. Tree-felling, woodworking, and changing perceptions of the landscape during the Neolithic and Chalcolithic periods in the southern Levant. Current Anthropology 54: 222-231.
WorleyParsons Oman Engineering LLC (2015, 22 Sep.), Duqm Liquid Bulk Berths Project, Environmental Impact Assessment Report. Document No.: SEZAD-DPTC-00-WP-EV-REP-3001-B2. WP, Muscat, Oman.
WorleyParsons Oman Engineering LLC (2016, 29 May), Ras Markaz Oil Pipeline Concept Study and FEED – Environmental Impact Assessment Report. Document No.: RMZ-0-2028-001-Q9-4. WP, Muscat, Oman.

24
Duqm Refinery Project WSP DRPIC Project No 70029220
Confidential June 2017
Appendix A ̀
ARCHAEOLOGICAL AND GEOLOGICAL FINDSPOTS
DOCUMENTED DURING SURVEY

1
Duqm Refinery Project WSP Duqm Refinery & Petrochemical Industries Company Project No 70029220 Confidential June 2017
Figure 1 - Map showing location of archaeological and geological findspots documented during survey

Appendix B ARCHAEOLOGICAL SITE CATALOGUE

1
Duqm Refinery Project WSP Duqm Refinery & Petrochemical Industries Company Project No 70029220
Confidential June 2017

2
Duqm Refinery Project WSP DRPIC Project No 70029220
Confidential June 2017

3
Duqm Refinery Project WSP DRPIC Project No 70029220
Confidential June 2017

4
Duqm Refinery Project WSP DRPIC Project No 70029220
Confidential June 2017

5
Duqm Refinery Project WSP DRPIC Project No 70029220
Confidential June 2017

6
Duqm Refinery Project WSP DRPIC Project No 70029220
Confidential June 2017

7
Duqm Refinery Project WSP DRPIC Project No 70029220
Confidential June 2017

8
Duqm Refinery Project WSP DRPIC Project No 70029220
Confidential June 2017

9
Duqm Refinery Project WSP DRPIC Project No 70029220
Confidential June 2017

10
Duqm Refinery Project WSP DRPIC Project No 70029220
Confidential June 2017

Appendix C SITE SURVEY FIGURES


Copyright © 2022 FDOKUMEN