
Feasibility study on waste utilization of a palm oil refinery
252
N E DO- I C-00ER25 020005089 FeasibiIity Study on Waste Utilization of a Palm Oil Refinery March. 2001 New Energy and Industrial Technologies Development Organization (NEDO) Listed Kawasaki Heavy Industries, Ltd. -6
-
Upload
khangminh22 -
Category
Documents
-
view
3 -
download
0
Transcript of Feasibility study on waste utilization of a palm oil refinery

N E DO- I C-00ER25
020005089
FeasibiIity Study onWaste Utilization of a Palm Oil Refinery
March. 2001
New Energy and Industrial Technologies Development Organization (NEDO)
Listed Kawasaki Heavy Industries, Ltd.
-6

Feasibility study on waste utilization on palm oil refinery
(Entrusted) Kawasaki Heavy Industries, Ltd. March. 2001
Study purpose ;
This study intends to realize high conservation of fossil fuels consumed by the existing diesel generator & boiler and the reduction of methane gas discharged from palm waste by introducing a high-efficiency fluidized bed boiler co generation system to utilize palm waste to palm oil refinery. As a result, the much reduction of greenhouse gas can be expected.

N E DO- I C-00ER25
FeasibiIity Study onWaste Utilization of a Palm Oil Refinery
Marchx 2001
New Energy and Industrial Technologies Development Organization (NEDO)
Entrusted Kawasaki Heavy Industries, Ltd.

PREFACE

PREFACEThis report represents the results of the “Feasibility Study on Waste Utilization of a
Palm Oil Refinery”, which was carried out by KAWASAKI HEAVY INDUSTRIES, LTD.,
entrusted by New Energy and Industrial Technologies Development Organization
(NEDO), as a part of the “Basic Survey for Promotion of Joint Implementation, etc.” in
the 2000 fiscal year.
In the “Kyoto Protocol” which was adopted as the Third Conference of the Parties
(COPS) to the United Nations Framework Convention on Climate Change (UNFCCC)
held in Kyoto in December 1997, the “Targets for Greenhouse Gases Reduction” was
fixed, and as means of attaining the targets, the “Joint Implementation (JI)” system to
share among advanced countries the volume of Greenhouse Gases to be reduced, and
the system: “Clean Development Mechanism (CDM)” to be participated by both
advanced and developing countries, were also determined.
Japan, too, must take step forward to attain its targets with these systems utilized
positively. As a part of such steps, this feasibility study was carried out introducing a
co generation equipment with the fluidizer bed boiler using as fuel the palm waste
being dumped so far to the Lahad Datu works of the company: FELDA VEGETABLE
OIL PROEUCTS in Malaysia, which was intended for the promotion of energy
substantiation and which was also intended for the control of methane gas generated
from the dumped waste and was further intended for the reduction of CO2 discharge
originating from fossil fuel being used so far in the existing diesel generator and boiler,
to link it with the future CDM.
When such a co generation are introduced into FELDA VEGETABLE OIL PROEUCTS,
the subject company of this survey, the results are obtained such as it is feasible both in
technology and in economy or finance and it effect can also be expected in energy
substitution and in Green House Gases reduction, and moreover that it can contribute
to the prevention of the earth’s warming as well, with improvement in its economy.
The introduction of such co generation is expectable, in Malaysia, to other palm oil
companies, and other districts as well, because the palm oil industry holds a dominant
position in Malaysian industries and generates a great volume of palm waste, and
therefore, taking into account the conformance of such a project to the Malaysian energy
P-1

policy, such a project can be regarded as a scheme in which a great possibility of
materialization can be seen.
During the period of this survey technological interchange was made three times
between FELDA and our company and adjustments were also carried out through
hearing on technological items, field investigations at the enforcement site for the
power plant, draft making and discussions on the fundamental scheme, etc. In result,
a fundamental agreement was attained so as to direct their steps toward the realization
of the project could be reached.
March 3, 2001
KAWASAKI HEAVY INDUSTRIES, LTD.

A List of Investigators’ Names:
(KAWASAKI HEAVY INDUSTRIES, LTD.)
Role Name Belonging Sec./Dept Post• Business management /
Staff in charge of survey T.Arai Boiler Plant Dept. Senior Staff Officerimplementation
• Business management /Staff in charge of sales T. Michino Power Plant Sales Dept. 1 Senior Manager
• Business management /Assistant to staff in charge of M. Yamamoto Boiler Plant Dept. Utility Sect. Managersurvey implementation
• Supervisor in charge of engineering Y. Tsunematsu Boiler Plant Dept. Utility Sect. Staff" Officer• Supervisor in charge of sales MYamada Power Plant Sales Dept. 1 Senior Staff" Officer• Assistant to supervisor in charge TMizumoto Power Plant Sales Dept. 1 Staff Officer
of sales• Sales in charge T. Hamada Power Plant Sales Dept. 1 Attendant• Sales in charge T. Suzuki Power Plant Sales Dept. 1 Attendant• Combustion facility design YTanabe Boiler Plant Dept Utility Sect. Staff Officer• Staff in charge of overall project T. Miyoshi Boiler Plant Dept. Utility Sect. Staff'Officer
Boiler Plant Dept. Utility Sect.JL. JLkSWLiJLVX X
• Staff in charge of overall project Y.Yosino Boiler Plant Dept. Utility Sect. Attendant• Supervising of boiler facility H. Sasaki Boiler Plant Dept. Industrial
Sect.Manager
• Boiler facility planning Y.Miki Boiler Plant Dept. Industrial Sect.
Staff Officer
• Boiler facility planning in charge KSunaga Boiler Plant Dept. Industrial Sect.
Attendant
• Supervising of Control system S. Tanaka Power Plant E & C Dept Senior Manager• Control system planning T.Itoh Power Plant E &C Dept Manager• Electric and control system N. Wasada Power Plant E &C Dept Staff Officer
design in charge• Electric and control system T. Umeki Power Plant E & C Dept Assistant Manager
design• Supervising of combustion
systemN.Takahashi Research & Development
Dept.Senior Manager
• Supervising of analysis and test C. Kurata R&D Dept. Manager• Combustion system planning T.Ino R&DDept. Staff'Officer• Analysis and test in charge KTaniguchi R&D Dept Assistant Manager• Assistant to staff in charge of T.Aoki R&DDept. Attendant
engineering management• Crushing facility in charge K. Miyoshi Crushing Plant Div. R&D
Sect.Attendant
• Supervising of civil engineering H. Koike Production Control Dept Senior Managerand construction work planning
• Civil engineering and S. Ozaki Production Control Dept. Managerconstruction work planning
• Civil engineering and T. Zama Production Control Dept. Staff Officerconstruction work planning
• Supervising of tax system, etc S. Sakabe Control Dept. Senior Managersurvey
• Tax system survey and S. Sekikawa Control Dept. Assistant Managersubcontract in charge
• Cost calculation in charge T.Yasui Control Dept. Manager

CONTENTS
SUMMARY
CHAPTER 1 FUNDAMENTAL ITEMS OF THE PROJECT......... l-l1.1 Situations of Partner Country............................................................................ 1 — 11.1.1 An Outline of General Affairs........................................................................ 1 — 11.1.1.1 Territory........................................................................................................ 1 — 11.1.1.2 Location........................................................................................................... 1 — 11.1.1.3 Population....................................................................................................... 1 — 11.1.1.4 Races............................................................................................................... 1—21.1.1.5 Language ...................................................................................................... 1 — 21.1.1.6 Climate........................................................................................................... 1—21.1.1.7 Currency......................................................................................................... 1 — 21.1.1.8 Visa................................................................................................................... 1—21.1.1.9 Difference in Time ...................................................................................... 1 — 31.1.1.10 Religion............................................................................................................ 1 — 31.1.1.11 King.................................................................................................................. 1-31.1.1.12 Designations of Ranks.................................................................................. 1 — 31.1.1.13 Education........................................................................................................ 1 — 41.1.1.14 Number of Japanese Residents................................................................... 1—41.1.1.15 A Brief History............................................................................................. 1 — 51.1.2 Politics............................................................................................................. 1 — 61.1.2.1 Political System........................................................................................... 1—61.1.2.2 Federal Congress System........................................................................... 1 — 61.1.2.3 Political Parties............................................................................................. 1—61.1.2.4 Big Project Conceptions............................................................................. 1 — 71.1.2.5 Countermeasures in the Asian Currency Crisis.................................... 1 — 71.1.2.6 Mahathir Ism ............................................................................................... 1—81.1.2.7 Cabinet Members......................................................................................... 1—91.1.3 Economy................................................................................................................. 1 — 101.1.3.1 General Condition of Economy.................................................................... 1 — 101.1.3.2 Trade.................................................................................................................. 1-121.1.3.3 Recent Political and Economical Affairs................................................... 1 — 131.2 Palm Oil Industry in Malaysia........................................................................ 1 — 141.2.1 History and Present Status of Palm Oil Industry..................................... 1 — 141.2.2 Condition of Location for Palm Oil Mills..................................................... 1 — 161.2.3 Evil Influences of Palm Oil Mills and
Environmental Countermeasures................................................................. 1 — 16
— C— 1 —

1.3 Energy Conditions............................................................................................ 1 — 181.3.1 Change of Energy in Malaysia........................................................................ 1 — 181.3.2 Electric Power Situation in Malaysia............................................................ 1—201.3.2.1 Demand-and-Supply Balance of Electric Power....................................... 1 — 201.3.2.2 Controversial Points between Power Demand in Future
and Supply Reinforcing Programs................................................................ 1—201.4 Need of Project Linked with CDM, etc...................................... ...................... 1 — 221.4.1 Need of Project as Seen from Policy Side ................................................... 1 — 221.4.2 Prospect for Cooperation from Government............................................... 1 — 231.4.2.1 Pioneer Status.................................................................................................. 1—231.4.2.2 Investment Tax Allowance (ITA).................................................................. 1—231.4.2.3 Reinvestment Allowance (RA)...................................................................... 1 — 241.4.2.4 Favorable Treatment Actions for R & D ................................................... 1 — 241.4.2.5 Favorable Treatment Actions for Advanced-Technology Industry-----1 — 241.5 Necessity of Introducing Alternative Energy Technology
in the Industry as Object of Project.................................................................. 1—251.6 Meaning, Need and Effect of Project in Question and Spread in
Possibility of Similar Industry............................................................................ 1—26
CHAPTER 2 CONCRETIZATION OF PROJECT PLAN 2-12.1 Project Plan............................................................................................................ 2—12.1.1 Overview of the Project Site............................................................................ 2—12.1.1.1 Geography ........................................................................ ............................ 2—12.1.1.2 Climate and Rainfall Amount at Site ....................................................... 2—22.1.1.3 Population.......................................................................................................2—32.1.1.4 Project Site.......................................................................................................2—42.1.1.5 Power Demand...............................................................................................2—52.1.2 Contents of Project..........................................................................................2—62.1.3 Objective Green House Gases, etc. ............................................................. 2—72.2 Outline of Enforcement Site (Enterprise)..................................................... 2—82.2.1 Degree of Interest at Enforcement Site (Enterprise)...............................2—82.2.1.1 Outline of FELDA Group............................................................................ 2—82.2.1.2 Status of Earning Rate (Profit).................................................................. 2 — 102.2.1.3 Degree of Interest...........................................................................................2 — 102.2.2 Status of Applicable Facilities at Enforcement Site
(Enterprise)(Outline. Specification and Commissioning Status).............2—122.2.2.1 Outline of Palm Oil......................................................................................... 2—122.2.2.2 Overall Image of FELDA S ARAB AT COMPLEX.................................... 2-232.2.2.3 Palm Oil Mill..................................................................................................... 2-272.2.2.4 Refining Process............................................................................................... 2—312.2.3 Capability of Project Execution at Enforcement Site (Enterprise) 2—372.2.3.1 Technological Capability.................................................................................2—372.2.3.2 Management Capability................................................................................. 2—372.2.3.3 Administrative Foundation and Administrative Capability..................2—38
— C—2—

2.2.3.4 Funds bearing Capability............................................................................. 2—382.2.3.5 Manpower-bearing Capability.....................................................................2—392.2.3.6 Enforcement Organization...........................................................................2—402.2.4 Contents of Project at Enforcement Site (Enterprise) and
Modified Specification at the Applicable Facilities.................................2—412.2.4.1 Basic Plan and Policy on Project .............................................................2—412.2.4.2 Demand and Supply Balance of Power and Plant Steam after
Introduction of the Co-generation System............................................... 2—452.2.4.3 Properties of Fuel (Palm Waste).................................................................2—542.2.4.4 Confirmation Test........................................................................................... 2—572.2.4.5 Specification of Planned Facilities ' ........................................................2—742.2.4.5.1 Steam Condition......................................................................................... 2—742.2.4.5.2 Boiler..............................................................................................................2—782.2.4.5.3 Turbine ..........................................................................................................2—812.2.4.5.4 Generator......................................................................................................2—832.2.4.5.5 EFB Pretreatment Equipment.................................................................2—842.2.4.5.6 Flue Gas Treatment Equipment.............................................................2—1002.2.4.5.7 Feed Water and Cooling Water Facility................................................. 1 — 1032.2.4.5.8 Electrical and Instrumentation Equipment.........................................2—1062.2.4.5.9 Estimated Performance............................................................................. 2—1112.2.4.6 Civil Engineering/Construction Works..................................................... 2—1142.2.4.7 Outline of Transportation Plan .................................................................2—1162.2.5 Scope of Supply including Fund, Facility Equipment,
Service etc. provided by both Parties required forthe Applicable Project Enforcement........................................................... 2—118
2.2.6 Conditions on the Premise of the Enforcement of the Projectand Problems to be solved ............................................................................2—122
2.2.7 Project Enforcement Schedule......................................................................2—1232.3 Concretization of Fund Plan..............................................................................2—1252.3.1 Fund Plan required for the Project Enforcement.....................................2—1252.3.1.1 Required Amount of Fund ........................................................................2—1252.3.1.2 Procurement Method....................................................................................2—1262.3.1.2.1 Ordinary Procurement................................................................................2—1262.3.1.2.2 Expansion of Enterprise as a Joint Venture (JV) .............................. 2—1262.3.1.2.3 Grant of Economical and Environmental Cooperation
with Overseas Countries............................................................................2—1272.3.1.2.4 Un tied Bank Loan Granted by Japan Bank for
International Cooperation........................................................................2—1272.3.2 Prospect of Fund Procurement (Execution Plan of Investigation
Consignee and of Enforcement Site (Enterprise))...................................2—1282.3.2.1 Execution Plan of Investigation Consignee............................................2—1282.3.2.2 Execution Plan of Enforcement Site (Enterprise)................................. 2—130
— C—3—

2.4 CDM Condition and the Relating Matters...................................................2—1332.4.1 Setting of Project Enforcement Condition based on the Actual
State at Project Enforcement Site, Division of Work etc. and Adjusting Matters with the Other Country required for the successful Materialization of CDM................................................................2—133
2.4.2 Feasibility of Agreement concluded for the CDM of the applicable Project (Requirements that the Other Country may agree with the Way of Concepts of Other Country Government and of Enforcement Site (Enterprise) concerning the CDM)..................................................... 2—137
CHAPTER 3 EFFECT OF THE PROJECT.......................................3.1 Energy Substitution Effect................................................................................3.1.1 Technological Grounds for Producing the Energy Substitution Effect3.1.2 Base Line Forming the Basis for Computation of Energy
Substitution Effect (Concepts of Estimating the Energy Consumption in the Case where the Project is Not Executed).............
3.1.2.1 Concepts on Base Line Setting.................................................................3.1.2.2 Quantity of Fuel Used on the Base Line.................................................3.1.3 Practical Volume, Producing Period and Accumulated Volume of
Energy Substitution Effect (Effect when the Project has been executed)......................................................................................................
3.1.3.1 Concepts on Setting the Case of the Project Executed...................3.1.3.2 Practical Volume and Accumulated Volume of Energy
Substitution Effect: ................................................................................3.1.4 Practical Confirmation Method of Energy Substitution Effect3.2 Green House Gases Reduction Effect.....................................................3.2.1 Technological Grounds for Producing the Green House Gases
Reduction Effect......................................................................................3.2.2 Base Line Forming the Basis for Computation of Green House
Gases Reduction Effect (Concepts for Estimating the Discharge when the Project is not Executed)...................................
3.2.2.1 Concepts on Base Line Setting...........................................................3.2.2.2 Computation on Base Line...................................................................3.2.3 Practical Volume, Producing Period and Accumulated Volume of
Green House Gases Reduction Effect(Effect when the Project has been Executed) ....................................................................................
3.2.3.1 Concepts on Setting the Case of the Project Executed...................3.2.3.2 Practical Volume and Accumulated Volume of Green
House Gases Reduction Effect.............................................................3.2.4 Practical Confirmation Method of Green House Gases
Reduction Effect (Monitoring Method) .............................................3.3 Influence on Productivity............................................................................
3-13-13-1
3-13-1
3-103-10
3-113-173-18
3-18
3-183-183-19
3-203-20
3-22
3-273-28
— C—4—

CHAPTER 4 EARNING RATE 4-14.1 Economic Effect in Return on Investment..................................................... 4— 14.1.1 Case Patters for Trial Computation ............................................................. 4—14.1.2 Prerequisites for Trial Computation............................................................. 4—14.1.3 Results of Computation...................................................................................... 4—34.2 Effect VS. Cost ......................................................................................................4—264.2.1 Energy Substitution Effect..............................................................................4—264.2.2 Green House Gases Reduction Effect......................................................... 4—264.3 Others............................................................................ 4—27(Appended Document) Payback Period........................................................................4—28
CHAPTER 5 ASCERTAINMENT OF PROPAGATING EFFECT 5-15.1 Possibility of Technology Introduced by the Project to Spread in
the Country in Question....................................................................................5—15.2 Effect with Spread Taken into Account........................................................... 5—25.2.1 Energy Substitution Effect..............................................................................5—25.2.2 Green House Gases Reduction Effect........................................................... 5—2
CHAPTER 6 INFLUENCE OF PROJECT UPON OTHERS 6-16.1 Influence upon Environmental Aspect........................................................... 6—16.2 Influence upon Economical Aspect....................................................................6—26.3 Influence upon Social Aspect..............................................................................6—3
CHAPTER 7 OTHERS..............................................................................7-17.1 Palm Waste as a Fuel..........................................................................................7—17.1.1 Yield of FFB ......................................................................................................7-17.1.2 Yield of Palm Waste ........................................................................................7—17.1.3 Properties of Palm Waste................................................................................7—27.2 Effective Utilization of Palm Waste...............................................................7—37.2.1 Current EFB Utilization Status................................................................... 7—37.2.2 Current Palm Waste Utilization Status..................................................... 7—37.2.3 Power Generation Limit in Effective Utilization of Palm Waste.........7—47.2.4 Future Utilization Method of EFB............................................................... 7—4
CONCLUSION
LIST of REFFERENCES
APPENDIXAppendix — 1 : Report of the 1st Field Survey Appendix—2 : Report of the 2nd Field Survey Appendix—3 : Report of the 3rd Field Survey
— C—5“

SUMMARY

SUMMARY
1. Purpose of Survey
The palm oil industry in Malaysia holds a very weighty position in the country
and evils arising from the industry have also come into question.
EFB (Empty Fruit Bunches) have been disposed by incineration in palm oil mills
so far and the resultant ashes have been returned to plantations as manure.
However, since the particles of soot discharged from incinerators cause air pollution,
the palm oil mills constructed in and after 1993 have been prohibited from installing
incinerators.
Therefore most EFB discharged have been disposed by using for mulching
(composting) in plantations; however since circumferential mulching to individual
oil palm tree takes much labor, dumping on the sides of farm roads has increased,
causing secondary problems, such as spontaneous combustion n the dry season,
damage to fruits due to mass generation of beetles, etc. In contrast with the fact that
shells and boiler, as waste from palm oil mills, have already been used for boiler
burning as an electric energy and process steam source, EFB have not been used as
an effective energy source so far, because they have hard fiber and are big in shape
and appropriate pretreatment is indispensable before putting them into the furnace
owing to their water content more than 60 %, and further because the have the
property of heavy slogging due to the melting point as low as about 1,000° C of the
ash coming from them.
Such decaying treatment generates a great volume of methane as Green House
Gases.
If these EFB can be effectively used as biomass energy, such can contribute much
to the reduction of Green House Gases.
In this survey, a feasibility study was made on the project o introducing a
co generation equipment to use EFB effectively, into SAHABAT COMPLEX, SABAH
State, possessed by FELDA which is the largest company in the Malaysian palm oil
industry. The survey was carried out with a view to linking it with the Clean
Development Malaysian in this country.

Since this feasibility study conforms opportunely to the energy policy of the
Malaysian Government, the study came to be carried out not only on
Industry owned PP but also on IPP, at a request of the Ministry of Energy.
2. Objects of Survey
In this survey, a feasibility study was carried out, on the fluidized bed system and
on the stoker system, as the type of the EFB burning system for the boiler, in the
introduction of a co-generation equipment into FELDA SAHABAT COMPLEX in
SABAH State, Malaysia.
3. Results of Survey
As the result of this survey, the following became clear by introducing a
Industry-owned Power Plant having a generating-end output of 7,800 kW.
For reference, in the case of introducing a IPP co-generation having a
generating-end output of 16,000 kW the result are also represented.
1) Energy substitution effect (reduced to crude oil quantity during twenty years):
About 376 ktoe for Industry-owned PP with fluidized bed boilers!
About 363 k toe for Industry-owned PP with stoker boilers!
(for Reference)
About 695 k toe for IPP with fluidized bed boilers!
About 662 k toe for IPP with stoker boilers.
2) Green House Gases reduction effect (reduced to carbon dioxide quantity
during twenty years):
About 5,757 kt-COs for Industry owned PP with fluidized bed boilers!
About 5,478 kt -CO2 for Industry-owned PP with stoker boilers!
(for Reference)
About 11,654 kt-C02 for IPP with fluidized bed boilers!
About 10,970 kt-C02 for IPP with stoker boilers.
S-2

3) Profitability-
The IRR for each case before tax deduction and after tax deduction is as
shown in the following table:
Before tax deduction After tax deduction
Max. Min. Max. Min.
Industry owned
PP
Fluidized Bed Boiler 8.47% 3.32% 8.08% 3.32%
Stoker Boiler 7.50% 2.27% 7.20% 2.27%
(for Reference)
Before tax deduction After tax deduction
Max. Min. Max. Min.
IPP Fluidized Bed Boiler 14.64% 9.13% 13.59% 8.64%
Stoker Boiler 12.97% 7.71% 12.07% 7.38%
For these values, the profit life has been set ten years, as the same value as the
depreciation period for equipment in FEDLA, but realistically, the equipment in
question can be used indisputably more than ten years.
Accordingly, if the project life value is set longer, an equal amount of cash flow
will be kept for the prolonged period and the IRR will be further improved.
In Industry owned PP, all of generated energy is used within the private group,
and therefore, it is not needed to deny unconditionally the effect of investment into
the system even if the IRR value is lower than in IPP, because there is no such
indefinite factor which any third parties are concerned with, as electric energy
selling to the outside in IPP.
As shown above, the IRR for the case of IPP by the FBB system amounts to a
good value of about 14% at the maximum profit, and it amounts to a value
exceeding the open market rate even at the minimum profit.
S-3

4) Possibility of spread:
In the biomass energy policy of the Malaysian Government, many “favorable
treatment sections' are expected to be established, and taking the fact into
account, a great possibility of realization can be seen in the spread of similar
projects.
5) Influence to other aspects:
In the environmental aspect, the discharge of NOx, SOx and smoke dust can be
reduced.
IN the economical aspect, such project will contribute to industrial development
and employment promotion because more than half of required equipment in
value are expected to be supplied from Malaysia and neighboring countries, and in
addition, improvement in profitability can be promoted in the palm oil industry.
From the above, it can safely be said that to introduce in Malaysia the equipment
in question which was studied in this project, can produce a great measure of effect
in aspects, such as environmental problems, energy consumption efficiency and
cast reduction, and further that the project in question conforms to the energy
policy and environmental improvement policy of the Malaysian Government and
thus can meet various prior conditions to be required when any schemes for the
DDM are assumed.
Thus this project conforms surely to related policies in the Malaysian
Government, and when opinion was tapped on the project in question, the MOE
spoke: “Energy-sawing promotion and environmental improvement in the palm oil
industry are major items to be faced squarely by the Malaysian Government. We
are much interested in them and want to promote them together.” The DOE also
spoke: “We are much interested and will cooperate with you. Please promote them.
Let DOE serve as a monitor on the project in question.” Furthermore the Malaysian
Energy Center has also promised positively its wholehearted support toward the
realization of this project.
Also, Enforcement Site (Enterprise) has a great interest in this project.
S-4

The company is so enthusiastic that it has dispatched an investigation committee
to Denmark being an advanced country in biomass power generation, and has made
an on-site inspection of the rice hash burning power plant.
Great expectations are laid on this project which would enable the whole
company to save, even in future, the diesel oil consumed in the company, because
the whole of the area expected to be covered by power supply in this project belongs
to the same group companies.
Upon the pride as FELDA having the largest palm oil company in the world
largest palm oil country, the corporation intends to realize biomass power
generation developed from palm oil production for the first time in the world.
S-5

CHAPTER 1
FUNDAMENTAL ITEMS OF THE PROJECT
Abstract
In Malaysia, which promotes now industrial high-degree advancement and addedvalue
upgrading in line with the fundamental conception worked out by its government to
achieve its entry into the family of advanced countries before 2020, this project by which
an attempt is made to introduce the newest biomass power generation into the palm oil
industry being ranked as one of major primary products as important as crude oil in the
country, can be regarded as a very significant project conforming to the governmental
conception as well.
In executing a project, there are conditions peculiar to each country and the project can
never be realized without respect to such conditions. In this chapter, the general
situation of Malaysia, the palm oil industry and energy conditions in Malaysia, and the
meaning and needs of this project are mentioned.

CHAPTER 1 FUNDAMENTAL ITEMS OF THE PROJECT
1.1 Situations of Partner Country
1.1.1 An Outline of General Affairs
1.1.1.1 Territory
Malaysia is composed of Malay Peninsula and the northern part of Borneo Island.
The region of Malay Peninsula is called West Malaysia and consists of the special
district Kuala Lumpur as capital and 11 states. On the other hand, the northern
part of Borneo Island is called East Malaysia and consists of two states and the
Labuan district placed under federal direct control. The area of the territory is
329,758 km2, as the sum of 131,598 km2 for the peninsular region and 198,160 km2
for East Malaysia, and 70% of the total territory is forested.
Table 1.1.1.11 States of Malaysia
Name of State Name of State(West Malaysia)Kuala LumpurSelangorNegri SembilanMelakaJohorPahangPenangKedah
PerilsPerakKelantanTerengganu (East Malaysia)SabahSarawakLabuan
1.1.1.2 Location
The peninsular region is situated between 6° 43' N. (North Latitude) and 1°
16' N, and between 104° 17' E. (East Longitude) and 100° 8' E. East Malaysia
is situated between 7° 25' N. and 1° N., and between 119° 20' E. and 109°
40' E. The southernmost point is situated nearly right at the equator.
1.1.1.3 Population
The whole population is 23,250,000 by governmental estimation in 2000 and is
23,790,000 by governmental estimation in 2001. The population by ages gives a
breakdown of 33.9 % for 14 years and downward, 62.2 % for ages ranging from 15
to 64 years, and 3.9 % for 65 years and over. The population of the capital Kuala
Lumpur is about 1,280 thousand. 1-1)
— 1 — 1 —
1.1.1.4 Races
Malaysia is a multiracial country, which includes mainly people of Malayan
origin, Chinese origin and of Indian origin, and the rates of their populations are
about 60, 30 and 10 % respectively. In addition to these, there are people of
minority races including the people of European origin, the aborigines
“Orangasuli’s” in West Malaysia and the “Uru” tribesmen as natives in East
Malaysia.
1.1.1.5 Language
The national language is Malayan (provided in Article 152 of the Constitution).
In addition to this, English, Chinese and Tamil are used as official languages
among people of respective races, but English is deeply infiltrated under the
influence of the past British reign.
1.1.1.6 Climate
The country has a hot and humid tropical climate throughout the year and has a
violent squall frequently. The mean air temperature in the daytime is about 30
degree C, but it sometimes gets cold unexpectedly in the morning. There is no
sharp distinction between the rainy season and the dry season. However on the
east coast of West Malaysia, from November to February, the monsoon blows, it is
rainy and the waves are high; so that this season is usually referred to as the rainy
season. Yearly rainfall is 1,600 to 6,000 mm.
1.1.1.7 Currency
The unit for currency denominations is Malaysian Ringit (RM) or Malaysian
Dollar (M$). Since autumn of 1998, the Malaysian Government has adopted a
fixed exchange rate policy to the US dollar (the fixed rate is: 1 US$ = 3.8 RM). The
rate to the Japanese yen is 1 RM = about 32 yen (as of March 2001), but owing to
the fixed rate policy to the US dollar and a prohibitive action against overseas
carrying of RM s, RM s can not be used overseas but can be used only in Malaysia.
1.1.1.8 Visa
No visa for entry from Japan is needed if the entrant's stay is within three
months, but a six-months or longer residual validity time is required with the
passport. However for voyages with the object of conducting the operations
attended by compensations (as in the dispatch of supervisors), it is needed to
— 1 — 2 —

obtain work permits, as a rule.
1.1.1.9 Difference in Time
The difference from the Japan time is minus one hour. However it is felt as if
minus two hours, in bodily sensation, because the sun rises after seven a m. and
sets at about eight p.m. throughout the year. As a matter of fact, the difference in
time of Thailand being situated around the same east longitude as Malaysia, is
minus two hours from Japan. It is said that in Malaysia there were originally two
times: the West Malaysian time and the East Malaysian time, but that they were
standardized into them East Malaysian time which made a difference of minus
one hour from the Japan time.
1.1.1.10 Religion
The state religion is Islam believed in mainly by Malayans that account for 60 %
of the whole population. Buddhism or Christianity is believed in by people of
Chinese descent and Hinduism by people of Indian descent. Kelantan State in the
north of West Malaysia and Terengganu State situated on the east coast show an
especially marked Islamic color.
1.1.1.11 King
Of the 11 states in West Malaysia, nine states have a ruler called “sultan” each.
The title “sultan” is originally the title for the throne, which appeared in Arabia,
the birthplace of Islam. A council of the rules of the nine states is held every five
years, and one of the rulers is elected to king. It follows that the term of service as
king is five years; and fundamentally the order of undertaking this service has
been decided beforehand among the states. The king is called “Agon” in Malayan
and is a highly symbolic being like the Japanese ‘tenno" is. The king exercises his
power to appoint ministers, to open a session of the Federal Congress and to
dissolve the Congress, and his legislative power including consent to bills carried
by both Houses of the Congress, and he performs his diplomatic duties, such as
foreign travels, reception to the visits of foreign leaders, etc., and makes official
announcement on the fast which is the biggest event in Islam.
1.1.1.12 Designations of Ranks
The following designations of ranks exist in Malaysia and are still being used:
CD Tunku: put on princes, princesses & sultan's relatives in the first degree,
-1-3-

(2) Raja: given to persons blood related to the royal family
(3) Tun: the highest rank given to persons other than the members of the
royal family,
(D Tan Sri: the second rank given to persons other than the members of the
royal family,
(5) Dato, Datuk: the third rank given to persons other than the members of the
royal family,
© Haji: given to persons who made a pilgrimage to Mecca and practiced
asceticism,
(7) Encik, Tuan: meaning “Mr.”,
© Cik, Puan: meaning “Mrs.”
The designations, “Tun”, “Tan Sri” and “Dato (Datuk)” are given to persons who
contributed to the nation or region, socially or economically or otherwise, and if
such a designation is given to a married person, an equal special designation will
be given to the person’s spouse as well. As a matter related to names, Malayans
have no surname, but their names are expressed as “So-and-so (first name) son
(daughter) of so and so (parent's name)”. For instance, if a man is “Ahmad” being a
son of his father named “Dato Ismail”, his name is expressed as “Ahmad bin Dato
Ismail” (where “bin” means “son of).
1.1.1.13 Education
The educational system and the percentage of school attendance are as follows:
School Level Educationalsystem
Percentage of School Attendance
Elementary school 6 years 97%
Junior high school 3years 83%
Senior high school 2 years 55%
Preparatory course for univ./coll. 2 years 22%
U niver sity/colle ge 3years 3.7%
1.1.1.14 Number of Japanese Residents
The number of Japanese residents increased rapidly from 1990 till 1998,
amounting to 11,726 in 1998. More than 7,600 center on the capital Kuala Lumpur
and Selangor State, and secondly 1,380 live in Penang State and 1,170 in Johor
State. Seeing the number of Japanese-affiliated invading enterprises by types of
— 1 — 4 —

industry, those of the manufacturing industry account for a little under 60 % of the
whole; those of commerce amount to about 15 %', those of construction and plant
industry amount to about 8 %; and the others the rest.
As to schools for Japanese, there are three elementary/junior-high schools in the
peninsular region, a school of the same kind in East Malaysia, and only one
kindergarten in Kuala Lumpur. The number of pupils amounts to about 1,500 in
all (as of May 1999).
1.1.1.15 A Brief History
Table 1.1.1.151 A Brief History of Malaysia 12)
Year Political Power Event1405 Melaka Kingdom comes into the world.
1511 Melaka Kingdom is captured by Portugal.
1641 The territory is captured by Holland in place of Portugal
1824 The territory is captured by England in place of Holland.
1867 England colonializes the whole territory of Malaysia.
1941 With the outbreak of Pacific War, the Japanese forces capture the Malay Peninsula.
1945 The territory comes again under the rule of England (UK) with Japan’s defeat.
1957 Malay Peninsula and Singapore Island become independent as the Federation of Malaya.
1958
1963
A Rahman assumes office as the 1st Prime Minister
The northwest part of Borneo is annexed and the Federation of Malaysia comes into the world.
1965 Singapore becomes independent and the present territory is fixed.
1969 Razak assumes office as the 2nd Prime Minister
A collision takes place between people of Malayan origin and people of Chinese origin on 13th May
1976 Fseion assumes office as the 3rd Prime Minister
1981 Mahathir assumes office as the 4th Prime Minister
— 1 — 5 —

1.1.2 Politics
1.1.2.1 Political System
The political system is a constitutional monarchy and the present Mahathir Power
has been maintained for more than 19 year as the political power which has lasted
longest among the powers of incumbent leaders in Southeast Asia, since Mahathir
assumed office as the first prime minister coming from any classes other than the
royal family.
1.1.2.2 Federal Congress System
The Federal Congress of Malaysia is divided into the Upper House and the Lower
House, which are called “Dewan Negara” and “Dewan Racat” respectively. The
Upper House has 68 seats with the term of membership of six years, and is
composed of 42 intelligent members nominated by the king and 26 members
selected from state assemblies. Similarly to the House of Councilors in Japan, the
Upper House has narrower limits of power than the Lower House. The Lower
House has 193 seats and its members are elected by nation’s direct vote, like in the
House of Representatives of Japan, from 192 small electoral districts covering the
whole country. Both the election by state assemblies and the election for the Lower
House are carried out every five years.
1.1.2.3 Political Parties
The Government party in Malaysia is “Balisan National” (meaning National
Front; Abbreviation: BN), and BN holds 148 of 193 seats in the Lower House. The
parties composing BN are as follows:
UMNO BARU (meaning New Unified Malayan National Organization),
MCA (Malaysian Chinese Association),
MIC (Malaysian Indian Council),
PPP (People’s Progress Party),
GERAKAN (meaning People’s Movement Party),
HANIM (HANIM Party),
AKAR (meaning Peoples Righteous Movement Party),
PBB (meaning Sarawak Bumiputra Conservative Party),
SNAP (Sarawak National Party),
SUPP (Sarawak Unified People’s party),
— 1 —6 —

and two other parties;
Thus 12 parties in all are included.
On the other hand, nongovernment parties are DAP (Democratic Action Party)
having 10 seats, PAS (meaning All-Malaysian Islam Party) having 27 seats, PBS
(meaning Sabah Unification Party) having 3 seats and KEADILAN having 5 seats.
DAP is a party being based on support from urban Chinese, and PAS is a
nationwide party rich in Islamic traditional color. As the result of the 2000 election,
PAS has held a majority in Kelantan State and Terengganu State, and the
Government party is under extreme uneasiness at the fact that Terengganu State,
which is the center of oil bases supporting the obtaining of foreign money in
Malaysia, has been placed under PAS' s command.
1.1.2.4 Big Project Conceptions
In order to prevent the recurrence of the same affair as the great collision between
Chinese and Malaysian in May 1969, which was the biggest recial dispute in
Malaysian history, Premier Mahathir set forth many big project conceptions with
the view of raising people’s consciousness of brethren and their pride. The national
car “Proton”, the national bike “Modenas”, the induction of “Commonwealth
Games”, the construction of a FI circuit, the Kuala Lumpur City Center project,
MSC (Multimedia Super Corridor), etc. are good examples.
As to the “Vision 2020” to aim at Malaysia’s entry into the family of advanced
countries before 2020, the prime minister himself keep on serving as flagman
toward its success, and its slogan “Malaysia Bore” means: “It is possible if
Malaysians do it” in Malayan.
1.1.2.5 Countermeasures in the Asian Currency Crisis
On the occasion of the currency crisis and subsequent economic depression,
Premier Mahathir attracted public attention by criticizing the speculator, Mr.
George Solus, with his name designated, and he also astonished the world by
working out suddenly in 1998 a fixed exchange rate system to the US dollar and a
prohibitive policy against the overseas carrying of RM’s over a specified amount,
after declaring that economic restoration will be promoted independently without
receiving support from the International Monetary Fund (IMF). These policies are
said to be based on advice from Minister of Finance, Tun Daim Zainudin.
Though the sudden policies around criticism from foreign countries, the rate of
— 1 — 7 —

Malaysia's economic growth has been recorded as 5.8 % in 1999 and 11.9 % in the
first quarter of 2000. This shows a tendency to recover steadily in economics, and
high appraisals have been centered again on the determination of Premier
Mahathir.
1.1.2.6 Mahathir Ism
Whereas Premier Mahathir is sometimes subjected to criticism, this is owing to
his unswerving faith and self confidence, his almost too strong leadership and his
astonishing determination; and thus his high capability is beyond question and he
can be regarded as one of representative leaders in the world. The former Deputy
Prime Minister, Anwar, who had been regarded as successor of Premier Mahathir,
was dismissed and no candidate for the next Prime Minister has been fixed.
Nevertheless Premier Mahathir declares he will retire at once if his successor is
found. What is required from his successor is to succeed the powerful Mahathir Ism
to enable the realization of Malaysia’s entry into the family to advanced countries
before 2020 (though Premier Mahathir says his successor is not necessarily of the
same type as himself), and it seems the influencing power of Premier Mahathir will
not fade away from Malaysia for the time being.
-1-8-

1.1.2.7 Cabinet Members
The present cabinet members are as follows:
Table 1.1.2.7-1 Malaysian Cabinet
(As of Jan/2000)
Ministry Ministry
Prime Minister Datuk Seri Dr. Mahathir Mohamad
Deputy Prime Minister Datuk Seri Abdullah Ahmad Badawi
Special Function & Finance Tun Dain Zainuddin
T ransport Datuk Seri Dr. Ling Liong Sik
Works Datuk Seri S. Sarny Vellu
Primary Industries Datuk Seri Dr. Lim Keng Yaik
Energy, Communications & Multimedia Datuk Leo Moggie
International Trade & Industry Datuk Seri Rafidah Aziz
Defence Datuk Seri Najib Tun Razak
Science, Technology and Environment Datuk Seri Law Hieng Ding
Foreign Datuk Seri Syed Hamid Albar
Domestic Trade & Consumer Affairs Tan Sri Muhyiddin Yassin
Health Datuk Chua Jui Meng
Land and Cooperative Development Tan Sri Kasitah Gaddam
National Unity & Community Development Datuk Dr. Siti Zaharah Sulaiman
Information Tan Sri Khalil Yaacob
Culture, Arts & Tourism Datuk Abdul kadir Sheikh Fadzir
Human Resources Datuk Dr. Fong Chan Onn
Housing & Local Government Datuk Ong Ka Ting
Entrepreneur Development Datuk Nazri Abdul Aziz
Rural Development Datuk Azmi Khalid
Youth and Sports Datuk Hishamuddin Tun Hussein
Agriculture Datuk Effendi Norwawi
Education Tan Sri Musa Mohamad
Prime Minister’s Department Datuk Dr. Abdul Hamid Othman
Prime Minister’s Department Datuk Pandikar Amin Mulia
Prime Minister’s Department Tan Sri Bernard Dompok
Prime Minister’s Department Datuk Rais Yatim
— 1 — 9—

1.1.3 Economy
1.1.3.1 General Condition of Economy
The Malaysian economy attained its growth worth recording, as high as 8 to 9 % in
annual mean value, during the period from 1988 to 1997. This growth brought
about a remarkable rise in real wages, a sudden extension of the export of
industrial products, and an inflow of enormous investment by foreign investors.
Especially, into the takeover of enterprises, excessive investments suggestive of the
bubble period in Japan were made, and the financial crisis brought about from 1997
to 1998, shocked the Malaysian economy to make its footing unsteady at a heat.
The Government’s drastic introduction of the fixed exchange rate system to the US
dollar and the prohibitive action against overseas remittance, minimized damage
due to a fall in the exchange rate, while on the other hand owing to sudden
depreciation of currency and in the stock market, the national budget which was
5.5 % of GDP in 1997 was drived down to 3 % in 1998 through a strict curtailment
of expenditures, in order to reduce shortage in the current account. Accordingly the
Government determined a reduction up to 20 % of annual expenditure, a restraint
on large-sum imports and the postponement of large-scale undertakings. On
account of the Government’s reduced budget and slowdown in economic growth,
bankruptcies increased and the jobless increased in number in 1998 and 1999. The
rate of economic growth in Malaysia sinked to about 4 % in 1998 and 1999.
However the signs of economic recovery have come to be surely shown and the rate
of economic growth in 2000 forecasted by the Government is 5 %.
— 1 —10—
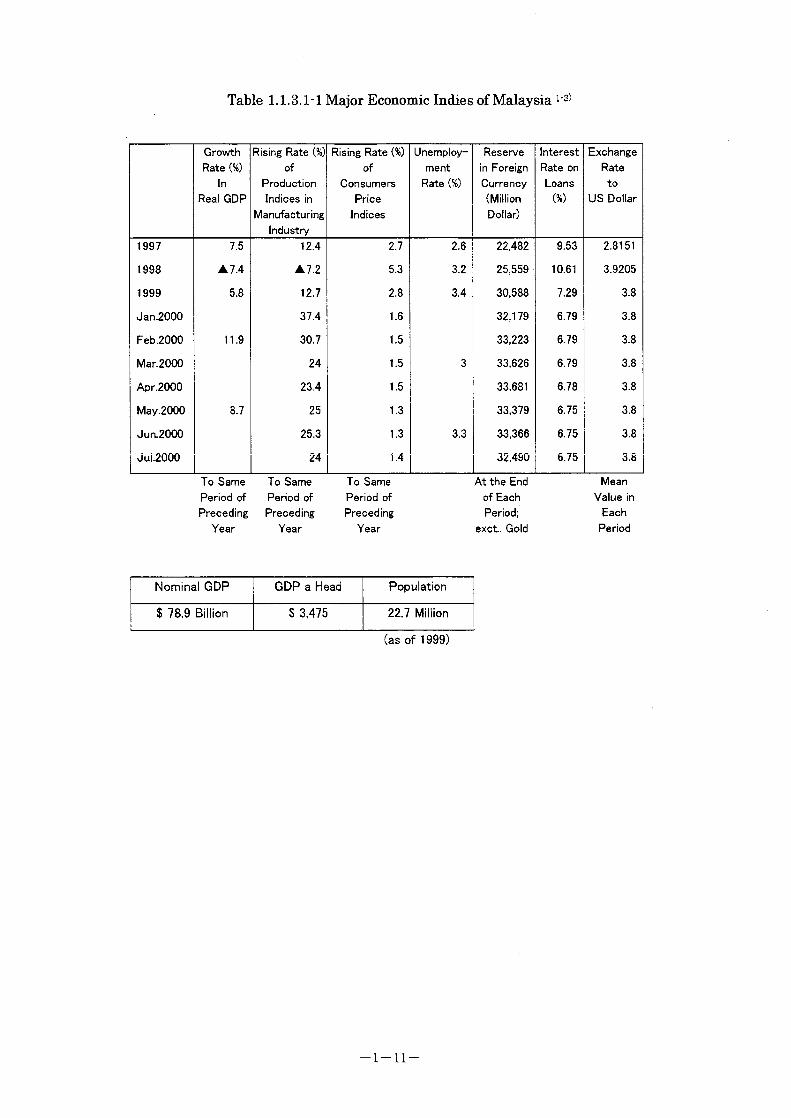
Table 1.1.3.11 Major Economic Indies of Malaysia v3)
Growth Rate (%)
InReal GDP
Rising Rate (%) of
ProductionIndices in
Manufacturing Industry
Rising Rate (%) of
ConsumersPrice
Indices
Unemployment
Rate (%)
Reserve in Foreign Currency (Million Dollar)
InterestRate onLoans
(%)
ExchangeRateto
US Dollar
1997 7.5 12.4 2.7 2.6 22,482 9.53 2.8151
1998 A 7.4 A7.2 5.3 3.2 25,559 10.61 3.9205
1999 5.8 12.7 2.8 3.4 30,588 7.29 3.8
Jan.2000 37.4 1.6 32,179 6.79 3.8
Feb.2000 11.9 30.7 1.5 33,223 6.79 3.8
Mar.2000 24 1.5 3 33,626 6.79 3.8
Apr.2000 23.4 1.5 33,681 6.78 3.8
May.2000 8.7 25 1.3 33,379 6.75 3.8
Jun.2000 25.3 1.3 3.3 33,366 6.75 3.8
Jul.2000 24 1.4 32,490 6.75 3.8
To Same Period of Preceding
Year
To Same Period of Preceding
Year
To Same Period of Preceding
Year
At the End Meanof Each Value inPeriod; Each
exct. Gold Period
Nominal GDP GDP a Head Population
$ 78.9 Billion $ 3,475 22.7 Million
(as of 1999)
-1-11-

1.1.3.2 Trade
The gross exports and gross imports of Malaysia in 1999 and in 2000 are as follows
according to the Government’s estimation:
In 1999, exports are 81,200 million US dollar and
Imports are 63.400 million US dollar;
In 2000, exports are 89,100 million US dollar and
Imports are 71,000 million US dollar.
The main exported goods are industrial products, palm oil, petroleum, wood and
woodwork, and rubber; and the major partner countries as destinations are ASEAN
(23.1 %), US (22.4 %), EU (15.8 %) and Japan (11.5 %).
The main imported goods are industrial semi manufactured goods, capital goods
and consumption goods; and as to the trade partners, import from ASEAN (20.8 %),
Japan (20.8 %), US (17.8 %), EU (11.5 %) is prominent.
— 1 —12 —

1.1.3.3 Recent Political and Economic Affairs
Table 1.1.3.3 -1 Recent Political and Economic Affairs 12)
Year Month Affairs
1990 Oct. A general election; the Government party UMNO gets the 2/3 stable majority. Labuan Island is designated as an Offshore Center.
1991 Feb. “Vision 2020” is released (to aim at Malaysia’s entry into the family of advanced countries before 2020).
Jun. National Development Policy (NDP) is released.1992 Dec A violence event by the sultan of Johor State is revealed and developed to an
issue on the forfeit of sultans’ privileges.1993 Mar. The Constitution is reformed on sultans’ privileges.
Nov. A staff election in UMNO; Anwar assumes office as Vice-president.Dec. Anwar assumes office as Deputy Prime Minister.
1994 Dec. The Foreign Exchange Act is amended.1995 Apr. A general election; the Government party BN wins a sweeping victory.1996 May. The 7th Malaysia Plan is released.
Aug. On “Multimedia Super Corridor”, the Government’s Keynote and the details of its favorable treatment actions are released.
Oct. A staff election in UMNO; Mahathir as President and Anwar as Vice-president are reelected without vote.
Dec. The 2nd Industrial master Plan (IMP2) is released.1997 Jul. Asian currency falls, originating from the shift of the exchange rate system for
the Thailand’s Baht to the floating system.Ringgit (RM) reaches the lowest rate in history: 4.895 RM to the US dollar, on 7th Jan. 1998.
1998 May. In the first quarter of 1998, growthrate in GDP reaches minus 1.8 %, which is the worst minus growth unprecedented since 1985.
Jun. The new international airport opens.Sep. Capital restraints are introduced; the fixed exchange rate system for the
Ringgit (RM) is introduced; the Commonwealth Games are held.Deputy Prime Minister Anwar is dismissed.
1999 Jan. Abdullah assumes office as Deputy Prime Minister.Feb. Capital restraints are relaxed in part. (Exit levy is introduced.)Sep. Capital restraints are relaxed again. (Exit levy is changed in part.)
1.2.2 Condition of Location for Palm Oil Mills
Since a large quantity of water is needed in the process of palm oil extraction, palm
oil mills are usually constructed near rivers having sufficient water. Generally, 1.5
m3 water is needed to refine one ton palm oil from FFB (Fresh Fruit Bunches).
In addition, as FFB must be efficiently collected in a wide expanse of plantation, it
is to be desired that the mill is located in the center of a plantation.
It is most important to secure wide lands, as a matter of course; therefore most
mills are necessarily located not in urban areas but in the out-of-the-way interior.
1.2.3 Evil Influences of Palm Oil Mills and Environmental Countermeasures
Since the waste water from palm oil mills include many organic matters, serious
water pollution will be aroused if the water is discharged in rivers as it is without
treatment. If a palm oil mills is located along a river, there is a fair possibility of
people living downstream to be affected by the mill.
As a countermeasure against the above, the Malaysian Government established and
the standard for waste water treatment has been set.
Another big evil influence is air pollution. After oil has been extracted from FFB,
fiber, kernels, shells and EFB (Empty Fruit Bunches) are left Fiber and shells are
used as fuel for boilers to generate steam and electricity, and kernels are hand EFB
were burnt in fields before to turn them into ashes usable as manure, but field
burning is now prohibited because it generates a large quantity of smoke and dust.
To serve as manure in place of ashes, EFB are used for mulching in plantations so
as to turn to clay slowly. However in addition to leisureliness in such a method of
disposal, EFB as much as about 23 % of FFB are generated, and thus some
producers who dump them unlawfully in other places, have begun to appear
hindered by spatial limits for mulching. Though the mills are located deep in the
mountains, such unlawful dumping are performed in places lying deeper, so as not to
be detected. In results, aborigines who keep living in traditional ways from ancient
times have been affected by the dumping, and criticism as public opinion has begun
to arise.
1-16

It is considered as an ideal solution to burn EFB without emitting smoke and dust
to utilize the heat as energy and to utilize ashes for manure.
— 1 — 17

1.3 Energy Conditions
1.3.1 Change of Energy in Malaysia
Malaysia depended on petroleum for 75 % of its total energy demand in 1990.
However in the 6th Malaysia Plan for the period from 1991 to 1995, the Government
advanced a breakaway from dependence on petroleum and a switchover to stable
and efficient energy. The aim is to slough off the biased dependence on one king of
energy source, by well-balanced utilization of four major energy sources: petroleum,
natural gas, coal and water power.
The final commercial energy demand in Malaysia, which had been dashing up the
stairs of high growth at that time, increased suddenly at a mean rate of 8.6 % per
year during the period.
Table 1.3.1-1 Final Commercial Energy Demand by Sources 16)
(1990-2000)
Source 1990 1995 2000Average Annual Growth Rate (%)
PJ % PJ % PJ % 6MP 7MP
Crude Oil & Petro. Products 414.0 74.9 561.7 67.1 777.5 60.8 6.3 6.7Natural Gas 45.7 8.3 103.5 12.4 188.1 14.7 17.8 12.7Electricity 71.8 13.0 131.4 15.7 221.8 17.3 12.8 11.0Coal & Coke 21.5 3.9 40.1 4.8 92 7.2 13.3 18.1
TOTAL 553 100 836.7 100 1279.4 100 8.6 8.9Per Capita Consumption
(gigajoules) 28.9 41.1 56.1 6.6 6.4Notes:1) Refers to the quantity of commercial energy delivered to final consumers but excluded gas, coal and
fuel oil used in electricity generation.2) Joule is the unit of energy to establish the equivalent physical heat content of each energy form.
One megajopule = 10° joules, one gigajoule (GJ) = 103 Joules and one petajoule (PJ) = 10' 5 joules and one PJ = 0.0239 million tones of oil equivalent (mtoe). One toe = 7.6 barrels.
3) Includes natural gas used as fuel and feedstock consumed by the non-electricity sector.4) 6MP: The 6th Malaysia Plan, 7MP: The 7th Malaysia Plan.
(Drawn from the 7th Malaysia Plan)
Seeing the demand by sectors, the maximum energy consumption is shown in the
sector connected with transportation, which amounts to 39.1 % of the total energy
demand in 1995 fiscal year. In the sector connected with transport, energy
consumption increased rapidly because automobiles grew in number at a rate of 7 %
per year at that time owing to success in the people’s car project. Energy
consumption in the sector of the manufacturing industry rose at a rate of 9.7 % per
— 1 —18 —

year with the pursuit of added value in the sector.
Table 1.3.1-2 Final Commercial Energy Demand by Sectors v6)
(1990-2000)
Source 1990 1995 2000Average Annual Growth Rate (%)
PJ % PJ % PJ % 6MP 7MP
Agriculture & Forestry 32.8 6.0 52.7 6.3 63.4 5.0 9.9 3.7Mining & Quarrying 25.7 4.6 34.4 4.1 50.0 3.9 6.0 7.8Manufacturing 187.8 34.0 298.7 35.7 488.7 38.2 9.7 10.3Transport 220.9 40.0 326.7 39.1 490.1 38.3 8.1 8.4Commercial 23.9 4.3 34.7 4.1 53.3 4.2 7.7 9.0Residential 43.4 7.8 51.5 6.2 64.4 5.0 3.5 4.6Non-Energy 18.5 3.3 38 4.5 69.5 5.4 15.5 12.8
TOTAL 553 100 836.7 100 1279.4 100 8.6 8.9(Drawn from the 7th Malaysia Plan)
The state-operated petroleum public corporation, Petronas, which generalizes
petroleum and natural gas operations, took rapid actions to support the
Governmental policy, with the result that switchovers among energy sources shown
in the following table has been realized.
Table 1.3.1-3 Primary Commercial Energy Supply by Sources 16)
(1990-2000)
Source 1990 1995 2000Average Annual Growth Rate (%)
PJ % PJ % PJ % 6MP 7MP
Crude Oil & Petro. Products 520.2 71.4 746.1 55.3 943.2 49.4 7.5 4.8Natural Gas 114.4 15.7 456.4 33.8 793.9 41.6 32.0 11.7Hydro 38.3 5.3 52.8 3.9 53.5 2.8 6.6 0.3Coal & Coke 55.5 7.6 93.2 7.0 117.9 6.2 10.9 4.8
TOTAL 728.9 100 1384.5 100 1908.5 100 13.1 7.2(Drawn from the 7th Malaysia Plan)
As found from the above table, worthy of special mention is the growth rate of the
switchover to natural gas. The reserves of natural gas in Malaysia are said to be
corresponding to its supply for 75 years. The abundant reserves and the execution of
the scheme of laying the natural gas pipeline through the peninsula which was
carried forward during the period, contributed greatly to the switchover to natural
gas. And coal supply which depends wholly on import, also showed high growth.
— 1 —19—

1.3.2 Electric Power Situation in Malaysia
1.3.2.1 Demand and Supply Balance of Electric Power v7)
The total electric power demand in West Malaysia in the first quarter of 2000, is
about 9,700 MW at peak hours, and the total capacity of power generating facilities
is about 11,800 MW at the same point of time. About 65 % of the capacity is covered
by the facilities of the electric power company TNB (Tenaga National), and at the
rest is covered by private IPP.
It is said that about 30 % is usually appropriate for the margin rate of power
generation capability to power demand. The margin rate at the above point of time
is a low value of about 21.5 % and in addition, the real power supply capability is
lower than the capability of power generating facilities by technical or
non technical losses existing.
In Malaysia, a large-scale power outage throughout the peninsula broke out two
times in the past, and its reccurence is still apprehended. In addition to outages,
the problem of what is called the “quality of electric power”, which causes
instantaneous voltage drops frequently, is affecting production in many plants.
1.3.2.2 Controversial Points between Power Demand in Future and
Supply Reinforcing Programs
According to the power station buildup program of TNB, it has been expected that
the 30 % margin rate can be kept for the time being, if the 3rd phase (500 MW X 2)
of the construction of Kapa Power Station starts in 1998. However the construction
has been delayed largely, and the prospect for the startup of operations is still far
from certain. Granting that the operation starts sooner or later, the program has
been so formulated that there will be no increase in power generation capability
thereafter till Denkir Power Station (350 MW) starts operation in 2002. (See
Fig.1.3.2.2-1.)
However power demand in Malaysia is expected to grow at a rate of 7 to 9 % per
year, and there is much possibility of power conditions being left precarious till the
4th quarter of 2002.
— 1 — 20—

1.4 Need of Project Linked with CDM,etc.
1.4.1 Need of Project as Seen from Policy Side
The Malaysian Government has already worked out the following policies related
closely with this project:
(1) In 1991, the “Vision 2020” to aim at Malaysian’s entry in the family of
advanced countries before 2020, was released.
(2) In 1996, the 2nd Industry Master Plan (IMP2) was made up, in which the
palm oil industry was ranked as an important strategic industry.
(3) In 2000, the 8th Malaysia Plan was made, in which renewable energy
sources are prearranged to be introduced with the target year set at 2005
and among then special energy has been thrown into biomass power
generation with an action plan made on it.
For the purpose of putting these plans in action, the Malaysian Palm Oil Board
(MPOB) was established with the Palm Oil Registration and Licensing Authority
(PORLA) and the Palm Oil Research and Development Institute of Malaysia
(PORIM) united into one organization, to strengthen support to the palm oil industry,
and in addition, on the introduction of favorable treatment actions in biomass power
generation, adjustments were made among the organs concerned and mutual
consent was reached, leaded by the MOE.
Since EFB, which are disposed be caused of their unsuitability to fuel for general
boilers, have the problem of methane gas being generated in the places of disposal
and that of soot and smoke being generated from field burning, the co-generation by
effective utilization of palm waste (EFB, fiber, shell, etc are residues after oil
squeezing from FFB), which is an energy source alternative to fossil fuel in the
meaning as a disposing method of low pollution, is being marked by the Department
of Environment (DOE) as well.
Thus this project conforms surely to related policies in the Malaysian Government,
and when opinion was tapped on the project in question, the MOE spoke:
“Energy-sawing promotion and environmental improvement in the palm oil industry
are major items to be faced squarely by the Malaysian Government. We are much
interested in them and want to promote them together.” The DOE also spoke: “We
are much interested and will cooperate with you. Please promote them. Let DOE
serve as a monitor on the project in question.” Furthermore the Malaysian Energy
-1-22-

Center has also promised positively its wholehearted support toward the realization
of this project.
In this way Malaysia has fully taken into consideration the national interest of its
own country from participation in the CDM, and it can be considered that Malaysia
is ready to participate as an activity under the CDM whenever any effective project
is given.
Accordingly it may be said that the need of this project linked with the CDM is
extremely high.
1.4.2 Prospect for Cooperation from Government
As to the prospect for cooperation from the Government, various favorable
treatment policies for investment have been framed 12), and by obtaining license
from the Malaysian Industry Development Agency (MIDA), the following favorable
treatments can be received:
1.4.2.1 Pioneer Status
This is a system to be given to the encouraged businesses and encouraged
production items specified by Minister of Trade and Industry, and an enterprise
whose Pioneer Status has been approved can receive the favor of partial exemption
from taxation upon imported equipment. Particularly Sabah State where the
proposed project site: Sahabat Complex is situated, has been designated as a
specially encouraged area, and there is much possibility of an additional favorable
treatment being given. The favor in taxation is exemption for 5 years of the
cooperation tax on 70 % of the legal income.
1.4.2.2 Investment Tax Allowance (ITA)
(D Period: 5 years (Reckoning of losses may be deferred)
(2) Favor in taxation: Up to 60 % of qualified capital disbursement is deductible
from income with a limit of 70 % of the legal income. (The deductible sum
remaining after deduction in the fiscal year under review, is kept deductible in
subsequent years.)
(3) To the enterprises having Pioneer Status, which have extended their business
to the east coast of West Malaysia and/or East Malaysia in order to expend
— 1 — 23 —

industrial areas, tax exemption on 85 % of the legal income is applied for 5
years (70 % for other areas). And to the enterprises to which ITA is applied,
80 % deduction from the income tax is basically applied, and the deductible
sum in each fiscal year is raised up to 85 % of the legal income.
1.4.2.3 Reinvestment Allowance (RA)
This is approved on the projects for expansion or modernization of the present
business of for multification of business, which are executed by resident corporations
in the manufacturing industry, agriculture and fishery. This allowance amounts up
to 660 % of the qualified disbursement. In general, this allowance is limited to 70 %
of the legal income. However to companies making reinvestments in specific areas of
East Malaysia and of the east coast of West Malaysia, allowances amounting up to
100 % of the legal income are approved. The deductible sum remaining after
deduction is kept deductible in subsequent years till the total deductible sum is
deduced.
1.4.2.4 Favorable Treatment Actions for R & D
To encourage research and development (R & D), there are various favorable
treatment actions. (Double deduction for R & D, investment tax allowance,
industrial allowance, etc.)
1.4.2.5 Favorable Treatment Actions for Advanced-Technology Industry
Advanced-technology enterprises are those engaging in the encouraged business
and in manufacture of encouraged products, in the field of new advanced
technologies, and a favorable treatment system to these enterprises also exists.
Since this project can also be interpreted as a new advanced technology, the
possibility of this favorable treatment action being applied to it is also undeniable.
-1-24-

1.5 Necessity of Introducing Alternative Energy Technology in the Industry as Object of
Project
As mention the above, palm oil mills are usually located far from the national grid,
larger mills are more so, due to their physical reasons so that they have to establish
in-house power generation facilities. Necessary electric power for the oil squeezing
process depends on diesel generators while necessary steam is supplied from the
boiler that are fueled by palm fiber and shell of which easily combusting.
The squeezed oil at palm oil mills is called as crude palm oil (hereafter as CPO),
semi product situation, so that they are required to refine for the final product. CPO
is collected from each palm oil mill to a refinery factory by truck of which CPO has to
refine for being final product. However, the refinery factory doesn’t have palm shell
for boiler fuel so that it has consumed a large quantity of diesel oil for boiler that
requires to generate steam for refinery process and for operation of diesel generator
that requires for obtaining electric power. But consuming diesel oil directly reflects on
the cost of final product.
In 1999, about 10 million ton crude palm oil in all was produced from about 57
million ton FFB, and as EFB amount to approx. 23 % of FFB, it follows that about 13
million ton EFB were generated as biomass waste in 1998.
The quantity of energy to be obtained from the total volume of EFB generated in
Malaysia, amounts to 2 million ton in the quantity of alternative oils, according to
investigation by the Malaysian Palm Oil Association. It is said that this corresponds
to 6 % of the energy needed in the whole of Malaysia. It is a fair loss to the country to
nullify the source of such a large volume of energy as before, and it can be considered
that it is necessary to utilize EFB as an alternative energy source in order to
strengthen the international competitive position in prices, of Malaysian palm oil
which is an important major export item.
— 1—25 —

1.6 Meaning, Need and Effect of Project in Question and Possibility of Spread in Similar
Industry
There were 328 palm oil mills in Malaysia as of 1998: 75 % of them in West
Malaysia and 25 % in East Malaysia. The FFB processing capability is 20 to 90 ton
per hour, though it varies with mills, and more than 60 % of all mills have capability
not less than 30 ton per hour.
‘30 ton per hour' means an EFB processing capability of 260 thousand ton per year
at 24-hour and 365-day operation, with EFB generation of 60 thousand ton per year.
About 200 thousand ton EFB per year are needed for 7 MW power generation,
though it varies with generation capabilities in private power generation; therefore it
follows that needed EFB can be secured if they are collected from 4 to 5 mills with a
scale of 30 ton per hour.
If this project is successful, it is considered that there is a great possibility of spread
in future into the similar industry.
(D The fact that EFB having been so far used only for mulching can be used ass
fuel, means, in itself the realization of extraordinary cost saving, compared with
the cost of diesel oil having been used so far.
(D It is the key to secure and collect a sufficient quantity of EFB; and now that
EFB are processed, EFB are necessarily accumulated once at least in the
stripper (the process to separate them from palm fruits) of each mill. It is not
difficult to provide the 2nd transport system from there to the burning site. It is
feasible independently for such a large organization as FELD A, to secure a
sufficient quantity of EFB, and even in the case of private companies of smaller
scales can minimize risks by executing the project jointly with neighboring
plural mills.
(3) In such cases as neighboring mills consent to investment can not be obtained,
the quantity of EFB can be secured by making with them long-term contracts to
take EFB only from them. It must be feasible to make such trades favorably
with them because every company is worried about EFB disposal.
(4) Profitability of the project can be improved by selling electric energy to the
national grid on the basis of IPP. Particularly, in the case of sites near the
national grid within West Malaysia, the possible issue of bearing the cost of
transmission line laying, is easy to settle by compromise with TNB, and this is
favorable when plural similar projects are schemed.
-1-26-

(D In the case of East Malaysia, the fact that though the absolute number of the
mills is small, the scale of each mill is larger than in West Malaysia, and the
fact that electric power conditions are worse than in West Malaysia, give
impetus to the need of the project in question. And the facts that as mentioned
before, better favorable treatments for investment can be received in East
Malaysia than in West Malaysia.
— 1 — 27 —

CHAPTER 2
CONCRETIZATION OF PROJECT PLAN
Abstract
Concrete studies are made on the project.
An outline of the area to be covered by the project and an outline of the site (enterprise)
proposed for execution of the project are stated, and studies are made on controversial
points predictable in execution of the project.
And the specifications of equipment to meet service conditions for the project are also
studied.
Since this project conforms to the Malaysian Government's policy in the points that the
EFB, one of palm shells' components, which have been disposed by dumping, are effectively
utilized as an energy source, the partner enterprise has a very deep interest in the
introduction of this project.

CHAPTER 2. CONCRETIZATION OF PROJECT PLAN
2.1 Project Plan
2.1.1 Overview of the Project Site
2.1.1.1 Geography
Sabah State is situated between approx. 7° 25' N and approx. 4° 10’ N. and
between approx. 119° 20’ E and 115° 20’ E.. and adjoins Indonesia (Kalimantan
State) and the kingdom of Brunei.
Its area is 74,398 square kilometers. At the northern end of the mountains
sunning north and south, rises Mt.Kinabalu (4,120 m), the highest peak in South
East Asia. Though the state is scarce of plains, there are innumerable rivers and
in their basins the soil is said to be fertile and fit for agriculture.
SAHABAT COMPLEX, which includes the project site, lies in the east of Sabah
State and faces the Celebes Sea.
To get there, it takes about one hour by twin engine plane from Kota Kinabalu,
the capital of Sabah State, to Lahad Datu Airport and about on more hour by car
from the airport.
XUOAT Ifc 13 i
SABAH STATE
KOTA KINABALU J
LABUAH
CELEBES SEA
SARAWAKSTATE
SAHABAT COMPLEX
Fig. 2.1.1.11 Map of Site Proposed for Project
— 2—1 —

2.1.1.2 Climate and Rainfall Amount at Site
Malaysia has a hot, humid and rainy climate of an oceanic tropical rain forest,
with no change of the seasons, because it faces the sea in low latitudes.
Though the atmospheric temperature changes between 24° C and 35° C
throughout the year, the monthly mean atmospheric temperature does not make a
difference reaching 1° C all the year round.
On the other hand, daily difference in atmospheric temperature approaches 10°
C, giving a climate cooler and easier to bear, though night into early morning,
compared with daytime.
Though the distinction between the rainy season when squalls visit frequently
and the dry season was clear before, owing to the northeast and southeast
monsoons, it is said that the climate has turned to such one as makes it hard to
distinguish between the rainy season and the dry season, in recent years,
presumably owing to various environmental changes.
The humidity is nearly 100 % because the coastline lies near.
It is said that the proposed site and its vicinities have leas rainfall compared with
other areas in Sabah State. Rainfall in respective years between 1992 and 1997 in
the area in question is as shown in the following table.
Table 2.1.1.2-1 Rainfalls in the Vicinities of SiteUnit: mm
1992 1993 1994 1995 1996 1997Mean
RainfallJan. 186.00 11.91 151.50 0.00 409.76 258.00 169.53Feb. 0.30 125.27 103.32 54.69 96.88 271.00 108.58Mar. 90.00 78.20 58.00 68.75 23.63 84.00 67.10Apr. 133.20 60.16 177.70 75.39 35.55 101.00 97.17May 160.00 13.67 355.86 89.94 432.03 63.00 185.75Jun. 228.20 33.40 118.48 178.90 268.75 18.00 140.96Jul. 76.10 64.06 325.98 110.74 180.86 151.55Aug. 64.40 32.38 157.80 189.60 182.81 125.40Sep. 39.60 74.18 148.83 216.80 66.66 109.21Oct 310.40 136.75 46.87 285.16 271.74 210.18Nov. 126.80 92.97 143.75 248.00 289.11 180.13Dec. 303.40 373.24 299.57 285.55 235.57 299.47Total 1,718.40 1,096.19 2,087.66 1,083.52 2,493.35 795.00
Data Offered by FELDA
-2-2

2.1.1.3 Population
Malaysia had a population of approx. 22.7 million in 1999.
The following table is a summary of the changes of population by states during
the period from 1980 to 1998.
The population of Sabah State is said to be about 2.2 million now which
corresponds to about 10 % of the whole population of Malaysia.
Table 2.1.1.31 Changes of Population by States in Malaysia 21)Unit: 1,000
1980 1991 1998Rate of
Increase (%)PeninsularMalaysia
Perak 1,744 1,880 2, 229 15. 66Johor 1,580 2,074 2, 513 17.47Selangor 1,426 2, 289 2, 848 19. 63Kedah 1,078 1,305 1,579 17. 35Federal Territory 946 1,199 1,410 14. 96Kelantan 859 1,182 1,446 18. 26Penang 901 1,065 1,253 15. 00Pahang 768 1,037 1,251 17.11Negri Sembi1 an 551 691 820 15. 73T rengganu 525 771 957 19. 44Ma1acca 446 505 609 17.08Per 1 is 145 184 217 15.21
Sub total 10, 969 14,182 17,132 17.22EastMalaysia
Sarawak 1.236 1,648 2, 000 17. 60Sabah 1,737 2J97 20.94
Sub total 2,165 3, 385 4,197 19. 35Total 13,134 17, 567 21,329 17.64
The number of household in the area to be covered by electric power supply in
the project is as shown in the following Table 2.1.1.3-2, and the whole population
in the area is about 15,500.
Table 2.1.1.3*2 Number of Households in the Area to be Covered by the Projected Power Supply
Complex Kampung D Kampung C1 Houses 517 524 5922 Shops 5 15 1303 Offices 66 - -4 Schools - 2 -5 Resorts & Others 40 - -
Note) Kampung: Village
-2-3-

2.1.1.4 Project Site
The site proposed for the project is SAHABAT COMPLEX which lies within
Lahad Datu District situated in the east of Sabah State.
SAlHABAT COMPLEX is a complex of facilities, composed of plants, houses,
commercial facilities and resort facilities, which are possessed by FELD A Palm
Industries.
FELDA keeps a 150 X 200 - m land on the other side across a road from the
kernel crushing plant lying within SAHABAT COMPLEX.
Sahabat Project is one of Regions where the most numerous palm plantations
and palm oil mills are massed in Malaysia, and round SAHABAT COMPLEX,
palm oil mills are under operation in 10 places.
“How stably EFB as fuel can be collected” and “To what extent the cost related to
the collection including transport expensed can be minimized” are very important
requisites to success in this project.
In the Plan, EFB are expected to be supplied from six out of the ten palm oil
mills for the Industry owned Power Plant co-generation system, or from all of the
ten mills for the IPP co generation system.
The mill names shown in smudged spaces on the following table are those for
the six mills, and the estimated quantities of EFB to be processed annually for ten
years hence in the six mills are mentioned in respective lines. If EFB are
insufficient, the shortage will be supplied by the residual four mills. Though no
detailed data are available for the residual four mills, the total quantity of EFB
processed will amount to more than two million tons per year.
Table 2.1.1.41 Estimated Quantities of EFB to beProcessed in the Proposed Site Area
Unit: tMill name 2002 2002 2003 2004 2005 2006 2007 2008 2009 2010
BAIDURIAYU 210,503 214,008 209,015 206,828 200,178 200,083 192,283 189,243 173,468 163,375
EMBARA BUDI 264,620 264,629 259,480 256,181 248,517 237,986 229,437 221,950 212,842 203,885F.HARAPAN 233,530 230,460 232,670 226,800 218,150 209,270 200,450 198,100 190,000 185,000MERCU PUSPITA 240,222 236,932 196,365 233,601 226,541 212,995 207.186 202,050 190,270 180,222
HMPR.BADAI 243,700 241,000 248,800 241,100 232,500 230,900 223,600 214,300 211,100 200,000KEM.SAKTINILAM PERMATA[NDERA BAKTIJRGN.BISTARALANCANG KEMUD 200,000 200,000 200,000 200,000 200,000 200,000 200,000 200,000 200,000 200,000
Total 1,392,584 1,388,019 1.341,330 1,364,510 1,325,886 1,291,234 1,252,956 1,225,643 1,177,680 1,132,482
Data Prepared by FELDA
-2-4-

2.1.1.5 Power Demand
Since raw material can be easily obtained and in addition there are houses and
production facilities which consume electric power, including those for kernel
crushing, oil refinery, bulk shipping, etc. within SAHABAT COMPLEX, the site is
“favorably located for both raw-material and demand aspects”.
The area expected to be covered by power supply in this project is composed of
SAHABAT COMPLEX formed with the there companies: “Sahabat Oil Products”,
“Kernel Crushing Plant” and “Sahabat Bulkers”, as nuclei, and the residential
quarters: “Kampung D” and “Kampung C”, situated in its vicinities.
Electric Power consumption in 1997, 1998 and 1999 of the there companies:
“Sahabat Oil Products”, “Kernel Crushing Plant” and “Sahabat Bulkers /
Complex”, is as shown in the following table.
Table 2.1.1.5-1 Electric Power Consumption in Major 3 Companies around the Site
Unit: kWhName of Company 1997 1998 1999Sahabat Oil Products 5,742,000 7,086,400 6,842,800Kernel Crushing Plant 10,776,920 7,620,830 9,952,900Sahabat Bulker 1,558,300 1,740,031 1,810,829
On the other hand, the up-to-date data obtained from FELDA on power and
steam consumption in the area to be covered by the projected power supply are
shown in thee following table:
Table 2.1.1.5*2 Present Status of Power and Steam Demand in the Area to be Covered by the Projected Power Supply
Annual Power Demand (kWh)
Max.Power(kW)
Steam(t/h)
Sahabat Oil Products 9,000,000 1,800 16 at 12barKernel Crushing Plant 12,000,000 2,400Sahabat Bulker 1,920,000 240Bandar D 2,760,000 300Bandar C 3,840,000 450Total 29,520,000 5,190
—2—5—
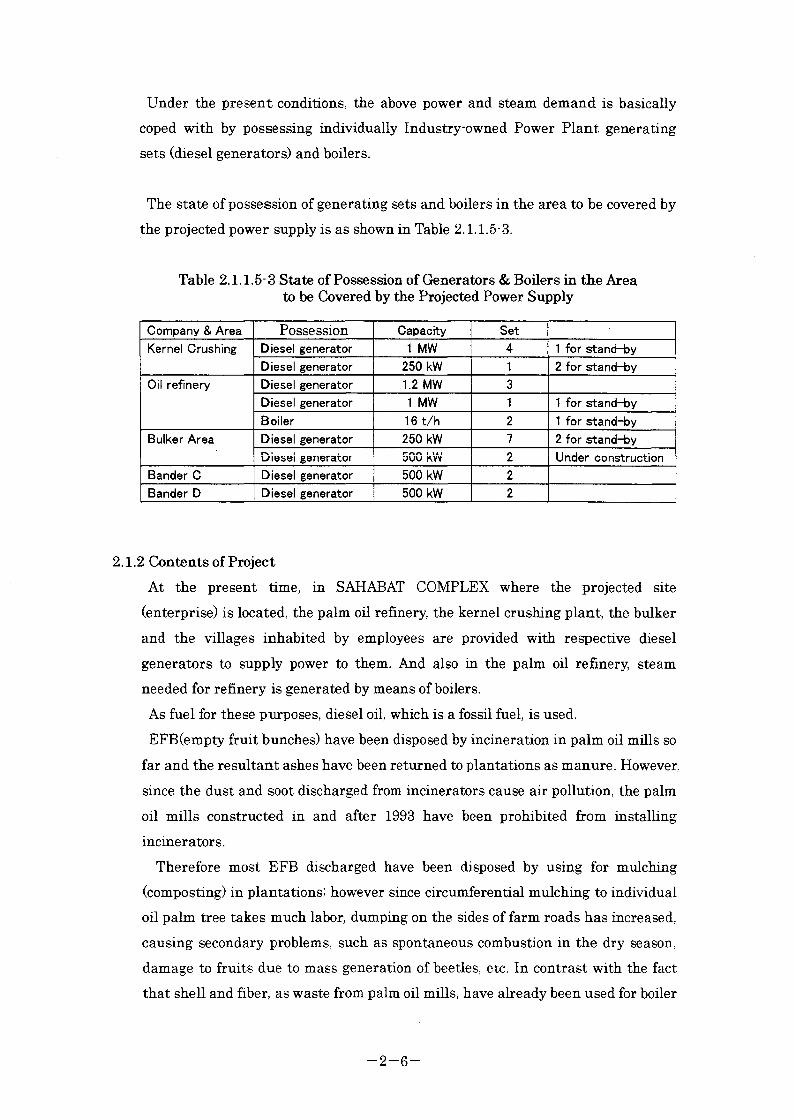
Under the present conditions, the above power and steam demand is basically
coped with by possessing individually Industry-owned Power Plant generating
sets (diesel generators) and boilers.
The state of possession of generating sets and boilers in the area to be covered by
the projected power supply is as shown in Table 2.1.1.5*3.
Table 2.1.1.5*3 State of Possession of Generators & Boilers in the Area to be Covered by the Projected Power Supply
Company & Area Possession Capacity SetKernel Crushing Diesel generator 1 MW 4 1 for stand-by
Diesel generator 250 kW 1 2 for stand-byOil refinery Diesel generator 1.2 MW 3
Diesel generator 1 MW 1 1 for stand-byBoiler 16 t/h 2 1 for stand-by
Bulker Area Diesel generator 250 kW 7 2 for stand-byDiesel generator 500 kW 2 under construction
BanderC Diesel generator 500 kW 2Bander D Diesel generator 500 kW 2
2.1.2 Contents of Project
At the present time, in SAHABAT COMPLEX where the projected site
(enterprise) is located, the palm oil refinery, the kernel crushing plant, the bulker
and the villages inhabited by employees are provided with respective diesel
generators to supply power to them. And also in the palm oil refinery, steam
needed for refinery is generated by means of boilers.
As fuel for these purposes, diesel oil, which is a fossil fuel, is used.
EFB(empty fruit bunches) have been disposed by incineration in palm oil mills so
far and the resultant ashes have been returned to plantations as manure. However,
since the dust and soot discharged from incinerators cause air pollution, the palm
oil mills constructed in and after 1993 have been prohibited from installing
incinerators.
Therefore most EFB discharged have been disposed by using for mulching
(composting) in plantations! however since circumferential mulching to individual
oil palm tree takes much labor, dumping on the sides of farm roads has increased,
causing secondary problems, such as spontaneous combustion in the dry season,
damage to fruits due to mass generation of beetles, etc. In contrast with the fact
that shell and fiber, as waste from palm oil mills, have already been used for boiler
—2—6—

burning as an electric-Power and process-steam source, EFB have not been used
as an effective Power source so far, because they have hard fiber and are big in
shape and appropriate pretreatment is indispensable before putting them into the
furnace owing to their water content more than 60 %, and further because the
have the property of heavy slogging due to the melting point as low as about
1,000° C of the ash coming from them.
With the view of utilizing effectively these unused EFB, it is attempted in the
project, to reduce the consumption of fossil fuel being used now, by meeting the
power demand for SAHABAT COMPLEX and the steam demand for refinery in
the complex, with the EFB burning Industry-owned Power Plant co-generation or
the EFB-burning IPP installed, and also to reduce the volume of generated Green
House Gases through the reduction of the volume of dumped waste.
2.1.3 Objective Green House Gases, etc.
The Green House Gases in this project are the carbon dioxide (CO2), which is
generated from fossil fuel being used in the existing diesel generators and boilers,
and the methane gas (CHJ, which comes from EFB being dumped in plantations.
It is attempted to reduce CO2 generated from fossil fuel and to reduce CH4 coming
from EFB, by utilizing EFB effectively as a biomass Power source.

The partner enterprise for this project is FELDA Palm Industries Sdn. Bhd.
(PFI).
As the core enterprise of the FELDA group, FPI possesses 12 subsidiary
companies in various fields of the palm industry.
The following enterprises having oil refinery or kernel or bulker facihties in the
area expected to be covered by power supply in this project, are all subsidiary
companies to FPI or companies tied up with FPI.
MANUFACTURING SECTION TRADING SECTION
FELDA ENTERPRISES
FELDA MARKE i iNG SERVICE htLUA tNU U StKVlULS
FELDA TRADING
FELDA TRANSPORT SERVICES
FELDA PRODATA SYSTEMS
FELDA BULKERS
FELDA HOLDINGS
KILANG GUA FELDA PERUS
FELDA KERNEL PRODUCTS
FELDA VEGE. OIL PRODUCTS
PREMIAR BREACHING EARTH
P. GUDANG GRAINS TERMINAL
FELDA SECURITY SERVICES
FELDA RUBBER INDUSTRIES
FELDA PALM INDUSTRIES
FELDA OIL PRODUCTS
MALAYSIA COCOA MFG.
FELDA-JOHOR BULKERS
FPG OLEOCHIMICALS
Fig. 2.2.1.1-2 Organization Chart of FELDA(Only Trading and Manufacturing Sections
Shown) 2'3)
—2—9—

2.2.1.2 Status of Earning Rate (Profit)
A part of the 1999 Annual Report released by the holding company. FELDA
HOLDINGS is extracted in the following:
Table 2.2.1.2-1 FELDA HOLDINGS’ 1999 Annual Report 2-3)
(PERFORMANCE AND ACTIVITIES FOR 1999)
Subsidiary CompaniesFeldaEquityHolding
(%)
Capital(RM'000)
Turnover(RM'000)
1999)
Pre Tax Profits(RM'000)
1998 1999
Felda Holdings Sdn Bhd 200,000 89,630 56,307 78,830
Felda Prodata Systems Sdn Bhd 100 10,000 71,180 15,250 15,570Felda Palm Industries Sdn Bhd 72 202,000 4,295,000 136,060 232,130Felda Rubber Industries Sdn Bhd 71.4 42,000 555,750 38,570 14,520Felda Trading Sdn Bhd 51 30,000 418,920 15,320 12,050Felda Transport Services Sdn Bhd 51 30,000 113,070 17,350 15,170Felda Security Services Sdn Bhd 51 1,440 22,440 2,190 2,760Felda Engineering Services Sdn Bhd 51 10,000 95,840 13,730 10,310Felda Plantations Sdn Bhd 51 30,000 37,620 N/A 36,500Felda Enterprises Sdn Bhd 51 120,000 15,150 8,930 14,080
FPI yielded prominent profit among the group members and takes the lead as the
core enterprise in raising business results of the group. Though the above table
shows data for only the two years, 1998 and 1999, FPI’s contribution to business
results within the group is said to have been equal even in the past previous to
these years.
2.2.1.3 Degree of Interest
FPI has a great interest in this project.
The company is so enthusiastic that it has dispatched an investigation committee
to Denmark being an advanced country in biomass power generation, and has
made an on-site inspection of the rice hask burning power plant.
Great expectations are laid on this project which would enable the whole
—2—10—
company to save, even in future, the diesel oil consumed in the company, because
the whole of the area expected to be covered by power supply in this project
belongs to the same group companies.
Both palm oil and diesel oil show heavy fluctuations in prices. If a sudden rise in
the price of diesel oil occurs in addition to a drop in the price of palm oil, the
industry will be strucked a combination of severe blows by them. However if a fuel
amounting to a nominal price can be obtained, even though some cost is needed for
its pretreatment, a very stable production system and cost control can be
established.
Upon the pride as FELDA having the largest palm oil company in the world
largest palm oil country, the corporation intends to realize biomass power
generation developed from palm oil production for the first time in the world.
2-11
(3) Produce of Crude Palm Oil
The growth of oil palms needs a humid tropical lowland climate which ensures
an annual rainfall of 2,000 mm, temperature ranging from 20° C to 30 °C and a
sunshine duration of 5 hours a day, and the soil must be fine volcanic alluvial
clay or marine clay. The climate and soil in Malaysia meet these conditions and
are optimum for oil palm cultivation.
After bred for 11 months in seedling fields from seeds selected to secure
high-yield palm oil, seedlings are transplanted to plantations. The seedlings are
planted to from a triangular pattern so that each of them can utilize an equal
land surface area and catch ample sunshine. The young plants protected against
damage from insects, etc. become reap able after the 32-month unripe stage
following the transplantation.
In reaping the fruits, attention is paid to the following in order to ensure high
yield and high quality:
• Gathering at the period of optimum maturity: Both overripeness and
unripeness affect quality and the yield.
• Well-regulated gathering: Gathering at intervals of 7 to 10 days during the
economic life of 20 to 30 years.
• Not to bruise ripe fruits in cutoff, gathering, transport, etc., and not be make
them dirty with dust or soil.
• Processing of reaped FFB within 24 hours: FFB must be processed without
delay after gathered because contained free fatty acid (FFA) increases with
hours.
To cape with this increase of FFA, palm oil mills (crude palm oil mills) are
arranged strategically within or near plantations.
Palm oil mills are mills to extract crude palm oil from fruits, where crude palm
oil is produced in accordance with the following processes:
" Sterilization: Impurities are separated from FFB.
• Stripping: Fruits are separated from bunches.
• Oil extraction: Oil is extracted from mesocarps.
• Clarification and Purification: Water, dirt and other impurities are
minimized, in order to prevent deterioration during preservation and
transportation.
• Kernel sorting and crush: After flesh fiber and nuts are sorted, shell and
kernel are separated by crushing.
-2-14-

Flesh fiber and shell are used as boiler fuel, and EFB are used as mulching
manure in plantations.
The waste fluid coming from the producing process of crude palm oil is
treated by either of the following and used in plantations of discharged in
rivers.
* Thermophilic anaerobic fermentation: After retained in the anaerobic cooker
for 9 to 13 days, the waste liquid with biogas stripped is transferred from the
anaerobic reservoir to the preserving reservoir and scattered over
plantations. And solid matters are sold as gardening manure after solar
drying. In this connection, the recovered biogas is used for power generation.
* Treatment in the reservoir: Kept intact more than 13 days so that anaerobic
digestion occurs.
The above processes are shown in Fig. 2.2.2.11
—2—15—

FFB from the Field.
FFB Weighed and Recorded
Sterilization of FFB
Thresher
EFB (Empty Fruit Bunches)Fruits Separated from Bunches
Mulching (Dumping)Digester & Presser
Fruits Digested: and: Press cakePressed
Winnowing Column & Depericarper
Purification Tank (Clarification)
Fiber Separated from Nuts
Partially purified Oil Fiber
Nut Drying Silo
Nut CrackerSeparation of Sludge Purification
Shells & Kernels
Sludge & Dirt
Vacuum Drier
Hydraulic Cyclone
EffluentTreatment
Purified & Dried Oil Shells Kernels
Boiler Fuel Kernel Silo
Kernels Bagged For Sate
Fig. 2.2.2.11 Flow Chart of Crude Palm Oil Extraction

(4) Extraction of Palm Kernel OilThe extraction of palm kernel oil consists of the pretreatment process and oil
extraction process. In the oil extraction, either of the solvent extraction and the
mechanical extraction by means of the screw press is used. An outline of each
process is explained in the following.
• Washing: Foreign matters, such as pebbles and metal pieces are removed by
means of the magnetic separator and the vibrating separator.
• Crushing: Fragmentized and flaked by means of the hammer mill and the
breaker roller.
• Heating treatment: Water contained in the meal is adjusted, cell walls are
destroyed, and protein is coagulated; this facilitates oil filtration.
• Solvent extraction: Hexane is used as solvent and oil is merged into the
solvent by immersing the meal in the solvent or by infiltrating the meal with
the solvent. The solvent containing oil is removed from the kernels and meal
through the processes of distillation, stripping and desolventing. The meal is
pelletized.
• Mechanical extraction: Oil is pressed out of the meal by means of the screw
mill. Impalpable powder and sediment remaining in the oil are removed by
means of the filter press.
The above processes are shown in Fig. 2.2.2.1-2.
-2-17-

Cleaning
Size Reduction (F ragmentization)
Flakinj
Steam Conditionin:
Oil Extraction
Solvent Solvent
Wet Meal Miseelia
EvaporationDesolventiser Toaster
Strippini
Pelletising Palm Kernel Oil
Palm Kernel Pellets
Espeller Cakes
Screw Pressin;
Mechanical ExtractionSolvent Extraction
/■ ■ ■l,!|. .;!!l!.! ■ .y!M; ■!"! *l
Coarse Screen Filter
Palm Kernel Oil
Filter Press
Fig. 2.2.2.1-2 Flow Chart of Palm Kernel Oil Extraction
-2-18-

(5) Refinement of Palm Oil
Crude palm oil contains various fat*soluble compounds including free fatty
acids and aromatic substances as main ones in addition to gum, pigments and
trace metals. To use for food, components, which give out unpleasant tastes or
smells or colors, must be removed,
l) Physical refinement:
This is the process where free fatty acid is steam-distillated out of oil
under vacuum at a high temperatures; it consists of the pretreatment of
degumming and bleaching and the deodorizing process.
* Pretreatment: The oil is phosphated to remove all impurities including
trace metals, and is bleached under vacuum and then filtrated.
• Deodorization: Volatile free fatty acids and aromatic substances and
unstable carotenoid pigments are steam-stripped under vacuum. The fatty
acid distillation liquid as a by-product, contains 80 to 90 % FFA.
The above processes are shown in Fig.2.2.2.1-3.
Deoxidization & Deodorization
Fatty Acid Distillates
RED Palm Oil / Palm Olein
Palm Stearin
Crude Palm Oil f Palm Olein / Palm Stearin
Degumming with Phosphoric Acid and Pre-Bleaching Earth
Pretreated Palm Oil t
Palm Olein ! Palm Stearin
Fig. 2.2.2.1-3 Flow Chart for Steam Distillation of Palm Oil
—2—19—

2) Fractional Distillation of Palm Oil into Olein & Stearim
Since a fair rate of triglyceride components are contained in palm oil,
‘olein’ with a low melting point and ‘stearin with a high melting point can
be separated, with palm oil crystallized by cooling control. The flow chart of
this process is shown in Fig. 2.2.2.1-4.
Fractional Distillation Centrifugation / Drum Filter / Belt Filter / Membrane Filter
Palm StearinPalm Olein
Crystallization
Crude / Refined Palm Oil
Fig. 2.2.2.1-4 Flow Chart for Single Fractional Distillation of Palm Oil
To separate the formed crystals, there are the dry method by direct
filtration and the cleaning method by centrifugation, (lauryl sodium sultate
is used as surface active agent).
And in solvent fractional distillation, oil is crystallized in the solvent and
the crystals are separated by filtration through the drum filter.
In the case where special products are required, various palm oil products
which have characteristics needed for diverse purposes, such as the palm
mid-fraction, double-fractionated olein and super olein, with the cloud point
lowered and the iodine value raised, can be produced through the processes
of refinement and fractional distillation.
3) Oil and fat Chemical Products
In oil-and-fat chemical products with palm oil and/or palm kernel oil used
as raw material, fatty acid, methyl ester and glycerin can be produced by
-2-20-

double fractionation, hydrogen treatment and ester interchange. These
Oil-and-fat chemical products are used over a wide area from fatty acid
mixtures to be used for soap produce, to food and further to high purity
products to be used for the plastic industry and medicine. Above all, as to
methyl esters, those varied in molecular chain length, are available, the
uses of which vary over a wide range including the production of fatty
alcohol, alkanol amid and sulfoester to be used for detergent. The flow
chart of this process is shown in Fig. 2.2.2.1-5.
Crude Palm Oil Palm. Kernel Oil
Palm Stearin Palm Olein
Palm Acid Oil
Z---
V.Pretreatment
......................i........................\
\_Fat Splitting
... ...r —\
Crude Fatty Acid
Sweet waterrJ
Pretreatment
f \
SoapsV——
Fig. 2.2.2.1-5 Flow Chart for Production of Oil and-fat Chemical Products (6) Uses of Palm Oil
-2-21-

1) Food Uses
Home cooking oil: Palm oil can be repeatedly used without smell left
because of its low rate of deterioration. And it forms no viscid film on the
surfaces of frying pans and also it emits no smoke and does not bubble.
Fried food oil for industrial use: By the same season as the above, palm oil
is used for cooking of potato chips, French fries, precooked Chinese noodles,
doughnuts and snack food.
Margarine: Palm oil is available with various process grades because it has
the property of crystallizing into appropriate shapes.
Shortening: This is used for bread, cakes, cream, candies and fried food,
and contributes to their softness, fitness is texture and stability in
preservation. The biscuits, which the shortening with a palm base has
been added to, are easy to break and soft and melt easily in the mouth.
Vegetable butter: Palm oil in a natural state is closely akin in
specifications to vegetable butter and its palatableness owing to a granular
structure is popular among consumers.
Ice cream: Though fat in milk is ideal for ice cream, vegetable oil will also
be an excellent substitute of blending is careful. Palm oil and palm kernel
oil produce smooth ice cream of fine texture and are resistant to
acidification.
Sweets: Cacao substitute fat is used for chocolate and sweets partially or
wholly as substitute for cacao butter. The chocolate and sweets made with
this substitute fat used are excellent in luster and wear resistance and
melt easily, and thus resemble closely those made with cacao butter mixed
in.
Creamer: Cream with palm oil or palm kernel oil blended with another
vegetable oil is used as substitute milk or cream with no milk contained.
Its strong resistance to oxidization keeps tests and makes coffee palatable
and tastier.
2) Soup and Detergent
The most important use with the exception of food is raw material for
soap and detergent production, and palm stearin is used for this purpose.
Perfectly refined, bleached and deodorized palm stearin is available:
Its characteristics, such as usable ness for soap produce without
2-22
pretreatment excellency in detergency solubility and lathering, and
stability in color, luster and finess in texture, and its competitive power, in
prices, are suitable to raw material for soap and detergent.
3) Oilandfat Chemical Products
Basic oil and fat chemical products producible out of palm oil and palm
kernel oil are fatty acid, methyl ester, fatty alcohol and glycerol. These
products have their uses in various fields, which include soap, detergent,
cosmetics and medicine. In addition to these, stearic acid is also used for
the produce by hot-melt adhesives and candles (in order to adjust flame
brightness, to remove smoke and smell, and to promote the action as
receiver for molten wax.)
These oil and fat chemical products with the palm oil base have an
important feature that they do not cause environmental pollution because
they have biogradability.
4) Effective Utilization of Waste
The wastes coming from the process of palm oil production include the
empty fruit bunches, fiber, shells and discharged liquid coming out of palm
oil mills, and they are utilized as fuel for palm oil mills or as manure for
plantations. Since these wastes contain much substance having nutriment
and value, researches have been made in effective utilization of palm
trunks, leaves and empty fruit bunches which are being used as manure.
The products developed through these researches include block boards,
roofing materials, pulp, paper, etc.
2.2.2.2 Overall Image of FELDA SAHABAT COMPLEX
Within a 120 thousand-hectare land situated on the east coast of Sahabat State
in Kalimantan Island 2'5), FELDA SAHABAT COMPLEX has developed 53
plantation zones and has palm oil mills arranged in 10 dispersed places and the
facilities located intensively in a place on the coastline, which are composed of a
kernel crushing mill, a palm oil refinery and shipping facilities.
The palm oil mills, which produce crude palm oil, are provided with boilers that
use as fuel the fiber and shells being residues left after crude palm oil pressed out
-2-23-

and with backpressure turbines, and almost all the demand of steam and power
used in respective mills are met by operating these facilities of the mills
themselves. And EFB of low calorific value are returned to plantations as manure
used for palm mulching. However the occurrence of damage from beetles and the
fact that the EFB left alone on roadsides burns spontaneously in the dry season,
have been put in question. On the other hand, the power and steam used in the
kernel crushing mill, palm oil refinery, shipping facilities, etc. are supplied
In the FS about effective utilization of the wastes from the palm oil refinery factory,
a major objective is reduction of fossil oil type fuel due to utilization of unutilized
wastes of EFB as substitute fuel for a cogeneration system.
An overall image in Fig. 2.2.2.2-1 and an arrangement drawing of SAHABAT
COMPLEX in Fig. 2.2.2.2-2 are indicated.
/ EFB i (mulching)
EFB \ (mulcting) )J Mill: energy
self- sustained type
<----- ;A"-----^
consumption t^e)
Crude Oil Kernel
Refinery
Plantation Plantation
Kernel crushing Mill
Kernel Meal (Feed use)
Refined PO (Food use)
Kernel Oil (Industry use)
A Mill: energy self- sustained
type
Residence Tank yard • shipment quay
FS conducted for possibility of use as a substitude
fuel for Refinery
Fig. 2.2.2.21 An Overall image of Palm Oil producing Process (FELDA SAHABAT COMPLEX)
-2-24-

mut TJUILIISII
Palm Oil Mill
Palm Oil Refinery
LiilT UL1 f ESI
Fig. 2.2.2.2-2 Arrangement Plan of SAHABAT COMPLEX
-2-25 —2—26 —

2.2.2.3 Palm Oil Mill
Palm oil mills are plants where crude palm oil and kernels are produced out of FFB gathered in plantations.Since these plants are within remote plantations, power and steam used in the plants are self-sustained by using for fuel the shells and fiber which are residues left after palm fruits picked off.
The process in the palm oil mill is as follows:The truck loaded with palm fruits is put in a high-pressure container and the fruits are sterilized with steam.Fruits are shaken off from bunches by means of the stripper.Palm oil is pressed out of mesocarp by means of the screw press, and crude palm oil is produced in the refining system.After mesocarp fiber and seeds are sorted by means of the sorter, the shells of the seeds are crushed and kernels are separated as products. Fiber and shells are used as fuel for boilers and EFB are used as manure in plantations.
After the above has been rearranged, the state of operations, the specifications, etc. of boilers and generators (the newest units started up in 1997) are shown in Table 2.2.2.3-1 and also in Fig. 2.2.2.31 as a process flow chart. And arrangement plan of facilities in Palm Oil Mill is shown in Fig. 2.2.2.32
In this connection, the plantations and the palm oil mills are managed by FELDA Plantations, Ltd. 2'6)
-2-27

Table 2.2.2.31 State of Operation and Specification of BTG in Palm Oil Mill
Items TreatedAmount
/Capacity
Calorific Value /
Number of Set
Application etc.
Operation Hours usual L2~16ku September 20~24h(2-sift)
MaterialBalance
RawMaterial
FFB 50 t/h Collection from Plantation
Product CPO 11.25 t/h To RefineryKernel 3.36 t/h To Crushing Mill
Effluent
Fiber 8.895 t/h 11,304 kJ/kg Boiler FuelShell 3.64 t/h 17,166 kJ/kg Boiler FuelEFB 11.7 t/h 6,113 kJ/kg Project Fuel
SludgeOil
0.2 t/h ? KJ/kg Starting to use as apart of fuel in the refinery
Defattedcake
1.2 t/h Fertilizer?
TreatedWasteWater
13.3 t/h Discharge to River
Boiler*GeneratingFacilities
Water Tube Boiler 22 t/h 2 Sets
Steam and Electric Power Supply at usual operation
Boiler Automatic Control
Pressure Control, Furnace Pressure
ControlBackpressure
Turbine Generator650kW 2 Sets
Diesel Generator 300kW 2 Sets Electric Power at starting Mill

j 1 Generator Roomtehumii
1 I I ItI ! I'
FFB Receiving
50 t/h
■ ^ i Wastewater
Diesel Generator 740 kW x 2 UnitsPlant PowerSterilization
(4 Trains)130' C x 110 min.
Rundown Tank
3.43 bar (g)To Presses. Tanks, etc.
Back-pressure Turbine Generator 600 kW X 2 Units
EFB 11.7 t/h Fuel for Project
Stripping (3 Units)
Office
FiberSelection (2 Trains)
Pressing(3 Units X 2 Trains) 8.99 t/h
Boiler22 t/h x 2 UnitsDischarge
DilutionWater
Shells 6.64 t/h
Clarification (2 Trains)
Crushing (2 Trains)
WastewaterTreatment
KernelsCrude Palm OilPoor-grade Oil0.2 t/h 11.25 t/h 3.6 t/h
To Refinery Boiler
To Refinery To Crushing Mill
Fig. 2.2.2.31 Process Flow Chart for Palm Oil Mill “J” (Latest Facilities Started Up in 1997)
Fig.2.2.2.3 2 Arrangement Plan of Facilities in Palm Oil
-2-29- — 2—30—

2.2.2.4 Refining Process
The refinery includes the kernel crushing mill, the palm oil refinery plant and the shipping facilities for products from these plants. And also in and enough the refinery the office, living quarters and resort facilities have been arranged, and diesel generators for power supply and flue - and- smoke - tube boilers for steam supply have been installed separately.
Specifications of these facilities, operation situation and oil-type fuel consumption are indicated in Table 2.2.2.41. Meanwhile, arrangements of the refinery factory and peripheral facilities are indicated in Fig. 2.2.2.4-1
Table 2.2.2.4-1 State of Operation and Specification of BTG in Refinery
Process Facility
Operating Facility Standby
Capacity kW or t/h Set
OperationHours
(atSurvey) kW or
t/h
CapacitykW,t/h Set
KernelCrushing
Mill
DieselGenerator
1,000 3 12~24h 1,800 250 11,000 1
Refinery
Flue and Smoke Tube
Boiler
18(l8k) 1 24h 16 18(18k) 1
DieselGenerator
1,500 1 24h 7401,280 1
1,000 1 24h 740
Shipping Equipment,
Office, Living Are,
etc.
Flue and Smoke Tube
Boiler
3.63(7k) 1 Operate15days/month
Standstill
2.27(7k) 14.50(7k) 1
DieselGenerator
250 3 24h 423 250 2(UnderConst
ruction)
PM5~10
500 2
-2-31
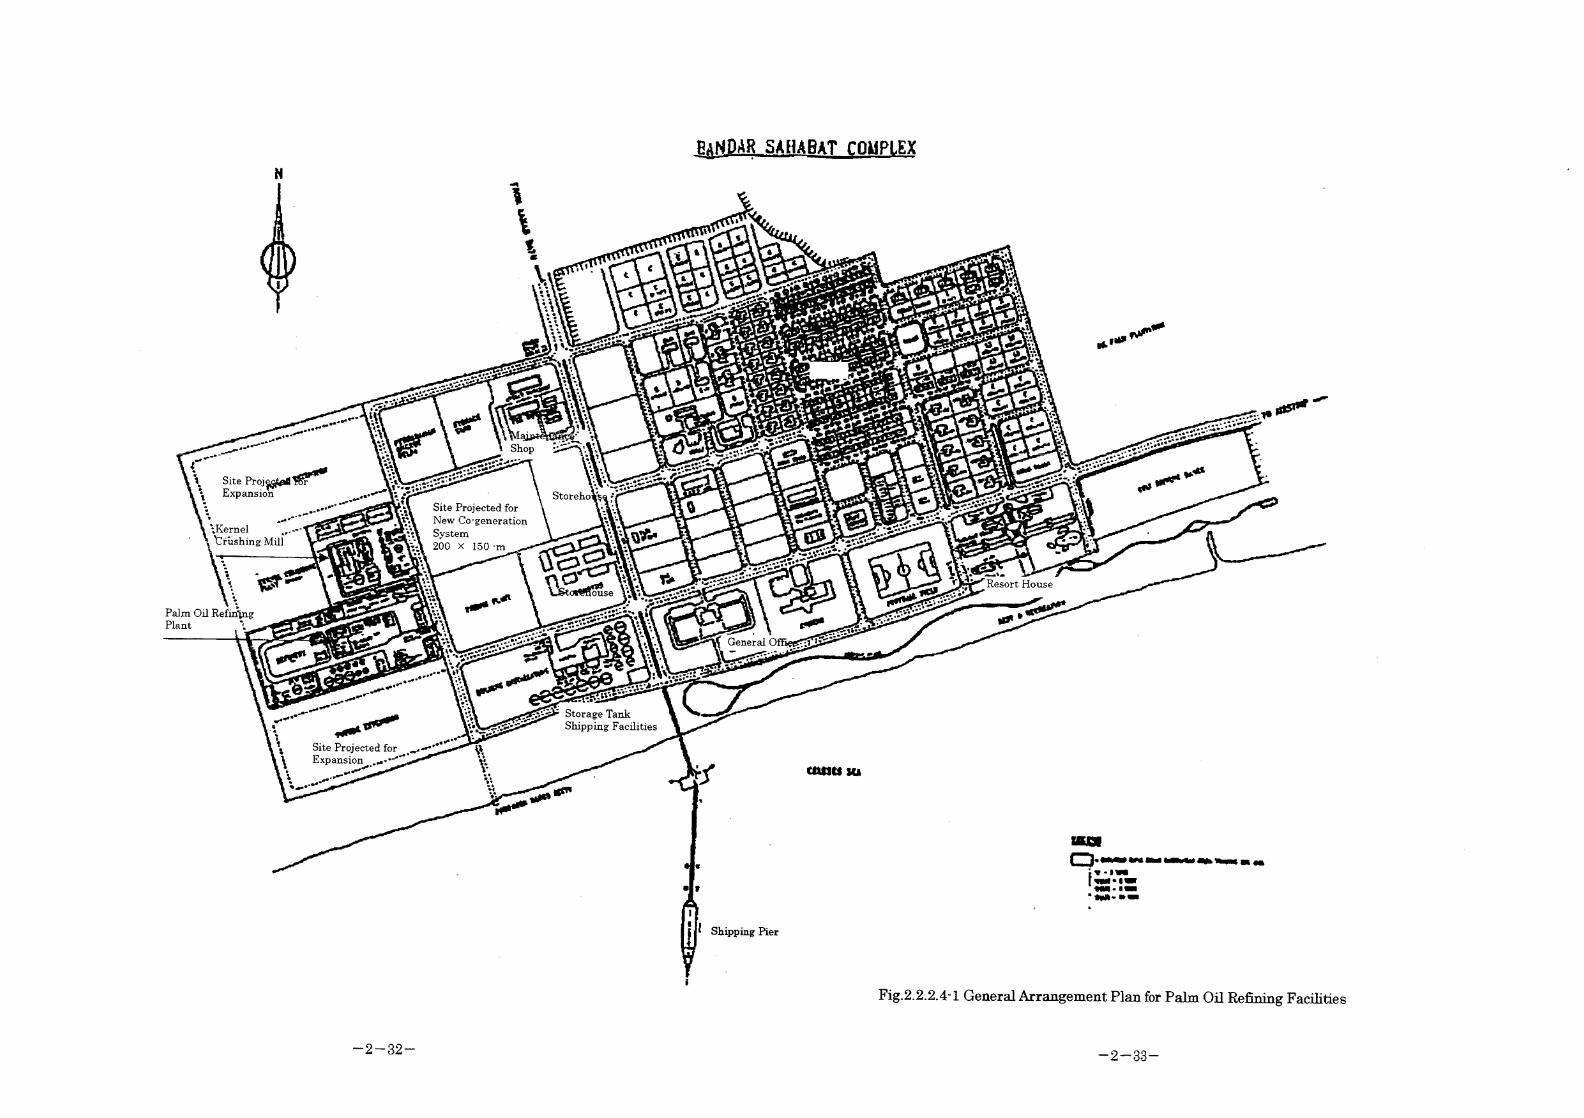
BANDAR SAHABAT COMPLEX
Fig.2.2.2.41 General Arrangement Plan for Palm Oil Refining Facilities
-2-32- -2-33-

The kernel crushing mill is a plant having a kernel processing capability of 400
to 500 t/day, which is set on the 24-hour job in the busiest harvest time of palms
and on the 12-hour job in other seasons.
As the plant power source, the plant has four 1000 kW diesel generator (DG)
units and two 2000 kW DG units. For oil extraction, a mechanical method is
used. As shown in Fig. 2.2.2.4-2, a simpler pretreatment system has been
adopted for this process compared with the process shown in Par. 2.2.1.1.
• Kernels are crushed with the hammer mill.
• Oil is pressed out by means of the screw press through the two stages of
precompression and the final compression.
• Rough press cake is removed by means of the vibrating screen and fine press
cake by means of the filter.
In this connection, the kernel crushing mill is managed by FELD A Kernel
Products, Ltd.2-6)
Kernel
Hammer Mill
Pre -compression
Kernel Silo
Cake Bin
Kernel Bin
Final Compression
Filter
Underground Tank
Vibration Screen
Ore-filter Oil Tank Storage Tank for Shipment
Product House (For feeds/Oil contents 10%)
57.5%
Filtered Oil (For industry / Cosmetic)
42.5%
Fig. 2.2.2.4-2 Process Flow of Kernel Crushing Mill
-2-34-

In the Palm oil refinery, a plant having a crude palm oil refining capability of
1200 t/day is set on the 24 hour continuous running. The refining plant consists
of the physical refining equipment which performs degumming, bleaching and
deodorizing treatments and the fractionating equipment with a capacity of 900
t/day, which fractionates thereafter the palm oil into olein and stearin. This
process flow is shown in Fig 2.2.2.4-3. Three units of 1,000 to 1,500-kW diesel
generators for plant power supply and two units of 18-t/h flue and smoke tube
boilers are installed separately.
In this connection, the palm oil refinery is managed by FELD A Vegetable Oil
Co., Ltd.2-6)Crude Palm Oil( 1200t/d)
4 bar(g) Steam injection—Degumming
4 baKg) Steam injection—► Bleaching
4 bar(g) Steam injection—» Liberation -► Bleached Residues
Degumming Bleached palm Oil
Steam (Heating) No collection of -
condensate waterDeodorization -Fatty Adds Distillate Tank
Cooling
Polishing
Refined Bleached Deodorized Palm Oil
Chiller coolingA
RBD Palm Oil Tank
Separation
Stearin ◄----------- -------(900t/d)
>- Olein Tank
Fig. 2.2.2 4—3 Process Flow in Refinery
— 2—35—
The products of the kernel crushing mill and the palm oil refinery are sent to
storage tanks and then shipped. The shipping facilities include three units o 2.3
to 4.5 t/h boilers for heating the tanks and the boilers are operated about 15
days per month. The plant also has five units of 250 kW diesel generators for
power supply to the shipping facilities, office and living quarters and two units
of 500 kW diesel generators are under construction.
In this connection, the shipping facilities are managed by FELD A Bulkers Co.,
Ltd. 20
-2-36-

2.2.3 Capability of Project Execution at Enforcement Site (Enterprise)
2.2.3.1 Technological Capability
No problem is found in technological capability.
FELDA possesses about 100 plants in Malaysia, including 74 palm oil mills and 5
palm oil refineries, when plants are limited to those in the industries connected
with palms.
As to these plants, FELDA Engineering Co., Ltd. and the engineering department of
FPI took the lead basically in making and executing the construction plans.
All of the retrofit and repair of equipment and the construction of new equipment,
which are almost annually executed in the FELDA group, are basically coped with
by the system where FELDA Engineering and the engineering department of FPI
fix specifications and make execution plans and their field engineers supervise
works and construction.
Though the fluidized bed boiler itself belongs to the most advanced technology in
Malaysia, FELDA, which has already been well informed about production
engineering on oil palm processing and boilers through the producing and refining
process of palm oil, possesses adequate technology of a high level, and accordingly
it is judged that there is no problem in technological capability on the site side.
2.2.3.2 Management Capability
The palm oil industry in Malaysia holds about 50 % of the world market.
The FELDA group possesses approx. 840-thousand-hectare lands over the whole
of Malaysia, and produces 1,800- thousand - ton palm oil per year, which
corresponds to about 25 % of the total production in the Malaysia palm oil
industry.2'3)
In fact, this means that 12.5 % of the whole quantity of palm oil in the whole
world is being produced by the FELDA group.
It comes to this, that the part related to its production is all managed by FPI, and
-2-37-

thus the above-mentioned numbers has demonstrated the group’s management
capability.
2.2.3.3 Administrative Foundation and Administrative Capability
Palm oil and various commodities produced through refinery and/or processing
out of palm oil have been exported to world nations, and have formed a key export
industry weighing heavily with Malaysia.
PPI is an enterprise whose stocks are 100 % possessed by the FELD A group, and
as the core enterprise of the group, the company manages companies over a wide
area including the production, refinery and sale of palm oil, the produce and sale
of various processed products made from palm oil, and the shipping and transport
of products. And from the fact that almost all of these companies keep the balance
in the black, it seems that administrative capability in FPI may be duly rated.
2.2.3.4 Funds bearing Capacity
The FELD A group, which has plantations with the largest total acreage in
Malaysia, is a sound business organization in the financial aspect as well.
Though the FELDA group obtained funds on loan from the World Bank for the
first 17 plants constructed by the group, it has raised funds thereafter by itself or
on loan from Malaysia domestic banks.
As a matter of fact, though FELDA proper is an enterprise established under the
control of the Government, it has covered all its needs for management since 1984
only with dividends obtained from the group, without any fund received from the
Government.
The FELDA group has also financed the May Bank being at once the bank of the
largest scale in Malaysia and the only bank which had no worsening in the
realities of its management even when Malaysia faced the economic crisis, and in
addition the group has been concerned in the bank’s management.
-2-38-

The very favorable connection between the group and the bank has brought
further merits to the management of the FELD A group.
Table 2.2.3.4—1 Income Account Status of F P I Group (Unit: RM) 2"7)
FPI Group FPI1999 1998 1999 1998
Total Sals 4,751,808,008 5,546,727,660 4,294,919,528 5,154,331,029
Profit before Ta: 298,578,837 204,856,698 232,127,141 136,057,276
The sales of the FPI group in fiscal 1999 were approx. 142.554 million yen and its
profit was approx. 8,957 million yen. And also the sales of FPI in fiscal 1999 were
approx. 128,845 million yen and its profit was approx. 6,963 million yen.
The realities of financial affairs are free from uncertainty, and thus if only the
pay ability of the projected case is satisfactory, FPI has a funds bearing capacity
sufficient to enable execution of the case with its own funds only, and loan from the
May Bank is available of course.
2.2.3.5 Manpower-bearing Capacity
FELD A Palm Industries, Ltd.2-6) is one of 20 companies allied with FELD A
Holdings, Ltd.22) under the control of Malaysian Federal Land Development
Authority2"^, and is mainly in charge of the planning and construction of new
equipment. The company also undertook the construction of the new palm oil mill
(started up in 1997) of FELDA Plantations, Ltd. the Sahabat refinery of FELD A
Kernel Products, Ltd. and FELDA Vegetable Oil Products, Ltd., and the storage
and shipping facilities (started up in 1997) of FELDA Bulkers, Ltd., which were
covered by this survey. FPI has abundant talents, such as process engineers and
construction engineers.
And also for the Sahabat refinery and the storage and shipping facilities, which
are operated by FELDA Kernel Products, Ltd., FELDA Vegetable Oil Products, Ltd.
and/or the FELDA Bulkers, Ltd., sufficient personnel in charge of boilers or
generators have been secured as shown in Table 2.2.3.51.
-2-39-

Table 2.2.3.5 — 1 Number of Employees for Boiler and Generator in SAHABAT COMPLEX
Existing Boiler • Generator Facility NewCogeneration
SystemKernel
MillRefinery Bulker Total
Manager 1 1 1 3
EngineerMechanical 1 1 1 3
Electric - 1 - 1
Operator
Chief 2X2shifts
3 7 1X3 shifts
Boiler - 5X2shifts
2 12 4X3 shiftsFor EFB Treat: 2 For BTG : 1 For Standby : 1Generator
1X2shifts
1X2shifts
3X2shifts
10
Total 2 16 11 29 15Maintenancestaff
Mechanical - 6 1 7Electric 1 4 1 6
Instrumentation - 2 - 2
2.2.3.6 Enforcement Organization
There are established organizations: FELD A Palm Industries, Ltd., to be in
charge of the planning and construction of new equipment, FELD A Plantations,
Ltd. to supply EFB; FELDA Transport Service, Ltd.2'3) to transport EFB; FELD A
Kernel Products, Ltd., FELDA Vegetable Oil Products, Ltd., and FELDA Bulkers,
Ltd. to operate plants! and this means a due organization for execution of the
project has already been built.
—2—40—

2.2.4 Contents of Project at Enforcement Site (Enterprise) and
Modified Specification at the Applicable Facilities.
2.2.4.1 Basic Plan and Policy on Project
(l) Requirements for Basic Plan
The requirements presented from the side of the site (enterprise) of execution,
for the basic plan on this project are as follows1
1) The place of installation shall be the 150 x 200 m site adjoining the palm
oil refinery and the kernel crushing plant within FELDA SAHABAT
COMPLEX in Sabah State.
2) The palm waste to be used as fuel shall be limited to EFB. Shell and fiber
shall not be used for the new facility.
3) EFB shall be carried in from 6 palm oil mills in the case of Industry owned
Power Plant and from 10 palm oil mills in the case of IPP to be studied for
reference.
4) EFB shall be 23 % (in weight) of FFB and their annual yield shall be
2,000,000 t/year for FFB and 460,000 t/year for EFB.
5) In consideration of seasonal variation in EFB yield, EFB corresponding to 2
days’ supply at full load shall be stored on the newly established power
plant side and the rest shall be stored in palm oil mills which are the
senders.
6) The annual operation rate of the newly-installed equipment shall be more
than 8,000 hr/year. (In the case of Industry-owned Power Plant, annual
average utilization factor is ca. 88%)
7) In the case of Industry-owned Power Plant, the system shall have a net
output power rating of 7,000 kW when no plant steam is supplied, and if
generated power becomes insufficient for plant power demand owing to a
drop in output power when plant steam is supplied from the system, the
system shall be backed up by starting up the existing diesel generator, to
cover the shortage.
8) However, both the Industry-owned Power Plant system and the IPP system
shall be a unit which can develop required output power even if turbine
back pressure becomes 0.23 bar (abs.) owing to vacuum down in the
condenser.
—2—41—

9) Design requirements:
a) Main steam pressure:
b) Ambient temperature:
c) Ambient humidity:
d) Atmospheric pressure:
e) Wind velocity:
f) Seismic coefficient:
g) Conditions of plant steam supplied:
h) Quantity of plant steam supplied:
i) Soot & dust regulation
j) SOx regulation
k) NOx regulation:
l) Noise regulation:
m) Power source:
n) Generator voltage:
o) For coxdenser coolingwith seawater:
To be within a range from 20.7 to 41.4 bar (gauge)(300 to 600 psi)
Highest: 35°C, Lowest: 24°C,Mean (Design): 30°C
72 to 100 %, 85 % for Design
101.3 kPa
Up to 50 m/s
Not specified (not seismic country)
11.77 bar (gauge), saturated
16 t/h
Not greater than 200 mg/m3N
None
None
Not greater than 85 dB (A)(at 1 m from the equipment’s flank)
For power use:
6,600 V 3-phase 50 Hz415 V 3-phase 50 Hz
For control:
220 V single-phase AC110 V DC
For instrumentation:
110 V AC110 V DC
For illumination:
220 V or 110 V single-phase AC
11 kV ± 6%
32°C or lower at the inlet, 43°C or lower at the outlet
-2-42

10) Others
a) Though works and construction are to be covered by FELDA in executing
this project, computation shall be made in studies on economy with
assumed prices taken into consideration for works and construction as
well.
b) Power transmission to the existing plants or to the destinations of sold
energy shall be covered by FELDA.
c) For steam supply to the existing plants, tie in points shall be set on the
boundary line between the existing plants and the newly established
plant, and the conveyance beyond the points shall be covered by FELDA.
d) In the case of IPP, the system shall have an output power rating which
can be met by the volume of EFB yielded in 10 palm oil mills.
(2) Supply and Demand of Power and Steam
According to the plan for the case of execution of this project, the diesel
generators and boilers, which have been installed individually in the plants and
villages lying within SAHABAT COMPLEX, will be integrated into a newly
installed system and power and steam will be supplied from the newly system.
As to power demand, it differs between the usual season time and the busy
season (i.e. the time of high FFB yield), which are 6 months of year each.
Table 2.2.4.1-1, Fig. 2.2.4.1-1 and Fig. 2.2.4.1-2 show power demand for each
time zone in these.
Table 2.2.4.11 Power Demand (MW)
Hour 0—7 7—17 17-19 19-23 23-24Usual Season 2.53 4.93 5.19 2.79 2.53Busy Season 4.93 4.93 5.19 5.19 4.93
-2-43

(3) Pretreatment of EFB
When the FFB reaped in plantations have been sterilized with steam, the EFB
after fruits picked off have been moistened by the condensed water from steam,
and thus water content of the EFB is greater than the original content which
they have as vegetation, and their surfaces are wet.
Consequently, the green EFB have a water content of approx. 65 % and a
colorific value (lower) of approx. 4,260 kj/kg (1,018 kcal/kg), and are bunches of
about 300 X 400 mm in dimensions. Therefore they are unfit to put as fuel in
boilers, as they are, and cutting up and reduction in water content are needed as
pretreatment.
Since water content, calorific value and dimensions at throwing in must be
rationalized according to the types of boilers, pretreatment is carried out so that
the following specifications are got:
Table 2.2.4.1-2 EFB Specifications Pretreated
Water content
(%)
Calorific value
(kj/kg)
Dimensions
(mm)
Fluidized bed boiler Dried till 60 4,605 - 5,025 Cut up into 50 ~ 100
Stoker boiler Dried till 45 7,536 - 8,374 Cut up into 25 ~ 50
2.2.4.2 Demand and Supply Balance of Power and Plant Steam afterIntroduction of the Co generation System.
As to the EFB burning power station, the auxiliary power ratio to the total
power generated is very high because the auxiliary power for the pretreatment
system in the station is greater than in the ordinary fossil-fuel-burning power
station.
Accordingly, in the case of Industry-owned Power Plant, gross generating
output must be considerably raised, to.maintain the power supply of 7,000 kW
(when no plant steam supplied) even if turbine back pressure becomes 0.23 bar
(abs.) owing to vacuum down in the condenser.
However, realistically, power consumption in the oil refinery out to also reduce
when no steam is supplied, and thus the nominal gross generating output has
been set at 7,800 kW (at the worst turbine back pressure).
—2—45—

As to IPP, the nominal gross output has been set at 16,000 kW (at the worst
turbine back pressure) with the EFB yield taken into consideration.
A heat balance calculation made under these conditions has resulted in a
boiler MCR evaporation of 39 t/h for Industry owned Power Plant and that of
77.2 t/h for IPP.
Since the turbine can suck these quantities of steam, 8,090 kW for
Industry-owned Power Plant and 16,340 kW for IPP are obtained as turbine
capability (TBC). (See Table 2.2.4.2-1.)
Table 2.2.4.21 Unit Output
Item Industry-owned Power Plant
IPP (Reference)
AtVacuum
down
TBC RatedLoad
AtVacuum
down
TBC RatedLoad
Evaporation t/h 38.4 39.0 39.0 77.2 77.2 77.2TB Back Press. bar(a) 0.23 0.167 0.167 0.23 0.167 0.167Steam Supply t/h 0 0 16 0 0 16Gross Output kW 7,800 8,090 5,570 16,000 16,340 13,391
The results of demand and supply balance calculation on the planned plant
power and plant steam with these output values as the base, are shown in Table
2 2.4.2-2 and Table 2.2.3.2 3.
Table 2.2.4.2-2 Demand and Supply Balance (in the case of Industry-owned PP)
Unit F B B Sto &erElectric Demand MW 2.53 2.79 4.93 5.19 2.53 2.79 4.93 5.19Steam Demand t/h 16 16 16 16 16 16 16 16Gross Power Output MW 3.731 4.028 5,570 5.570 4.111 4.424 5,570 5,570Power Consumption in PP MW 1.201 1.238 1.460 1.460 1,581 1.634 1.848 1.848Power Consumption Ratio* % 32.2 70.7 26.2 26.2 38.5 36.9 33.2 33.2Capable TransmissionPower to SAHABAT
MW 2,530 2.790 4.110 4.110 2.530 2.790 3.722 3.722
Req. D G back up Power MW 0.000 0.000 0.820 1.080 0.000 0.000 1.208 1.468* : Ratio of (Power Consumption in PP)/( Gross Power Output)
—2—46—

Table 2.2.3.2-3 Demand and Supply Balance (in the case of IPP- for Reference)
Unit FBB StokerElectric Demand MW 2.53 2.79 4.93 5.19 2.53 2.79 4.93 5.19Steam Demand t/h 16 16 16 16 16 16 16 16Gross Power Output MW 14.390 14.390 14.390 14.390 14.390 14,390 14.390 14.390Power Consumption in PP MW 2.637 2.637 2.637 2.637 3.455 3.455 3.455 3.455Power Consumption Ratio ■ % 18.3 18.3 18.3 18.3 24.0 24.0 24.0 24.0Capable TransmissionPower to SAHABAT
MW 11.763 11.763 11.763 11.763 10.935 10.935 10.935 10.935
Req.D G back-up Power MW 0.00 0.00 0.00 0.00 0.00 0.00 0.00 0.00Capable Power to sell MW 9.223 8.963 6.823 6,563 8.405 8.145 6.005 5.745
The systematic flow diagram and arrangement plant for the plant projected
based on these conditions are shown in Fig. 2.2.4.2-1 to Fig. 2.2.4.2-6.
-2-47-

to
oo
STACKCYCLONE
SAG FILTER
GAS AIR HEATER
BOILER
EFB RECEIVING STATION
SHRE00ERi
THRESHER
MW
SLUDGETANK
ASH HOPPER
OEA lalalCONTROLQ RECEIVER
COMPRESSOR(roe BOILER OEA 1*1*1
GNERATORAUXILIARY
COOLING TOWER
PUMPCONOENSATE
COOLERP
(in STEAM) NAKE-UPWATER
SOOTBLOWER
OEMINERALIZER WATER TANK
OEHINERAUEO WATER
Fig. 2.2.4.21 Overall System Diagram (In the case of Fluidized Bed Boiler)

txD
to
EFB RECEIVING STATION
CYCLONE
_^jlE»^ER
ORYER / SILO
“3MW . ccj
SAMPLING,EQUIPMENT5 Iron BOILER Q- - - - - - -
AIRCOMPRESSORgPJ
OEHUHIDIFIERAIR |—| r CONTROL
.AUXILIARYAIR
GNERATOR
U
BAG FILTER
(12k STEAM)
:6666& SOOTBLOWER
bfp©
OENINERALZEOOEHINERALIZER WATER TANK
OENINERALZEO WATER
COOLING TOWER
DEAERATOR
Fig. 2.2A.2-2 Overall System Diagram (In the case of Stoker Boiler)

GATE HOUSE
OFFICE
NOT BLAST
BAG FILTER
STEAM TURBINECOOll MG TOWERATHLETIC FIELD
DEMINERALIZINGSTATION
WATER YARD
WASTE WATER YARD
STACK
BOILERGAS AIR
BAG FILTERHill! tMtW
Fig. 2.2.4.2 3 Overall Layout Plan (In the case of Industry-owned Power Plant
Fluidized Bed Boiler)
— 2 — 50 —

TRUCK SCALE
SLUDGE OIL YARH/ Brtlk calltr CIMNOFFICE
BOILER
STEAM TUHIIMECOOL IMG TOMERATILETIC FIELD GENERATOR
DEMINERALIZINGSTATION
TRANSFORMERWASTE MATER TARO SWITCH YARD
zoaooo
Fig. 2.2.4.2 4 Overall Layout Plan (In the case of Industry-owned Power Plant
Stoker Boiler)
2 — 51 —

TRUCK SCALE
i'iliS i'SSBST!Hull »M f SLUDGE OIL TARH j . j
[| | O ; |PARtiNc;OFFICE
l hbtbdst a
GATE HOUSE
"im
b
2OB0Q0 J
STACK
BOILER
BAG FILTER
Dm« TAmRer
Fig. 2.2.4.2 5 Overall Layout Plan (In the case of IP P Fluidized Bed Boiler)
(For Reference)
-2-52-

TRUCK SCALE
Hull »»«c< tx—er »illSLUDGE Oil YARQ
OFFICE
SLUDGE TARO
BAG FILTERBOILER
STEAM TURBINEEFB RECEIVING STATION COOLING TONERATHLETIC FIELD
DEMINERALIZINGSTATION
ELECTRICROOM
BASTE WATER YARD SWITCH YARD
200000
STACK
BOILER■GAS AIR
Dim TNitalwDm* TNteiNei
Fig. 2.2.4.2 6 Overall Layout Plan (In the case of IP P Stoker Boiler)
(For Reference)
— 2 — 53 —
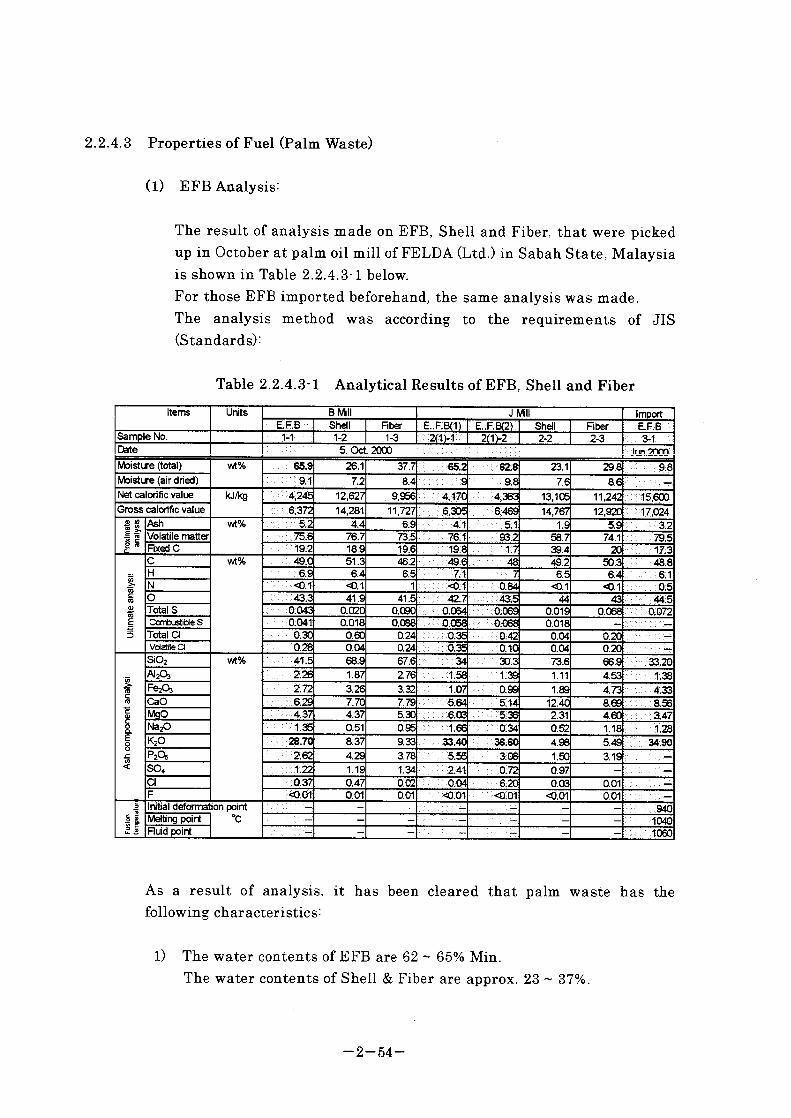
2.2.4.3 Properties of Fuel (Palm Waste)
(l) EFB Analysis:
The result of analysis made on EFB, Shell and Fiber, that were picked up in October at palm oil mill of FELDA (Ltd.) in Sabah State, Malaysia is shown in Table 2.2.4.3-1 below.For those EFB imported beforehand, the same analysis was made.The analysis method was according to the requirements of JIS (Standards):
Table 2.2.4.3T Analytical Results of EFB, Shell and Fiber
Items Units B Mill J Mill ImportEFB Shell Fiber E.F.Bd) E..F.B(2) Shell Fiber EFB
Sample No. 1-1 1-2 1-3 2(1 M 2(1>2 2-2 2-3 3-1Date 5, Oct. 2000 Jun.2000Moisture (total) wt% 65.9 26.1 37.7 65.2 62.8 23.1 29.8 9.8Moisture (air dried) 7.2 8.4 9.8 7.6 8.6 —
Net calorific value kJ/kg 4,245 12,627 . 9,956 4,170 4,363 13,105 11,242 15,600Gross calorific value 6,372 14,281 11,727 6,305 6,469 14,767 12,920 17,024
Prox
imat
ean
alys
is Ash wt% ^^■5.2 4.4 6.9 . ::4:1 1.9 5.9 3.2Volatile matter 75.6 76.7 73.5 76.1 93.2 58.7 74.1 79.5Fixed C 19.2 18.9 19.6 19.8 W 39.4 20 17.3
Ulti
mat
e ana
lysis
C wt% 49.0 51.3 46.2 49.6 48 49.2 50.3 48.8H 6.9 6.4 6.5 ^ 7.1 -V 7 6.5 6.4 6.1N <0.1 <0.1 1 <0.1 0.84 0.1 0.1 0.5O 43:3 41.9 41.5 -w#2:7 44 43 44.5Totals 0.043 0.020 0.090 0.064 O06S 0.019 0.068 0.072Combustibles 0.041 0.018 0.088 0.058 0.068 0.018 —
Total Q 0.30 0.60 0.24 0.35 0.42 0.04 0.20 —
Volatile Cl 028 0.04 0.24 ■Vi:': 0.35 0.10 0.04 0.20 —
Ash
com
pone
nt an
alys
i
SiOz wt% 41.5 68.9 67.6 'i/::34 30.3 73.6 66.9 33.20AI2O3 2.26 1.87 2.76 1.58 1,39 1.11 4.53 1.38Fe203 2.72 3.26 3.32 1.07 0.99 1.89 4.73 4.33CaO 6.29 7.70 7.79 5.64 5.14 12.40 8.69 8.56MqO 4.37 4.37 5.30 6.03 5.36 2.31 4.60 3.47Na^ 1.35 0.51 0.95 1.66 0.34 0.52 1.18 1.28k2o 28.70 8.37 9.33 33.40 36.60 4.98 5.49 34.90P2O5 2.62 4.29 3.78 : V 5.55 3.08 1.50 3.19 —
S04 : : 1.22 1.19 1.34 2.41 0.72 0.97 —
a 0.37 0.47 0.02 0.04 6.20 0.03 0.01 —
F <0.01 0.01 0.01 <0.01 <0.01 0.01 0.01 —
tem
pera
turi Initial deformation point - - : x - — — 940
Melting point °C - - ■ ' : - - — 1040Fluid point .;: - - - ■' ■ - - - 1060
As a result of analysis, it has been cleared that palm waste has the following characteristics:
l) The water contents of EFB are 62 ~ 65% Min.The water contents of Shell & Fiber are approx. 23 ~ 37%.
—2—54
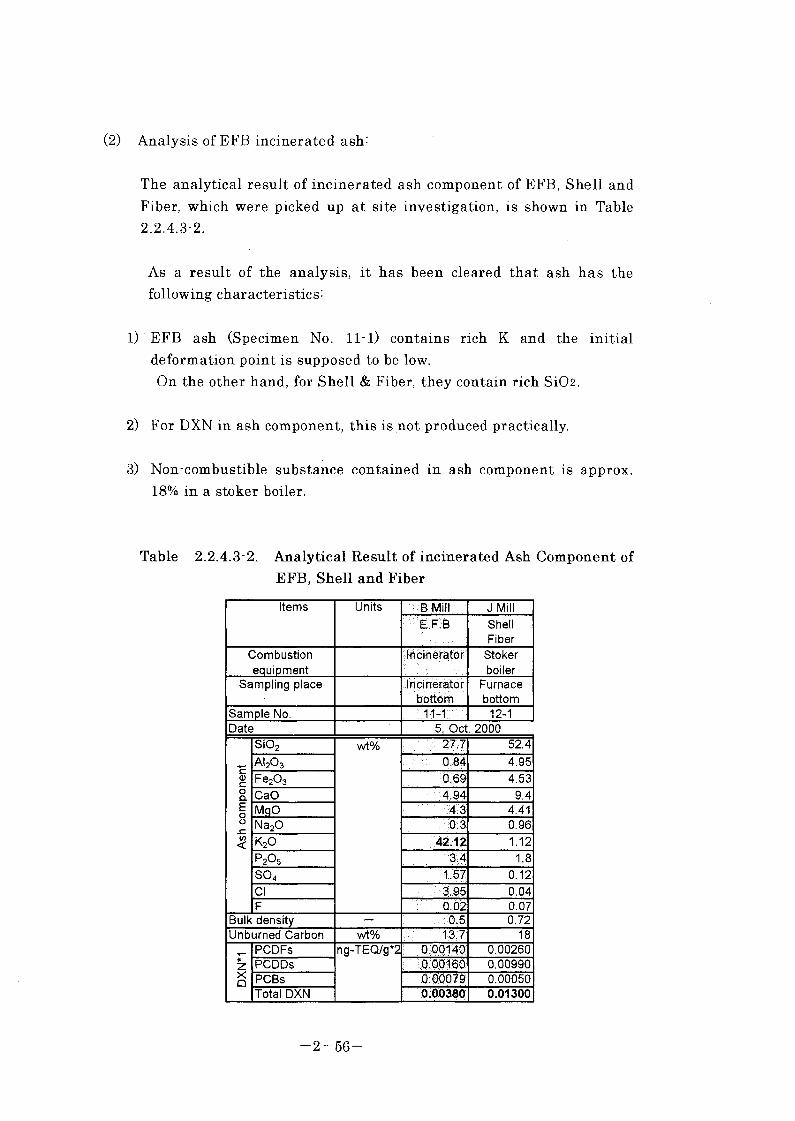
(2) Analysis of EFB incinerated ash:
The analytical result of incinerated ash component of EFB, Shell and Fiber, which were picked up at site investigation, is shown in Table2.2.4.3-2.
As a result of the analysis, it has been cleared that ash has the following characteristics:
1) EFB ash (Specimen No. Il l) contains rich K and the initial deformation point is supposed to be low.On the other hand, for Shell & Fiber, they contain rich Si02.
2) For DXN in ash component, this is not produced practically.
3) Non-combustible substance contained in ash component is approx. 18% in a stoker boiler.
Table 2.2.4.3 2. Analytical Result of incinerated Ash Component of EFB, Shell and Fiber
Items Units B Mill J MillE.F.B Shell
FiberCombustionequipment
Incinerator Stokerboiler
Sampling place Incineratorbottom
Furnacebottom
Sample No. 11-1 12-1Date 5, Oct. 2000
Ash
com
pone
nt
Si02 wt% 27.7 52.4
AI2O3 0.84 4.95
Fe203 0.69 4.53
CaO 4.94 9.4MgO 4.3 4.41Na20 0.3 0.96
K20 42.12 1.12P2O5 3.4 1.8
OCO 1.57 0.12
Cl 3.95 0.04F 0.02 0.07
Bulk density — 0.5 0.72Unburned Carbon wt% 13.7 18
DX
N*1
PCDFs ng-TEQ/g*2 0.00140 0.00260PCDDs 0.00160 0.00990PCBs 000079 0.00050Total DXN 0.00380 0.01300
-2-56-

3) Test results:Tests were conducted in accordance with the requirements of procedure specified shown in Fig. 2.2.4.4-1 and Fig. 2.2.4.4-2 above.Then the shape of products were classified into several components, the details of which are shown in Table 2.2.4.4-1 below:.
Table 2.2.4.41 Shape of Products
Results I II IllShape Lump Long fiber Short fiber
Fig. 2.2.4.4-10 Fig. 2.2.4.4-11 Fig. 2.2.4.4-12Dimensions 70 x 200mm Approx.
100mm MinApprox,30mm Max
Products No. 6, 9 1, 3, 5, 7 2, 4, 4', 8Features • A lump may • Fibers can • Fibers can
keep EFB not keep not keep
shape EFB shape EFB shape
• Lumps are • Fibers are • Fibers are
not entangled entangled not
and easy to each other entangled
handle. and difficult each other
* Bulk density to feed and easy to
is large. stably..
* Bulk density
is small.
feed stably..
• Bulk density
is small.
• There is no much difference for the shape existed betw
raw material EFB after crushing.
een dry EFB and
• Fibrous property of EFB after crushing is soft than that of dry EFB, and
featured by less entangling forces.
-2-60-

(2) EFB combustion test-By using a traveling stoker furnace (burning rate: 100 kg/h), actually the EFB combustion test was conducted on December 18~19, 2000.
l) Test facilities:The system diagram of the test stoker furnace is shown in Fig. 2.2.4.4-13 and the overall photo is shown in Fig. 2.2.4.414 respectively.
The fuel feeding rate regulator for the test stoker furnace, was actuated by adjusting “Chain feeding speed” (adjusted by means of an inverter and “Gate height” adjustment.
Combustion gas generated above the chain is then fed towards in front of the furnace passing through the effluent pipe and reversing against the flow in the rear furnace.Then, again the combustion gas reverses here, and is exhausted from the combustion furnace passing through the effluent pipe.
On the other hand, cinders are fed towards on the chains, and then, the cinders are conveyed and accumulated on the furnace bottom ash hopper.
Air for combustion is injected from three places as specified below: Primary air blown up from the chain bottom section. Secondary air injected from the sides of floor, and Third air injected from the upper and side sections.
According to this combustion test facilities, two systems and paralleled stacks are installed.One stack is useful to exhaust effluent gas from the cyclone to externally passing through the stack.The other stack is useful to exhaust effluent gas externally passing through branched bag-filter.

2) Specimen fuel:As the specimen fuel, imported EFB beforehand was used.(The properties are specified in Table 2.2.4.3-1: Sample No.3)
The imported EFB is different from original EFB in water contents and lower heating values, because it was bundled (Dried EFB (fibrous) after crushed and dried.
Dried EFB (long fibrous) is featured by long fiber, it was crushed into short fiber beforehand.
(Fig. 2.2.4.4-15 Dried EFB (fibrous) Crushing Treatment)
"Original shape> Dried EFB (fibrous)Type of fuel : Compressed and molded, Size: approx. 1 x 1 x lm
I
<Primary crushing>Crusher: Multi-rotor, Passing-through mesh size: <f> 40 mmFibrous status ^ Length of fiber:Type of fuel : J 20 ~ 30 mm or longer
-
<Secondary crushing>Crusher: Multi-rotor, Passing-through mesh size: <£ 10 mm Fibrous status 1 Length of fiber: 10 mm Max.Type of fuel : J Bulk density: approx. 0.15
Fig. 2.2.4.415 Dried EFB (fibrous) Crushing Treatment
3) Running condition:
In order to adjust the dried EFB and the heating value, water added EFB specimen in which water is contained was used.Table 2.2.4.4-2 shows the Running condition used this time test.
The chain stoker furnace was planned to use where the input heat capacity is 1,675 MJ/h (lowlevel heating value base).
—2—64—

When the input amount of this time fuel is converted, this becomes approx. 100 kg/h.Moreover, in the course of water adding test, for the original water evaporation sensible heat addition, the fuel amount is required to increase.This time, the test was conducted under the condition that the fuel amount was fixed.On this occasion, the input heat capacity (at low level base) is less than 1,675 MJ/h.
Table 2.2.4.4-2 Running ConditionDescription Unit Specimen No. C Specimen No. GFuel used — Dry EFB Water added EFBFuel input kg/h 100 kg/h 100 kg/hamount (Target value) (Target value)
60-70 kg/h 87-111 kg/hAmount ofwater added
kg/h 0 kg/h 39-55 kg/h
02 % 7 - 8%concentrationAir — Air on furnace bed ^ 0.1 ~ 0.2distribution
4) Confirmation item, details of test and testing method:
The test confirmation items selected this time are as follows:
(a) Make sure the combustion status dried EFB (fibrous) in the furnace and water added EFB.
(b) Perform property analysis of picked up ash from several places (furnace bed ash, cyclone ash, bag-filter ash).
(c) Perform flue gas components (02, NOx, SOx, Flue gas dust concentration and Flue gas dust particle distribution)
(d) Measure temperature at inside furnace and flue gas temperature.
2-65-

b) Property analytical result of flue gas:
Flue gas property at the boiler outlet (upper stream of cyclone) was analyzed.Then the analyzed results are shown in Table . 2.2.4.4-3 below:
For NOx, the analyzed value was a little higher than usual; it showed 120 ppm (converted value).For the other analyzed values, they were confirmed that they were sufficiently low.
White smoke was observed from both the stacks:From one stack, after flue gas was passed through the cyclone, the white smoke was observed.In the same way, from the other stack, after flue gas was passed through the bag-filter, the white smoke was observed.
After elapsing the warming up period, when the flue gas temperature was reached at 90°C, or more, no white smoke was observed from the second stack, but it was observed continuously from the first stack.Dust which has passed through the bag-filter, the amount of dust will be decreased (Dust removal efficiency: 98.5%) sufficiently.In the flue gas which was passed through the cyclone, much dust will be remaining, which will become the cause of white smoke.
On the contrary, for white smoke which will be generated at the starting of the machine, this will be caused by steam containing in the flue gas.
-2-67-

Table 2.2.4.4-3 Conditions at Analysis of Flue Gas PropertyDescription Unit Measured values Remarks
Measure-mentcondition
Flue gas temperature °C 169Amount of flue gas m* N/h 2110 WettingWater content % 5.17 vol%Gas flow rate m/s 25.3Gas propertyC02 % 4.1 vol%O2 % 16.1 vol%CO % 0.0 vol%N2 % 79.8 vol%
Analyticalresults
Sulfur oxides (SOx) ppm Less than 2 Raw value(Conversion value) Nm*/h Less than 0.004 TotalNitrogen oxides (Nox) ppm 63 Raw value(Conversion value) ppm 120 12% conv.valDust furnace outlet mg/m-N 560 Raw valueUpstream of cyclone (Conversion value)
mg/m-N 1100 12% conv.val
Dust stack outlet mg/m-N 8.6 Raw value(Downstream of bagfilter(Conversionvalue)
mg/m-N 16 12% conv.val
(b) Water addition EFB:
The water addition amount and the combustion status are summarized in Table 2.2.4.4-4 below.
Concerning Chain stoker type combustion, it was confirmed that stabilized combustion is possible when the water contents are approx. 43%
In this case, however, this is on the premise that stabilized fuel supply can be ensured.In the course of test conducted this time, if the supply of fuel oil was decreased temporarily, the inside furnace temperature has been decreased suddenly, and it was become practically in a state of miss-fire.
—2—68—

Table 2.2.4.4-4 Amount of Water Addition and Combustion Status
No. Amountof fuel
kg/h
Amountof wateradded
kg/h
FullWatercontent
% %
Combustion status
G-2 111.06 39.00 33.2 In all cases, at the addition of water, it was confirmed that continuous burning is feasible.For the inside furnace temperature, 700 ~ 770 ° C is stabilized.For the combustion position, at dry EFB, it was adjacent to the chain stoker fuel inlet position.Then the position moves to the back flowing section a little, ash in the chain stoker rear flow section is blackened and much carbon is contained.. However, flame might be formed, and remained a fire as it is.
G 3 104.40 44.00 36.5
G-l 94.90 47.48 39.9
G-4 86.58 44.10 40.2
G-5 94.69 54.86 42.9
% For the full water content, the water content display considered as follows:
(c) Property of sampling ash:
Kinds and appearance of ash sampled this time are summarized in Table 2.2.4.4-5 below.
Table 2.2.4.4-5 Kinds and Appearance of Ash Sampled This Time
Date 12/18 12/19 12/19 12/19Picked up ash
Furnace bed ash at trial run
Furnace bed ash at trial run
Cyclone ash at trial run
Bag-filter ash at trial run
SampleNo.
No.21 No.2-2 No. 3 No.4
Status Ash is required to maintain in the furnace for 24hours, andremaining substance will be burnt out slowly.
Upon completion of test, collect ash from the furnace bed, which isthen put into in a pale can.The a lid is placed on the can so as to stop burning action under the nooxygen state.After that, ash accumulated on the furnace bed will be burnt out slowly as a remaining fire.
Fine ash was collected.Without burning,rawEFB was mixed with ash.
In a drying state, fine ash was collected.When the state was maintained for 24 hours, small lumps were formed by absorbing moisture.
Photo Fig.2.2.4.4-16 Fig.2.2.4.4-17 Fig.2.2.4.4-18 Fig.2.2.4.4-19
— 2—69—

and as a result, in-furnace environmental temperature was shifted lowly, and the burning point is only in a place adjacent to the inlet port only. Moreover, in the no-oxygen state, combustion reaction is being stopped.This means that much K is remaining in ash, and the fuel is similar to the ash component.
c) For No.3 cyclone ash, K component might be decreased a little.However, for other components, they might be similar to the fuel ash organization.Because a great many amounts of Fe20.s are existed in ash, which can be detected by rust available in the machine and equipment.
d) For No.4 Bag-filter ash, there is a tendency that Fe2 0.3, K2O, and Cl are condensed in ash.For Fe component, in the same way as No.3, rust in machine and equipment might exert some influences.For K and Cl, condensate degree is high than that of No.3 ash.In particular, Cl becomes 17%.On the other hand, for Si component, the concentration is being decreased.
e) With the comparison of No.3 and No.4 ash property, the below items are estimated:Once evaporated Cl will adhered to very small particles which pass through the cyclone.Moreover, for K component, it is supposed that it will be existed in the form of KC1 component.In this state, K components accumulated by the Bag-filter may be condensed.
On the other hand, Bag-filter ash has poor Si component.This means that ash which flows in the stack passing through the cyclone has rich Si component.
White smoke generated from the cyclone outlet stack is supposed to mainly composing with Si component which was caught by the cyclone.
-2-71-

Table 2.2.4.4*6 Property Analyzed Values of Collected Ash
Items Units Fuel Collected Ash
dry E.F.B Bottom Ash Bottom Ash CycloneAsh
Bag-filterAsh
(Gray clinker (Black)sample No. No.1 No.2-1 No.2-2 No 3 No.4Date 2000.6 2000.12.18 2000.12.19 2000.12.19 2000.12.19
Moisture (total) wt% 9.8 — - — —Moisture (air dried) — — - — -Net calorific Value kJ/kg 15,600 — — — —
Gross calorific Value 17,024 — — — -
» .S2 Ash wt% 3.2 — — — —
1 1 Volatile matter 79.5 — — — —o <oo Fixed C 17.3 — — — —
C wt% 48.8 — — — —,S2 H 6.1 — — — —
■ S N 0.5 — — — —0 44.5 — — — —
% Total S 0.072 — — — —E Combustible — = — — =5 Total Cl — — — — —
Volatile Cl — — — — —SiC2 wt% 33.20 63.00 7.14 28.40 0.76
•3AI2O3 1.38 9.00 0.57 3.05 1.06
J| Fe203 4.33 6.99 1.62 10.20 9.76CaO 8.56 9.20 1.47 7.18 4.91
C MqO 3.47 2.72 0.94 3.65 0.36| Na20 1.28 0.85 0.09 0.73 0.368 k2o 34.90 6.48 10.50 25.20 40.601 P2O5 — 2.03 0.81 2.80 0.21
S04 — 0.02 0.05 3.05 7.28Cl — 0.01 1.15 2.15 14.08F — — — — —
1 Initial deformation point 940 — — — —
# Melting point °C 1040 — — — —
II Fluid point 1060 — - — —
6) Conclusion
(a) Comparatively much non combustible substances were observed in ash.In particular, in the Chain stoker furnace, it has been confirmed that crushed EFB can be burnt out continuously and successfully.
(b) In the water added EFB combustion test, it has been also confirmed that crushed EFB can be burnt out continuously and successfully in the case of water content rate rise up to 43% by using this furnace.
-2-72-

(c) Dust, which was generated during EFB combustion, can not be caught by the Cyclone sufficiently.However, the Bag-filter can do it successfully.In this case, it has been confirmed that white smoke component composed of dust particles can be cut sufficiently.
(d) It has been also confirmed that NOx and SOx concentration in flue gas is sufficiently low.
(e) If EFB incineration ash is maintained at high-temperature, it has been confirmed that clinker is generated,This means that extreme care must be taken for the selection of combustion temperature.
2-73-

2.2.4.5 Specifications of Planned Facilities
2.2.4.5.1 Steam Condition
Referring to section 2.2.4.1 and section 2.2.4.2 above, thespecification of both the industry-owned power plant and the IPPshall be as follows:
• Steam pressure shall be at 41-bar (600 psi), which is the highest pressure within the specified pressure range after considering the efficiency and extraction within the pressure range (300 ~ 600 psi) in conformity with the requirements of FELDA.
• Steam temperature shall be at 450° C.
The reason why is as follows:
1) In conformity with the requirements of enforcement site (enterprise);Such as so as to satisfy the condition that power supplying out put is 7,000 kW when condenser vacuum rate is decreasing (0.23 bar (a)) without process steam supply, it is necessary to apply highly-efficient unit as far as possible.At the same time, the back-up power shall be considered to decrease as small as possible.
2) Moreover, for the major steam pressure, it shall be so designed that the process steam is obtainable from turbine steam extraction.
3) For the major steam temperature, suitable temperature shall be selected so as to prevent the machine from Cl corrosion.
Referring to the results of examination on steam condition, theplanned heat balance is shown in Fig. 2.2.4.5.11 ~ Fig.2.2.4.5.1-6 below-
— 2—74—

ea | <8» | 3»o ■«m. ' ..«m.m
! CZX ' 02 3W
130 IM 00130 I HM t M ! 130 I 313 I »
B -TB CAPABILITY (NO PROCESS STM) -at Vacuum Down(NO PROCESS STM)
PO— 0UW1 MRS. FBJMCMAUMSU) 781AV P P ( FOB and Stoter)
HEAT BALANCE DIAGRAM
PATE _____ 2001-2-9_______________ _______WA3S-A0EOO1-<R0
Fig. 2.2.4.5.1-1 Heat Balance in Industry-owned power plant(Maximum Loading)
400 1U60 I 90
m li«o i i&o
1-----RATED LOAD(16T/H PROCESS STM)MOTE P : taXa)
T : ‘C
POWPu*ir»v CU«T MRS FELDA^MALA'VSIA) NAME 7BMWPP (FBBwdSmler)
HEAT BALANCE DIAGRAM61MBA3S
_____ 2001-2-9_______________ ommm MBA35— A0E0O2-4R0
Fig. 2.2.4.5.1-2 Heat Balance in Industry-owned power plant(Rated Loading* At Steam Supply)
-2-75

go I <300 I «tgo F <800 I 010
mOJJMjwow-
j-CZ-Laj.
NOTEj NIGHT T!ME<1 ST/H PROCESS STM) ? :j----- MIDNIGHT (16T/H PROCESS STM) t : c
Fig. 2.2.4.5.1-3 Heat Balance in Industry-owned power plant(Rated Loading* At Steam Supply)
(Fluidized Bed Boiler)
rOW!ri>P.-DV cuss iW-PiANT BTSCFaG)
HEAT BALANCE DIAGRAMNO. 61NBA35
DATE ____ 2W-2-3____________ —*1 M8A33-A0E0Q3-AR0
i. <m. .J.,gw 1 jsi
jiaoioa | m ;1130:32 I'M :
i____ :----- NIGHT TIMEC1 6T/H PROCESS STM)i____ '-----MIDNIGHT (1 6T/H PROCESS STM)
NOTE P : btr(a) T : C
IN-PLANT BTOC Staler) 7.BMW P.P (Stater)
HEAT BALANCE DIAGRAM61MBA35
P*te 2001 —2—A MBA3S-AOEOOA-4RO
Fig. 2.2 4.5.1-4 Heat Balance in Industry-owned power plant(Rated Loading* At Steam Supply)
(Stoker Boiler)
— 2 —16—

4800 | TO ICO I <800 I TO
013T7 [ |j m
M IW
1870 Tots
-----TB CAPABILITY (NO PROCESS STM)-----at Vacuum Down(NO PROCESS STM)
Fig. 2.2.4.5.1-5
NOTEmaiPuMim cuan MRSFELOAttlALAYSIA) 1QMWP.P. (FBB end Stoker)
HEAT BALANCE DIAGRAMNQ 61MBA35
PAT£ 2001-2-9 ______MBA3S-AOEOOS-ARC
Heat Balance in I P P (Maximum Loading)
(Reference)
JUBJ-HZ-pHU
-RATED L0AD(16T/H PROCESS STM)
Fig. 2.2.4.5.16 HEAT BALANCE DIAGRAMMB A3S- AOEOOC-ARO
(Rated Loading* At Steam Supply)
(Reference)
-2-77-

2.2.4.5.2 Boiler
In this Project, Fluidize bed boiler is main type to be considered. However, in conformity with the requirements of the Enforcement site (Enterprise), Stoker boiler may be included in the scope of installation specification.
Essential points to be considered in the boiler designing work shall be as shown below:
(1) Steam condition:For the steam condition, as specified above:
' Steam temperature : 450°C • Steam pressure : 41-bar (600 psi)
(2) Furnace designing:For EFB, 29 ~ 37% of K2O is available in 5% ash.As a result, the softening point of ash is comparatively low; at 940°C, and the melting point is at 1040°C.
A spacious furnace volume so as to prevent the rear heat transfer tube from sticking clinkers features the furnace designing.A two-stage combustion system is also useful to control combustion temperature, as well as to prevent the inside furnace from accumulation of clinkers.The draft system is balanced draft, and heat of exhaust gas is recovered and utilized for the heating up of combustion air.
The major specifications of the boiler used in this Project are as shown in Table 2.2.4.5.2-1 below:
2-78-

Table 2.2.4.5.21 Major Specifications of Boiler
Industry owned PP I P P (Reference)Type of the boiler — Single shell natural circulation typeCombustion method — FBB Stoker FBB StokerMax, working pressure bar(g) 50 50 50 50Steam and water condition:
Steam press. bar(g) 41 41 41 41Steam temperature °C 450 450 450 450MCR evaporation t/h 39 39 77.2 77.2Feed water temp. °C 137.9 137.9 137.9 137.9
Air temp. (FDF inlet) °C 30 30 30 30Ventilation system Balance
d draftBalanced
draftBalanced draft
Balanced draft
Fuel:Kinds — EFB EFB EFB EFBWater content in fuel % 60 45 60 45Calorific value (LHV) kj/kg 5,143 7,998 5,143 7,998
Boiler efficiency:HHV base % 59.66 63.58 59.76 63.68LHV base % 83.72 78.89 83.87 79.02
-2-79-

ISHcto
Fig. 2.2.4.5.2-1
Assembly Drawing of Fluidized
Bed Boiler
(Reference Drawing)
Fig. 2.2.4.5.22
Assembly Drawing of
Stoker Boiler
(Reference Drawing)
-2-80-

2.2.4.5.3 Turbine
The major specifications of steam turbine used in this Project are as shown in Table 2.2.4.5.3*1 below:
Table 2.2.4.5.3-1 Specifications of Steam Turbine
Industryowne IPPdPP (Reference)
[Turbine]
Type Speed-reduction-type impulse Condensing Extraction Turbine
at Rated / at Capability output kW 7,800/8,090 16,000/16,340Revolution (Turbine) rpm 10,000 7,100Revolution (Generator) rpm 1,500 1,500Number of Extraction — One point One pointSteam condition:- Pressure (at inlet of MSV) bar (a) 40 40- Temp, (at inlet of MSV) °C 445 445- Extraction press. bar (a) 12.9 17.6- Back press.(at Vacuum down / bar(a) 0.23/0.167 0.23/0.167
at Normal)- Main Steam Qty. t/h 38.2/38.8 77/77
(at Vacuum down / at Capability)- Extraction Steam Qty. t/h 3.8/3.9 7.9/7.9
(without Steam supply)- Exhaust Steam Qty.
(at Vacuum down / at Capability)t/h 34.3/34.8 69/69
Turbine heat rate kj/kWh 13,343/13,068 13,140/12,867[Steam Condenser]
Type Water-cooled surface-contacting type,two time flow, one section
Condensate amount (Planning point)
t/h 34.3/34.8 69/69
Vacuum rate in steam condenser bar(a) 0.23/0.167 0.23/0.167(at Vacuum down / at Capability)
Heating Surface Area m- 330 850Cooling water inlet temperature °C 32 32Cooling water outlet temperature °C 44 44
-2-81-
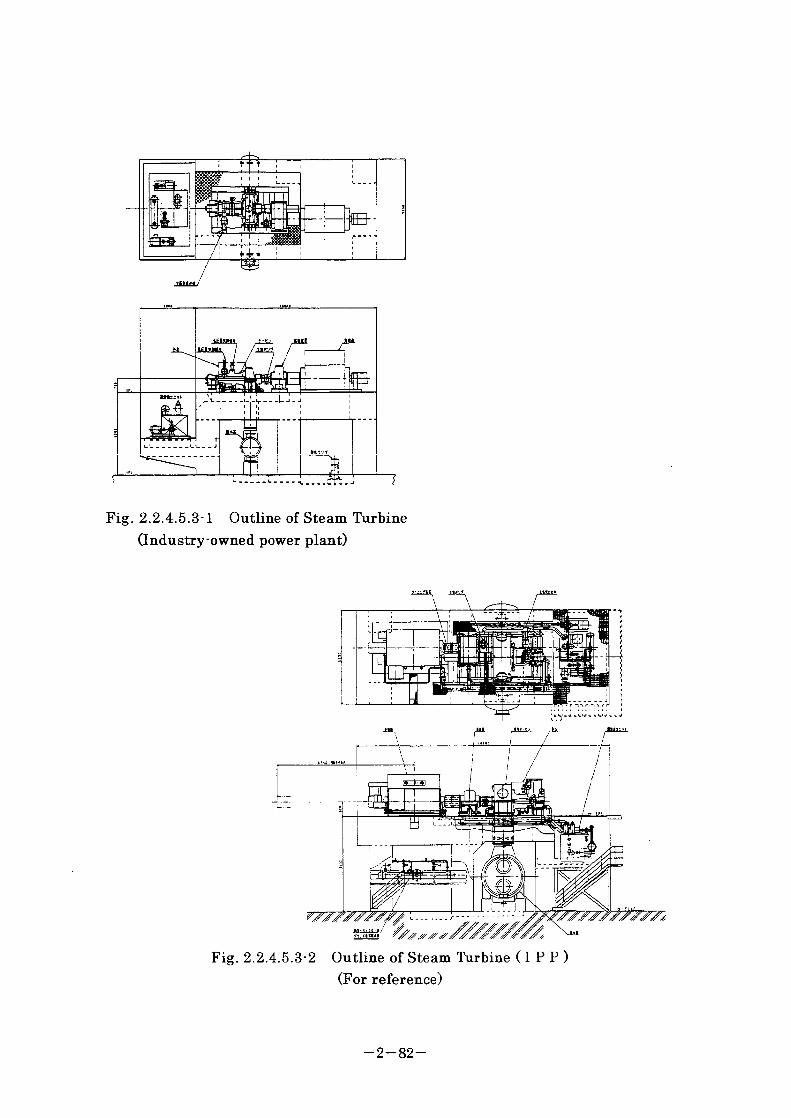
Fig. 2.2.4.5.31 Outline of Steam Turbine (Industry-owned power plant)
Fig. 2.2.4.5.3-2 Outline of Steam Turbine (I P P ) (For reference)
-2-82-

2.2.4.5.4 Generator
The major specifications of generator used in this Project are as
shown in Table 2.2.4.5.4-1 below-
Table 2.2.4.5.4-1 Specifications of Generator
Private power
generation
IPP
Model — 3-phase AC synchronous generator
Type Horizontal shaft, totally enclosed,
revolving field, air cooled,
blushless type
Ventilation system — Self-sustained ventilation system
Cooling system Both stator and rotor are
air-cooling type
Rated output kVA 9,750 20,000
Number of poles Pole 4 4
Revolution (Speed) rpm 1,500 1,500
Voltage kV 11 + 6% 11 + 6%
Frequency Hz 50 50
Power factor % 80 (Lag) 80 (Lag)

2.2.4.5.5 EFB Pretreatment System
(l) Requisites for Using EFB for Boiler Burning
Since EFB have hard fiber, large shapes and more than 60 % water content (as
mentioned above), a proper treatment system is indispensable.
As firing methods, there are the ‘stoker firing method’ and the ‘fiuidizedbed
firing method’, and the pretreatment system must be designed so that EFB are
turned to have water content and shapes adapted to the firing method.
The ‘stoker firing method’ has been mainly used so far for various biomass
wastes, such as the shells and fiber as palm oil mill waste, wood chips, bagasse
and bark.
As water content of fuel, about 50 % (corresponding to a lower calorific value of
7,118 kJ/kg) is the upper limit and more stable combustion becomes feasible at
about 45 % (corresponding to a lower calorific value of 7,955 kJ/kg). And also
from the ‘combustion test results’ (above-mentioned) by our company, stable
combustion at 43 % water content has been ascertained.
As the shape of EFB, a small Tump or fiber shape is adequate.
As to the shape after crushing, some crushing tests were conducted practically
in our company and it has been ascertained that the shape can be turned into
the small-lump shape or the fiber shape varying in length (above-mentioned).
The ‘fiuidized bed firing method’ gives good combustion efficiency and enables
combustion even with higher water content than in the stoker firing. As water
content of fuel, 65 % (corresponding to a lower calorific value of 4,187 kJ/kg) is
the upper hmit and stable combustion is feasible at about 60 % (corresponding
to a lower calorific value of 5,024 kJ/kg). As to fiber shape EFB, their carry-over
to the downstream side is apprehended, and thus the small-lump shape is
adequate (Table 2.2.4.5.5-1).
Table 2.2.4.5.5—1 Suitable Water and Shape of EFB for each Burning Method
Water in EFB Shape of E F B RemarksStoker Type Approx. 45% Small Lump or FiberFBB Type Approx. 60% Small Lump
-2-84-
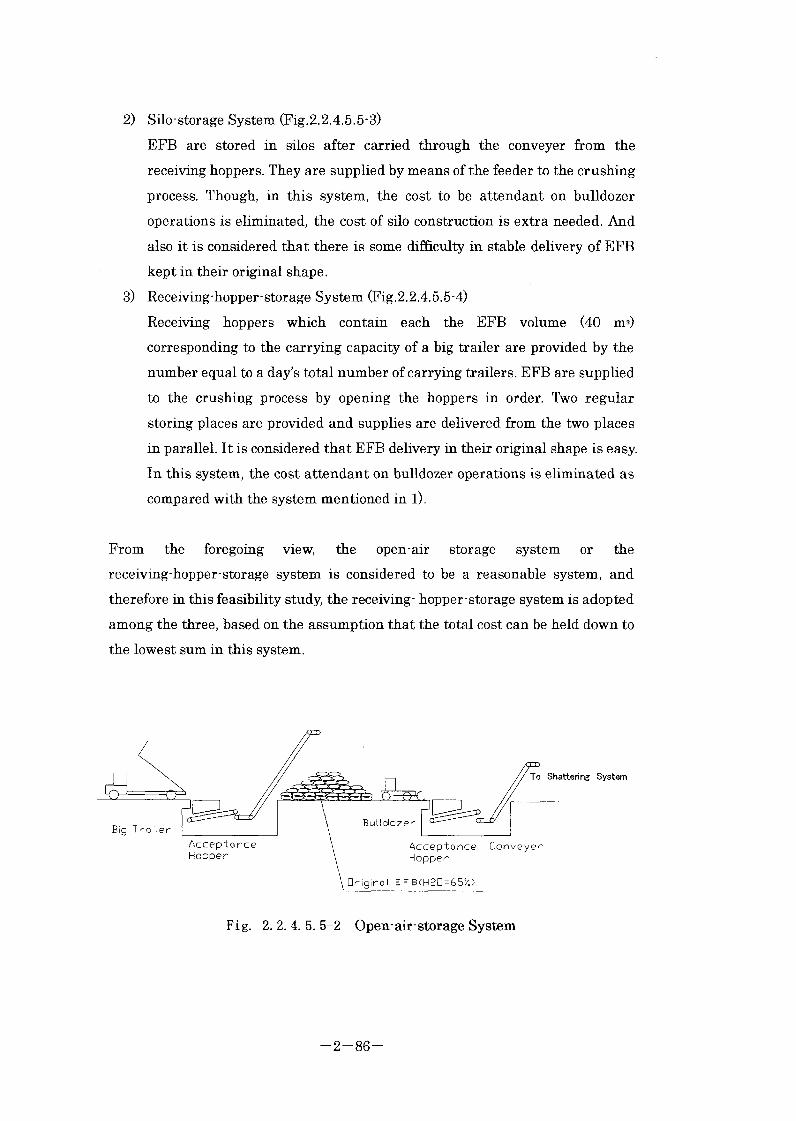
2) Silo-storage System (Fig.2.2.4.5.5-3)
EFB are stored in silos after carried through the conveyer from the
receiving hoppers. They are supplied by means of the feeder to the crushing
process. Though, in this system, the cost to be attendant on bulldozer
operations is eliminated, the cost of silo construction is extra needed. And
also it is considered that there is some difficulty in stable delivery of EFB
kept in their original shape.
3) Receiving-hopper-storage System (Fig.2.2.4.5.5-4)
Receiving hoppers which contain each the EFB volume (40 up)
corresponding to the carrying capacity of a big trailer are provided by the
number equal to a days total number of carrying trailers. EFB are supplied
to the crushing process by opening the hoppers in order. Two regular
storing places are provided and supplies are delivered from the two places
in parallel. It is considered that EFB delivery in their original shape is easy.
In this system, the cost attendant on bulldozer operations is eliminated as
compared with the system mentioned in l).
From the foregoing view, the open-air storage system or the
receiving-hopper-storage system is considered to be a reasonable system, and
therefore in this feasibility study, the receiving- hopper storage system is adopted
among the three, based on the assumption that the total cost can be held down to
the lowest sum in this system.
To Shattering System
Bulldozerig TrailerAcceptance Acceptance ConveyerHopper Hopper
Original E F B(H20=65X)
Fig. 2. 2. 4. 5. 5-2 Open- air - storage System
-2-86-

To Shattering System
ConveyerAcceptanceHopper
Fig. 2. 2. 4. 5. 5-3 Silo storage System
To Shattering System
Big Troller
Conveyer Conveyer
Fig. 2. 2. 4. 5. 5-4 Receiving- hopper - storage System
(3) Process of Crushing,. Processing and Drying
The EFB delivered by bulldozers from the open-air-storage place are cleared of
the earth and sand sticking to their surfaces by means of the thresher, first of all.
Then the EFB are crushed, pressed and dried to be turned to have water content
and shapes fitted to the firing system.
l) In the case of fiuidizedbed firing:
In the case of fiuidized bed firing, water content must be reduced to about
60% as mentioned before.
Since the volume of water to be removed in dehydration is less than in stoker
-2-87-

firing, either of the mechanical system and the drier system can be adopted.
On the other hand, in the mechanical system, EFB are turned into the fiber
shape and thus their carry-over at throwing-in is apprehended.
Accordingly, the system is desirable, where after the EFB of the original
shape are roughly crushed by means of the shredder, water is pressed out
from 65% content to 50 to 55% content by dehydrating the EFB of the
small-lump shape with drier. (Fig.2.2.4.5.5-5)
To Silo
Shredder
Conver Conver
DurmThresher
Hot Blast Stove
Fig.2.2.4.5.5 5 Process of Crushing, Processing and Drying(FBB)
As to the types of the shredder and the press, the optimum combination is
selected, with cost, power consumption, etc. taken into account and with
reference to the results of the crushing test by means of our company's
equipment (above-mentioned), etc.
By this process, the water content is lowered to 55 to 60% and the shape is
turned into the small lump shape.
2) In the case of stoker firing:
In the case of stoker firing, water content must be reduced to about 45% as
mentioned before.
Fig. 2.2.4.5,5-6 shows the relation between the water content of EFB and
water evaporation.
When EFB are dried from about 65% water content at their carry-in to about
45% water content, the higher the water content is, the more water is
evaporated, and evaporation decreases as the water content lessens.
—2—88—
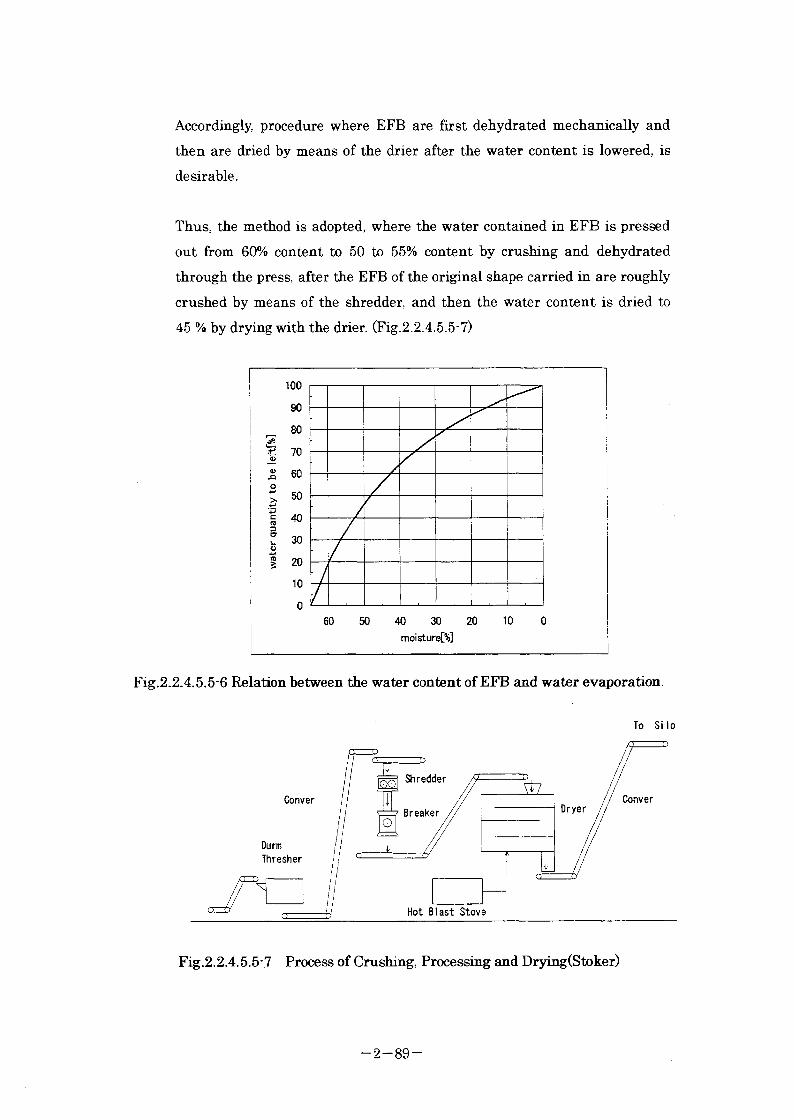
Accordingly, procedure where EFB are first dehydrated mechanically and
then are dried by means of the drier after the water content is lowered, is
desirable.
Thus, the method is adopted, where the water contained in EFB is pressed
out from 60% content to 50 to 55% content by crushing and dehydrated
through the press, after the EFB of the original shape carried in are roughly
crushed by means of the shredder, and then the water content is dried to
45 % by drying with the drier. (Fig.2.2.4.5.5-7)
moisture[%]
Fig.2.2.4.5.5-6 Relation between the water content of EFB and water evaporation.
To Si lo
Shredder
ConverConver7 Breaker
DurmThresher
Hot Blast Stove
Fig.2.2.4.5.5-7 Process of Crushing, Processing and Drying(Stoker)
-2-89-

As to the types of the shredder and the press, the optimum combination is
selected, with cost, power consumption, etc. taken into account and with
reference to the results of the crushing test by means of our company’s
equipment (above-mentioned), etc.
As to the drier, the method of heating indirectly with steam or the method of
heating directly with high-temperature gas is available.
Steam heating is undesirable because it leads to reduction in power
generated.
Though the high-temperature gas can be obtained by recovery of boiler waste
heat or by heating in the hot blast stove, the hot-blast-stove system is
adopted because the boiler heat recovery is insufficient in heat volume, and
it is considered to be better to use sludge oil instead of heavy oil.
By this process, the water content is lowered to 45 to 50% and the shape is
turned into fiber shape of 25 to 50 mm in length.
And the method can also be considered, where after crushed roughly by
means of the shredder, the water content is lowered from 65% to 45% by
using the drier only without using the press.
However, heat drying by this method is considered to be unfeasible, because
the drier must have large capacity and a great volume of heavy oil or sludge
will be needed and in addition the initial cost will rise if the hot-blast-stove
system is adopted.
(4) Process of Temporary Storage, Delivery and Weighing
The penetrated EFB are put in the temporary-storage silo. The silo serves as a
buffer for the pretreatment process and stabilizes EFB supply to the boiler. This
system is common to the stoker boiler and the fluidized boiler.
-2-90-

If the silo capacity corresponds to 2 hours’ boiler consumption, it is 650 (l300)/24
x 2 = 54 (108)t. With EFB of the fiber shape, it will come to 500 (500 x 2) m3 ,
assuming the bulk specific gravity to be 0.1, and with EFB of the small-lump shape, it
will come to 135 (135 x 2) m3, assuming the bulk specific gravity to be 0.4.
Delivery from the hopper is carried out by means of the reciprocating rake feeder
which has given actual results frequently for wool chips, etc. In this process, the
case where stable delivery is difficult owing to entangles in EFB, can be supposed
according to fiber length, but no such problem can be caused in the case of the
above-mentioned fiber length of 25 to 50 mm and in the small lump shape.
The weighing equipment is laid after the feeder to control the quantity of EFB fed
into boilers. The EFB delivered from the temporary- storage silo are carried by the
conveyor and branched into plural lines at a point on this side of boilers and then
are fed into the combustion chambers of boilers.
Besides, EFB are supplied directly from the conveyor to boilers because if any
small-capacity hoppers are provided just this side of boilers, clogging or the like at
the points of the hoppers is apprehended.
To Shattering System
Conveyer
Conveyer
Weighter
Fig.2.2.4.5.58 Process of Temporary Storage, Delivery and Weighing
(5) In the Case of 7.8 MW Industry-owned PP / Fluidized bed Firing
In Fig. 2.2.4.5.5-9 is shown the pretreatment system train.
EFB are carried in the in by big trailers and put in to the receiving hopper system
-2-91-

(D. The hoppers are provided so as to contain the volume of EFB, which
corresponds to 2 days' total number of the big trailers. EFB are delivered in order
from respective hoppers of their 2 trains and carried by the conveyer (2) to the
thresher (3), where they are cleared of earth and send sticking up their surfaces.
Then EFB are carried by the conveyer © to the coarse crusher © and carried
further through the accumulating conveyer (9) and the carried conveyer © to
the drier system ©. In result, EFB are dried to 60 % water content. After carried
by the conveyer © to the silo ©, they are stored once in it and then delivered,
and after weighed, they are carried through the conveyer © and the distributor
© and fed into the fluidized bed boiler.
Item Unit Value RemarksCarried in EFB amount t/day approx. 650 As water contained 64.63%Number of Palm Oil Mills supplying EFB
set 6
Big trailers in total N/day 32 Capacity of Trailer :20tEFB amount for Boiler combustion
t/h 28.13 As water contained 64.63%24.87 As water contained 60 %
©Receiving hopper 64 sets (20t/ set)
©EFB conveyer 2 sets (1.2mWidth X OOmLong)
©Drum thresher 2 sets (15t/Ti)
©Conveyer 1 set (1.2mWidth X 42mLong)
©High speed hammer mill 3 sets (8t/h/set including 1 set spare)
©Distributor —
©Break cutter oil extractor —
©Break cutter oil extractor —
©Accumulating conveyer 1 set (1.2mWidth X 26mLong)
©Sludge tank —
©Carrying conveyer 1 set (1.2mWidth X 23mLong)
©Distributor —
©Drier 1 set (35t/h)
©Carrying conveyer 1 set (l.2mWidth X 21mLong)
©Silo 1 set (135m3)
©Carrying conveyer 1 set (1.2mWidth X 21mLong)
©Distributor 3 sets

© ©
o Boiler
<£>CO
% Name Name % Name k Name© Receivme bomr © Fifh seetd hansel mill © Slvdee Holdme Tent © St lo© EFB coeverer © Distribution device © conveyer © conveyer
Drue Thresher © B'eak cel ter cue oilextractor III © Diitribulion device © Distribution device
©a convey#: (5) Break ceuer cue oil © drver© conveyer © conveyer © conveyer
Fig. 2. 2. 4. 5. 5 —9 EFB Pretreatment System for Industry-owned PP (FBB)

(6) In the Case of 7.8 MW Industry-owned PP/Stoker Firing:
In Fig.2.2.4.5.5.-10 is shown the pretreatment system train.EFB are carried in b ay big trailers and put into the receiving hopper system
CD. The hoppers are provided so as to contain the volume of EFB, which corresponds to 2 days’ total number of the big trailers. EFB are delivered in order from respective hoppers of their 2 trains and carried by the conveyer © to the thresher (3), where they are cleared of earth and sand sticking to their surfaces. Then after carried by the conveyer (D, EFB are turned into fiber being 50 to 55 % in water content and 25 to 50 mm in length by means of the coarse crusher (D, distributor (6), and the two trains of presses ©&®. The sludge coming from pressing is stored in the tanks ®. EFB are carried through the accumulating conveyer (9) and the carrying conveyer © and then they are dried to 45 to 50 % water content by means of the two drier systems After carried by the conveyer © to the silo ©, they are stored once in it and then delivered, and after weighed, they are carried through the conveyer © and the distributor © and fed into the stoker boiler.
Item Unit Value RemarksCarried in EFB amount t/day approx. 650 As water contained 64.63%Number of Palm Oil Mills supplying EFB
set 6
Big trailers in total N/day 32 Capacity of Trailer :20tEFB amount for Boiler combustion
t/h 26.39 As water contained 64.63%16.97 As water contained 45 %
©Receiving hopper 64 sets©EFB conveyer 2 sets©Drum thresher 2 sets©Conveyer 1 set©High speed hammer mill 3 sets©Distributor 3 sets©Break cutter oil extractor 6 sets©Break cutter oil extractor 6 sets©Accumulating conveyer 1 set©Sludge tank 3 sets©Carrying conveyer 1 set©Distributor 1 set©Drier 2 sets©Carrying conveyer 1 set©Silo 1 set©Carrying conveyer 1 set©Distributor 3 sets
(20tZ set)(1.2mWidth X OOmLong)(15t/h)(1.2mWidth X 42mLong)(8t/h/set including 1 set spare)(including 1 set spare)(6t/h/set including 1 set spare) (6t/h/set including 1 set spare) (1.2mWidth X 26mLong)
(1.2mWidth X 23mLong)
(lOt/h)(1.2mWidth X 21mLong) (135m3)(1.2mWidth X 21mLong)
-2-94

N)COOi
to Boiler
Name Name & Name h. NameRecelviee fca»«i HUM steed koeeer ■ill Sledee Heldlne Teek 9 SiloEft cm«mr Olelrllullee device (y) coAvtvtr 0Dree Ikreiker US Olatrlkiiien device 0 DlelilMut ion device
§ drver|eeev»ver| 0 emevif
Fig. 2. 2. 4. 5. 5 —10 EFB Pretreatment System for Industry-owned PP (Stoker)

(7) In the Case of 16 MW IPP Co-generation / Fluidized-bed Firiing (for Reference)
In Fig. 2.2.4.5.5-11 is shown the pretreatment system train.
EFB are carried in by big trailers and put into the receiving hopper system (D.
The hoppers are provided so as to contain the volume of EFB, which corresponds
to 2 days’ total number of the big trailers. EFB are delivered in order from
respective hoppers of their 4 trains and carried of earth and sand sticking to their
surfaces. Then EFB are carried by the conveyer © to the coarse crusher (D
and carried further through the accumulating conveyer (9) and the carried
conveyer © to the 2 drier system @. In result, EFB are dried to 60 % water
content. After carried by the conveyer @ to the silo ©, they are stored once in it
and then delivered, and after weighed, they are carried through the conveyer ©
and the distributor © and fed into the fluidized-bed boiler.
Item Unit Value RemarksCarried in EFB amount t/day approx. 1300 As water contained 64.63%Number of Palm Oil Mills supplying EFB
set 10
Big trailers in total N/day 65 Capacity of Trailer :20tEFB amount for Boiler combustion
t/h 55.57 As water contained 64.63%49.14 As water contained 60 %
©Receiving hopper 130 sets (20t/set)©EFB conveyer 4 sets (1.2m Width X 90mLong)©Drum thresher 4 sets (15t/h)©Conveyer 1 set (1.2m Width X 42mLong)©High speed hammer mill 5 sets (8t/hy/set including 1 set©Distributor —©Break cutter oil extractor —©Break cutter oil extractor —©Accumulating conveyer 1 set (1.2m Width X 26mLong)©Sludge tank —©Carrying conveyer 2 sets (1.2m Width X 23mLong)©Distributor —©Drier 2 sets (35t/h)©Carrying conveyer 2 sets (1.2m Width X 21mLong)©Silo 2 sets (135m3)©Carrying conveyer 2 sets (1.2m Width X 21mLong)©Distributor 2 sets
-2-96-

to
<x>
Name© Rtceivint hoeeer© €F8 converer® Or«r Tateehir©a conveyer© conveyer
Kith seeed ham' mill® Oisl'ikutieri device
Break cellar cwa oil
® Break cellar cin oil
® conveyer
© Sludee Holdine Tent
© conveyer© Oislr-tutioo device© drvar© conveyer© Silo
© conveyer© Oislrihvtion device
rRi ©
Fig. 2. 2. 4. 5. 5 —11 EFB Pretreatment System for I P P (FBB)(for Reference)

(8) In the Case of 16 MW IPP Co-generation / Stoker Firing (for Reference)
In Fig. 2.2.4.5.5-12 is shown the pretreatment system train.EFB are carried in by big trailers and put into the receiving hopper system ®.
The hoppers are provided so as to contain the volume of EFB, which corresponds to 2 days’ total number of the big trailers. EFB are delivered in order from respective hoppers of their 4 trains and carried by the conveyer © to the thresher (3), where they are cleared of earth and sand sticking to their surfaces. Then after carried by the conveyer (D, EFB are turned into fiber being 50 to 55 % in water content and 25 to 50 mm in length by means of the coarse crusher ©, distributor © and the two trains of presses ® & ©. The sludge coming from pressing is stored in the tanks ©. EFB are carried through the accumulating conveyer © and the carrying conveyer © and then they are dried to 45 to 50 % water content by means of the 4 drier systems ©. After carried by the conveyer © to the silo ©, they are stored once in it and then delivered, and after weighed, they are carried through the conveyer © and the distributor © and fed into the stoker boilers.
Item Unit Value RemarksCarried in EFB amount t/day approx. 1300 As water contained 64.63%Number of Palm Oil Mills supplying EFB
set 10
Big trailers in total N/day 65 Capacity of Trailer :20tEFB amount for Boiler combustion
t/h 52.15 As water contained 64.63%33.54 As water contained 45 %
©Receiving hopper 130 sets (20t// set)©EFB conveyer 4 sets (1.2m Width X OOmLong)©Drum thresher 4 sets (I5t/h)©Conveyer 1 set (1.2m Width x 42mLong)©High speed hammer mill 5 sets (8t/h/ set including 1 set spare)©Distributor 5 sets (including 1 set spare)©Break cutter oil extractor 10 sets (6 t/h/ set including 1 set spare)©Break cutter oil extractor 10 sets (6t/h/set including 1 set spare)©Accumulating conveyer 1 set (1.2m Width X 26mLong)©Sludge tank 5 sets©Carrying conveyer 1 set (1.2m Width X 23mLong)©Distributor 3 sets©Drier 4 sets (lOt/h)©Carrying conveyer 2 sets (1.2m Width X 21mLong)©Silo 2 sets (135m3)©Carrying conveyer 2 sets (1.2m Width x 21mLong)©Distributor 2 sets
-2-98-
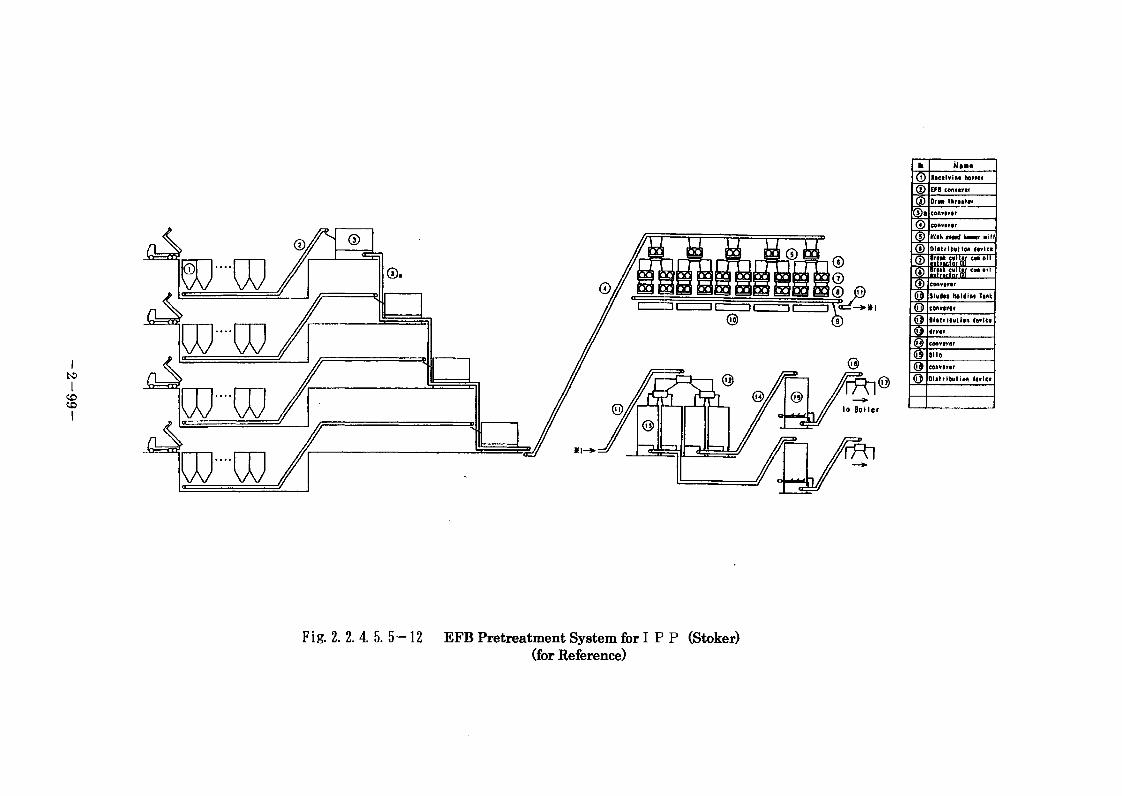
Nameleceiviae hoaaer£FB conveyerOrw TkreakerconveyerconveyerHI eh aeeed keeer sill
Olalrlbutlo* device
Jir?LtsiWf—0,1| ® |cenverer |
Sludea Heldiai Tank
conveyerDiatritutlen devicedryerconveyerSiloconveyer
Olalrlbullea device
© ""
Fig. 2. 2. 4. 5. 5—12 EFB Pretreatment System for I P P (Stoker)(for Reference)

2.2.4.5.6 Flue Gas Treatment Equipment
Since meeting the local environmental standard is approved as conformance to due environmental criteria, in the site (enterprise) of executive for this project, the following standard should be applied to this project:
NOx & SOx : No regulation is enforced to agricultural industry.
Smoke and soot: Not greater than 200 mg/m • N(2.0 in Riggleman value as smoke density)
Chimney (Stack): Not lower than 2.5 times the height of the highest living building standing within a radius of 50 m with the stack as the center.(However, only the plants of FELD A Sahbat Complex stand around the site, and any building where any person can be on duty is not higher than 20 m.)
Accordingly, as the flue gas treatment system, the installation of a dust collector, a Ringgelman smoke indicator and a 50 m stack is to be carried out.
As to the exhaust gas from EFB burning, its features which were obtained from the results of a small grate firing test by our company, are summarized as follows:
(l) Smoke and soot:The smoke and soot at the outlet of the boiler is white smoke which can be discriminated by the naked eye, and by passing this smoke through a bag filter, white dust is caught and smoke is turned colorless and transparent.As the result of instrumentation in our company, it has been ascertained that the exhaust gas dust density at the outlet and inlet of the bag filter is as low as 1 mg/nvN (converted according to 02 = 12%).
From this, it is judged that smoke density can be kept lower than 200 mg/m • N by installing such a filter as a bag filter.
—2 — 100—

The NOx concentration at the outlet of the boiler was 120 ppm (converted according to 02 =12%) in the test furnace, and there is a great possibility of the emission concentration in the real boiler being on the same level.
As to SOx concentration at the outlet of the boiler, hardly any S content of fuel was detected and the concentration in the test furnace was 2 ppm (converted according to 02=12%)It is assumed that the emission concentration in the real boiler will also be negligible.
As dioxin concentration at the outlet of the boiler, the dioxine concentration in ash was 0.004 ng-TEQ/g.
Since there is a definite correlation between dioxine in exhaust gas and dioxin in ash, it is assumed that the emission level of dioxin in exhaust gas will also be negligible.
The specifications for the dust collector are shown in Table 2.2.4.5.41
The specifications differ between the EBB system and the stoker system even with the same output because rationalization has been sought in water content of EFB and its calorific value according to the type of the boiler.
(2) Noxious substances:NOx, SOx and dioxin are assumed to be noxious substances.
Table 2.2.4.5.41 Specifications for Dust Collector
Industry-owned P.P. IPP (reference)EBB Stoker EBB Stoker
Type — Bug Filter Bug Filter
Gas Volume m3N/h 86,800 82,420 171,510 162,890
Inlet Gas Temperature °C 178 178 178 178
Inlet Dust Density mg/m3N 8,660 11,240 8,660 11,240
Outlet Dust Density mg/m3N <200 <200 <200 <200
Pressure Drop mmAq <200 <200 <200 <200
H2O in Gas % 33 23 33 23
—2—101 —

In this connection, as to the properties of the ash from EFB burning, the ash us excellent in collectability even by the electric dust collector.However the bag filter is superior to the electric dust collector for this project, from grounds, such as the requisite that steam content of the gas to be treated is much higher than in fossil fuel, the fact that the price of equipment is higher in the electric system, the fact that the space needed for installation is larger and the condition that special technique is needed for maintenance of the electric system.

2.2.4.5.7 Feed Water and Cooling Water Equipment
As water to be used according to plant demand attendant on the introduction of the co-generation system, the following kinds of water are needed:
1) Turbine condenser cooling water,2) Demineralized water for boilers,3) Equipment shaft cooling water, and4) Equipment wash water.
Whereas idea of using seawater was also proposed as to the turbine condenser cooling water, it has been fixed to adopt the cooling tower system from the following grounds:
a) In this project the site for the new plant is about 500 mm distant from the coastline,
b) Other facilities have been already installed between the site for the new plant and the coast,
c) It is unknown what has been laid under the ground on the intake and discharge routs,
d) There are many unknown data including the sea bottom topography along the coastline and the state of waves, the state of drift sand, and others.
And if the spread of projects similar to this project is taken into consideration, the cooling tower system can be used more widely because the palm oil industry has developed mostly in inland areas.
(l) Feed Water Equipment
Ground water is used as raw water.The analyzed values on its water quality (analyzed values obtained from FELD A) are shown in Table 2.2.4.5,7-1.Only the analyzed values mentioned in the Table have been obtained at present, but it is judged that these are values of very low grade as water quality.
-2-103-

Table 2.2.4.5,71 Quality of Ground Water
p H(20t) — 12.0Sulphite mg/1 13Chloride mg/1 120Phenolphthalein mg/1 344Caustic mg/1 369Phosphate mg/1 27.5Total Dissolved Solid mg/1 2100
Chemicals are injected into feed water and boiler water, to adjust pM and dissolved oxygen.
As Chemicals injected, sodium phosphate is used for boiler water, and hydrazine and morpholine are used for feed water.
And the water quality of boiler water and boiler feed water is monitored by means of the sampler and hand analysis is also enabled.
On boiler water : Conductivity, pH; by hand analysisOn feed water : Conductivity, pH; Si02 , 02 : by hand analysisOn main steam : Hand analysis
As to feed water heating equipment, in consideration of the scale of this project and steam pressure in it, feed water is deaerated and heated by installing only the Deaerator generalized in the class.
(2) Cooling Water Equipment
The cooling tower system has been adopted for turbine condenser cooling.
Fig. 2.2.4.5.7-1 shows an example of an outline drawing for the cooling tower.

.kexs
10906%12510
■St *-A- A f 7 ? -C #F
Fig. 2.2.4.5.7 1 Outline Drawing for Cooling Tower. (An Example)
-2-105-

2.2.4.5.8 Electrical and Instrumentation Equipment
(l) Electrical Equipment
The one Tine diagram for the case of 7.8 MW industry-owned PP is shown in Fig. 2.2.4.5.81 and the on-line diagram for the case of 16 MW IPP is shown in Fig. 2.2.4.5.8-2.As specifications for the power to be generated by the palm-oil-waste recycle power generating equipment, 3 phase, 11 kV and 50 Hz has been specified.To respective plants of FELDA (Kernel Crushing Plant, Oil Product, Sahabat Bulkers/Complex) and to the newly established power plant, the power is supplied after its voltage is dropped to 6.6 kV.
As to starting from the state where all equipment in the new plant have been stopped, the new system is started by supplying the plant service power to the new power plant, from the diesel generator existing in FELDA in the case of 7.8 MW industry-owned PP, and from any outside power systems in the case of 16 MW IPP.
After started, synchronization in voltage and frequency, and concurrent operation are carried out, and then, power supply from the new power system is started.
(2) Instrumentation Equipment
The control system configuration diagram for the case of 7.8 MW industry-owned PP is shown in Fig. 2.2.4.5.8 3, and that for the case of 16 MW IPP is shown in Fig. 2.2.4.5.8-4.
The control system is composed of the boiler control equipment, the turbine control equipment, the generator monitor, and the control equipment for the pretreatment system and other auxiliary facilities.
For boiler control, turbine control, generator control and plant monitoring, the distributed control system (DCS) is adopted, which enables main actuation and overall monitoring of the plant by means of the CRT installed in the control room.
—2—106—

107
3* 11000V 50Hz
TR11000/6600V
KVA To Sahabat Oil Product
To Sahabat Bulkers
To Kernel Crushing Plant
3# 6600V 50Hz
coesi 3*fi600VS0Hz
H uofl I xlofl
.—) TR[§)6600/220V-110V
TX KVA
To Aux. Equipment
Fig. 2.2.4.5.8*1 One*line Diagram (Industry-owned PP)

108
To Grid
3* 11000V SOHz
11000/6600VTo Kernel Crushing Plant
To Sahabat OK Product
To Sahabat Bulkers
3» 6600V SOHz
3# 6600V SOHz
1 I I WPS I I ZTOSl I SICS 1
AutomaticSynchronizer
5Q zcr
"-HR W-g)6600/Z20V-110V BFP T \ KVA ncp
moov.soHz'
Fig. 2.2.4.5.8 2 One line Diagram (IPP : for Reference)

to
§
< Local)< Control Room)
< Furnace Monitoring ITV><PRP>< TCP)
< 0PC1X0PC2) <AUB>
0B0BBBO
<PR1> <PR2>
< Relay Room)
< Electrical Room)|t1hW&6KVl< CBli>
<MCC>
6.6KV/T2ffV-l10V
< Local) < for UPS)
ON/OFF ValveThermocouple Control Valve
Receiving hopper Control Panel Drum Thresher Control Panel High speed hammer mill Control Panel Dryer Control Panel Silo Control Panel < Low Voltage Motor)< High Voltage Motor)
< Turbine Room)GENERATOR
Fig. 2.2.4.5.S-3 Control System Configuration Diagram (Industry-owned PP)

to
o
< Local>< Control Room>
< Furnace Monitoring ITV>< TCP> <PRP>
<0PC1X0PC2> < AUB> <GP>
<PR1> <PR2>
mm
< Relay Room>
CDCS>
< Electrical Room>|i1kWg6KVl< CBS) <MCC>
6.6KV/220V-1I0V
< Local) < for UPS>
ON/OFF ValveTransmitterThermocouple Control Valve
Receiving hopper Control Panel Drum Thresher Control Panel High speed hammer mill Control Panel Dryer Control Panel Silo Control Panel <Low Voltage Motor)< High Voltage Motor)
< Turbine Room)
TURBINE
Fig. 2.2.4.5 8 4 Control System Configuration Diagram (IPP * for Reference)

2.2.4.5.9 Estimated Performance
(l) Conditions for Estimated Plant Performance
The estimated plant performance has been calculated under the following conditions:
1) Properties of fuel (EFB)2) Properties of sinter ash3) Ambient temperature
4) Ambient humidity
5) Atmospheric pressure
: Shown in Table 2.2.4.5.9*1 : Shown in Table 2.2.4.5.9 2 : 30° C (Base value for performance calculation)
•' 100% (Base value for performance calculation)
101.3 kPa
Table 2.2.4.5.9T Properties of Fuel (EFB)
Raw EFB For FBB For stoker
Total moisture % 64.633 60.00 45.00Carbon % 16.446 18.601 25.576Hydrogen % 2.357 2.666 3.666Oxygen % 14.535 16.439 22.604
Nitrogen % 0.121 0.137 0.188Sulfur % 0.020 0.022 0.031Ash % 1.699 1.922 2.642
Total Cl % 0.121 0.136 0.188
H.H.V Kj/kg 6,382 7,218 9,925L.H.V Kj/kg 4,261 5,143 7,998
—2—111 —

Table 2.2.4.5.9-2 Properties of Burnt Ash
Si02 % 35.27 35.27 35.27AI2O3 % 1.74 1.74 1.74Fe203 % 1.59 1.59 1.59CaO % 5.69 5.69 5.69MgO % 5.25 5.25 5.25KgO % 32.90 32.90 32.90Na20 % 1.12 1.12 1.12P20, % 3.75 3.75 3.75S04 % 1.45 1.45 1.45Cl % 2.20 2.20 2.20F % 0.01 0.01 0.01
Total % 90.98 90.98 90.98
Initial deformation T °C 940 940 940Melting Tempi °c 1 .040 1 .040 1 .040Fluid Temp °c 1 .060 1 .060 1 .060
-2-112-

(2) Estimated Plant Performance
In Table 2.2.4.5.9*3 is shown the estimated plant performance at rated load.
Table 2.2.4.5.9-3 Estimated Plant Performance (at Rated Load)
Industry-ownedPP
I P P (reference)
Boiler type FBB Stoker FBB StokerGenerating output kW 5,570 5,570 14,390 14,390Auxiliary Powerconsumption
kW 1,460 1,848 2,637 3,455
Available TransmissionPower
kW 4,110 3,722 11,753 10,935
Power Demand in Complex kW 5,190 5,190 5,190 5,190Steam Demand in Complex t/h 16 16 16 16Req. back-up power kW 1,080 1,468 0 0Capable power to sell kW 0 0 6,563 5,745Main steam quantity t/h 39 39 77.2 77.2Main steam press. bar(g) 41 41 41 41
Main steam temp. °C 450 450 450 450Feed water temp. °C 137.9 137.9 137.9 137.9Calorific value of EFB
(Gross)Kj/kg 7,218 9,925 7,218 9,925
Calorific value of EFB (Net) Kj/kg 5,143 7,998 5,143 7,998Water in fuel % 60 45 60 45Fuel consumption t/h 24.87 16.97 49.14 33.54Fuel consumption (raw EFB) t/h 28.13 26.39 55.57 52.15Net thermal efficiency (HHV base)
% 33.08 34.42 24.50 25.22
Net thermal efficiency (LHV base)
% 46.42 42.72 34.38 31.30
Net heat rate (HHV base) KJ/kWh 10,885 10,460 14,697 14,276
Net heat rate (LHV base) KJ/kWh 7,756 8,429 10,472 11,505
-2-113-

2.2.4.6 Civil Engineering/Construction Works
(l) Survey and Planning
In location of the co generation equipment, a survey must be made first on the conditions in material environment and social environment, and then, in consideration of these conditions, planning, design and environmental assessment, etc. must be carried out,
However,l) As affairs now stand, location of the point projected for installation in the
site (enterprise) for this project has been already finished.
2) In the stage of execution, FELDA which is well aware of design standards, peculiar design conditions and constructional environment on the spot, isto carry out such planning, design, etc. included;
with a geological survey
3) In actual execution of civil engineering and construction works as well, FELDA being well aware of conditions on the spot, is to seek economy by using the construction machinery suppliable on the spot and by employing local constructors as far as possible.
Accordingly, businesses on the Japan side in this project are to give data needed for civil engineering and construction works.
(2) Buildings:
According to the conception on the projected site (enterprise), the facilities by construction works for this project are buildings which can barely protect equipment and equipments against wind and rain, and are limited to the boiler building, the turbine building and the EFB storage yard.
However, in consideration of the configuration as a newly-established plant, the office, guard room, water treatment room, electrical maintenance room, control room, etc. are regarded as necessary in addition to the above, and a plan is to be made so that a separate building is constructed or required rooms are provided in the turbine building.
—2—114—

(3) Incidental Facilities:
The incidental facilities are those needed for keeping adequate environmental conditions, and include roads and pavement, rainwater drainage facilities, outdoor lights, etc.
As to roads and pavement, concrete-surfaces roads and parking zones are laid out within the plant site so as to enable access from the existing roads. Conditions, such as road width, are planned in consideration of carrying-in and carrying-out of EFB, etc.
The rainwater drainage facilities catch the rainwater received within the newly-established yard and discharge it in the nearest existing drainage way laid outside the yard.
As to outdoor for operation and maintenance of equipment installed outdoors, are installed.
—2—115—

2.2.4.7 Outline of Transportation Plan
The equipment composing the EFB-burning co-generation system can be divided into those to be supplied from Malaysian territory and those to be supplied from overseas, and as to those to be supplied from Malaysia, they can further be subdivided into those supplied from the peninsula and those to be supplied from Kalinantan Island (where the site is situated).
However, both marine transport and land transport will be needed for almost all equipments because the field is in an island.
Land transport
Land transport
Land transport
Marine transport
Marine transport
Marine transport
Marine transport
Supplied from overseas
Supplied from Malaysia (peninsula)
Supplied from Malaysia (Island)
Fig. 2.2.4.71 Methods of Transporting Equipment
(l) Equipments Supplied from Malaysian Territory
Though there are equipments to be supplied from Malaysian Territory, almost all of them will be supplied from the peninsula, and thus both marine transport and overland transport will be needed.
Small equipments can be landed through the pier, which is used for shipment of palm oil by FELDA (nearest the site).However large equipments must be landed in the port of Lahad Datu being about 2 hours’ car ride from the site.
As to tanks or the like, it is considered that they can be supplied from makers in Kalimantan Island.However even in the case where field assembly is applied to such products,
— 2—116—

it can be desirable not to limit their transport to overland transport but to adopt marine transport as well if they can be landed through the FELDA’s pier and the cost of transport is lower.
At all events, works are to be executed under the responsibility and control the partner enterprise, based on the data planned and prepared with the Japan side taking lead.
(2) Equipments Supplied from Overseas:
Equipments made overseas will be landed in the above-mentioned port of Lahad Datu after marine transport, from need on customs clearance and on weight.
As to inland transport, there are two routes as mentioned above: the route from the port of Lahad Datu and the route from the FELDA’s pier.
Since no railway has been laid on both the routes, transport by trucks (trailers) to the field is needed, and the distance is about 100 km from the port of Lahad Datu and about 1 km from the FELDAs pier.
Though both the routes are paved roads, there were some unpaved road sections between Lahad Datu and the site.Since these sections are said to be under construction and improvement works will be completed before execution of this project, no problem will remain in overland transport.
2-117-

2.2.5 Scope of Supply including Fund, Facility Equipment, Service etc. provided by both Parties required for the Applicable Project Enforcement
The proposed machines & equipment are required to install at the SAHABAT COMPLEX in FELDA (Ltd.) here in Malaysia.
At site, raw water is schedule to supply from the existing facility to the newly proposed facility.Moreover, the electric power and steam generated in the newly established facility are supplied to the existing facility.
Accordingly, a connection system is required to provide between the proposed machines & equipment and the existing facility.
Then based on the said connection system, an external new facility yard is prerequisite to remodel through the own funds invested by FELDA (Ltd.), or to arrange a power transmission line through the power purchasing power company.
Such being the case, for the examination cost and installation cost of the above mentioned remodeling facility and new power transmission line shall not be included in the Project cost.
The scope of work classification required for the materialization and enforcement of the Project is shown in Table 2.2.5-1 below:
We would like to cooperate with FELDA (Ltd.) for the forwarding of data required for the preparation of financing/ loan application documents up to the dead line of the tendering.On the other hand, business/work required for the successful materialization of the Project, as well as pre-arrangement required for the enforcement of the Project, the orderer , FELDA (Ltd.) will exercise at his own cost.
-2-118-

Table 2.2.5-1 The Scope of Work Classification required for the Project Enforcement
MalaysiaSide
JapanSide
1 Business/work to be performed for the Project materialization l) Preparation of public financing application data to be
forwarded to the Japanese Government AuthoritiesO
2) Submission of public financing application data required for the preparation of the said application sheet.
O
3) Application arrangement forwarding to Nation and State. O
4) Submission of data required for application arrangement to be forwarded to Nation and State.
o
5) Examination and coordination of financing application within the inter-Government Authorities.
o
6) Financing proposal/application o
7) Acceptability of financing proposal/application, as well as determination of loans.
o
8) Inter-Government Authority consultation concerningCDM project.
o o
9) Procurement of self funds. o2 Pre-arrangement performed for the Project enforcement:
1) Consulting and contract conclusion with Electric Power Company for buying/selling of generated power.
2) Environment assessment.
3) Tendering (including the preparation of facility tendering specification sheet)
4) Arrangement with Nation and State
o
o
o
o
(to be continued)
-2-119-

(continues)
Malaysia JapanSide Side
3 Business/work enforcement of the Project1) Conclusion of contract and execution of negotiation O O
2) Fundamental design of machine & equipment and electric facility
o
3) Civil engineering design and building design O
4) Submission of data required for civil engineering designing and building designing
o
5) Procurement/fabrication/ machining of civil engineering materials and building materials
o
6) Foundation work o
7) Building work o
8) Detailed designing of machine & equipment and electric facility
o
9) Procurement of purchased parts and manufacturing of parts for machine & equipment and electric facility.
o
10) Remodeling of existing plant (For the connection with the onew facility: it will be distinguished from the new boarder line provided at site)
11) New establishment of power feeding line for power selling. o
12) Ocean transportation spec, and insurance application o
13) Arrangement of customs clearance and payment of customs oclearance fee.
(to be continued)
-2-120-

(continues)Malaysia
SideJapanSide
3 14) Tax free arrangement. O
15) Preparation of documents required for the exemption of tax arrangement.
O O
16) Inland transportation arrangement. o
17) Installing of machines, equipment and electric facilities. o
18) Installation supervising work. o
19) Trial run and adjustment. o
20) Trial run, adjustment and supervising work. o
21) Performance confirmation test. o
22) Supporting work for performance confirmation test. o
23) Commissioning work and maintenance work o
24) Management o
25) Monitoring of substitution energy effect and greenhouse effect gas reduction effect.
o
-2-121-
2.2.6 Conditions on the Premise of the Enforcement of the Project and Problems to be solved
In the course of the enforcement of this Project, it is prerequisite to realize the following points for the successful completion of the Project;
• Concrete and earlier standardization of the biomass power generation promotion policy, which the Malaysian Government is strongly expediting
• The proposal of this business may firmly applicable to the already available new enterprise favorable treatment policy, and
• The tax exemption treatment may be applicable to imported machines and equipment
In addition, if economical merit according to this business may be acceptable, as well as if the lower money-rate loan is obtainable, it is sure that the starting up of this business will be realized in the early stage successfully.

2.2.7 Project Enforcement Schedule
According to the FS investigation result of this Project, the facts have been forwarded to FELDA (Ltd.).
Then the details of the report are scheduled to examine in FELDA (Ltd.).
In this way, the applicable work will be commenced for the enforcement of the Project.
Miscellaneous works to be carried out until the project enforcement may start shall be carried out by FELDA (Ltd.).
Then the period required for the completion of the following work is presumable as follows:
From the procurement of own funds to the arrangement of financing consultation with the relating governmental authorities here in Malaysia
..........Seven (7) monthsFrom the proposal/application of the Project to the mutual agreement concluded between two countries
..........Ten (10) monthsAfter that, the tendering will be expedited followed by the enforcement of the Project.In this way the major milestone schedule is summarized as follows-
(l) Inter government agreement between two countriesconcerning a lone/financing ......~ End of September 2002
(2) Determination of order received enterprise ......... End of October 2003
(3) Commencing of foundation work ......... Beginning of September 2004
(4) Completion of machine & equipment installation ~ End of October 2005
(5) Commissioning of commercial running ...... From January 2006 ~
The overall schedule containing the above schedule is shown in Table 2.2.7-1 below.
-2-123-

124
Table 2.2.7* 1 Enforcement Schedule of the Project
to
yearWork
20 >0 2001 20( 2 20 >3 2004 20 15 20069 to 11 12 1 2 3 4 6 6 7 e 9 10 11 12 1 2 3 4 5 6 7 e 9 10 11 12 1 2 3 4 5 6 7 e 9 10 11 12 1 2 3 4 5 6 7 6 9 10 11 12 1 2 3 4 6 6 7 8 9 10 11 12 1 2 3 4 5 6 7 8 9 10 11 12
1 FS work
7 Preparation ol NEOO FS Report and explanation to FEIDA
3 Examination of FS Report at FEIDA (Ltd)
4
6Agreement between two countries concerned joint enforcement
6Forwarding of FS Report to Malaysia Government Agencies ■
7
Examination of acceptability by Malaysia Government Agenciesincluding MOE etc., as well as coordination with the relating Ministries
8 Foreign debts approval and guarantee bv the Financial Ministry
9 Prooosal/apolicatnn to the Japanese Embassy in Malaysia ■
in Verification of the Protect bv the Japanese Government
11 ■
i?Arrange men# for official credit application qualification by the Japanese Government
13 L/A ■
14 Preparation of bid documents by FEIDA
15 Bidding 1
lit Tendering of the bid
17 Opening of the bid 1 1
Id Negotiation and contract conclude with Plant Erector
19Updating of electric power buying/selling contract with PowerCo
70 Soil investigation and examination71
77 Designing and arrangement of civil eneheerhg
73
74 Manufacturing of buildings materials
75 Civil work75 Building work77 Mach he foundation work
?flEquipment/electrical design and material procurement, fabrication
79
30 installation of eouioment and electrical components
31 Trial run
32 Commancina of commercial operation
12 Monitor ini on substitution energy refection offset34 Monitor hi on Green House Gases refection

2.3 Concretization of Fund Plan
2.3.1 Fund Plan required for the Project Enforcement
2.3.1.1 Required Amount of Fund :
The required amount of fund for the Project may be calculated by using four (4) trial calculation methods.The calculation includes the applicable machine & equipment costs, installing work costs, civil engineering costs and building erection costs:
(l) Private co-generation:
(D Application of fluidized bed boiler-'Machine & equipment costs:Installing work costs:Civil engineering and building erection costs: Total costs:
¥ 1,646,000,000 ¥ 319,000,000 ¥ 239,000,000 ¥ 2,204,000,000
(2) Application of storker boiler:Machine & equipment costs:Installing work costs:Civil engineering and building erection costs: Total costs:
¥ 1,668,000,000 ¥ 324,000,000 ¥ 243,000,000 ¥ 2,235,000,000
(2) IPP: (for Reference)
(D Application of fluidized bed boiler:Machine & equipment costs:Installing work costs:Civil engineering and building erection costs: Total costs:
¥2,256,000,000 ¥ 438,000,000 ¥ 328,000,000 ¥3,022,000,000
(2) Application of storker boiler:Machine & equipment costs:Installing work costs:Civil engineering and building erection costs: Total costs:
¥2,315,000,000 ¥ 449,000,000 ¥ 337,000,000 ¥3,101,000,000
Note: According to a preferential treatment (proposal) for biomass power generation of Malaysia Energy Ministry at the time of March 2000, “the
— 2—125—
facility setup and management of a power generation plant to an electric power company’s grid should be burden of an electric power company” so that the cost of power transmission installation doesn’t include in this FS
2.3.1.2 Procurement Method2.3.1.2.1 Ordinary Procurement Method
In general, FELDA Group will invest money to the new Project by utilizing the group’s own funds or by a local bank loan if the total amounts of the funds are RM 50-million Max. (Equivalent to 1.5 billion-yen Japanese yen).
On the contrary if the investment exceeds over RM 50-million (over 1.5 billion-yen ), the investment might be made under the joint venture (JV) enterprise so as to minimize the monetary risk.
In case of a money loan financing by Malaysian local bank, a loan from MAY BANK to FELDA will be the most natural financing method.This is because that FELDA has a stock of the subject bank.On this occasion, the interest on loans is about 9% annually.
2.3.1.2.2 Expansion of Enterprise as a Joint Venture (JV):
Because the total amounts of investment of this Project is more than RM 50-million, as well as the Project is new and there is no past experience, it is required to minimize the monetary risk.As a matter of fact, it is highly forecasted that a JV enterprise system takes precedence over others.
The selection of partners in the JV enterprise system is important.Apart from such an essential partnership, the most important points in the successful enforcement of this Project are as follows:
(D Securing of EFB(2) Availability of electric power consumers
Not only the in-company group himself, but also by joining with the adjacent other palm oil mills, and then, by forming a JV with these mills, sufficient EFB can be secured.
—2—126 —

At the same time, firm electric power consumers can be secured stably. Moreover, if a great amount of excess power may be sold as IPP, and the power company who will buy the power is a member of the JV, some merits would be obtainable from the setting of selling power price and from the installation of power transmission line.
2.3.1.2.3 Grant of Economical and Environmental Cooperation with Overseas Countries
As the first project in the world, it is mostly preferable that it applies to a special grant from DANCED, UNDP, etc for FELD A and Malaysia government.
In this case, however, there are several application conditions peculiar to the applicable funds, the requirements of these conditions must be satisfied.In addition, among many proposed applications submitted from overseas countries, including Malaysia, those countries which can finance funds to the Project are preferable countries, through which aimed merits would be expectable.In other words, the following contributions should be obtainable:- Reduction of carbon dioxide (CO2)- Effective use of biomass- Effectiveness of power generation- Strong export competition force
2.3.1.2.4 Un tied Bank Loan Granted by Japan Bank for International Cooperation
We would like to apply to Japanese bank loans featured by low money rate. On this occasion, however, an exchange risk would be borne by us, of which costs exceed far over the low money rate.In addition, FRI is not desirous to accept the tied loan.This means that an un tied loan is prerequisite to apply.
In order to clean the above-mentioned conditions, actually an un tied bank loan is available through the Japan Bank for International Cooperation.
The skimming is represented by affording the credit line from the Japan Bank for International Cooperation to foreign Government,, etc., through which the
-2-127-

applicable foreign enterprises may utilize such loans with site currencies or US dollars.
A loan financing from the Japan Bank for International Cooperation to the site Governmental Financing Agents is made according to the Japanese-Yen-basis featured by low money rate.
Since the Governmental Financing Agents at site bears the exchange risk, the money-rate is higher than that of in Japan, but the actual money-rate is firmly lower than that of used at site general Bank here in Malaysia,
2.3.2 Prospect of Fund Procurement (Execution Plan of InvestigationConsignee and of Enforcement Site (Enterprise))
2.3.2.1 Execution Plan of Investigation Consignee
Application of Un tied Loan financed by JBIG is examined.
The above-mentioned special loan can be utilized in Malaysia through the Governmental Financing Agent, represented by the BANK INDUSTRY (Malaysian Industrial Bank).
In fact, the Japan Bank for International Cooperation is now financing the total amount of 24 billion yens credit line to the BANK INDUSTRY used for the investment to machine & equipment funds, as well as running funds for Malaysian export relating enterprises under the name of “Secondary Two-step Loans”.
The above loan period has been terminated at the end of 2000.However, the loan period has been decided to elongate.In other words, the loan is applicable to this Project.
In this case, however, under the existing condition that the clear CDM rule is not yet determined, the availability of greenhouse effect gas reduction credit is also unclear in the enterprises who utilize the JBIG loan.
Such being the case, if any rule has been established on the financing
-2-128-

regulations in CDM, then, we would like to consult and coordinate the matters with JBIG, the other governments, the opposite nation partners so as to materialize the loan successfully.
The loaning condition of the ' Loan applicable industry • Purpose of use
• Loan borrower conditions
BANK INDUSTRY is as shown below:: Manufacturing industries
: Investment in machines and equipment, as well as in the construction of the relating factories and shops
: Manufacturing enterprises here in Malaysia may conform to one of the following conditions;l) Number of employees is 150 persons
Min.2) Annual sales amount is RM25million
• Loan money-rate• Line of credit• Refundment
Min. or3) Paid up capital is RM25million Min.
: 7.75% annual : US$ 30-million: 15 years Max. (Allowable period-' 5 years)
(Depending upon the cash-flow status)
The reason why this loan was intended to apply may be explained as follows:
1) In general, the loan money rate is lower more than 1% in comparison with that of utilized by FELD A; who is now raising funds from general bank here in Malaysia. This means that the proposed “Loan money-rate” is more advantageous.
2) The proposed “Refundment” exceeds far beyond the required amount of capital, as well as the building construction cost is the object of the credit. This means that the availability of the funds is effectively expandable.
3) Since the un tied loan condition is stipulated, the requirements may conform to the FELD As intension satisfactorily.
4) Because the loan is made at site currency, there is no fear against the exchange risk.
5) FELDA can clear the loan conditions submitted by the BANK INDUSTRY
-2-129-

without any problem.
6) The montage may be acceptable only the enterprise guarantee prepared for the newly purchased machines and equipment.
7) Since the use of the biomass power generation systems are encouraged by Malaysian Government.In other words, FELDA may easily conform to the intention of the BANK INDUSTRY who belongs to the Malaysian Governmental financing department.
For the financing conditions in the Japan Bank for International Cooperation includes the investment for machines and equipment installed in the import relating enterprises.
Accordingly, for the palm oil industries working here in Malaysia, the palm oil industries are typical industries, as well as major exporting items.In addition, even if the owner of this palm oil industry was replaced with other company owner, when stabilized electric power supply in a palm oil company can be maintained, this can be regarded that the company may indirectly support the export industries, and there is no problem.
In other words, if the financing object is for the major exporting items, as well as for the leading company, represented by FELDA, the financing regulations will be more beneficial for FELDA.
2.3.2.2 Execution Plan of Enforcement Site (Enterprise)
FELDA is now examining and expediting the following two cases at SAHABAT COMPLEX in FELDA (Ltd.) here in Malaysia.
1) A plant construction work of which private power generation scale is on the premise that power is supplied to only enterprises adjacent to the FELDA Group.
2) A plant construction work, as IPP through which excess power is sold to an electric power company by connected with the national grid, (for Reference)
— 2—130—

On the other hand, whether the new plant is commissioned under a certain configuration (such as a new company or a division of the existing company), the definite plan is not yet established.
In addition to the above, the same execution plan is now examined at SEBERANG COMPLEX in West Malaysia.
In case of SAHABAT COMPLEX in FELDA (Ltd.) here in Malaysia, when it is required to sell electric power as IPP, at present, there is no power transmission line in the neighborhood area.This means that if the electric power company may arrange the power transmission line up to the plant site, it becomes the critical point of profit or loss.
On the other hand, in comparison with SAHABAT COMPLEX, SEBERANG COMPLEX in West Malaysia is advantageous, because a power transmission line is readily available in the neighborhood area.This means that comparatively easy power transmission line connection is feasible.
After examining the above miscellaneous conditions, this time, the reason why SAHABAT COMPLEX has been picked up as a hopeful object is as follows:
Securing of raw materials, EFB is advantageous.The complex is a prominent power consumer in the FELDA (Ltd.) Group Sufficiently wide space can be maintained so as to install new machines and equipment.
FELDA is strongly desirous to apply financing grant introduced from foreign countries.
However, as a matter of fact, FELDA believes that if the operability of the plant is good, the execution plan at enforcement site by using own funds might be executable.
It is natural that if any favorable money loan is obtainable, FELDA may arrange the more prospective execution plan through the cooperation with Japan side.
Mr. Subash who is a responsible person of FELDA side intends to investigate the profitability of the Project under the following condition:
—2—131 —

On the premise that 50% of required funds shall be furnished by the own funds of FELDA.Then the remaining 50% of required funds shall be procured from external funds (including bank loans) on the premise that the total amount of required funds shall be within 0.15 billion yens.
-2-132-

2.4 CDM (Clean Development Mechanism) Condition and the Relating Matters
2.4.1 Setting of Project Enforcement Condition Based on the Actual Status at Project Enforcement Site, Division of Work etc. and Adjusting Matters with the Other Country required for the successful Materialization of CDM
In Hague, Netherlands, the conference period (November 13 ~ 24) of COP6 (6th Agreement Concluded Countries Conference made on Climatic Variation Frame Agreement) was terminated at p.m. on November 25 after extending one day conference period.
According to this conference aimed at the early promulgation of KYOTO Protocol, based on the results of preparatory meeting held up to now, several cabinet members were scheduled to held a meeting so as to solve political problems centering on the unsolved problems.
In this case, however, sophisticated advantage and disadvantage were entangled among many countries including advanced nations and advancing nations.As a result, the mutual agreement cannot be concluded.
For the absorption source of contamination, the restriction of obtainable credit and the separation of a natural influence from an artificial influence have become a focal point.
Then for the application of the first promising period during the additional activity of the absorption source of contamination, no positive action was not taken.
As a matter of fact, Japan, USA and Canada insisted to minimize the credit restriction, and to perform wide activity which should be applied to the first promising period.As a result, an opposing opinion was generated among EU, advancing countries, Japan, USA and Canada.
Then, on the premise that the above first promising period application shall be made so as to seek feasibility of agreement among the above-mentioned countries. But, finally, no agreement was concluded among EU, advancing countries, Japan, USA and Canada.
-2-133-

For the finance relating problems which are an essential focal point of problems to be solved in advancing countries, the problems were forwarded to the Umbrella Group. But, the plan has been denied by advancing countries.
For the necessity of additional funds, the consensus was obtained.In this case, however, for the details of the purpose of money use, scale, management body, etc., no agreement was concluded at all.
On the other hand, for capacity building, adaptability actions and additional guidance to GEF, many items have been agreed.However, for countermeasures to be taken against oil producing countries, as well as for technology transient expert group problems, and other major argument points, they have been remained without resolution.
For the KYOTO mechanism, the following items become the major points in dispute:
Supplementary capabilityRestriction of the objective business in Clean Development Mechanism (CDM)Configuration of CDM Execution Board.
For the Supplementary capability (Restriction of utilization of KYOTO mechanism), in the final stage, it was observed that a compromise by advanced countries is available.
For the Configuration of CDM Execution Board, no agreement was concluded
For the CDM’s objective business, no restriction was applied, but a certain orientation has been found.
On the other hand, for the handling of an atomic power generation and for a contamination absorption business, no agreement was concluded.
For the handling of ODA relating with CDM, if it is additional item, a statement that ODA can be utilized is described on the document of Chairman, Mr. Bronk.
-2-134-

According to the applicable observation regulations, the configuration of committee in the execution section who determines the non-conformance of Article 31 in the Protocol became the critical focal point.
According to the Chairman's plan, the configuration itself is selected based on the geographical distribution.Then the plan was G77 + China biased plan.As a result, plural numbers of Appendix I nations including Japan were unable to receive the plan.Such being the case, the protocol was transferred to the discussion at the next COP6 meeting to be held in May ~ June, 2002.
As described above, according to COP6 meeting held this time, clear CDM rule is not determined.In order to realized this Project, the following items are required to discuss and adjust with the opposite Government.
Next, based on the agreement concluded by both the nations, and then, according the regulations, the scope of work should be determined after consulting with the partners of the opposite Government.Fundamentally, the partners of the opposite Government agree with the enforcement of miscellaneous arrangements including registration of CDM in relationship with the applicable agencies.
l) Creation of an organization between both nations concerning CDM:
In the course of the enforcement of CDM, the following items will promote the CDM business:Establishment of an organization which may consult with detailed regulations and plans.Standardization of nation level through the above organization.Tax-free actions to be taken on imported machines and equipment. Simplification of construction work.
If the above organization is supposed to commence the work simultaneously with other places, the management organization can be required to verify in both the nation level and local level.
Moreover, in particular, it is also supposed that the determination of the
-2-135-

baseline is complicated and difficult. Therefore, consultation is prerequisite to carry out through the above organizations.
2) Establishment 3rd party validation agencies for project, modeling and verification planning:
In order to maintain clear management and report of contaminant disposal assignment including the reduction of validated discharge amount (CERs), caused by CDM, the establishment 3rd party validation agencies is necessary.Those agencies which can manage adequately the assigned disposal amount so that the specified assignment unit does not receive plural number of registration are the basis which can secure environmental preservation as written in KYOTO Protocol.
3) Technology/ engineering transfer:
Because CDM is useful and effective technology/engineering for the opposite nation, the opposite nation will surely request to transfer such technology/ engineering.In order to transfer such technology/engineering smoothly, first of all, political and trade interference s/obstacle s must be eliminated.
On this occasion, it will be required to make clear the technology licensing fee, CO2 removal technology and reduction credit, etc., which must be discussed between both parties.
— 2—136—

2.4.2 Feasibility of Agreement concluded for the CDM of the applicable Project (Requirements that the Other Country may agree with the Way of Concepts of Other Country Government and of Enforcement Site (Enterprise) concerning the CDM)
At present. Malaysia is improving energy foundations depending upon gas, oil, petroleum and other fossil fuels.
Actually biomass power generation, solar power generation, wind power generation and garbage burning power generation, as well as disposal incineration and gasification power generation are being studied or being scheduled to introduce from overseas countries.
In particular, Malaysia is strongly expediting the biomass power generation method, and is scheduled to promote miscellaneous biomass power generation policies.
In order to satisfy such Malaysian Government requirements, the Project has proposed.Whenever the CDM regulations have been cleared in COP6 meeting, the possibility that the Malaysian Government may agree with the intention of this Project is high.Moreover, the partners are also agreeable with the Project.This is because that the partners may fully recognize the economic merits.
Accordingly, when the CDM qualification work is simple and low cost, the agreement may be concluded very hopefully.
-2-137-

CHAPTER 3
EFFECT OF THE PROJECT
Abstract
In regard to energy substitution effect and Green House Gases reduction effect, lines of thinking on the base line and on its setting have been shown, and the volume of such effect has been computed.With the base line set up on the basis of the planned values for electric power demand and for the quantity of steam consumed at the site (enterprise) of execution of this project, the following volume can be expected, as the effect of the project during twenty years from 2006 to 2025 at the site of the project executed, by utilizing effectively the expectable quantity of generated EFB (composing coconut husks) as an alternative fuel for fossil fuel:
• As energy substitution effect (reduced to crude oil quantity):About 376 ktoe for Industry-owned Power Plant with fluidized bed boilers, or About 363 ktoe for Industry-owned Power Plant with stoker boilers
(for Reference)About 695 k toe for IPP with fluidized bed boilers, or About 652 k toe for IPP with stoker boilers; and
• As Green House Gases reduction effect (reduced to carbon dioxide quantity):About 5,757 kt-COa for Industry-owned Power Plant with fluidized bed boilers, or About 5,478 kt COz for Industry-owned Power Plant with stoker boilers
(for Reference)About 11,654 ktCOa for IPP with fluidized bed boilers, or About 10,970 kt COz for IPP with stoker boilers.
The above values for the case of IPP show the volume of effect in the case where almost the whole quantity of EFB generated from 10 palm oil plants as SAHBAT COMPLEX, where the site of project execution is situated, in SABAH State, is utilized effectively.
However, the volume of production at the site of project execution is only 3.5% of that in the whole of Malaysia, and therefore, when ETB is effectively used in the whole of Malaysia, the volume of effect for the whole of Malaysia is estimated at more than 25 times as much as shown above for the case of IPP.

CHAPTER 3. EFFECT OF THE PROJECT
3.1 Energy Substitution Effect
3.1.1 Technological Grounds for Producing the Energy Substitution Effect
There are EFB, fiber and shell left as remnants after products (palm oil and kernel
oil) have been got from palms, and among them, fiber and shell are being utilized
effectively as fuel because they are not watery and also high in calorific value.
However, EFB, which is generated in the greatest quantity among the remnants, is
no being used as fuel because of its wateriness and low calorific value.
Through the adoption of the EFB burning co generation equipment, which
incorporates due pretreatment so as to enable the use of EFB as fuel by adjusting its
moisture to the type of the combustion furnace and also by raising its calorific value,
the introduction of the EFB burning Industry-owned Power Plant or IPP which uses
as fuel the EFB having been so far dumped as useless into palm plantations,
enables the curtailment of fossil fuel being now used for Diesel generators and
boiler.
3.1.2 Base Line Forming the Basis for Computation of Energy Substitution Effect
(Concepts of Estimating the Energy Consumption in the Case where the Project is
Not Executed)
3.1.2.1 Concepts on Base Line Setting
The planned service conditions shown below, which are predetermined at the site
(enterprise) intended for execution of this project, are used as a basis: and for the
case of Industry-owned Power Plant, the quality of fossil fuel to be consumed, in the
-3-1-

case which this project is not executed and the planned service conditions are
assumed to be met by means of the existing Diesel generators and boiler is SAHBAT
COMPLEX where the palm oil refineries to be incorporated in the project are
situated, is regarded as corresponding to the base line.
And for the case of IPP, the quantity of fuel to be used by the electric power company
as buyer, for generation of electric power corresponding to sold electric energy, must
be added to the base line value, and since energy selling capability differs between
the FBB and the stoker boiler, this difference is also taken into consideration, for
setting the base line.
[ Planned Service Conditions ]
1) Annual operating time shall be not less than 8000 hours,
(335 days = 8040 hours have been predetermined.))
2) The following daily loads in usual season and in busy season shall be based on.
a) Power demand:
In usual season (October to March):
5.19 MW for 2 hours from 17:00 to 19:00,
4.93 MW for 10 hours from 7:00 to 17:00,
2.79 MW for 4 hours from 19:00 to 23:00,
2.53 MW for 8 hours from 23=00 to 7=00;
In busy season (April to September):
5.19 MW for 6 hours from 17=00 to 23=00,
4.93 MW for 18 hours from 23=00 to 17=00,
— 3—2—

b) Steam demand: (refer Fig. 2.2.2.4-3)
16 t/h throughout the year. 12bar(g), sat. (44,740 Mj/h)
Upon these various conditions, calculation result is indicated in Table 3.1.2.1-1~
Table 3.1.2.1-4.
As for calculation of fuel oil quantity (fossil fuel quantity),
1) Diesel generator
According to the data (annual power generation quantity, annual fuel cost and
fuel unit price) obtained from FELD A, fuel oil quantity per MWh is calculated
and the same of power generation quantity or backup power quantity by diesel
generator at operation conditions in the new facihty is also calculated. That is,
Unit fuel oil quantity =
(Annual fuel cost in the existing facihty)
(Fuel unit price)
(Annual power generation in existing facihty) (KL/MWh)
Fuel oil quantity on the operation conditions at a new facihty =
unit fuel oil quantity x diesel power generation quantity.... (D
2) Boiler for process steam
The data obtained from FELDA is only fuel oil quantity per day so that fuel oil
quantity of steam generation per lt/h is calculated in assumption of steam
quantity at 16t/h during 24 hours continuously transmitted to the factory as a
maximum value. That is,
(Actual fuel quantity per day)Unit fuel oil quantity = -------------------------------------------- 4-
24
(Steam generation) (KL/t/h)
— 3—3—

Fuel oil quantity on the operation conditions at a new facility = unit fuel oil
quantity X steam transmission quantity to factory..... (D
Consequently, in case of operation for a new facility on the same conditions in the
existing
facility, the fuel oil quantity is the total of (D + (D using in existing diesel
generator and boiler.
Meanwhile, in case of operation on the conditions suitable to a new facility, the fuel
oil quantity is only 0 using in backup power generation by the existing diesel
generator.
— 3—4—

Table 3. 1. 2. 1 — 1 Amount of Fossil Fuel Used Based on the Planned Working Condition (In Case of Fluidized Bed Boiler in Industry owned PP)Continuous
Jan. Feb. Mar Apr May July Aug Sept. Oct. Nov Dec. Total TotalCalendar days 31 28 31 * 31 30 31 31 30 31 30 31 366 336
Unit Unit: KLA or t/YUsual treason t)usy—beasurr rtdsuai—Season----------
Electric Demand in COMPLEX MW 2.53 279 4.93 519 253 279 493 5.19 253 279 4 93 619 4 93 5.19 433 519 4.93 519 493 519 493 519 493 619 253 279 493 519 2.53 279 493 519 2.53 279 493 5.19Steam Demand t/h 16 16 16 16 16 16 16 16 16 16 16 1c 16 1c 16 16 16 16 16 16 16 16 16 16 16 16 16 16 16 16 16 16 16 16 16 16Operation Hours h/d 8 4 10 2 8 4 10 2 8 4 10 2 16 6 18 6 18 6 18 6 18 6 18 6 8 4 10 8 4 10 2 8 4 10 2
Generalia* Power MW 3.731 4.028 5.570 5.570 3.731 4.028 5.570 5.570 3.731 4.028 6.570 5.570 5.570 5.570 6.570 5.570 5.570 5.570 5.570 5.570 6.570 5.570 5.570 5.570 9.731 4.028 5.570 5.570 3.731 4.028 5.570 6.670 3.731 4.028 5.570 5.570Power Consumption in PP MW 1.201 1.238 1.460 1.460 1.201 1.238 1.460 1.460 1.201 1.238 1.460 1.460 1.460 1.460 1.460 1.460 1.460 1.460 1.460 1.460 1.460 1.460 1.460 1.460 1.201 1.238 1.460 1.460 1.201 1.238 1.460 1.460 1.201 1.238 1.460 1.460Capable Transmission Power MW 2530 2790 4110 4110 2530 2790 4110 4110 2.530 2790 4110 4110 4110 4.110 4110 4110 4110 4110 4110 4110 4110 4110 4.110 4110 2530 2790 4110 4110 2630 2790 4110 4.110 2530 2790 4110 4110
Power Consumption in SAHABAT COMPLEX MVWVm 627 346 1,628 322 567 312 1.380 291 627 346 1.528 322 2.662 934 2.751 966 2.662 934 2.761 966 2.761 965 2,662 934 627 346 1.528 322 607 336 1.479 311 627 346 1.628 322 38.616 36.349Fuel Oil for Power KL/m 1944 1072 4734 997 1755 968 4276 900 1944 1072 4734 997 3247 2894 8522 2990 8247 2894 8522 2990 8522 2990 8247 2894 1944 107.2 4734 997 1881 1037 4581 965 1944 1072 473.4 997 11.931 10.950
Steam Consumption t/m 3.968 1,984 4.960 992 3.584 1.792 4.480 896 3.968 1.984 4.960 992 3.640 2.880 8.928 2.976 8.640 2.880 8,928 2.976 8.928 2.976 8.640 2.880 3.968 1984 4.960 992 3.840 1.920 4.800 960 3.968 1.984 4.960 992 140.160 128.640Fuel Oil for Steam KL/m 3750 1875 4687 937 338 7 1693 4234 84 7 3750 1875 4687 93 7 3165 272 2 8437 2812 8165 2722 8437 2812 8437 2812 8165 2722 3750 1375 4687 937 362.9 1314 453.6 90.7 3750 1875 4687 937 13.245 12.156
EFB Consumption (601 Moisture) t/h 2011 2087 2487 24 87 2011 2087 24 87 2487 2011 20 87 2487 24 87 24 87 24 87 2487 2487 2487 2487 2487 2487 2487 24 87 2487 2487 2011 20.87 2487 2487 2011 2087 2487 24.87 2011 2087 2487 24 87 190.918Raw EFB Consumption t/h 22 75 2361 2813 2813 22 75 2361 2813 2813 22 75 23.61 2813 2813 9813 2813 2813 2813 2813 2813 2813 2813 2813 2813 2813 2813 2276 2361 2813 2813 2275 2361 28.13 2813 2275 23.61 2813 2813Carryin£-in of EFB t/m 5.642 2.927 8.720 1.744 5.095 2.644 7.876 1.575 5.642 2.927 3.720 1.744 15.190 5.063 15.697 5.232 15,190 5.063 15.697 5.232 15.697 5.232 15.190 5.063 5.642 2927 8.720 1.744 5.460 2.833 8.439 1.688 5.642 2927 8.720 1.744 235.291 215.952
(Fuel Oil Consumption to meet planned output using the existing facilities]Fuel Oil Consumption KL/m 5693 294 7 9421 1934 5142 2661 8510 174 7 5693 294 7 9421 1934 1.5411 561 5 1.6959 5803 1.6411 5615 1.6959 5803 16959 5803 16411 5615 5693 2947 942.1 1934 5510 285.2 9117 187.2 5693 2947 9421 1934 25.176 23107
(Fuel Oil Consumption to meet planned output using a newly-setup facilities]Pei. DC back-up Power MW 0000 OCOO 0820 1 080 0000 0000 0820 1080 0000 0000 0820 1080 0820 1 080 0 820 1 080 0.820 1.080 0820 1080 0820 1080 0820 1080 0000 0000 0.820 1080 0.000 0000 0.820 1080 0.000 QOOO 0.820 1080Back "Up Mlmh MWh/m GO 670 00 2295 606 uu 0.0 254.2 670 4438 194 4 4576 2009 4428 1944 4576 2009 457.6 2009 442.8 194.4 0.0 00 2542 670 uO 0.0 2460 64.6 UU UU 2542 67.0 57724 52960I'd Oil Consumption to back-up KL/m 00 00 78 7 207 00 00 711 18.7 00 00 787 207 1372 602 1417 622 1372 602 1417 622 141.7 622 1372 602 00 00 767 207 0.0 00 762 201 00 0.0 78.7 207 1.788 1.641
Reduced Fuel amount KL/m 5693 2947 8634 1727 514 2 2661 7793 1560 5693 294 7 8634 1727 1.5040 5013 15541 5180 1.5040 5013 1.5541 5180 15541 5180 15040 5013 5693 294.7 863.4 172.7 5510 235 2 8355 1671 5693 2947 8634 1727 23.388 21.465
Table 3. 1.2. 1-2 Amount of Fossil Fuel Used Based on the Planned Working Condition (In Case of Stoker Boiler in Industry owned PP)
Jan Feb Mat Apr. May July Aug Sept. Oct NovCalendar days 31 28 31 30 31 30 31 31 30 31 30
UnitII , ^ 1-% ^Usual oeabun uus y ouasori Usual—Season
Electric Demand in COMPLEX MW 253 279 493 519 253 279 493 519 253 279 493 519 493 516 4 93 519 4.93 519 493 519 493 519 493 519 253 279 493 519 2.53 279Steam Demand t/h 16 16 16 16 16 16 16 16 16 16 16 16 16 16 16 16 16 16 16 16 16 16 16 16 16 16 16 16 16 16Operation Hours h/d 8 4 10 2 8 4 10 2 8 4 10 2 18 6 18 6 18 6 18 6 18 6 18 6 8 4 10 2 8 4
Generating Power MW 4.111 4.424 5.570 5.570 4.111 4.424 5.570 5.570 4.111 4.424 5.570 5.570 5.570 5.570 5.570 5.570 5.570 5.570 5.570 5.570 5.570 5.570 5.570 5.570 4.111 4.424 5.570 5.570 4.111 4.424Power Consumption in PP MW 1.581 1.634 1.848 1.848 1.581 1.634 1.848 1.648 1.581 1.634 1.843 1.848 1.843 1.848 1.848 1.848 1.848 1.848 1.848 1.848 1.848 1.848 1.848 1.348 1.581 1.634 1.848 1.848 1.581 1.634Capable Transmission Power MW 2.630 2790 3722 3722 2530 2790 3722 3722 2530 2790 3722 3722 3722 3722 3.722 3722 3.722 3722 3 722 3722 3.722 3722 3.722 3722 2530 2790 3 722 3722 2530 2790
Power Consumption in SAHABAT COMPLEX MVWi/m 627 346 1.628 322 667 312 1,380 291 627 346 1.628 322 2.662 934 2,751 965 2.662 934 2.761 966 2.761 965 2.662 934 627 346 1,628 322 607 335Fuel Oil for Power KL/m 194 4 1072 4734 99 7 1756 968 4275 900 1944 1072 4734 997 824.7 2894 8522 2990 824 7 2894 8522 2990 8522 2990 824.7 2894 1944 1072 4734 99.7 1881 1037
Steam Consumption t/m 3.968 1,984 4,960 992 3.584 1,792 4.480 896 3.968 1.984 4,960 992 8.640 2.880 8.928 2.976 8.640 2.880 8.928 2.976 8.928 2.976 8.640 2.880 3.968 1.984 4,960 992 3.840 1.920Fuel Oil for Steam KL/m 3760 1875 4687 907 3387 169.3 4234 647 3750 1875 4687 937 8165 2722 8437 2812 8165 272.2 8437 2812 8437 2812 8165 2722 3750 187.5 4687 937 3629 131.4
EFB Consumption (45% Moisture) t/h 14 37 1493 1697 1697 1437 1493 1697 1697 14 37 14 93 1697 1697 1697 1697 1697 1697 1697 16.97 1697 1697 1697 1697 1697 1697 1437 1493 1697 1697 14.37 1493Raw EFB Consumption t/h 22 35 2322 26 39 2639 22 35 2322 26 39 26 39 22 35 2322 26.39 2639 2639 26 39 2639 26.39 2639 2639 2639 2639 2639 26.39 2639 26 39 22.35 99 99 2639 26.39 2235 2322Carrying-in of EFB t/m 5.542 2.879 8.181 1,636 5.005 2.601 7.389 1.478 5.542 2.879 8,181 1.636 14.251 4.750 14.726 4.909 14.251 4.750 14.726 4.909 14.726 4.909 14.251 4.750 5.542 2879 8,181 1,636 5.363 2.786
[Fuel Oil Consumption to meet planned output us rig the exixting facilities]Fuel Oil Consumption KL/m 5693 2947 9421 1934 514.2 2661 8510 174 7 5693 2947 9421 1934 1.641.1 5615 1.6959 5803 1.6411 5615 1.6959 5803 1.6959 5803 16411 5615 5693 2947 942.1 1934 5510 2852
[Fuel Oil Consumption to meet planned output us rig a newly-setup facilities]Pei. DC back-up Power MW oooo 0000 1.208 1 468 0.000 0000 1203 1468 0.000 0000 1.208 1 468 1.208 1468 1268 1 468 1208 1468 1208 1 468 1.208 1468 1 208 1468 0000 0000 1.208 1468 0000' 0000Back-up WWh MVWi/in 00 00 3745 910 00 00 3382 822 00 00 3745 910 6523 264 2 6741 2730 6523 2642 6741 2730 6741 2730 6523 2642 00 00 3745 910 00 00Hi Oil Consumption to back-up KL/m 00 00 1160 282 00 00 104 8 265 00 00 1160 282 2021 81 9 2088 846 2021 819 2088 846 2088 846 2021 819 00 0.0 116.0 282 00 00
Reduced Fuel amount KL/m 5693 2947 8261 1652 5142 2661 7462 1492 569 3 2947 3261 1652 1.4391 4797 1.4870 495 7 1.4391 4797 1,4870 4957 1.487.0 495.7 14391 479.7 5693 2947 826.1 1552 5510 2852
30 days
Total
Unit: KL/Y or t/Y
4.1111.848 1.848 1.581 1.634 1.848 1.8483.722 3722 2.530 2790 3 722 3722
11.931
4.800 960 3.968 1.984 4.960 992 140.160 128.640468 7 937 13.245
1697 1697 1437 1493 1697 1697 131,609
7.917 5.542 2.879 8.181 1.636 222.979
9117 1872 669.3 294 7 942.1 1934 25,176 23.107
881 00 00 374 5 910 8323 9 76398
799.5 159.9 5693 294.7 8261 1652 22.597 20,740
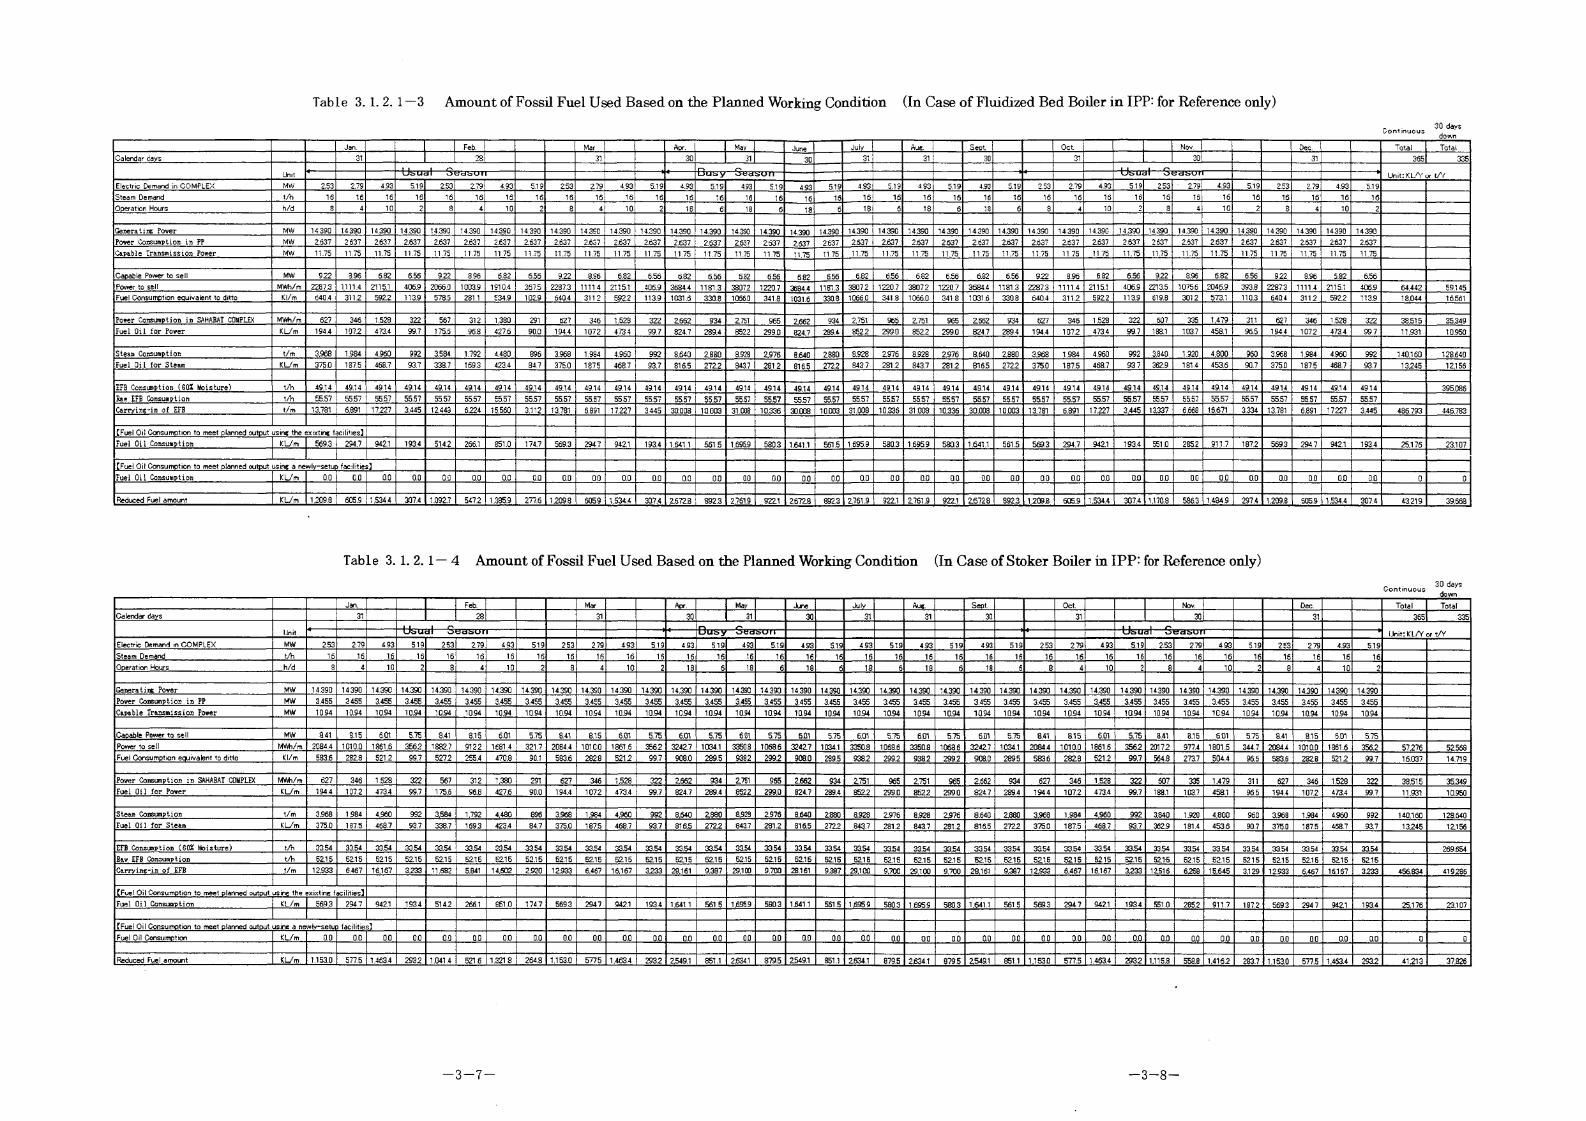
Table 3.1. 2.1 —3 Amount of Fossil Fuel Used Based on the Planned Working Condition (In Case of Fluidized Bed Boiler in IPP; for Reference only)
Continuous ,downJan. Feb. Mar Apr. Mav June July Aug. Sept Oct. Nov. Dec. Total Total
Calendar days 31 28 31 30 31 30 31 31 30 31 30 31 365 335
Unit Unit: KL/Y or t/YUbUdl otfdbori tJuyy oBason— UbLidl OCdbU r i
Electric Demand in COMPLEX MW 2.53 2.79 4.93 5.19 2.53 2.79 4.93 5.19 2.53 2.79 4.93 5.19 4.93 5.19 493 5.19 4.93 5.19 4.93 5.19 4.93 5.19 4.93 5.19 2.53 2.79 4.93 5.19 2.53 2.79 4.93 5.19 2.53 2.79 493 5.19Steam Demand t/h 16 16 16 16 16 16 16 16 16 16 16 16 16 16 16 16 16 16 16 16 16 16 16 16 16 16 16 16 16 16 16 16 16 16 16 16Operation Hours h/d 8 4 10 2 8 4 10 2 8 4 10 2 18 6 18 6 18 6 18 6 18 6 18 6 8 4 10 2 8 4 10 2 8 4 10 2
Generating Power MW 14.390 14390 14.390 14.390 14.390 14390 14.390 14.390 14.390 14.390 14.390 14390 14.390 14.390 14.390 14.390 14.390 14.390 14.390 14390 14.390 14 390 14.390 14.390 14.390 14.390 14.390 14.390 14.390 14.390 14.390 14.390 14.390 14.390 14390 14.390Power Consumption in PP MW 2.637 2637 2.637 2.637 2.637 2.637 2.637 2.637 2.637 2.637 2.637 2.637 2.637 2.637 2.637 2.637 2.637 2.637 2.637 2.637 2.637 2.637 2.637 2.637 2.637 2.637 2.637 2637 2.637 2.537 2637 2.637 2.637 2.637 2.637 2.637Capable Transmission Power MW 11.75 11.75 11.75 11.75 11.75 11.75 11.75 11.75 11.75 11.75 11.75 11.75 11.75 11.75 11.75 11.75 11.75 11.75 11.75 11.75 11.75 11.75 11.75 11.75 11.75 11.75 11.75 11.75 11.75 11.75 11.75 11.75 11.75 11.75 11.75 11.75
Capable Power to sell MW 9.22 3.96 6.82 6.56 9.22 8.96 6.82 6.56 9.22 8.96 6.82 6.56 6.82 6.56 6.82 6.56 6.82 6.56 6.82 6.56 6.82 6.56 6.82 6.56 9.22 8.96 6.82 6.56 922 8.96 6.82 6.56 922 8.96 5.82 656Power to sell MWh/m 2287.3 1111.4 2115.1 406.9 2066.0 1003.9 1910.4 367.5 2287.3 11114 2115.1 406.9 3684.4 1181.3 3807.2 1220.7 3684.4 1181.3 3807.2 12207 3807.2 1220.7 3684.4 1181.3 2287.3 1111.4 21151 406.9 2213.5 1075.6 2046.9 393.8 2287.3 1111.4 2115.1 406.9 64.442 59145Fuel Consumption equivalent to ditto Kl/m 640.4 311.2 5922 113.9 578.5 281.1 534.9 102.9 640.4 3112 592.2 113.9 1031.6 330.8 1066.0 341.8 1031.6 330.8 1066.0 341.8 1066.0 341.8 1031.6 330.8 640.4 311.2 592.2 113.9 619.8 301.2 573.1 110.3 640.4 311.2 592.2 113.9 18.044 16561
Power Consumption in SAHABAT COMPLEX MWh/m 627 346 1.528 322 567 312 1.380 291 627 346 1.528 322 2.662 934 2.751 965 2.662 934 2.751 965 2.751 965 2.662 934 627 346 1,528 322 607 335 1.479 311 627 346 1.528 322 38.515 35.349Fuel Oil for Power KL/m 194.4 1072 473.4 99.7 175.5 96.8 427.6 90.0 194.4 1072 473.4 99.7 824.7 289.4 8522 299.0 824.7 289.4 852.2 299.0 852.2 299.0 824.7 289.4 194.4 107.2 473.4 99.7 188.1 103.7 458.1 96.5 194.4 107.2 473.4 99.7 11.931 10950
Steam Consumption t/m 3.968 1.984 4.960 992 3.584 1.792 4.480 896 3.968 1.984 4.960 992 8.640 2.880 8.928 2.976 8.640 2.880 8.928 2.976 8.928 2.976 8.640 2.880 3.968 1.984 4.960 992 3.840 1.920 4.800 960 3.968 1.984 4.960 992 140.160 128.640Fuel Oil for Steam Kl/m 375.0 187.5 468.7 93.7 338.7 169.3 423.4 84.7 375.0 1875 468.7 93.7 816.5 272.2 843.7 281.2 816.5 272.2 843.7 281.2 843.7 281.2 816.5 272.2 375.0 187.5 468.7 93.7 362.9 181.4 453.6 90.7 375.0 187.5 468.7 93.7 13.245 12.156
EFB Consumption (BOX Moisture) t/h 49.14 49.14 49.14 49.14 49.14 49.14 49.14 49.14 49.14 49.14 49.14 49.14 49.14 49.14 49.14 49.14 49.14 49.14 49.14 49.14 49.14 49.14 49.14 49.14 49.14 4914 49.14 49.14 49.14 49.14 4914 49.14 49.14 4914 49.14 4914 395.086Saw EFB Consumption t/h 55.57 55.57 55.57 55.57 55.57 55.57 55.57 55.57 55.57 55.57 5557 55.57 5557 55.57 55.57 55.57 55.57 55.57 55.57 5557 55.57 55.57 55.57 55.57 5557 55.57 55.57 55.57 55.57 55.57 55.57 55.57 55.57 55.57 55.57 55.57Carrying-in of EFB t/m 13.781 6.891 17.227 3.445 12.443 6.224 15.560 3.112 13.781 6.891 17.227 3.445 30.008 10.003 31.008 10.336 30.008 10.003 31.008 10.336 31.008 10.336 30.008 10.003 13.781 6.891 17.227 3.445 13.337 6.668 16.671 3.334 13.781 6.891 17227 3.445 486.793 446.783
[Fuel Oil Consumption to meet planned output using the exixting facilities]Fuel Oil Consumption KL/m 569.3 294.7 942.1 1934 514.2 266.1 851.0 174.7 569.3 2947 942.1 193.4 1.641.1 5615 1.695.9 580.3 1.641.1 561.5 1.695.9 580.3 1.695.9 580.3 1.641.1 561.5 569.3 294.7 942.1 193.4 551.0 285.2 911.7 187.2 569.3 294.7 942.1 193.4 25.176 23.107
[Fuel Oil Consumption to meet planned output using a newly-setup facilities]Fuel Oil Consumption KL/m 0.0 0.0 0.0 0.0 0.0 0.0 0.0 0.0 0.0 00 0.0 0.0 0.0 0.0 0.0 0.0 0.0 0.0 0.0 0.0 0.0 0.0 0.0 0.0 0.0 0.0 0.0 0.0 0.0 0.0 0.0 0.0 0.0 0.0 0.0 0.0 0 0
Reduced Fuel amount Kl/m 1209.3 605.9 1,534.4 307.4 1.092.7 547.2 1.385.9 277.6 1.209.8 6059 1.534.4 307.4 2.672.8 892.3 2.761.9 922.1 2.672.8 892.3 2.761.9 922.1 2.761.9 922.1 2.672.8 892.3 1.209.8 605.9 1.534.4 307.4 1.170.8 586.3 1.484.9 297.4 1.209.8 605.9 1.534.4 307.4 43.219 39.668
Table 3.1. 2.1 — 4 Amount of Fossil Fuel Used Based on the Planned Working Condition (In Case of Stoker Boiler in IPP; for Reference only)
Continuous ^own
Jan. Feb. Mar Apr. May June July Aug. Sept. Oct. Dec. Total TotalCalendar days 31 28 31 30 31 30 31 31 30 31 30 31 365 335
Unit Unit: KL/Y or t/YUsual otidsori Uusy—otidburi— UbUdl ocd^uriElectric Demand in COMPLEX MW 253 279 493 5.19 253 2.79 493 519 253 279 493 5.19 493 519 493 519 493 519 493 519 4.93 519 493 519 2.53 279 493 5.19 253 279 493 519 253 279 4.93 519Steam Demand t/h 16 16 16 16 16 16 16 16 16 16 16 16 16 16 16 16 16 16 16 16 16 16 16 16 16 16 16 16 16 16 16 16 16 16 16 16Operation Hours h/d 8 4 10 2 8 4 10 2 8 4 10 2 18 6 18 6 18 6 18 6 18 6 18 6 8 4 10 2 8 4 10 2 8 4 10 2
Generating Power MW 14.390 14390 14.390 14.390 14.390 14.390 14.390 14.390 14.390 14.390 14.390 14.390 14.390 14390 14.390 14.390 14.390 14.390 14.390 14.390 14.390 14.390 14.390 14.390 14.390 14.390 14.390 14.390 14.390 14.390 14.390 14.390 14.390 14.390 14390 14.390Power Consumption in PP MW 3.455 3455 3.455 3.455 3.455 3.455 3.455 3.455 3.455 3.455 3.455 3.455 3.455 3.455 3.455 3.455 3.455 3.455 3.455 3.455 3.455 3.455 3.455 3.455 3.455 3.455 3.455 3.455 3.455 3.455 3.455 3.455 3.455 3.455 3455 3.455Capable Transmission Power MW 10.94 10.94 10.94 10.94 10.94 1094 10.94 1094 1094 10.94 10.94 10.94 1094 10.94 10.94 10.94 10.94 10.94 10.94 1094 10.94 10.94 10.94 1094 1094 10.94 10.94 1094 1094 10.94 10.94 1094 10.94 1094 10.94 10.94
Capable Power to sell MW 8.41 8.15 6.01 5.75 8.41 8.15 6.01 5.75 8.41 8.15 6.01 5.75 6.01 5.75 6.01 5.75 6.01 5.75 6.01 5.75 6.01 5.75 6.01 5.75 8.41 8.15 6.01 5.75 8.41 8.15 6.01 5.75 8.41 8.15 5.01 5.75Power to sell MWh/m 2084.4 1010.0 1861.6 356.2 1882.7 912.2 1681.4 321.7 2084.4 1010.0 1861.6 356.2 3242.7 1034.1 3350.8 1068.6 3242.7 1034.1 3350.8 1068.6 3350.8 1068.6 3242.7 1034.1 2084.4 1010.0 1861.6 356.2 2017.2 977.4 1801.5 344.7 2084.4 1010.0 1861.6 356.2 57.276 52.568Fuel Consumption equivalent to ditto Kl/m 583.6 282.8 521.2 99.7 527.2 255.4 470.8 90.1 583.6 282.8 521.2 99.7 908.0 289.5 938.2 299.2 908.0 289.5 938.2 299.2 938.2 299.2 908.0 289.5 583.6 282.8 521.2 99.7 564.8 273.7 504.4 96.5 583.6 282.8 521.2 99.7 16.037 14.719
Power Consumption in SAHABAT COMPLEX MVWi/m 627 346 1.528 322 567 312 1.380 291 627 346 1.528 322 2.662 934 2.751 965 2.662 934 2.751 965 2751 965 2.662 934 627 346 1.528 322 607 335 1.479 311 627 346 1.528 322 38.515 35.349Fuel Oil for Power KL/m 194.4 107.2 473.4 99.7 175.6 96.8 427.6 90.0 194.4 1072 473.4 99.7 824.7 289.4 8522 299.0 824.7 289.4 8522 299.0 852.2 299.0 824.7 289.4 194.4 107.2 473.4 99.7 188.1 103.7 458.1 96.5 194.4 107.2 473.4 99.7 11.931 10.950
Steam Consumption t/m 3.968 1984 4.960 992 3.584 1.792 4.480 896 3968 1984 4.960 992 8.640 2.880 8928 2976 8.640 2880 8928 2.976 8928 2976 8.640 2.880 3.968 1.984 4.960 992 3.840 1920 4.800 960 3968 1.984 4960 992 140.160 128.640Fuel 011 for Steam KL/rn 375.0 187.5 468.7 93.7 338.7 169.3 423.4 84.7 375.0 1875 468.7 93.7 816.5 272.2 843.7 281.2 816.5 2722 843.7 281.2 843.7 281.2 816.5 2722 375.0 187.5 468.7 93.7 3629 181.4 453.6 90.7 375.0 187.5 468.7 93.7 13.245 12.156
EFB Consumption (BOX Moisture) t/h 33.54 33.54 33.54 33.54 33.54 33.54 33.54 33.54 33.54 33.54 33.54 33.54 33.54 33.54 33.54 33.54 33.54 33.54 33.54 3354 33.54 33.54 33.54 33.54 3354 33.54 33.54 33.54 33.54 33.54 33.54 33.54 33.54 33.54 33.54 33.54 269.654Saw EFB Consumption t/h 52.15 52.15 52.15 52.15 52.15 52.15 52.15 52.15 52.15 52.15 52.15 52.15 52.15 52.15 52.15 52.15 52.15 52.15 5215 5215 52.15 52.15 52.16 52.15 5215 5215 52.15 52.15 52.1-5 52.15 52.15 52.15 52.15 52.15 52.15 52.15Carrying-in of EFB t/m 12.933 6.467 16.167 3.233 11.682 5.841 14.602 2.920 12.933 6.467 16.167 3.233 28.161 9.387 29.100 9.700 28.161 9.387 29.1 CO 9.700 29.1 CD 9.700 28.161 9.387 12.933 6,467 16.167 3.233 12.516 6.258 15.645 3.129 12.933 6.467 16.167 3.233 456.834 419.286
[Fuel Oil Consumption to meet planned output using the exixting facilities]Fuel Oil Consumption KL/m 5693 2947 942.1 1934 5142 2661 8510 1747 5693 2947 942.1 1934 1.641.1 561 5 1.6959 5803 16411 5615 1.6959 5803 1.6959 5803 1.641.1 5615 5693 2947 942.1 1934 551.0 2852 911 7 1872 5693 2947 942.1 1934 25.176 23.107
[Fuel Oil Consumption to meet planned output using a newlv-setuo facilities]Fuel Oil Consumption KL/m 0.0 0.0 0.0 0.0 0.0 0.0 0.0 0.0 0.0 0.0 0.0 0.0 0.0 0.0 0.0 0.0 0.0 0.0 0.0 0.0 0.0 0.0 0.0 0.0 0.0 0.0 0.0 0.0 0.0 0.0 0.0 0.0 0.0 0.0 0.0 0.0 0 0
Reduced Fuel amount KL/m 1.153.0 577.5 1.463.4 2932 1.041.4 521.6 1,321.8 264.8 1.153.0 577.5 1.463.4 293.2 2.549.1 851.1 2.634.1 879.5 2549.1 851.1 2634.1 879.5 2634.1 879.5 2549.1 851.1 1.153.0 577.5 1.463.4 293.2 1.115.8 558.8 1.416.2 283.7 1.153.0 577.5 1.463.4 293.2 41.213 37.826
—3—7— —3—8—

3.1.2.2 Quantity of Fuel Used on the Base Line
In the case of Industry-owned Power Plant, the quantity of fossil fuel to be consumed on the assumption that the existing Diesel generators and boiler would meet the planned service conditions in future is the quantity of fuel used on the base line.
Furthermore, the fossil fuel being used for the existing Diesel generators and boiler is wholly Diesel oil (DO).
In the case of IPP, the quantity of fuel to be used by the electric power company as a buyer, for generation of electric power corresponding to sold electric energy, is added to the above value for the base line.
In the power stations of the electric power company, which are situated ad RAHAT DATU District in SABAH State, electric power is supplied by Diesel generators, in connection with power demand at this district.Thus the fossil fuel being used there is also Diesel oil, and the quantity of fuel per
generated electric energy is about 280 (DO) Lit/MWh.
The generation of fossil fuel used in these cases is as shown in Table 3.1.2.2-1.In this connection, fuel data are as follows:
For Diesel oil: Calorific value = 43,124kJ/kg(l0,300 kcal/kg), and Density = 0.85 t/kl
For crude oil: Calorific value = 41,868kJ/kg(l0,000 kcal/kg).(The data are according to 2l(l) c) and a), Proposal depending on appealing public contribution of “Basic Survey for Promotion of Joint Implementation, etc.” in the 2000 fiscal year)
Table 3.1.2.2 1 Quantity of Fossil Fuel Used on Base Line
Unit Industry- owned PP
IPP (Reference)(FBB) (Stoker)
Quantity of Fuel Used by Existing Equipment
kl(DO)/year 23.107 23.107 23.107
Sold Electric Energy MWh/year 0 59,145 52,568
Quantity of Fuel Used Corresponding to Sold Electric Energy
kl(DO)/year 0 16,561 14,719
Total Sum of Quantities of Fuel Used
kl(DO)/year 23,107 39,668 37,826
Quantity Reduced to Crude Oil Basis
k toe/year 20,23 34,73 33,1287
-3-9-

3.1.3 Practical Volume, Producing Period and Accumulated Volume of Energy Substitution Effect (Effect when the Project has been executed)
3.1.3.1 Concepts on Setting the Case of the Project Executed
On the assumption that the above-mentioned planned service conditions at the site intended for execution of this project have been met, the reduction of the quantity of fossil fuel used, which is based on the following concepts, is regarded as energy substitution effect.
(1) In the case of Industry-owned Power Plant:The difference between the quantity of fossil fuel to be consumed when electric
power demand and steam demand in SAHABAT COMPLEX having the palm oil refineries in question, are met by power generating equipment using EFB as fuel, and the quantity of fossil fuel to be consumed (the value for the base line) when this project is not executed but the planned service conditions are met by the existing equipment, is regarded as energy substitution effect.In this case, in the high load zone, factory power demands can not be fully
supplied by the newly-set up equipment but some backup supply from the existing Diesel generators is needed, and thus the volume after the quantity of Diesel oil needed for this back-up supply has been deducted, corresponds to energy substitution effect.
Accordingly, the expression for computing the energy substitution effect is as follows:
[ Volume of energy substitution effect ] =[Quantity of fossil fuel used for the base line] —[Quantity of fossil fuel used for the case of the project executed]
(2) In the case of IPP- (for reference)Since factory power demand can be fully supplied, no back-up supply from the
existing equipment is needed, and in addition, the quantity of fossil fuel to be used for generation of electric power corresponding to sell electric energy, is unnecessary in the electric power company as a buyer.Accordingly, the added up volume of the value for the energy substitution effect
in Industry-owned Power Plant and the quantity of fossil fuel to be used for power generation corresponding to sold electric energy, corresponds to energy substitution effect.
Thus the expression for computing the energy substitution effect is as follows:
[ Volume of energy substitution effect ] =[Quantity of fossil fuel used for the base line ] —[Quantity of fossil fuel to be used for power generation corresponding to sold
electric energy in the case of the project executed ] —[Quantity of fossil fuel used for the case of the project executed]
— 3—10—

In the case of IPP, where [Quantity of fossil fuel used for the case of the project executed] is 0 (zero), because backup supply from the existing Diesel generators is not necessary.As to the period during which energy substitution effect is produced, it has
been regarded as twenty years from 2006 fiscal year when the newly set up equipment will start up operation, on the assumption that the nominal service life of the newly-set-up equipment is twenty years.
3.1.3.2 Practical Volume and Accumulated Volume of Energy Substitution Effect:
Referring to Table 3.1.3.2-1 below, it will be understandable that for the FBB and stoker, the electric power used in the plant is variable. As a result, the applicable energy substitution effect also varies accordingly.
(l) In case of Industry-owned Power Plant with fluidized bed boiler (FBB):In case of the FBB unit, the electric power consumption of a forced draft fan
increases. On the contrary, the power consumption of the EFB pretreatment system decreases.Therefore, as a whole, the in-plant power consumption will decrease in
proportion to that of the stoker boiler unit.On this occasion, the energy substitution effect is as shown in Table 3.1.3.2-1
below:
Table 3.1.3.2-1 Energy substitution effect (In case of Industry-ownedPower Plant with FBB)
Energy (in aut) consumption " " --------—Start Year
2001 2002 2003 2004 2005
Yearly Reduced energy consumption (DO) kl(DQ)/y 0 0 0 0 0
Quantity reduced to crude oil basis ktoe/v 0.00 0.00 0.00 0.00 0.00
Total Reduced energy consumption (DO) kl(DO) 0 0 0 0 0
Quantity reduced to crude oil basis k toe 0.00 0.00 0.00 0.00 0.00
Energy (input) consumption ----------------------------Commissic
2006
ning
2007 2008 2009 2010
Yearly Reduced energy consumption (DO) kl(DO)/y 21.466 21.466 21,466 21.466 21.466
Quantity reduced to crude oil basis k toe/y 18.79 18.79 18.79 18.79 18.79
Total Reduced energy consumption (DO) kl(DO) 21.466 42.932 64.398 85.864 107.330
Quantity reduced to crude oil basis k toe 18.79 37.59 56.38 75.17 93.97
Energy (input) consumption --------- ------------------ 2011 2012 2013 2014 2015
Yearly Reduced energy consumption (DO) kl(DO)/v 21.466 21.466 21.466 21.466 21.466
Quantity reduced to crude oil basis k toe/y 18.79 18.79 18.79 18.79 18.79
Total Reduced energy consumption (DO) kl(DO) 128,796 150.262 171,728 193.194 214,660
Quantity reduced to crude oil basis k toe 112.76 131.55 150.35 169.14 187.93
Energy (input) consumption --------------- 2016 2017 2018 2019 2020
Yearly Reduced energy consumption (DO) kl(DO)/v 21.466 21.466 21.466 21.466 21.466
Quantity reduced to crude oil basis k toe/y 18.79 18.79 18.79 18.79 18.79
Total Reduced energy consumption (DO) kl(DO) 236.126 257.592 279.058 300.524 321,990
Quantity reduced to crude oil basis k toe 206.73 225.52 244.32 263.1 1 281.90
Energy (input) consumption " ---------------------- ---- 2021 2022 2023 2024
Year End
2025
Yearly Reduced energy consumption (DO) kl(DO)/y 21.466 21.466 21.466 21.466 21.466
Quantity reduced to crude oil basis k toe/y 18.79 18.79 18.79 18.79 18.79
Total Reduced energy consumption (DO) kl(DO) 343.456 364.922 386.388 407.854 429.320
Quantity reduced to crude oil basis k toe 300.70 319.49 338.28 357.08 375.87
— 3 —11 —
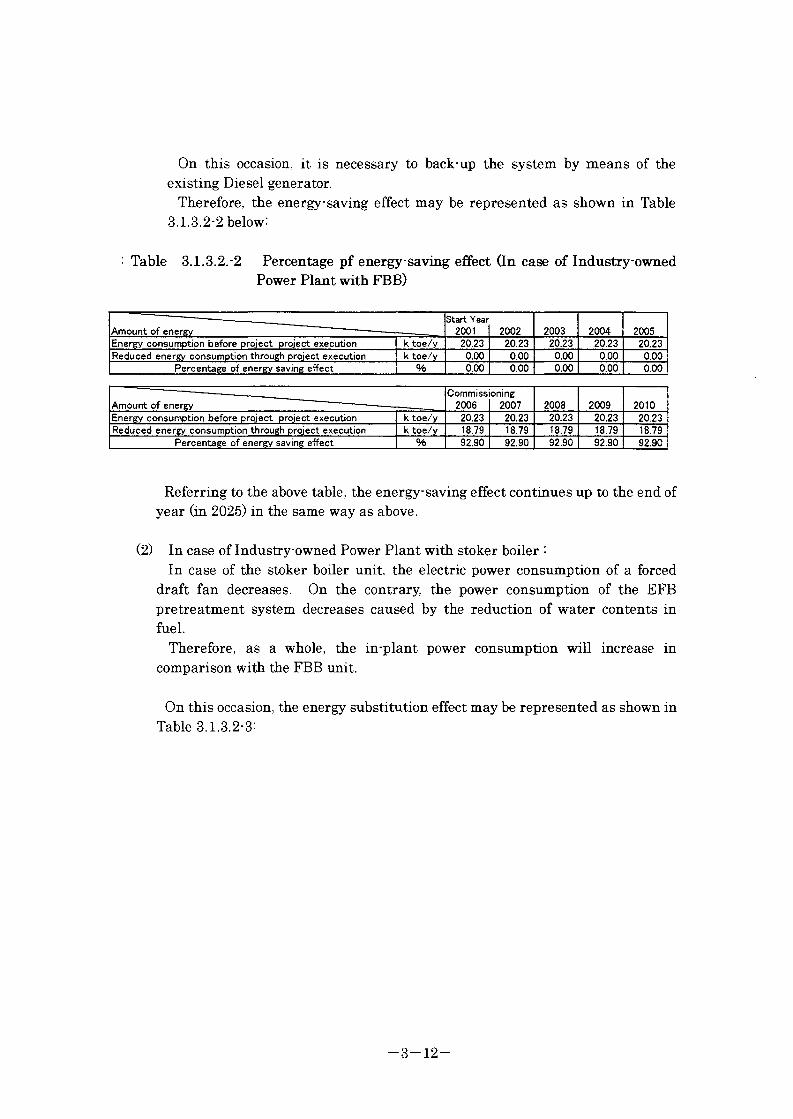
On this occasion, it is necessary to back-up the system by means of the existing Diesel generator.
Therefore, the energy saving effect may be represented as shown in Table3.1.3.2-2 below:
: Table 3.1.3.2.-2 Percentage pf energy-saving effect (In case of Industry-ownedPower Plant with FBB)
Amount of energy ~ -------------- -----Start Year
2001 2002 2003 2004 2005
Energy consumption before project project execution ktoe/y 20.23 20.23 20.23 20.23 20.23
Reduced energy consumption through project execution ktoe/y 0.00 0.00 0.00 0.00 0.00
Percentage of energy saving effect % 0.00 0.00 0.00 0.00 0.00
Amount of energy ------------------
Commiss
2006
oning
2007 2008 2009 2010
Energy consumption before project project execution k toe/y 20.23 20.23 20.23 20.23 20.23
Reduced energy consumption through project execution k toe/y 18.79 18.79 18.79 18.79 18.79
Percentage of energy saving effect % 92.90 92.90 92.90 92.90 92.90
Referring to the above table, the energy-saving effect continues up to the end of year (in 2025) in the same way as above.
(2) In case of Industry-owned Power Plant with stoker boiler :In case of the stoker boiler unit, the electric power consumption of a forced
draft fan decreases. On the contrary, the power consumption of the EFB pretreatment system decreases caused by the reduction of water contents in fuel.
Therefore, as a whole, the in-plant power consumption will increase in comparison with the FBB unit.
On this occasion, the energy substitution effect may be represented as shown in Table 3.1.3.2-3:
— 3—12—

Table 3.1.3.2 3 Energy substitution effect (In case of Industry-owned Power Plant with stoker boiler)
Energy (in aut) consumption ------------------------
Start Year
2001 2002 2003 2004 2005
Yearly Reduced energy consumption (DO) ki(DO)/y 0 0 0 0 0
Quantity reduced to crude oil basis ktoe/y 0.00 0.00 0.00 0.00 0.00
Total Reduced energy consumption (DO) kl(DO) 0 0 0 0 0
Quantity reduced to crude oil basis k toe 0.00 0.00 0.00 0.00 0.00
Energy (input) consumption '
Commissic
2006
ning
2007 2008 2009 2010
Yearly Reduced energy consumption (DO) kl(DO)/y 20,740 20,740 20,740 20,740 20,740
Quantity reduced to crude oil basis k toe/y 18.16 18.16 18.16 18.16 18.16
Total Reduced energy consumption (DO) kl(DO) 20.740 41,480 62.220 82,960 103,700
Quantity reduced to crude oil basis k toe 18.16 36.32 54.47 72.63 90.79
Energy (iniaut) consumption “ ' ----------- 2011 2012 2013 2014 2015
Yearly Reduced energy consumption (DO) kl(DO)/y 20,740 20,740 20.740 20,740 20,740
Quantity reduced to crude oil basis k toe/y 18.16 18.16 18.16 18.16 18.16
Total Reduced energy consumption (DO) kl(DO) 124,440 145,180 165,920 186,660 207,400
Quantity reduced to crude oil basis k toe 108.95 127.10 145.26 163.42 181.58
Energy (iniaut) consumption " ------------- ----------- .----- 2016 2017 2018 2019 2020
Yearly Reduced energy consumption (DO) kl(DO)/y 20,740 20,740 20,740 20,740 20,740
Quantity reduced to crude oil basis k toe/y 18.16 18.16 18.16 18.16 18.16
Total Reduced energy consumption (DO) kl(DO) 228.140 248,880 269,620 290,360 311,100
Quantity reduced to crude oil basis k toe 199.74 217.89 236.05 254.21 272.37
Energy (input) consumption ---------- ---------------- 2021 2022 2023 2024
Year End
2025
Yearly Reduced energy consumption (DO) kl(DO)/y 20,740 20,740 20,740 20,740 20,740
Quantity reduced to crude oil basis k toe/y 18.16 18.16 18.16 18.16 18.16
Total Reduced energy consumption (DO) kl(DO) 331,840 352.580 373,320 394,060 414,800
Quantity reduced to crude oil basis k toe 290.53 308.68 326.84 345.00 363.16
On this occasion, it is necessary to back-up the system by means of the existing Diesel generator.
Therefore, the energy-saving effect may be represented as shown in Table3.1.3.2-4 below:
: Table 3.1.3.2-4 Percentage of energy-saving effect (In case of Industry-owned Power Plant stoker)
Amount of energy ■—
Start Year
2001 2002 2003 2004 2005
Energy consumption before project project execution k toe/y 20.23 20.23 20.23 20.23 20.23
Reduced energy consumption through project execution k toe/y 0.00 0.00 0.00 0.00 0.00
Percentage of energy saving effect % 0.00 0.00 0.00 0.00 0.00
Amount of energy ----------------------------
Commiss
2006
oning
2007 2008 2009 2010
Energy consumption before project project execution ktoe/y 20.23 20.23 20.23 20.23 20.23
Reduced energy consumption through project execution k toe/y 18.16 18.16 18.16 18.16 18.16
Percentage of energy saving effect % 89.76 89.76 89.76 89.76 89.76
Referring to the above table, the energy-saving effect continues up to the end of year (in 2025) in the same way as above.
— 3—13—

(3) In case of IPP fluidized bed boiler (FBB): (for reference)In case of the FBB unit, the electric power consumption of a forced draft fan
increases as the same as the Industry owned Power Plant. On the contrary, the power consumption of the EFB pretreatment system decreases.
Therefore, as a whole, the in-plant power consumption will decrease in proportion to that of the stoker boiler unit.
In other words, the sold power amount increases in comparison with the stoker boiler unit output under the condition that the applicable output is the same.
This means that the fuel amount corresponding with the power generated amount of an electric power company who purchases power decreases proportionally.
On this occasion, the energy substitution effect is as shown in Table 3.1.3.2-5 below:
Energy (iniDut) consumption ——----------- -
Start Year
2001 2002 2003 2004 2005
Yearly Reduced energy consumption (DO) kl(DO)/y 0 0 0 0 0
Quantity reduced to crude oil basis ktoe/y 0.00 0.00 0.00 0.00 0.00
Total Reduced energy consumption (DO) kl(DO) 0 0 0 0 0
Quantity reduced to crude oil basis k toe 0.00 0.00 0.00 0.00 0.00
Energy (inijut) consumption ----------—.—
Commissic
2006
ning
2007 2008 2009 2010
Yearly Reduced energy consumption (DO) kl(DO)/y 39.668 39,668 39,668 39,668 39,668
Quantity reduced to crude oil basis k toe/y 34.73 34.73 34.73 34.73 34.73
Total Reduced energy consumption (DO) kl(DO) 39,668 79,336 119,004 158,672 198,340
Quantity reduced to crude oil basis k toe 34.73 69.46 104.19 138.92 173.65
Energy (in;Dut) consumption ----------------------- 2011 2012 2013 2014 2015
Yearly Reduced energy consumption (DO) kl(DO)/y 39,668 39,668 39,668 39,668 39,668
Quantity reduced to crude oil basis k toe/y 34.73 34.73 34.73 34.73 34.73
Total Reduced energy consumption (DO) kl(DO) 238,008 277,676 317,344 357,012 396,680
Quantity reduced to crude oil basis k toe 208.38 243.11 277.83 312.56 347.29
Energy (iniDut) consumption " —--------------- ------ 2016 2017 2018 2019 2020
Yearly Reduced energy consumption (DO) kl(DO)/y 39,668 39,668 39,668 39,668 39,668
Quantity reduced to crude oil basis k toe/y 34.73 34.73 34.73 34.73 34.73
Total Reduced energy consumption (DO) kl(DO) 436,348 476,016 515,684 555,352 595,020
Quantity reduced to crude oil basis k toe 382.02 416.75 451.48 486.21 520.94
Energy (in;aut) consumption 2021 2022 2023 2024
Year End
2025
Yearly Reduced energy consumption (DO) kl(DO)/y 39,668 39,668 39,668 39,668 39,668
Quantity reduced to crude oil basis k toe/y 34.73 34.73 34.73 34.73 34.73
Total Reduced energy consumption (DO) kl(DO) 634,688 674,356 714.024 753,692 793,360
Quantity reduced to crude oil basis k toe 555.67 590.40 625.13 659.86 694.59
Table 3.1.3.2-5 Energy substitution effect (In case of IPP FBB)On this occasion, it is unnecessary to back up the system by means of the existing Diesel generator.Therefore, the energy-saving effect may be represented as shown in Table 3.1.3.2.6:
3-14-

Table 3.1.3.2-6 Percentage of energy-saving effect (In case of 1PP FBB)
Amount of energy " " -Start Year
2001 2002 2003 2004 2005
Energy consumption before project project execution k toe/y 34.73 34.73 34.73 34.73 34.73
Reduced energy consumption through project execution k toe/y 0.00 0.00 0.00 0.00 0.00
Percentage of energy saving effect % 0.00 0.00 0.00 0.00 0.00
Amount of energy
Commiss
2006
oning
2007 2008 2009 2010
Energy consumption before project project execution k toe/y 34.73 34.73 34.73 34.73 34.73
Reduced energy consumption through project execution k toe/y 34.73 34.73 34.73 34.73 34.73
Percentage of energy saving effect % 100.00 100.00 100.00 100.00 100.00
Referring to the above table, the energy-saving effect continues up to the end of year (in 2025) in the same way as above.
(4) In case of IPP Stoker boiler : (for reference)In case of the stoker boiler unit, the electric power consumption of a forced
draft fan decreases. Because the water content in fuel decreases, the power consumption of the EFB p re treatment system increases.
Therefore, as a whole, the in-plant power consumption will increase in comparison with the FBB unit.
In other words, the sold power amount decreases in comparison with the FBB unit output under the condition that the applicable output is the same.
This means that the fuel amount corresponding with the power generated amount of an electric power company who purchases power decreases proportionally.
On this occasion, the energy substitution effect may be represented as shown in Table 3.1.3.2-7:
— 3—15—

Table 3.1.3.2-7 Energy substitution effect (In case of IPP stoker boiler)
Energy (in 3ut) consumption " -------------------------
Start Year
2001 2002 2003 2004 2005
Yearly Reduced energy consumption (DO) kl(DO)/y 0 0 0 0 0
Quantity reduced to crude oil basis ktoe/y 0.00 0.00 0.00 0.00 0.00
Total Reduced energy consumption (DO) kl(DO) 0 0 0 0 0
Quantity reduced to crude oil basis k toe 0.00 0.00 0.00 0.00 0.00
Energy (ini3ut) consumption ' ------------ —
Commissic
2006
ning
2007 2008 2009 2010
Yearly Reduced energy consumption (DO) kl(DO)/y 37,826 37,826 37.826 37,826 37.826
Quantity reduced to crude oil basis k toe/y 33.12 33.12 33.12 33.12 33.12
Total Reduced energy consumption (DO) kl(DO) 37.826 75,652 113,478 151.304 189,130
Quantity reduced to crude oil basis k toe 33.12 66.23 99.35 132.47 165.58
Energy (ini3ut) consumption --------------- ------ 2011 2012 2013 2014 2015
Yearly Reduced energy consumption (DO) kl(DO)/y 37,826 37.826 37.826 37.826 37,826
Quantity reduced to crude oil basis k toe/y 33.12 33.12 33.12 33.12 33.12
Total Reduced energy consumption (DO) kl(DO) 226.956 264.782 302.608 340.434 378.260
Quantity reduced to crude oil basis k toe 198.70 231.82 264.93 298.05 331.17
Energy (in;Dtit) consumption ----------------------- 2016 2017 2018 2013 2020
Yearly Reduced energy consumption (DO) kl(DO)/y 37,826 37,826 37,826 37,826 37,826
Quantity reduced to crude oil basis k toe/y 33.12 33.12 33.12 33.12 33.12
Total Reduced energy consumption (DO) kl(DO) 416,086 453,912 491,738 529,564 567.390
Quantity reduced to crude oil basis k toe 364.28 397.40 430.52 463.63 496.75
Energy (in Dut) consumption ---------- ----- 2021 2022 2023 2024
Year End
2025
Yearly Reduced energy consumption (DO) kl(DO)/y 37,826 37,826 37,826 37,826 37,826
Quantity reduced to crude oil basis k toe/y 33.12 33.12 33.12 33.12 33.12
Total Reduced energy consumption (DO) kl(DO) 605,216 643,042 680,868 718.694 756,520
Quantity reduced to crude oil basis k toe 529.87 562.98 596.10 629.22 662.33
On this occasion, it is unnecessary to back-up the system by means of the existing Diesel generator.
Therefore, the energy saving effect may be represented as shown in Table3.1.3.2 6 below:
: Table 3.1.3.2-8 Percentage of energy-saving effect (In case of IPP stoker boiler)
Amount of energy ~ —-------------Start Year
2001 2002 2003 2004 2005
Energy consumption before project project execution k toe/y 33.12 33.12 33.12 33.12 33.12
Reduced energy consumption through project execution k toe/y 0.00 0.00 0.00 0.00 0.00
Percentage of energy saving effect % 0.00 0.00 0.00 0.00 0.00
Amount of energy ------------ —
Commiss
2006
oning
2007 2008 2009 2010
Energy consumption before project project execution k toe/y 33.12 33.12 33.12 33.12 33.12
Reduced energy consumption through project execution k toe/y 33.12 33.12 33.12 33.12 33.12
Percentage of energy saving effect % 100.00 100.00 100.00 100.00 100.00
Referring to the above table, the energy-saving effect continues up to the end of year (in 2025) in the same way as above.
— 3—16—

3.1.4 Practical Confirmation Method of Energy Substitution Effect
It will be necessary to determine the agent at site who measures and manages the required data in the field beforehand.
The exercising body who supervises the field monitoring will become a energy controlling department in the company., because FELD A Company would establish a separate company who will manage the newly established electric power station.
Items, which require to measure, are as follows:
1) Power transmission amount2) Steam supply amount3) Fossil fuel consumption rate4) EFB usage rate5) Sold power
The electric energy should be equipped with an electric power meter so as to measure the electric energy.
The Fossil fuel consumption rate should be equipped with the existing flow meter, which will back-up the existing Diesel generator.
The EFB usage rate should be measured by a truck scale.Steam supply amount should be measured with the calculated values.Moreover, in the base line, the fossil fuel consumption rate is variable
depending upon the planned commissioning load.
Therefore, it is prerequisite to make monitoring the fossil fuel consumption rate at the available facility under the loading condition which is approximate to the planned commissioning condition at leas for several years until the new facility will be installed.
-3-17-

3.2 Green House Gases Reduction Effect
3.2.1 Technological Grounds for Producing the Green House Gases Reduction Effect
Technological grounds for producing the Green House Gases reduction effect are similar to the grounds shown in 3.1.1.
By using as fuel the EFB having been dumped, Green House Gases discharge decreases because the quantity of fossil fuel consumed can be curtailed and in addition because methane gas generated from dumped EFB can be reduced.
3.2.2 Base Line Forming the Basis for Computation of Green House Gases Reduction Effect (Concepts for Estimating the Discharge when the Project is not Executed)
3.2.2.1 Concepts on Base Line Setting
The Green House Gasses which can be reduced by execution of this project, are the methane gas generated from the EFB being dumped in the side (enterprise) intended for execution of this project and the carbon dioxide discharged from the fossil fuel being used as fuel for the existing Diesel generators and boiler in SAHABAT COMPLEX which has the palm oil refineries intended for incorporation in the project.
Therefore the base line corresponds to the sum of the following two quantities in the case where this project is not executed, namely, the quantity reduced to carbon dioxide basis, of the methane gas to be discharged from the fossil fuel being used for Diesel generators and boiler.
However in the case of IPP (for Reference), the quantity of carbon dioxide discharged from the fossil fuel being used for power generation on the electric power company side, must also be taken into account, because electric energy to be generated by the power company standing on the electric energy buyer side is reduced.
In this connection, service conditions are set in accordance with the planned service conditions shown in 3.1 headlined “Energy Substitution Effect”.
And since electric energy consumed in the plant differs greatly between the FBB and the stoker boiler and in addition the quantity of FFB used fuel differs between the two, computation is to be made on the four cases, namely, the FBB unit and the stoker boiler unit for Industry-owned Power Plant, and the FBB unit and the stoker boiler unit for IPP (for Reference).
— 3 —18 —

3.2.2.2 Computation on Base Line
Carbon dioxide discharge on the base line has been computed by means of the following expression.In this connection, all conditions have been set in accordance with the planned
service conditions.
[Carbon dioxide discharge on the base line] =[Carbon dioxide discharge coming out from the quantity of fossil fuel used in the existing
equipment]+ [Discharge reduced to carbon dioxide basis, of methane gas generated from EFB consumed] + [Carbon dioxide discharge coming out from the quantity of fossil fuel used for power
generation corresponding to sold electric energy]
Computing procedure for Green House Gases discharge has been arranged in accordance with Annexed Sheet 1 of the Proposal depending on appealing public contribution of “Basic Survey for Promotion of Joint Implementation, etc.” in the 2000 fiscal year
* The determination of annual CH4 emissions from EFB consumption can be
* calculated from equation 1 of IPCC Guidelines
*
(MSWTXMSWFXMCFXDOCXDOCFXFX16/12-R) x (1-OX)
MSWT : Total MSW generated (= EFB consumption t/y)
MSWF : fraction of MSW disposed to solid waste disposal sites 1 (all)
MCF : methane correction factor 0.6 (default value)
DOC : degradable organic carbon 0.16446
DOCF : fraction of DOC dissimilated 0.77
F : fraction of CH4 in landfill gas0.5
R : recovered CH4 0
OX : oxidation factor 0
(carbon content in EFB)
(IPCC guideline)
(default value)
(not recovered)
(default value)
— 3 —19 —

The original data for computation are shown in Table 3.2.2.2-1 below:
Table 3.2.2.2-1 Data for Computation of Green House Gases Discharge
Unit Industry-owned PP IPP (Reference)
Type of Boiler - FBB Stoker FBB Stoker
Quantity of Fuel Used inExisting Equipment
kl/year 23,107 23,107 23,107 23,107
Quantity Reduced to Crude OilBasis of the Same
k toe/year 20.23 20.23 20.23 20.23
Quantity of EFB Treated t/year 215,952 204,652 446,783 419,286Sold Electric Energy MWh/year 0 0 59,145 52,568Quantity of Fuel Used Corresponding to Sold Electric Energy
kl/year 0 0 16,561 14,719
Quantity Reduced to Crude OilBasis of the Same
k toe/year 15.32 12.89
Total of Fossil Fuel QuantitiesReduced to Crude Oil Basis
k toe/year 20.23 20.23 34.73 33.12
Under the conditions, CO* discharge for the baseline is shown in Table 3.2.2.22 below:
Table 3.2.2.2-2 CO* Discharge
Unit Industry-owned PP IPP (Reference)
Type of Boiler - FBB Stoker FBB Stoker
CO- t* CO'/year 62,596 62,596 107,462 102,480CH- t' CO-/year 229,719 217,686 475,251 445,998
Total t" CO-/year 292,315 280,282 582,713 548,478
3.2.3 Practical Volume, Producing Period and Accumulated Volume of Green House Gases Reduction Effect (Effect when the Project has been executed)
3.2.3.1 Concepts on Setting the Case of the Project Executed
Since the newly-set up power generating equipment uses as biomass fuel, the EFB which is not used but dumped now and generates methane gas, it controls the generation of methane gas and the fossil fuel being used in the existing Diesel generators and boiler becomes useless or is curtailed, and thus carbon dioxide discharge originating from those existing equipment is also reduced.
-3-20-

Accordingly, the curtailed quantity of Green House Gases discharge in the case where this project has been executed, is the sum of the quantity reduced to carbon dioxide basis of the methane gas discharge from dumped EFB (corresponding to the quantity of EFB used in the newly-set-up power generating equipment) and the quantity of carbon dioxide to be discharged from the curtailed quantity of fossil fuel being used for the existing Diesel generators and boiler.
In this connection, IPCC Guideline 6.5.2 provides-“In the case where the greater part of an accumulation of waste to be
incinerated originates from biomass material, carbon dioxide discharge from such an accumulation shall not be considered as carbon dioxide produced by man.”
Therefore the carbon dioxide discharge coming out from the EFB used as fuel in the newly set up equipment, is not taken into account as discharge.
Under these conditions and on the assumption that the above-mentioned planned service conditions at the site intended for execution of this project is not, the reduction of carbon dioxide discharge, which is based on the following concepts, is regarded as Green House Gases reduction effect.
Thus the expression for computing the Green House Gases reduction effect is as follows:
[Volume of Green House Gases reduction effect] =[Carbon dioxide discharge coming out from the quantity of fossil fuel used in the existing
equipment]- [Carbon dioxide discharge coming out from the quantity of fossil fuel used in the newly set up
equipment]+ [Discharge reduced to carbon dioxide basis, of methane gas generated from EFB consumed]+ [Carbon dioxide discharge coming out from the quantity of fossil fuel to be used for power
generation corresponding to sold electric energy]
As to the period during which Green House Gases reduction effect is produced, the same as the case of energy substitution effect, it has been regarded as twenty years from 2006 when the newly set up equipment will start up operation, on the assumption that the nominal service life of the newly-set up equipment is twenty years.
— 3—21 —

3.2.3.2 Practical Volume and Accumulated Volume of Green House Gases ReductionEffect
(l) In the case of the fluidized bed boiler (FBB) for Industry-owned Power Plant:
In the case of the fluidized bed boiler unit, needful power in the plant is, as a whole, less than for the stoker boiler unit, because power for the EFB pretreatment system is less than in the case of the stoker boiler, whereas power for the forced draft fan is greater.
Consequently, the quantity of fossil fuel used corresponding to backup electric energy supplied by the existing Diesel generator is less, at high loads, than in the case of the stoker boiler unit, and thus the volume of Green House Gases reduction effect increases.
-3-22-

Table 3.2.3.2-1 Green House Gases Reduction Effect(In the Case of FBB for Private Generator)
Green House Gn*rr- redii7TlTTTmfTimint
Start Year
2001 2002 2003 2004 2005
Yearly C02 t-C02/y 0 0 0 0 0
ch4 t-C02/y 0 0 0 0 0
Total t-C02/y 0 0 0 0 0
T otal o o t-co2 0 0 0 0 0
ch4 t-co2 0 0 0 0 0
Total t-co2 0 0 0 0 0
Green House Gnrrr rf»dnrTtTTrrmnniint
Commission
2006
ing
2007 2008 2009 2010
Yearly C02 t~C02/y 58,140 58,140 58,140 58,140 58,140
ch4 t-C02/y 229,719 229,719 229,719 229,719 229,719
Total t~C02/y 287,859 287,859 287,859 287,859 287,859
T otal O O t-co2 58,140 116,280 174,420 232,560 290,700
ch4 t-co2 229,/ i 9 459,438 689,157 918,876 1,148,595
Total t-co2 287,859 575,718 863,577 1,151,436 1,439,295
Green House ("iases rt»Hnrrrmr-»«mjint 2011 2012 2013 2014 2015
Yearly C02 t-C02/y 58,140 58,140 58,140 58,140 58,140
CH4 t-C02/y 229,719 229,719 229,719 229,719 229,719
Total t-C02/y 287,859 287,859 287,859 287,859 287,859
T otal C02 t-co2 348,840 406,980 465,120 523,260 581,400
ch4 t-co2 1,378,314 1,608,033 1,837,752 2,067,471 2,297,190
Total t-co2 1,727,154 2,015,013 2,302,872 2,590,731 2,878,590
Green House 2016 2017 2018 2019 2020
Yearly
OO
t-C02/y 58,140 58,140 58,140 58,140 58,140
ch4 t-C02/y 229,719 229,719 229,719 229,719 229,719
Total t-C02/y 287,859 287,859 287,859 287,859 287,859
Total C02 t-co2 639,540 697,680 755,820 813,960 872,100
ch4 t-co2 2,526,909 2,756,628 2,986,347 3,216,066 3,445,785
Total t-co2 3,166,449 3,454,308 3,742,167 4,030,026 4,317,885
Green House GasesrecfijcTtTJTr-e«wiimt 2021 2022 2023 2024
year End
2025
Yearly O o t-C02/y 58,140 58,140 58,140 58,140 58,140
ch4 t-C02/y 229,719 229,719 229,719 229,719 229,719
Total t~C02/y 287,859 287,859 287,859 287,859 287,859
T otal
OO t-co2 930,240 988,380 1,046,520 1,104,660 1,162,800Io t-co2 3,675,504 3,905,223 4,134,942 4,364,661 4,594,380
Total t-co2 4,605,744 4,893,603 5,181,462 5,469,321 5,757,180
3-23-
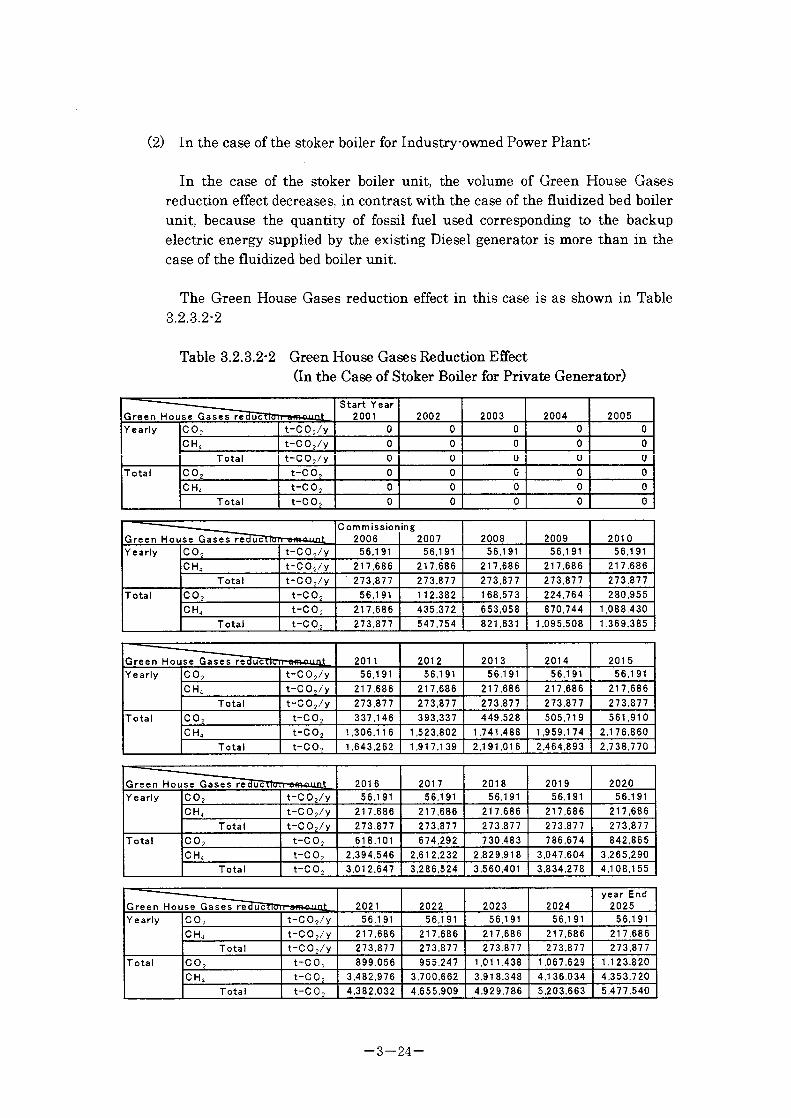
(2) In the case of the stoker boiler for Industry-owned Power Plant-
In the case of the stoker boiler unit, the volume of Green House Gases reduction effect decreases, in contrast with the case of the fluidized bed boiler unit, because the quantity of fossil fuel used corresponding to the backup electric energy supplied by the existing Diesel generator is more than in the case of the fluidized bed boiler unit.
The Green House Gases reduction effect in this case is as shown in Table3.23.2-2
Table 3.2.3.2-2 Green House Gases Reduction Effect(In the Case of Stoker Boiler for Private Generator)
Green House Gases reduction wnnniiitStart Year
2001 2002 2003 2004 2005
Yearly CO, t-CO,/y 0 0 0 0 0
ch4 t-CO,/y 0 0 0 0 0
T otal t~CO,/y 0 0 0 0 0
T otal CO, t-CO, 0 0 0 0 0
ch4 t-CO, 0 0 0 0 0
T otal t-co. 0 0 0 0 0
Green House Gases reduction nmnnntCommission
2006
ing
2007 2008 2009 2010
Yearly CO, t-CO,/y 56,191 56,191 56,191 56,191 56,191
CH. t-CO,/y 217,686 217,686 217,686 217,686 217,686
T otal t-CO,/y 273,877 273,877 273,877 273,877 273.877
Total CO, t-CO, 56,191 112,382 1 68,573 224,764 280,955
ch4 t-co. 217,686 435,372 653,058 870,744 1,088,430
T otal t-co,, 273,877 547,754 821,631 1,095,508 1,369,385
Green House Gases reduollon minuiiit 201 1 2012 2013 2014 2015
Yearly C02 t-C02/y 56,191 56,191 56,191 56,191 56,191
ch4 t~C02/y 217,686 217,686 217,686 217,686 217,686
T otal t-C02/y 273,877 273,877 273,877 273,877 273,877
T otal C02 t-CO 2 337,146 393,337 449,528 505,71 9 561,910
ch4 t-co2 1,306,1 16 1,523,802 1,741,488 1,959,174 2,1 76,860
T otal t-co2 1,643,262 1,917,139 2,191,016 2,464,893 2,738,770
Green House Gases leduitlun nnmiint 2016 2017 2018 2019 2020
Yearly C02 t~C02/y 56,191 56,191 56,191 56,191 56,191
ch4 t~C02/y 217,686 217,686 217,686 217,686 217,686
T otal t-C02/y 273,877 273,877 273,877 273,877 273,877
T otal C02 t-co2 618,101 674,292 730,483 786,674 842,865
ch4 t-co2 2,394,546 2,612,232 2,829,918 3,047,604 3,265,290
T otal t-co2 3,012,647 3,286,524 3,560,401 3,834,278 4,108,155
Creen House fta sesr e (I in: I lil n mm mint 2021 2022 2023 2024
year End
2025
Yearly C02 t-C02/y 56,191 56,191 56,191 56,191 56,191
ch4 t-C02/y 217,686 217,686 217,686 217,686 217,686
T otal t~C02/y 273,877 273,877 273,877 273,877 273,877
T otal CO; t-co2 899,056 955,247 1,011,438 1,067,629 1,123,820
ch4 t-C02 3,482,976 3,700,662 3,918,348 4,136,034 4,353,720
T otal t-co2 4,382,032 4,655,909 4,929,786 5,203,663 5,477,540
-3-24-

(3) In the case of the fluidized bed boiler (FBB):In the case of the FBB unit, needful power in the plant is, as a whole, less
than in the case of the stoker boiler unit, because, similarly to the case of Industry-owned Power Plant, power for the FFB pretreatment system decreases, whereas power for the forced draft increases.
Therefore, with the same output of power, more electric energy is sold than in the case of the stoker boiler unit.
As the result, the volume of Green House Gases reduction effect increases, because the reduction of fuel quantity corresponding to the electric energy generated in the electric power company standing on the side of the electric energy buyer increases.
Green House Gases reduction effect in this case is as shown in Table 3.2.3.23.
Table 3.2.3.2-3 Green House Gases Reduction Effect(In the Case of FBB for IPP (Reference))
Green House Gases reduc'llnn win mint
Start Year
2001 2002 2003 2004 2005
Yearly CO; 0 0 0 0 0
C h4 t-C 0 2/y 0 0 0 0 0
T ota 1 t-C 0 2/y 0 0 0 0 0
Total C 0 2 t-C 0 2 0 0 0 0 0
C h4 t-C 0 2 0 0 0 0 0
Total t-C 0 2 0 0 0 0 0
Green House G i i i i il n i 1 In 11 u in n n n 1
Commission
2006
ing
2007 2008 2009 2010
Yearly C O j 1 07.462 1 07,462 1 07,462 1 07,462 1 07,462
C h4 t-C 0 ;/y 475,25 1 475,25 1 475.25 1 475,2 5 1 475,25 1
Tota 1 582.7 1 3 582,71 3 582,7 1 3 582,7 1 3 582,71 3
Total C O 2 t-C 0 j 1 07,462 21 4,924 322,386 429,848 5 3 7,3 1 0
C h4 t-C O 2 475,25 1 950,502 1 ,425,753 1 ,9 0 1 ,004 2,3 76,255
Total t-C O 2 582,7 1 3 1 ,1 65,426 1 ,748,1 39 2,330,8 52 2,9 1 3,565
Green House Case s reduullun um mint 2011 201 2 2013 2014 201 5
Yearly C O 2 t-C 0 2/y 1 0 7.4 6 2 1 07,462 I 07,462 1 0 7,4 6 2 1 07,462
C h4 t-C 0 2/y 4 7 5,2 5 1 475,25 1 475,25 1 475,2 5 1 4 7 5,2 5 1
Total 582,7 1 3 582,7 1 3 582,7 1 3 582,7 1 3 582,7 1 3
Total C O 2 t-C O 2 644,772 752,234 859,696 967,158 1 ,074,620
C H„ t-C O 2 2,8 5 1,506 3.326,757 3,802,008 4,2 7 7,2 59 4,752,51 0
Total t-C O 2 3,4 9 6,2 7 8 4,078,991 4,6 6 1 ,704 5,244,4 1 7 5,82 7,1 30
Green House Gases reducTIlin wiiiuiint 2016 2017 2018 2019 2020
Yearly C O 2 t-C 0 2/y 1 07,462 1 07,462 1 07,462 1 07,462 1 07,46 2
c h4 4 7 5,251 4 7 5,25 1 4 7 5,2 5 1 475,25 1 475,25 1
T ota 1 t-C 0 2/y 582,7 1 3 582,7 1 3 582,7 1 3 582,7 1 3 582,7 1 3
Total C 0 2 t-C O 2 1 ,1 82.082 1 ,289,544 1 ,39 7,006 1 ,504.468 1 ,6 1 1 ,9 3 0
C h4 t-C O 2 5,227,76 1 5,703,012 6,1 78,263 6,653,5 1 4 7,1 28,765
Total t-C 0 2 6,409,843 6,992,556 7,575,269 8.1 5 7,9 82 8,740,695
Green House Gases reducllun urn mint 202 1 2022 2023 2024
year End
2025
Yearly C 0 2 t-CO 2/y 1 07,462 1 07.462 1 07,462 1 0 7,4 6 2 1 07,462
c h4 t-C 0 2/y 475,25 1 4 7 5,2 5 1 475,25 1 475,25 1 475,25 1
Total t-C 0 2/y 582,7 1 3 582,7 1 3 582,7 1 3 582,7 1 3 582,7 1 3
Total o o t-C 0 2 1 ,7 1 9,392 1 ,826,854 1 ,934,3 1 6 2,04 1,7 78 2,1 49,240
C h4 t-C O 2 7,604,0 1 6 8,079,267 8.554,5 1 8 9,029,7 69 9,505,020
Total t-C 0 2 9,323,408 9,906,1 2 1 1 0,488,834 1 1,07 1,547 1 1 ,654,260
-3-25-

(4) In the case of the stoker boiler for IPP (Reference):
In the case of the stoker boiler unit, in contrast with the case of the fluidized bed boiler unit, the volume of sold electric energy is less than in the case of the fluidized bed boiler unit, with the same output of power. As the result, the volume of Green House Gases reduction effect decreases than in the case of the fluidized bed boiler unit, because the reduction of fuel quantity corresponding to the electric energy generated in the electric power company standing on the side of the electric energy buyer decreases.
Green House Gases reduction effect in this case is shown in Table 3.2.3.2-4.
Table 3.2.3.2-4 Green House Gases Reduction Effect(In the Case of Stoker Boiler for IPP (Reference))
Green House Gases redur.Hfln ...............itStart Year
2001 2002 2003 2004 2005
Yearly CO, t-C 0 2/v 0 0 0 0 0
OH, t-C 0 2/y 0 0 0 0 0
Total t-C 0 2/y 0 0 0 0 0
T otal co? t-co2 0 0 0 0 0
OH, t-CO, 0 0 0 0 0
Total t-co2 0 0 0 0 0
Green House Gases reduction mm mintComm ission
2006
ing
2007 2008 2009 2010
Yearly CO, t-C O 2/y 102,480 102,480 102,480 1 02,480 102,480
CH„ t~C O 2/y 445,998 445,998 445,998 445,998 445,998
Total t-CO,/y 548,478 548,478 548,478 548,478 548,478
T otal CO,
Oo
102,480 204,960 307,440 409,920 512,400
ch4
o01 445,998 891,996 1.337,994 1,783,992 2,229,990
T otal t-C02 548,478 1,096,956 1,645,434 2,193,912 2,742,390
Green House Gases reduction T-wm nunt 2011 2012 2013 2014 2015
Yearly CO, t-C O ,/y 102,480 102,480 102,480 102,480 102,480
CH, t-C O ,/y 445,998 445,998 445,998 445,998 445,998
T otal t-CO,/y 548,478 548,478 548,478 548,478 548,478
T otal CO, t-CO, 614,880 71 7,360 81 9,840 922,320 1,024,800
CH, t-CO, 2,675,988 3,121,986 3,567,984 4,013,982 4,459,980
T otal t-CO, 3,290,868 3,839,346 4,387,824 4,936,302 5,484,780
Green House Gases reduction nit........ lit. 2016 2017 2018 2019 2020
Yearly CO, t-C 0 ,/y 102,480 102,480 102,480 102,480 102,480
ch4 t-C 0,/y 445,998 445,998 445,998 445,998 445,998
Total t-CO,/y 548,478 548,478 548,478 548,478 548,478
Total CO, t-co, 1,1 27,280 1,229,760 1,332,240 1,434,720 1,537,200
ch4 t-CO, 4,905,978 5,351,976 5,797,974 6,243,972 6,689,970
T otal t-co. 6,033,258 6,581,736 7,130,214 7,678,692 8,227,1 70
Green House Gases reduction urn mint 2021 2022 2023 2024
year End
2025
Yearly CO, t-C O ,/y 102,480 102,480 102,480 102,480 102,480
ch4 t-C 0,/y 445,998 445,998 445,998 445,998 445,998
T otal t-C O ,/y 548,478 548,478 548,478 548,478 548,478
T otal CO, t-co. 1,639,680 1,742,160 1,844,640 1,947,1 20 2,049,600
ch4 t-co, 7,135,968 7,581,966 8,027,964 8,473,962 8,91 9,960
T otal t-co, 8,775,648 9,324,1 26 9,872,604 10,421,082 1 0,969,560
— 3 — 26 —

3.2.4 Practical Confirmation Method of Green House Gases Reduction Effect(Monitoring Method)
Since it is anticipated that FELD A will manage the newly-set-up power plant, with a separate company established, the executive nucleus to superintend monitoring in the field will be the department taking charge of environmental problems in such a company.
Necessary measuring items are:1) Power transmission amount,2) Steam supply amount to the plant,3) Fossil fuel consumption rate,4) EFB usage rate,5) Sold power6) Exhaust gas , quantity7) Composition of exhaust gas, and8) Properties of fuel.
However, on the values, such as the quantity of exhaust gas and the composition of exhaust gas, no device to monitor them continuously is set up, and thus no other means can be found but to estimate them with calculated values used.
— 3 — 27 —

3.3 Influence on Productivity
By the introduction of the EFB burning co-generation equipment, productivity in SAHABAT COMPLEX which has the palm oil refineries intended for incorporation in this project, will be improved in the following points:
(l) The effective utilization of unused waste biomass energy:
EFB are generated in large quantities because they amount in weight to 23% of FFB (Fresh Fruit Bunches).Since they are hard to burn because of their wateriness, they are unused and
being dumped in palm plantations.And electric energy and steam for SAHABAT COMPLEX are being supplied
by Diesel generators and boiler, which use fossil fuel.
By using these EFB as fuel, it can be expected that the quantity of fossil fuel consumed will be cut sharply, and thus, the cost of palm oil refining can be reduced and competitive power can be increased.
And the dumping in palm plantations bring the fermentation of EFB and causes the breeding of beetles, and as the result, it develops problems such as the occurrence of damage to palm trees or fruits.However, by using the EFB effectively, the quantity of those dumped
decreases and the crop of the fruits increases.
(2) The curtailment of operating personnel:
As to the existing equipment in SAHABAT COMPLEX, small Diesel generators have been set up for each of kernel crushing plants, palm oil refineries, the office of shipping facilities, and the living quarter, and these generators are started and stopped according to loads. And boiler have also been set up in the refineries, and therefore operators for the Diesel generators and the boiler amount to 29 persons.
By replacing the above equipment with the newly set up equipment, operations can be covered by 15 persons.
However, the operating personnel can not be simply curtailed, because the personnel for backup operations of Diesel generators must be kept in the case of private generation, and also because there is a thought that the existing equipment should be kept as a backup at the time to stop the newly set up equipment for periodic inspections, etc., and moreover because there is also a view that no regard should be paid to the curtailment of operating personnel,
— 3—28 —

from the standpoint of employment creation.
Nevertheless at least in the case of IPP, the operating personnel for Diesel generators can be curtailed because electric energy supply from the outside becomes capable at the stoppage of the newlysetup equipment, owing to connection with the grid of the outside electric power company.
— 3 — 29—

CHAPTER 4
PROFITABILITY
Abstract
The economic effect of the project in return on investment is computed under the
planned service conditions.
In calculation cases, four patterns were verified in maximum profit (maximum profit -
minimum cost) and in minimum profit (minimum income — maximum cost) in both
fluidized bed boiler and stoker boiler.
At the same time, as cost performance of the project effect, energy saving effect and C02
reduction effect were examined.
For reference, IPP (16MW) effect was also verified as the same case to the in house
power plant

CHAPTER 4 PROFITABILITY
4.1 Economic Effect in Return on Investment
Economic effect in return on investment has been inspected by computing the
internal return rate (IRR) under the following conditions and assumptions.
4.1.1 Case Patters for Trial Computation
Inspection was made on the eight patterns- the two cases of maximum profit (the
income max. — the cost min.) and minimum profit (the income min. — the cost
max.), in each of the fluidized bed boiler (EBB) type and the stoker boiler (Stoker)
type, for the Industry-owned Power Plant system (7.8 MW)
Furthermore, in the IPP system (16MW) examined for reference purpose, it has
been inspected on the same patterns as the Industry-owned Power Plant
4.1.2 Prerequisites for Trial Computation
(D Values used:
The values obtained from FELD A during the survey period are used and
amount of money are converted at a rate of 32 yean to the RM.
For the details of values used, see the annexed Table 4.1.2-1.
(2) Basic conditions:
Start of construction: 2004,
Construction period: 2 years,
Project life: Set at 10 years, according to the depreciation period for
equipment in FELDA.
(3) Capital:
Assumed as 25 % of gross assets.
(D Debts:
2-steps loans with 7.75 % interest, of 5-year deferment and 15-year (including
the deferment period) repayment.
(D Expenditure for assets:
For buildings: On engineering works and construction (reference price:
expenditure in the 1st year), 20-year depreciation, with 0 of residual value.
For equipment: Assumed that 20 % is paid in the 1st year and 80 % in the 2nd
year; 10-year depreciation, with 0 of residual value.
For other machineries: On amounts of installation work (reference price:
— 4 — 1 —

expenditure in the 2nd year), 10-year depreciation, with 0 of residual value.
Preparatory expenditure for operation: Though it was considered to count in
salaries and wages for about half a year, this has been omitted in
consideration of simplification because there is no increase of personnel and
also because such cost is not so large.
For interest during construction: 3-year depreciation, with 0 of residual value.
© Revenue:
Since the present cost of diesel oil, EFB disposal, labor and maintenance can
be reduced, this cost reduction has been counted as revenue of the first order,
and earnings from electric energy selling has been counted as revenue of the
second order.
© Floating charges:
The charge for EFB conveyance; the charge for maintenance of the equipment
proper and the backup DG (Diesel generator); the cost of fuel for the backup
DG.
(D Fixed charges:
Labor cost for the equipment proper and the backup DG.
(9) Administrative expense:
3 % of the revenue (cost reduction + earnings from electric energy selling) has
been assumed to be the administrative expense.
@ Corporation tax:
28 %. Whereas it has been told by FELDA that 85 % deduction is applied for
the first 5 years, the condition of exemption for the first 5 years has been set.
© Short-term debts:
9%.
© Operating days:
Estimated at 335 operating days per year, based on the condition of more than
8,000 in operating hours per year, which was specified by FELDA. It has been
assumed that maintenance and checking are carried out during 30 stoppage
days.
4 -2-

4.1.3 Results of Computation
The IRR before and after tax deduction in each case is as follows:
Table 4.1.31: Max. IRR and Min. IRR before and after Tax Deduction
Before Tax Deduction
After Tax Deduction
Before tax deduction After tax deductionMax. Min. Max. Min.
Industry-ownedPP
Fluidized Bed Boiler 8.47% 3.32% 8.08% 3.32%Stoker Boiler 7.50% 2.27% 7.20% 2.27%
(for Reference)
Before tax deduction After tax deductionMax. Min. Max. Min.
IPP Fluidized Bed Boiler 14.64% 9.13% 13.59% 8.64%Stoker Boiler 12.97% 7.71% 12.07% 7.38%
For these values, the project life has been set at ten years, as the same value as
the depreciation period for equipment in FELDA, but realistically, the equipment
in question can be used for more than ten years.
In other words, if the project life is set longer, on equal amount of cash flow will
be kept for the prolonged period and the IRR will be further improved.
In the Industry-owned Power Plant developing 7.8 MW. all of generated energy is
used within the private group, and therefore it is not needed to deny
unconditionally the effect of investment into the system even if the IRR value is
lower than in IPP, because there is no such indefinite factor which any third
parties are concerned with, as electric energy selling to the outside in IPP.
The IRR in the case of IPP of the FBB type amounts to a good value of about 15 %
at the maximum profit. Even at the minimum profit, it mounts to a value
exceeding the open market interest rate in Malaysia.
— 4 —3—

Table 4.1.21 Basic Data for Trial Computation on Economy
Industry-owned PP IPP (Reference)Type of Boiler FBB Stoker FBB StokerOperating Days days/year 335 335 335 335Wages for Operators (*l)
Qualified Personnel (Low-pressure Boiler) Min. RM/man-month 1,200 1,200 1,200 1,200Max. RM/manmonth 1,400 1,400 1,400 1,400
Qualified Personnel (High-pressure Boiler) Min. RM/man month 2,100 2,100 2,100 2,100Max. RM/man month 3,000 3,000 3,000 3,000
Operators RM/L 450 450 450 450Fuel Charge (*l) 0.615 0.615 0.615 0.615Charge for EFB Disposal (*l) RM/mt
Present Condition (Mulching) RM/mt 6 6 6 6Conveyance for New Equipment (incl. Ash Conveyance) RM/mt 15 15 15 15Difference Min. RM/kwh 9 9 9 9
Price of Electric Energy Sold (*2) Max. RM/kwh 0.14 0.14 0.14 0.140.17 0.17 0.17 0.17
Quantity of Backup Energy by DG MWh/year 5,298 7,640 0 0Quantity of Fuel for Backup DG L/year 1,641,159 2,366,571 0 0Fuel charge for Backup DG 103RM/year 1,009.31 1.455.44 0 0
Electric Energy Selling Capacity MWh/year 2,993 2,216 59,145 52,568Amount of Sold Electric Energy Min. 103RM/year Not sell Not sell 2,681 2,516
Max. 103RM/year Not sell Not sell 6,702 6,289
Quantity of Carriedin EFB t/year 215,952 204,652 446,783 419,286Charge for EFB Disposal (Mulching): Present Condition 103RM/year 1,296 1,228 2,681 2,516Charge for EFB Disposal (Incineration): Effectively used for New Equipment 103RM/year 3,239 3,070 6,702 6,289
Quantity of Electric Energy Used in Plant (SAHABAT COMPLEX) MWh/year 35,349 35,349 35,349 35,349Volume of Fuel for Electric Energy Used KL/year 10,950 10,950 10,950 10,950Volume of Air Supplied to Plant t/year 128,640 128,640 128,640 128,640Volume of Fuel for Air supply Min. KL/year 8,262 8,262 8,262 8,262
Max. KL/year 12,156 12,156 12,156 12,156Volume of Fuel in Total Min. KL/year 19,213 19,213 19,213 19,213
Max. KL/year 23,107 23,107 23,107 23,107Fuel Charge Min. 103RM/year 11,816 11,816 11,816 11,816
Max. 103RM/year 14,211 14,211 14,211 14,211
Expenditure for Operation of Existing Equipment with It left IntactNumber of Operators: Qualified Personnel (Low-pressure Boiler) persons 7 7 7 7
Boiler Operators persons 12 12 12 12Diesel (DG) Operators persons 10 10 10 10
l) Labor Cost (Low-pressure Boiler) Min. 103RM/year 220 220 220 220Max. 103RM/year 236 236 236 236
2) Fuel Charge Min. 103RM/year 11,816 11,816 11,816 11,816Max. 103RM/year 14,211 14,211 14,211 14,211
3) Charge for EFB Disposal (Mulching) 103RM/year 1,296 1,228 2,681 2,516Total Min. 103RM/year 13,331 13,263 14,716 14,551
Max. 103RM/year 15,743 15,675 17,128 16,963
Expenditure for Operation of Newly-set up Thermal Power PlantNumber of Operators for New Equipment: Qualified Personnel (High pressure Boiler) persons 3 3 3 3(3 Shifts) Boiler Operators persons 3 3 3 3
Fuel SV persons 3 3 3 3Personnel for EFB Disposal persons 3 3 3 3Reserved Personnel persons 3 3 3 3
Operators for Backup by Existing Equipment,: Qualified Personnel persons 4 4 4 4Diesel (DG) Operators persons 10 10 10 10
l) Labor Cost (High-pressure Boiler) Min. 103RM/year 252 252 252 252Max. 103RM/year 294 294 294 240
2) Fuel Charge for Backup by DG 103RM/year 1,009 1,455 0 03) Charge for EFB Disposal (incl. Cost of Conveyance of EFB & Ashes) 103RM/year 3,239 3,070 6,702 6,289Subtotal Min. 103RM/year 4,501 4,777 6,954 6,541
Max. 103RM/year 4,543 4,819 6,996 6,529[Profit from Electric Energy Selling][Amount of Sold Electric Energy] Min. 103RM/year
Max. 103RM/year 0 0 8,280 7,3600 0 10,055 8,937
[Expenditure for Operation after Profit] Min. 103RM/yearMax. 103RM/year 4,501 4,777 -3,101 -2,395
4,543 4,819 -1,285 -830
[Difference in Annual Expenditure]Difference in Expenditure Min. 103RM/year 8,788 8,444 16,001 15,381
Max. 103RM/year 11,242 10,898306 20,229 19,358*1. Data from FELDA*2. Data from Department of Energy

Table 4.1.3*2 Income Statement (Ind.-owned P.P. FBB Type)
(Unit:¥Million)
(a) Max.
Year 2004 2005 2006 2007 2008 2009 2010 2011 2012 2013 2014 2015
Sales Revenue 0 0 506 506 506 506 506 506 506 506 506 506
Total Cost of Sales 0 0 357 357 357 357 357 357 357 357 357 357
Variable Cost 0 0 140 140 140 140 140 140 140 140 140 140
EFB Transport 0 0 104 104 104 104 104 104 104 104 104 104
Maintenance 0 0 3 3 3 3 3 3 3 3 3 3
BUFuef 0 0 32 32 32 32 32 32 32 32 32 32
BU Nfaintenance 0 0 1 1 1 1 1 1 1 1 1 1
Fixed Cost 0 0 217 217 217 217 217 217 217 217 217 217
Labor 0 0 4 4 4 4 4 4 4 4 4 4
BU Labor 0 0 4 4 4 4 4 4 4 4 4 4
Depreciation 0 0 209 209 209 209 209 209 209 209 209 209
Amortization 0 0 0 0 0 0 0 0 0 0 0 0
Inc. of Prod. Inventory 0 0 0 0 0 0 0 0 0 0 0 0
FYofiton Sales 0 0 149 149 149 149 149 149 149 149 149 149
Sales & Adrria Cost 0 0 15 15 15 15 15 15 15 15 15 15
General Cost 0 0 15 15 15 15 15 15 15 15 15 15
Operation FYofit 0 0 134 134 134 134 134 134 134 134 134 134
Interest on L-ioan 0 0 128 128 128 128 115 103 90 77 64 51
Interest on S-Loan 0 0 0 0 0 0 0 0 0 0 0 0
Net FYofit before Tax 0 0 6 6 6 6 19 31 44 57 70 83
Income Tax 0 0 0 0 0 0 1 9 12 16 20 23
Net FYofit after Tax 0 0 6 6 6 6 18 22 32 41 50 60
(b) Min.
Year 2004 2005 2006 2007 2008 2009 2010 2011 2012 2013 2014 2015Sales Revenue 0 0 428 428 428 428 428 428 428 428 428 428Total Cost of Sales 0 0 359 359 359 359 359 359 359 359 359 359
Variable Cost 0 0 140 140 140 140 140 140 140 140 140 140EFB Transport 0 0 104 104 104 104 104 104 104 104 104 104Maintenance 0 0 3 3 3 3 3 3 3 3 3 3BU Fuel 0 0 32 32 32 32 32 32 32 32 32 32BU Maintenance 0 0 1 1 1 1 1 1 1 1 1 1
Fixed Cost 0 0 219 219 219 219 219 219 219 219 219 219Labor 0 0 6 6 6 6 6 6 6 6 6 6BU Labor 0 0 4 4 4 4 4 4 4 4 4 4Depreciation 0 0 209 209 209 209 209 209 209 209 209 209Amortization 0 0 0 0 0 0 0 0 0 0 0 0
Inc. of Prod. Inventory 0 0 0 0 0 0 0 0 0 0 0 0Profit on Sales 0 0 69 69 69 69 69 69 69 69 69 69
Sales & Admin. Cost 0 0 13 13 13 13 13 13 13 13 13 13General Cost 0 0 13 13 13 13 13 13 13 13 13 13
Operation Profit 0 0 56 56 56 56 56 56 56 56 56 56Interest on L-Loan 0 0 128 128 128 128 115 103 90 77 64 51Interest on S-Loan 0 0 0 0 0 0 0 0 0 0 0 0
Net Profit before Tax 0 0 -72 -72 -72 -72 -59 -47 -34 -21 -8 5Income Tax 0 0 0 0 0 0 0 0 0 0 0 1Net Profit after Tax 0 0 -72 -72 -72 -72 -59 -47 -34 -21 -8 4
4 — 6 —

Table 4.1.3 3 Balance Sheet (Ind. owned P.P. FBB Type)
(Unit ^Million)
(a) Max.
Year 2004 2005 2006 2007 2008 2009 2010 2011 2012 2013 2014 2015Asset 568 2.206 2.212 2.218 2.224 2.064 1.918 1.774 1.640 1.515 1.401 1.295
Current Asset 0 0 215 430 645 694 757 822 897 981 1.076 1.1790 0 215 430 645 694 757 822 897 981 1.076 1.179
Account receivable 0 0 0 0 0 0 0 0 0 0 0 0Inventory of Materials 0 0 0 0 0 0 0 0 0 0 0 0Inventory of Products 0 0 0 0 0 0 0 0 0 0 0 0
Fixed Asset 568 2.206 2.206 2.206 2.206 2.206 2.206 2.206 2.206 2.206 2.206 2.206Land 0 0 0 0 0 0 0 0 0 0 0 0Building 239 239 239 239 239 239 239 239 239 239 239 239Plant 329 1.647 1.647 1.647 1.647 1.647 1.647 1.647 1.647 1,647 1.647 1.647Other Machinery 0 319 319 319 319 319 319 319 319 319 319 319Preoperation Cost 0 0 0 0 0 0 0 0 0 0 0 0IDC 0 1 1 1 1 1 1 1 1 1 1 1
Deprec. and Amort. 0 0 -209 -418 -627 -836 -1.045 -1.254 -1.463 -1.672 -1.881 -2.090Liability and Equity 568 2.206 2.212 2.218 2.224 2.064 1.918 1.774 1.640 1.515 1.401 1.295Liability 17 1.654 1.654 1.654 1.654 1.488 1.324 1.158 992 826 662 496
Current Liability 0 0 0 0 0 0 0 0 0 0 0 0Account Payable 0 0 0 0 0 0 0 0 0 0 0 0Short Term Loan 0 0 0 0 0 0 0 0 0 0 0 0
Fixed Liability 17 1.654 1.654 1.654 1.654 1.488 1.324 1.158 992 826 662 496Long Term Loan 17 1.654 1.654 1.654 1.654 1.488 1.324 1.158 992 826 662 496
Stock Holders' Equity 551 552 558 564 570 576 594 616 648 689 739 799Share Capital 551 552 552 552 552 552 552 552 552 552 552 552Retained Earning 0 0 0 6 12 18 24 42 64 96 137 187Net Profit after Tax 0 0 6 6 6 6 18 22 32 41 50 60
(b) Min.
Year 2004 2005 2006 2007 2008 2009 2010 2011 2012 2013 2014 2015Asset 568 2.206 2.134 2.062 1.990 1.752 1.529 1.316 1.116 929 757 595
Current Asset 0 0 137 274 411 382 368 364 373 395 432 479Cash 0 0 137 274 411 382 368 364 373 395 432 479Account receivable 0 0 0 0 0 0 0 0 0 0 0 0Inventory of Materials 0 0 0 0 0 0 0 0 0 0 0 0Inventory of Products 0 0 0 0 0 0 0 0 0 0 0 0
Fixed Asset 568 2.206 2.206 2.206 2.206 2.206 2.206 2.206 2.206 2.206 2.206 2.206Land 0 0 0 0 0 0 0 0 0 0 0 0Building 239 239 239 239 239 239 239 239 239 239 239 239Plant 329 1,647 1.647 1,647 1.647 1.647 1.647 1.647 1.647 1.647 1.647 1.647Other Machinery 0 319 319 319 319 319 319 319 319 319 319 319Preoperation Cost 0 0 0 0 0 0 0 0 0 0 0 0IDC 0 1 1 1 1 1 1 1 1 1 1 1
Deprec. and Amort 0 0 -209 -418 -627 -836 -1.045 -1.254 -1.463 -1.672 -1.881 -2.090Liability and Equity 568 2.206 2.134 2.062 1.990 1.752 1.529 1.316 1.116 929 757 595Liability 17 1.654 1.654 1.654 1.654 1.488 1.324 1.158 992 826 662 496
Current Liability 0 0 0 0 0 0 0 0 0 0 0 0Account Payable 0 0 0 0 0 0 0 0 0 0 0 0Short Term Loan 0 0 0 0 0 0 0 0 0 0 0 0
Fixed Liability 17 1.654 1.654 1.654 1.654 1.488 1.324 1.158 992 826 662 496Long Term Loan 17 1.654 1.654 1.654 1.654 1.488 1.324 1.158 992 826 662 496
Stock Holders' Equity 551 552 480 408 336 264 205 158 124 103 95 99Share Capital 551 552 552 552 552 552 552 552 552 552 552 552Retained Earning 0 0 0 -72 -144 -216 -288 -347 -394 -428 -449 -457Net Profit after Tax 0 0 -72 -72 -72 -72 -59 -47 -34 -21 -8 4
— 4 — 7 —

Table 4.1.3-4 Cash Flow Sheet (Ind.-owned P.P. FBB Type)
(Unit:¥Million)
(a) Max.
Year 2004 2005 2006 2007 2008 2009 2010 2011 2012 2013 2014 2015Source of Fund 568 1.638 343 343 343 343 343 343 343 343 343 343
Cash from Operation 0 0 343 343 343 343 343 343 343 343 343 343Operation Profit 0 0 134 134 134 134 134 134 134 134 134 134Depreciation 0 0 209 209 209 209 209 209 209 209 209 209Amortization 0 0 0 0 0 0 0 0 0 0 0 0
Financial Resources 568 1.638 0 0 0 0 0 0 0 0 0 0Share Capital 551 1 0 0 0 0 0 0 0 0 0 0Long term Loan 17 1.637 0 0 0 0 0 0 0 0 0 0Short Term Loan 0 0 0 0 0 0 0 0 0 0 0 0
Increase of Account Payable 0 0 0 0 0 0 0 0 0 0 0 0Use of Fund 568 1.638 128 128 128 294 280 278 268 259 248 240
Fixed Asset Investment 568 1.638 0 0 0 0 0 0 0 0 0 0Land 0 0 0 0 0 0 0 0 0 0 0 0Building 239 0 0 0 0 0 0 0 0 0 0 0Plant 329 1.318 0 0 0 0 0 0 0 0 0 0Other Machinery 0 319 0 0 0 0 0 0 0 0 0 0Preoperation Cost 0 0 0 0 0 0 0 0 0 0 0 0IDC 0 1 0 0 0 0 0 0 0 0 0 0
Increase of Current Asset 0 0 0 0 0 0 0 0 0 0 0 0Inc. Account receivable 0 0 0 0 0 0 0 0 0 0 0 0Inc. Product Inventory 0 0 0 0 0 0 0 0 0 0 0 0Inc. Material Inventory 0 0 0 0 0 0 0 0 0 0 0 0
Inc. of Debt Service 0 0 128 128 128 294 279 269 256 243 228 217Repayment L-term Loan 0 0 0 0 0 166 164 166 166 166 164 166Repayment S-term Loan 0 0 0 0 0 0 0 0 0 0 0 0Interest L-term Loan 0 0 128 128 128 128 115 103 90 77 64 51Interest S-term Loan 0 0 0 0 0 0 0 0 0 0 0 0
Income Tax 0 0 0 0 0 0 1 9 12 16 20 23Cash Increase 0 0 215 215 215 49 63 65 75 84 95 103Cash Balance Bgn. 0 0 0 215 430 645 694 757 822 897 981 1.076Cash Balance End 0 0 215 430 645 694 757 822 897 981 1.076 1.179
(b) Min.
Year 2004 2005 2006 2007 2008 2009 2010 2011 2012 2013 2014 2015Source of Fund 568 1.638 265 265 265 265 265 265 265 265 265 265
Cash from Operation 0 0 265 265 265 265 265 265 265 265 265 265Operation Profit 0 0 56 56 56 56 56 56 56 56 56 56Depreciation 0 0 209 209 209 209 209 209 209 209 209 209Amortization 0 0 0 0 0 0 0 0 0 0 0 0
Financial Resources 568 1.638 0 0 0 0 0 0 0 0 0 0Share Capital 551 1 0 0 0 0 0 0 0 0 0 0Long term Loan 17 1.637 0 0 0 0 0 0 0 0 0 0Short Term Loan 0 0 0 0 0 0 0 0 0 0 0 0
Increase of Account Payable 0 0 0 0 0 0 0 0 0 0 0 0Use of Fund 568 1.638 128 128 128 294 279 269 256 243 228 218
Fixed Asset Investment 568 1.638 0 0 0 0 0 0 0 0 0 0Land 0 0 0 0 0 0 0 0 0 0 0 0Building 239 0 0 0 0 0 0 0 0 0 0 0Plant 329 1.318 0 0 0 0 0 0 0 0 0 0Other Machinery 0 319 0 0 0 0 0 0 0 0 0 0Preoperation Cost 0 0 0 0 0 0 0 0 0 0 0 0IDC 0 1 0 0 0 0 0 0 0 0 0 0
Increase of Current Asset 0 0 0 0 0 0 0 0 0 0 0 0Inc. Account receivable 0 0 0 0 0 0 0 0 0 0 0 0Inc. Product Inventory 0 0 0 0 0 0 0 0 0 0 0 0Inc. Material Inventory 0 0 0 0 0 0 0 0 0 0 0 0
Inc. of Debt Service 0 0 128 128 128 294 279 269 256 243 228 217Repayment L-term Loan 0 0 0 0 0 166 164 166 166 166 164 166Repayment S-term Loan 0 0 0 0 0 0 0 0 0 0 0 0Interest L-term Loan 0 0 128 128 128 128 115 103 90 77 64 51Interest S-term Loan 0 0 0 0 0 0 0 0 0 0 0 0
Income Tax 0 0 0 0 0 0 0 0 0 0 0 1Cash Increase 0 0 137 137 137 -29 -14 -4 9 22 37 47Cash Balance Bgn. 0 0 0 137 274 411 382 368 364 373 395 432Cash Balance End 0 0 137 274 411 382 368 364 373 395 432 479
-4-8

Table 4.1.3-5 Income Statement (Ind.-owned P.P. Stoker Type)
(Unit:¥Million)
(a) Max.
Year 2004 2005 2006 2007 2008 2009 2010 2011 2012 2013 2014 2015Sales Revenue 0 0 504 504 504 504 504 504 504 504 504 504Total Cost of Sales 0 0 368 368 368 368 368 368 368 368 368 368
Variable Cost 0 0 149 149 149 149 149 149 149 149 149 149EFB Transport 0 0 98 98 98 98 98 98 98 98 98 98Maintenance 0 0 3 3 3 3 3 3 3 3 3 3BU Fuel 0 0 47 47 47 47 47 47 47 47 47 47BU Maintenance 0 0 1 1 1 1 1 1 1 1 1 1
Fixed Cost 0 0 219 219 219 219 219 219 219 219 219 219Labor 0 0 4 4 4 4 4 4 4 4 4 4BU Labor 0 0 4 4 4 4 4 4 4 4 4 4Depreciation 0 0 211 211 211 211 211 211 211 211 211 211Amortization 0 0 0 0 0 0 0 0 0 0 0 0
Inc. of Prod. Inventory 0 0 0 0 0 0 0 0 0 0 0 0Profit on Sales 0 0 136 136 136 136 136 136 136 136 136 136
Sales & Admin. Cost 0 0 15 15 15 15 15 15 15 15 15 15General Cost 0 0 15 15 15 15 15 15 15 15 15 15
Operation Profit 0 0 121 121 121 121 121 121 121 121 121 121Interest on L-loan 0 0 130 130 130 130 117 104 91 78 65 52Interest on S-Loan 0 0 0 0 0 0 0 0 0 0 0 0
Net Profit before Tax 0 0 -9 -9 -9 -9 4 17 30 43 56 69Income Tax 0 0 0 0 0 0 0 5 8 12 16 19Net Profit after Tax 0 0 -9 -9 -9 -9 4 12 22 31 40 50
(b) Min.
Year 2004 2005 2006 2007 2008 2009 2010 2011 2012 2013 2014 2015Sales Revenue 0 0 426 426 426 426 426 426 426 426 426 426Total Cost of Sales 0 0 370 370 370 370 370 370 370 370 370 370
Variable Cost 0 0 149 149 149 149 149 149 149 149 149 149EFB Transport 0 0 98 98 98 98 98 98 98 98 98 98Maintenance 0 0 3 3 3 3 3 3 3 3 3 3BU Fuel 0 0 47 47 47 47 47 47 47 47 47 47BU Maintenance 0 0 1 1 1 1 1 1 1 1 1 1
Fixed Cost 0 0 221 221 221 221 221 221 221 221 221 2210 0 6 6 6 6 6 6 6 6 6 6
BU Labor 0 0 4 4 4 4 4 4 4 4 4 4Depreciation 0 0 211 211 211 211 211 211 211 211 211 211Amortization 0 0 0 0 0 0 0 0 0 0 0 0
Inc. of Prod. Inventory 0 0 0 0 0 0 0 0 0 0 0 0Profit on Sales 0 0 56 56 56 56 56 56 56 56 56 56
Sales & Admin. Cost 0 0 13 13 13 13 13 13 13 13 13 13General Cost 0 0 13 13 13 13 13 13 13 13 13 13
Operation Profit 0 0 43 43 43 43 43 43 43 43 43 43Interest on L-Loan 0 0 130 130 130 130 117 104 91 78 65 52Interest on S-Loan 0 0 0 0 0 0 0 0 0 0 0 0
Net Profit before Tax 0 0 -87 -87 -87 -87 -74 -61 -48 -35 -22 -9Income Tax 0 0 0 0 0 0 0 0 0 0 0 0
Net Profit after Tax 0 0 -87 -87 -87 -87 -74 -61 -48 -35 -22 -9
— 4 — 9 —

(a) Max.
Table 4.1.3-6 Balance Sheet (Ind.-owned P.P. Stoker Type)
(Unit>¥Million)
Year 2004 2005 2006 2007 2008 2009 2010 2011 2012 2013 2014 2015Asset 577 2.237 2.228 2.219 2.210 2.033 1.869 1.714 1.568 1.432 1.304 1.186
Current Asset 0 0 202 404 606 640 687 743 808 883 966 1.0590 0 202 404 606 640 687 743 808 883 966 1.059
Account receivable 0 0 0 0 0 0 0 0 0 0 0 0Inventory of Materials 0 0 0 0 0 0 0 0 0 0 0 0Inventory of Products 0 0 0 0 0 0 0 0 0 0 0 0
Fixed Asset 577 2.237 2.237 2.237 2.237 2.237 2.237 2.237 2.237 2.237 2.237 2237Land 0 0 0 0 0 0 0 0 0 0 0 0Building 243 243 243 243 243 243 243 243 243 243 243 243Plant 334 1,669 1.669 1.669 1.669 1.669 1,669 1.669 1.669 1.669 1,669 1.669Other Machinery 0 324 324 324 324 324 324 324 324 324 324 324Preoperation Cost 0 0 0 0 0 0 0 0 0 0 0 0IOC 0 1 1 1 1 1 1 1 1 1 1 1
Decree and Amort. 0 0 -211 -422 -633 -844 -1.055 -1.266 -1.477 -1.688 -1.899 -2.110Liability and Equity 577 2.237 2.228 2.219 2.210 2.033 1.869 1.714 1.568 1.432 1.304 1.186Liability 18 1.677 1.677 1.677 1.677 1.509 1.341 1.174 1.006 839 671 503
Current Liability 0 0 0 0 0 0 0 0 0 0 0 0Account Payable 0 0 0 0 0 0 0 0 0 0 0 0Short Term Loan 0 0 0 0 0 0 0 0 0 0 0 0
Fixed Liability 18 1.677 1.677 1.677 1.677 1.509 1.341 1.174 1.006 839 671 503Long Term Loan 18 1.677 1.677 1.677 1.677 1.509 1.341 1.174 1.006 839 671 503
Stock Holders' Equity 5591 560 551 542 533 524 528 540 562 593 633 683Share Capital 559 560 560 560 560 560 560 560 560 560 560 560Retained Earning 0 0 0 *9 -18 -27 -36 -32 -20 2 33 73Net Profit after Tax 0 0 -9 -9 -9 -9 4 12 22 31 40 50
(b) Min.
Year 2004 2005 2006 2007 2008 2009 2010 2011 2012 2013 2014 2015577 2237 2.150 2.063 1.976 1.721 1.479 1.251 1.035 833 643 466
Current Asset 0 0 124 248 372 328 297 280 275 284 305 339Cash 0 0 124 248 372 328 297 280 275 284 305 339Account receivable 0 0 0 0 0 0 0 0 0 0 0 0Inventory of Materials 0 0 0 0 0 0 0 0 0 0 0 0Inventory of Products 0 0 0 0 0 0 0 0 0 0 0 0
Fixed Asset 577 2.237 2.237 2.237 2.237 2.237 2.237 2.237 2.237 2.237 2.237 2.237Land 0 0 0 0 0 0 0 0 0 0 0 0Building 243 243 243 243 243 243 243 243 243 243 243 243Plant 334 1.669 1,669 1.669 1.669 1.669 1.669 1,669 1.669 1.669 1.669 1.669Other Machinery 0 324 324 324 324 324 324 324 324 324 324 324Preoperation Cost 0 0 0 0 0 0 0 0 0 0 0 0IDG 0 1 1 1 1 1 1 1 1 1 1 1
Deprec. and Amort. 0 0 -211 -422 -633 -844 -1.055 -1.266 -1.477 -1.688 -1.899 -2.110Liability and Equity 577 2.237 2.150 2.063 1.976 1.721 1.479 1.251 1.035 833 643 466Liability 18 1.677 1.677 1.677 1.677 1.509 1.341 1.174 1.006 839 671 503
Current Liability 0 0 0 0 0 0 0 0 0 0 0 0Account Payable 0 0 0 0 0 0 0 0 0 0 0 0Short Term Loan 0 0 0 0 0 0 0 0 0 0 0 0
fixed Liability 18 1.677 1.677 1.677 1.677 1.509 1.341 1,174 1.006 839 671 503Long Term Loan 18 1.677 1.677 1.677 1.677 1.509 1.341 1.174 1.006 839 671 503
Stock Holders' Equity 559 560 473 386 299 212 138 77 29 -6 -28 -37Share Capital 559 560 560 560 560 560 560 560 560 560 560 560Retained Earning 0 0 0 -87 -174 -261 -348 -422 -483 -531 -566 -588Net Profit after Tax 0 0 -87 -87 -87 -87 -74 "61 -48 -35 -22 -9
-4-10-
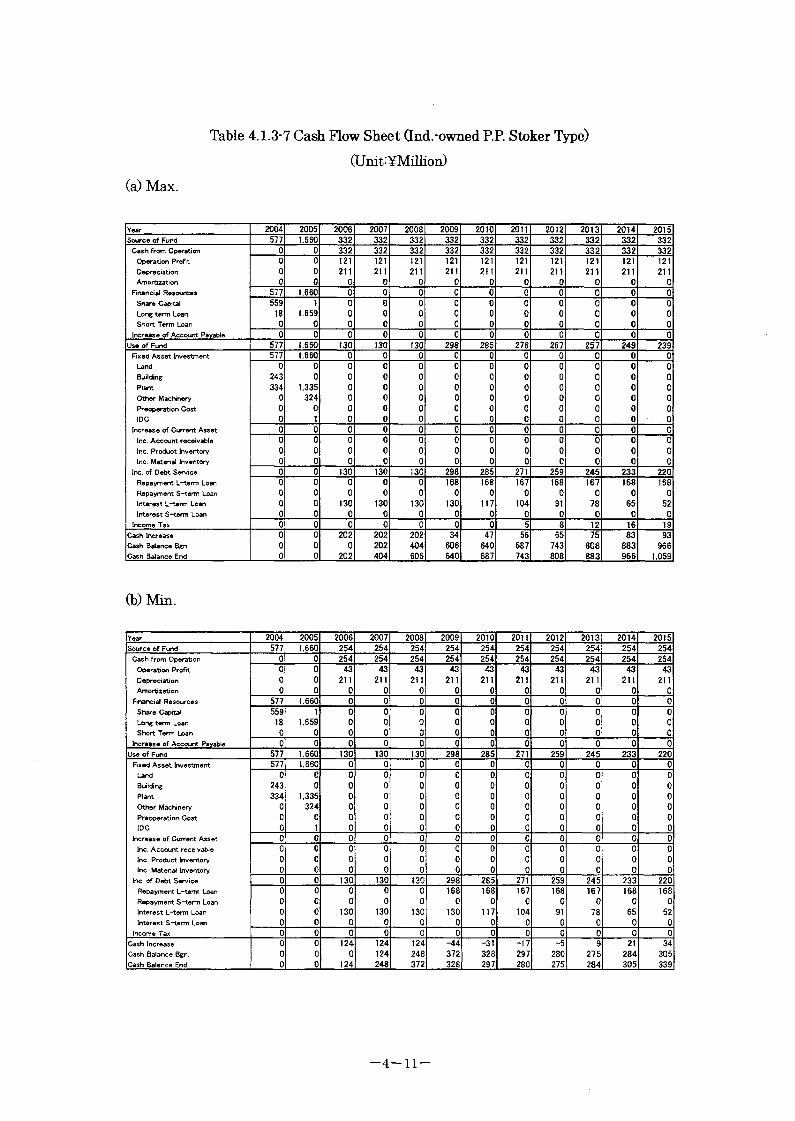
Table 4.1.3-7 Cash Flow Sheet (Ind.-owned P.P. Stoker Type)
(Unit ^Million)
(a) Max.
Year 2004 2005 2006 2007 2008 2009 2010 2011 2012 2013 2014 2015Source of Fund 577 1.660 332 332 332 332 332 332 332 332 332 332
Cash from Operation 0 0 332 332 332 332 332 332 332 332 332 332Operation Profit 0 0 121 121 121 121 121 121 121 121 121 121Depreciation 0 0 211 211 211 211 211 211 211 211 211 211Amortization 0 0 0 0 0 0 0 0 0 0 0 0
Financial Resources 577 1.660 0 0 0 0 0 0 0 0 0 0Share Capital 559 1 0 0 0 0 0 0 0 0 0 0Long term Loan 18 1,659 0 0 0 0 0 0 0 0 0 0Short Term Loan 0 0 0 0 0 0 0 0 0 0 0 0
Increase of Account Payable 0 0 0 0 0 0 0 0 0 0 0 0Use of Fund 577 1.660 130 130 130 298 285 276 267 257 249 239
Fixed Asset Investment 577 1.660 0 0 0 0 0 0 0 0 0 0Land 0 0 0 0 0 0 0 0 0 0 0 0Building 243 0 0 0 0 0 0 0 0 0 0 0Plant 334 1.335 0 0 0 0 0 0 0 0 0 0Other Machinery 0 324 0 0 0 0 0 0 0 0 0 0Preoperation Cost 0 0 0 0 0 0 0 0 0 0 0 0IDC 0 1 0 0 0 0 0 0 0 0 0 0
Increase of Current Asset 0 0 0 0 0 0 0 0 0 0 0 0Inc. Account receivable 0 0 0 0 0 0 0 0 0 0 0 0Inc. Product Inventory 0 0 0 0 0 0 0 0 0 0 0 0Inc. Material Inventory 0 0 0 0 0 0 0 0 0 0 0 0
Inc. of Debt Service 0 0 130 130 130 298 285 271 259 245 233 220Repayment L-term Loan 0 0 0 0 0 168 168 167 168 167 168 168Repayment S-term Loan 0 0 0 0 0 0 0 0 0 0 0 0Interest L-term Loan 0 0 130 130 130 130 117 104 91 78 65 52Interest S-term Loan 0 0 0 0 0 0 0 0 0 0 0 0
Income Tax 0 0 0 0 0 0 0 5 8 12 16 19Cash Increase 0 0 202 202 202 34 47 56 65 75 83 93Cash Balance Bgn. 0 0 0 202 404 606 640 687 743 808 883 966Cash Balance End 0 0 202 404 606 640 687 743 808 883 966 1.059
(b) Min.
Year 2004 2005 2006 2007 2008 2009 2010 2011 2012 2013 2014 2015Source of Fund 577 1.660 254 254 254 254 254 254 254 254 254 254
Cash from Operation 0 0 254 254 254 254 254 254 254 254 254 254Operation Profit 0 0 43 43 43 43 43 43 43 43 43 43Depreciation 0 0 211 211 211 211 211 211 211 211 211 211Amortization 0 0 0 0 0 0 0 0 0 0 0 0
Financial Resources 577 1.660 0 0 0 0 0 0 0 0 0 0Share Capital 559 1 0 0 0 0 0 0 0 0 0 0Long term Loan 18 1.659 0 0 0 0 0 0 0 0 0 0Short Term Loan 0 0 0 0 0 0 0 0 0 0 0 0
Increase of Account Payable 0 0 0 0 0 0 0 0 0 0 0 0
Use of Fund 577 1.660 130 130 130 298 285 271 259 245 233 220Fixed Asset Investment 577 1.660 0 0 0 0 0 0 0 0 0 0
Land 0 0 0 0 0 0 0 0 0 0 0 0
Building 243 0 0 0 0 0 0 0 0 0 0 0
Plant 334 1,335 0 0 0 0 0 0 0 0 0 0
Other Machinery 0 324 0 0 0 0 0 0 0 0 0 0
Preoperation Cost 0 0 0 0 0 0 0 0 0 0 0 0
IDC 0 1 0 0 0 0 0 0 0 0 0 0
Increase of Current Asset 0 0 0 0 0 0 0 0 0 0 0 0
Inc. Account receivable 0 0 0 0 0 0 0 0 0 0 0 0
Inc. Product Inventory 0 0 0 0 0 0 0 0 0 0 0 0
Inc. Material Inventory 0 0 0 0 0 0 0 0 0 0 0 0
Inc. of Debt Service 0 0 130 130 130 298 285 271 259 245 233 220Repayment L-term Loan 0 0 0 0 0 168 168 167 168 167 168 168Repayment S-term Loan 0 0 0 0 0 0 0 0 0 0 0 0
Interest L-term Loan 0 0 130 130 130 130 117 104 91 78 65 52Interest S-term Loan 0 0 0 0 0 0 0 0 0 0 0 0
Income Tax 0 0 0 0 0 0 0 0 0 0 0 0
Cash Increase 0 0 124 124 124 -44 -31 -17 -5 9 21 34Cash Balance Bgn. 0 0 0 124 248 372 328 297 280 275 284 305Cash Balance End 0 0 124 248 372 328 297 280 275 284 305 339
4—11 —

Table 4.1.3 8 Income Statement (I.P.P. FBB Type)
(Unit:¥Million)
(a) Max.
Year 2004 2005 2006 2007 2008 2009 2010 2011 2012 2013 2014 2015Sales Revenue 0 0 874 874 874 874 874 874 874 874 874 874Total Cost of Sales 0 0 514 514 514 513 513 513 513 513 513 513
Variable Cost 0 0 219 219 219 219 219 219 219 219 219 219EFB Transport 0 0 214 214 214 214 214 214 214 214 214 214Maintenance 0 0 4 4 4 4 4 4 4 4 4 4BU Maintenance 0 0 1 1 1 1 1 1 1 1 1 1
Fixed Cost 0 0 295 295 295 294 294 294 294 294 294 2940 0 4 4 4 4 4 4 4 4 4 4
BU Labor 0 0 4 4 4 4 4 4 4 4 4 4Depreciation 0 0 286 286 286 286 286 286 286 286 286 286Amortization 0 0 1 1 1 0 0 0 0 0 0 0
Inc. of Prod. Inventory 0 0 0 0 0 0 0 0 0 0 0 0Profit on Sales 0 0 360 360 360 361 361 361 361 361 361 361
Sales & Admin. Cost 0 0 26 26 26 26 26 26 26 26 26 26General Cost 0 0 26 26 26 26 26 26 26 26 26 26
Operation Profit 0 0 334 334 334 335 335 335 335 335 335 335Interest on L-Loan 0 0 176 176 176 176 158 140 123 105 88 70Interest on S-Loan 0 0 0 0 0 0 0 0 0 0 0 0
Net Profit before Tax 0 0 158 158 158 159 177 195 212 230 247 265Income Tax 0 0 7 7 7 7 7 55 59 64 69 74Net Profit after Tax 0 0 151 151 151 152 170 140 153 166 178 191
(b) Min.
Year 2004 2005 2006 2007 2008 2009 2010 2011 2012 2013 2014 2015Sales Revenue 0 0 739 739 739 739 739 739 739 739 739 739Total Cost of Sales 0 0 516 516 516 515 515 515 515 515 515 515
Variable Cost 0 0 219 219 219 219 219 219 219 219 219 219EFB Transport 0 0 214 214 214 214 214 214 214 214 214 214Maintenance 0 0 4 4 4 4 4 4 4 4 4 4BU Maintenance 0 0 1 1 1 1 1 1 1 1 1 1
Fixed Cost 0 0 297 297 297 296 296 296 296 296 296 296Labor 0 0 6 6 6 6 6 6 6 6 6 6BU Labor 0 0 4 4 4 4 4 4 4 4 4 4Depreciation 0 0 286 286 286 286 286 286 286 286 286 286Amortization 0 0 1 1 1 0 0 0 0 0 0 0
Inc. of Prod. Inventory 0 0 0 0 0 0 0 0 0 0 0 0Profit on Sales 0 0 223 223 223 224 224 224 224 224 224 224
Sales & Admin. Cost 0 0 22 22 22 22 22 22 22 22 22 22General Cost 0 0 22 22 22 22 22 22 22 22 22 22
Operation Profit 0 0 201 201 201 202 202 202 202 202 202 202Interest on L-Loan 0 0 176 176 176 176 158 140 123 105 88 70Interest on S-Loan 0 0 0 0 0 0 0 0 0 0 0 0
Net Profit before Tax 0 0 25 25 25 26 44 62 79 97 114 132Income Tax 0 0 1 1 1 1 2 17 22 27 32 37Net Profit after Tax 0 0 24 24 24 25 42 45 57 70 82 95
-4-12-

Table 4.1.3-9 Balance Sheet (I.P.P. FBB Type)
(Unit:¥Million)
(a) Max.
Year 2004 2005 2006 2007 2008 2009 2010 2011 2012 2013 2014 2015
Asset 779 3. 024 3. 175 3. 326 3. 477 3.403 3.345 3. 259 3. 186 3. 126 3. 076 3.041
Current Asset 0 0 438 876 1.314 1.526 1.754 1.954 2. 167 2.393 2. 629 2.880
Cash 0 0 411 849 1.287 1.499 1.727 1.927 2. 140 2. 366 2. 602 2. 853
Account receivable 0 0 27 27 27 27 27 27 27 27 27 27
Inventory of Materials 0 0 0 0 0 0 0 0 0 0 0 0
Inventory of Products 0 0 0 0 0 0 0 0 0 0 0 0
Fixed Asset 779 3. 024 3. 024 3.024 3. 024 3.024 3. 024 3. 024 3. 024 3. 024 3. 024 3. 024
Land 0 0 0 0 0 0 0 0 0 0 0 0
Building 328 328 328 328 328 328 328 328 328 328 328 328
Plant 451 2. 256 2. 256 2. 256 2. 256 2. 256 2. 256 2. 256 2. 256 2. 256 2. 256 2. 256
Other Machinery 0 438 438 438 438 438 438 438 438 438 438 438
Preoperation Cost 0 0 0 0 0 0 0 0 0 0 0 0
IDG 0 2 2 2 2 2 2 2 2 2 2 2
Deprec. and Amort. 0 0 -287 -574 -861 -1. 147 -1.433 -1.719 -2.005 -2.291 -2.577 -2.863
Liability and Equity 779 3.024 3. 175 3. 326 3. 477 3.403 3.345 3. 259 3. 186 3. 126 3. 076 3.041
Liability 23 2. 266 2. 266 2. 266 2. 266 2.040 1.812 1.586 1.360 1. 134 906 680
Current Liability 0 0 0 0 0 0 0 0 0 0 0 0
Account Payable 0 0 0 0 0 0 0 0 0 0 0 0
Short Term Loan 0 0 0 0 0 0 0 0 0 0 0 0
Fixed Liability 23 2. 266 2. 266 2. 266 2. 266 2.040 1.812 1.586 1.360 1. 134 906 680
Long Term Loan 23 2. 266 2. 266 2. 266 2. 266 2.040 1.812 1.586 1.360 1. 134 906 680
Stock Holders' Equity 756 758 909 1.060 1.211 1.363 1.533 1.673 1.826 1.992 2. 170 2. 361
Share Capital 756 758 758 758 758 758 758 758 758 758 758 758
Retained Earning 0 U 0 151 453 915 1.068 1. 234 1.412
Net Profit after Tax 0 0 151 151 151 152 170 140 153 166 178 191
(b) Min.
Year 2004 2005 2006 2007 2008 2009 2010 2011 2012 2013 2014 2015Asset 779 3.024 3.048 3.072 3.096 2,895 2.709 2.528 2.359 2,203 2.057 1.926
Current Asset 0 0 311 622 933 1.018 1.118 1.223 1.340 1.470 1.610 1.765Cash 0 0 289 600 911 996 1.096 1,201 1.318 1.448 1.588 1,743Account receivable 0 0 22 22 22 22 22 22 22 22 22 22Inventory of Materials 0 0 0 0 0 0 0 0 0 0 0 0Inventory of Products 0 0 0 0 0 0 0 0 0 0 0 0
Fixed Asset 779 3.024 3.024 3.024 3.024 3.024 3.024 3.024 3.024 3.024 3.024 3.024Land 0 0 0 0 0 0 0 0 0 0 0 0Building 328 328 328 328 328 328 328 328 328 328 328 328Plant 451 2.256 2.256 2.256 2.256 2.256 2.256 2.256 2.256 2.256 2.256 2.256Other Machinery 0 438 438 438 438 438 438 438 438 438 438 438Preoperation Cost 0 0 0 0 0 0 0 0 0 0 0 0IDG 0 2 2 2 2 2 2 2 2 2 2 2
Deprec. and Amort. 0 0 -287 -574 -861 -1.147 -1.433 -1.719 -2.005 -2.291 -2.577 -2.863Liability and Equity 779 3.024 3.048 3.072 3.096 2.895 2.709 2.528 2.359 2.203 2.057 1.926Liability 23 2.266 2.266 2.266 2.266 2.040 1.812 1.586 1.360 1.134 906 680
Current Liability 0 0 0 0 0 0 0 0 0 0 0 0Account Payable 0 0 0 0 0 0 0 0 0 0 0 0Short Term Loan 0 0 0 0 0 0 0 0 0 0 0 0
Fixed Liability 23 2.266 2.266 2.266 2.266 2.040 1.812 1.586 1.360 1.134 906 680Long Term Loan 23 2.266 2.266 2.266 2.266 2.040 1.812 1.586 1.360 1.134 906 680
Stock Holders' Equity 756 758 782 806 830 855 897 942 999 1.069 1.151 1.246Share Capital 756 758 758 758 758 758 758 758 758 758 758 758Retained Earning 0 0 0 24 48 72 97 139 184 241 311 393Net Profit after Tax 0 0 24 24 24 25 42 45 57 70 82 95
-4-13-

Table 4.1.3-10 Cash Flow Sheet d.P.P. FBB Type)
(Unit:¥Milhon)
(a) Max.
Year 2004 2005 2006 2007 2008 2009 2010 2011 2012 2013 2014 2015Source of Fund 779 2.245 621 621 621 621 621 621 621 621 621 621
Cash from Operation 0 0 621 621 621 621 621 621 621 621 621 621Operation Profit 0 0 334 334 334 335 335 335 335 335 335 335Depreciation 0 0 286 286 286 286 286 286 286 286 286 286Amortization 0 0 1 1 1 0 0 0 0 0 0 0
Financial Resources 779 2.245 0 0 0 0 0 0 0 0 0 0Share Capital 756 2 0 0 0 0 0 0 0 0 0 0Long term Loan 23 2.243 0 0 0 0 0 0 0 0 0 0Short Term Loan 0 0 0 0 0 0 0 0 0 0 0 0
Increase of Account Payable 0 0 0 0 0 0 0 0 0 0 0 0Use of Fund 779 2.245 210 183 183 409 393 421 408 395 385 370
Fixed Asset Investment 779 2.245 0 0 0 0 0 0 0 0 0 0Land 0 0 0 0 0 0 0 0 0 0 0 0Building 328 0 0 0 0 0 0 0 0 0 0 0Plant 451 1.805 0 0 0 0 0 0 0 0 0 0Other Machinery 0 438 0 0 0 0 0 0 0 0 0 0Preoperation Cost 0 0 0 0 0 0 0 0 0 0 0 0IDC 0 2 0 0 0 0 0 0 0 0 0 0
Increase of Current Asset 0 0 27 0 0 0 0 0 0 0 0 0Inc. Account receivable 0 0 27 0 0 0 0 0 0 0 0 0Inc. Product Inventory 0 0 0 0 0 0 0 0 0 0 0 0Inc. Material Inventory 0 0 0 0 0 0 0 0 0 0 0 0
Inc. of Debt Service 0 0 176 176 176 402 386 366 349 331 316 296Repayment L-term Loan 0 0 0 0 0 226 228 226 226 226 228 226Repayment S-term Loan 0 0 0 0 0 0 0 0 0 0 0 0Interest L-term Loan 0 0 176 176 176 176 158 140 123 105 88 70Interest S-term Loan 0 0 0 0 0 0 0 0 0 0 0 0
Income Tax 0 0 7 7 7 7 7 55 59 64 69 74Cash Increase 0 0 411 438 438 212 228 200 213 226 236 251Cash Balance Bgn. 0 0 0 411 849 1.287 1.499 1.727 1.927 2,140 2.366 2.602Cash Balance End 0 0 411 849 1.287 1.499 1.727 1.927 2.140 2.366 2.602 2.853
(b) Min.
Year 2004 2005 2006 2007 2008 2009 2010 2011 2012 2013 2014 2015Source of Fund 779 2.245 488 488 488 488 488 488 488 488 488 488
Cash from Operation 0 0 488 488 488 488 488 488 488 488 488 488Operation Profit 0 0 201 201 201 202 202 202 202 202 202 202Depreciation 0 0 286 286 286 286 286 286 286 286 286 286Amortization 0 0 1 1 1 0 0 0 0 0 0 0
Financial Resources 779 2.245 0 0 0 0 0 0 0 0 0 0Share Capital 756 2 0 0 0 0 0 0 0 0 0 0Long term Loan 23 2.243 0 0 0 0 0 0 0 0 0 0Short Term Loan 0 0 0 0 0 0 0 0 0 0 0 0
Increase of Account Payable 0 0 0 0 0 0 0 0 0 0 0 0Use of Fund 779 2.245 199 177 177 403 388 383 371 358 348 333
Fixed Asset Investment 779 2.245 0 0 0 0 0 0 0 0 0 0
Land 0 0 0 0 0 0 0 0 0 0 0 0Building 328 0 0 0 0 0 0 0 0 0 0 0Plant 451 1.805 0 0 0 0 0 0 0 0 0 0Other Machinery 0 438 0 0 0 0 0 0 0 0 0 0Preoperation Cost 0 0 0 0 0 0 0 0 0 0 0 0IDC 0 2 0 0 0 0 0 0 0 0 0 0
Increase of Current Asset 0 0 22 0 0 0 0 0 0 0 0 0
Inc. Account receivable 0 0 22 0 0 0 0 0 0 0 0 0
Inc. Product Inventory 0 0 0 0 0 0 0 0 0 0 0 0
Inc. Material Inventory 0 0 0 0 0 0 0 0 0 0 0 0
Inc. of Debt Service 0 0 176 176 176 402 386 366 349 331 316 296Repayment L-term Loan 0 0 0 0 0 226 228 226 226 226 228 226Repayment S-term Loan 0 0 0 0 0 0 0 0 0 0 0 0
Interest L-term Loan 0 0 176 176 176 176 158 140 123 105 88 70Interest S-term Loan 0 0 0 0 0 0 0 0 0 0 0 0
Income Tax 0 0 1 1 1 1 2 17 22 27 32 37Cash Increase 0 0 289 311 311 85 100 105 117 130 140 155Cash Balance Bgn. 0 0 0 289 600 911 996 1,096 1.201 1.318 1.448 1.588Cash Balance End 0 0 289 600 911 996 1.096 1.201 1.318 1.448 1.588 1.743
— 4 —14 —

Table 4.1.3-11 Income Statement G.P.P. Stoker Type)
(Uni1>¥Million)
(a) Max.
Year 2004 2005 2006 2007 2008 2009 2010 2011 2012 2013 2014 2015Sales Revenue 0 0 833 833 833 833 833 833 833 833 833 833Total Cost of Sales 0 0 509 509 509 508 508 508 508 508 508 508
Variable Cost 0 0 206 206 206 206 206 206 206 206 206 206EFB Transport 0 0 201 201 201 201 201 201 201 201 201 201Maintenance 0 0 4 4 4 4 4 4 4 4 4 4BU Maintenance 0 0 1 1 1 1 1 1 1 1 1 1
Fixed Cost 0 0 303 303 303 302 302 302 302 302 302 302Labor 0 0 4 4 4 4 4 4 4 4 4 4BU Labor 0 0 4 4 4 4 4 4 4 4 4 4Depreciation 0 0 294 294 294 294 294 294 294 294 294 294Amortization 0 0 1 1 1 0 0 0 0 0 0 0
Inc. of Prod. Inventory 0 0 0 0 0 0 0 0 0 0 0 0Profit on Sales 0 0 324 324 324 325 325 325 325 325 325 325
Sales & Admin. Cost 0 0 25 25 25 25 25 25 25 25 25 25General Cost 0 0 25 25 25 25 25 25 25 25 25 25
Operation Profit 0 0 299 299 299 300 300 300 300 300 300 300Interest on L-Loan 0 0 180 180 180 180 162 144 126 108 90 72Interest on S-Loan 0 0 0 0 0 0 0 0 0 0 0 0
Net Profit before Tax 0 0 119 119 119 120 138 156 174 192 210 228Income Tax 0 0 5 5 5 5 6 44 49 54 59 64Net Profit after Tax 0 0 114 114 114 115 132 112 125 138 151 164
(b) Min.
Year 2004 2005 2006 2007 2008 2009 2010 2011 2012 2013 2014 2015Sales Revenue 0 0 705 705 705 705 705 705 705 705 705 705Total Cost of Sales 0 0 511 511 511 510 510 510 510 510 510 510
Variable Cost 0 0 206 206 206 206 206 206 206 206 206 206EFB Transport 0 0 201 201 201 201 201 201 201 201 201 201Maintenance 0 0 4 4 4 4 4 4 4 4 4 4BU Maintenance 0 0 1 1 1 1 1 1 1 1 1 1
Fixed Cost 0 0 305 305 305 304 304 304 304 304 304 304Labor 0 0 6 6 6 6 6 6 6 6 6 6BU Labor 0 0 4 4 4 4 4 4 4 4 4 4Depreciation 0 0 294 294 294 294 294 294 294 294 294 294Amortization 0 0 1 1 1 0 0 0 0 0 0 0
Inc. of Prod. Inventory 0 0 0 0 0 0 0 0 0 0 0 0Profit on Sales 0 0 194 194 194 195 195 195 195 195 195 195
Sales & Admin. Cost 0 0 21 21 21 21 21 21 21 21 21 21General Cost 0 0 21 21 21 21 21 21 21 21 21 21
Operation Profit 0 0 173 173 173 174 174 174 174 174 174 174Interest on L-Loan 0 0 180 180 180 180 162 144 126 108 90 72Interest on S-Loan 0 0 0 0 0 0 0 0 0 0 0 0
Net Profit before Tax 0 0 -7 -7 -7 -6 12 30 48 66 84 102Income Tax 0 0 0 0 0 0 1 8 13 18 24 29Net Profit after Tax 0 0 -7 -7 -7 -6 11 22 35 48 60 73
—4 —15 —

Table 4.1.3-12 Balance Sheet C.P.P. Stoker Type)
(Unit;¥Million)
(a) Max.
Year 2004 2005 2006 2007 2008 2009 2010 2011 2012 2013 2014 2015800 3.104 3.218 3.332 3.446 3.329 3.228 3.107 2.999 2.905 2824 2755
Current Asset 0 0 409 818 1.227 1.404 1.597 1.770 1.956 2156 2.369 2594Cash 0 0 385 794 1.203 1.380 1,573 1.746 1.932 2.132 2.345 2570Account receivable 0 0 24 24 24 24 24 24 24 24 24 24Inventory of Materials 0 0 0 0 0 0 0 0 0 0 0 0Inventory of Products 0 0 0 0 0 0 0 0 0 0 0 0
Fixed Asset 800 3.104 3.104 3.104 3.104 3.104 3.104 3.104 3.104 3.104 3.104 3.104Land 0 0 0 0 0 0 0 0 0 0 0 0Building 337 337 337 337 337 337 337 337 337 337 337 337Plant 463 2,316 2.316 2,316 2.316 2,316 2.316 2.316 2.316 2.316 2.316 2,316Other Machinery 0 449 449 449 449 449 449 449 449 449 449 449Preoperation Cost 0 0 0 0 0 0 0 0 0 0 0 0IDG 0 2 2 2 2 2 2 2 2 2 2 2
Decree, and Amort. 0 0 -295 -590 -885 -1.179 -1.473 -1.767 -2.061 -2.355 -2.649 -2.943Liability and Equity 800 3.104 3.218 3.332 3.446 3.329 3.228 3.107 2.999 2.905 2824 2.755Liability 24 2.326 2.326 2.326 2,326 2.094 1.861 1.628 1.395 1.163 931 698
Current Liability 0 0 0 0 0 0 0 0 0 0 0 0Account Payable 0 0 0 0 0 0 0 0 0 0 0 0Short Term Loan 0 0 0 0 0 0 0 0 0 0 0 0
Fixed Liability 24 2.326 2.326 2.326 2.326 2.094 1.861 1.628 1.395 1.163 931 698Long Term Loan 24 2.326 2.326 2.326 2,326 2.094 1.861 1.628 1.395 1.163 931 698
Stock Holders' Equity 776 778 892 1.006 1.120 1.235 1.367 1.479 1.604 1.742 1.893 2.057Share Capital 776 778 778 778 778 778 778 778 778 778 778 778Retained Earning u 0 u nr 22o 342 457 559 701 525 954 1.115Net Profit after Tax 0 0 114 114 114 115 132 112 125 138 151 164
(b) Min.
Year 2004 2005 2006 2007 2008 2009 2010 2011 2012 2013 2014 2015800 3.104 3.097 3.090 3.083 2.845 2.623 2.412 2.214 2.030 1.858 1.698
Current Asset 0 0 288 576 864 920 992 1.075 1.171 1.281 1.403 1.537Cash 0 0 268 556 844 900 972 1.055 1,151 1.261 1.383 1.517Account receivable 0 0 20 20 20 20 20 20 20 20 20 20Inventory of Materials 0 0 0 0 0 0 0 0 0 0 0 0Inventory of Products 0 0 0 0 0 0 0 0 0 0 0 0
Fixed Asset 800 3.104 3.104 3.104 3.104 3.104 3.104 3.104 3,104 3.104 3.104 3.104Land 0 0 0 0 0 0 0 0 0 0 0 0Building 337 337 337 337 337 337 337 337 337 337 337 337Plant 463 2.316 2.316 2,316 2,316 2.316 2.316 2.316 2,316 2.316 2.316 2.316Other Machinery 0 449 449 449 449 449 449 449 449 449 449 449Preoperation Cost 0 0 0 0 0 0 0 0 0 0 0 0IDC 0 2 2 2 2 2 2 2 2 2 2 2
Deprec. and Amort. 0 0 -295 -590 -885 -1.179 -1.473 -1.767 -2,061 -2.355 -2.649 -2.943Liability and Equity 800 3.104 3.097 3.090 3.083 2.845 2.623 2.412 2.214 2.030 1.858 1.698Liability 24 2.326 2.326 2.326 2.326 2.094 1.861 1.628 1.395 1.163 931 698
Current Liability 0 0 0 0 0 0 0 0 0 0 0 0Account Payable 0 0 0 0 0 0 0 0 0 0 0 0Short Term Loan 0 0 0 0 0 0 0 0 0 0 0 0
Fixed Liability 24 2.326 2,326 2.326 2.326 2.094 1.861 1.628 1.395 1,163 931 698Long Term Loan 24 2.326 2.326 2.326 2.326 2.094 1.861 1,628 1.395 1.163 931 698
Stock Holders' Equity 776 778 771 764 757 751 762 784 819 867 927 1.000Share Capital 776 778 778 778 778 778 778 778 778 778 778 778Retained Earning 0 0 0 -7 -14 -21 -27 -16 6 41 89 149Net Profit after Tax 0 0 -7 -7 -7 -6 11 22 35 48 60 73

Table 4.1.3-13 Cash Flow Sheet (I.P.P. Stoker Type)
(Unit:¥Milhon)
(a) Max.
Year 2004 2005 2006 2007 2008 2009 2010 2011 2012 2013 2014 2015Source of Find 800 2.304 594 594 594 594 594 594 594 594 594 594
Cash from Operation 0 0 594 594 594 594 594 594 594 594 594 594Operation Profit 0 0 299 299 299 300 300 300 300 300 300 300Depreciation 0 0 294 294 294 294 294 294 294 294 294 294Amortization 0 0 1 1 1 0 0 0 0 0 0 0
Financial Resources 800 2.304 0 0 0 0 0 0 0 0 0 0Share Capital 776 2 0 0 0 0 0 0 0 0 0 0Long term Loan 24 2.302 0 0 0 0 0 0 0 0 0 0Short Term Loan 0 0 0 0 0 0 0 0 0 0 0 0
Increase of Account Payable 0 0 0 0 0 0 0 0 0 0 0 0Use of Fund 800 2.304 209 185 185 417 401 421 408 394 381 369
Fixed Asset Investment 800 2.304 0 0 0 0 0 0 0 0 0 0
Land 0 0 0 0 0 0 0 0 0 0 0 0
Guiding 337 0 0 0 0 0 0 0 0 0 0 0
Plant 463 1.853 0 0 0 0 0 0 0 0 0 0Other Machinery 0 449 0 0 0 0 0 0 0 0 0 0Preoperation Cost 0 0 0 0 0 0 0 0 0 0 0 0IDC 0 2 0 0 0 0 0 0 0 0 0 0
Increase of Cirrent Asset 0 0 24 0 0 0 0 0 0 0 0 0Inc. Account receivable 0 0 24 0 0 0 0 0 0 0 0 0Inc. Product Inventory 0 0 0 0 0 0 0 0 0 0 0 0
Inc. Material Inventory 0 0 0 0 0 0 0 0 0 0 0 0
Inc. of Debt Service 0 0 180 180 180 412 395 377 359 340 322 305Repayment L-term Loan 0 0 0 0 0 232 233 233 233 232 232 233
Repayment S-term Loan 0 0 0 0 0 0 0 0 0 0 0 0
Interest L-term Loan 0 0 180 180 180 180 162 144 126 108 90 72Interest S-term Loan 0 0 0 0 0 0 0 0 0 0 0 0
Income Tax 0 0 5 5 5 5 6 44 49 54 59 64Cash Increase 0 0 385 409 409 177 193 173 186 200 213 225Cash Balance Bgn. 0 0 0 385 794 1.203 1.380 1.573 1.746 1.932 2.132 2.345Cash Balance End 0 0 385 794 1.203 1.380 1.573 1.746 1.932 2.132 2.345 2.570
(b) Min.
Year 2004 2005 2006 2007 2008 2009 2010 2011 2012 2013 2014 2015Source of Fund 800 2.304 468 468 468 468 468 468 468 468 468 468
Cash from Operation 0 0 468 468 468 468 468 468 468 468 468 468Operation Profit 0 0 173 173 173 174 174 174 174 174 174 174Depreciation 0 0 294 294 294 294 294 294 294 294 294 294Amortization 0 0 1 1 1 0 0 0 0 0 0 0
Financial Resources 800 2.304 0 0 0 0 0 0 0 0 0 0Share Capital 776 2 0 0 0 0 0 0 0 0 0 0Long term Loan 24 2.302 0 0 0 0 0 0 0 0 0 0Short Term Loan 0 0 0 0 0 0 0 0 0 0 0 0
Increase of Account Payable 0 0 0 0 0 0 0 0 0 0 0 0Use of Fund 800 2.304 200 180 180 412 396 385 372 358 346 334
Fixed Asset Investment 800 2.304 0 0 0 0 0 0 0 0 0 0
Land 0 0 0 0 0 0 0 0 0 0 0 0
Building 337 0 0 0 0 0 0 0 0 0 0 0
Plant 463 1,853 0 0 0 0 0 0 0 0 0 0
Other Machinery 0 449 0 0 0 0 0 0 0 0 0 0
Preoperation Cost 0 0 0 0 0 0 0 0 0 0 0 0
IDC 0 2 0 0 0 0 0 0 0 0 0 0
Increase of Current Asset 0 0 20 0 0 0 0 0 0 0 0 0
Inc. Account receivable 0 0 20 0 0 0 0 0 0 0 0 0
Inc. Product Inventory 0 0 0 0 0 0 0 0 0 0 0 0
Inc. Material Inventory 0 0 0 0 0 0 0 0 0 0 0 0Inc. of Debt Service 0 0 180 180 180 412 395 377 359 340 322 305
Repayment L-term Loan 0 0 0 0 0 232 233 233 233 232 232 233Repayment S-term Loan 0 0 0 0 0 0 0 0 0 0 0 0
Interest L-term Loan 0 0 180 180 180 180 162 144 126 108 90 72Interest S-term Loan 0 0 0 0 0 0 0 0 0 0 0 0
Income Tax 0 0 0 0 0 0 1 8 13 18 24 29Cash Increase 0 0 268 288 288 56 72 83 96 110 122 134Cash Balance Bgn. 0 0 0 268 556 844 900 972 1.055 1.151 1.261 1.383Cash Balance End 0 0 268 556 844 900 972 1.055 1.151 1.261 1.383 1.517
— 4 —17 —

Table 4.1.3-14 Internal Rate of Return (Ind. owned RR FBB Type)
(a) Max. before Tax
*** Return on Investment before Tax *** ________________ _________________________8.47%
yearFixed
Asset
Incr.WorkingCapital
Profitbefore
Tax
Deprec.and
Amort.
Interest
Debt
Returnbefore
Tax
Discount
Factor
Present
Value1 2004 568 0 0 0 0 -568 1.000 -5682 2005 1,637 0 0 0 0 -1,637 0.922 -1,5093 2006 0 0 6 209 128 343 0.850 2924 2007 0 0 6 209 128 343 0.783 2695 2008 0 0 6 209 128 343 0.722 2486 2009 0 0 6 209 128 343 0.666 2287 2010 0 0 19 209 115 343 0.614 2118 2011 0 0 31 209 103 343 0.566 1949 2012 0 0 44 209 90 343 0.522 179
10 2013 0 0 57 209 77 343 0.481 16511 2014 0 0 70 209 64 343 0.443 15212 2015 0 0 83 209 51 343 0.409 140
(b) Max. after Tax
*** Return on Investment after Tax ***___________________________________________________8.08%
yearFixed
Asset
Incr.WorkingCapital
Profitbefore
Tax
Deprec.and
Amort.
Interest
Debt
Returnbefore
Tax
Discount
Factor
Present
Value1 2004 568 0 0 0 0 -568 1.000 -5682 2005 1,637 0 0 0 0 -1,637 0.925 -1,5153 2006 0 0 6 209 128 343 0.856 2944 2007 0 0 6 209 128 343 0.792 2725 2008 0 0 6 209 128 343 0.733 2516 2009 0 0 6 209 128 343 0.678 2337 2010 0 0 18 209 115 342 0.627 2158 2011 0 0 22 209 103 334 0.580 1949 2012 0 0 32 209 90 331 0.537 178
10 2013 0 0 41 209 77 327 0.497 16211 2014 0 0 50 209 64 323 0.460 14912 2015 0 0 60 209 51 320 0.425 136
-4-18-

Table 4.1.3-15 Internal Rate of Return (Ind.-owned RR FBB Type)
(a) Min. before Tax
*** Return on Investment before Tax ***_________________________________________________ 3.32%
yearFixed
Asset
Incr.WorkingCapital
Profitbefore
Tax
Deprec.and
Amort
Interest
Debt
Returnbefore
Tax
Discount
Factor
Present
Value1 2004 568 0 0 0 0 -568 1.000 -5682 2005 1,637 0 0 0 0 -1,637 0.968 -1,5843 2006 0 0 -72 209 128 265 0.937 2484 2007 0 0 -72 209 128 265 0.907 2405 2008 0 0 -72 209 128 265 0.877 2336 2009 0 0 -72 209 128 265 0.849 2257 2010 0 0 -59 209 115 265 0.822 2188 2011 0 0 -47 209 103 265 0.796 2119 2012 0 0 -34 209 90 265 0.770 204
10 2013 0 0 -21 209 77 265 0.745 19711 2014 0 0 -8 209 64 265 0.721 19112 2015 0 0 5 209 51 265 0.698 185
(b) Min. after Tax
*** Return on Investment after Tax ***__________________________________________________ 3.32%
yearFixed
Asset
Incr.WorkingCapital
Profitbefore
Tax
Deprec.and
Amort
Interest
Debt
Returnbefore
Tax
Discount
Factor
Present
Value1 2004 568 0 0 0 0 -568 1.000 -5682 2005 1,637 0 0 0 0 -1,637 0.968 -1,5843 2006 0 0 -72 209 128 265 0.937 2484 2007 0 0 -72 209 128 265 0.907 2405 2008 0 0 -72 209 128 265 0.878 2336 2009 0 0 -72 209 128 265 0.850 2257 2010 0 0 -59 209 115 265 0.822 2188 2011 0 0 -47 209 103 265 0.796 2119 2012 0 0 -34 209 90 265 0.770 204
10 2013 0 0 -21 209 77 265 0.746 19811 2014 0 0 -8 209 64 265 0.722 19112 2015 0 0 4 209 51 264 0.699 184
-4-19-

Table 4.1.3-16 Internal Rate of Return (Ind.-owned RR Stoker Type)
(a) Max. before Tax
*** Return on Investment before Tax ***_________________________________________________ 7.50%
yearFixed
Asset
Incr.WorkingCapital
Profitbefore
Tax
Deprec.and
Amort
Interest
Debt
Returnbefore
Tax
Discount
Factor
Present
Value1 2004 577 0 0 0 0 -577 1.000 -5772 2005 1,659 0 0 0 0 -1,659 0.930 -1,5433 2006 0 0 -9 211 130 332 0.865 2874 2007 0 0 -9 211 130 332 0.805 2675 2008 0 0 -9 211 130 332 0.749 2496 2009 0 0 -9 211 130 332 0.697 2317 2010 0 0 4 211 117 332 0.648 2158 2011 0 0 17 211 104 332 0.603 2009 2012 0 0 30 211 91 332 0.561 186
10 2013 0 0 43 211 78 332 0.522 17311 2014 0 0 56 211 65 332 0.485 16112 2015 0 0 69 211 52 332 0.452 150
(b) Max. after Tax
*** Return on Investment after Tax ***__________________________________________________ 7.20%
yearFixed
Asset
Incr.WorkingCapital
Profitbefore
Tax
Deprec.and
Amort
Interest
Debt
Returnbefore
Tax
Discount
Factor
Present
Value1 2004 577 0 0 0 0 -577 1.000 -5772 2005 1,659 0 0 0 0 -1,659 0.933 -1,5483 2006 0 0 -9 211 130 332 0.870 2894 2007 0 0 -9 211 130 332 0.812 2705 2008 0 0 -9 211 130 332 0.757 2516 2009 0 0 -9 211 130 332 0.706 2357 . 2010 0 0 4 211 117 332 0.659 2198 2011 0 0 12 211 104 327 0.615 2019 2012 0 0 22 211 91 324 0.573 186
10 2013 0 0 31 211 78 320 0.535 17111 2014 0 0 40 211 65 316 0.499 15812 2015 0 0 50 211 52 313 0.466 146
-4-20-

Table 4. 1. 3-17 Internal Rate of Return (Ind. -owned P. P. Stoker Type)
(a) Min. before Tax
*** Return on Investment before Tax ***_________________________________________________ 2.27%
yearFixed
Asset
Incr.WorkingCapital
Profitbefore
Tax
Deprec.and
Amort
Interest
Debt
Returnbefore
Tax
Discount
Factor
Present
Value1 2004 577 0 0 0 0 -577 1.000 -5772 2005 1,659 0 0 0 0 -1,659 0.978 -1,6223 2006 0 0 -87 211 130 254 0.956 2434 2007 0 0 -87 211 130 254 0.935 2375 2008 0 0 -87 211 130 254 0.914 2326 2009 0 0 -87 211 130 254 0.894 2277 2010 0 0 -74 211 117 254 0.874 2228 2011 0 0 -61 211 104 254 0.854 2179 2012 0 0 -48 211 91 254 0.835 212
10 2013 0 0 -35 211 78 254 0.817 20711 2014 0 0 -22 211 65 254 0.799 20312 2015 0 0 -9 211 52 254 0.781 198
(b) Min. after Tax
*** Return on Investment after Tax ***__________________________________________________ 2.27%
yearFixed
Asset
Incr.WorkingCapital
Profitbefore
Tax
Deprec.and
Amort
Interest
Debt
Returnbefore
Tax
Discount
Factor
Present
Value1 2004 577 0 0 0 0 -577 1.000 -5772 2005 1,659 0 0 0 0 -1,659 0.978 -1,6223 2006 0 0 -87 211 130 254 0.956 2434 2007 0 0 -87 211 130 254 0.935 2375 2008 0 0 -87 211 130 254 0.914 2326 2009 0 0 -87 211 130 254 0.894 2277 2010 0 0 -74 211 117 254 0.874 2228 2011 0 0 -61 211 104 254 0.854 2179 2012 0 0 -48 211 91 254 0.835 212
10 2013 0 0 -35 211 78 254 0.817 20711 2014 0 0 -22 211 65 254 0.799 20312 2015 0 0 -9 211 52 254 0.781 198
— 4 — 21 —
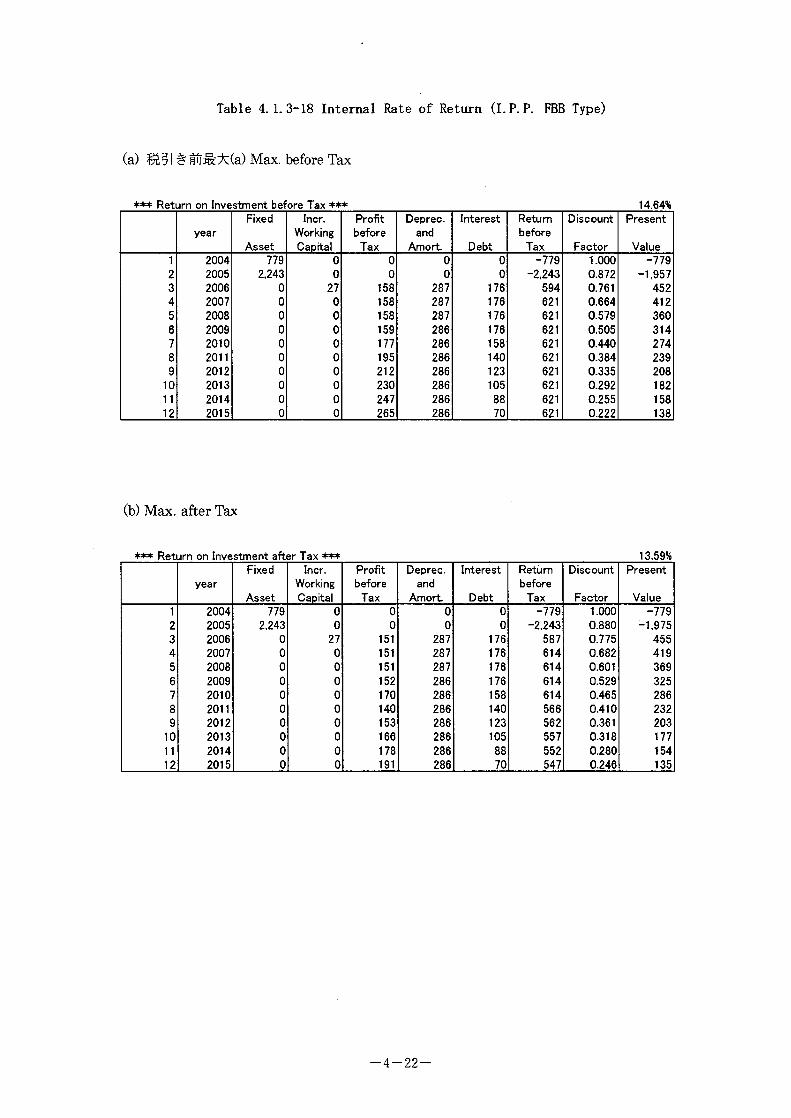
Table 4.1.3-18 Internal Rate of Return (I.P. P. FBB Type)
(a) $£§| # Max. before Tax
*** Return on Investment before Tax ***________________________________________________ 14.64%
yearFixed
Asset
Incr.WorkingCapital
Profitbefore
Tax
Deprec.and
Amort
Interest
Debt
Returnbefore
Tax
Discount
Factor
Present
Value1 2004 779 0 0 0 0 -779 1.000 -7792 2005 2,243 0 0 0 0 -2,243 0.872 -1,9573 2006 0 27 158 287 176 594 0.761 4524 2007 0 0 158 287 176 621 0.664 4125 2008 0 0 158 287 176 621 0.579 3606 2009 0 0 159 286 176 621 0.505 3147 2010 0 0 177 286 158 621 0.440 2748 2011 0 0 195 286 140 621 0.384 2399 2012 0 0 212 286 123 621 0.335 208
10 2013 0 0 230 286 105 621 0.292 18211 2014 0 0 247 286 88 621 0.255 15812 2015 0 0 265 286 70 621 0.222 138
(b) Max. after Tax
*** Return on Investment after Tax ***__________________________________________________13.59%
yearFixed
Asset
Incr.WorkingCapital
Profitbefore
Tax
Deprec.and
Amort.
Interest
Debt
Returnbefore
Tax
Discount
Factor
Present
Value1 2004 779 0 0 0 0 -779 1.000 -7792 2005 2,243 0 0 0 0 -2,243 0.880 -1,9753 2006 0 27 151 287 176 587 0.775 4554 2007 0 0 151 287 176 614 0.682 4195 2008 0 0 151 287 176 614 0.601 3696 2009 0 0 152 286 176 614 0.529 3257 2010 0 0 170 286 158 614 0.465 2868 2011 0 0 140 286 140 566 0.410 2329 2012 0 0 153 286 123 562 0.361 203
10 2013 0 0 166 286 105 557 0.318 17711 2014 0 0 178 286 88 552 0.280 15412 2015 0 0 191 286 70 547 0.246 135
-4-22-

Table 4. 1. 3-19 Internal Rate of Return (I. P. P. FBB Type)
(a) Min. before Tax
*** Return on Investment before Tax ***_________________________________________________ 9.13%
yearFixed
Asset
Incr.WorkingCapital
Profitbefore
Tax
Deprec.and
Amort
Interest
Debt
Returnbefore
Tax
Discount
Factor
Present
Value1 2004 779 0 0 0 0 -779 1.000 -7792 2005 2,243 0 0 0 0 -2,243 0.916 -2,0553 2006 0 22 25 287 176 466 0.840 3914 2007 0 0 25 287 176 488 0.769 3755 2008 0 0 25 287 176 488 0.705 3446 2009 0 0 26 286 176 488 0.646 3157 2010 0 0 44 286 158 488 0.592 2898 2011 0 0 62 286 140 488 0.542 2659 2012 0 0 79 286 123 488 0.497 243
10 2013 0 0 97 286 105 488 0.455 22211 2014 0 0 114 286 88 488 0.417 20412 2015 0 0 132 286 70 488 0.382 187
(b) Min. after Tax
*** Return on Investment after Tax *** 8.64%
yearFixed
Asset
Incr.WorkingCapital
Profitbefore
Tax
Deprec.and
Amort.
Interest
Debt
Returnbefore
Tax
Discount
Factor
Present
Value1 2004 779 0 0 0 0 -779 1.000 -7792 2005 2,243 0 0 0 0 -2,243 0.920 -2,0653 2006 0 22 24 287 176 465 0.847 3944 2007 0 0 24 287 176 487 0.780 3805 2008 0 0 24 287 176 487 0.718 3506 2009 0 0 25 286 176 487 0.661 3227 2010 0 0 42 286 158 486 0.608 2968 2011 0 0 45 286 140 471 0.560 2649 2012 0 0 57 286 123 466 0.515 240
10 2013 0 0 70 286 105 461 0.474 21911 2014 0 0 82 286 88 456 0.437 19912 2015 0 0 95 286 70 451 0.402 181
— 4 — 23 —

Table 4. 1. 3-20 Internal Rate of Return (I. P. P. Stoker Type)
(a) Max. before Tax
*** Return on Investment before Tax ***______________________________ _________________ 12.97%
yearFixed
Asset
her.WorkingCapital
Profitbefore
Tax
Deprec.and
Amort.
Interest
Debt
Returnbefore
Tax
Discount
Factor
Present
Value1 2004 800 0 0 0 0 -800 1.000 -8002 2005 2,302 0 0 0 0 -2,302 0.885 -2,0383 2006 0 24 119 295 180 570 0.784 4474 2007 0 0 119 295 180 594 0.694 4125 2008 0 0 119 295 180 594 0.614 3656 2009 0 0 120 294 180 594 0.543 3237 2010 0 0 138 294 162 594 0.481 2868 2011 0 0 156 294 144 594 0.426 2539 2012 0 0 174 294 126 594 0.377 224
10 2013 0 0 192 294 108 594 0.334 19811 2014 0 0 210 294 90 594 0.295 17512 2015 0 0 228 294 72 594 0.261 155
(b) Max. after Tax
*** Return on Investment after Tax ***___________________________ _____ ________________ 12.07%
yearFixed
Asset
her.WorkingCapital
Profitbefore
Tax
Deprec.and
Amort
Interest
Debt
Returnbefore
Tax
Discount
Factor
Present
Value1 2004 800 0 0 0 0 -800 1.000 -8002 2005 2,302 0 0 0 0 -2,302 0.892 -2,0543 2006 0 24 114 295 180 565 0.796 4504 2007 0 0 114 295 180 589 0.710 4185 2008 0 0 114 295 180 589 0.634 3736 2009 0 0 115 294 180 589 0.566 3337 2010 0 0 132 294 162 588 0.505 2978 2011 0 0 112 294 144 550 0.450 2489 2012 0 0 125 294 126 545 0.402 219
10 2013 0 0 138 294 108 540 0.358 19411 2014 0 0 151 294 90 535 0.320 17112 2015 0 0 164 294 72 530 0.285 151
— 4 — 24 —

Table 4. 1. 3-21 Internal Rate of Return (I. P. P. Stoker Type)
(a) Min. before Tax
*** Return on Investment before Tax *** _____________________________________________7.71%
yearFixed
Asset
Incr.WorkingCapital
Profitbefore
Tax
Deprec.and
Amort
Interest
Debt
Returnbefore
Tax
Discount
Factor
Present
Value1 2004 800 0 0 0 0 -800 1.000 -8002 2005 2,302 0 0 0 0 -2,302 0.928 -2,1373 2006 0 20 -7 295 180 448 0.862 3864 2007 0 0 -7 295 180 468 0.800 3755 2008 0 0 -7 295 180 468 0.743 3486 2009 0 0 -6 294 180 468 0.690 3237 2010 0 0 12 294 162 468 0.641 3008 2011 0 0 30 294 144 468 0.595 2789 2012 0 0 48 294 126 468 0.552 258
10 2013 0 0 66 294 108 468 0.513 24011 2014 0 0 84 294 90 468 0.476 22312 2015 0 0 102 294 72 468 0.442 207
(b) Min. after Tax
*** Return on Investment after Tax ***__________________________________________________ 7.38%
yearFixed
Asset
Incr.WorkingCapital
Profitbefore
Tax
Deprec.and
Amort.
Interest
Debt
Returnbefore
Tax
Discount
Factor
Present
Value1 2004 800 0 0 0 0 -800 1.000 -8002 2005 2,302 0 0 0 0 -2,302 0.931 -2,1443 2006 0 20 -7 295 180 448 0.867 3894 2007 0 0 -7 295 180 468 0.808 3785 2008 0 0 -7 295 180 468 0.752 3526 2009 0 0 -6 294 180 468 0.701 3287 2010 0 0 11 294 162 467 0.652 3058 2011 0 0 22 294 144 460 0.608 2809 2012 0 0 35 294 126 455 0.566 257
10 2013 0 0 48 294 108 450 0.527 23711 2014 0 0 60 294 90 444 0.491 21812 2015 0 0 73 294 72 439 0.457 201
— 4 — 25 —

4.2 Project cost performance effect
4.2.1 Substitute energy effect
Annual energy reduction quantity on crude oil base, the initial investment
amount and annual energy saving effect to the initial investment in this project
facility investment amount are indicated in Table 4.2.1 1.
Table 4.2.1 —1 Cost performance of substitute energy
Unit Industry-owned PP I P P (reference)
Boiler type — EBB Stoker EBB Stoker
Energy reduction k toe/ year 18.79 18.16 34.73 33.12
Initial investment JPY
million
2,204 2,235 3,022 3,101
Cost performance of
substitute energy
toe/ year /
JPY million
8.525 8.125 11.492 10.680
Consequently, as for cost performance on substitute energy effect, it is observed
that the fluidized bed boiler is slightly superior to the other one.
4.2.2 Reduction effect of greenhouse effect gas
Reduction quantity of C02 calculation greenhouse effect gas, and the initial
investment amount and reduction effect of greenhouse effect gas to the initial
investment amount are indicated in Table 4.2.1-2.
Table 4.2.1—2 Cost performance on reduction of greenhouse effect gas
Unit Industry-owned PP I P P (reference)
Boiler type — EBB Stoker EBB Stoker
Reduction of
greenhouse effect gas
t-C02/ year 287,859 273,877 582,713 548,478
Initial investment JPY million 2,204 2,235 3,022 3,101
Cost performance on
reduction effect
t-CCy year /
JPY million
130.61 127.54 192.82 176.87
Consequently, as for cost performance on reduction effect, it is observed that
the fluidized bed boiler is slightly superior to the other one.

4.3 Other
Due to introduction of the subject facility, other effects than mentioned in the
above are in the following:
(1) Due to effective utilization of unutilized energy of EFB, reduction of palm oil
refinery cost can promote while realizing energy saving and consequently,
competitiveness can be increased by retaining stabilization of product cost.
(2) If operation of this subject facility secured a good result, reduction of operation
staff that have been separately allocated at the site can be possible that gives a
good effect to reduction of personnel cost.
(3) Electric supply hours to the residential area for the workers who engage in the
plantations have been limited so far. However, 24 hours electric supply can be
possible due to introduction of the subject facility that securers a good living for
them and activation of the area.
-4-27-

PostscriptInvestment Recovery Period
In case the applicable machines & equipment have been introduced for this Project, the Investment Recovery Period becomes as follows:
(l) In case of private power co-generation/Fluidized bed boiler:
Maximum profit (Income Max. - Expenditure Min) :10 years from commissioning commencing
Minimum profit (Income Min. - Expenditure Max) :13 years from commissioning commencing
(2) In case of private power co-generation/Stoker boiler:
Maximum profit (Income Max. - Expenditure Min) :10 years from commissioning commencing
Minimum profit (Income Min. - Expenditure Max) :14 years from commissioning commencing
(3) In case of IPP co-generation/Fluidized bed boiler (for reference):
Maximum profit (Income Max. - Expenditure Min) :7 years from commissioning commencing
Minimum profit (Income Min. - Expenditure Max) :9 years from commissioning commencing
(4) In case of IPP co-generation/Stoker boiler (for reference):
Maximum profit (Income Max. - Expenditure Min) :8 years from commissioning commencing
Minimum profit (Income Min. - Expenditure Max) :10 years from commissioning commencing
For the details of this calculation, refer to Table 4.31 for private power generation: in case of IPP for reference use, refer to Table 4.3-2.
-4-28-

Table 4.31 Investment Recovery Annual Calculation Sheet (In case of Industry-owned Power Plant)
In the case of FBB (Max.)_________________________________________________________________________________________________________________________________________________ (Unit: Million en)
Year
Start Yet 2006
r2007 2008 2009 2010 2011 2012 2013 2014
Recovery2015
Period
Total Project Cost ▲ 2.206
Expenditure after Commissioning A 291 A 291 A 291 A 291 A 278 A 266 A 253 A 240 A 227 A 214
Merits after Commissioning 506 506 506 506 506 506 506 506 506 506
Total A 1.991 215 215 215 228 240 253 266 279 292
Cumulative amount A 1.991 A 1.776 A 1,561 A 1.346 A 1.118 A 878 A 625 A 359 A 80 212
In the case of FBB (Min.)_____________________________________________________________________________________________________________________________________________________________________________________________________________________________ (Unit: Million en)
Year
Start Yee 2006
r2007 2008 2009 2010 2011 2012 2013 2014 2015 2016 2017
Recovery2018
Period2019 2020
Total Project Cost A 2.206
Expenditure after Commissioning A 291 A 291 A 291 A 291 A 278 A 266 A 253 A 240 A 227 A 214 A 201 A 189 A 176 A 163 A 163
Expenditure after Commissioning 428 428 428 428 428 428 428 428 428 428 428 428 428 428 428
Total A 2.069 137 137 137 150 162 175 188 201 214 227 239 252 265 265
Cumulative amount A 2,069 A 1.932 A 1,795 A 1.658 A 1,508 A 1,346 A 1,171 A 983 A 782 A 568 A 341 A 102 150 415 680
In the case of Stoker (Max.) (Unit: Million en)
Year
Start Ye< 2006
r2007 2008 2009 2010 2011 2012 2013 2014
Recovery2015
Total Project Cost A 2.237
Expenditure after Commissioning A 302 A 302 A 302 A 302 A 289 A 276 A 263 A 250 A 237 A 224
Expenditure after Commissioning 504 504 504 504 504 504 504 504 504 504
Total A 2.035 202 202 202 215 228 241 254 267 280
Cumulative amount A 2.035 A 1,833 A 1.631 A 1.429 A 1,214 A 986 A 746 A 491 A 224 56
In the case of Stoker (Min.)____________________________________________________________________ ' ______________ ___________________________________________________________ (Unit: Million en)
Year
Start Yet 2006
r2007 2008 2009 2010 2011 2012 2013 2014 2015 2016 2017 2018
Recovery2019
Period2020
Total Project Cost A 2.237
Expenditure after Commissioning A 302 A 302 A 302 A 302 A 289 A 276 A 263 A 250 A 237 A 224 A 211 A 198 A 185 A 172 A 172
Expenditure after Commissioning 426 426 426 426 426 426 426 426 426 426 426 426 426 426 426
Total A 2.113 124 124 124 137 150 163 176 189 202 215 228 241 254 254
Cumulative amount A 2.113 A 1.989 A 1.865 A 1.741 A 1.604 A 1.454 A 1.291 A 1.115 A 926 A 724 A 509 A 281 A 40 214 468

Table 4.3 2 Investment Recovery Annual Calculation Sheet
In the case of FBB (Max.)_______________________________________________________________________________________________________________________ ____________________________________________(Unit: Million en)
Year
Start Yei 2006
r2007 2008 2009 2010 2011
Recovery2012
Period2013 2014 2015
Total Project Cost ▲ 3.024
Expenditure after Commissioning ▲ 429 ▲ 429 ▲ 429 A 429 A 411 A 393 A 376 A 358 A 341 A 323
Merits after Commissioning 874 874 874 874 874 874 874 874 874 874
Total ▲ 2.579 445 445 445 463 481 498 516 533 551
Cumulative amount ▲ 2.579 ▲ 2.134 ▲ 1.689 A 1.244 A 781 A 300 198 714 1.247 1,798
In the case of FBB (Min.)____________________________________________________________________________________________________________________________________________________________________ (Unit: Million en)
Year
Start Ye< 2006
r2007 2008 2009 2010 2011 2012 2013
Recovery2014
Period2015
Total Project Cost A 3.024
Expenditure after Commissioning A 427 A 427 A 427 A 427 A 409 A 391 A 374 A 356 A 339 A 321
Expenditure after Commissioning 739 739 739 739 739 739 739 739 739 739
Total A 2.712 312 312 312 330 348 365 383 400 418
Cumulative amount A 2.712 A 2.400 A 2.088 A 1.776 A 1.446 A 1,098 A 733 A 350 50 468
coO
In the case of Stoker (Max.)______________________________________________________________________________________________________________________________________ _________________________ (Unit: Million en)
Year
Start Ye* 2006
r2007 2008 2009 2010 2011 2012
Recovery2013
Period2014 2015
Total Project Cost A 3.104
Expenditure after Commissioning A 419 A 419 A 419 A 419 A 401 A 383 A 365 A 347 A 329 A 311
Expenditure after Commissioning 833 833 833 833 833 833 833 833 833 833
Total A 2.690 414 414 414 432 450 468 486 504 522
Cumulative amount A 2,690 A 2.276 A 1.862 A 1.448 A 1.016 A 566 A 98 388 892 1.414
In the case of Stoker (Min.)________________________________________________________________________________________________________________________________________________________ ________ (Unit: Million en)
Year
Start Ye< 2006
r2007 2008 2009 2010 2011 2012 2013 2014
Recovery2015
Total Project Cost A 3.104
Expenditure after Commissioning A 417 A 417 A 417 A 417 A 399 A 381 A 363 A 345 A 327 A 309
Expenditure after Commissioning 705 705 705 705 705 705 705 705 705 705
Total A 2.816 288 288 288 306 324 342 360 378 396
Cumulative amount A 2.816 A 2.528 A 2,240 A 1.952 A 1.646 A 1.322 A 980 A 620 A 242 154

CHAPTER 5
ASCERTAINMENT OF SPREAD EFFECT
<Abstract>
The possibility of such projects as this one to spread in Malaysia is stated.
The palm oil industry forms the nucleus of Malaysian industries and also produces much waste.Since due support is being given by the Malaysian Government to biomass power generation, much possibility of spread to be attained can been in such projects.
And a fair measure of energy substitution effect and Green House Gases reduction effect, with the spread taken into account, can be expected.

CHAPTER 5 ASCERTAINMENT OF SPREAD EFFECT
5.1 Possibility of Technology Introduced by the Project to Spread in the Country in Question
The Malaysian Government has introduced numerical targets on regenerable energy in its Eighth Malaysian Plan, with 2005 set as the target year.This plan has been made to meet 5% (= 600 MW) of the electric power demand, by the six means: biomass burning generation, garbage burning generation, power generation using gas from landfill sites, solar thermal power generation, wind power generation and small-scale hydraulic power generation.
Especially, among these, the government is concentrating its energies on biomass burning generation, and in order to anchorage biomass burning generation, it has made examinations and adjustment along with related agencies on the following favorable treatment actions, and as a result, as to the palm oil biomass project, a fundamental agreement was reached at the end of February, 2001.
[ Favorable Treatment Actions ] ■
1) Exemption from import duties on equipment related to regenerated energy,
2) Exemption of biomass IPP enterprises from the corporation tax,
3) Duty imposed upon electric power companies, to buy electric energy coming out from biomass generation (0.13 ~ 0.17 RM/kWh).
4) Exemption from taxation of income earned out of biomass burning generation,
5) Prohibition of stand-by charge imposition by electric power companies upon biomass IPP enterprises, and
6) Liability on the electric power company side, to set up and manage the facilities laid between the power generating equipment and the grid of the electric power company.
Palm plantations in Malaysia increased fivefold during 25 years from about642,000 hectare in 1975 to about 3,313,000 hectare in 1999:They kept increasing at an annual rate of 29%.And according to statistics in 1999, 334 palm oil mills are at work and 49 of suchplants are under contemplation or under construction. Thus, it may be supposedthat the palm oil industry in Malaysia will keep extending in future as well.
— 5 — 1 —

Taking into account such support by the Malaysian Government and considering from the fact that the palm oil industry is extending sharply a great possibility of spread can be seen in similar projects.
5.2 Effect with Spread Taken into Account
5.2.1 Energy Substitution Effect
The crop of EFB in the whole of Malaysia is 56,586,300 t/year in 1999, as the up-to-date last statistic.Therefore, the quantity of generated EFB amounts to 14,146,600 t/year, as 23% of the above value, and if the whole quantity can be used effectively, electric power corresponding to 500 MW can be generated.
However, considering from the plant scale, the quantity of FFB treated per one palm oil mill is 184,500 t/year and the quantity of generated EFB is 46,100 t/year per plant, and thus generated power averages a very small value of about 1.7 MW. This means many small businesses are included in the industry and thus it can be concluded in the industry and thus it can be concluded that such projects in question will not spread over the industry.
Namely, the enterprises which such projects would spread to, are limited to several major companies: FELD A, Sime Darby, etc. However, since the total share of these several companies exceeds 70%, electric power corresponding to 350 MW can be generated, theoretically, if these companies enter the IPP business.
Accordingly, in the case of power generation plants with FBB’s, the energy substitution effect resulting from spread effect:
34.73 (k toe/year) x 350 (MW) /16 (MW) ^ 760 (k toe/year), can be obtained.
5.2.2 Green House Gases Reduction Effect
Similarly to 5.2.1, in the EFB burning power generation corresponding to 350 MW the Green House Gases Reduction Effect:
582,713 (t-CO'/year) x 350 (MW) /16 (MW) ^ 12,747,000 (t-CO-/year), can be obtained.
— 5 — 2 —

CHAPTER 6
INFLUENCE OF PROJECT UPON OTHERS
<Abstract>
This chapter describes the influence of this project upon environment aspect, environmental aspect, economical aspect and social aspect as well as alternative energy effect and Green House Gases reduction effect.Since the implementation of this project will become an energy program compatible to the annual project of the Malaysian government, it will bring about a great influence upon national interest of Malaysia and interest of project implementation enterprise.

CHAPTER 6 INFLUENCE OF PROJECT UPON OTHERS
6.1 Influence upon Environmental Aspect
The introduction of EFB-burning co-generation system will bring about the alternative energy saving effect.As a result, it is possible to reduce the NOx, SOx and soot dust generated from the existing diesel generator and boiler.In other words, it is possible to reduce the NOx generated at high concentration from the existing diesel generator and boiler, by generating the power, using the relatively low combustion concentration low-EFB burning boiler, to reduce the SOx generated, by using the EFB containing limited sulfur content in fuel, and further to reduce the soot dust by strengthening the dust collector.Such reduction is as shown in Table 6. IT.
Table 6.11 Improvement in E nvironmental Aspect
Industry-owned PP IPP(reference)Boiler type FBB Stoker FBB StokerReduction inamount of NOx discharged
Tons/year 381 292 949 769
Reduction inamount of SOx discharged
Tons/year 104 80 169 118
Reduction inamount of soot dust discharged
Tons/year 99 58 158 74
-6-1

6.2 Influence upon Economical Aspect
(l) Direct influence
For direct influence of this project upon domestic industry of Malaysia, 60~70% of services/equipment supplied by purchaser are expected to be supplied within Malaysia or neighboring countries.Consequently, the implementation of this project is expected to make a great contribution to the development of industry and to the promotion of employment in Malaysia, particularly in Kalimantan Islands.
(2) Indirect influence
If the effective utilization of coconut husk is circulated due to implementation of this project, the material having been thrown away can be utilized, and it is possible to cut down the expense required for throw away, resulting in the improved profit in palm oil industry.
It is also possible to provide the homes of laborers working at palm plantation, with low cost electricity, which will also lead to the improvement of laborers.For an extreme example, the probable demerit will include the destruction of forest or nature due to excessive industrialization, however, it is hardly said to result from bio mass power generation.
This may be a heavy blow to those who are engaged in the sales of diesel oil.As a whole, however, it is nothing but a slight phenomenon, and is not thought to be a demerit.
— 6—2 —

6.3 Influence upon Social Aspect
Miscellaneous merits which would be given to the social aspect by this Project are thought as follows:
(1) Improvements of the living environmental condition by securing a stabilized electric power source.
(2) In case of IPP, the fulfillment of extended social investments included power transmission lines.
(3) Extension of living zones
(4) Stoppage of excessive population reduction.
(5) Enhancement of national consensus for recycle promotion activities.
(6) Enhancement of boiler operators’ skill.
(7) Increase of employment opportunities
(8) Enhancement of a national sentiment and pride who exercise “Malaysian Volley” in Malaysia.
On the contrary, demerits which might exert adverse influences upon social aspect might include forest destruction and natural destruction caused by excessive industrializationIn this case, however, the destruction is truly not caused by biomass power generation,In fact, this project will exert some economical influences upon the Diesel oil dealers, but this matter is only a micro event.
— 6 — 3 —

CHAPTER 7
OTHERS
<Abstract>
This chapter describes the limit of coconut husk power generation as well as future probable situation in accordance with the total amount of coconut husk (EFB, fiber, shell) generated in whole Malaysia.The effective utilization of coconut husk within the country of Malaysia is expected to be further promoted due to implementation of this project.

CHAPTER 7 OTHERS
7.1 Palm Waste as a Fuel
7.1.1 Yield of FFB
Table 7.1.1.1 and Table 7.1.1.2 shown below indicate the yield of FFB in whole
Malaysia, and that of EFB by object project enterprise (site) respectively.
Table 7.1.1.1 Yield of EFB in whole Malaysia, 1999(tons) 7"1)
Jan. Feb. Mar. Per. May Juno ^jly Aut Seat Oct. Nov. Dec TotalJohor 764.030 794.985 930.481 1.070.117 1.200.242 1.168.110 1.256.639 1.237.990 1.307.813 1.314.659 1.237.553 1.145.660 13.428.279Kedah 28.600 38.962 59.264 66.202 71.565 73.017 70.899 66.676 67.373 59.473 55.255 46.172 702.327Ke lan tan 45.391 50.816 57.729 102.919 116.924 116.242 121.557 127.130 130.400 119.627 105.617 86.798 1.181.060Melaka 13.237 17.267 21.175 23.330 22.086 19.728 20.816 19.329 21.814 20.960 18.713 18.280 236.724NSembilan 126.029 143.824 193.334 243.626 269.738 240.222 215.453 208.306 236.616 263.252 232.612 216.072 2.567.983Pahang 442.104 618.616 668.861 906.034 1.069.426 977.604 934.102 964.738 1.019.168 1.033.600 973.379 896.086 10.371.497Penan* 11.988 14.146 20.496 22.019 26.015 27.660 26.052 24.222 23.637 20.753 19.268 18.774 254.018Perak 348.939 421.891 539.666 613.807 641.417 632.911 664.629 609.631 617.762 546.023 494.819 481.860 6.612.366Selangor 187.811 204.616 265.186 318.819 349.626 321.156 318.309 286.112 298.263 298.351 268.737 251.611 3367 596Terengganu 111.662 119.362 108.132 171.026 207.468 197.968 209.009 231.717 249.084 263.448 229.996 197.537 2.286.399P. Malaysia 2.079.771 2.324.374 2.864.302 3.536.898 3.963.606 3.774.498 3.837.466 3.763.760 3.970.920 3.919.146 3.636.749 3.367.849 41.008.228Sabah 600.247 623.396 836.509 1.200.638 1.318.280 1.223.361 1.169.869 1.190.973 1.316.002 1.368.713 1.308.268 1.227.494 13.381.640Sarawak 114.609 131.348 162.376 190.301 189.318 186.086 183.341 200.809 226.802 227.927 209.063 175.464 2.196.432IMalvasia 714.866 754.744 997.884 1.390.639 1.507.598 1,408.446 1.353.210 1.391.782 1.641.804 1.596.640 1.517.321 1.402.948 15.578.072Malaysia 2.794.627 3.079.118 3.852.186 4.927.737 5.461.104 5.182.944 5.190.675 5.166.532 5.512.724 5.516.786 5.153.070 4.760.797 56 586 300
Table 7.1.1.2 Yield of EFB by object project enterprise, 2000(tons) 7 2)
Jan. Feb M* Aor. May June -illy Aut Sent. Oct. Nov. Dec Totalfrom 6 Mills 74.526 75.792 92.726 127.847 148.869 134.027 141.799 121.869 119.677 104.624 116.592 108.346 1.366.685from 10 Mills 117.372 119.367 146.036 201.348 234.456 211.081 223.322 191.918 188.482 164.774 183.623 170.636 2.152.414
Consequently, the proportion of object project enterprise (site) is only 3.8% as shown
below*
2,152,414/56,585,300 X 100 = 3.8%
7.1.2 Yield of Palm Waste
If the FFB is substituted for 100%, the proportion of Palm Waste generated is as shown
below*
• EFB: 23.0%
• Fiber: 14.6%
• Shell: 7.8%
Accordingly, the Palm Waste generated is calculated as shown in Table 7.1.2 1.
— 7_ 1 —

Table 7.1.2-1 Amount of Palm Waste generated(ton/year)
EFB Fiber Shell TotalWhole Malaysia 13,014,800 8,261,600 4,413,400 25,689,000Total for 10 mills of object enterprise (site)
495,100 314,800 167,900 977,300
7.1.3 Properties of Palm Waste
Table 7.1.31 shows the properties of Palm Waste (re-listing for EFB)
Referring to the below Table. “Mixture” shown in the column means properties when the generated Palm Waste was mixed in proportion to the above-mentioned generating rate.
Items Unit FTB Fiber Shell MixtureTotal moisture content % 64.63 33.75 24.60 47.82Carbon % 16.45 30.01 36.68 24.29Hydrogen % 2.36 4.00 4.71 3.29Oxygen % 14.53 26.21 31.28 21.16Nitrogen % 0.12 0.32 0.07 0.18Sulfur % 0.02 0.05 0.01 0.03Ash content % 1.70 4.22 2.36 2.62Chlorine % 0.12 0.14 0.23 0.14Others % 0.07 1.30 0.05 0.46Total % 100.00 100.00 100.00 100.00Higher calorific value (wet base)
Kcal/kg 1.525 2,944 3.469 2.315
Lower calorific value (wet base) Kcal/kg 1.018 2.532 3.074 1.858Waste compositionSi02 wt% 13.40 66.97 86.24 52.36AI2O3 wt% 5.05 0.89 2.92 2.57Fe20 wt% 1.08 2.23 0.63 1.61CaO wt.% 5.05 6.25 0.83 5.02MgO wt% 11.19 9.15 4.17 9.05Na20 wt% 0.72 0.00 0.00 0.24K2O wt% 63.52 14.51 5.21 29.16SOs wt.% 0.00 0.00 0.00 0.00
Total 100.00 100.00 100.00 100.00
Since the property of Palm Waste is considerably stabilized, and the calorific value of both fiber and shell is high, it is used effectively as a fuel for boiler used to supply the steam for sterilization of FFB at palm oil mill (oil press mill).
-7-2-

7.2 Effective Utilization of Palm Waste
7.2.1 Current EFB Utilization Status
“EFB” has been incinerated in the oil palm mill, and the resulting ash has been reduced in the farm as fertilizer, however, the installation of incineration furnace is prohibited for oil palm mill to be constructed in 1993 and after, as the white smoke discharged from the incineration furnace may result in air pollution.Consequently, a great part of such EFB is subjected to “Malting (composting)” at the farm.
Even for malting, the EFB is similarly thrown away at the circumference of oil coconut.
Since it requires time and labor, the EFB is thrown away along the agricultural road in many cases, resulting in the generation of secondary problems such as spontaneous combustion in dry season, damage of fruit due to massive insect growth, etc.The EFB energy has not been effectively utilized so far due to the following reasons whereas the oil palm wastes such as shell, fiber, etc. have been utilized as power generation source and process steam source for boiler combustion'
• The EFB has a hard fiber and large shape.• It is indispensable to arrange a proper pre-treatment facility before loading the EB
in the furnace, as it contains the water content of over 60%.• The melting point of ash content is low or approx. 1,000° C, thus providing the high
slugging performance within boiler.
7.2.2 Current Palm Waste Utilization Status
A current example of Palm Waste utilization status is shown in Fig.7.2.1-l-(a) and (b).
Fig.7.2.2-1 Current Palm Waste utilization status
(a) In Fig.7-2-2-1 shows a small-scaled company which extracts only the crude palm oil from coconut at its oil extraction mill, where the fiber and waste oil are used for boiler fuel.
(b) in Fig.7.2.21 shows a company which has a process up to final process for palm oil/kernel oil product.
For large-scaled company, the object project enterprise (site) also corresponds to such
— 7—3 —
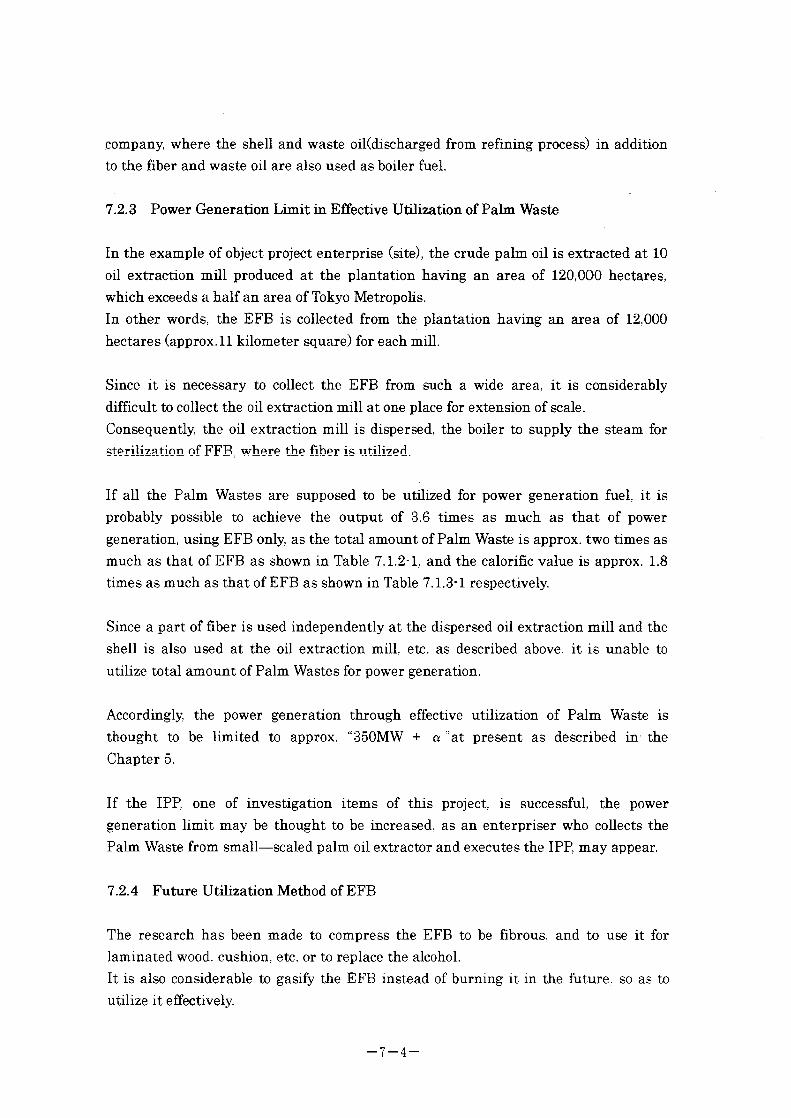
company, where the shell and waste oilCdischarged from refining process) in addition to the fiber and waste oil are also used as boiler fuel.
7.2.3 Power Generation Limit in Effective Utilization of Palm Waste
In the example of object project enterprise (site), the crude palm oil is extracted at 10 oil extraction mill produced at the plantation having an area of 120,000 hectares, which exceeds a half an area of Tokyo Metropolis.In other words, the EFB is collected from the plantation having an area of 12,000 hectares (approx. 11 kilometer square) for each mill.
Since it is necessary to collect the EFB from such a wide area, it is considerably difficult to collect the oil extraction mill at one place for extension of scale. Consequently, the oil extraction mill is dispersed, the boiler to supply the steam for sterilization of FFB, where the fiber is utilized.
If all the Palm Wastes are supposed to be utilized for power generation fuel, it is probably possible to achieve the output of 3.6 times as much as that of power generation, using EFB only, as the total amount of Palm Waste is approx, two times as much as that of EFB as shown in Table 7.1.2-1, and the calorific value is approx. 1.8 times as much as that of EFB as shown in Table 7.1.3-1 respectively.
Since a part of fiber is used independently at the dispersed oil extraction mill and the shell is also used at the oil extraction mill, etc. as described above, it is unable to utilize total amount of Palm Wastes for power generation.
Accordingly, the power generation through effective utilization of Palm Waste is thought to be limited to approx. “350MW + a "at present as described in the Chapter 5.
If the IPP, one of investigation items of this project, is successful, the power generation limit may be thought to be increased, as an enterpriser who collects the Palm Waste from small—scaled palm oil extractor and executes the IPP, may appear.
7.2.4 Future Utilization Method of EFB
The research has been made to compress the EFB to be fibrous, and to use it for laminated wood, cushion, etc. or to replace the alcohol.It is also considerable to gasify the EFB instead of burning it in the future, so as to utilize it effectively.
— 7 — 4 —

For the time being, it is realistic to mainly burn the EFB and to utilize it for heat or power generation.
The methane fermentation power generation technology is available as an effective utilization of organic waste.It is hard to apply the EFB, as it contains a lot of hgnins as the aqueous bio mass.
— 7 — 5 —

CONCLUSIONS

CONCLUSIONS
This report was completed through three-time technological inter-charges on the
survey which was started in September 2000, entrusted by New Energy and
Industrial Technology Development Organization (NEDO) as one of the items of the
“Basic Survey for Promotion of Joint Implementation, etc.” for the international
reduction of Green House Gasses.
The purpose of this survey is to pick out a project which promotes the reduction of
fossil fuel used and Green House Gasses by the introduction of technologies
possessed for petroleum and which can be linked with the future “CDM” through its
contribution to durable economic development and pollution measures in the
partner country.
In FELD A SAHABAT COMPLEX having the palm oil refineries on which this
survey was conducted, a feasibility study was carried out for the case where a EFB
burning private or IPP co-generation equipment is introduced, and a conclusion
was deduced that such introduction is feasible both in technology and in economy or
finance.
The result of this survey shows that by using effectively the unused biomass energy
being dumped, as a matter of fact, into plantations, through the introduction of the
EFB burning co-generation equipment, a fair measure of reduction in the volume of
fossil fuel used and Green House Gases can be expected and that such can also
contribute much to development of the palm oil industry in Malaysia.
To realized this project, a considerable sum of investment is necessary, of the scale
of the plant, and it is fated that a large-scale plant is hard to build because energy
of low quality must be collected from a vast area. However, even if the scale is
small, energy substitution effect and greenhouse effect gas reduction effect can be
attained in a good measure, and this conforms to the energy policy and
environmental improvement policy of the Malaysian Government.
— C— 1 —

This company intents to devote its energies in future toward the realization of this
project, keeping the connections of this company cultivated through this survey,
with FELD A as a company in the partner country, the departments and agencies
concerned of the Malaysian Government, and with the agencies concerned in this
country.
Lastly, we would like to express our deep appreciation to the members of the
agencies concerned in the country including NEDO, the members of the Malaysian
departments and agencies concerned and the persons concerned of FELD A, for
their guidance and cooperation in the execution of this survey.
(END)
— C—2—

List of References
Chapter 1
• 1-1) The Malaysian Economy In Figures 2000 ('v I'—'yTWtfa'teMfr)
-1-2)
. 1-3) h tin • //w w w. iri.co.i n
. 1-4) Industrial Processes and The Environment (DOE)
• 1-5) Malaysia Palm Oil Directory 1999-2000
• 1-6) The 7th Malaysia Plan U—C/T%#)
-1-7) (^y-C/TgB^Z^
mBfzmo#)
Chapter 2
• 2 l) Information Malaysia 2000 (Berita Pubhshing Sdn. Bhd.)
• 2-2) Oil Palm and The Environment (Malaysian Oil Palm Grower’s Council Kuala
Lumpur)
• 2-3) FELDA Annual Report 1999 (FELDA Holdings Bhd.)
• 2-4) Oil Palm Industry in Malaysia (Malaysian Palm Oil Board Ministry of
Primary Industries Malaysia)
-2-5) 3^-^X^)
- 2-6) FELDA ^0%# h)
• 2-7) FPI Annual Report 1999 (FELDA Palm Oil Industry Sdn. Bhd.)
Chapter 5
• 5-1) MALAYSIAN OIL PALM STATISTICS 1999 (19th,Edition)
Chapter 7
• 7-1) MALAYSIAN OIL PALM STATISTICS 1999 (19th,Edition)
• 7-2) Data from FELDA

APPENDIX

Appendix — 1
Report of the 1st Field Survey
KAWASAKI HEAVY INDUSTRIES, LTD.
Purpose of investigation :Prior to commence the Project F/S, the following items were investigated so as to reflect it upon the planning.(a) Conditions of enforcement site (Enterprise)(b) Intentions of Malaysian Government relating agencies(c) Actual status of palm oil industries(d) Others
Areas investigated: Palm oil mill located in the surrounding areas of KualaLumpur, and Sabah State Malaysia
Period Investigated: October 1 ~ October 14, 2000 (including traveling days)
Investigators: KAWASAKI HEAVY INDUSTRIES, LTD.Power Plant DivisionBoiler Plant Dept., Utility Section
Research and Development Dept,, Boiler and Ash Treatment Group
Engineering Support Center Power Plant E & C Dept., Engineering Group
Plant Engineering Sales Division Power Plant Sales Dept. 1, Export Group
Mr. Tsunematsu, Staff Officer
(Team leader)
Mr. Ino Staff Officer
(Sub Team Leader)
Mr. Itoh* Manager (Control)
Mr. Suzuki (Sales)
A—1 — 1

Crushing Plant Division Engineering Department,Research and Development Sect. Mr. Miyoshi +
(Crusher)The Energy Conservation CenterJapan International Energy & EnvironmentCooperation Center,International Engineering Dept. Mr. Komiyama *
(Specialist)Kawasho CorporationPlant Department Mr. Michel Wong
(Assistant Manager)
Note * : Only for investigation at site+ : Only for investigation at Sabah State No marking: All process investigation
including Governmental Agencies
Investigated Enterprises :1) FELDA (Ltd.) (FELDA Palm Industry Sdn Bhd) /KL
Dept./Engineering/Special project /R&D Mr. Subash Sundeaj (Head)Mr. Ahmad Nor Azman Bin Jamin (Mechanical Engineer) Mr. Mohad Redzuan Hassan (Electrical Engineer) Mr. Chong Kow Chia (Environmental Chemist)
2) FELDA SAHABT COMPLEX including FELDA (Ltd.) Palm Oil Mill and Refinery Works.(The following three persons were dispatched from FELDA (Ltd.))
Mr. Ahmad Nor Azman Bin Jamin (Mechanical Engineer) Mr. Mohad Redzuan Hassan (Electrical Engineer) Mr. Chong Kow Chia (Environmental Chemist)
3) Jugra Palm Oil Mill (Ltd.) (EFB combustion fluidized bed boiler exist)
Mr. Lee Che Chuan (Mill Manager of Jugra Palm Oil) Mr. Chew Klan Sang (Szetech Engineering Sdn Bhd) Mr. Tan Kim Hai (Szetech Engineering Sdn Bhd)
4) Sime Darby (Ltd.) Tennamaran Mill (Methane fermenter exist)
A—1—2

Mr. A Balakrisman (Mill Manager)Mr. Dinesh Nair (Maintenance Engineer)Miss Yuzidah (Assistant Engineer)
5) Malaysia Energy Center (Equivalent to NEDO in Japan)Dr. Mohd Zamzam Jaafar (Chief Executive Officer)
6) Malaysian Palm Oil Board (MPOB)Dr. Hamirin Kifli (Director, product development &
advisory servicesDr. Ainier Hj. Kuntom (Head of unit, analytical &
quality dept.)
7) Japanese EmbassyMr. F. Nasuno (Commercial Attache First Secretary)
8) Department of Environmental (DOE)Mr. Shamsuddin Latiff (Deputy Director General) Mr. Aminuddin Bin Ishak, Head Mr. Mobile Source Unit
9) Ministry of Energy (MOE)Mr. Thiyaga Rajian Veluruail (Principal Assistant
Secretary, Energy Division)
Mr. Khairul
Investigation schedule:(a) 10/1 (Sunday) : Moved from Tokyo —» KL(b) 10/2 (Monday : Meeting with FELDA (1st day)(c) 10/3 (Tuesday) : Meeting with FELDA (2nd day)(d) 10/4 (Wednesday): Moved from KL —» SABAH State(e) 10/5 (Thursday) : Investigation on FELDA Mill in SABAH State (B.J)(f) 10/6 (Friday) : Investigation on/around Refinery Mill in SABAH
State(g) 10/7 (Saturday) : Moved from SABAH State —» KL(h) 10/9 (Monday) : Meeting with FELDA (3rd day)(i) 10/10 (Tuesday) : Visited to Jugra Palm Oil Mill(j) 10/11 (Wednesday): Visited to Tennamaran Mill (Sime Darby Plantation)
also visited to Malaysia Energy Centre

(k) 10/12 (Thursday) : Visited to Malaysian Palm Oil Board (MPOB)also visited to Japanese Embassy
(l) 10/13 (Friday) : Visited to Department of Environmental (DOE)Moved from KL —* Tokyo
(1) 10/14 (Saturday): Arrived Narita Airport Japan
Investigated items:1. Meeting with FELDA (Ltd.) (10/2, 10/3. 10/9 : 3 days)
(1) Investigation on outline of FELDA (Ltd.)(2) Investigation on tax payment(3) Investigation on machine & equipment design conditions
2. Investigation on FELDA Mill in SABAH State (10/15)(1) Investigation on machine & equipment in B Mill(2) Investigation on machine & equipment in J Mill (Most Advanced
Mill)
3. Investigation on Palm oil refinery mill FELDA Mill in SABAH State and surrounding area (10/6)(1) Investigation on refinery machine & equipment(2) Investigation on kernel crushing mill(3) Investigation on Bulkers
4. Visited to Jugra Palm Oil Mill and other places (10/10)(1) Investigation on factories(2) Investigation on FBC in general : Installation of MILL drain
treatmentand steam source
(3) Investigation on FBC problems : Agglomeration was generated. As a result, only two hours are operable.
(4) Investigation on EFB upper stream process.
5. Visited to Tennamaan Mill (Sime Darby Plantation) (10/11 at a.m.)(l) Investigation on EFB combustion boiler :
We have heard that there was a Mill site that EFB was burning by using a stoker boiler, we immediately visited the Mill.We found that, actually, shell & fiber only are burnt out by means of the stoker boiler. Then EFB was utilized by malting (returning to plantation, or disposed around palm trees'- fertilization by natural
A—1—4

contamination by returning to soil) only.(2) Investigation on biomass machines & equipment.(3) Investigation on outline of companies:
Sime Darby owns several mills:six mills in Malaysia, 2 mills in SABAH State, one mill in Indonesia.Sime Darby also owns refinery mills in Johole, Taiwan, Hong Kong, and Egypt.Mill products are transported to separate companies.
6. Visited to Malaysia Energy Center (10/11 at p.m.)(1) Explanation of details of meeting with FELDA (by KHI)(2) Explanation of how to obtain advices and authorization (by MEC)
Visited to Malaysia Palm 0^ Rnorrl /MPAR)'VUl U \X1An/io o +
(1) Explanation of details of meeting with FELDA (by KHI)(2) Activities of MPOB (by MPOB)(3) Details of MPOB enforcement study (by MPOB)
8. Visited to Japanese Embassy (10/12 at p.m.)(1) Rewarding visit and meeting(2) Explanation of this Project (by KHI)(3) Outline of energy policy in Malaysia
9. Visited to Department of Environment (DOE) (10/13 at a.m.)(1) Explanation of this Project (by KHI)(2) Heard explanation of regulation for palm oil industries from DOE.(3) Purchased documents concerning environmental regulations
10. Visited to Ministry of Energy (MOE) (10/13 at a.m.)(1) Explanation of this Project (by KHI)(2) Advice transmitted from MOE(3) Explanation of 8th Malaysian Plan Policy (from MOE)
A—1—5

Appendix— 2
Report of the 2nd Field Survey
KAWASAKI HEAVY INDUSTRIES, LTD.
Purpose of investigation:Based on the design condition in conformity with the “First Time InvestigationReport at Site” , KHI s outline of planning is explained in the “Interim Report”.Then in answering to questions, the other partner's intentions have been examined with questions and answers.
Areas investigated:Malaysia/ Kuala Lumpur
Period investigated:December 4 ~ December 8, 2000 (including traveling days)
Investigators: KAWASAKI HEAVY INDUSTRIES, LTD.Power Plant DivisionBoiler Plant Dept., Utility Section Mr. Tsunematsu,
Staff Officer (Team leader)
Research and Development Dept,,Boiler and Ash Treatment Group Mr. Inoh
Staff Officer (Sub Team Leader)
Mr. Taniguchi Assistant Manager (Analysis and Test)
Engineering Support Center Power Plant E & C Dept.,Engineering Group Mr. Umeki
Assistant Manager (Control)
A- 2 -1

Plant Engineering Sales Division Power Plant Sales Dept. 1,Export Group Mr. Suzuki *
(Sales)
Kawasho CorporationPlant Department Mr. Kobayashi
Manager(Attended only on
December 5) Mr. Michel Wong
(Assistant Manager)
Note * : Attended and investigated at site only on December 4, 5, and 6, 2000
Investigated enterprises:FELDA (Ltd.) (FELDA Palm Industry Sdn Bhd) /KL Dept./Engineering/Special project /R&D
Mr. Subash Sundeaj (Head)Mr. Ahmad Nor Azman Bin Jamin (Mechanical Engineer) Mr. Mohad Redzuan Hassan (Electrical Engineer) Mr. Chong Kow Chia (Environmental Chemist)
Investigation schedule:(a) December 4 (Monday) : Moved from Narita Airport —» (Kuala Lumpur)
(b) December 5 (Tuesday) : Explanation of outline of Project plan for FELDAtogether with questions and answers (1st day)
(c) December 6 (Wednesday) : Explanation of outline of Project plan for FELDAtogether with questions and answers (2nd day) Minute was prepared and agreement concluded.
(d) December 7 (Thursday) : Visited to FELDA (Ltd.) Palm Oil Museum.Prepared documents were arranged.Moved to Airport at night for departure. (Kuala Lumpur —» Narita Airport Japan)
(e) December 8 (Friday) : Arrived to Narita Airport Japan
A- 2-2

Investigated items:Based on the design condition in conformity with the “First Time Investigation Report at Site” , KHI’s outline of planning is explained in the “Interim Report”.Then in questions and answers, the design condition change was proposed by FELDA (Ltd.).Then the results were written in the Minutes of Meeting, of which details are shown below:
(a) Steam condition: Steam pressure, 62 bar (g) —» Max. 600 psi = 41 bar (g)( 62 bar (g) pressure is too high to use by FELDA. that is, FELDA operators are afraid of to apply such high-pressure)
(b) Supplied steam amount : 18 t/h —» 16 t/h
(c) Power demand : Max. 6.95 MW —» 5.19 MW(However, generating output 7 MW without steam supply is not varied.Then based on it, if power transmission is short, at 16t/h steam supply, the power may be backed up by DG)
(d) Used palm waste '• In case of IPP, EFB + Fiber + Shell are used as fuel —» only EFB (However, sludge oil may be used)
(e) Seasonal fluctuations of EFB : Malaysia palm oil board (MPOB) data —» This time FELDA proposed data.
(f) Loading applied to FEB seasonal fluctuations : Shortage period is backed up by power DG. —* At palm oil mill, EFB may be stored for a long period of time, which may be used adequately so as to cover seasonal EFB shortage.
A- 2-3

Appendix— 3
Report of the 3rd Field Survey
KAWASAKI HEAVY INDUSTRIES, LTD.
Purpose of investigation :Based on the design condition in conformity with the “Second Time Investigation Report at Site” , KHI's has explained as the final report.
Areas investigated :Malaysia/ Kuala Lumpur
Period investigated :March 26 ~ March 29, 2001 (including traveling days)
Investigators : KAWASAKI HEAVY INDUSTRIES, LTD.Power Plant DivisionBoiler Plant Dept., Utility Section Mr. Tsunematsu,
Staff Officer (Team leader)
Research and Development Dept,, Boiler and Ash Treatment Group Mr. Ino
Staff Officer (Sub Team Leader)
Production Control Dept. Mr. Zama Boiler & Nuclear Group Mr. Zama
Staff Officer (Construction Planning)
Engineering Support CenterPower Plant E & C Dept.,Engineering Group Mr. Umeki
Assistant Manager (Control)
Plant Engineering Sales Division Power Plant Sales Dept. 1Export Group Mr. Suzuki *
(Sales)Kawasho CorporationPlant Department Mr. Kobayashi
Manager(KL Branch Office)
Mr. Michel Wong (KL Branch Office)
Mr. SawadaDeputy Manager
(Tokyo/Machinery)
Mr. Oono(Tokyo/East Asia Business Development)
A—3—1

Investigated enterprises, etc. :(Visited site)
FELDA (Ltd.) (FELDA Palm Industry Sdn Bhd) /KL Dept./Engineering/Special project /R&D
Mr. Subash Sundeaj (Head)Mr. Ahmad Nor Azman Bin Jamin (Mechanical Engineer) Mr. Mohad Redzuan Hassan (Electrical Engineer)Mr. Chong Kow Chia (Environmental Chemist)
Note) Mark Joints together at site at one day delay* : It is schedule to visit MCE (Ministry of
Energy) on March 29, 2000 (one day extension)
Investigation schedule:(a) March 26 (Monday) : Moved from Narita Airport —> (Kuala Lumpur)
(b) March 27 (Tuesday) : Explanation of outline of Project plan for FELDAtogether with questions and answers (1st day)
(to be continued)(continues)
(c) March 28 (Wednesday) : Explanation of outline of Project plan for FELDAtogether with questions and answers (2nd day) Minute was prepared and agreement concluded. Prepared documents were arranged.Moved to Airport at night for departure.(Kuala Lumpur —> Narita Airport)
(d) March 29 (Thursday) : Arrived to Narita Airport Japan
Investigated items:Based on the design condition in conformity with the “Second Time Investigation Report at Site” , KHIs outhne of planning was explained.Then the explained items are as follows:
(a) Design and test conditions.(b) Generated power output and heat balance(c) FEB pre-processing machine & equipment(d) Specifications of major machine(e) Boiler efficiency and EFB consumption rate (0 Arrangement drawing and system diagram(g) Running cost and project profitability(h) EFB burning test results(i) Electrical system and instrument system(j) Construction process
A-3-2

Any part or a whole of the report shall not be disclosed
without prior consent of International Cooperation
Center. NEDO.
Phone 03(3987)9466
FAX 03 (3987) 5103