
former bp oil, inc. marcus hook refinery - US Environmental ...
Upload
khangminh22Category
view
3download
0
Univers
ity of
Cap
e Tow
n
The copyright of this thesis vests in the author. No quotation from it or information derived from it is to be published without full acknowledgement of the source. The thesis is to be used for private study or non-commercial research purposes only.
Published by the University of Cape Town (UCT) in terms of the non-exclusive license granted to UCT by the author.
Univers
ity of
Cap
e Tow
n
ELECTROREFINING OF BASE METAL REFINERY RESIDUE
COPPER ALLOY FOR PLATINUM GROUP METAL RECOVERY
Thesis submitted in partial fulfillment of the degree of Master of Science
Lizelle Kruyswijk KRYLIZ001
_______________
23 November, 2009

Univers
ity of
Cap
e Tow
n
PAGE 2 OF 181-
Abstract
Secondary leach concentrate (SLC) is an important bleed stream for minor
elements from Anglo Platinum’s Base Metal Refinery (BMR) which produces
copper nickel and cobalt sulphate. It contains mainly sulphur, iron jarosites, un-
leached base metals and platinum group metals (PGMs), which makes the
treatment of SLC necessary. The SLC is currently toll-refined at Umicore’s
Hoboken smelter and refinery to recover revenue from entrapped valuable metals.
This method of treatment results in excessively high costs due to high transport
and toll refining expenses as well as penalties. Thus, an in-house method of
treatment by Anglo Platinum itself would prove beneficial in that it would eliminate
these excessive costs and also provide a method of treatment in the event of
residues exporting becoming banned or strongly penalised in future. Therefore, a
method for treating SLC in-house is investigated.
The first stage of the proposed treatment method involves a pyrometallurgical
process where the removal of amphoterics by oxidative fuming, followed by
reduction to recover base metals from the slag takes place. The PGMs are
reported mainly to the metal alloy phase along with the base metals during this
process. The project discussed in this report deals with the treatment of this
furnace alloy which is referred to as Cu alloy. The Cu alloy is used to produce
anodes to be applied to an electrorefining application for the recovery of Cu as a
Cu cathode and PGMs in the form of anode slimes. Spent electrolyte from the
BMR copper electrowinning section adjusted to specific pH and Cu concentration is
used as electrolyte to which dissolvable metals (such as Ni and Fe) are recovered.
The purpose of the process is to recover PGMs to anode slimes with a composition
suitable to be blended with the final concentrate that is sent to the Precious Metals
Refinery (PMR). The performance of this process on the Cu alloy provided is
investigated and the anode slimes produced are characterised in order to propose
further methods of purification before blending with PMR feed. The typical energy
consumption, cathodic current efficiency, anodic copper dissolution rate and
deportment of elements (especially PGMs) are determined. The effects of various
operating parameters on the performance are also investigated in order to propose
operating conditions. The operating parameters that are investigated are current
density, Cu and H2SO4 concentrations in electrolyte and the use of an additive. A
preliminary process design based on knowledge and experience gained during the
literature review and test work is given.

Univers
ity of
Cap
e Tow
n
-PAGE 3 OF 181
The major technical factors in electrorefining are the cathode purity, the production
rate and the specific energy consumption. These factors are influenced primarily
by anode quality, electrolyte conditions and cathode current density. Design
considerations and typical design parameters for other industrial Cu electrorefining
applications are studied as well as possible further treatment of anode slimes for
the concentration of PGMs.
A total of eleven experiments were performed with a variety combinations of Cu
concentration (30, 40 and 50 g/l), H2SO4 concentration (110, 130, 160 and 190 g/l)
and current density (100, 125, 150, 250, 300 A/m2). In each experiment only one
parameter was changed while all others were kept constant at the base-case
setting of 40 g/l Cu, 160 g/l H2SO4, and 125 A/m2.
The testwork showed that electrolytic refining of the Cu alloy, produced by a two
stage pyrometallurgical treatment of current SLC, produces a highly concentrated
PGM residue at an overall SLC mass reduction of 99.3%, with excellent PGM
recovery to the anode slimes material. The different operating parameters that
were tested successfully, all showed very good repeatability and greater than 99%
PGM recovery from the Cu alloy, which would result in an overall recovery of 98%
from SLC. Very little or none of the base metals that were supplied by the anode
or the electrolyte feed reported to the anode slimes. The typical operating
conditions (cell potential, current efficiency, anodic Cu dissolution and element
deportment) that were observed correlated well with literature and the theoretically
calculated values.
The characteristics of the anode slimes produced stayed relatively similar
throughout the different operating parameters and strong confidence can be placed
in the production thereof and the recovery of the PGMs. The characteristics of the
spent electrolyte and the Cu cathodes were also found to be suitable for
integration in the BMR circuit.
The anode slimes composition was 20 to 30% PGMs, 20 to 30% base metals, 15 to
20% Ag, As, Te, Se, Pb and 2 to 5% Al, Si, Sb, Bi, Zn and Sn. The blending of
these slimes with typical PMR feed will result in a new PMR feed where the Pt
grade of the feed to PMR is reduced by 4 to 5.5%, the Cu grade increased by 2 to
4% and the Ni content reduced by ±4%. Other concerns are the increase of As,
Te, and Pb by between 0.5 and 1%.

Univers
ity of
Cap
e Tow
n
-PAGE 4 OF 181
The PGM-rich (>60%) phase in the anode slimes is a mostly amorphous matrix
phase containing mostly palladium and other PGMs, arsenic and tellurium
[Pd73As6Te21] with small amounts of Cu.
Anode slimes produced from electrorefining can either be subjected to an
additional process step to remove Ag, Pb and base metals before it is blended with
the final concentrate (FICO) as feed for PMR, or it can be sent to the metallics
section in PMR which includes a roast and a leach stage. The treatment of the
anode slimes depends on the nature of the slimes.
A preliminary process design was performed with proposed design parameters of
electrolyte concentrations of 40 g/l Cu and 160 g/l H2SO4 at 65˚C and a current
density of 200 A/m2. The process consists out of seven cells in series with 55
anode cathode pairs in parallel per cell. The process has a maximum capacity of
127 t/m of anode material which allows 56 days of downtime per year if the current
SLC produced (6600 t/a) is treated. The maximum capacity for Cu production is
1349 t/a and anode slimes 50.3 t/m. The power consumption per kg of anode
dissolved will be 0.175 kWh/kg.

Univers
ity of
Cap
e Tow
n
-PAGE 5 OF 181
Disclaimer
I know the meaning of plagiarism and declare that all the work in the document,
save for that which is properly acknowledged, is my own.
Date:_______________________________________________________________
Signature:___________________________________________________________
ACKNOWLEDGEMENTS
I would like to acknowledge and thank the Mintek staff, Ephraim Mabusela, Calvin
Mokwana, Johannes Maitse, Florence Jantjies, Alice Mukhabele, Mante Kgaria,
Sifiso Khumalo and especially the Mintek metallurgist responsible for the project,
Ndina Malaudzi, for their hard work and commitment throughout the project and
getting quality results. Also, I would like to thank Thembi Thulare and Marthie
Kotze, for allowing me to work in their department and giving me their support.
The Mintek staff was always very helpful and cooperative in order to get the best
possible solution to any questions that came up. I learnt a great deal during my
time spent at Mintek and I would like to thank them for welcoming me into the
company for the duration of the testwork.
Thanks also go to the Anglo Platinum Process Technology Department, Lloyd
Nelson, Les Bryson and Debbie Erasmus for the initiation of the project and the
provision of the required funds and resources. I was never left wanting for any
kind of support, whether it was accommodation, provision of experimental
requirements, technical support or just a word of motivation and inspiration.
I would also like to thank Jochen Peterson, Kathy Sole and Steve Woollam for their
guidance during the write up of the thesis. They were there to bounce ideas off,
get me into the right mode of thinking and also give their opinions of the meaning
of the results. A special thank you also to Jochen and Kathy, for their efforts in the
revision of the thesis.
Thank you to Petra Dinham from Anglo Research for her mineralogical analysis of
the samples and discussions around the meaning of the results.
Lastly I would like to thank my family, partner and housemates for their support
and motivation.

Univers
ity of
Cap
e Tow
n
PAGE 6 OF 181-
Table of Contents
1 INTRODUCTION _________________________________________________15
1.1 Background --------------------------------------------------------------------------------------------------------------------16
1.2 Process Concept-------------------------------------------------------------------------------------------------------------19
1.3 Problem Statement----------------------------------------------------------------------------------------------------------21
2 LITERATURE REVIEW ____________________________________________22
2.1 Theory ---------------------------------------------------------------------------------------------------------------------------22
2.1.1 General Introduction..............................................................................................................22
2.1.2 Redox Equilibria ....................................................................................................................23
2.1.3 Electrochemical Kinetics.......................................................................................................25
2.1.4 Mass Transport .....................................................................................................................28
2.1.5 Cathode Morphology ............................................................................................................30
2.1.6 Current Distribution ...............................................................................................................31
2.1.7 Anode Passivation ................................................................................................................32
2.2 Operating Parameters------------------------------------------------------------------------------------------------------33
2.2.1 Current Density .....................................................................................................................33
2.2.2 Electrolyte ..............................................................................................................................34
2.2.3 Temperature..........................................................................................................................39
2.2.4 Anodes...................................................................................................................................41
2.2.5 Additives ................................................................................................................................43
2.2.6 Typical Operating Conditions ...............................................................................................44
2.3 What to Expect During Electrorefining --------------------------------------------------------------------------------45
2.3.1 Behavior of Various Elements in Copper Electrorefining ...................................................45
2.4 Rustenburg Base Metal Refiners Internal Literature--------------------------------------------------------------48
2.5 Process Design---------------------------------------------------------------------------------------------------------------50
2.6 Further Processing of Anode Slimes ----------------------------------------------------------------------------------52
3 RESEARCH OBJECTIVES & APPROACH ____________________________54
3.1 Key Questions ----------------------------------------------------------------------------------------------------------------54
Univers
ity of
Cap
e Tow
n
PAGE 7 OF 181-
3.2 Objectives ----------------------------------------------------------------------------------------------------------------------54
3.3 Approach -----------------------------------------------------------------------------------------------------------------------55
4 EXPERIMENTAL_________________________________________________57
4.1 Parameters---------------------------------------------------------------------------------------------------------------------57
4.2 Equipment----------------------------------------------------------------------------------------------------------------------59
4.3 Procedures---------------------------------------------------------------------------------------------------------------------62
4.3.1 Anode Casting.......................................................................................................................62
4.3.2 Electrorefining Testwork .......................................................................................................63
4.4 Sample Analysis--------------------------------------------------------------------------------------------------------------66
4.4.1 Electrolyte Samples ..............................................................................................................66
4.4.2 Cathode Samples .................................................................................................................66
4.4.3 Anode Slimes and Anode Samples.....................................................................................66
5 RESULTS AND DISCUSSION ______________________________________67
5.1 Background --------------------------------------------------------------------------------------------------------------------67
5.2 Change in Anode Composition ------------------------------------------------------------------------------------------67
5.3 Typical Operating Conditions---------------------------------------------------------------------------------------------70
5.3.1 Cell Potential..........................................................................................................................70
5.3.2 Current Efficiency..................................................................................................................73
5.3.3 Anodic Cu Dissolution...........................................................................................................74
5.3.4 Element Deportment.............................................................................................................76
5.4 Product Characterisation --------------------------------------------------------------------------------------------------90
5.4.1 Anode Slimes ........................................................................................................................90
5.4.2 Spent Electrolyte .................................................................................................................100
5.4.3 Cathodes .............................................................................................................................101
5.4.4 Mass Reduction ..................................................................................................................103
5.5 Effect of Operating Parameters----------------------------------------------------------------------------------------105
5.5.1 Smoothing Agents...............................................................................................................105
5.5.2 Current Density ...................................................................................................................107
5.5.3 Cu Concentration ................................................................................................................113
5.5.4 H2SO4 Concentration ..........................................................................................................116

Univers
ity of
Cap
e Tow
n
PAGE 8 OF 181-
6 PROCESS DESIGN______________________________________________119
6.1 Process Design Background-------------------------------------------------------------------------------------------119
6.2 Process Design Parameters--------------------------------------------------------------------------------------------120
7 CONCLUSIONS ________________________________________________123
8 RECOMMENDATIONS ___________________________________________127
9 REFERENCES _________________________________________________128
I. APPENDIX I ..............................................................................133
A. Background of BMR Expansion...............................................133
B. Raw Material Composition .......................................................134
C. Comparison of Leaching vs. Electrorefining ...........................135
D. Test Accuracy ...........................................................................136
E. Element Deportment Results...................................................153
F. Product Characterisation Results ............................................164
G. Effect of Blended Feed on PMR Feed Composition ..............166
H. Mineralogical Results for Initial Anodes...................................170
I. Mineralogical Results for Anode Slimes..................................172
J. Mineralogy Procedures ............................................................173
II. APPENDIX II .............................................................................181
A. Anode Casting Report ..............................................................182

Univers
ity of
Cap
e Tow
n
PAGE 9 OF 181-
List of Figures
Figure 1.1.a: Composition of Ausmelt TSL furnace alloy produced from treating SLC............................18
Figure 1.2.a: Proposed flow sheet of Base Metals Refinery............................................................................20
Figure 2.1.a: Standard reduction potentials for metal ions (Nicol, 2008) ......................................................24
Figure 2.1.b: Schematic current potential curves for anodic and cathodic reactions (Nicol, 2008).....................................................................................................................................................27
Figure 2.1.c: Calculated current-potential relationship ......................................................................................28
Figure 2.1.d: Rate-potential curve for an electrode reaction involving mass transport (Nicol, 2008).....................................................................................................................................................30
Figure 2.2.a: The effect of copper concentration in the electrolyte on cell voltage during electrorefining (Hayes. 2003)..........................................................................................................35
Figure 2.2.b: Effect of Cu Concentration on Cu2+ Diffusion Coefficient (Moats et al. 2000) .....................36
Figure 2.2.c: Effect of Acid Concentration on Cu2+ Diffusion Coefficient (Moats et al. 2000).................37
Figure 2.2.d: The effect of temperature on the cell voltage during electrorefining (Hayes, 2003) ..........39
Figure 2.2.e: The effect of temperature on diffusion coefficient (Moats et al. 2002) ..................................40
Figure 2.2.f: Kinetic parameters for the Cu2+/Cu0 reaction on a copper sheet cathode at various temperatures as determined by Cifuentes (2005)......................................................................41
Figure 2.2.g: Example of a typical anode casting...............................................................................................42
Figure 2.4.a: Deportment of PGMs (190 g/l H2SO4, 40 g/l Cu, 60ºC, 0.5 V) (Hanf, 1989)........................49
Figure 2.5.a: Copper anode casting wheel ..........................................................................................................50
Figure 4.2.a: Expirimental set up ............................................................................................................................59
Figure 4.2.b: Polypropolene cell connected to thermocouple, heat exchanger, feed, spent and recyle lines...........................................................................................................................................60
Figure 4.2.c: Impure Cu anode before test ..........................................................................................................60
Figure 4.2.d: Cu deposit on stainless steel cathode with one effective plating surface of 20 cm x 14 cm .................................................................................................................................................60
Figure 4.2.e: Heat exchanger connected to hot water bath with PID controller ..........................................60
Figure 4.3.a: Original material (two-stage Ausmelt TSL alloy product) .........................................................62
Figure 4.3.b: Bottom half of silica sand mould for anodes................................................................................62

Univers
ity of
Cap
e Tow
n
PAGE 10 OF 181-
Figure 4.3.c: Molten metal transferred from furnace to casting ladle.............................................................63
Figure 4.3.d: Molten metal cast into closed top silica sand mould..................................................................63
Figure 4.3.e: Anode surface after dissolution in test 1.......................................................................................65
Figure 4.3.f: Anode slimes on filter paper produced from test 5......................................................................65
Figure 5.2.a: MLA backscattered electron image of anode cast from original material.............................68
Figure 5.2.b: MLA backscattered electron image of anode cast from altered material ............................68
Figure 5.2.c: Cell potential during test 8 with significant step change when anode passivation takes place. .........................................................................................................................................69
Figure 5.3.a: Potential difference profiles between anode and cathodes and rectifier voltage................70
Figure 5.3.b: Theoretical and actual anode dissolution rate under various operating conditions ...........75
Figure 5.3.c: Concentration profiles of different elements during test 2 (base-case).................................78
Figure 5.3.d: PGM deportment to anode slimes from anode and electrolyte ..............................................79
Figure 5.3.e: Base Metals deportment to anode slimes from anode and electrolyte.................................80
Figure 5.3.f: Impurity deportment to anode slimes from anode and electrolyte ..........................................80
Figure 5.3.g: Minor impurity deportment to anode slimes from anode and electrolyte..............................81
Figure 5.3.h: Recovery of PGMs from anode material to anode slimes .......................................................87
Figure 5.3.i: Recovery of base metals from anode to anode slimes ..............................................................88
Figure 5.3.j: Recovery of impurities from anode to anode slimes...................................................................89
Figure 5.3.k: Recovery of minor impurities from anode to anode slimes......................................................90
Figure 5.4.a: Composition of anode slimes compared with typical PMR feed composition .....................91
Figure 5.4.b: Deviation of blended feed composition from current PMR feed .............................................93
Figure 5.4.c: Backscattered electron image of original anode material used in the base-case test with additives (Test 3) ...............................................................................................................94
Figure 5.4.d: Backscattered electron image of typical anode slime particle.................................................95
Figure 5.4.e: XRD traces of anode slimes samples of test 1 – 7 showing amorphous phase.................96
Figure 5.4.f: Comparison of bright white phases in anode and slimes..........................................................98
Figure 5.4.g: Comparison of grey bleb phases in anode and slimes.............................................................99
Figure 5.4.h: Comparison of the matrix phases in anodes and slimes..........................................................99

Univers
ity of
Cap
e Tow
n
PAGE 11 OF 181-
Figure 5.4.i: Nodular growth around edges first test cathode ........................................................................103
Figure 5.4.j: Smooth surface of fourth test cathode. ........................................................................................103
Figure 5.4.k: Slimes and cathode production per kg of anode treated........................................................104
Figure 5.5.a: Comparison of cell potential during tests with additives and without additives.................106
Figure 5.5.b: Increase in power consumption with an increase in current density ...................................108
Figure 5.5.c: Increase in anode dissolution with an increase in current density........................................109
Figure 5.5.d: Deportment of Rh, Ru, Ir, Ag and Pg to slimes from anode and electrolyte......................110
Figure 5.5.e: Deportment of As, Te, Sb, Bi, Se & S to slimes from anode and electrolyte......................110
Figure 5.5.f: Comparison of cell potential at various current densities ........................................................111
Figure 5.5.g: Actual and calculated relationship between current density and cell potential .................112
Figure 5.5.h: Comparison of cell potential at various Cu concentrations....................................................115
Figure 5.5.i: Comparison of cell potential at different H2SO4 concentrations for altered anode material...............................................................................................................................................116
Figure 5.5.j: Comparison of cell potential at different H2SO4 concentrations ............................................118
Figure 6.1.a: Proposed flow sheet of Base Metals Refinery..........................................................................119
List of Tables
Table 1.1.a: Content of trace elements and major elements in SLC .............................................................15
Table 2.1.a: Non –standard electrode potentials at electrorefining conditions ............................................25
Table 2.2.a: Chemical specifications for copper cathode (Nicol, 2008) ........................................................38
Table 2.2.b: Typical operating conditions of a copper electrorefining process...........................................45
Table 2.3.a: Recovery of elements to anode slimes and to electrolyte (Biswas, 2002) ............................47
Table 2.4.a: Results of electrorefining tests performed on BMR Cu bullion by Hanf et al. (1989)..........50
Table 2.6.a: Typical composition of commercial Cu anodes and the slimes produced Chen (2004)....................................................................................................................................................52
Table 4.1.a: Operating parameter combinations for different tests performed ............................................57
Table 4.2.a: Experimental electrode dimensions and flow rate settings .......................................................61
Table 5.3.a: Power consumption for each test i.t.o kWh/kg Cu produced and anode dissolved ............72

Univers
ity of
Cap
e Tow
n
PAGE 12 OF 181-
Table 5.3.b: Anode and cathode current efficiencies under various conditions ..........................................74
Table 5.3.c: Actual and theoretical dissolution rate under different conditions............................................76
Table 5.3.d: Recovery of elements from Anode to different product streams for Test 1 (110 g/l H2SO4) ..................................................................................................................................................83
Table 5.3.e: Recovery of elements from Anode to different product streams for Test 2 (Base-case) .....................................................................................................................................................83
Table 5.3.f: Recovery of elements from Anode to different product streams for Test 3 (Base-case With Additives)..........................................................................................................................84
Table 5.3.g: Recovery of elements from Anode to different product streams for Test 4 (100 A/m2) .....................................................................................................................................................84
Table 5.3.h: Recovery of elements from Anode to different product streams for Test 5 (150 A/m2) .....................................................................................................................................................85
Table 5.3.i: Recovery of elements from Anode to different product streams for Test 6 (30 g/l Cu).........................................................................................................................................................85
Table 5.3.j: Recovery of elements from Anode to different product streams for Test 7 (50 g/l Cu).........................................................................................................................................................86
Table 5.4.a: PGM grade of anode slimes.............................................................................................................91
Table 5.4.b: Impurity grade in slimes produced by tests with original anode material...............................92
Table 5.4.c: Composition of phases present in initial anode used in base-case test with additives (Test 3)................................................................................................................................94
Table 5.4.d: Composition of different phases in anode slimes........................................................................97
Table 5.4.e: Spent electrolyte concentrations after each test........................................................................100
Table 5.4.f: Impurities in cathodes .......................................................................................................................102
Table 5.5.a: Calculation of exchange current density (i0) and the Tafel slope (b).....................................112

Univers
ity of
Cap
e Tow
n
PAGE 13 OF 181-
Glossary of Terms
BMR – Base Metals Refinery
SLC – Secondary Leach Concentrate
PGM – Platinum Group Metals (Pt, Pd, Rh, Ru, Ir, Os, Au)
BM – Base Metals (Ni, Cu, Fe & Co)
CPL – Copper Pressure Leach
PMR – Precious Metals Refinery
FICO – Final Concentrate
MC plant – Alloy Concentration Plant
SG – Specific Gravity
AMD – Advanced Materials Division
ASD – Analytical Services Division
SEM-EDX – Scanning Electron Microscope with Energy Dispersive X-ray
TSL – Top Submerged Lance
LME – London Metal Exchange
PID – Proportional–Integral–Derivative

Univers
ity of
Cap
e Tow
n
PAGE 14 OF 181-
Nomenclature
Symbol Description Unit m Mass g or kg M Molecular Mass g/mol or kg/kmol n Number of electrons per reaction (stoichiometrically) Mol W Energy Watt (W) P Power kWh/kg ŋ Overpotential Volts (V) or mV ɛ Current Efficiency % E Electrode Potential Volts (V) E° Standard Electrode Potential Volts (V) R Universal Gas Constant T Temperature K I Applied Current Ampere (A) t Time Seconds (s) A Surface area m2 i Current Density A/m2 i0 Exchange Current Density A/m2 F Faraday Constant 96 487 C/mol V Cell Voltage Volts (V) P Power Consumption kWh/kg fs Fraction of slimes per unit anode Fraction / %
t/m Monthly capacity / throughput Tonnes per month t/a annual capacity / throughput Tonnes per annum
[Ox] Activity (molarity) of oxidised species mol/l [Re] Activity (molarity) of reduced species mol/l
r Rate of reaction mol/m2.s rm Mass transfer limited rate mol/m2.s
k, h Constants in rate equation
a Activity of reactants taking part in rate determining step
mol/l
∆G” Free energy of activation J b Tafel slope mV/decade kL Mass transfer coefficient m/s Cb Bulk concentration mol/l D Diffusion coefficient m2/s δ Diffusion layer thickness mm

Univers
ity of
Cap
e Tow
n
PAGE 15 OF 181-
1 I N T R O D U C T I O N
The Base Metal Refinery (BMR) of Anglo Platinum currently produces nickel, copper,
cobalt sulphate and sodium sulphate as saleable products, as well as a residue which
serves as the main outlet for impurities from the refining processes. The residue
generated from these processes is called the Secondary Leach Concentrate (SLC)
and it contains mainly sulphur, iron jarosites, un-leached base metals and platinum
group metals (PGMs), which makes the treatment of SLC attractive. The SLC is
currently toll-refined at Umicore’s Hoboken smelter and refinery. This treatment
route results in high transport and refining costs as well as a long pipeline, which
equate to a significant revenue loss. Also, it is projected that the export of residues
will become a challenge in the near future due to new environmental laws being
developed. It is thus beneficial and necessary for Anglo Platinum to develop an
alternative treatment route which will result in significant mass reduction of the SLC
or complete in-house treatment thereof. Thereby eliminating additional costs
involved with toll refining and benefiting from the PGM values captured in the SLC.
BMR currently produces 550 t/m of SLC with the typical composition given in Table
1.1.a.
Average Content in SLC g/t Wt % Wt %
Pd 810 Fe 28.30 Se 0.399 Ag 700 S 26.00 Pb 0.318 Ru 550 SiO2 25.00 Sb 0.256 Pt 170 Cu 16.62 Te 0.122 Rh 190 Ni 2.94 As 0.098 Au 100 Co 0.06 Bi 0.050 Ir 30 Zn 0.002
According to Hofirek (2001), the Cu and Ni are present predominantly as
monosulfides and small quantities of unleached material. Iron is present either as a
hematite or jarosite, depending on the secondary leach conditions. The formation of
this precipitate is very important in the secondary leach because it is the only outlet
for Fe from the process. It also collects non-metallic impurities from the liquor.
Forming hematite is more preferable because it collects more impurities and is less
soluble than jarosite; however, it is more difficult to filter. It is thought that the Ag,
Pb, Zn, Mn and Cr present in the SLC are co-precipitates with or as jarosite
analogues and Se and Te are presumed to be associated with the copper sulfides.
Table 1.1.a: Content of trace elements and major elements in SLC

Univers
ity of
Cap
e Tow
n
PAGE 16 OF 181-
The PGMs that are present in the SLC is due to PGMs bypassing the Matte
Concentration (MC) plant where the PGMs are separated from the base metals by
magnetic separation and base metal leaching prior to being sent to the precious
metals refinery (PMR). Some of the PGMs might not be captured with the magnetic
fraction as it is supposed to (predominantly non-magnetic CuPdAu alloy and Ru
pentlandite report to the base metal fraction) or it could be co-dissolved in the base
metal leaching stages where the magnetic PGM fraction is concentrated (Ru and Rh
are prone to dissolve under these conditions) (Hofirek, 2001).
If the economic climate allows, BMR is planned to undergo an expansion to increase
the Ni production from 21 000t/a to 33 000t/a. This expansion involves a change in
the process flow sheet which will include a Fe removal step. The Fe content in the
new residue (similar to the old SLC) is said to be reduced by 80% (Dynatec, 2006).
The residue will consist mainly of covelite (CuS) and elemental S. The other
impurities and PGMs will still be exiting via this residue (Dinham, 2006). The
background of the new flow sheet design is given in Appendix I, Section A. The
implementation of this process is still indefinite so, in the interim, test work is done
on the current SLC with the objective of either significantly minimising the mass or
finding a process design that will treat the residue completely in-house. If the
expansion continues, the residue treatment process should have the flexibility of
treating the new residue economically as well. The criteria for such a residue
treatment process are that all the products of the process can either be routed to the
current process or produce saleable products or environmentally safe waste for
disposal while maximising PGM recovery.
1.1 Background
Based on a review that was done on impurity removal from the secondary leach
residue (Viljoen, 2007), two treatment processes were proposed: a pyrometallurgical
and a hydrometallurgical process. SLC was successfully treated with a
pyrometallurgical process at BMR from 1983 to 1989 where the PGMs were collected
in a Cu bullion that was recycled to the smelter. This process was stopped due to
operational problems with the furnace and the off-gas treatment. Experience gained
in this process and an improvement in furnace designs could make a
pyrometallurgical route once again attractive.
Hence, testing of a pyrometallurgical process was done in an Ausmelt Top
Submerged Lance (TSL) furnace. The process concept was to fume off unwanted

Univers
ity of
Cap
e Tow
n
PAGE 17 OF 181-
minor elements (Pb, Bi, Sb, As, Se, Te) and then recover the valuable metals (PGMs,
Cu, Ni, Co) to a small mass of alloy for further treatment while Fe, Si and other
impurities are mostly rejected to the slag. The fuming was done under oxidative
conditions to fume off selenides and tellurides. In order to get the valuable metals
back into the matte phase the melt was subjected to reducing conditions with coal
addition. This process offers an SLC mass reduction of ± 80% and an expected PGM
recovery of 99%. The alloy obtained from this process would require further
processing to separate the base metals and other impurities from the PGMs and
ultimately obtain a product that is rich in PGMs and can be blended with the feed to
Precious Metals Refinery (PMR). The process that was recommended by Viljoen
(2007) made use of a subsequent oxidative pressure leach of the Cu alloy in H2SO4
to dissolve the base metals, leaching this residue with HNO3 to dissolve the Ag. The
PGM oxide residue can then be sent to PMR where it is subjected to the metallics
process.
For the purpose of this project an alternative method of treating the Cu alloy is
considered which involves the electrorefining of Cu. This process appeared
attractive due to the production of Cu cathodes as a final product, a nickel-rich
solution that can be recycled to BMR and a PGM-rich anode slime which might be
suitable for treatment in the PMR metallics section. This would eliminate all the other
complicated leaching steps. A comparison between a leaching process and
electrolysis was done and is given in Appendix I, Section C.
The Cu content in the Ausmelt TSL furnace alloy is not as high as in the Cu bullion
that was produced at BMR in 1983 to 1989 (which was ~90% Cu), but it would still be
sufficient for the purpose of electrorefining. The composition of the Ausmelt TSL
furnace alloy is shown in Figure 1.1.a. It can be seen that it contains mainly copper
(80%) and also a significant amount of Ni (12%). The total PGM content in the alloy
is ~1.1%. Impurities which might cause a problem in the further processing of the
anode slimes / electrolyte are Ag, Pb, As, Te, Se and also Si. The complete analysis
table can be viewed in Appendix I, Section B. It is thus necessary to investigate the
deportment of the PGMs as well as the impurities to determine if such a process will
be suitable, practical and beneficial to implement.

Univers
ity of
Cap
e Tow
n
PAGE 18 OF 181-
Cu Bullion Composition
0%
20%
40%
60%
80%
100%
Total Trace Elements = 2.4% PGMs = 1.1%
Te
Ag
Cu
Fe
Ni
80%
12%
3.5%
Pd
Ru
Rh
Ir
Pt
Au
5646ppm
443ppm
As
Si
S
Ca
Pb
Cr
Mg
Al
CoSb
0.3%
0.1%SeSnBi
Figure 1.1.a: Composition of Ausmelt TSL furnace alloy produced from treating SLC

Univers
ity of
Cap
e Tow
n
PAGE 19 OF 181-
1.2 Process Concept
The proposed process uses the two-stage Ausmelt TSL furnace alloy to manufacture
anodes which will be used in the electrorefining of Cu. Spent electrolyte from the
BMR copper electrowinning can be used as electrolyte. The electrolyte after
electrorefining will be rich in Ni and Fe and can subsequently be recycled to the
primary leaching stages in BMR where the objective is to obtain a nickel-rich solution,
or it can alternatively be sent directly to the Ni circuit where it will be blended with the
Ni-rich primary leach solution and put through a number of purification steps in order
to remove impurities prior to Ni electrowinning. The Fe and remaining Cu in this
solution will be removed in the copper removal section which is the first step of
purification. Anode slimes produced from electrorefining can either be subjected to
an additional process step to remove Ag, Pb and base metals before being blended
with the final concentrate (FICO) as feed for PMR, or can be sent to the metallics
section in PMR which includes a roast and a leach stage. The treatment of the anode
slimes depends on its nature. The pure copper cathodes that are produced will form
part of the BMR final product, provided that they meet the specifications. This way, if
it can be assumed that all the Cu and Ni currently present in the SLC will eventually
be processed to a cathode, the total Cu production of BMR can be increased by 1056
t/a and the Ni production by 160 t/a. Recoveries will be close to 100% due to the
preferential dissolution of these metals during electrorefining. Similarly, the PMR
PGM throughput will increase by 14.5 t/a. Figure 1.2.a shows the proposed flow
sheet for the SLC treatment.

Univers
ity of
Cap
e Tow
n
PAGE 20 OF 181-
Cu E RCu E RCu E RCu E R
Se R emoval Se R emoval Se R emoval Se R emoval
Cu R emovalCu R emovalCu R emovalCu R emoval Secondary L eachSecondary L eachSecondary L eachSecondary L eachP rimary L eachP rimary L eachP rimary L eachP rimary L each
Ni P urific ationNi P urific ationNi P urific ationNi P urific ation
Ni EWNi EWNi EWNi EW
P bSO4 to Smelter
Ni Cathode
CoSO4
Cu Cathode
P ressure Vessel Liquor
Leach R esidue
Nickel - Copper Matte
AusmeltAusmeltAusmeltAusmelt TSL F urnaceTSL F urnaceTSL F urnaceTSL F urnace
Cu EWCu EWCu EWCu EW
Fume F ume F ume F ume (scrub & dispose)
S lag S lag S lag S lag (recycle to smelter)
S R emovalS R emovalS R emovalS R emoval Na2SO4
Anode S limesAnode S limesAnode S limesAnode S limes(further processing / feed to PMR )
Solids
Solution
Cu E RCu E RCu E RCu E R
Se R emoval Se R emoval Se R emoval Se R emoval
Cu R emovalCu R emovalCu R emovalCu R emoval Secondary L eachSecondary L eachSecondary L eachSecondary L eachP rimary L eachP rimary L eachP rimary L eachP rimary L each
Ni P urific ationNi P urific ationNi P urific ationNi P urific ationNi P urific ationNi P urific ationNi P urific ationNi P urific ation
Ni EWNi EWNi EWNi EWNi EWNi EWNi EWNi EW
P bSO4 to Smelter
Ni Cathode
CoSO4
Cu Cathode
P ressure Vessel Liquor
Leach R esidue
Nickel - Copper Matte
AusmeltAusmeltAusmeltAusmelt TSL F urnaceTSL F urnaceTSL F urnaceTSL F urnaceAusmeltAusmeltAusmeltAusmelt TSL F urnaceTSL F urnaceTSL F urnaceTSL F urnace
Cu EWCu EWCu EWCu EW
Fume F ume F ume F ume (scrub & dispose)
S lag S lag S lag S lag (recycle to smelter)
S R emovalS R emovalS R emovalS R emovalS R emovalS R emovalS R emovalS R emoval Na2SO4
Anode S limesAnode S limesAnode S limesAnode S limes(further processing / feed to PMR )
Solids
Solution
Figure 1.2.a: Proposed flow sheet of Base Metals Refinery
Univers
ity of
Cap
e Tow
n
PAGE 21 OF 181-
1.3 Problem Statement
The aim is to produce a suitable PGM concentrate in a form that can be easily
processed to purify it and then be sent to PMR for final separation of PGMs, as well
as recover Cu and Ni to BMR. The proposed process must be safe, cost efficient and
economically feasible as well as practical and sustainable.
This project must thus investigate the performance of electrorefining of the Ausmelt
TSL alloy provided. The anode slimes produced must be characterised in order to
propose further methods of purification before final separation of PGMs.
During this project, the typical energy consumption, current efficiency, anodic copper
dissolution rate and deportment of elements (especially PGMs) will be determined.
The anode slimes will be characterised by mineralogical investigation and the effect
of various operating parameters will be determined to propose optimal operating
conditions. A preliminary process design will be performed using the knowledge and
experience gained during the literature review and testwork.
Univers
ity of
Cap
e Tow
n
PAGE 22 OF 181-
2 L I T E R AT U R E R E V I E W
2.1 Theory
2.1.1 General Introduction
Electrorefining is widely used for the purification and production of copper that is suitable
for electrical applications. Such plants exist throughout the world on production scales
between 1000 and 100 000 t/a.
In an electrorefining process, the anode is the impure metal and the impurities are lost
during the passage of metal from the anode to the cathode during electrolysis. The
electrode reactions in the case of Cu electrorefining are as follows.
• Anode reaction: Cu → Cu2+ + 2e-
If Ni and Fe are also present in the impure anode, they will dissolve as follows:
Ni → Ni2+ + 2e-
Fe → Fe2+ + 2e-
• Cathode reaction: Cu2+ + 2e- → Cu
A suitable voltage is applied to the electrodes to cause oxidation of copper metal at the
anode and reduction of Cu2+ to form copper metal at the cathode. This works efficiently
because copper is both oxidized and reduced more readily than water. Metallic
impurities with a lower reduction potential than copper are less noble and will readily
dissolve at the anode but do not plate at the cathode. More noble metals with a higher
reduction potential are not dissolved at the anode, instead they collect at the bottom of
the cell as anode slimes. The anode slimes can be captured and processed to recover
the valuable metals.
Cell voltage and current density are the two important parameters in copper
electrorefining. The total voltage is determined by the equilibrium cell voltage, anodic
and cathodic overpotential and Ohmic potential drop in electrolyte, hardware and power
supply. It is generally accepted that copper production increases with an increase of
current density at the cost of current efficiency. The electrolyte that serves as a carrier
for the Cu2+ ions is sometimes in the form of a molten salt or non-aqueous electrolyte.
These forms of electrolyte offer opportunities for increasing current densities and refining
via lower oxidation states that are not stable in water. However, aqueous processes are
the most widely used due to the ease of handling, more developed chemistry and

Univers
ity of
Cap
e Tow
n
PAGE 23 OF 181-
familiarity with aqueous process liquors and electrolytes. Cu electrorefining is typically
conducted using a sulphate medium for the transport of Cu ions.
The theory behind the redox equilibria, electrochemical kinetics, mass transport, cathode
morphology and current distribution for a Cu electrorefining operation are discussed in
the following paragraphs (Nicol, 2008).
2.1.2 Redox Equilibria
As mentioned before, the two half reactions for the dissolution and deposition of Cu are
equal but opposite, with a standard electrode potential of 0.34 V. The cell voltage can be
considered to be composed of the difference between the potential of the cathode and
that of the anode:
∆E = V = Ecathode - Eanode , Thus, ∆E = 0 V (1)
Thus, in the ideal case, the total cell voltage is only required to drive the current through
the electrolyte.
The anode material in this case only consists of 80% Cu, 12% Ni, ~4% Fe and other
impurities. To investigate what the behaviour of the impurities will be during the
dissolution of Cu, the standard electrode potential of other elements are investigated.
Figure 2.1.a shows the standard reduction potentials for some metal ions. It can be
observed that only the metals on the right-hand side of Cu will dissolve more readily than
copper. Thus, some of the current that passes through the anode will be used to dissolve
these metals (especially Ni and Fe). The remainder of the current will dissolve the Cu
from the anode which is the major component. It can also be seen that the standard
reduction potential for H2O is on the left of Cu, meaning that Cu will be dissolved
preferentially to the oxidation of H2O to O2, and O2 evolution will not occur. At the
cathode, Ag and Au (as well as other precious metals not shown in the figure) could be
deposited more readily than Cu if in solution. This is not likely because they are on the
left hand side of Cu and will not dissolve with the Cu from the anode. H2O is also on the
left-hand side of Cu which indicates that if there are any O2 in solution at any time, it
would be reduced to H2O preferentially to the deposition of Cu. However, there would
generally not be any O2 in solution during the electrorefining of Cu and it does not play a
significant role.

Univers
ity of
Cap
e Tow
n
PAGE 24 OF 181-
Order of Reducability
-1.5
-1
-0.5
0
0.5
1
1.5
2
Au H2O Ag Cu H Pb Ni Co Cd Fe Cr Zn Mn
E˚
(V)
Oxidised more easily
Reduced more easily
In typical electrorefining, the reactions are not carried out under the standard conditions
of unit activity. In order to quantitatively account for deviations from the standard states,
the Nernst equation is applied to calculate the equilibrium potential for each half reaction
under the specific conditions of electrorefining.
[ ][ ]
−°=OxnF
RTEE
Reln. (2)
Where T: Temperature = 338 K (65˚C)
n: number of electrons transferred
F: Faraday’s constant = 96 487 C/mol
[Ox] [Re]: activity of the oxidised or reduced species respectively
[Ox] + ne = [Re]
R: universal gas constant = 8.314 J/K mol
If it is assumed that the activity of the ions in solution is equal to the molar concentration
and that the metals are only present as Me2+ ions and not complexed, the non-standard
electrode potentials at typical BMR electrolyte conditions can be calculated to be the
following:
Figure 2.1.a: Standard reduction potentials for metal ions (Nicol, 2008)

Univers
ity of
Cap
e Tow
n
PAGE 25 OF 181-
Metal in Solution Typical Concentration (M) E˚ (V) n E Cu 0.615 0.34 2 0.333 Ni 1 -0.25 2 -0.250 Fe 0.041 -0.44 2 -0.487 Ag 1.00E-06 0.8 1 0.398
It can be seen that at concentrations smaller than unity, the equilibrium potential
decreases slightly, and the metals would dissolve more easily. The difference in
equilibrium potential in the case of Ag is significant due to the very low concentration of
Ag in solution. At even lower concentrations, the electrode potential might become lower
than that of Cu and would start co-dissolving from the anode. However, a very small
build-up of Ag in solution would increase the equilibrium potential again and it would stop
dissolving.
2.1.3 Electrochemical Kinetics
The rate at which electrochemical reactions take place is dependent on the transfer of
electrons across interfaces of anode/solution and solution/cathode more than just the
reactant concentrations. This rate of transfer is governed mostly by the electrochemical
potential difference across the interfaces or the and is described by Faraday’s law:
Fn
tIMm
.
... ε= (3)
where m: mass of metal deposited (g)
I: applied current (A)
t: time (s)
n: number of electrons per mole of metal oxidized or reduced
M: molecular mass of the metal (g/mol)
F: the Faraday constant (96 487 C/mol)
ε: current efficiency
Because the reaction across the surface is relatively heterogeneous, the use of current is
often replaced with current density (i) which is the current passed through 1 m2 of surface
area (A):
A
Ii = A/m2
(4)
Table 2.1.a: Non –standard electrode potentials at electrorefining conditions

Univers
ity of
Cap
e Tow
n
PAGE 26 OF 181-
From these equations it can be derived that the rate of reaction at the cathode (r) in
moles/m2.s is as follows:
nF
ir = mol/(m2.s) (5)
As proven earlier, if the current through an electrorefining cell is 0 A, the equilibrium cell
potential is 0 V. If current is subsequently applied to the cell, the anodic potential will
increase and the cathodic potential will decrease. This change in potential is defined as
overpotential (η): eEE −=η with Ee: equilibrium potential of particular electrode.
It has been determined that the rate of reaction is related to the free energy of activation
(∆G#) by:
∏
∆−=RT
Ga
h
Tkr
#
exp...
(6)
where k and h are constants and ∏a is the product of activities of reactants taking part in
the rate-determining step.
It is also known that for an electrode process the free energy is related to potential by:
nFEG −=∆ (7)
If the potential of the electrodes, relative to a copper reference electrode, are measured
at different current densities, the current can be plotted as a function of the potential as
shown in the solid curve given in Figure 2.1.b. This curve is essentially the algebraic
sum of the currents due to the reactions at the anode and at the cathode. At equilibrium
where the applied current (i) = 0A and Ee = 0 V the opposite anodic and cathodic
reactions are still taking place at equal and opposite rates. The current density due to
each of these reactions is known as exchange current density (i0) and is characteristic of
a particular reaction. The exchange current density is a measure of the quantity of
oxidation and reduction taking place at the equilibrium potential.

Univers
ity of
Cap
e Tow
n
PAGE 27 OF 181-
ia (A/m2)
ic (A/m2)
Cu = Cu2+ + 2e-
Cu2+ + 2e- = Cu
E (V)
i0
Ee = 0
ia (A/m2)
ic (A/m2)
Cu = Cu2+ + 2e-
Cu2+ + 2e- = Cu
E (V)
i0
Ee = 0
ia (A/m2)
ic (A/m2)
Cu = Cu2+ + 2e-
Cu2+ + 2e- = Cu
E (V)
i0
Ee = 0
The anodic and cathodic overpotentials relationship with exchange current density and
current (the dotted curves in Figure 2.1.b) is quantitatively well described by the Butler-
Volmer reaction:
−−
=RT
F
TR
Fii ba ηβηβ ..
exp.
..exp.0 (8)
At high field regions where the reactions are not close to equilibrium, the anodic
contribution to the cathodic reaction and vice versa can be neglected and the Butler
Volmer equation can be simplified to describe the anodic and cathodic current density as
follows:
Anodic:
=
0
log.i
ib a
aη (9)
Cathodic:
=
cc i
ib 0log.η (10)
Figure 2.1.b: Schematic current potential curves for anodic and cathodic reactions (Nicol, 2008)

Univers
ity of
Cap
e Tow
n
PAGE 28 OF 181-
where b is the so-called Tafel slope and is given by ( )FTR
bβ−
=1
..303.2 (11)
The exchange current density for Cu plating at the cathode at unit molarity and 25°C is
0.2 A/m2 and the Tafel slope is 40 mV/decade. The Butler-Volmer equations were used
with these constants to draw up an approximate schematic of the current density vs. the
overpotential applied to the electrodes up to a current density of 250 A/m2. This
relationship is shown in Figure 2.1.c.
Butler Volmer Equationi0 = 0.2 A/m 2 , b = 40 mV/decade
-300
-200
-100
0
100
200
300
-0.15 -0.1 -0.05 0 0.05 0.1 0.15
Overpotential (V)
Cur
rent
Den
sity
(A
/m2)
ia ic
2.1.4 Mass Transport
If the rate of reaction due to current through the cell is faster than the electrons or ions
can physically be transported to or from the electrode the reaction rate becomes mass-
transport controlled. Mass transport of ions through the electrolyte is achieved by any of
the following means.
Convection
This is due to hydrodynamic transport that is induced by stirring or pumping, air sparging,
gas evolution at electrodes, density gradients or thermal gradients. It is often the most
effective way of improving mass transport but is applied more in electrowinning practices
than electrorefining.
Figure 2.1.c: Calculated current-potential relationship

Univers
ity of
Cap
e Tow
n
PAGE 29 OF 181-
Diffusion
Diffusion has to do with the transport of ions from high to low concentration regions. Due
to Cu dissolving at the anode, the concentration in the anode regions will be high; in
contrast, the concentration at the cathode will be low due to the transformation of Cu2+
ions to Cu metal. Thus, diffusion of Cu2+ ions is very relevant in electrorefining practices.
Migration
Migration is the movement of ions due to an electrical field. In acidic solutions such as
the electrolyte used in Cu electrorefing, there is a good transport of current and the
contribution of migration is relatively small and is often neglected.
In cases where the reaction is mass-transport controlled, the rate equation in terms of
current density is no longer applicable. Instead, the rate is determined by the product of
the bulk molar concentration (Cb) of the ion in solution and the mass transport coefficient
(kL).
Reaction rate controlled: nF
ir = mol/(m2.s) (12)
Maximum rate if mass transport controlled: Lbm kCr .= mol/(m2.s) (13)
The mass transport coefficient (kL, m/s) is determined with the diffusion coefficient (D,
m2/s) of the ion moving through a diffusion layer which is a stationary film adjacent to the
electrode surface and the physical thickness (δ, mm) of this film:
δD
k L = m/s (14)
The rate schematic for a mass-transport controlled system is illustrated in Figure 2.1.d:

Univers
ity of
Cap
e Tow
n
PAGE 30 OF 181-
r (mol/m2s)
Cu = Cu2+ + 2e-
Cu2+ + 2e- = Cu
E (V)
Ee = 0
r (mol/m2s)
rm
rm
r (mol/m2s)
Cu = Cu2+ + 2e-
Cu2+ + 2e- = Cu
E (V)
Ee = 0
r (mol/m2s)
rm
rm
2.1.5 Cathode Morphology
Cu electrorefining should produce cathodes that are uniformly thick and chemically pure
that can be readily stripped, handled and processed. One of the most important factors
that influences the morphology of the cathodes is the current density. As the current
density increases, the mean size of crystallites that are deposited will decrease.
Excessively high current densities can even produce very powdery deposits. Other
factors that will result in finer crystal growths are:
• Decrease in metal ion concentration
• Decrease in temperature
• Reduction in mass transport
• Increase in smoothing agents.
An increased grain size or roughness in cathode promotes occlusion of anode residues
and electrolyte, resulting in contamination of the cathodes and is thus not preferred. It is
aimed to obtain a fine-grained cathode surface with lateral crystal growth. The maximum
Figure 2.1.d: Rate-potential curve for an electrode reaction involving mass transport (Nicol, 2008)

Univers
ity of
Cap
e Tow
n
PAGE 31 OF 181-
current density that is generally applied in industrial operations is 30-40% of the limiting
current density.
Developments in improving cathode quality have been reusable cathodes, electrolyte
purification, monitoring of additives, periodic current reversal and anode preparation
machines (Hiskey, 1999).
2.1.6 Current Distribution
The distribution and extent of reactions taking place on the electrode surfaces are
dependent on the current distribution over an electrode surface or throughout a cell. It
has been proven that current is not uniform and is mainly dependent on the following
factors:
• Size and geometry of cell
• Current density
• Conductivity of solution
• Kinetics of the electrode reactions
• Mass transport to the electrode
Distinctions are made between three different types of current distribution:
1) Primary current distribution – Assumed that overpotentials do not play a role in
current distribution but only the geometrical distances between the electrodes.
2) Secondary current distribution – Takes activation overpotentials (i.e., conductivity of
electrolyte) and geometrical distances into account but assumes that there is no
concentration variation near the electrode.
3) Tertiary current distribution – Assumes that the reactions are mass-transport
controlled, thus takes into account geometry, conductivity as well as mass transport.
It should be aimed to maintain as uniform as possible current distribution throughout the
tankhouse to prevent poor cathode quality, decreased current efficiency, non-uniform
cathode growths (dendrites), short-circuiting, loss of production, and local anode
passivation. There are a number of precautions that can be taken to ensure uniform
current distribution:
• Uniform electrode spacing
• Vertical hanging of anodes and cathodes
Univers
ity of
Cap
e Tow
n
PAGE 32 OF 181-
• Flat cathodes and anodes
• Good electrolyte composition
• Avoidance of passivation.
Good contacts of anodes and cathodes to the bus bars (current distributor bars) also
minimises energy loss and contributes to uniform current distribution among all
electrodes (Biswas et al., 2002).
2.1.7 Anode Passivation
Anode passivation is the build-up of non-porous layers on anode surface. This tends to
block mass transport of dissolved ions to the electrolyte. Current density, temperature,
additives and anode or electrolyte compositions are some of the influencing factors on
anode passivation. All of these mainly relate to the solubility of various ions in the
electrolyte.
Radhakrishnamurthy et al. (1980) described anode passivation as follows:
“The concentration of copper ions at both the cathode and the anode change with time; a decrease occurs at the cathode and an increase occurs at the anode. As the concentration of copper ions increases at the anode, a point is reached when the copper salt precipitates on the anode and acts as a mechanical barrier for the copper ion transfer.”
Anode passivation, caused primarily by copper sulphate precipitation on the anode and
the slime layer present on the anode surface, was demonstrated to depend on electrolyte
composition, temperature, anode composition and parameters affecting the mass
transport of copper ions, as well as CuSO4 solubility (Gu et al. 1994)
From the work of Gu et al. (1994) it is evident that the higher the silver content in the
anodes, the larger the amount of suspended slime and this reduces the time it takes for
anode passivation to take place as it obstructs the transfer of ions through the slimes
layer at very high current densities.
As mentioned before, the passivation time and periodic passivation phenomena were
found to be closely associated with thiourea concentration and degradation (Hiskey and
Cheng, 1998).

Univers
ity of
Cap
e Tow
n
PAGE 33 OF 181-
2.2 Operating Parameters
The major technical factors in electrorefining practice are specific energy consumption,
the production rate and the cathode purity. The operating parameters that influence
these factors the most are the anode quality, electrolyte conditions and cathode current
density. A literature review was done on these operating parameters in detail to
summarise the effect each of these has on the technical factors as well as the typical
operating conditions that are currently applied in electrorefining applications.
The operating parameters must be selected such that both the anodic dissolution and the
deposition of the Cu occur efficiently while none of the impurity metals transfer from the
anode to the cathode and passivation of the anode is minimal. The objective is to
recover all the precious metals with as little as possible base metals and other impurities
to the anode slimes and produce a good quality, highly crystalline deposit at the cathode.
2.2.1 Current Density
The current density and voltage required to produce such a current are important factors
in the capital and working cost of a plant. The theory presented in the previous section
showed that current density is in direct relationship with the rate of reaction, as long as
mass transport is not the limiting factor. Thus, in order to achieve high production rates,
high current densities are required. Unfortunately, current density can not be increased
indefinitely due to a number of limiting factors. Pletcher and Walsh (1990) described the
effects of excessive current density as the following:
1) Increased impurity levels in the cathode deposit due to increased roughness of
cathodes caused by high current density. Cathode roughness promotes occlusion of
anode residues and electrolyte in the cathode.
2) Anode passivation occurs at high current density (>280 A/m2) which limits or
suspends production rates.
Another limiting factor mentioned by Nicol (2008) is the cost implication of high voltage
drop across electrolyte due to high current density.
Radhakrishnamurthy et al. (1980) investigated the problems associated with operating at
increased current densities and came to similar conclusions:
1) Anode passivation occurs, resulting in increased cell voltage (energy waste)
2) Production of rough and powdery deposits

Univers
ity of
Cap
e Tow
n
PAGE 34 OF 181-
3) Deterioration of cathode quality and purity
4) Decrease in current efficiency.
A model for the diffusion coefficient of Cu2+ ions in simulated electrorefining electrolytes,
applied by Moats et al., (2000), indicates that rapid precipitation of CuSO4 occurs at the
high current densities used in accelerated passivation experiments.
At some refineries, periodic current reversal is applied which allows operation at higher
current densities. The current reversal of short periods at a specific interval serves as a
de-passivation mechanism, where the anode acts as a cathode and vice versa, thereby
depleting the built up copper concentration within the anodic boundary layer and
preventing the precipitation of CuSO4. The limited use of this technology, however is the
significant increase in energy consumption (Biswas et al., 2002).
2.2.2 Electrolyte
The electrolyte used for copper electrorefining typically consists of CuSO4 and H2SO4.
The effect of the concentrations of these substances on the performance of the
electrorefining process has been thoroughly investigated in previous research.
The importance of H2SO4 in solution is highlighted by Hayes (2003) and a number of
reasons why electrolytes should contain sulphuric acid are given:
1) The inspection of the Eh-pH diagram for the Cu-S-H2O system suggests that formation
of cupric oxide or hydroxide will occur more easily if an acidic solution is not
maintained.
2) Better conductivity can be achieved with an increased acid content, thereby lowering
electrical resistance.
3) Sulphuric acid is generally relatively cheap.
This was confirmed with the work of Casas et al. (2000) who used the Pitzer and Davie
ion-interaction model to simulate the distribution and concentration of chemical species in
sulphuric acid – cupric sulphate solutions. The simulations showed that the
concentrations of the different species are very dependent on pH. It was found that the
conductivity of the aqueous solution increases with acidity.

Univers
ity of
Cap
e Tow
n
PAGE 35 OF 181-
The electrolyte acid and copper concentration not only affect the solubility of copper
sulphate and electrical conductivity but also affect the equilibrium electrode potential as
illustrated by the Nernst relationship (equation 2) in Section 2.1.2.
The presence of Cu2+ in the electrolyte is mainly to reduce cell voltage and anode /
cathode polarisation which is the accumulation of ions around an electrode, causing the
accumulation of a charge. The effect of Cu concentration on these factors is shown in
Figure 2.2.a (Hayes, 2003). However, the solubility of copper at high current densities is
limited and precipitation of CuSO4 will take place if concentrations are too high, resulting
in anode passivation.
Total Cell Volts
Electrolyte Resistance Drop
Cathode PolarisationAnode
Polarisation
Copper Concentration in Electrolyte (g/l)
Vol
ts
0 6030
0.1
0.2
0.3
0.4
Total Cell Volts
Electrolyte Resistance Drop
Cathode PolarisationAnode
Polarisation
Copper Concentration in Electrolyte (g/l)
Vol
ts
0 6030
0.1
0.2
0.3
0.4
The concentration of Cu in the electrolyte also plays a large role in the purity of the
cathodes that are produced. If the Cu concentration across a cell is typically in the range
of 45 g/l to 15 g/l, good commercial purity cathodes are produced but at lower
concentrations (15 g/l to 8 g/l) the cathodes will be impure and will need to be re-melted.
At extremely low concentrations (8 g/l to 0.2 g/l), the cathode will be very impure and will
need purification before being re-melted in the anode furnace (Pletcher and Walsh,
1990).
Figure 2.2.a: The effect of copper concentration in the electrolyte on cell voltage during electrorefining (Hayes. 2003).
Univers
ity of
Cap
e Tow
n
PAGE 36 OF 181-
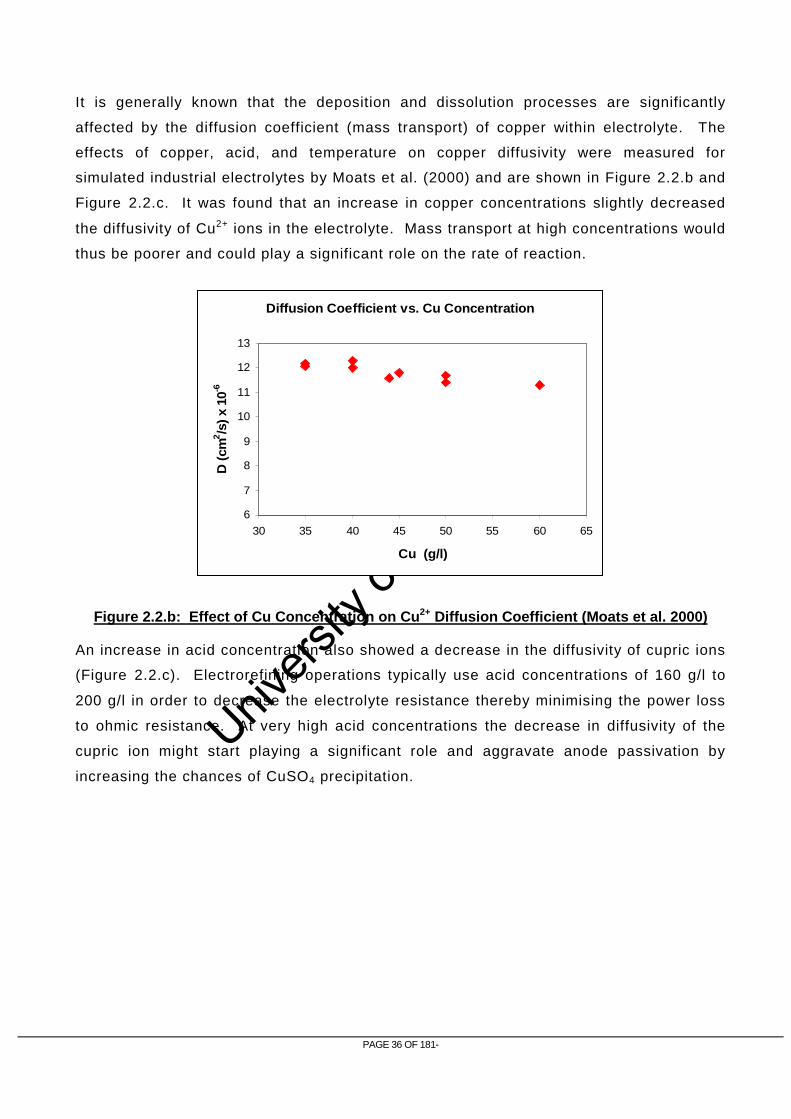
It is generally known that the deposition and dissolution processes are significantly
affected by the diffusion coefficient (mass transport) of copper within electrolyte. The
effects of copper, acid, and temperature on copper diffusivity were measured for
simulated industrial electrolytes by Moats et al. (2000) and are shown in Figure 2.2.b and
Figure 2.2.c. It was found that an increase in copper concentrations slightly decreased
the diffusivity of Cu2+ ions in the electrolyte. Mass transport at high concentrations would
thus be poorer and could play a significant role on the rate of reaction.
Diffusion Coefficient vs. Cu Concentration
6
7
8
9
10
11
12
13
30 35 40 45 50 55 60 65
Cu (g/l)
D (
cm2/s
) x
10-6
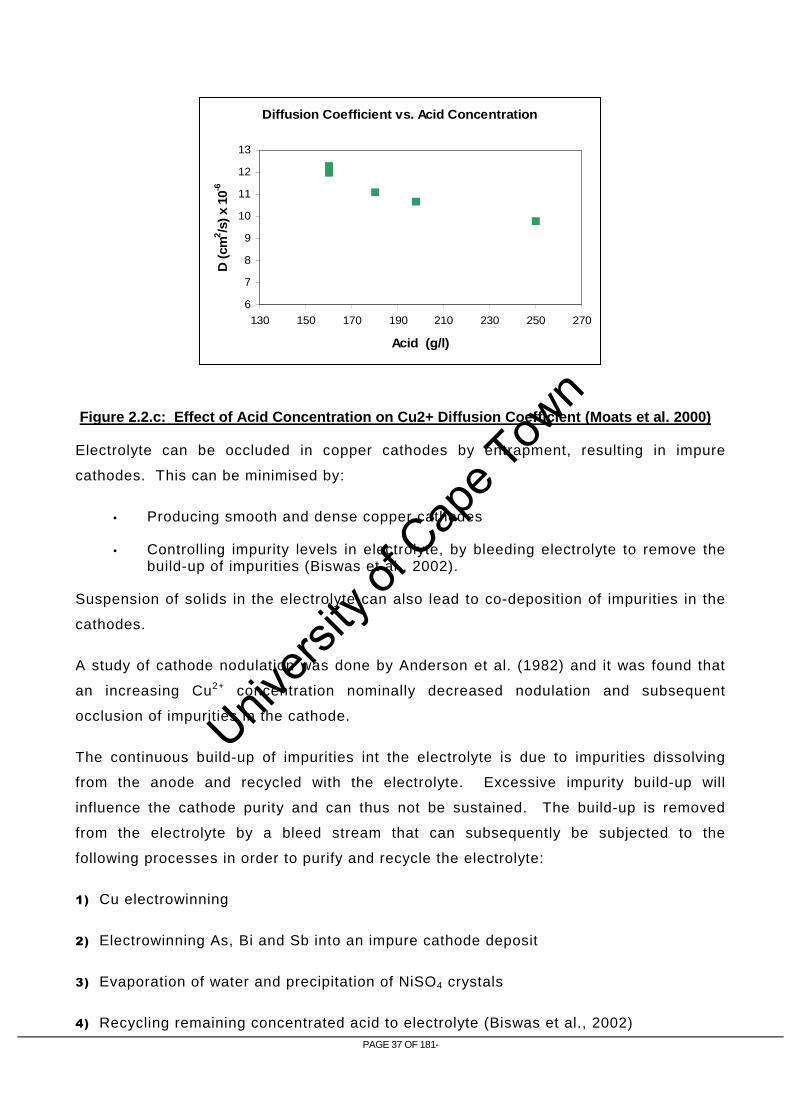
An increase in acid concentration also showed a decrease in the diffusivity of cupric ions
(Figure 2.2.c). Electrorefining operations typically use acid concentrations of 160 g/l to
200 g/l in order to decrease the electrolyte resistance thereby minimising the power loss
to ohmic resistance. At very high acid concentrations the decrease in diffusivity of the
cupric ion might start playing a significant role and aggravate anode passivation by
increasing the chances of CuSO4 precipitation.
Figure 2.2.b: Effect of Cu Concentration on Cu 2+ Diffusion Coefficient (Moats et al. 2000)
Univers
ity of
Cap
e Tow
n
PAGE 37 OF 181-
Diffusion Coefficient vs. Acid Concentration
6
7
8
9
10
11
12
13
130 150 170 190 210 230 250 270
Acid (g/l)
D (
cm2 /s
) x
10-6
Electrolyte can be occluded in copper cathodes by entrapment, resulting in impure
cathodes. This can be minimised by:
• Producing smooth and dense copper cathodes
• Controlling impurity levels in electrolyte, by bleeding electrolyte to remove the build-up of impurities (Biswas et al., 2002).
Suspension of solids in the electrolyte can also lead to co-deposition of impurities in the
cathodes.
A study of cathode nodulation was done by Anderson et al. (1982) and it was found that
an increasing Cu2+ concentration nominally decreased nodulation and subsequent
occlusion of impurities in the cathode.
The continuous build-up of impurities int the electrolyte is due to impurities dissolving
from the anode and recycled with the electrolyte. Excessive impurity build-up will
influence the cathode purity and can thus not be sustained. The build-up is removed
from the electrolyte by a bleed stream that can subsequently be subjected to the
following processes in order to purify and recycle the electrolyte:
1) Cu electrowinning
2) Electrowinning As, Bi and Sb into an impure cathode deposit
3) Evaporation of water and precipitation of NiSO4 crystals
4) Recycling remaining concentrated acid to electrolyte (Biswas et al., 2002)
Figure 2.2.c: Effect of Acid Concentration on Cu2+ Diffusion Coefficient (Moats et al. 2000)

Univers
ity of
Cap
e Tow
n
PAGE 38 OF 181-
An example of impurity build-up in electrolyte leading to cathode impurity was
experienced by a Zambian copper smelter at Mufulira (Nyirenda and Phiri, 1997). It was
found that an increase in Ni content in the anodes (0.1% Ni content) led to an increase of
Ni content in the electrolyte (10 g/l) as well as in the final Cu cathode (1.2 ppm).
Although the London Metal Exchange (LME) Grade A specification is a maximum of 10
ppm Ni in cathode, the copper smelter had a target of only 1 ppm Ni in cathode. A large
bleed stream was required to maintain good cathode quality. The bleed stream was
subsequently evaporated to precipitate NiSO4 crystals and recycle the concentrated acid
to the electrolyte. The LME Grade A specifications for impurities in Cu cathode
production are given in Table 2.2.a (Nicol, 2008):
Element LME Grade A (ppm)
Se 2
Te 2
Bi 2
Sb 4
As 5
Pb 5
S 15
Sn 5
Ni 10
Fe 10
Ag 25
The electrolyte is circulated through the electrorefining cells at a steady slow flow with
one inlet (near the bottom of the cell) on the one side and an overflow outlet at the other.
The importance of this kind of circulation is given by Pletcher and Walsh (1990), it is
stated that a steady slow flow of electrolyte cell is necessary for the following reasons:
• Good temperature control
• Gentle increase in mass transport
• Minimum compositional gradients throughout the cell
• Replenishing of organic additives
• Settling of anode slimes at the bottom of the cell so as not to come into contact with the cathodes.
• Removal (bleed stream) of element build-up in solution such as Ni, Fe etc.
Table 2.2.a: Chemical specifications for copper cathode (Nicol, 2008)

Univers
ity of
Cap
e Tow
n
PAGE 39 OF 181-
2.2.3 Temperature
Temperature plays an important role in the solubility of the elements in the electrolyte as
well as the solution conductivity. Generally, better operation is experienced at high
temperature, but excessively high temperatures will result in significant evaporation and
a reduction in energy efficiency (Biswas et al., 2002). The boiling point of the solution
might also be reached which could result in unwanted gas emissions.
The effect of temperature on the cell voltage and anode / cathode polarisation is shown
in Figure 2.2.d (Hayes, 2003). It can be seen that increased temperature significantly
reduces the electrolyte resistance and cell voltage.
Total Cell Volts
Electrolyte Resistance Drop
Cathode PolarisationAnode Polarisation
Temperature (˚C)
Vol
ts
0 30 60
0.1
0.2
0.3Total C
ell Volts
Electrolyte Resistance Drop
Cathode PolarisationAnode Polarisation
Temperature (˚C)
Vol
ts
0 30 60
0.1
0.2
0.3Total C
ell Volts
Electrolyte Resistance Drop
Cathode PolarisationAnode Polarisation
Temperature (˚C)
Vol
ts
0 30 60
0.1
0.2
0.3
In a model developed by Moats et al. (2000) for the diffusion coefficient, it was also
shown that an increase in temperature increases the diffusion coefficient of Cu2+ ions,
thereby improving mass transport and allowing higher current densities before the
precipitation of CuSO4 occurs. The effect of temperature on the diffusion coefficient as
determined by Moats et al. (2002) is shown in Figure 2.2.e.
Figure 2.2.d: The effect of temperature on the cell voltage during electrorefining (Hayes, 2003)

Univers
ity of
Cap
e Tow
n
PAGE 40 OF 181-
Diffusion Coefficient vs. Temperature
6
7
8
9
10
11
12
13
30 40 50 60 70
Temperature ('C)
D (c
m2 /s
) x 1
0-6
In confirmation of this, Cifuentes et al. (2007) developed a model for the operation of a
laboratory-scale copper electrowinning cell. The model determined that an increase in
temperature decreases the cell voltage and the specific energy consumption, while
increasing the copper production rate slightly.
Biswas (2002) stated that an increase in temperature:
1) Increases the solubility of CuSO4.5H2O thereby preventing it from precipitating on the
anode and causing anode passivation;
2) Lowers electrolyte density and viscosity and can thus allow anode slimes to settle to
the bottom more easily, thus minimising slimes reporting to the cathode;
3) Increases the rate of reaction of Cu dissolving from the anode.
It was found that nodulation is more substantial at temperatures lower than 50˚C and that
it decreased markedly with an increase in temperature to between 50˚C and 70˚C
(Anderson et al. 1982).
Cifuentes and Simpson (2005) investigated the temperature dependence of various
kinetic parameters for the copper electrodeposition reaction. Numerical relationships
between temperature and exchange current density, as well as temperature and limiting
current density were determined experimentally. These relationships are illustrated in
the Figure 2.2.f:
Figure 2.2.e: The effect of temperature on diffusion coefficient (Moats et al. 2002)

Univers
ity of
Cap
e Tow
n
PAGE 41 OF 181-
Cu2+/Cu0 Kinetic Parameters
0
200
400
600
800
1000
1200
1400
25 30 35 40 45 50 55 60 65
Temperature ('C)
Cur
rent
Den
sity
(A
/m2 )
i0 (Exchange Current Density) iL (Limiting Current Density)
The above finding simply shows the importance of increased temperature during
electrorefining.
Cifuentes et al. (2006) also investigated the relationships of species concentration as a
function of temperature in aqueous Cu2+-H2SO4 solutions and found that the species
concentrations are linearly dependent on the operating temperature and that the
prevalent species at high temperatures are [Cu2+] and [HSO4-].
2.2.4 Anodes
In order to cast anodes suitable for electrorefining, blister copper produced from Cu ore
normally needs to be fire refined to remove the excess amounts of S and O. If S and O
concentrations are relatively high in Cu blister, SO2 bubbles (blisters) will form in newly
cast anodes which will make them weak and bumpy. Fire refining takes place in two
steps (Biswas et al., 2002):
1) Step 1 – Selective oxidation by means of injecting air through the molten metal for the
removal of SO2 and other impurities. The S content is reduced to 0.002%.
2) Step 2 – Deoxidation by hydrocarbon (typically propane) reductions for the removal of
oxygen as CO and H2O. Oxygen content is reduced to 0.15% O.
Figure 2.2.f: Kinetic parameters for the Cu 2+/Cu0 reaction on a copper sheet cathode at various temperatures as determined by Cifuentes (2005)

Univers
ity of
Cap
e Tow
n
PAGE 42 OF 181-
This process is similar to the two-stage process that the SLC material of the present
study was subjected to in the Ausmelt TSL furnace.
Most copper anodes are cast in open anode-shaped impressions on top of flat copper
moulds. Newly pored anodes are cooled by spraying water on the tops and bottoms of
the moulds. An example of a typical Cu anode is shown in Figure 2.2.g
(Asarco, Mineral Discovery Centre, 17 July 2009, image at: www.asarco.com/AMDC/smelting.html)
Anodes suitable for electrorefining need to have flat surfaces and uniform thickness.
This is to make sure that all the anodes in an electrorefining cell reach the end of their
useful life at the same time and also contributes to obtaining uniform current distribution
over the surface area and throughout the cell. Vertical and flat anodes essentially
improve cathode purity and increase current efficiency.
One electrorefining cycle generally returns 15-20% of the anode as anode scrap to be
thoroughly washed and remelted. It takes typically 21 days for an anode to dissolve
before it has to be re-melted (Biswas et al., 2002).
The anodes should be manufactured in such a way that as little as possible oxidation
takes place (to minimise passivation) and also to obtain an anode with finely and
homogeneously distributed copper throughout the anode to ensure uniform dissolution of
the anode, subsequently preventing anode disintegration.
Figure 2.2.g: Example of a typical anode casting
Univers
ity of
Cap
e Tow
n
PAGE 43 OF 181-
The Ni concentration in the Cu alloy material used for the anodes of this project is
relatively high (12%) compared to traditional Cu anodes used in electrorefining (0.3%)
and it is thus necessary to investigate the forms in which Ni will present itself in both the
anode and the anode slimes. A study of nickel-bearing copper anodes and anode slimes
were performed by Chen and Dutrizac, b, (1989). It was found that in anodes containing
> 0.3% Ni, NiO crystals, Cu-Ni-Sb oxides, Cu-Ni silicates, NiFe2O4 and other Ni-bearing
iron oxide phases are present along with Ni in solid solution within the copper matrix. It
was shown that all of the oxide nickel phases remain largely undissolved during
electrorefining.
McKay and Peters (1991) suggested that a suitable way to increase copper extractions
by up to 50% is to use a packed particulate anode, thereby increasing the surface area
for dissolution. It was shown that high-grade copper alloy can be successfully
electrorefined using particulate anodes, provided there is no obstruction to convection in
the anode compartment and that the particles sizes are about 1/10 th of the thickness (eg.
2 mm for 20 mm anode thickness) of the anode bag.
This work also established that the presence of Fe and Pb in the copper alloy leads to a
reduction of total copper extraction. It was found that Fe in the form of bornite (Cu5FeS4)
stopped dissolving after losing no more than 25% of its Cu content. .
2.2.5 Additives
Additives, such as chloride, thiourea and glue are used in electrorefining as grain refiners
and levelling agents for deposition. They allow the production of smooth dense cathodes
which will not entrap impurities from the electrolyte or suspended particulates.
In order to minimise entrapment of electrolyte or anode slimes, smooth dense cathodes
are required. The addition of levelling and grain-refining agents (guar gum and thiourea
amongst others respectively) encourages this kind of cathode deposition (Biswas et al.,
2002).
Biswas et al. (2002) stated that the levelling action of glue is caused by the deposition of
the large protein molecules on the tips of protruding copper grains. These protein
molecules create an electrically resistant barrier at the tips of these protrusions and then
forces sideways growth, ultimately creating a dense and level surface.
Chloride ions are a common addition to enhance the dissolution and the use of guar gum
has typically been used as a brightening additive for electrowinning. The drawback in
using guar is that it is hard to dissolve into solution and tends to readily break down. The

Univers
ity of
Cap
e Tow
n
PAGE 44 OF 181-
electroplating in such conditions will be very erratic. Another additive that is often used
is thiourea; however, the use of this results in sulphur co-deposition from the plating
residues in the solution. Sulphur then co-deposits as an undesirable impurity in the
copper deposit (Janik 2001).
Jin and Gali, (2001) also investigated the effect of thiourea on cathode polarisation and
found that at thiourea concentrations of 1, 2 and 4 g/l polarisation of the Cu cathode
occurred at low overpotentials and a depolarisation occurred at high overpotentials.
Between these two occurences there was a transition current density, which increased
with thiourea concentration. This transition current density decreased with time after
thiourea was added due to its apparent decomposition. However, it was stated that at
current densities lower than 350 A/m2, as is currently applied in the industry,
concentrations of thiourea higher than 1 g/l still only produced a polarizing effect on the
copper cathode through the formation of a sulphide film on the cathode.
The effect of additives on anode passivation in electrorefining of copper was investigated
by Ilkhchi et al. (2006). Passivation of industrial copper anodes under high current
densities were reported with the additions of thiourea, glue and chloride ions as
additives. It was found that the addition of glue and thiourea prolongs the time before
passivation at low concentrations but reduces it at higher concentration and that chloride
addition prolongs the passivation time at concentrations higher than 40 ppm.
The addition of most additives increases the polarization of the cathode and results in an
inhibition of Cu deposition (Muresan et al. 1999)
Very good automised additive additions are available for careful monitoring of additives.
The principal levelling agents used in copper electrorefineries are bone glues, and the
principal grain-refining agents are thiourea and chloride ions (added as HCl or NaCl).
The typical glue, thiourea and Cl ion addition in grams per tonne of cathode are 40-90
g/t, 10-60 g/t and 35-65 g/t respectively (Biswas et al, 2002).
2.2.6 Typical Operating Conditions
Typical operating conditions for commercial electrorefining operations were given by
various sources and are shown in Table 2.2.b.

Univers
ity of
Cap
e Tow
n
PAGE 45 OF 181-
Source Current Density A/m 2
Cell Voltage V
Cu g/l
Acid g/l
Temperature ˚C
Additives Y/N
Biswas et al. (2002) 250 – 290 0.3 - 0.4 40-50 170-200 60 – 70
Steam Heated
Yes, 0.02 - 0.05 g/l Cl
1 – 10 ppm levelling agents &
grain refining organics
Pletcher & Walsh (1990)
100 – 200 0.15 - 0.3 40 – 55 180 – 250 60 – 65
Yes, Levellers,
brighteners and surfactants
Moskalyk & Alfantazi (2003)
180 – 280 35 – 45 150 – 220 55 – 65
McKay & Peters (1991)
200 40 200 55
Jin & Gali (2001) 150 – 350 42 160 65
Yes, 4 mg/l thiourea
Chen & Dutrizac (2004)
180 - 300 40 - 45 160 - 280 60 – 66 Yes
2.3 What to Expect During Electrorefining
2.3.1 Behavior of Various Elements in Copper Electrorefining
Ni
As stated before, Ni requires a lower applied potential than Cu and will dissolve from the
anode rapidly. However, it was found that Ni that occurs as NiFe2O4, Cu-Ni-Sb oxides
and other oxidate nickel phases will remain largely undissolved during electrorefining
(Chen and Dutrizac, b, 1989).
Ag, Se and Te
Chen and Dutrizac, a (1989) studied the mineralogical deportment and reaction of Ag
during electrorefining and found that the silver in the copper matrix dissolved, but was
then rapidly precipitated from the electrolyte by a variety of reactions. Part of it is
reduced to its elemental form by the Cu+ ion but can subsequently redissolve. Some
precipitates as a complex Cu-Ag-Pb-As-Se oxidate and some reacts with Cu2(Se,Te)
particulates liberated from the anode and forms copper-bearing silver selenide or silver-
bearing copper selenides. It is important to note that if there is Ag in solution in the
Table 2.2.b: Typical operating conditions of a copper electrorefining process

Univers
ity of
Cap
e Tow
n
PAGE 46 OF 181-
vicinity of the cathode at any time, it will electroplate preferentially to Cu because it
requires a smaller applied potential. However, the reaction of Ag precipitation is
sufficiently fast that the Ag/Se ratio in the bulk anode is an approximate indication of the
Ag/Se ratio of the selenides in the slimes layer.
Au and PGMs
Biswas et al. (2002) stated that Au and PGMs do not dissolve in sulphate electrolyte but
simply drop from the anode surface, as they are liberated, and report to anode slimes.
Au (and possibly other PGMs) that are in solid solution within the copper matrix are
liberated in the elemental form in spike-like particles of <1 µm. Some Au is also detected
in complex Cu-Ag-As-Se oxidate precipitates in the anode slimes (Chen and Durtizac, a,
1988).
Pb, Sn, As, Bi, Co, Sb and S
These elements will essentially dissolve rapidly from the Cu anode and stay mostly in
solution which would cause a build-up in electrolyte, and therefore need to be removed
via a bleed stream to prevent cathode contamination (Biswas et al., 2002). They could
be entrapped in the copper cathode by occlusion.
However, some Pb and Sn re-precipitate as PbSO4 and SnO2 respectively (Biswas et al.,
2002)
Sb and As dissolve electrochemically from copper anodes as trivalent ions but can
oxidises again to a valency of 5 by O2, if there were any dissolved in electrolyte, which is
unlikely. Sb(V) has a lower solubility in electrolytes than As(V), and forms a floating
slime, which is a ragged residue of amorphous structure (Petkova, 1997). During
electrorefining, these floating slime particulates can be included electrochemically in
growing cathode copper deposits.
According to Chen and Dutrizac (2005), Pb, As and Sb would re-precipitate to PbSO4,
SbAsO4, Sb-As oxide, Sb-As-Bi oxide, Pb5(AsO4)3(OH,Cl) and an oxide phase of mainly
Cu-Ag-AsO4-SO4. It was also stated that a high As content facilitates the precipitation of
Sb and Bi from the electrolyte and would cause them to report to the anode slimes. At
some refineries, the concentrations of Sb and Bi in the electrolyte are controlled by
adding Pb and As to the anodes in order to promote precipitation of these impurities.

Univers
ity of
Cap
e Tow
n
PAGE 47 OF 181-
Xiao et al. (2007) also showed that Bi and Sb precipitate as copper arsenite if As is
present in the electrolyte. It was proved that these Bi-Sb-As precipitates reports to the
anode slimes with the undissolved PGMs.
Co and Fe
Like Ni, these base metals will also mostly dissolve in the electrolyte unless they are in
an oxide form which would not dissolve under specific conditions (Biswas, 2002).
The behaviour of different impurities depends on the specific element and the form in
which it is present in the anode and electrolyte. A closer investigation into the
mineralogy of the anode will explain some of the behaviours.
Biswas et al. (2002) presents a table of fractions of anode elements that typically enter
the slimes and the electrolyte (see Table 2.3.a).
Element % to Slimes % to Electrolyte
Cu <0.2 >99.8
Au 100 0
Ag >99 <1
Se 98 2
Te 98 2
Pb 98 2
Bi 60 40
Sb 60 40
As 25 75
S 1 99
Ni 1 99
Co 1 99
Fe 0 100
Zn 0 100
Cathode Purity
Sedzimir et al. (1985) found that in Cu electrorefining with an ammonium electrolyte, an
increase in current density had the following effect on copper cathode impurities:
• Ag content decreases sharply
• Ni increases slightly
Table 2.3.a: Recovery of elements to anode slimes and to electrolyte (Biswas, 2002)

Univers
ity of
Cap
e Tow
n
PAGE 48 OF 181-
• As increases significantly
• Sb decreases sharply
and with an increase in electrolyte temperature:
• Ag increases
• Ni increases
• As decreases
• Sb increases slightly.
It was also found that the ammonia concentration does not have an effect on the impurity
deportment to the copper cathodes.
It is likely that the behaviour of these elements will be similar in a sulphate electrolyte.
2.4 Rustenburg Base Metal Refiners Internal Literature
SLC was successfully treated with a pyrometallurgical process at BMR from 1983 to 1989
where the PGMs were collected in a Cu bullion that was recycled to the smelter. This
mode of operation led to lock-up of PGMs over extended periods, increased overall PGM
losses, and a build-up of process impurities in the process. Thus, in order to treat the Cu
bullion, a process was established whereby the PGMs could be collected in a high grade
alloy. The proposed process involved electrorefining, pressure leaching of anode slimes
and reduction and volatilisation of the lead contained in the anode slimes leach residue
(Hanf et al., 1989). Unfortunately, the Cu bullion production process was stopped due to
operational problems with the furnace and the off-gas treatment.
Some electrorefining experiments were performed and reported by Hanf et al. (1989). A
number of tests with different operating parameters were performed to determine the
optimal conditions. An additional test was done, combining all the optimal operating
conditions and it was found that the PGMs can be separated very efficiently from copper
and other base metals. Figure 2.4.a illustrates the deportment of PGMs after electrolysis
of this copper bullion.

Univers
ity of
Cap
e Tow
n
PAGE 49 OF 181-
Deportment of PGMs
0%
20%
40%
60%
80%
100%
Pt Pd Rh Ru Au Ag
Slimes Electrolyte Cathode
It can be observed that almost all of the PGMs that were present in the anode reported to
the anode slimes with the exception of some of the ruthenium and rhodium, which were
dissolved in the electrolyte. The copper bullion that these tests were performed on
consisted of 90% copper and had very little nickel and iron present. The optimal
operating conditions obtained from this test work were as follows:
• H2SO4 : 190 g/l
• Cu2+ : 40 g/l
• Current density : 200 A/m2
• Voltage : 0.5 V
• Temperature : 60ºC
The mass reduction obtained was 91.3% and the anode slimes still contained ±47% Cu.
Tests were performed at different operating parameters. The deportment results at each
setting are given in Table 2.4.a:
Figure 2.4.a: Deportment of PGMs (190 g/l H 2SO4, 40 g/l Cu, 60ºC, 0.5 V) (Hanf, 1989)

Univers
ity of
Cap
e Tow
n
PAGE 50 OF 181-
H2SO4 Cu Temperature Current Density Results
g/l g/l ˚C A/m 2 80 60 35 ≈200 7% Pt, 60% Rh and 70% Ru lost to electrolyte
180 60 65 ≈200 7% Rh and 60% Ru lost to electrolyte 80 80 60 200 14% Rh and 40% Ru lost to electrolyte
190 40 60 200 1.7% Rh and 20% Ru lost to electrolyte
2.5 Process Design
Anodes can be cast either continuously with a Hazelett twin-belt type caster or a mould-
on-wheel type (Biswas et al., 2002). Anodes are cast with thin tops where the anode is
not submerged to minimise the amount of undissolved anode scrap to be remelted (see
Figure 2.2.g). There are numerous casting methods available, Figure 2.5.a shows an
example of an anode casting wheel. Molten copper is poured into a mould and the wheel
is turned for the next mould. The mass of the copper being cast is sensed and
controlled by load cells at each mould.
(Schoolscience.co.uk, 17 July 2009, image at: http://resources.schoolscience.co.uk/CDA/14-16/cumining)
In order to ensure flat and vertical anodes, refineries generally treat their anodes in an
automated anode preparation machine which performs the following tasks Biswas et al.
(2002):
Table 2.4.a: Results of electrorefining tests performed on BMR Cu bullion by Hanf et al. (1989)
Figure 2.5.a: Copper anode casting wheel

Univers
ity of
Cap
e Tow
n
PAGE 51 OF 181-
1) Weighs the anodes, and redirects under- or overweight anodes back to melting
furnace.
2) Straightens the lugs, and machines a knife edge on each lug (on which the anode
hangs)
3) Flattens anodes with pressure
4) Loads anodes into a spaced rack which will be dropped into an electrorefining cell.
Electrorefining is generally done with typical anode castings of 360 – 400 kg which have
the dimensions of 1 m x 1 m and a thickness of 4 cm – 5 cm. These are stacked between
cathode blanks at a distance of 5 cm. Cathode starter blanks can be either titanium or
stainless steel at a thickness of 1 mm – 3 mm welded to copper support bars. One
electrorefining cycle generally returns 15-20% of the anode as anode scrap to be
thoroughly washed and remelted. It takes typically 21 days for an anode to dissolve
before it has to be re-melted (Biswas et al.,2002).
The process is continuous, with purified electrolyte entering on one end of the cell and
overflowing at the other end of the cell into an electrolyte collection system. Cathodes
are allowed to plate for 7 to 10 days before they are removed from the cell, washed and
stripped from the blanks (cathodes cannot be allowed to grow too thick or too close to the
slime-covered anode surface). The mass of one Cu plate is generally 50–80 kg.
The vertical edges of the cathode blanks are covered with long tight-fitting polymer edge
strips to prevent Cu from plating around the edges of the cathodes. This would make it
very difficult to strip the cathodes. In practice, the sizes of the anodes are generally
slightly longer than the cathodes sheets in the cell. This is to minimise heavy edge
deposits at the bottom edge of the cathode (edge strips will eliminate growth on vertical
edges) (Pletcher and Walsh, 1990).
Industrial cells are 3 m – 6 m long and 1.1 m – 1.3 m deep, leaving a space of 0.1 m –
0.2 m underneath the electrodes. Each cell contains 60 – 70 anode cathode pairs and is
made of pre-cast polymer concrete or made with concrete and lined with a flexible
polyvinyl chloride lining (older applications).
Cells are connected electrically in series to form sections of 20 – 40 cells. Cathodes of
one cell are connected to the anodes of the next cell by placing them all on one bus bar.
Each cell should be able to be isolated for removing anodes and cathodes as well as for
cleaning and maintenance (Biswas et al., 2002).

Univers
ity of
Cap
e Tow
n
PAGE 52 OF 181-
Inco’s copper refinery in Copper Cliff uses anodes of 272 kg that dissolve for 28 days and
plates cathodes for 14 days. Each cell contains 38 anode-cathode pairs and runs at a
current density of 177 A/m2 (Moskalyk and Alfantazi cited Davenport, 2003)
In some applications the anode slimes are recovered from the cell by woven cloth or
polymer bags with controlled porosity that surrounds the anodes and catches the slimes
(Pletcher, 1990). In other cases, the cells are cleaned periodically in order to collect the
slimes.
2.6 Further Processing of Anode Slimes
It has been concluded from the behaviour of various elements in copper that the anode
slimes likely to result from the current Cu alloy will consist mainly of undissolved PGMs
and Ni-bearing iron oxides, re-precipitated Pb and Sn, complex Cu-Ag-Pb-As-Se oxides
and some precipitated Sb-As-Bi oxides. The typical composition of slimes produced from
commercial copper anodes was given by Chen and Dutrizac (2004) and is shown in Table
2.6.a.
Anode (%) Slimes (%) Cu 99 16-24 Au 0.01 0.1-2 Ag 0.1 4-25 Se 0.07 4-15 Te 0.02 0.2-3.5 As 0.04 0.5-2 Sb 0.02 0.3-2 Bi 0.0075 0.1-0.8 Pb 0.1 4-22 Ni 0.55 0.4-26 O 0.14 -
The PGMs present in the anode will behave similarly to Au and report to the slimes. It
can be seen that the base metals, Pb, Ag, Se and Te content in the anode slimes is
significant, and in order to recover the PGMs from the slimes, further processing is
required to remove these impurities. The first step in the typical flowsheet to recover the
PGMs entails a decopperizing step. Many operations apply an air-H2SO4 atmospheric
leach at 80˚C, but in order to reduce processing time and improve copper extraction,
pressure leaching with O2-H2SO4 at elevated pressures and temperatures has also been
considered (Chen and Dutrizac, 2004). Decopperising the anode slimes specified in
Table 2.6.a: Typical composition of commercial Cu anodes and the slimes produced Chen (2004)

Univers
ity of
Cap
e Tow
n
PAGE 53 OF 181-
Table 2.6.a produces a residue with Au concentrated as metallic Au, an Ag-Au-Se phase
and as a solid solution in the Ag-Se phase. It was found (Beauchemin et al., 2007) that
the Sb and Bi mostly dissolve in the decopperizing process but will re-precipitate partly
as BiAsO4, Sb-As-O and Sb-As-Bi-O.
After decopperising, the anode slimes, Ag can be leached from the residue with thiourea
and Fe3+ as oxidant at 60˚C (Amer, 2003).
Au and possibly other PGMs can selectively be leached from impurities such as Pb, Ag,
Sb, Zn, Cu and Sn with chlorination optimisation (Dönmez et al., 1999).
It was also proposed by Hanf et al. (1989) to subject the anode slimes produced from the
BMR Cu bullion to pressure leaching with sulphuric acid and subsequent reduction and
volatilisation of the lead contained in the anode slimes leach residue.

Univers
ity of
Cap
e Tow
n
PAGE 54 OF 181-
3 R E S E A R C H O B J E C T I V E S & A P P R O A C H
3.1 Key Questions
Gathered from the given literature review, the major technical factors in successful
electrorefining are the cathode purity, the production rate and the specific energy
consumption. These factors are influenced primarily by anode quality, electrolyte
conditions and cathode current density.
The electrolyte conditions, current density, temperature, additive addition, circulation
rate and anode composition must be selected in such a way that anodic dissolution
and the deposition of the metal occur with optimum efficiency while none of the
impurity metals can transfer from the anode to the cathode. Good recovery of PGMs
to the anode slimes must be achieved and the slimes must be in a form that can be
easily processed to be purified and sent to PMR for final separation of PGMs. To do
this efficiently, passivation of the anode must be avoided and the anode slimes must
be able to settle to the bottom of the cell fast enough to prevent co-deposition of
PGMs or other impurities in the cathode product.
This project will therefore investigate electrorefining as an option for recovering a
PGM rich stream as well as achieving the separation and recovery of Ni in solution
and Cu as saleable Cu cathodes. The anode slimes produced will be characterised
by their composition and mineralogy in order to foresee further processing
requirements. The proposed process must be safe, cost efficient as well as practical
and sustainable.
3.2 Objectives
The objectives of this project are to:
1) Determine the typical total cell potential, cathodic current efficiency, anodic
copper dissolution rate and deportment of elements (especially PGMs) during
electrorefining of Cu from the alloy produced from the two-stage Ausmelt testwork
on SLC.
2) Characterise the anode slimes formed to determine the behaviour of the PGMs
and other impurities during electrorefining and also to recommend possible
process steps necessary for the purification of the PGM concentrate.

Univers
ity of
Cap
e Tow
n
PAGE 55 OF 181-
3) Evaluate the effect of current density, copper and acid concentration on
electrorefining products and subsequently propose optimal conditions.
4) Perform a preliminary process design, based on experimental results and
knowledge gained from literature study.
3.3 Approach
Anglo Platinum has approached Mintek to conduct the casting of anodes and the
electrorefining tests. The project was planned, supervised and managed by the MSc
candidate at Mintek in conjunction with the Mintek metallurgist responsible for the
project, Ndina Malaudzi throughout the duration of the testwork.
The following approach was followed throughout the duration of the testwork:
1) Identification of key parameters and test matrix.
As can be observed from the literature review, Cu electrorefining is generally
conducted at 160 g/l Sulphuric Acid, 40 g/l Cu, 100-300 A/m2 and 65˚C. Therefore
the test parameters were designed around these industrial operating conditions.
One of the tests was designed to use fresh spent electrolyte from the Cu
electrowinning section at BMR.
2) Development of suitable test cell
The anode dimensions and test duration were selected in such a way that the
amount of slimes produced from one test was sufficient (minimum 20 g) for
mineralogical and chemical analysis thereof. A suitable cell for the selected
anode dimensions was chosen. The heating of the circulated electrolyte was
carried out in a heat exchanger using Proportional–Integral–Derivative (PID)
control with a valve controlling the flow of hot water from a hot water bath into the
heat exchanger.
3) Collect sufficient electrolyte from BMR Cu spent solution and transport to Mintek
4) Determine required electrolyte feed flow rate, recirculation rate as well as
operating period
In order to minimise the time required for performing one test, the anode
dimensions were made as large as possible to obtain a large surface area and

Univers
ity of
Cap
e Tow
n
PAGE 56 OF 181-
subsequent increased rate of dissolution; however, the anode size was limited by
the amount of raw material available.
The feedrate of fresh electrolyte required for a minimum change in Cu
concentration was determined by taking into account the difference between the
rate of Cu deposition and the rate of Cu dissolution. A circulation of electrolyte
was required for temperature control as well as to provide better mass transport.
The circulation rate was chosen to deliver 2.5 electrolyte volume replacements per
hour.
5) Outline and plan experimental methodology, sampling intervals, variables to be
recorded.
6) Production of anodes and dealing with problems encountered during the casting
thereof.
The anodes were cast by the Advanced Materials Division (AMD) of Mintek. The
casting technology of the Cu alloy material has been investigated and discussed
by AMD due to difficulties encountered during the casting process. The report
submitted by AMD is attached in Appendix II for reference.
7) Schedule tests and manpower for continuous ±3 day test runs (continuous
sampling and analysis)
8) Conducting of testwork in Mintek laboratories.
9) Analysis of solution samples by Mintek and solid samples by Anglo Platinum.

Univers
ity of
Cap
e Tow
n
PAGE 57 OF 181-
4 E X P E R I M E N TA L
4.1 Parameters
Eleven experiments were performed with variety combinations of Cu concentration,
H2SO4 concentration and current density combinations (see Table 4.1.a). In each
experiment only one parameter was changed, while all others were kept constant at
the base-case setting of 40 g/l Cu, 160 g/l H2SO4, and 125 A/m2. The Cu and H2SO4
concentrations for the base-case were chosen based on the typical concentrations of
electrorefining, determined during the literature review. The current density for the
base-case setting was chosen to be much lower than what was mentioned in the
literature for two reasons. Firstly, the Cu alloy that is used during this test work has
a much lower Cu content (~80%) than typical anodes in the industry (~99%) and it is
expected that the optimal current density for this material would be lower due to
passivation effects resulting from the high impurity content. Secondly, a conservative
current density might allow us to see the effects of Cu and H2SO4 concentrations
more easily by not being dominated by the effect of high current density. An
additional experiment, with BMR Cu electrowinning spent electrolyte was also
performed to determine the viability of implementing electrorefining without adjusting
the electrolyte within the current operation.
Experiment Current Density Cu Concentration Acid Concentration Special Condition (A/m²) (g/l) (g/l)
Typical Cu Spent Condition 1
125 40 110 Lowest Acid & 55˚C 2 125 40 160 Base-case 3 125 40 160 With Additives 4 100 40 160 Low CD 5 150 40 160 High CD 6 125 30 160 Low Cu 7 125 50 160 High Cu 8 125 40 130 Low Acid 9 125 40 190 High Acid
10 250 40 160 Higher CD 11 300 40 160 Highest CD
During experiments 2 to 11, the temperature was kept constant at 65ºC. Test 2 and
test 3 were carried out under similar conditions with the only difference being the
addition of smoothing additives to test 3 in order to verify the improvement on the
Table 4.1.a: Operating parameter combinations for different tests performed

Univers
ity of
Cap
e Tow
n
PAGE 58 OF 181-
surface morphology of the copper deposit. It was found that the surface morphology
improves significantly with the use of additives and it was decided to continue its
addition for the remainder of the tests.
The concentration of additives added was calculated based on a 10 times reduction
of typical additive addition in the industry (investigated in the literature review). It
was decided to reduce the amount of additive in this way due to the small scale of the
test. The amount of chloride ions, guar gum and thiourea added was calculated to be
± 3.5, 4 and 1 respectively in mg per kg of cathode produced. This related to additive
concentrations in the electrolyte of:
• Chloride: 18 mg/l
• Guar Gum: 6 mg/l
• Thiourea: 3 mg/l
The electrolyte feed and circulating flow rates for each test were 1.5 l/h and 20 l/h
respectively and the anode-cathode spacing was maintained at 3 cm.
The feedrate of fresh electrolyte required for minimum change in Cu concentration
was determined by taking into account the difference between the rate of Cu
deposition and the rate of Cu dissolution. A circulation of electrolyte was required for
temperature control as well as to provide better mass transport. The circulation rate
was chosen to deliver 2.5 electrolyte volume replacements per hour. The anode-
cathode spacing was chosen to mimic typical electrorefining design.

Univers
ity of
Cap
e Tow
n
PAGE 59 OF 181-
4.2 Equipment
The experimental set up of the equipment used is illustrated in Figure 4.2.a.
V A
+ -
Circulating Electrolyte
Anode Cathode
Cell
Feed Box
Fresh Electrolyte Feed
DC Power Output
Cathode
Additives
Spent Electrolyte
HX
V A
+ -
Circulating Electrolyte
Anode Cathode
Cell
Feed Box
Fresh Electrolyte Feed
DC Power Output
Cathode
Additives
Spent Electrolyte
HX
V A
+ -
Circulating Electrolyte
Anode Cathode
Cell
Feed Box
Fresh Electrolyte Feed
DC Power Output
Cathode
Additives
Spent Electrolyte
V A
+ -
Circulating Electrolyte
Anode Cathode
Cell
Feed Box
Fresh Electrolyte Feed
DC Power Output
Cathode
Additives
Spent Electrolyte
V A
+ -
Circulating Electrolyte
Anode Cathode
Cell
Feed Box
Fresh Electrolyte Feed
DC Power Output
Cathode
Additives
Spent Electrolyte
HXHX
An undivided poly propylene cell (Figure 4.2.b) with a working solution volume of ± 8
l was used for each test. One impure Cu anode (see Figure 4.2.c) was placed into
the cell between two stainless steel cathode blanks with a spacing of 30 mm between
the surfaces of the electrodes. The effective anode and cathode areas were
controlled using electroplating tape to cover the anode area that should not be
electrolytically active (the active anode height was kept at 195mm, everything above
that was covered). Each cathode had only one effective plating surface facing the
anode (See Figure 4.2.d).
The feed solution, recirculating flow and the smoothing additives were mixed in the
feed box prior to feeding into the cell. The electrolyte temperature was controlled by
circulating the cell electrolyte through a heat exchanger. The electrolyte was heated
by the flow of hot water from a hot water bath through an inlet valve to the heat
exchanger which uses PID control. The heat exchanger used is shown in Figure
4.2.e.
Figure 4.2.a: Expirimental set up

Univers
ity of
Cap
e Tow
n
PAGE 60 OF 181-
The experiments were conducted by feeding a constant current through a rectifier.
Each electrode (anode and both cathode) were connected to the rectifier with two
wires on each side of the electrode for better current distribution. The cell potential
was monitored throughout the test with a multimeter by taking measurements on the
hanger bars of a cathode and the anode for each cathode.
Figure 4.2.b: Polypropolene cell connected to thermocouple, heat exchanger, feed, spent and
recyle lines
Figure 4.2.c: Impure Cu anode before test
Figure 4.2.d: Cu deposit on stainless steel cathode with one effective plating
surface of 20 cm x 14 cm
Figure 4.2.e: Heat exchanger connected to hot water bath with PID
controller
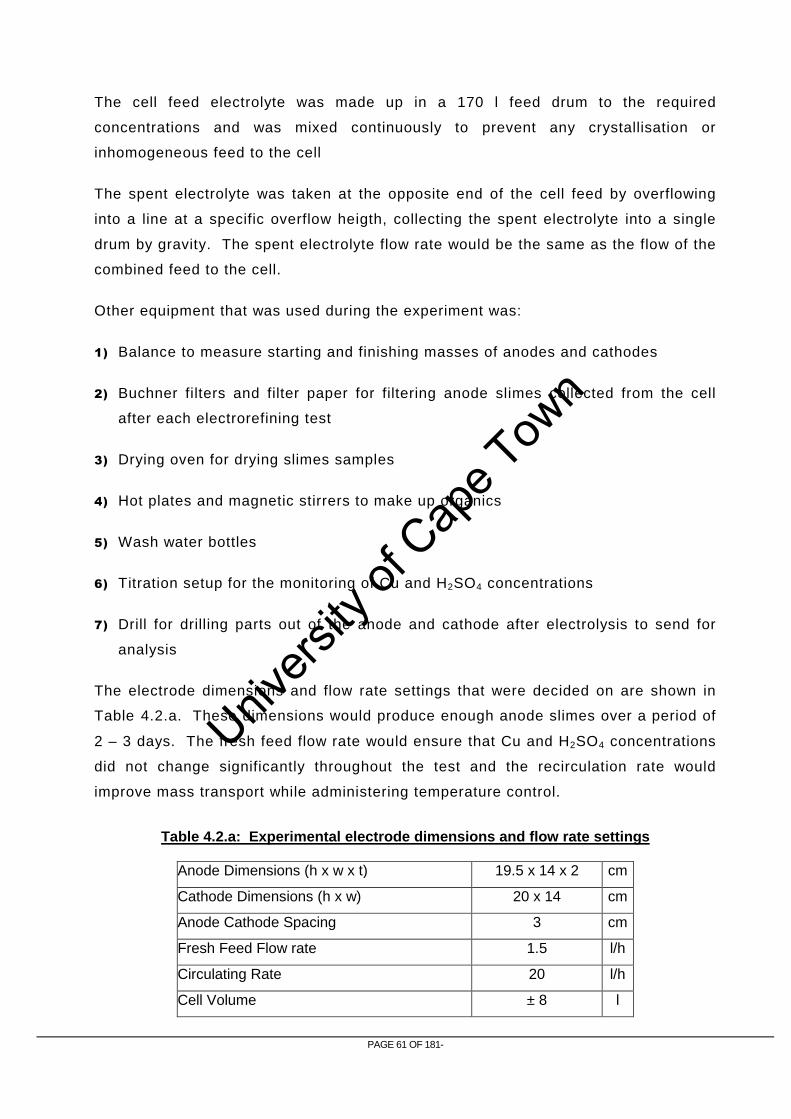
Univers
ity of
Cap
e Tow
n
PAGE 61 OF 181-
The cell feed electrolyte was made up in a 170 l feed drum to the required
concentrations and was mixed continuously to prevent any crystallisation or
inhomogeneous feed to the cell
The spent electrolyte was taken at the opposite end of the cell feed by overflowing
into a line at a specific overflow heigth, collecting the spent electrolyte into a single
drum by gravity. The spent electrolyte flow rate would be the same as the flow of the
combined feed to the cell.
Other equipment that was used during the experiment was:
1) Balance to measure starting and finishing masses of anodes and cathodes
2) Buchner filters and filter paper for filtering anode slimes collected from the cell
after each electrorefining test
3) Drying oven for drying slimes samples
4) Hot plates and magnetic stirrers to make up organics
5) Wash water bottles
6) Titration setup for the monitoring of Cu and H2SO4 concentrations
7) Drill for drilling parts out of the anode and cathode after electrolysis to send for
analysis
The electrode dimensions and flow rate settings that were decided on are shown in
Table 4.2.a. These dimensions would produce enough anode slimes over a period of
2 – 3 days. The fresh feed flow rate would ensure that Cu and H2SO4 concentrations
did not change significantly throughout the test and the recirculation rate would
improve mass transport while administering temperature control.
Anode Dimensions (h x w x t) 19.5 x 14 x 2 cm
Cathode Dimensions (h x w) 20 x 14 cm
Anode Cathode Spacing 3 cm
Fresh Feed Flow rate 1.5 l/h
Circulating Rate 20 l/h
Cell Volume ± 8 l
Table 4.2.a: Experimental electrode dimensions and flow rate settings

Univers
ity of
Cap
e Tow
n
PAGE 62 OF 181-
4.3 Procedures
4.3.1 Anode Casting
The anode material was cast into silica sand moulds. Figure 4.3.a is a picture of the
cross section of the original material. Figure 4.3.b shows the bottom half of the
closed top mould that was used for most of the anodes. A number of different
variations of this mould were used in an attempt to produce anodes with as little as
possible shrinkage and gas captured so that it can have a smooth surface. A number
of the moulds that were produce did not satisfy the desire for a smooth surface and
were recycled to the original material to be remelted. These anodes are referred to
as failed anodes. The casting procedure and technology for producing anodes, as
well as the challenges that were encountered were discussed by AMD in a report
provided to Anglo Platinum. This report is attached as Appendix II. The furnace that
was used for the melting of the material is shown in Figure 4.3.c where the molten
material is being transferred from the furnace to the casting ladle. The casting ladle
was then used to poor the molten metal into the mould in a controlled fashion. This
is shown in Figure 4.3.d.
Figure 4.3.a: Original material (two-stage Ausmelt TSL alloy product)
Figure 4.3.b: Bottom half of silica sand mould for anodes

Univers
ity of
Cap
e Tow
n
PAGE 63 OF 181-
Due to a limited amount of raw material, the failed anodes and remaining anode
scrap from previous tests were re-melted to cast more anodes. This could have lead
to a slight change in anode composition due to silica contamination from the moulds
or other forms of contamination. Between test 7 and test 8 a significant change
occurred in the composition of the anode material, possibly due to contamination of
the molten material. Hence, the initial anodes for tests 8 to 11 were inconsistent with
the rest of the anodes and cannot be compared to the rest of the tests.
4.3.2 Electrorefining Testwork
All the input and output solid products and solution volumes were weighed and
recorded as accurately as possible for mass-balancing purposes.
The procedures that were followed during the conducting of a test are described in
detail.
Feed Solution Preparation
150 l of feed solution was measured into a calibrated drum and the Cu and H2SO4
concentrations were adjusted to the required test settings by diluting or spiking with
CuSO4.5H2O and 98% H2SO4 respectively. Chloride ions were added by adding a
specific amount of NaCl that would result in 18 mg/l Cl- ions.
Figure 4.3.c: Molten metal transferred from furnace to casting
ladle
Figure 4.3.d: Molten metal cast into closed top silica sand mould
Univers
ity of
Cap
e Tow
n
PAGE 64 OF 181-
The guar and thiourea was made up in solutions with concentration of 300 mg/l and
150 mg/l respectively. These solution mixtures would be added to the cell at a
controlled rate of 0.5 ml/min throughout the test which would result in the additive
concentration in the electrolyte of 6 mg/l and 3 mg/l.
Cathode and Anode Preparation:
The cathode surface was prepared by buffing with 180 grit sandpaper and then taping
off to the required cathode area with electroplating tape. The cathode was then
dipped in a 1:1 (v/v) nitric acid-water solution for 30 minutes and allowed to drip dry
prior to inserting it into the cell. The anode surface was washed under running water
to ensure that the surface was clean.
Filling Up the Cell
After ensuring that the cell was clean and free from any solids or solutions, the
cathodes and anode were inserted in the cell and positioned to be exactly 3 cm apart.
The cell was then filled with fresh electrolyte until there was an overflow of solution
into the spent electrolyte line. Guar and Thiourea was added to the cell fill
electrolyte to obtain concentrations of 6 mg/l and 3 mg/l respectively. The
recirculation pump was then switched on to allow the heat exchanger to fill up before
topping the cell up again. The recirculation pump was subsequently calibrated, as
well as the feed pump and organic pump. The recirculation pump was then started to
warm up the solution to the required temperature before the test could start. A
sample was taken of the electrolyte when the test was started.
The negative terminal of the power source was then connected to both cathodes at
two places on each cathode and the positive terminal of the power source was
connected to the anode at two places.
Once all of the above procedures were completed, the test was started.
During the Test:
At the start of the test, the fresh feed and organic pumps were started and the power
source was switched on by setting the current according to the required current
density and surface area.
Throughout the test, the following readings were monitored:

Univers
ity of
Cap
e Tow
n
PAGE 65 OF 181-
• Solution temperature
• Current
• Voltage readings between the anode and both cathodes
• Feed flow rate
• Cu and H2SO4 concentration (by titration).
Samples were also taken throughout the test of the spent electrolyte in order to
monitor the concentration profiles of different elements.
After the Test:
After the test the electrolyte in the cell was drained and filtered to separate the anode
slimes from the electrolyte. The anodes and cathodes were taken out of the cell,
scraped clean and rinsed with filtered electrolyte to recover slimes attached to them.
The slimes were washed twice with 800 ml of 100 g/l H2SO4, before being weighed
and placed in a drying oven overnight at 60˚C. The cathodes were stripped from the
stainless steel blanks and weighed before being drilled for sampling. A sample of all
the spent electrolyte collected was taken after agitating it for a period of time to
ensure homogenous composition. Examples of an anode after being dissolved and
anode slimes are shown in Figure 4.3.e and Figure 4.3.f, respectively.
Figure 4.3.e: Anode surface after dissolution in test 1
Figure 4.3.f: Anode slimes on filter paper produced from test 5

Univers
ity of
Cap
e Tow
n
PAGE 66 OF 181-
4.4 Sample Analysis
4.4.1 Electrolyte Samples
The copper and acid concentrations were monitored by titration. The acid was titrated
with 0.51 M sodium bicarbonate using a mixed indicator. The copper was titrated
using potassium iodide and sodium thiosulphate using starch as the indicator. The
rest of the chemical analyses were carried out by the Mintek Analytical Services
Division (ASD) using ICP-OES and ICP-MS.
4.4.2 Cathode Samples
The cathode analysis was also conducted by ASD. The anode and copper deposits
were drilled at the top, middle and bottom along the width of each anode and copper
deposit. 15 g of the solid sample were dissolved in 70 g of nitric acid (65%). The
dissolved metal was then diluted with deionised water in a 250 ml flask before
sending the samples for analysis. The only element analysed using solid samples
was sulphur for both the anode and cathode samples.
4.4.3 Anode Slimes and Anode Samples
The anode slimes and anodes were analysed at Anglo Research Laboratories using
mass spectrometry for PGM analysis. The elements that were analysed for were as
follows:
1. Pt 2. Pb 3. Pd 4. As 5. Rh 6. Al 7. Ru 8. S 9. Ir 10. Cr 11. Os 12. Mg 13. Au 14. Si 15. Ag 16. Te 17. Cu 18. Sb 19. Ni 20. Bi 21. Fe 22. Sn 23. Co 24. Se 25. Ca 26. Zn
The mineralogical analyses were performed with the Scanning Electron Microscope
with Energy Dispersive X-ray analysis (SEM-EDX) technique. The analysis is
standardless and normalised. The detection limit for elements is 0.5 mass percent
within a phase. It was set to detect oxide or element/alloy. The SEM-EDX analysis
cannot determine OH / H2O compositions.

Univers
ity of
Cap
e Tow
n
PAGE 67 OF 181-
5 R E S U LT S A N D D I S C U S S I O N
5.1 Background
The testwork showed that electrolytic refining of the Cu alloy, produced by a two
stage pyrometallurgical treatment of current SLC, produces a highly concentrated
PGM residue at an overall SLC mass reduction of 99.3%, with excellent PGM
recovery to the anode slimes material. The different operating parameters that were
tested successfully all showed very good repeatability and greater than 99% PGM
recovery. An unfortunate contamination of the original material occurred before high
current densities and different H2SO4 concentrations could be tested; however, the
data collected proved to be useful and sufficient for the objectives of this project.
The typical operating conditions that were observed correlated well with literature and
the theoretically calculated values. The characteristics of anode slimes stayed
relatively similar throughout the different operating parameters and strong confidence
can be placed in the production thereof and the recovery of the PGMs. The
characteristics of the spent electrolyte and the Cu cathodes were also found to be
suitable for integration in the BMR circuit. The results obtained during this testwork
are discussed in detail in this section.
5.2 Change in Anode Composition
Due to difficulties encountered during the casting of the anodes (see Appendix II), a
significant contamination of the original material occurred after the 7 th test. Due to a
limited amount of raw material, there was no fresh material without the contamination
to continue the remainder of the tests. Although the rest of the tests were performed
with the altered material, it was found that the change in behaviour during the tests
was significant and the results of tests 8 to 11 could not be compared to the rest of
the earlier tests. Although the actual chemical composition of the anode material
only changed slightly with the amount of silicon captured in the material, the phases
that occurred in the anode changed from a Cu, Ni metal matrix to an alloy of the Cu,
Ni, Fe and Si as a silicide in the anode. The clear differences between the original
material and altered material can be seen in Figure 5.2.a and Figure 5.2.b.

Univers
ity of
Cap
e Tow
n
PAGE 68 OF 181-
In Figure 5.2.a, it can be seen that the metal matrix is clean and simple. It consists
mainly of three phases:
1) Light grey – the metal matrix containing mainly Cu, Ni and Fe in metal form.
2) Dark grey – a CuS alloy containing mainly Cu, S and also Te.
3) Bright white – An alloy containing mostly Pb, Bi, Ag, and also some Pd.
In Figure 5.2.b of the altered material, the above phases still existed but it was found
that the light grey Cu-Ni-Fe phase contained much less Ni and Fe and was more
concentrated in Cu. The Ni and Fe were present in a fourth phase (the darker grey
needles embedded in the metal matrix). This phase also contained Si which points to
an alloy of a Ni, Fe silicide which also contains Cu to a certain extent.
This change in the mineralogical composition of the material led to dramatic
influences on the behaviour of the anodes during dissolution. Some of the major
changes in behaviour were the following:
1) The colour of the anode changed significantly from a brassy silver colour to a
reddish copper colour.
2) Significant passivation of anodes occurred within a short period of time. This was
indicated by the step change in cell potential that can be observed in Figure 5.2.c.
The rest of the tests that were performed with the altered material showed similar
trends and can be seen in Appendix I, Section D.
Figure 5.2.a: MLA backscattered electron image of anode cast from original material
Figure 5.2.b: MLA backscattered electron image of anode cast from altered material
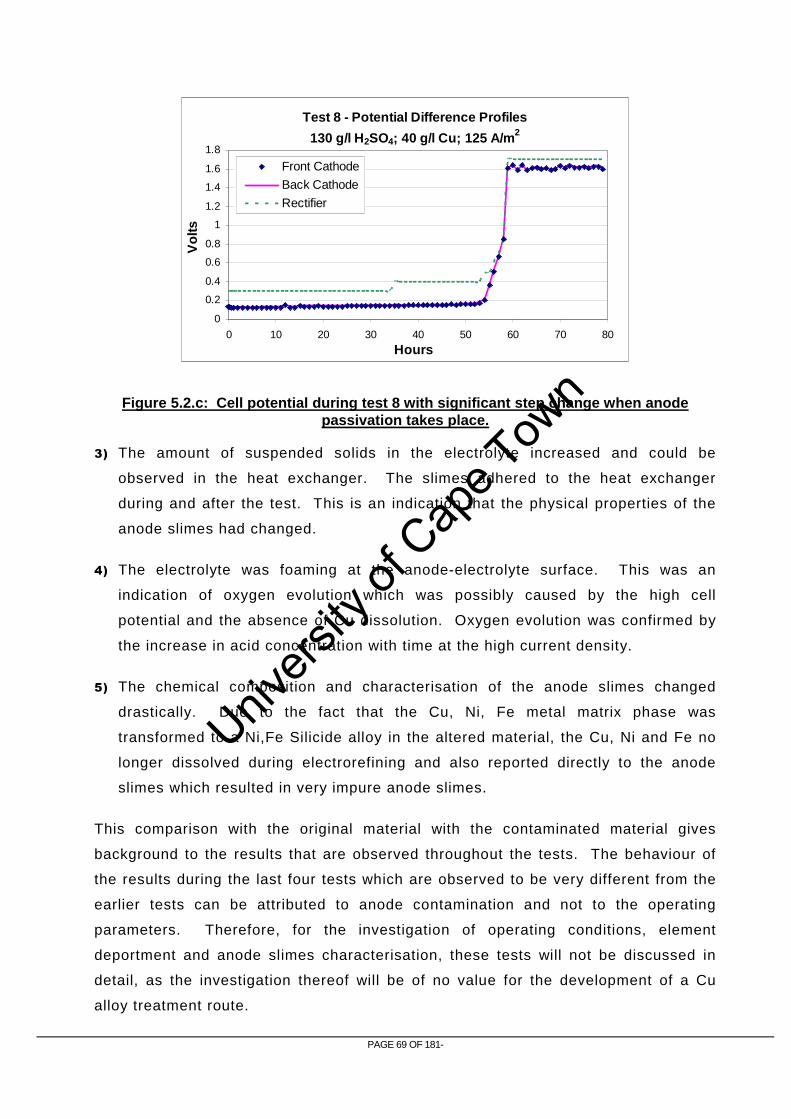
Univers
ity of
Cap
e Tow
n
PAGE 69 OF 181-
Test 8 - Potential Difference Profiles
130 g/l H 2SO4; 40 g/l Cu; 125 A/m 2
0
0.2
0.4
0.6
0.8
1
1.2
1.4
1.6
1.8
0 10 20 30 40 50 60 70 80
Hours
Vol
ts
Front Cathode
Back Cathode
Rectifier
3) The amount of suspended solids in the electrolyte increased and could be
observed in the heat exchanger. The slimes adhered to the heat exchanger
during and after the test. This is an indication that the physical properties of the
anode slimes had changed.
4) The electrolyte was foaming at the anode-electrolyte surface. This was an
indication of oxygen evolution which was possibly caused by the high cell
potential and the absence of Cu dissolution. Oxygen evolution was confirmed by
the increase in acid concentration with time at the high current density.
5) The chemical composition and characterisation of the anode slimes changed
drastically. Due to the fact that the Cu, Ni, Fe metal matrix phase was
transformed to a Ni,Fe Silicide alloy in the altered material, the Cu, Ni and Fe no
longer dissolved during electrorefining and also reported directly to the anode
slimes which resulted in very impure anode slimes.
This comparison with the original material with the contaminated material gives
background to the results that are observed throughout the tests. The behaviour of
the results during the last four tests which are observed to be very different from the
earlier tests can be attributed to anode contamination and not to the operating
parameters. Therefore, for the investigation of operating conditions, element
deportment and anode slimes characterisation, these tests will not be discussed in
detail, as the investigation thereof will be of no value for the development of a Cu
alloy treatment route.
Figure 5.2.c: Cell potential during test 8 with significant step change when anode passivation takes place.
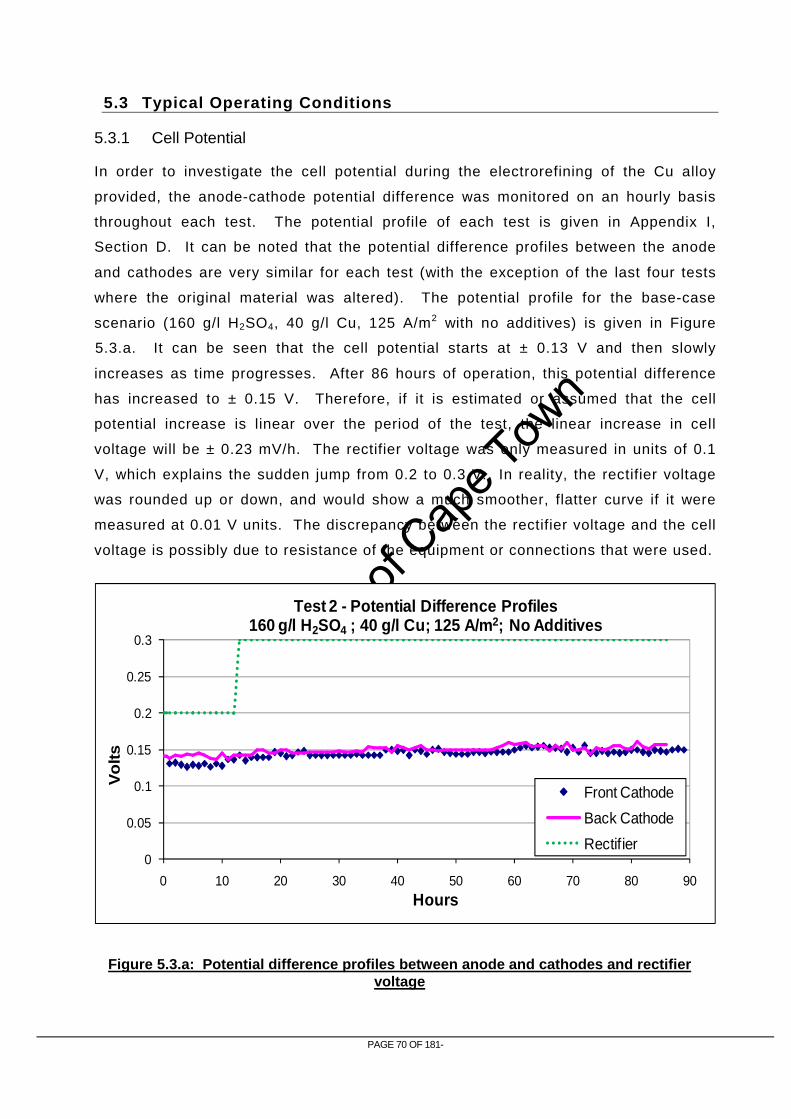
Univers
ity of
Cap
e Tow
n
PAGE 70 OF 181-
5.3 Typical Operating Conditions
5.3.1 Cell Potential
In order to investigate the cell potential during the electrorefining of the Cu alloy
provided, the anode-cathode potential difference was monitored on an hourly basis
throughout each test. The potential profile of each test is given in Appendix I,
Section D. It can be noted that the potential difference profiles between the anode
and cathodes are very similar for each test (with the exception of the last four tests
where the original material was altered). The potential profile for the base-case
scenario (160 g/l H2SO4, 40 g/l Cu, 125 A/m2 with no additives) is given in Figure
5.3.a. It can be seen that the cell potential starts at ± 0.13 V and then slowly
increases as time progresses. After 86 hours of operation, this potential difference
has increased to ± 0.15 V. Therefore, if it is estimated or assumed that the cell
potential increase is linear over the period of the test, the linear increase in cell
voltage will be ± 0.23 mV/h. The rectifier voltage was only measured in units of 0.1
V, which explains the sudden jump from 0.2 to 0.3 V. In reality, the rectifier voltage
was rounded up or down, and would show a much smoother, flatter curve if it were
measured at 0.01 V units. The discrepancy between the rectifier voltage and the cell
voltage is possibly due to resistance of the equipment or connections that were used.
0
0.05
0.1
0.15
0.2
0.25
0.3
0 10 20 30 40 50 60 70 80 90
Vo
lts
Hours
Test 2 - Potential Difference Profiles160 g/l H 2SO4 ; 40 g/l Cu; 125 A/m 2; No Additives
Front Cathode
Back Cathode
Rectifier
Figure 5.3.a: Potential difference profiles between anode and cathodes and rectifier voltage

Univers
ity of
Cap
e Tow
n
PAGE 71 OF 181-
The reason for the increase in cell potential could be a function of the following
factors:
1) The resistance to current flow will increase with an increase in suspended solids
due to anode dissolution. In this case, it could be anticipated that the amount of
solids in suspension in the electrolyte could reach equilibrium when the amount of
solids released from the anode into electrolyte is equal to the amount of solids
settling at the bottom of the cell per unit of time. When this equilibrium occurs,
the cell potential due to suspended solids would stay constant. However, given
the low solids density, the effect of suspended solids is unlikely to be a
measurable effect.
2) Decrease of chemically active surface area resulting in anode passivation. Cell
potential will increase if there is an increase in anode passivation. Slight anode
passivation could occur as a larger fraction of the anode is being dissolved.
Some of the particles around the easily dissolved species that do not dissolve will
drop from the anodes, but some will stay attached to the anode surface, thereby
forming a slimes layer on the anode and reducing the chemically active surface
area available for dissolution. Decreased dissolution results in lower current
through the cell and increased cell potential.
3) Increase in anode or cathode polarization over time as a function of metal
concentration in the vicinity. As the metal ion dissolves from the anode, the metal
concentration will increase in the vicinity of the anode surface area. If the metal
concentration becomes too high it might precipitate slightly as CuSO4 and prevent
further dissolution of the anode and resistance to current flow will increase.
Similarly, if the metal concentration in the vicinity of the cathode surface is too low
due to lack of mass transport or excessive current density, there will be less ions
available for depositing on the cathode and resistance will be increased.
If it is assumed that the cell potential increases linearly at a rate of 0.23 mV/h over
the entire time of electrorefining and that the typical dissolution time is 21 days (as
stated in the literature review, Section 2.5), the total increase in cell potential will be
± 0.177 V, resulting in a terminal voltage of 0.25 V. The total power consumption for
dissolving 147.29 g/m2.h (as it is in the base-case) is calculated with the following
equation:
m
VItP = kWh/kg (15)

Univers
ity of
Cap
e Tow
n
PAGE 72 OF 181-
where V : Average cell voltage (V)
I : Applied current (A)
t : Time of dissolution or plating (s)
m : Mass of anode dissolved or Cu plated (g)
P : Power consumption (kWh/kg)
(In this case current and mass were used per 1 m2 area which cancels out in the
equation).
Thus,
kgkWh
dayshrshrmg
hrsdaysmAV
P
/16.0
2124./29.147
2421/1252
13.025.0
2
2
=××
×××
+
= (16)
The same equation was used to determine the power consumption per kg of anode
dissolved and kg of Cu cathode produced for each test and the results are shown in
Table 5.3.a. The last four tests show a significant increase in power consumption (in
grey italic) due to the passivation that occurred during the test as a result of the
different composition of the anode relative to the original material (the passivation
can be observed in the potential difference profiles given in Appendix I, Section D).
Test Special Condition kWh/kg Cu Produced
kWh/kg Anode Dissolved
Test 1 110 g/l H2SO4 0.225 0.217 Test 2 Base-case* 0.125 0.118 Test 3 With Additives 0.121 0.115 Test 4 100 A/m2 0.111 0.104 Test 5 150 A/m2 0.140 0.131 Test 6 30 g/l Cu 0.126 0.121 Test 7 50 g/l Cu 0.128 0.123 Test 8 130 g/l H2SO4 0.475 0.460 Test 9 190 g/l H2SO4 0.850 0.961 Test 10 250 A/m2 1.135 1.506 Test 11 300 A/m2 1.344 2.220
*160 g/l H2SO4, 40 g/l Cu, 125 A/m2
Table 5.3.a: Power consumption for each test i.t.o kWh/kg Cu produced and anode dissolved
Univers
ity of
Cap
e Tow
n
PAGE 73 OF 181-
5.3.2 Current Efficiency
Current efficiency is a measure of how efficiently the current is being used to perform
only the desired tasks. With regards to cathode current efficiency, it will be the
fraction of the current that is utilised to plate Cu and with regards to anode current
efficiency, it will be the fraction of the current that is used to dissolve the targeted
metal (Cu) from the anode. In typical industrial electrorefineries, the impure anodes
are composed of ±99% Cu; however, the anode material used in the present
experiments is composed of a large amount of Ni and Fe as well. Thus, the current
will not only be used to dissolve Cu but also Ni and Fe and these have to be taken
into account when calculating the anode current efficiencies. If it is assumed that the
impure anodes contain on average 12% Ni and 4% Fe and the remainder of the
dissolvable metal is Cu, the equations for calculating anode and cathode current
densities are as follows:
Anode: ( )
( ) 100..).16.01(.04.0.12.0
..x
tIMMM
Fnmm
CuFeNi
slossa
−++−=ξ (17)
Cathode: 100..
..x
tMI
Fnm
cu
Cuc
=ξ (18)
Where ξ : the current efficiency for the anode (a) or cathode (c), (%)
mCu : mass of copper plated on cathode, (g)
MCu/Ni/Fe: molecular mass of Cu or Ni or Fe, (g/mol)
n : number of electrons transferred/mole Cu plated or anode dissolved
F : Faraday constant, (96 487 C/mol)
I : applied current, (A)
t : duration of deposition or dissolution, (s)
m loss : mass of anode lost during period of dissolution, (g)
ms : mass of slimes produced during period of dissolution, (g)
These calculations assume that each metal dissolves in proportion to its composition
in the alloy, which would be most likely if the metals were all in their metallic form in
the alloy. The mineralogy and composition of the anodes are discussed in more
detail in section 5.4. The current efficiencies achieved are shown in Table 5.3.b. An
interesting observation is the high anode current efficiencies (>100%) in cases where
the H2SO4 concentration was higher than 110 g/l. This is an indication that current is

Univers
ity of
Cap
e Tow
n
PAGE 74 OF 181-
not the only contributor to the dissolution of anodes. It is well known that direct acid
leaching of base metals is possible in strong acidic solutions. Thus, it is possible
that some copper dissolution took place purely due to leaching. This suspicion gains
further confidence during the characterisation of the anode slimes in Section 5.4.1. It
was considered that an inaccuracy of the mass of slimes produced due to loss of
solids to filter paper and attachment to the anode or cathode after electrorefining
could have played a roll in the calculation of the current efficiency. The sensitivity of
the calculation to the slimes mass was tested and it was found to be considerably
insensitive. Thus, there is a high confidence in the calculation of the anode current
efficiency.
Test Special Condition Anode ξ (%) Cathode ξ (%) Test 1 110 g/l H2SO4 94.1 98.8 Test 2 Base-case* 102.4 98.6 Test 3 With Additives 100.8 97.5 Test 4 100 A/m2 101.5 96.7
Test 5 150 A/m2 103.4 98.4
Test 6 30 g/l Cu 99.9 98.4
Test 7 50 g/l Cu 99.8 98.5
Test 8 130 g/l H2SO4 86.8 96.5
Test 9 190 g/l H2SO4 69.2 97.4
Test 10 250 A/m2 60.0 97.4
Test 11 300 A/m2 50.7 96.7
*160 g/l H2SO4, 40 g/l Cu, 125 A/m2
It can be observed that current efficiencies of >98% for the deposition of Cu can be
easily obtained. In cases where the original material was different (Tests 8 – 11), the
cathode current efficiencies were lower. This is most likely due to the fact that the
reactions that were taking place were more of an electrowinning nature than
electrorefining. This can be assumed due to the high cell potential after a certain
period of time, the oxygen evolution that took place (see Section 5.1) and the low
anode current efficiencies.
5.3.3 Anodic Cu Dissolution
Figure 5.3.b shows the actual dissolution rate compared to the theoretical dissolution
rate of the Cu, Ni, Fe alloy (84%, 12%, 4%, respectively) at the different operating
conditions. During the initial tests, the dissolution rate followed the theoretical
dissolution closely, but is slightly higher. This is due to the possible leaching of
Table 5.3.b: Anode and cathode current efficiencies under various conditions

Univers
ity of
Cap
e Tow
n
PAGE 75 OF 181-
anode material due to high acid concentrations. In the last four tests the actual
dissolution was significantly less than the theoretical as discussed earlier. The
dissolution at 30 g/l and 50 g/l was also slightly lower than the theoretical prediction;
it could be due to slight contamination of anodes that already took place during the
production these anodes (when investigating the content of these anodes, slight
increases in Si content was observed, Appendix I, Section E). Figure 5.3.b and
Table 5.3.c shows that the main contributor to anode dissolution is current density,
and the electrolyte concentrations play only a minor role.
Dissolution Rate
0
50
100
150
200
250
300
350
400
110 g/lAcid
BaseCase
WithAdditives
100 CD 150 CD 30 g/l Cu 50 g/l Cu 130 g/lAcid
190 g/lAcid
250 CD 300 CD
Special Condition
Dis
solu
tion
Rat
e (g
/m2 hr
)
Theoretical Anode Dissolved
Actual Anode Dissolved
Figure 5.3.b: Theoretical and actual anode dissolution rate under various operating conditions

Univers
ity of
Cap
e Tow
n
PAGE 76 OF 181-
Test Special Condition Anode
Dissolution (%/m2.h)
Actual Dissolution
(g/m 2.h)
Theoretical Dissolution
(g/m 2.h) Test 1 110 g/l H2SO4 1.8 137.6 146.1 Test 2 Base-case* 3.0 149.5 146.1 Test 3 With Additives 2.6 147.3 146.1 Test 4 100 A/m2 2.1 118.7 116.9
Test 5 150 A/m2 3.2 181.3 175.3
Test 6 30 g/l Cu 2.6 145.9 146.1 Test 7 50 g/l Cu 2.5 145.8 146.1
Test 8 130 g/l H2SO4 3.1 126.8 146.1
Test 9 190 g/l H2SO4 4.7 101.0 146.1
Test 10 250 A/m2 2.8 175.4 292.2
Test 11 300 A/m2 3.5 177.7 350.7
*160 g/l H2SO4, 40 g/l Cu, 125 A/m2
If operating at a current density of 150 A/m2 with a typical industrial anode design
(360 kg, 1 m x 1 m, and 20% scrap rate) the dissolution cycle period for an anode will
be 34 days. This period can be reduced by increasing current density to increase
dissolution while not sacrificing efficiency, but this could not be confirmed in the
current test work.
With application to the BMR, the Cu anode production will be ±1320 t/a. Thus, 428
anode/cathode pairs will be required for the treatment of all the Cu alloy produced
per year with a cycle time of 34 days at 150 A/m2.
5.3.4 Element Deportment
Overall Mass Balance
In order to perform a mass balance the input and output streams were identified as
the following:
In:
1) Mass of element removed from the surface of the anode = grade in initial anode x
(mass of initial anode – mass of final anode)
2) Mass of element in electrolyte feed = concentration in electrolyte feed x total
volume fed during the test (flow rate x time)
Table 5.3.c: Actual and theoretical dissolution rate under different conditions

Univers
ity of
Cap
e Tow
n
PAGE 77 OF 181-
Out:
1) Mass of element in slimes = grade in slimes x mass of slimes
2) Mass of element in cathode = (grade in front cathode x mass of front cathode) +
(grade in back cathode x mass of back cathode)
3) Mass of element in spent electrolyte = concentration in spent electrolyte x total
volume out (recorded)
It should be noted that concentrations of a specific element that were reported to be
below detection limit were assumed to be 0 g/l for mass-balance purposes. This is
not necessarily accurate but the effects are assumed to be negligible. The input and
output streams’ grades, concentrations and mass or volume flows for each test are
given in Appendix I, Section E.
The accountability for each element was determined by dividing the sum of the output
streams by the sum of the input streams. Accountability was generally good with a
few exceptions, such as a large over-accountability for Os and Si and under-
accountability for Ag. It should be noted that large volumes of electrolyte were used
during the test in order to maintain stable Cu and H2SO4 concentrations, thus a
significant change in element concentration will not be observed. The exact changes
in concentrations can thus not be detected with confidence, due to the variability of
solution analysis.
The overall deportment of each element to a different product stream was performed
by dividing the amount of element in the product stream by the amount of element in
the total input (anode + electrolyte feed). Due to the large volume of electrolyte that
was used, the amount of an element fed via the electrolyte could, in some cases, be
larger than the amount supplied by the anode. This would play a large role in the
deportment of the specific element because not all of the element present in the
electrolyte will precipitate to the slimes or deposit at the cathode but will remain in
the electrolyte due to the minimal changes in element concentrations in the
electrolyte throughout the tests.
The concentration profiles of various elements in the electrolyte during electrorefining
were monitored by sampling and analyses at specified intervals. It was proven that
minimal changes in concentrations occurred during the test work for all the tests due
to the constant fresh feed flow rate. With the added effect of analysis variance and
bias, the concentration change throughout the test should be almost negligible. An

Univers
ity of
Cap
e Tow
n
PAGE 78 OF 181-
example of this is given in Figure 5.3.c where the concentration profiles of a number
of elements during the base-case test (test 2) are shown.
Concentration Profiles During Electrorefining
Fe
Co
Cu
Ni
Pb
As
Se
0
500
1000
1500
2000
2500
3000
Initial 6 hrs 12 hrs 18 hrs 24 hrs 36 hrs 48 hrs 60 hrs 72 hrs 84 hrs
Time
Co,
Fe
(mg/
l)
0
10
20
30
40
50
60
70
Cu,
Ni (
g/l);
As,
Pb,
Se
(mg/
l)
Fe Co Te Cu Ni Pb As Se
In order to calculate comparable deportment of elements regardless of the
accountability, the deportment of the element was normalised to 100% by dividing it
by the accountability for the specific element.
Tables of the calculated accountability and deportments from the total input (anode
+electrolyte) are given in Appendix I, Section E. These tables have shown that the
deportment of all the PGMs from the anode and electrolyte is not only to the anode
slimes. Rh, Ru and Ir especially show some deportment to the electrolyte. This
could be due to the fact that some of the PGMs that were originally in solution do not
precipitate with the slimes but stay in the electrolyte. However, as mentioned earlier,
confidence in the electrolyte analysis is relatively low and no definite conclusions can
be drawn from this. In order to get a clearer comparison between the behaviour of
different elements at the different operating parameters that were tested with the
original material, the deportment of the elements are illustrated in the following
column charts:
Figure 5.3.c: Concentration profiles of different elements during test 2 (base-case)

Univers
ity of
Cap
e Tow
n
PAGE 79 OF 181-
PGM Deportment from Anode and Electrolyte to Slimes
0%
20%
40%
60%
80%
100%
120%
110 g/lAcid
Base Case WithAdditives
100 A/m2 150 A/m2 30 g/l Cu 50 g/l Cu
% R
ecov
ery
Pt Pd Rh Ru Ir Os Au
Figure 5.3.d shows the overall deportment of PGMs to the anode slimes throughout
the different operating parameters that were tested successfully. Due to the
detectable concentrations of Rh, Ru and Ir in the electrolyte feed and the spent
electrolyte, the deportments of these PGMs are not 100% to the anode slimes as they
are for Pt, Pd, Os and Au which were below detection limit (assumed to be 0).
However, it can be noted from the electrolyte analysis given in Appendix I, Section E
that the concentrations of the Rh, Ru and Ir do not change significantly (2.6 to 2.9
mg/l, 15 to 17 mg/l and 0.3 to 0.4 mg/l respectively), indicating that the dissolution of
the anode does not result in an increase in concentration in the electrolyte. If the
expected 99% recovery from SLC to Cu alloy is achieved and a PGM recovery from
Cu alloy to anode slimes of 99% is obtained, the overall PGM from SLC will be 98%.
As expected, Figure 5.3.e shows that very little or none of the base metals that were
supplied by the anode and the electrolyte feed deported to the anode slimes. With a
Cu deportment of less than 0.1%, this means that more than 99.9% of the Cu has
reported to the electrolyte or deposited on the cathode. In the same way, ~0% of Ni
and 0.05 to 0.3% of Fe reported to the slimes. Figure 5.3.c shows that the
concentration of Cu was maintained at ± 40 g/l throughout the test, which means that
a large fraction of the overall deportment of Cu will be to the electrolyte due to the
large volume of spent electrolyte compared to the mass of copper deposited on the
cathode.
Figure 5.3.d: PGM deportment to anode slimes from anode and electrolyte

Univers
ity of
Cap
e Tow
n
PAGE 80 OF 181-
Base Metal Deportment from Anode and Electrolyte to Slimes
0.0%
0.1%
0.2%
0.3%
0.4%
0.5%
110 g/lAcid
Base Case WithAdditives
100 A/m2 150 A/m2 30 g/l Cu 50 g/l Cu
% R
ecov
ery
Cu Ni Fe Co
Impurity Deportment from Anode and Electrolyte to Slimes
0%
20%
40%
60%
80%
100%
120%
110 g/lAcid
Base Case WithAdditives
100 A/m2 150 A/m2 30 g/l Cu 50 g/l Cu
% R
ecov
ery
Ag As Te Se Pb
When investigating the main anticipated impurities as shown in Figure 5.3.f, Se and
Te deportment from the electrolyte and the anode to the slimes is between 10 – 20%.
It should be noted that the amount of these elements entering and exiting via the
Figure 5.3.e: Base Metals deportment to anode slimes from anode and electrolyte
Figure 5.3.f: Impurity deportment to anode slimes from anode and electrolyte
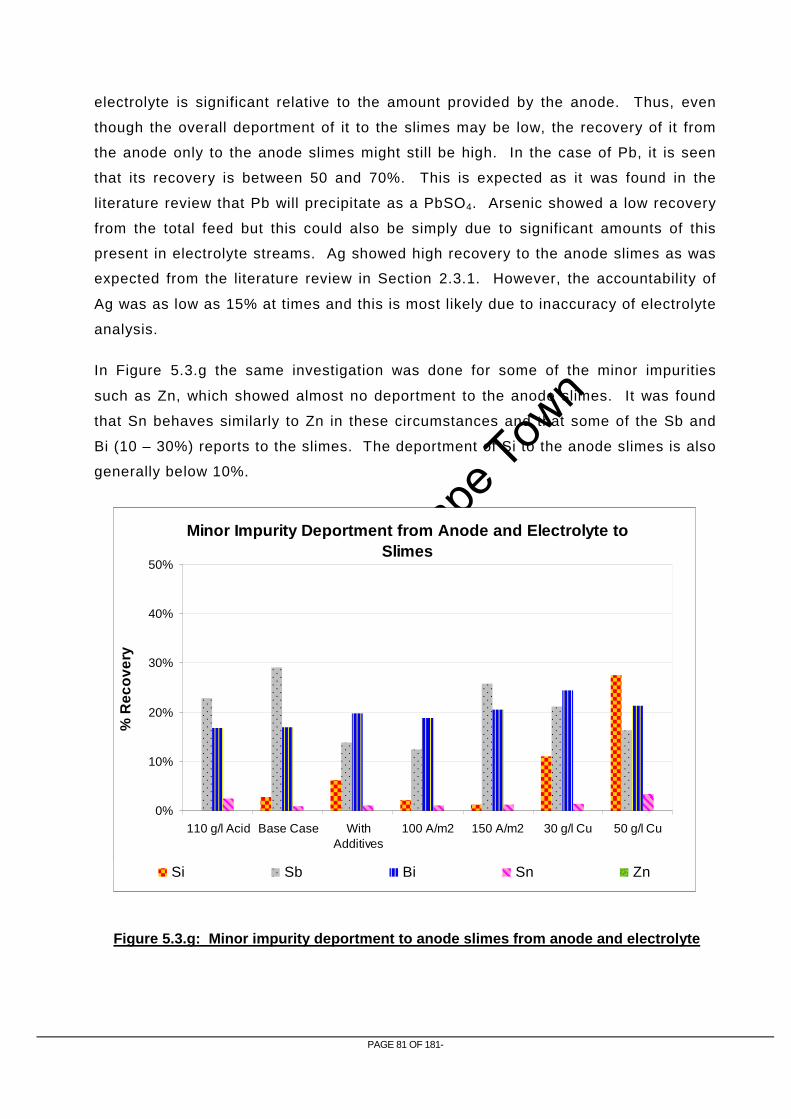
Univers
ity of
Cap
e Tow
n
PAGE 81 OF 181-
electrolyte is significant relative to the amount provided by the anode. Thus, even
though the overall deportment of it to the slimes may be low, the recovery of it from
the anode only to the anode slimes might still be high. In the case of Pb, it is seen
that its recovery is between 50 and 70%. This is expected as it was found in the
literature review that Pb will precipitate as a PbSO4. Arsenic showed a low recovery
from the total feed but this could also be simply due to significant amounts of this
present in electrolyte streams. Ag showed high recovery to the anode slimes as was
expected from the literature review in Section 2.3.1. However, the accountability of
Ag was as low as 15% at times and this is most likely due to inaccuracy of electrolyte
analysis.
In Figure 5.3.g the same investigation was done for some of the minor impurities
such as Zn, which showed almost no deportment to the anode slimes. It was found
that Sn behaves similarly to Zn in these circumstances and that some of the Sb and
Bi (10 – 30%) reports to the slimes. The deportment of Si to the anode slimes is also
generally below 10%.
Minor Impurity Deportment from Anode and Electrolyte to Slimes
0%
10%
20%
30%
40%
50%
110 g/l Acid Base Case WithAdditives
100 A/m2 150 A/m2 30 g/l Cu 50 g/l Cu
% R
ecov
ery
Si Sb Bi Sn Zn
Figure 5.3.g: Minor impurity deportment to anode slimes from anode and electrolyte
Univers
ity of
Cap
e Tow
n
PAGE 82 OF 181-
Recovery from Anodes
Unfortunately, the overall deportment of elements from the electrolyte and the anode
to the slimes does not reveal much of what happens to the elements that are
released only from the anode during electrorefining. This is due to the large volume
of electrolyte that was used, resulting in electrolyte concentrations staying relatively
constant throughout these tests. Therefore, it is needed to perform a new mass
balance, defining new input and output streams that will depict the deportment of
elements provided by the anodes only. The new input and output streams for this
mass balance are defined as follows:
In:
1) Mass of element removed from the surface of the anode = grade in initial anode x
(mass of initial anode – mass of final anode)
Out:
1) Mass of element in slimes = grade in slimes x mass of slimes
2) Mass of element in cathode = (grade in front cathode x mass of front cathode) +
(grade in back cathode x mass of back cathode)
3) Mass of element in spent electrolyte – Mass of element in electrolyte feed =
(concentration in spent electrolyte x total volume out (recorded)) – (concentration
in electrolyte feed x total volume fed during the test (flow rate x time))
The recovery of each element to a certain product stream is once again calculated by
dividing the mass in the specific output stream by the mass in the input stream and
the accountability. The recoveries of the elements from the anode to the different
products are shown in Table 5.3.d to Table 5.3.j.

Univers
ity of
Cap
e Tow
n
PAGE 83 OF 181-
% % Recovery from Anode
Element Accountability To Slimes To Electrolyte To Cathode Pt 105.7 99.6 0.0 0.4 Pd 95.0 99.9 0.0 0.1 Rh 114.7 100.4 -0.6 0.2 Ru 89.0 105.3 -5.3 0.0 Ir 105.9 103.7 -3.7 0.0
Os 130.9 100.0 0.0 0.0 Au 92.8 98.3 0.0 1.7 Ag 13.4 101.6 -1.6 0.0 Cu 140.0 0.5 8.1 91.4 Ni 167.3 0.0 100.0 0.0 Fe 68.5 1.0 98.7 0.4 Co 673.8 0.0 100.0 0.0 Pb 63.0 84.5 15.0 0.5 As 85.1 101.5 -1.8 0.3 S 16552.6 0.9 99.1 0.0 Si 730.2 0.0 98.6 1.4 Te 42.0 609.7 -512.6 2.9 Sb 70.5 79.7 20.3 0.0 Bi 90.9 25.4 74.6 0.0 Sn 107.5 2.5 97.5 0.0 Se 29.9 956.4 -1074.4 17.9 Zn 611.1 0.2 97.0 2.8
% % Recovery from Anode Element Accountability To Slimes To Electrolyte To Cathode
Pt 84.0 100.0 0.0 0.0 Pd 86.8 99.9 0.0 0.1 Rh 89.4 102.9 -3.5 0.6 Ru 106.4 89.6 9.4 1.0 Ir 82.7 103.2 -3.2 0.0
Os 90.9 100.0 0.0 0.0 Au 84.1 100.0 0.0 0.0 Ag 18.5 42.5 57.4 0.1 Cu 100.3 1.1 -19.7 118.6 Ni 461.3 0.0 100.0 0.0 Fe 127.5 0.3 99.5 0.2 Co 686.2 0.0 100.0 0.0 Pb 44.7 140.2 -40.2 0.0 As 94.0 100.9 -1.3 0.3 S 48359.6 0.3 99.7 0.0 Si 172.2 17.4 -125.7 8.3 Te 16.0 1520.9 -1541.5 120.5 Sb 76.5 85.6 13.9 0.5 Bi 96.5 25.1 74.6 0.3 Sn 113.3 1.0 99.0 0.0 Se 137.2 277.7 -380.3 2.6 Zn 1571.8 0.1 99.9 0.0
Table 5.3.d: Recovery of elements from Anode to different product streams for Test 1 (110 g/l H 2SO4)
Table 5.3.e: Recovery of elements from Anode to different product streams for Test 2 (Base-case)

Univers
ity of
Cap
e Tow
n
PAGE 84 OF 181-
% % Recovery from Anode Element Accountability To Slimes To Electrolyte To Cathode
Pt 102.6 99.8 0.2 0.0 Pd 92.5 99.7 0.2 0.0 Rh 106.3 101.4 -1.5 0.1 Ru 133.6 85.6 14.3 0.1 Ir 135.2 88.1 11.9 0.0
Os 149.5 100.0 0.0 0.0 Au 88.4 100.0 0.0 0.0 Ag 18.1 99.6 0.0 0.4 Cu 191.5 0.3 39.7 60.0 Ni 587.7 0.0 100.0 0.0 Fe 224.7 0.3 99.6 0.1 Co 1028.3 0.1 99.8 0.0 Pb 74.4 79.2 20.8 0.0 As 74.8 93.7 6.3 0.0 S 60032.1 0.3 99.7 0.0 Si 28.6 59.3 -160.9 1.6 Te 21.4 811.5 -716.4 4.9 Sb 87.3 34.9 65.0 0.1 Bi 101.2 24.8 75.1 0.0 Sn 101.9 1.2 98.8 0.1 Se 51.3 535.5 -447.9 12.5 Zn 834.6 0.0 98.2 1.8
% % Recovery from Anode Element Accountability To Slimes To Electrolyte To Cathode
Pt 92.1 99.7 0.3 0.0 Pd 90.9 99.6 0.3 0.0 Rh 79.2 126.3 -26.5 0.2 Ru 100.2 109.7 -9.7 0.1 Ir 113.1 92.9 7.1 0.0
Os 139.3 100.0 0.0 0.0 Au 81.3 100.0 0.0 0.0 Ag 46.0 35.7 64.2 0.1 Cu 76.8 1.3 -48.6 147.3 Ni 409.9 -0.1 100.1 0.0 Fe 114.3 0.7 99.3 0.0 Co 580.2 0.3 99.7 0.0 Pb 78.7 74.5 25.5 0.0 As 43.5 168.5 -68.5 0.1 S 191167.1 0.1 -100.1 0.0 Si 180.2 5.0 94.4 0.5 Te 117.7 174.5 -275.3 0.8 Sb 62.6 49.2 50.7 0.1 Bi 87.2 30.1 69.9 0.0 Sn 88.2 1.3 98.7 0.0 Se 144.3 224.0 -328.0 4.0 Zn 274.2 0.2 -104.3 4.0
Table 5.3.f: Recovery of elements from Anode to different product streams for Test 3 (Base-case With Additives)
Table 5.3.g: Recovery of elements from Anode to different product streams for Test 4 (100 A/m 2)

Univers
ity of
Cap
e Tow
n
PAGE 85 OF 181-
% % Recovery from Anode Element Accountability To Slimes To Electrolyte To Cathode
Pt 93.2 100.0 0.0 0.0 Pd 91.7 99.9 0.0 0.1 Rh 99.3 101.2 -1.6 0.5 Ru 109.1 93.8 5.1 1.0 Ir 109.6 95.4 4.6 0.0
Os 140.5 100.0 0.0 0.0 Au 85.8 100.0 0.0 0.0 Ag 20.1 99.7 0.0 0.3 Cu 148.9 0.7 23.3 76.0 Ni 37.4 1.1 98.7 0.2 Fe 122.0 1.0 99.0 0.0 Co 233.3 0.5 99.3 0.2 Pb 42.7 125.5 -25.5 0.1 As 81.1 106.5 -6.5 0.0 S 3796.6 4.0 96.0 0.0 Si 212.7 11.9 84.6 3.5 Te 34.9 524.8 -477.2 52.4 Sb 79.8 65.3 34.6 0.1 Bi 89.4 29.1 70.9 0.0 Sn 110.4 1.2 98.8 0.0 Se 37.6 796.1 -925.2 29.0 Zn 20.9 2.1 47.8 50.1
% % Recovery from Anode Element Accountability To Slimes To Electrolyte To Cathode
Pt 101.3 100.0 0.0 0.0 Pd 90.2 100.1 -0.1 0.0 Rh 101.7 101.6 -2.4 0.7 Ru 115.8 95.4 3.6 1.0 Ir 124.7 84.9 15.1 0.0
Os 132.7 100.0 0.0 0.0 Au 86.0 100.0 0.0 0.0 Ag 45.8 93.3 6.4 0.2 Cu 131.9 1.0 9.3 89.7 Ni 306.8 0.2 99.7 0.0 Fe 124.7 2.5 97.5 0.0 Co 304.1 1.1 98.8 0.1 Pb 68.8 85.0 14.9 0.1 As 169.9 45.2 54.8 0.0 S 91878.0 0.1 99.9 0.0 Si 90.7 40.7 57.7 1.6 Te 13.4 1259.6 -1311.6 152.0 Sb 84.2 50.1 49.6 0.2 Bi 80.8 33.7 66.3 0.0 Sn 104.5 1.4 98.5 0.1 Se 180.9 161.2 -268.5 7.3 Zn 351.8 0.3 78.2 21.5
Table 5.3.h: Recovery of elements from Anode to different product streams for Test 5 (150 A/m 2)
Table 5.3.i: Recovery of elements from Anode to different product streams for Test 6 (30 g/l Cu)

Univers
ity of
Cap
e Tow
n
PAGE 86 OF 181-
% % Recovery from Anode Element Accountability To Slimes To Electrolyte To Cathode
Pt 97.4 100.0 0.0 0.0 Pd 93.6 100.0 0.0 0.0 Rh 108.5 100.0 -0.1 0.1 Ru 115.8 93.6 6.4 0.1 Ir 109.5 94.0 6.0 0.0
Os 146.6 100.0 0.0 0.0 Au 87.5 100.0 0.0 0.0 Ag 45.6 99.8 0.0 0.2 Cu 202.0 0.2 41.9 57.8 Ni 28.4 1.8 98.2 0.0 Fe 123.3 1.9 97.8 0.4 Co 333.9 0.7 99.3 0.0 Pb 50.4 124.8 -31.3 6.4 As 74.0 94.0 6.0 0.0 S 30559.1 0.7 99.3 0.0 Si 78.4 99.0 -2.5 3.5 Te 20.8 765.7 -668.5 2.8 Sb 77.1 43.2 56.7 0.0 Bi 80.6 31.1 68.9 0.0 Sn 218.0 3.4 96.3 0.3 Se 157.5 171.7 -281.1 9.4 Zn 316.1 0.3 -102.9 2.7
It can be seen from these tables that some of the recoveries to electrolyte results
seem confusing. At times it shows a very large recovery to the anode slimes and a
negative recovery to the electrolyte. The reasons for this are, firstly, that the
analysis variability of the electrolyte might be very large compared to the amount of
element provided by the anode, (due the large volumes of electrolyte that were used),
and secondly, the concentration in the spent electrolyte might be lower than the
concentration in the electrolyte feed resulting in a negative recovery to electrolyte
(this is observed in the cases of Pb, Te and Se). These concentration differences
could be due to the precipitation of these elements or the variability of the analysis.
Most importantly, it can be seen from these tables that the ratio of PGM mass in the
slimes to the mass removed from the anode is almost always close to 100%. This is
desirable because it indicates that minimal PGM loss occurred during the
transformation of the anode to the anode slimes. In cases where there was over-
accountability for the element, the recovery of the PGM to the anode slimes were
lower (i.e. Ru and Ir), which is most likely a result of the variability of electrolyte
analyses.
Table 5.3.j: Recovery of elements from Anode to different product streams for Test 7 (50 g/l Cu)
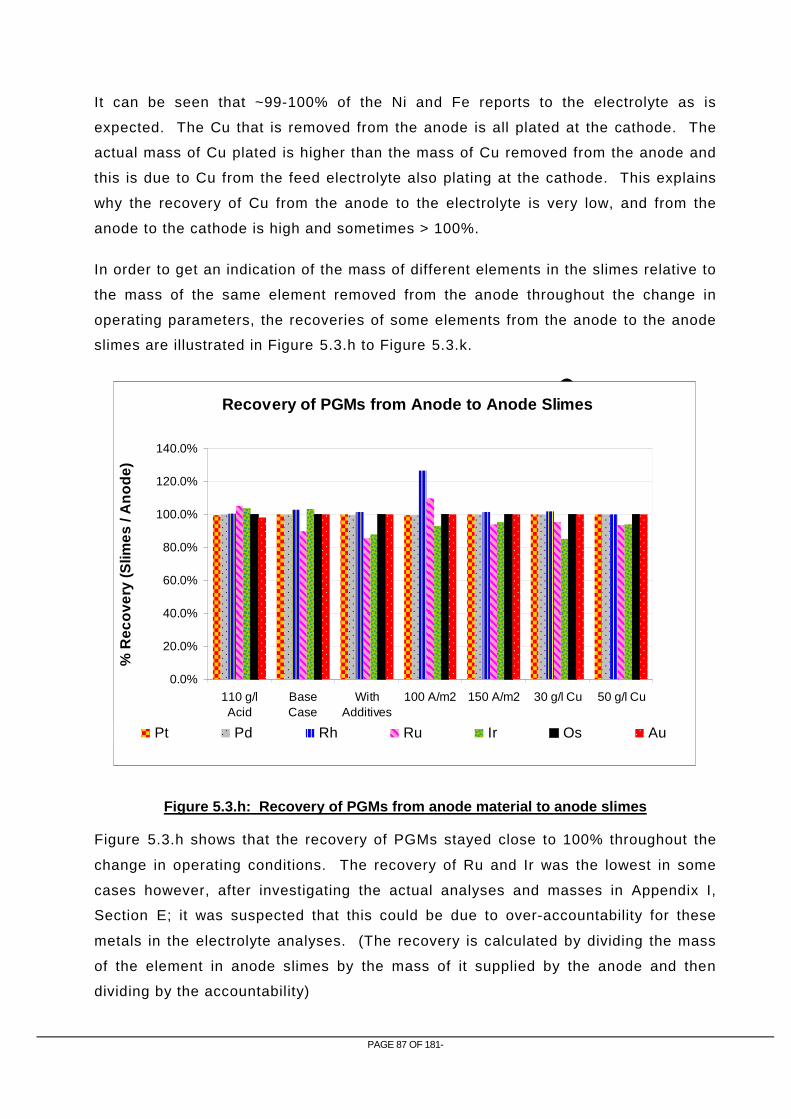
Univers
ity of
Cap
e Tow
n
PAGE 87 OF 181-
It can be seen that ~99-100% of the Ni and Fe reports to the electrolyte as is
expected. The Cu that is removed from the anode is all plated at the cathode. The
actual mass of Cu plated is higher than the mass of Cu removed from the anode and
this is due to Cu from the feed electrolyte also plating at the cathode. This explains
why the recovery of Cu from the anode to the electrolyte is very low, and from the
anode to the cathode is high and sometimes > 100%.
In order to get an indication of the mass of different elements in the slimes relative to
the mass of the same element removed from the anode throughout the change in
operating parameters, the recoveries of some elements from the anode to the anode
slimes are illustrated in Figure 5.3.h to Figure 5.3.k.
Recovery of PGMs from Anode to Anode Slimes
0.0%
20.0%
40.0%
60.0%
80.0%
100.0%
120.0%
140.0%
110 g/lAcid
BaseCase
WithAdditives
100 A/m2 150 A/m2 30 g/l Cu 50 g/l Cu
% R
ecov
ery
(Slim
es /
Ano
de)
Pt Pd Rh Ru Ir Os Au
Figure 5.3.h shows that the recovery of PGMs stayed close to 100% throughout the
change in operating conditions. The recovery of Ru and Ir was the lowest in some
cases however, after investigating the actual analyses and masses in Appendix I,
Section E; it was suspected that this could be due to over-accountability for these
metals in the electrolyte analyses. (The recovery is calculated by dividing the mass
of the element in anode slimes by the mass of it supplied by the anode and then
dividing by the accountability)
Figure 5.3.h: Recovery of PGMs from anode material to anode slimes

Univers
ity of
Cap
e Tow
n
PAGE 88 OF 181-
Recovery of Base Metals from Anode to Slimes
0.0%
0.5%
1.0%
1.5%
2.0%
2.5%
3.0%
110 g/l Acid Base Case WithAdditives
100 A/m2 150 A/m2 30 g/l Cu 50 g/l Cu
% R
ecov
ery
(Slim
es /
Ano
de)
Cu Ni Fe Co
Figure 5.3.i shows the base metal recovery from the anode to the anode slimes. This
figure confirms that the majority of the base metals are dissolved from the anode and
reports to either the electrolyte or the cathode. In most cases, less than 1.5% of the
all base metals supplied by the anode stays in the solid form and reports to the
anode slimes which are desirable effects. This is a very good indication that
electrorefining is an excellent method for concentrating PGMs.
The recovery of Pb, As and Ag to the anode slimes were all close to 100% indicating
that these elements either does not dissolve, or re-precipitates after dissolution and
report to the anode slimes.
A very interesting phenomenon is found when investigating the mass of Se and Te in
the slimes compared to the mass provided by the anode as shown in Figure 5.3.j. It
was found that there were two to twelve times higher Se and Te in the slimes than
was supplied by the anode. This indicates that some of the Se and Te provided by
the electrolyte feed have precipitated to the slimes. The reason that there is still a
low overall deportment of these elements is the fact that the mass in the electrolyte
was high compared to the mass in the anode and that the majority of it still remained
in solution in the spent electrolyte. It should be noted that the accountability for
Figure 5.3.i: Recovery of base metals from anode to anode slimes
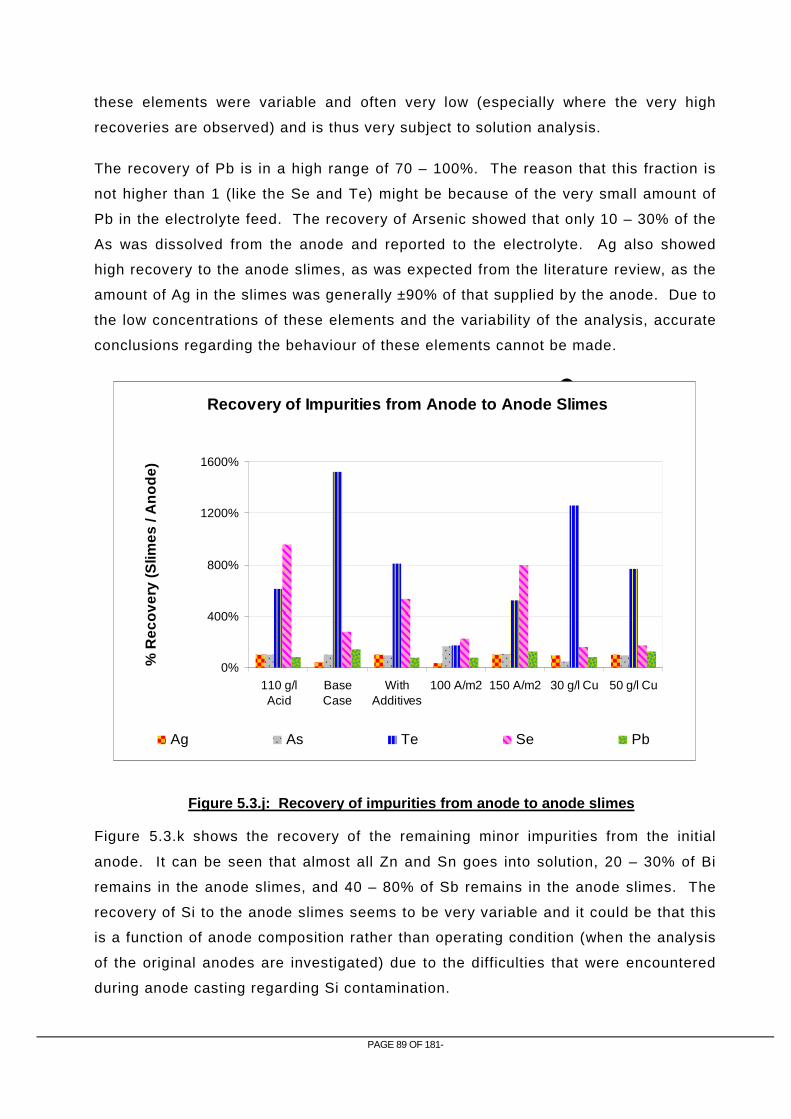
Univers
ity of
Cap
e Tow
n
PAGE 89 OF 181-
these elements were variable and often very low (especially where the very high
recoveries are observed) and is thus very subject to solution analysis.
The recovery of Pb is in a high range of 70 – 100%. The reason that this fraction is
not higher than 1 (like the Se and Te) might be because of the very small amount of
Pb in the electrolyte feed. The recovery of Arsenic showed that only 10 – 30% of the
As was dissolved from the anode and reported to the electrolyte. Ag also showed
high recovery to the anode slimes, as was expected from the literature review, as the
amount of Ag in the slimes was generally ±90% of that supplied by the anode. Due to
the low concentrations of these elements and the variability of the analysis, accurate
conclusions regarding the behaviour of these elements cannot be made.
Recovery of Impurities from Anode to Anode Slimes
0%
400%
800%
1200%
1600%
110 g/lAcid
BaseCase
WithAdditives
100 A/m2 150 A/m2 30 g/l Cu 50 g/l Cu
% R
ecov
ery
(Slim
es /
Ano
de)
Ag As Te Se Pb
Figure 5.3.k shows the recovery of the remaining minor impurities from the initial
anode. It can be seen that almost all Zn and Sn goes into solution, 20 – 30% of Bi
remains in the anode slimes, and 40 – 80% of Sb remains in the anode slimes. The
recovery of Si to the anode slimes seems to be very variable and it could be that this
is a function of anode composition rather than operating condition (when the analysis
of the original anodes are investigated) due to the difficulties that were encountered
during anode casting regarding Si contamination.
Figure 5.3.j: Recovery of impurities from anode to anode slimes

Univers
ity of
Cap
e Tow
n
PAGE 90 OF 181-
Recovery of Minor Impurities from Anode to Slimes
0.0%
20.0%
40.0%
60.0%
80.0%
100.0%
110 g/lAcid
BaseCase
WithAdditives
100 A/m2 150 A/m2 30 g/l Cu 50 g/l Cu
% R
ecov
ery
(Slim
es /
Ano
de)
Si Sb Bi Sn Zn
5.4 Product Characterisation
5.4.1 Anode Slimes
Composition
It is important to know the composition of the anode slimes in order to decide whether
integration with the current PMR feed is viable, or if further processing will be
required.
Figure 5.4.a shows the summarised mass composition of the slimes for every test, as
well as the typical mass composition of the PMR feed from the MC plant. None of the
slimes that were produced had PGM content as high as the PMR feed and the
impurities in the anode slimes were significantly higher than in the PMR feed. The
elemental composition of the anode slimes is given in Table 5.4.a and b.
Figure 5.3.k: Recovery of minor impurities from anode to anode slimes

Univers
ity of
Cap
e Tow
n
PAGE 91 OF 181-
Anode Slimes Composition
0%
20%
40%
60%
80%
100%
110 g/lAcid
BaseCase
WithAdditives
100 CD 150 CD 30 g/l Cu50 g/l Cu 130 g/lAcid
190 g/lAcid
250 CD 300 CD PMR
Special Condition
Con
tent
PGMs BMs Ag, As, Te, Se & Pb Al, Si, Sb, Bi, Sn & Zn S
It can be observed that the major impurities in the anode slimes are the base metals
and amphoterics like As, Te, Se and Pb as well as silver. It can also be seen that the
total accountability for the slimes mass was ±80%; it is suspected that the remainder
of the slimes mass consist of mainly hydrogen or oxygen in precipitated sulphates or
hydroxides or oxides. Table 5.4.a shows the elemental concentrations of the PGMs
in the anode slimes and the typical PMR feed concentrations. It can be seen that
only Pt and Ir occur in lower levels in the anode slimes than in the typical PMR feed.
This is because very low levels of Pt and Ir actually bypass the MC plant to ultimately
report to the SLC.
Special Condition Pt (%) Pd (%) Rh (%) Ru (%) Ir (%) Os (%) Au (%) 110 g/l H2SO4 3.35 17.43 4.77 3.45 0.12 0.02 1.38 Base-case 2.57 13.76 3.87 3.88 0.11 0.02 1.09 With Additives 2.73 14.62 3.78 4.21 0.13 0.03 1.19 100 A/m2 2.51 14.01 3.62 4.15 0.12 0.02 1.13 150 A/m2 2.41 13.04 3.43 3.63 0.11 0.02 1.04 30 g/l Cu 2.22 11.42 3.02 3.35 0.10 0.02 0.89 50 g/l Cu 1.95 10.66 2.81 3.00 0.09 0.02 0.83 130 g/l H2SO4 0.43 2.17 0.52 0.58 0.01 0.00 0.21 190 g/l H2SO4 0.30 1.75 0.29 0.30 0.01 0.00 0.15 250 A/m2 0.33 1.88 0.38 0.40 0.01 0.00 0.17 300 A/m2 0.35 2.04 0.39 0.40 0.01 0.00 0.18 PMR 30.00 17.00 3.50 4.60 1.40 0.67 1.30
Figure 5.4.a: Composition of anode slimes compared with typical PMR feed composition
Table 5.4.a: PGM grade of anode slimes

Univers
ity of
Cap
e Tow
n
PAGE 92 OF 181-
The remainders of the elements in anode slimes are considered impurities and the
grade of it is given in Table 5.4.b. These anode slimes were produced by the original
uncontaminated anode material. A breakdown of the slimes produced by the altered
material is given in Appendix I, Section F.
Element 110 g/l H2SO4
Base-case
With Additives
100 A/m 2 150 A/m 2 30 g/l Cu 50 g/l Cu
Ag (g/t) 7330 3420 10 400 9080 9600 177 00 17 000 Cu (g/t) 187 500 28 1600 155 200 27 0600 272 400 266 500 84 700 Ni (g/t) 2800 6400 6000 10 800 15 500 23 800 14 400 Fe (g/t) 10 500 6100 6700 8100 12 300 32 200 21 800 Co (g/t) <500 <500 630 770 600 1400 930 Pb (g/t) 52 600 49 800 57 700 53 400 45 100 37 800 37 600 As (g/t) 63 000 57 900 59 300 63 400 60 000 46 300 38 300 Al (g/t) 2000 1800 <1000 <1000 <1000 <1000 <1000 S (g/t) 95 500 86 500 93 700 78 700 78 300 56 100 84 700 Cr (g/t) <1000 <1000 1100 <1000 1500 <1000 <1000 Mg (g/t) <1000 <1000 <1000 <1000 <1000 <1000 <1000 Si (g/t) <3000 4800 14 200 8000 3800 42 800 96 800 Te (g/t) 61 200 46 300 48 300 53 900 39 100 32 400 27 800 Sb (g/t) 20 000 19 300 10 900 10 500 15 900 11 100 8020 Bi (g/t) 3400 2900 3950 3910 3440 2870 2430 Sn (g/t) 155 53 69 67 65 63 291 Se (g/t) 7050 7820 7460 7820 6610 5260 4580 Zn (g/t) 9 12 9 16 11 37 24
Elements such as Ag, As, Te, Se and Pb may be of concern due to high
concentrations in the anode slimes. The important thing to consider, however, is the
mass input of the deleterious elements, relative to current inputs to PMR and how
these will impact on the downstream processing. The effect of blending the projected
amounts of slimes with the PMR feed was investigated to determine whether these
concentrations could be problematic. Figure 5.4.b shows what the deviation of
composition will be from current PMR feed if the typical slimes produced per annum
(based on slimes production of test, 3-3.5 t/m) were blended with the typical annual
PMR feed (±22 t/m). It can be seen that the Pt concentration of the feed to PMR will
reduce by 4 to 5.5%, the Cu composition will increase by 2 to 4% and Ni content will
reduce by ±4%. The typical and projected mass throughput is given in Appendix I,
Section G.
Table 5.4.b: Impurity grade in slimes produced by tests with original anode material

Univers
ity of
Cap
e Tow
n
PAGE 93 OF 181-
Deviation of Blended PMR Feed from Current PMR Feed Content
Ru
AsPbTe
Pt
Ni
Cu
S
-6.0%
-4.0%
-2.0%
0.0%
2.0%
4.0%
6.0%
Pt Pd Au Rh Ir Ru Os Ag Fe Ni Cu S Co Te Se Pb Zn Sb As Bi Sn Al Si
Test 1 Test 2 Test 3 Test 4 Test 5 Test 6 Test 7
Mineralogy
In order to investigate the formation of anode slimes, the original anodes were also
investigated. The phases present in the anode give insight into the formation of
anode slimes with respect to where the different slimes phases come from and how
the anode phases change during electrorefining.
A backscattered-electron image of the initial anode used in the base-case test is
shown in Figure 5.4.c and the composition of each phase is given in Table 5.4.c.
Figure 5.4.b: Deviation of blended feed composition from current PMR feed

Univers
ity of
Cap
e Tow
n
PAGE 94 OF 181-
The phases and their compositions were very similar for all the anodes used during
the first seven tests. The backscattered-electron images and analyses of all anodes
are given in Appendix I, Section H.
Cu 84.54 Ni 11.83 Fe 2.67 Pd 0.56
Light Grey Matrix
Si 0.28 Cu 68.83 S 20.11 Te 5.78 Fe 4.68 Ni 0.36
Dark Grey Blebs
Se 0.22 Pb 42.71 Bi 23.65 Ag 18.91 Cu 7.96
Bright Dots
Ni 7.47
Figure 5.4.c: Backscattered electron image of original anode material used in the base-case test with additives (Test 3)
Table 5.4.c: Composition of phases present in initial anode used in base-case test with additives (Test 3)
Light grey metal matrix
Bright dots
Dark Grey Blebs

Univers
ity of
Cap
e Tow
n
PAGE 95 OF 181-
It can be seen from Figure 5.4.c that the major phase in the original anode is the light
grey Cu-Ni-Fe alloy with a composition very similar to the overall composition of the
Cu alloy. It is possible that the PGMs are distributed in this phase at very low levels
and are therefore undetected. The dark grey bleb-like phase consists mostly of Cu, S
and Te which points to the presence of copper sulphides and copper tellurides. The
small very bright phase normally occurs around the edges of such copper sulphide
phases but is also observed as small little dots within the Cu-Ni-Fe matrix. The
bright phase is mainly a Pb-Bi-Ag phase with a small amount of Cu and Ni dispersed
in it.
The same investigation was done on the anode slimes and, based on the composition
of the samples, two distinct populations were identified. The first population included
Tests 1 to 7 and the second comprised Tests 8 to 11. Thus, the phases present were
similar for Tests 1 to 7 (see Appendix I, Section I). An MLA backscattered-electron
image of a typical anode slime particle is shown in Figure 5.4.d. Reflected light
images and more backscattered-electron images of the rest of the anode slimes can
be seen in Appendix I, Section I.
Figure 5.4.d: Backscattered electron image of typical anode slime particle
Light grey matrix
Dark grey matrix Dark Grey in
Bleb
Lighter Grey Bleb
Bright White Dots

Univers
ity of
Cap
e Tow
n
PAGE 96 OF 181-
It was observed that there are mainly four phases in all anode slimes. The phases
are described as follows:
1) Light grey matrix – Rich in PGMs, palladium arsenic telluride [Pd73As6Te21] phase
with small amounts of Cu
2) Dark grey matrix – More amorphous PGM-rich phase with higher O content
3) Dark grey in blebs – A copper sulphate hydrate [CuSO4.5H2O] phase also
containing Cu telluride and Fe.
4) Lighter grey blebs – Digenite [Cu9S5] with tellurides and large amounts of Pb
5) Small bright white spots - A lead sulphate [PbSO4] phase, containing mostly Pb,
Bi, Ag.
The distinct amorphous component, observed as a hump in each of the traces, is
present in Tests 1 to 7 (see Figure 5.4.e). Other XRD traces are given in Appendix I,
Section J). The amorphous component ranges between 60 and 80 mass percent in
Tests 1 to 7, as calculated by the Rietveld refinement method.
Figure 5.4.e: XRD traces of anode slimes samples of test 1 – 7 showing amorphous phase

Univers
ity of
Cap
e Tow
n
PAGE 97 OF 181-
SEM-EDX analysis was performed on the anode slimes to determine the composition
of these phases. Although the phases in the slimes are similar for all test products,
the element concentrations varied slightly. The phase compositions for slimes
phases produced during the first test are shown in Table 5.4.d.
Element Light Grey Matrix
Darker Grey Matrix*
Dark Grey in Blebs
Lighter Grey Blebs
Bright White Dots
Pd 38.3 21.6 As 11.5 11.9 1.1 Rh 8.1 10.9 Ag 7.4 4.5 2.5 3.0 18.91 Pt 6.6 6.3 Te 6.4 6.9 8.2 7.0 Sb 6.0 4.5 Cu 5.3 5.5 52.3 47.4 7.96 Ru 4.2 9.4 Au 4.1 2.6 O 13.2 S 1.9 2.0 29.2 23.3 Se 0.5 0.7 0.4 1.4 Fe 6.4 7.7 Pb 10.2 42.7 Bi 23.7 Ni 7.47
*Amorphous phase (dark grey matrix), not analysed accurately
When comparing the phases in the anode slimes with the phases in the anodes, it
was found that the composition of the bright white particles in the original anodes is
similar to those in the anode slimes (Figure 5.4.f). Thus, it is suspected that this
phase does not take part in reactions during electrorefining and reports directly to the
anode slimes.
The Cu sulphide (digenite) or telluride phase (dark grey blebs) also has a similar
content as the bleb phase in the original anode (Figure 5.4.g). This also indicates
that this phase is not influenced extensively by electrorefining but reports to the
anode slimes. The main difference is the reduction of Cu content by ±10%. This
suggests that dissolution of Cu from the sulphide or telluride takes place, possibly
through leaching in the acidic electrolyte after dropping from the anode surface. An
increase in S is also evident which suggests the precipitation of sulphates, as
expected from the literature review in Section 2.3.1. The Pb concentration increases
with the sulphur content in the lighter bleb phase (which is much more prominent)
which suggests the precipitation of PbSO4.
Table 5.4.d: Composition of different phases in anode slimes

Univers
ity of
Cap
e Tow
n
PAGE 98 OF 181-
The light grey matrix phase and amorphous phase in the anode slimes contains most
of the PGMs and are completely new phases (Figure 5.4.h). Due to the fact that
there is no Cu-Ni-Fe metal phase (the matrix phase in the original anode) remaining
in the slimes, it can be suggested that this new phase is formed during the
dissolution of the metallic Cu, Ni and Fe from the matrix phase. It is likely that these
PGMs were distributed in the Cu, Ni metal matrix at very low levels that were not
detected (detection limit = 0.5%). A small percentage of Cu remains in this phase
together with As, Te and Sb. This Cu is possibly complexed with some of the PGMs
or Ag as tellurides or arsenides. The PGM-bearing phase is thus a PGM-As-Te
phase with > 60% PGMs.
Bright White Phase
0.0
20.0
40.0
60.0
80.0
100.0
Anode Bright Dots Slimes Bright Dots
Com
posi
tion
%
Ni
Cu
Ag
Bi
Pb
Figure 5.4.f: Comparison of bright white phases in anode and slimes

Univers
ity of
Cap
e Tow
n
PAGE 99 OF 181-
Grey Bleb Phase
0
20
40
60
80
100
Anode Dark Grey Blebs Slimes Dark Grey inBlebs
Slimes Lighter GreyBlebs
Com
posi
tion
%Pb
Fe
Se
S
Cu
Te
Ag
Grey Matrix Phase
0
20
40
60
80
100
Anode Light GreyMatrix
Slimes Light GreyMatrix
Slimes Darker GreyMatrix
Com
posi
tion
%
PGMs
Fe
Ni
O
Cu
Sb
Te
Ag
As
Figure 5.4.g: Comparison of grey bleb phases in anode and slimes
Figure 5.4.h: Comparison of the matrix phases in anodes and slimes

Univers
ity of
Cap
e Tow
n
PAGE 100 OF 181-
5.4.2 Spent Electrolyte
The spent electrolyte produced during electrorefining will need to be recycled to the
process in order to bleed some of the impurities, and recover the Ni to the Ni
electrowinning and the Co to the Co solvent extraction circuits. In order to determine
the optimal position in the process flow sheet to integrate the spent electrolyte, the
concentrations need to be investigated. The final spent electrolyte concentrations
that were obtained after each test performed with the original material are given in
Table 5.4.e.
Element 110 g/l Acid
Base-case
With Additives
100 A/m 2
150 A/m 2
30 g/l Cu
50 g/l Cu
Pt mg/l <0.2 <0.2 0.01 0.01 <0.2 <0.2 <0.2 Pd mg/l <0.2 <0.2 0.055 0.06 <0.2 <0.2 <0.2 Rh mg/l 2.8 2.6 2.6 2.5 2.5 1.7 2.5 Ru mg/l 16 17 16 15 15 11 15 Ir mg/l 0.4 0.4 0.4 0.4 0.4 0.3 0.4
Os mg/l <0.2 <0.2 <0.2 <0.2 <0.2 <0.2 <0.2 Au mg/l <0.2 <0.2 <0.01 <0.2 <0.2 <0.2 <0.2 Ag mg/l 0.1 0.85 <0.2 2.22 <0.2 0.37 <0.2 Cu g/l 41.23 40.1 36.9 38.4 38.2 28.2 40.5 Ni g/l 56.4 58.28 55.86 52.82 55.06 40.95 52.39 Fe g/l 2.65 2.73 2.56 2.45 2.58 1.972 2.52 Co mg/l 944 931 877 868 898 644 838 Ca mg/l 51.43 52.44 49.02 48.78 49.22 41.27 48.83 Pb mg/l 8.7 5.7 8.4 8.3 4.4 6.5 5.1 As mg/l 74 74 74 74 73 54 71 Al mg/l 43.44 45.71 45.76 42.4 41.72 32.29 43.49 S g/l 98.34 118.8 114.4 110.3 111.6 98.95 113.2 Cr mg/l 3.06 2.87 2.56 2.51 2.58 4.78 6.17 Mg mg/l 33.21 33.54 32.71 30.93 31.12 23.69 31.54 Si mg/l 112 30.86 34.83 48.44 66.6 74 66.69 Te mg/l 33 33 33 33 33 22 34 Sb mg/l 10 8.6 11 10 10 8.9 11 Bi mg/l 2.5 2.6 2.6 2.3 2.9 1.9 2.4 Sn mg/l 0.9 1 1 0.8 1.2 1 2.2 Se mg/l 10 9.2 9.2 9.1 9 6.6 8.6 Zn mg/l 26.1 27.62 27.73 26 25.69 21.93 25.08
The Ni concentration is relatively high, between 50 and 60 g/l. This is slightly lower
than typical Ni electrowinning feed concentration of 70 g/l and it is possible to blend it
with Ni electrowinning feed to obtain a higher concentration. However, the impurities
like Cu, Pb, Co, Fe, Zn, etc, will result in significant contamination of the Ni cathodes.
The typical concentrations in the current Ni feed are:
• Ni: 72.93 g/l
Table 5.4.e: Spent electrolyte concentrations after each test
Univers
ity of
Cap
e Tow
n
PAGE 101 OF 181-
• Co: 7.80 mg/l
• Cu: 101.93 mg/l
• Fe: 10.55 mg/l
• Pb: 0.70 mg/l
• Zn: 1.51 mg/l
These are much lower than the concentrations in the spent electrolyte produced by
electrorefining. Thus, the electrolyte stream will have to be subjected to purification
before the Ni can be recovered. However, if it is subjected straight to the purification
circuit, the high acid content will have to be neutralised and will incur extra costs.
Therefore it would make sense to send the acidic Ni-rich spent electrolyte from
electrorefining to the primary leaching stage where acid is required and the objective
is to leach Ni from the BMR feed material. The acid will be used for leaching of Ni
and the Ni from electrorefining will report to the Ni purification circuit together with
the newly leached Ni after the primary leach stage. Most of the other impurities will
also have an opportunity to be removed from the stream in the purification circuit and
will also be diluted significantly with the Ni-rich leach liquor. The Ni purification
circuit consists of:
1) Cu and Fe Removal
2) Pb Removal
3) Co Removal
Some other impurities like Zn will also be removed in some of the above stages to a
certain extent.
5.4.3 Cathodes
The impurities in the Cu cathodes produced are given in Table 5.4.f. These
impurities should be compared with the chemical specifications given in Table 2.2.a
on page 38.
Generally, only Se, Te, Ni and Fe in the cathodes produced are higher than the target
specified by the LME grade A specifications. This could be due to the high
concentrations in the electrolyte or cathode porosity resulting in high entrainment of
electrolyte. Analytical bias could also play a role in some of the results.

Univers
ity of
Cap
e Tow
n
PAGE 102 OF 181-
Element 110 g/l Acid Base-case With Additives 100 A/m 2 150 A/m 2 30 g/l Cu 50 g/l Cu Front Back Front Back Front Back Front Back Front Back Front Back Front Back
Pt ppm 4.0 3.8 0.2 <0.167 <0.167 <0.167 <0.167 <0.167 <0.167 <0.167 <0.167 <0.167 <0.167 <0.167 Pd ppm 5.7 3.3 6.8 6.3 1.3 2.3 1.7 2.8 2.8 2.0 1.7 1.0 <0.167 <0.167 Rh ppm 2.8 1.5 7.7 8.2 1.3 1.7 1.3 1.5 3.5 7.3 9.7 8.2 1.0 0.8 Ru ppm 13.0 14.3 1.0 0.8 1.0 1.2 14.5 14.2 15.5 13.5 1.2 0.8 Ir ppm <0.167 <0.167 <0.167 <0.167 <0.167 <0.167 <0.167 <0.167 <0.167 <0.167 <0.167 <0.167
Os ppm <0.167 <0.167 <0.167 <0.167 <0.167 <0.167 <0.167 <0.167 <0.167 <0.167 <0.167 <0.167 Au ppm 7.5 2.2 0.2 <0.167 0.2 0.2 <0.167 0.2 <0.167 <0.167 <0.167 0.2 <0.167 <0.167 Ag ppm 0.3 <0.167 1.2 1.8 1.0 1.3 1.0 1.2 1.5 2.2 1.8 1.3 Ni ppm 85.2 83.5 24.0 24.3 28.3 33.5 101.7 112.7 88.5 86.3 14.7 8.3 Fe ppm 126.7 51.7 266.7 50.0 111.7 10.8 6.3 7.5 6.5 4.2 6.8 3.8 416.7 <0.833 Co ppm 5.3 5.8 13.7 1.5 2.8 3.2 7.3 7.0 6.2 2.7 0.5 0.3 Ca ppm 150.0 88.3 41.7 13.8 10.8 5.3 23.3 66.7 16.7 36.7 0.8 0.8 20.0 4.7 Pb ppm 8.3 8.3 <0.167 <0.167 1.0 0.7 <0.167 0.8 1.0 0.3 2.0 0.5 74.3 95.0 As ppm 6.7 2.5 7.8 5.0 0.8 0.8 0.8 0.8 0.8 0.8 0.8 0.8 <0.167 <0.167 Al ppm <0.833 <0.833 <0.833 <0.833 25.0 20.0 25.0 18.3 18.3 20.0 20.0 20.0 <0.833 5.8 Cr ppm 2.2 2.5 1.5 0.8 0.8 1.2 1.0 1.2 1.2 0.7 2.0 0.7 Mg ppm <0.833 <0.833 <0.833 <0.833 <0.833 <0.833 <0.833 <0.833 <0.833 <0.833 <0.833 <0.833 <0.833 <0.833 Si ppm 63.3 <0.833 65.0 85.0 8.0 16.7 43.3 10.8 41.7 38.3 66.7 68.3 45.0 233.3 Te ppm 7.8 7.8 123.3 118.8 11.8 7.3 7.5 9.2 138.7 139.8 148.5 168.3 5.7 3.7 Sb ppm 4.3 2.7 0.3 0.8 0.8 0.7 1.0 0.8 1.8 2.3 0.5 0.3 Bi ppm 2.3 0.2 0.5 <0.167 <0.167 <0.167 <0.167 <0.167 <0.167 <0.167 <0.167 <0.167 Sn ppm <0.167 <0.167 0.3 <0.167 <0.167 <0.167 <0.167 <0.167 <0.167 0.3 1.3 1.2 Se ppm 4.0 1.8 1.7 3.0 5.8 5.5 4.3 4.8 8.2 9.0 9.5 9.8 9.2 12.7 Ti ppm <0.167 0.7 <0.167 <0.167
Mn ppm 5.7 5.2 <0.167 <0.167 <0.167 <0.167 <0.167 <0.167 <0.167 <0.167 <0.167 <0.167 Cd ppm <0.167 <0.167 <0.167 <0.167 <0.167 <0.167 <0.167 <0.167 <0.167 <0.167 <0.167 <0.167 Zn ppm 4.2 4.8 <0.167 <0.167 8.2 14.7 8.2 9.2 9.2 8.8 92.5 96.3 6.8 12.5
Table 5.4.f: Impurities in cathodes

Univers
ity of
Cap
e Tow
n
PAGE 103 OF 181-
The cathode morphology is shown in Figure 5.4.i. It can be seen that the morphology
is much rougher around the edges of the cathode. Figure 5.4.j shows the surface of
a cathode produced during test 4 (100 A/m2). It can be seen that the colour of the
cathode is darker around the edges of the cathode which could indicate some
entrainment of electrolyte or slimes due to higher porosity around the edges. The
thickness of the cathodes was relatively uniform throughout the length and width of
the cathode which indicates that the current distribution was good through the depth
of the cell. The weight of the front cathode was also very similar to the back cathode
after each test, showing that the current distribution was relatively equal between the
back and the front of the anode.
5.4.4 Mass Reduction
Figure 5.4.k shows the mass of slimes and cathode produced per kg of anode for the
tests that were performed with the original composition material. It can be seen that
the amount of slimes produced stays relatively constant over the range of operating
conditions (27 – 42 g/kg). The slight increase in slimes produced during the last two
tests at special copper concentration is most probably a function of the silica content
in the initial anode material that was used (the increase in Si content in anodes can
be seen in Appendix I, Section E.). The cathode production also stayed relatively
constant at slightly less than 1 kg of Cu plated per kg of anode dissolved.
Figure 5.4.i: Nodular growth around edges first test cathode
Figure 5.4.j: Smooth surface of fourth test cathode.

Univers
ity of
Cap
e Tow
n
PAGE 104 OF 181-
Considering that 20% less copper dissolved than were plated, it is safe to say that ±
20% of the Cu cathode is plated from the electrolyte feed. This gives an indication as
to how large the Cu concentration drop will be across a cell at a given fresh feed
rate.
Slimes and Cathode Production
0
5
10
15
20
25
30
35
40
45
110 g/l Acid Base Case WithAdditives
100 CD 150 CD 30 g/l Cu 50 g/l Cu
Special Conditions
Slim
es /
Ano
de (g
/kg)
0.5
0.6
0.7
0.8
0.9
1.0
1.1
1.2
1.3
1.4
1.5
Cat
hode
/ A
node
(kg/
kg)
Slimes/Anode (g/kg)
Cath/Anode kg/kg
Given these results of an average slimes production of 33 g and cathode production
of 1 kg per kg of anode, the typical BMR SLC of 550 t/m can be converted into:
• Anode slimes: 3.63 t/m or 43.56 t/a
• Copper cathode: 110 t/m or 1320 t/a
• 1056 t/a produced from BMR SLC
• 264 t/a produced from BMR leach liquor
(These calculations assume an 80% mass reduction by pyrometallurgical treatment of
SLC prior to electrorefining.)
At an average of 33 g/kg slimes production, the Cu alloy mass is reduced by 96.7%,
and an overall SLC mass reduction of 99.3% is achieved.
Figure 5.4.k: Slimes and cathode production per kg of anode treated

Univers
ity of
Cap
e Tow
n
PAGE 105 OF 181-
5.5 Effect of Operating Parameters
The effects of Cu and H2SO4 concentrations, current density as well as the addition
of smoothing agents were investigated. The combination of parameter settings that
were used are shown in Table 4.1.a. It was aimed to maintain a constant voltage, Cu
and H2SO4 concentration throughout the tests and these parameters were monitored
on an hourly basis throughout the tests. It should be noted that the concentrations
did vary from the original set point at times. This could have been due to titration
bias by different operators or actual change in concentration due to the effect of
current density. In Test 7, the Cu concentration was set to be 50 g/l. Due to low
ambient temperatures and the high concentration in the electrolyte, CuSO4 started to
crystallise in the feed box during the test. Thus, a significant drop in Cu
concentration occurred. The average concentration (45 g/l) was, however, still higher
than the base-case setting (40 g/l) and can thus still be compared to the base-case to
a certain extent. The stabilities of all these parameters are shown in Appendix I,
Section D.
5.5.1 Smoothing Agents
The second and third tests were to determine whether smoothing additives would
improve the morphology of the copper deposit. The copper and acid concentrations
were 40 g/l and 160 g/l, respectively, the current density was 125 A/m2 and
temperature was 65˚C. The additives added in Test 3 were guar gum, thiourea and
sodium chloride. The measured cell potential for the two tests is shown in Figure
5.5.a.

Univers
ity of
Cap
e Tow
n
PAGE 106 OF 181-
Cell Potential Comparison Between Test With Additives and Without Additives
0
0.02
0.04
0.06
0.08
0.1
0.12
0.14
0.16
0.18
0 10 20 30 40 50 60 70 80Hours
Vol
ts
Without Additives
With Additves
As discussed before, the cell potential increased slightly throughout the test. The
cell potential without additives was slightly higher than it was with additives for the
larger part of the test. However, this difference may not be significant enough to
draw any conclusions. The following differences between the two tests were noticed:
1) Power consumption
• Without Additives: 0.125 kWh/kg anode; 0.118 kWh/kg cathode
• With Additives: 0.121 kWh/kg anode; 0.115 kWh/kg cathode
2) Current Efficiency
• Without Additives: Anodic = 102.4%; Cathodic = 98.57%
• With Additives: Anodic = 100.8%; Cathodic = 97.5%
3) Anodic dissolution
• Without Additives: 149.5 g/m2.h
• With Additives: 147.3 g/m2.h
Figure 5.5.a: Comparison of cell potential during tests with additives and without additives.
Univers
ity of
Cap
e Tow
n
PAGE 107 OF 181-
The power consumption with additives was slightly lower due to the lower cell
voltage. The anodic and cathodic current efficiencies also decreased slightly with the
use of additives, as well as the anodic dissolution. An explanation for this could be
slight passivation of the electrode surfaces due to the absorption of the organics to
the surface, resulting in less Cu being dissolved or plated. However, the drop in cell
voltage is counter-intuitive in this regards as the presence of organics is expected to
pose some resistance to current flow thereby rather increasing the cell voltage.
The main observation made was that the test without the smoothing agent had an
irregular deposit surface. This area was covered in anode sludge which was lodged
between the copper deposit grains. The smoothing additives resulted in an improved
cathode surface morphology and less anode slimes were lodged between the copper
deposit grains. This was confirmed by the cathode analysis shown in Table 5.4.f
where almost all of the impurity concentrations were reduced significantly with the
use of additives. The smoothing additives were subsequently added to all the
succeeding tests in order to minimise entrainment.
5.5.2 Current Density
The effects of the change in current density on the power consumption, current
efficiency, dissolution rate and product mass are as follows:
1) Power consumption
• 100 A/m2: 0.104 kWh/kg anode; 0.111 kWh/kg cathode
• 125 A/m2: 0.115 kWh/kg anode; 0.121 kWh/kg cathode
• 150 A/m2: 0.131 kWh/kg anode; 0.140 kWh/kg cathode
2) Current Efficiency
• 100 A/m2: Anodic = 101.5%; Cathodic = 96.7%
• 125 A/m2: Anodic = 100.8%; Cathodic = 97.5%
• 150 A/m2: Anodic = 103.4%; Cathodic = 98.4%
3) Anodic dissolution
• 100 A/m2: 118.3 g/m2.h
• 125 A/m2: 147.3 g/m2.h
• 150 A/m2: 181.3 g/m2.h

Univers
ity of
Cap
e Tow
n
PAGE 108 OF 181-
4) Product mass
• 100 A/m2: Slimes: 30.64 g/kg anode; Cathode: 0.94 g/kg anode
• 125 A/m2: Slimes: 31.05 g/kg anode; Cathode: 0.95 g/kg anode
• 150 A/m2: Slimes: 33.26 g/kg anode; Cathode: 0.93 g/kg anode
The power consumption at each current density is plotted in Figure 5.5.b. The power
consumption will continue increasing at a similar rate as shown below with a further
increase in current density. Thus, the power consumption will increase even more as
less copper is produced per unit of energy. If it is assumed that the increase in
power consumption is at least linear with an increase in current density, it can be
calculated that the power consumption at 250 A/m2 and 300 A/m2 will be at the very
least 0.18 and 0.20 kWh per kg of anode dissolved, respectively.
Power Consumption vs. Current Density
y = 0.0006x + 0.0516
y = 0.0005x + 0.0498
0.00
0.02
0.04
0.06
0.08
0.10
0.12
0.14
0.16
80 90 100 110 120 130 140 150 160 170
Current Density (A/m 2)
Pow
er C
onsu
mpt
ion
(kW
h/kg
)
kWh/kg Anode Dissolved
kWh/kg Cu Produced
Linear (kWh/kg Cu Produced)
Linear (kWh/kg Anode Dissolved)
The cathodic current efficiency increased with an increase in current density. This is
counter-intuitive as it is expected that current efficiency will decrease. It could thus
be assumed that the increase in the calculated current efficiency is not real.
However, it still shows that the current efficiency was not adversely affected by the
increase in current density and current densities higher than 150 A/m2 could still be
beneficial without sacrificing current efficiency excessively.
Figure 5.5.b: Increase in power consumption with an increase in current density

Univers
ity of
Cap
e Tow
n
PAGE 109 OF 181-
As expected, the dissolution rate increased with current density as shown in Figure
5.5.c. The anode dissolution rate will stop increasing with current density as soon as
mass transport becomes the rate-limiting factor and the current efficiency reduces.
Thus, the linear relationships given in Figure 5.5.c represent the best case scenario if
no anode passivation, mass transport limiting or drop in current efficiency occur.
Thus, the anode dissolution rates at 250 A/m2 and 300 A/m2 would be, at most, 292
g/m2.h and 351 g/m2.h, respectively.
Anode Dissolution Rate vs. Current Density
y = 1.1689x + 1E-12
y = 1.2533x - 7.5611
0.00
20.00
40.00
60.00
80.00
100.00
120.00
140.00
160.00
180.00
200.00
80 90 100 110 120 130 140 150 160 170
Current Density (A/m 2)
Ano
de D
isso
lutio
n (g
/m2 .h
r)
Anode Dissolved g/m2.hr
Theoretical Diss (g/m2.hr)
Linear (Theoretical Diss (g/m2.hr))
Linear (Anode Dissolved g/m2.hr)
The mass of slimes produced per kg of anode increased with an increase in current
density. This could be due to the fact that not enough time was allowed for all the
elements to dissolve from a particle before it became detached from the anode. It
could also be that the change in slimes mass production could simply be a function of
original anode content or bias occurring during the filtration and drying of the slimes.
When investigating the recovery of elements from the anode to the anode slimes in
Figure 5.3.h to Figure 5.3.k to no evidence was found of any element that was
retained in the anode slimes more preferentially as a function of current density.
However, when investigating the element deportment from the anode and the
Figure 5.5.c: Increase in anode dissolution with an increase in current density

Univers
ity of
Cap
e Tow
n
PAGE 110 OF 181-
electrolyte to the slimes, a number of elements showed an increased deportment to
the anode slimes. These elements are shown in Figure 5.5.d and Figure 5.5.e.
Element Deportment from Anode and Electrolyte to Slimes
0%
20%
40%
60%
80%
100%
100 125 150
Current Density A/m 2
% R
ecov
ery
Rh Ru Ir
Ag Pb
Element Deportment from Anode and Electrolyte to Slimes
0%
10%
20%
30%
100 125 150
Current Density A/m 2
% R
ecov
ery
0.000%
0.005%
0.010%
0.015%
0.020%
% R
ecov
ery
- SAs Te Sb
Bi Se S
Figure 5.5.d: Deportment of Rh, Ru, Ir, Ag and Pg to slimes from anode and electrolyte
Figure 5.5.e: Deportment of As, Te, Sb, Bi, Se & S to slimes from anode and electrolyte

Univers
ity of
Cap
e Tow
n
PAGE 111 OF 181-
An increase in recovery of Rh, Ir and Ru from the electrolyte was observed at the
points that had increased current density. If this is a true representation of the PGM
behaviour it would be the desired effect. However, the deportment of these elements
was calculated with electrolyte analysis which was very variable and cannot be
assumed to be accurate.
Figure 5.5.f shows the cell potential at different current densities. As expected, a
higher current density resulted in a higher cell voltage:
Cell Potential at Different Current Densities
0
0.02
0.04
0.06
0.08
0.1
0.12
0.14
0.16
0.18
0.2
0 10 20 30 40 50 60 70Hours
Vol
ts
125 CD 100 CD 150 CD
It is known from the literature review (Section 2.1.3) that the relationship between the
anodic current density and the anodic overpotential is given by the following high
field approximations of the Butler Volmer relationship:
Anodic:
=
0
log.i
ib a
aη ;
Where ŋa is the overpotential of E – Ea
It was also calculated in the literature review that the equilibrium potential for Cu
electrorefining is Ee = 0 V. Thus ŋa = E – 0 V
Figure 5.5.f: Comparison of cell potential at various current densities

Univers
ity of
Cap
e Tow
n
PAGE 112 OF 181-
The experimental data were used in combination with the Butler-Volmer relationship
to determine values for i0 and b by iteration. The error between the actual
overpotential obtained during the testwork and the calculated overpotential was
minimised by iterating the values of i0 and b.
The solution that was obtained from this procedure is given in Table 5.5.a.
E (mV) ia (A/m 2) E-Ea (mV) ŋa (mV) Squared Errors b(mV) i0 (A/m 2) Ee
127.47 100.00 127.5 125.3 4.6 140.27 125.00 140.3 145.0 22.5 163.70 150.00 163.7 161.1 6.8
SSE: 33.89
202.9 24.1 0
These constants were used to determine the current density over a range of cell
potentials. This relationship, together with the actual results that were obtained, is
shown in Figure 5.5.g.
Current Density vs. Cell Potential
0
50
100
150
200
250
300
350
0.00 50.00 100.00 150.00 200.00 250.00
Anode Potential (mV)
Cur
rent
Den
sity
(A/m
2)
Actual Current Density
Calculated Current Density
Altered material at high CD
An additional two tests were performed at higher current densities of 250 A/m2 and
300 A/m2 to determine what the highest viable current density will be for optimal
operation. However, these tests were performed last and therefore on the altered
Table 5.5.a: Calculation of exchange current density (i 0) and the Tafel slope (b)
Figure 5.5.g: Actual and calculated relationship between current density and cell potential

Univers
ity of
Cap
e Tow
n
PAGE 113 OF 181-
material. Caution is thus taken to compare these results with the rest of the results.
It can be seen from the last two tests (Appendix I, Section D) that the cell potential
increased significantly during the test due to anode passivation (as discussed
earlier). However, the initial voltages of these tests might be useful to compare with
the cell voltages of the rest of the tests. The initial cell voltages at these current
densities were:
• 250 A/m2: 0.209 V
• 300 A/m2: 0.2435 V
These points are indicated with the yellow dots on Figure 5.5.g. It can be seen that
the cell voltage of the 250 A/m2 test also correlated well with the calculated
relationship, but that at 300 A/m2 the cell voltage started to deviate. This could be
due to mass transport becoming the limiting factor, and that a current density of 300
A/m2 exceeds the maximum mass-transport rate or it could simply be due to the
anode composition. However, both of the last tests were performed with exactly the
same material, as it was the same anode that was machined clean for the last test.
There should thus be no difference in performance due to material composition; it is
thus more likely that mass transport started to play a significant role.
5.5.3 Cu Concentration
In Test 7, the Cu concentration was set to be 50 g/l. Due to low ambient
temperatures and the high concentration in the electrolyte, CuSO4 started to
crystallise in the feed box during the test. Thus, a significant drop in Cu
concentration occurred. The average concentration (45 g/l) was, however, still higher
than the base-case setting (40 g/l) and can thus still be compared to the base-case to
a certain extent.
The effects of the change in Cu concentration on the power consumption, current
efficiency, dissolution rate and product mass are as follows:
1) Power consumption
• 30 g/l: 0.121 kWh/kg anode; 0.126 kWh/kg cathode
• 40 g/l: 0.115 kWh/kg anode; 0.121 kWh/kg cathode
• 45 g/l: 0.122 kWh/kg anode; 0.128 kWh/kg cathode
2) Current Efficiency
• 30 g/l: Anodic = 99.9%; Cathodic = 98.4%

Univers
ity of
Cap
e Tow
n
PAGE 114 OF 181-
• 40 g/l: Anodic = 100.8%; Cathodic = 97.5%
• 45 g/l: Anodic = 99.8%; Cathodic = 98.5%
3) Anodic dissolution
• 30 g/l: 145.9 g/m2.h
• 40 g/l: 147.3 g/m2.h
• 45 g/l: 145.8 g/m2.h
4) Product mass
• 30 g/l: Slimes: 38.82 g/kg anode; Cathode: 0.96 g/kg anode
• 40 g/l: Slimes: 31.05 g/kg anode; Cathode: 0.95 g/kg anode
• 45 g/l: Slimes: 42.51 g/kg anode; Cathode: 0.96 g/kg anode
It can be observed from all these variables, that the values for the 30 g/l and 45 g/l
tests correlate closely with each other but not with the 40 g/l test. This is because
the original material has changed slightly already since the 40 g/l test was performed.
A number of re-castings had taken place before the Cu concentration tests were
performed (test 6 and test 7). Thus, it might make more sense to only compare these
two tests with each other.
The power consumption increased and the current efficiency and anodic dissolution
rate decreased slightly with increasing copper concentration in the electrolyte. This
is as expected as these parameters are inversely related to each other. However,
the changes are very small and no real conclusions can be drawn.
The mass of slimes that were produced per kg of anode increased slightly with an
increase in Cu concentration (see Figure 5.4.k), but this could also be attributed to
the higher silica content in the original anode material (see Appendix I, Section E).
The cell potential measured for the three copper concentrations is shown in Figure
5.5.h. The general trend was an increase in cell potential with time, but no real
differentiation can be made between the cell potentials at different Cu concentrations
that were tested.

Univers
ity of
Cap
e Tow
n
PAGE 115 OF 181-
Cell Potential at Different Cu Concentrations
0
0.05
0.1
0.15
0.2
0.25
0.3
0 10 20 30 40 50 60 70 80
Hours
Vol
ts
40 g/l Cu
30 g/l Cu
45 g/l Cu
When investigating the slimes/anode ratio of element masses, it is observed that the
amount of the following elements in the slimes compared to the amount removed from
the anode is higher at increased Cu concentrations:
• Lead
• Arsenic
• Silver
• Zinc
• Silicon
These observations also correspond with the deportment from the electrolyte and the
anode to the slimes. Thus, it might be suggesting that an increase in Cu
concentration resulted in a higher recovery of these elements. This might be due to a
reduction of solubility of these elements at high metal concentrations in the
electrolyte.
Figure 5.5.h: Comparison of cell potential at various Cu concentrations

Univers
ity of
Cap
e Tow
n
PAGE 116 OF 181-
5.5.4 H2SO4 Concentration
The effect of acid was tested at the base conditions of 40 g/l copper, 125 A/m2 and
65˚C. The 130 g/l and 190 g/l sulphuric acid tests, Test 8 and Test 9, were conducted
after the anode composition had changed. It is therefore difficult to evaluate the
effect of acid concentration on the process. However, the cell potential during these
two tests can give some information regarding the effect of H2SO4 concentration on
electrorefining (see Figure 5.5.i).
Cell Potential at Different H 2SO4 Concentrations with Altered Anode Material
0
0.2
0.4
0.6
0.8
1
1.2
1.4
1.6
1.8
2
0 10 20 30 40 50 60 70 80
Hours
Vol
ts
130 g/l
190 g/l
The cell potential measured for the 130 and 190 g/l tests increased abruptly after 58
hours and 36 hours, respectively, indicating anode passivation. The absence of
anode passivation at 160 g/l acid as compared to the passivation observed at 130 g/l
acid, shows that the passivation was linked to the anode composition and not to
H2SO4 concentration. It is most likely that the composition and/or physical properties
of the anode are the primary cause of passivation. No passivation of the anode took
place at 160 g/l acid but this would be because the anode had more Cu available for
dissolution than the altered material used for the tests shown in Figure 5.5.j. The
acid concentration, however, did affect the time before passivation for these anodes.
The shortening of time before passivation at higher concentrations indicated that high
acid concentration exacerbates anode passivation. It is likely that the shortening of
time before passivation at higher acid concentrations is due to the normally
dissolving Cu being dissolved faster at higher acidities similar to the following
reaction: Cu+2H+→Cu2++H2. After all the dissolvable Cu is removed from the anode,
Figure 5.5.i: Comparison of cell potential at different H 2SO4 concentrations for altered anode material

Univers
ity of
Cap
e Tow
n
PAGE 117 OF 181-
only the contaminated alloy remains which does not dissolve and subsequently result
in a higher cell potential which indicates anode passivation.
For the purpose of investigating the effect of H2SO4 concentration on the actual
power consumption, current efficiency, dissolution rate and product mass, only test 1
at 110 g/l and test 2 at 160 g/l H2SO4 without additives were compared.
1) Power consumption
• 110 g/l: 0.225 kWh/kg anode; 0.217 kWh/kg cathode
• 160 g/l: 0.118 kWh/kg anode; 0.124 kWh/kg cathode
2) Current Efficiency
• 110 g/l: Anodic = 94.2%; Cathodic = 98.8%
• 160 g/l: Anodic = 102.4%; Cathodic = 98.6%
3) Anodic dissolution
• 110 g/l: 137.6 g/m2.h
• 160 g/l: 149.5 g/m2.h
4) Product mass
• 110 g/l: Slimes: 27.83 g/kg anode; Cathode: 1.03 g/kg anode
• 160 g/l: Slimes: 31.18 g/kg anode; Cathode: 0.95 g/kg anode
The power consumption was significantly higher at low acid concentrations. This is
as expected as H2SO4 increases the conductivity of the electrolyte (see literature
review Section 2.2.2). This also explains the lower anodic current efficiency and
anodic dissolution at low H2SO4 concentrations. However a current efficiency of
>100% experienced at high H2SO4 concentration indicates added dissolution of the
anode purely due to leaching of Cu in the highly acidic solution. All consequent tests
at similar concentrations indicated the same results (Table 5.3.b).
An increase in slimes product mass is also observed at higher H2SO4 concentrations.
This could be due to a change in anode composition or a reduction of solubility of a
number of elements due to high acidic concentration. Especially Cu seemed to be
recovered to the slimes to a greater extent at higher acid concentration (see Figure
5.3.e and Figure 5.3.i). Thus, the most PGM-concentrated residue was produced at
low acid concentration (Figure 5.4.a).

Univers
ity of
Cap
e Tow
n
PAGE 118 OF 181-
The cell potentials at 110 g/l and 160 g/l H2SO4 are shown in Figure 5.5.j. It can be
seen that the cell potential at 110 g/l was very high for the first 45 hours of the test.
Upon inspecting the cell connections during this test, it was discovered that the wires
in the cables connecting the power supply and the back cathode were detached from
the connector. It was therefore assumed that there was no current flow in the back
cathode for the first 45 hours. Consequently, the mass of copper deposited on the
front cathode was four times more than that on the back cathode. This is an
indication that the operating current density on the front cathode was double the set
point (250 A/m2) for the first 45 hours before it was reduced to 125 A/m2 when the
cables were properly connected.
Cell Potential at Different H 2SO4 Concentrations
0
0.05
0.1
0.15
0.2
0.25
0.3
0.35
0.4
0.45
0 10 20 30 40 50 60 70 80 90
Hours
Vol
ts
110 g/l
160 g/l
The cause for the increase in voltage measured on the front cathode between 40 to
45 hours for the 110 g/l test was not confirmed, but it could have been caused by
anode sludge accumulation on the anode surface, resulting in increased resistance
which caused the voltage to increase. The anode sludge accumulation could have
been a result of the high rate of anode dissolution on the surface facing the front
anode at the high current density (~250 A/m2).
After the current density was restored to 125 A/m2, the cell potential was still higher
than the cell potential at 160 g/l H2SO4 which indicates lower electrolyte conductivity,
as expected.
Figure 5.5.j: Comparison of cell potential at different H 2SO4 concentrations

Univers
ity of
Cap
e Tow
n
PAGE 119 OF 181-
6 P R O C E S S D E S I G N
6.1 Process Design Background
A preliminary process design was performed based on the current production of SLC
(550 t/m) and estimated mass reduction (80%) by the proposed pyrometallurgical
treatment of SLC. A design factor of 15% is incorporated in the design to allow for
down time due to cell cleaning and maintenance as well as the possibility of
increases in capacity requirement. The proposed process design will fit in to the
current BMR process flow as indicated by Figure 6.1.a.
Cu E RCu E RCu E RCu E R
Se R emoval Se R emoval Se R emoval Se R emoval
Cu R emovalCu R emovalCu R emovalCu R emoval Secondary L eachSecondary L eachSecondary L eachSecondary L eachP rimary L eachP rimary L eachP rimary L eachP rimary L each
Ni P urific ationNi P urific ationNi P urific ationNi P urific ation
Ni E WNi EWNi EWNi EW
PbSO4 to Smelter
Ni Cathode
CoSO4
Cu Cathode
P ressure Vessel Liquor
Leach R esidue
Nickel - Copper Matte
AusmeltAusmeltAusmeltAusmelt TS L F urnaceTS L F urnaceTS L F urnaceTS L F urnace
Cu EWCu EWCu EWCu EW
Fume F ume F ume F ume (scrub & dispose)
Slag S lag S lag S lag (recycle to smelter)
S R emovalS R emovalS R emovalS R emoval Na2SO4
Anode S limesAnode S limesAnode S limesAnode S limes(further processing / feed to PMR )
Solids
Solution
Cu E RCu E RCu E RCu E R
Se R emoval Se R emoval Se R emoval Se R emoval
Cu R emovalCu R emovalCu R emovalCu R emoval Secondary L eachSecondary L eachSecondary L eachSecondary L eachP rimary L eachP rimary L eachP rimary L eachP rimary L each
Ni P urific ationNi P urific ationNi P urific ationNi P urific ationNi P urific ationNi P urific ationNi P urific ationNi P urific ation
Ni E WNi EWNi EWNi EWNi EWNi EWNi EWNi EW
PbSO4 to Smelter
Ni Cathode
CoSO4
Cu Cathode
P ressure Vessel Liquor
Leach R esidue
Nickel - Copper Matte
AusmeltAusmeltAusmeltAusmelt TS L F urnaceTS L F urnaceTS L F urnaceTS L F urnaceAusmeltAusmeltAusmeltAusmelt TS L F urnaceTS L F urnaceTS L F urnaceTS L F urnace
Cu EWCu EWCu EWCu EW
Fume F ume F ume F ume (scrub & dispose)
Slag S lag S lag S lag (recycle to smelter)
S R emovalS R emovalS R emovalS R emovalS R emovalS R emovalS R emovalS R emoval Na2SO4
Anode S limesAnode S limesAnode S limesAnode S limes(further processing / feed to PMR )
Solids
Solution
The optimal electrolyte concentrations of 40 g/l Cu and 160 g/l H2SO4 at 65˚C and a
current density of 200 A/m2 are proposed for the process design. Even though no
valid testwork at this current density was performed on the given material, it is
suggested to be a suitable current density due to the fact that current efficiency was
still very high at 150 A/m2 and no passivation took place. However, due to the nature
of the anode material (not high Cu purity) it is expected that very high current
densities, as applied by other electrorefining operations, might result in problems in
terms of anode passivation and low current efficiencies. Thus 200 A/m2 and anodic
and cathodic current efficiencies of 98% and 95%, respectively, are chosen as a
worst case scenario for production. It is possible to optimise the process or prove
that higher current densities can be used without excessive power consumption.
Figure 6.1.a: Proposed flow sheet of Base Metals Refinery

Univers
ity of
Cap
e Tow
n
PAGE 120 OF 181-
Design anode, cathode and cell dimensions were chosen according to typical plant
designs as obtained during the literature review. The number of anodes, cathodes
and cells are calculated based on the amount of anode material that needs to be
treated per month. The fresh electrolyte feed required to maintain Cu and H2SO4
concentrations and power consumption of the entire tank house (given that all cells
operate in series and electrodes in a cell operate in parallel) are calculated as well.
The total voltage required is the sum of the cell voltages for 6 cells in parallel (6 x 0.2
V). A small number of large cells are chosen as opposed to a larger number of
smaller cells in order to minimize the voltage required from the rectifier.
6.2 Process Design Parameters
The assumptions, design parameters, calculated variables and final production
figures and energy consumption are given below:
Feed:
Current SLC Residue: 550 t/m 6600 t/a
Pyrometallurgical treatment reduces SLC mass by 80%
Cu Alloy tonnage 110 t/m 1320 t/a
Minimum extra capacity to design for 15%
Minimum design capacity 127 t/m 1518 t/a
Constant Variables & Assumptions:
Molar mass (Cu) 63.55 g/mol
Molar mass (Ni) 58.69 g/mol
Molar mass (Fe) 55.85 g/mol
Anode composition:
% Cu 84%
% Ni 12%
% Fe 4%
n (moles of electrons transferred) 2
Faraday constant 96488 C/mol
Density of Cu Alloy 8200 kg/m3
Anodic current efficiency 98%
Cathodic current efficiency 95%
Design Parameters:
Current density 200 A/m2
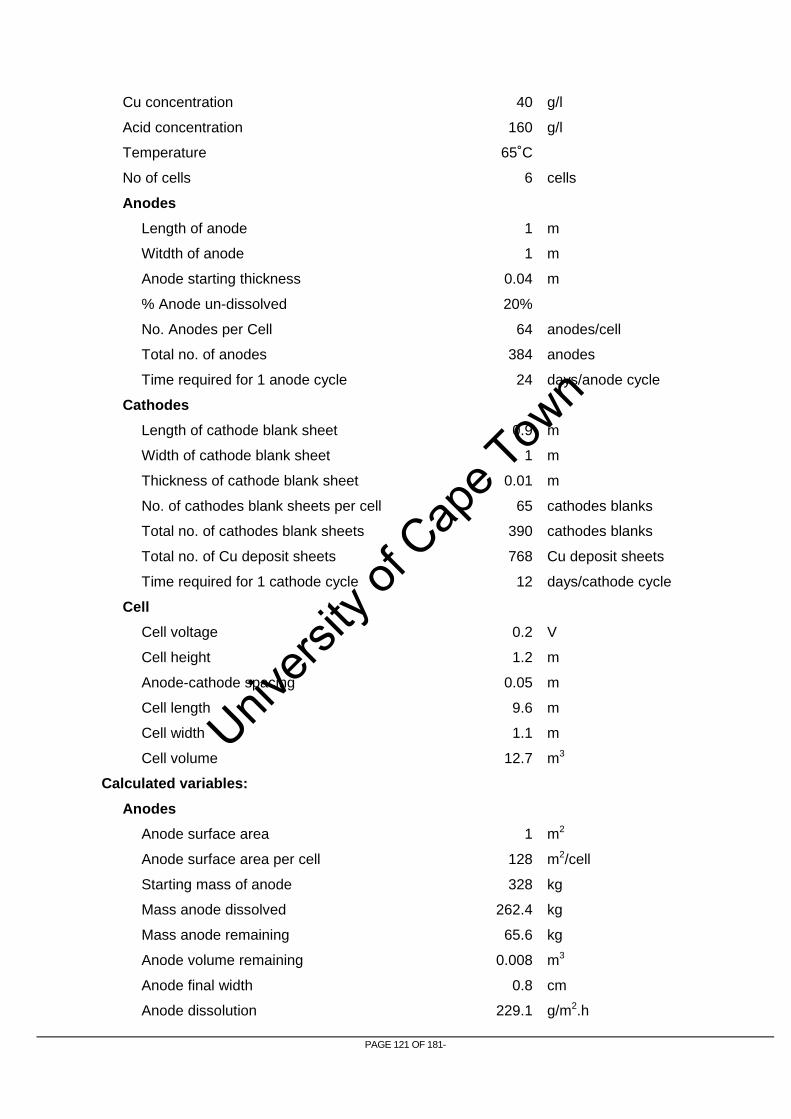
Univers
ity of
Cap
e Tow
n
PAGE 121 OF 181-
Cu concentration 40 g/l
Acid concentration 160 g/l
Temperature 65˚C
No of cells 6 cells
Anodes
Length of anode 1 m
Witdth of anode 1 m
Anode starting thickness 0.04 m
% Anode un-dissolved 20%
No. Anodes per Cell 64 anodes/cell
Total no. of anodes 384 anodes
Time required for 1 anode cycle 24 days/anode cycle
Cathodes
Length of cathode blank sheet 0.9 m
Width of cathode blank sheet 1 m
Thickness of cathode blank sheet 0.01 m
No. of cathodes blank sheets per cell 65 cathodes blanks
Total no. of cathodes blank sheets 390 cathodes blanks
Total no. of Cu deposit sheets 768 Cu deposit sheets
Time required for 1 cathode cycle 12 days/cathode cycle
Cell
Cell voltage 0.2 V
Cell height 1.2 m
Anode-cathode spacing 0.05 m
Cell length 9.6 m
Cell width 1.1 m
Cell volume 12.7 m3
Calculated variables:
Anodes
Anode surface area 1 m2
Anode surface area per cell 128 m2/cell
Starting mass of anode 328 kg
Mass anode dissolved 262.4 kg
Mass anode remaining 65.6 kg
Anode volume remaining 0.008 m3
Anode final width 0.8 cm
Anode dissolution 229.1 g/m2.h

Univers
ity of
Cap
e Tow
n
PAGE 122 OF 181-
Mass to dissolve per cell per anode cycle 16 794 kg/cell/anode cycle
Anode dissolved per cell per month 21 114 kg/cell/m
Cu dissolved from anode per cell per month 17 736 kg Cu/cell/m
Anode cycles/month 1.3 anode cycles
Cathodes
Cathode surface area per cathode 1.8 m2
Cathode surface per cell 115 m2/cell
Cu deposit sheet weight 58.4 kg/cathode
Cathode deposition 225.3 g/m2.h
Mass cathode to plate per cell per cathode cycle 7473 kg/cell/cathode cycle
Cu plated per cell per month 18 683 kg/cell/m
Cathode cycles per month 2.5 cathode cycles
Electrolyte
Cu plated from fresh electrolyte per cell per month 947 kg/cell/m
Fresh electrolyte feed rate required per cell 33 l/h/cell
Total electrolyte feed required 197 l/h
Total electrolyte inventory 76 m3
Current required for specified design current density 23 040 A/cell
Cells required to dissolve design capacity 5.99 cells
Products:
Anode feed capacity 127 t/m 1 520 t/a
Cu production capacity 112 t/m 1 345 t/a
Slimes production capacity 4.2 t/m 50.3 t/a
kg Cu Produced per kg Anode dissolved 0.88 kg/kg anode
Downtime available (if only 110 t/m processed) 4.6 days/month 55.4 days/annum
% over design 15.2%
Energy Consumption:
Current 23040 A
Total voltage 1.2 V
Power 27.6 kW
Power consumption/kg anode treated 0.175 kWh/kg
Power consumption/kg cathode produced 0.178 kWh/kg

Univers
ity of
Cap
e Tow
n
PAGE 123 OF 181-
7 C O N C L U S I O N S
The testwork showed that electrolytic refining of the Cu alloy, produced by a two
stage pyrometallurgical treatment of current SLC, produces a highly concentrated
PGM residue at an overall SLC mass reduction of 99.3%, with excellent PGM
recovery to the anode slimes material. The different operating parameters that were
tested successfully all showed very good repeatability and greater than 99% PGM
recovery, which would result in an overall recovery of 98% from SLC. An unfortunate
contamination of the original material occurred before high current densities and
different H2SO4 concentrations could be tested. The phases present in the anodes
used for these tests were alloys of the Cu, Ni, Fe and Si as a silicide instead of the
Cu, Ni metal matrix found in the original material that was used for the initial tests.
The results obtained from these tests were very different from the initial tests and it is
acknowledged that these differences are not a function of the operating parameters
that were tested but of the change in anode composition.
The typical operating conditions that were observed correlated well with literature and
the theoretically calculated values. The characteristics of anode slimes stayed
relatively similar throughout the different operating parameters and strong confidence
can be placed in the production thereof and the recovery of the PGMs. The
characteristics of the spent electrolyte and the Cu cathodes were also found to be
suitable for integration in the BMR circuit. The results obtained during this testwork
are discussed in detail in this section.
Cell Voltage and Power Consumption
The cell potential measured between the anode and the cathode was generally
between 0.13 and 0.2 V. The lowest cell voltage obtained was at low current density
(100 A/m2), and the highest at high current density (150 A/m2). Cu concentration did
not have a significant effect on cell voltage but low H2SO4 concentration contributed
to an increased cell voltage. The cell potential increased slowly as time progresses
during electrorefining. It is suspected that a build-up of slimes on the anode surface
and an increase in suspended solids are the main contributors to this potential
increase. The power consumption varied between 0.104 – 0.217 kWh/kg cathode
produced and 0.111 – 0.225 kWh/kg anode dissolved. The power consumption was
lower at low current densities but a low acid concentration resulted in an increase in
power consumption due to the reduction of the solution conductivity.

Univers
ity of
Cap
e Tow
n
PAGE 124 OF 181-
The high field approximation to the Butler-Volmer equation and the experimental
results were used to determine the exchange current density and the Tafel slope.
The best fitted values for these were 24.13 A/m2 and 202.99 mV, respectively. The
test performed at 250 A/m2 current density also correlated well with the calculated
relationship, but at 300 A/m2 the cell voltage started to deviate. This could be due to
mass transport becoming the limiting factor at such high current densities or simply
due to the change in anode composition.
Current Efficiency and Anode Dissolution
In most cases where the initial anode material was original and the acid
concentration was high, the anode current efficiency was higher than 100%. It is
concluded that current is not the only contributor to the dissolution of anodes but that
base metal leaching from the anode also occurs due to the acidity of the electrolyte.
It was also observed that current efficiencies of >98% for the deposition of Cu can be
obtained and that the addition of smoothing additives adversely affects the current
efficiency. Current efficiency did not decrease with increased current density.. It is
therefore suspected that a higher operating current density than the tested 150 A/m2
might be optimal for production without excessively compromising efficiency.
Anode dissolution for the current densities tested ranged from 118.68 g/m2.h at 100
A/m2 and 181.3 g/m2.h at 150 A/m2. These masses are 1.5 x of each other which is
what is to be expected from Faraday’s law. It can be concluded that current density
is the main determining factor for anode dissolution rates and not Cu and H2SO4
concentrations.
Element Deportment
It was found that the recovery of PGMs from the anode to the anode slimes is very
close to 100% in most cases. This is desirable because it indicates that no PGM loss
occurs during the transformation of the anode to the anode slimes. In cases where
PGMs were in solution prior to electrorefining, the deportment of all the PGMs from
the anode and electrolyte is not 100% to anode slimes. Rh, Ru and Ir especially
show some deportment to the electrolyte. This could however be due to a variability
in electrolyte analysis.
Very little or none of the base metals that were supplied by the anode or the
electrolyte feed reported to the anode slimes. With a Cu recovery of less than 0.1%
to anode slimes, more than 99.9% of the Cu from the anode stayed in solution and/or

Univers
ity of
Cap
e Tow
n
PAGE 125 OF 181-
deposited on the cathode. In the same way, ~100% of Ni reported to electrolyte as
well as ~99.7 – 99.95% of the Fe.
The mass of Se and Te in the anode slimes is two to twelve times more than was
supplied by the anode. This indicates that some of the Se and Te in solution reacted
with other elements and precipitated to the slimes. The slimes/anode ratio for Pb is
in a high range of 0.7 – 1. Only 10 – 30% of the As was removed to the electrolyte,
and the majority of the Ag reported to the anode slimes. It was found that Zn and Sn
are almost completely dissolved in the electrolyte. The mass of Sb and Bi present in
the slimes is up to 80% less than it was in the anode.
Product Characterisation
The anode slimes composition was generally 20-30% PGMs, 20-30% base metals,
15-20% Ag, As, Te, Se, Pb and 2-5% Al, Si, Sb, Bi, Zn and Sn. This leaves ± 20%
unaccounted for, which is suspected to be composed mainly of oxygen in the form of
oxides. If these typical anode slimes material is to be blended with the annual PMR
feed, the increased mass of feed material to PMR will have a Pt grade of 4 to 5.5%
lower, Cu grade of 2 to 4% higher and Ni grade of ±4% lower than the current PMR
feed. Other concerns are the increase of As, Te, and Pb by between 0.5 and 1%.
The most PGM-concentrated residue was produced at low H2SO4 concentration at the
cost of low current efficiency and high power consumption.
The major phase in the original anode is a light grey Cu-Ni-Fe alloy with a
composition very similar to the overall composition of the Cu alloy, possibly with a
distribution of PGMs at low levels. There is also a dark grey bleb-like phase
consisting mostly out of Cu, S and Te which points to the presence of copper
sulphides and copper tellurides and, lastly, a small very bright phase containing
mainly Pb-Bi-Ag and some Pd with a small amount of Cu and Ni dispersed in it.
Similar phases were found in the anode slimes. The light grey matrix phase
composition has, however, changed to a phase rich in PGMs, palladium, arsenic and
tellurium [Pd73As6Te21], with small amounts of Cu. An amorphous phase amounting
to 60-80% of the mass composition was also present within this matrix. These two
phases contain most of the PGMs in the slimes (up to 60% PGM).
The Ni concentration in the spent electrolyte is between 50 and 60 g/l and slightly
lower than a typical Ni electrowinning feed concentration of 70 g/l. It also contains
impurities like Cu, Pb, Co, Fe, Zn which will result in significant contamination of the
Ni cathodes. Thus, the electrolyte stream will have to be subjected to purification

Univers
ity of
Cap
e Tow
n
PAGE 126 OF 181-
before the Ni can be recovered. Due to the high acidity of this solution, it would be
most suitable to use it as a lixiviant in the pressure leaching of Ni stage. Thereby,
the Ni concentration would be increased and the acidity would be reduced by the
leaching reactions. Only Se, Te, Ni and Fe in the Cu cathodes produced during the
testwork showed content higher than the target specified by the LME grade A
specifications.
The average slimes and cathode production are 33 g and 1 kg per kg of anode,
respectively. This equates to an SLC mass reduction of 99.3%, an additional Cu
production of 1320 t/a, and slimes production of 43.5 t/a.
Process Design
A preliminary process design was performed with proposed design parameters of
electrolyte concentrations of 40 g/l Cu and 160 g/l H2SO4 at 65˚C and a current
density of 200 A/m2. The process was designed to treat 110 t/m of anode material
with a design factor of 15%, at anodic and cathodic current efficiencies of 98% and
95%, respectively.
The process consists of seven electrolytic cells in series with 55 anode cathode pairs
in parallel per cell. The anode dimensions are 1 m x 1 m x 4 cm and the cathodes 1
m x 0.9 m. The process has a maximum capacity of 127 t/m of anode material which
allows 56 days of downtime per year if only 110 t/m is treated. The maximum
capacity for Cu production is 112 t/m and anode slimes, 4.2 t/m. The power
consumption per kg of anode dissolved will be 0.175 kWh/kg. It is possible to
optimise the process to increase current efficiencies or prove that higher current
densities can be used without excessive power consumption.
Univers
ity of
Cap
e Tow
n
PAGE 127 OF 181-
8 R E C O M M E N D AT I O N S
Following the above investigations, there are a number of consequent issues that
need to be considered or investigated before proceeding with the selection of an SLC
process route. Some of these are listed below.
1) The influence of acid concentration and high current density on the original copper
alloy material could not be clearly observed due to the change in anode
composition. It would prove worthwhile to investigate higher current densities in
order to determine the optimal current density before mass transport and anode
passivation becomes limiting. This way, maximum production can be obtained,
while reducing both capital and operating costs. It is possible that different acidity
might also lead to better operation.
2) The procedure and design of the anode casting stage should be investigated and
tested in order to produce suitable anodes for electrorefining cost efficiently.
3) The downstream effects of reduced Pt and increased Cu, Te, Pb and As in the
PMR feed should be investigated to determine the viability of integrating the
anode slimes with the PMR feed directly or to the metallics section in PMR, The
maximum capacity for these elements in PMR and the possible bleed locations
from the process to prevent impurity build-up also should be determined.
4) If it is found that the slimes composition is not suitable to blend with PMR feed,
further processing steps, like decopperising, should be tested on anode slimes in
order to produce an upgraded residue for treatment in PMR.
5) A cumulative cost analysis in terms of capital and production costs should be
performed on the pyrometallurgical anode casting as well as electrorefining stages
to show the feasibility of the proposed process. The current toll-refining contract
should be investigated in detail in order to accurately specify the magnitude of the
saving based on the projected capital and operating costs of the new proposed
process.
6) The availability of existing equipment that can be re-used for the construction of
the new plant should be investigated to reduce capital cost. There is a possibility
of modifying the previously used Anglo Platinum Converting Process pilot plant for
the two-stage Ausmelt process and also using existing tankhouse equipment from
BMR to compose the cells required for electrorefining.
Univers
ity of
Cap
e Tow
n
PAGE 128 OF 181-
9 R E F E R E N C E S
Amer, A.M. (2003) “Processing of copper anodic-slimes for extraction of
valuable metals”, Waste Management, Vol 23, pp 763-770
Andrews, L. (2008) “Mineralogy of trial Ausmelt samples”, Mineralogy
Report No: M/08/31, Mineralogical Research Department, Anglo American.
Andersen, T.N. Pitt, C.H. Livingston, L.S. (1982) “Nodulation of
electrodeposited copper due to suspended particulate”, Journal of Applied
Electrochemistry, Vol 13 Number 4, pp 429-438
Asarco, Mineral Discovery Centre, 17 July 2009, image at:
www.asarco.com/AMDC/smelting.html
Beauchemin, S. Chen, T.T. Dutrizac, J.E. (2007) “Behaviour of antimony
and bismuth in copper electrorefining circuits”, Canadian Metallurgical
Quarterly, Vol 47, Number 1, pp 9-25
Biswas, A. K. Davenport, W.G. King, M. Schlesinger, M. (2002)
“Extractive Metallurgy of Copper”, Fourth Edition, Pergamon Press, Elsevier
Science, pp 247 - 283
Casas, J.M. Alvarez, F. Cifuentes, L. (2000) “Aqueous speciation of
sulfuric acid-cupric sulfate solutions”, Chemical Engineering Science, Vol
55, pp 6223-6234
Chen, T.T. Dutrizac, J.E. (1988) “The behaviour of gold and silver during
copper electrorefining”, BMR Technical library, ID 9668
Chen, T.T. Dutrizac, J.E., a (1989) “A mineralogical study of the
deportment and reaction of silver during copper electrorefining”,
Metallurgical and Materials Transactions B, Vol 20, Number 3, pp 345-361
Chen, T.T. Dutrizac, J.E., b (1989) “A mineralogical overview of the
behaviour of Nickel during copper elctrorefining”, Metallurgical and
Materials Transactions B, Vol 21, Number 2, pp 229-238

Univers
ity of
Cap
e Tow
n
PAGE 129 OF 181-
Chen, T.T. Dutrizac, J.E. (2004) “Gold in the electrorefining of copper
and the decopperizing of copper anode slimes”, Gold Process Mineralogy
Part II, pp 48-52
Chen, T.T. Dutrizac, J.E. (2005) “Mineralogical characterization of a
copper anode and the anode slimes from the La Caridad copper refinery of
Mexicana de Cobre”, Metallurgical and Materials Transactions B, Vol 36B,
pp 229-240
Cifuentes, L. Casas, J.M. Simpson, J. (2007) “Modelling the effect of
temperature and time on the performance of a copper electrowinning cell
based on reactive electrodialysis”, Chemical Engineering Science, Vol 63,
pp 117-1130
Cifuentes, L. Simpson, J. (2005) “Temperature dependence of the
cathodic and anodic kinetics in a copper electrowinning cell based on
reactive electrodialysis”, Chemical Engineering Science, Vol 60, pp 4915-
4923
Cifuentes, L. Casas, J.M. Simpson, J. (2006) “Temperature dependence
of the speciation of copper and iron in acidic electrolytes”, Chemical
Engineering Research and Design, Vol 84(A10), pp 965-969
Dinham, P. (2006) “Mineralogical study of leach residues from the Dynatec
pilot plant trial”, Anglo Research Report, M/06/11
Dönmez, B. Ekinci, Z. Çelik, C. Çolak, S. (1999) “Optimisation of the
chlorination of gold in decopperised anode slime in aqueous medium”,
Hydrometallurgy, Vol 52, pp 81-90
Dynatec. (2006) “Rustenburg BMR Expansion. Hydrometallurgical
Testwork”, Dynatec Corporation, Job 260, Vol 1 & 2
Gu, Z.H. Chen, J. Fahidy, T.Z. (1994) ”A study of anodic slime behaviour
in the electrorefining of copper”, Hydrometallurgy, Vol 37, pp149-167
Hanf, N.W. Frampton, G.L. Farrell, L.J. (1989) “Copper bullion treatment
for the recovery of precious metals”, BMR Technical library, Vol ID 0-1436,
ID 1772; Project ref. No 500.3039P88P/P89/1

Univers
ity of
Cap
e Tow
n
PAGE 130 OF 181-
Hayes, P. (2003) “Electrorefining of Copper”, Process Principles in Mineral
and Materials Production, Third Edition, pp 352 – 360
Hiskey, J.B. Cheng, X. (1998) “Fundamental studies of copper anode
passivation during electrorefining Part III. The effect of thiourea”,
Metallurgical and Materials Transactions B, Vol 29B, pp53-58
Hiskey, J.B. (1999) “Principles and practical considerations of copper
electrorefining and electrowinning”, Copper Leaching Solvent Extraction,
and Electrowinning Technology, pp 169 – 172
Hofirek, Z. (2001) “Secondary leach residue (SLR) production,
characterisation and treatment”, Anglo Platinum Technical Report, ref:
RBMR-108
Ilkhchi, M.O. Yoozbshizadeh, H. Safarzadeh, S.M. (2000) “The effect of
additives on anode passivation in electrorefining of copper”, Chemical
Engineering and Processing, Vol 46, pp 757 – 763
Janik, R. (2001) “Ductility additives for electrorefining and electrowinning”,
United States Patent 6183622, Plymouth, MI, Primary class: 205/585
Jin, S. Gali, E. (2001) “Effect of thiourea on the copper cathode
polarization behaviour in acidic copper sulphate at 65˚C”, Metallurgical and
Materials Transactions B, Vol 32B, pp 887-893
McKay, D.J. Peters, E. (1991) “The electrorefining of copper-rich alloys
using particulate anodes”, BMR Technical library, Report No15 0-6362
Moats, M.S. Hiskey, J.B. Collins, D.W. (2000) “The effect of copper, acid,
and temperature on the diffusion coefficient of cupric ions in simulated
electrorefining electrolytes.” Hydrometallurgy, Vol 56, pp 255-268
Moskalyk, R.R. Alfantazi, A.M. (2003) “Review of copper
pyrometallurgical practice: today and tomorrow”, Minerals Engineering, Vol
16, pp 893-919
Muresan, L. Varvara, S. Maurin, G. Dorneanu, S. (1999) “The effect of
some organic additives upon copper electrowinning from sulphate
electrolytes”, Hydrometallurgy, Vol 54, pp 161-169
Univers
ity of
Cap
e Tow
n
PAGE 131 OF 181-
Nicol, M. (2008) “Hydrometallurgy Theory and Practice Study Guide 2008”,
Module 8, University of Cape Town, pp 55 – 58
Nyirenda, R.L. Phiri, W.S. (1997) “The removal of nickel from copper
electrorefining bleed-off electrolyte”, Minerals Engineering, Vol 11, Number
1, pp 23-37
Petkova, E.N. (1997) “Mechanisms of floating slime formation and its
removal with help of sulphur dioxide during the electrorefining of anode
copper”, Hydrometallurgy, Vol 46, pp 277 – 286
Pletcher D. Walsh F.C. (1990) “Industrial Electrochemistry” Second
Edition, Kluwer, pp 231 - 237
Radhakrshnamurthy, P. Srinivasan, G.N. Srinivasan, R. (1980) “Scope of
periodic current reversal in electrorefining of copper”, Electrochem. Soc.
India, Vol 29, Number 4, pp 280-282
Schoolscience.co.uk , 17 July 2009, image at:
http://resources.schoolscience.co.uk/CDA/14-16/cumining
Sedzimir, J. Gumowska, W. Haranczyhk, I. Kustowska, B. Jasinska, B.
Pasierb, H. (1985) “Silver, nickel, arsenic and antimony behaviour in the
process of electrorefining of copper in the copper ammine electrolyte”, BMR
Technical library, Report No 2733
Verotnikov, M. Borbat, V. Kuzmichev, G. (1969) “Behaviour of iridium and
ruthenium in electrorefining of copper”, BMR Technical library, Report No 2
0-653
Viljoen, K. (2007) “Removal of impurities from the secondary leach residue
at Anglo Platinum Base Metal Refiners. Part 1: Literature Review”, Anglo
Research, Project No. P200701632, Report No. 1
Xiao, F. Zheng, Y. Wang Y. Xu, W. Li, C. Jian, H. (2007) “Novel
technology of purification of copper electrolyte”, Trans.Nonferrous Met. Soc.
China, Vol 17, pp 1069-1074

Univers
ity of
Cap
e Tow
n
PAGE 132 OF 181-
APPENDIX I
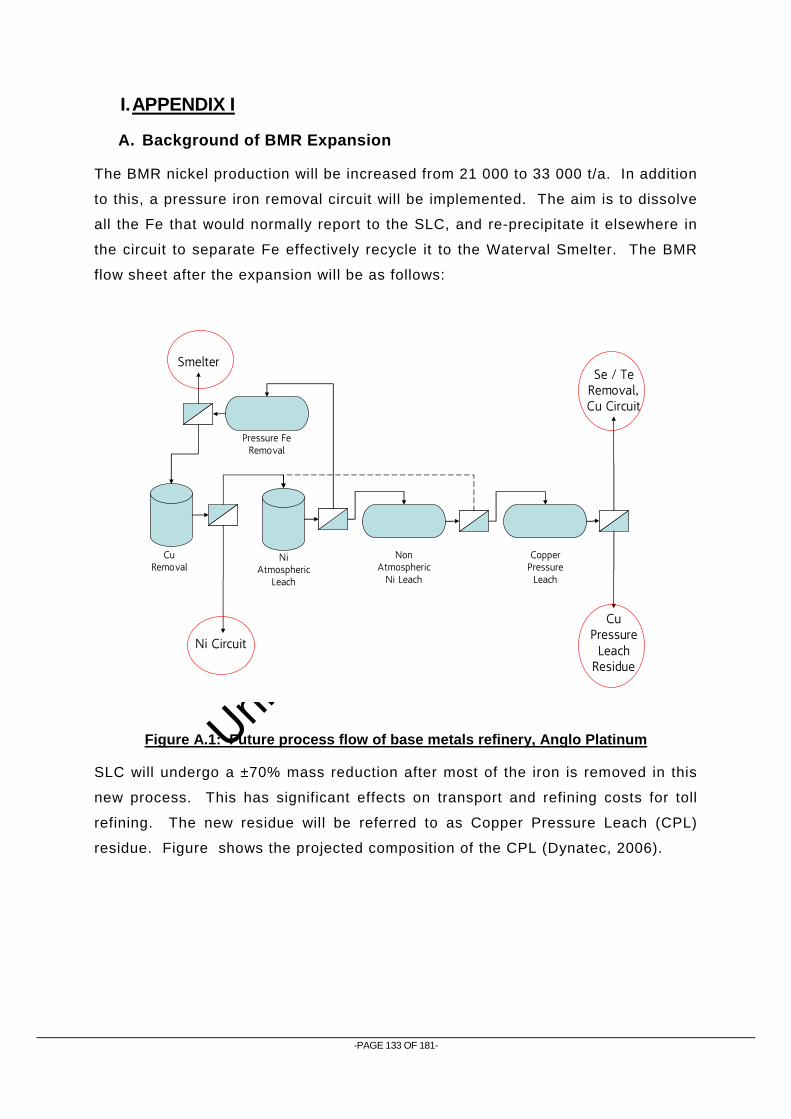
Univers
ity of
Cap
e Tow
n
-PAGE 133 OF 181-
I. APPENDIX I
A. Background of BMR Expansion
The BMR nickel production will be increased from 21 000 to 33 000 t/a. In addition
to this, a pressure iron removal circuit will be implemented. The aim is to dissolve
all the Fe that would normally report to the SLC, and re-precipitate it elsewhere in
the circuit to separate Fe effectively recycle it to the Waterval Smelter. The BMR
flow sheet after the expansion will be as follows:
Ni Circuit
Cu Removal
Ni Atmospheric
Leach
Non Atmospheric Ni Leach
Copper Pressure Leach
Pressure Fe Removal
SmelterSe / Te Removal, Cu Circuit
Cu Pressure Leach Residue
SLC will undergo a ±70% mass reduction after most of the iron is removed in this
new process. This has significant effects on transport and refining costs for toll
refining. The new residue will be referred to as Copper Pressure Leach (CPL)
residue. Figure shows the projected composition of the CPL (Dynatec, 2006).
Figure A.1: Future process flow of base metals refinery, Anglo Platinum

Univers
ity of
Cap
e Tow
n
PAGE 134 OF 181-
CPL CompositionCPL CompositionCPL CompositionCPL Composition
Other, 5.54%Other, 5.54%Other, 5.54%Other, 5.54%
Cu, 39.40%Cu, 39.40%Cu, 39.40%Cu, 39.40%
PGM's, 0.42%PGM's, 0.42%PGM's, 0.42%PGM's, 0.42%
Fe, 1.92%Fe, 1.92%Fe, 1.92%Fe, 1.92%
Ni, 0.80%Ni, 0.80%Ni, 0.80%Ni, 0.80%
S, 50.34%S, 50.34%S, 50.34%S, 50.34%
B. Raw Material Composition
Pt ppm 735.67 Si % <0.1 Pd % 0.39 Te ppm 891.67 Rh ppm 1038.67 Sb ppm 791.67 Ru ppm 1387.33 Bi ppm 420.00 Ir ppm 40.33 Sn ppm 108.33 Os ppm 5.67 Se ppm 61.33 Au ppm 351.67 Ti ppm <20 Ag ppm 918.33 Mn ppm 14.73 Cu % 82.39 Cd ppm <2 Ni % 11.97 Pb % 0.284 Fe % 3.97 As % 0.250 Co % 0.147 Al % <0.1 Ca % <0.1 S % 0.160 Mg % <0.1 Cr % <0.1
Figure A.2: Predicted composition of the CPL residue after expansion of BMR
Table B.1: Composition of Ausmelt TSL furnace product – Cu alloy (electrorefining raw material)

Univers
ity of
Cap
e Tow
n
PAGE 135 OF 181-
C. Comparison of Leaching vs. Electrorefining
Advantages Disadvantage
Pressure Leaching
• BMR already experienced in pressure leaching of base metals.
• H2SO4 available on site
• Recovery of Ni and Cu in solution.
• Have to dissolve 97% of residue – energy intensive.
• Will require capital projects for installation of setup.
• Need graining operation for plant setup as well as test work.
• Not necessarily 100% removal of base metals.
• Possible dissolution of some PGMs with base metals.
Electrorefining
• Simultaneous production of Cu as cathode – cuts out significant pipeline.
• Recovery of Ni in solution
• Existing tank house facilities
• BMR also experienced in tank house operation
• High value PGM slimes handling in Cu tank house – security issue.
• Possible co-deposition of impurities with copper.
• Possible losses of PGMs to electrolyte. (Buildup)
Table C.2: Advantages and disadvantages of pressure leaching vs. electrorefining

Univers
ity of
Cap
e Tow
n
-PAGE 136 OF 181-
D. Test Accuracy
Test 1
-0.4
-0.3
-0.2
-0.1
0
0.1
0.2
0.3
0.4
0.5
0.6
0.7
0 10 20 30 40 50 60 70 80 90 100
Vol
ts
Hours
Test 1 - Potential Difference Profiles100 g/l H 2SO4; 40 g/l Cu; 125 A/m 2; 55'C
Front Cathode
Back Cathode
Rectifier
Test 1 - Cu Concentration
160 g/l H 2SO4; 40 g/l Cu; 125A/m 2
30
32
34
36
38
40
42
44
46
48
50
0 10 20 30 40 50 60 70 80 90 100Hours
Cu
Con
c (g
/l)
Cu2 per. Mov. Avg. (Cu)
Linear (Cu)
Figure D.1: Potential difference between back cathode and anode, front cathode and anode and the rectifier potential for test 1
Figure D.2: Copper concentration monitored during test 1 (110 g/l H 2SO4)

Univers
ity of
Cap
e Tow
n
PAGE 137 OF 181-
Test 1 - H 2SO4 Concentration
160 g/l H 2SO4 ; 40 g/l Cu; 125 A/m 2
90
95
100
105
110
115
120
125
130
0 10 20 30 40 50 60 70 80 90 100Hours
H2S
O4
Con
c (g
/l)
Acid
2 per. Mov. Avg. (Acid)
Linear (Acid)
Test 2
0
0.05
0.1
0.15
0.2
0.25
0.3
0 10 20 30 40 50 60 70 80 90
Vol
ts
Hours
Test 2 - Potential Difference Profiles160 g/l H 2SO4 ; 40 g/l Cu; 125 A/m 2; No Additives
Front Cathode
Back Cathode
Rectifier
Figure D.3: H 2SO4 Concentration profile during test 1 (110 g/l H 2SO4)
Figure D.4: Potential difference between back cathode and anode, front cathode and anode and the rectifier potential for test 2

Univers
ity of
Cap
e Tow
n
PAGE 138 OF 181-
Test 2 - Cu Concentration
160g/l H 2SO4; 40g/l Cu; 125A/m 2; No Additives
30
32
34
36
38
40
42
44
46
48
50
0 10 20 30 40 50 60 70 80 90Hours
Cu
Con
c (g
/l)
Cu2 per. Mov. Avg. (Cu)Linear (Cu)
Test 2 - H 2SO4 Concentration
160 g/l H 2SO4 ; 40 g/l Cu; 125 A/m 2
130
140
150
160
170
180
190
200
0 10 20 30 40 50 60 70 80 90 100Hours
H2S
O4
Con
c (g
/l)
Acid
2 per. Mov. Avg. (Acid)
Linear (Acid)
Figure D.5: Cu concentration profile during test 2 (Base-case)
Figure D.6: H 2SO4 Concentration profile during test 2 (Base-case)

Univers
ity of
Cap
e Tow
n
PAGE 139 OF 181-
Test 3
0
0.05
0.1
0.15
0.2
0.25
0.3
0 10 20 30 40 50 60 70 80
Vol
ts
Hours
Test 3 - Potential Difference Profiles160 g/l H 2SO4; 40 g/l Cu; 125 A/m 2; With Additives
Rectifier
Front Cathode
Back Cathode
Test 3 - Cu Concentration
160g/l H 2SO4; 40g/l Cu; 125A/m 2; With Additives
30
32
34
36
38
40
42
44
46
48
50
0 10 20 30 40 50 60 70 80Hours
Cu
Con
c (g
/l)
Cu2 per. Mov. Avg. (Cu)Linear (Cu)
Figure D.7: Potential difference between back cathode and anode, front cathode and anode and the rectifier potential for test 3
Figure D.8: Cu concentration profile during test 3 (Base-case with additives)

Univers
ity of
Cap
e Tow
n
PAGE 140 OF 181-
Test 3 - H 2SO4 Concentration
160 g/l H 2SO4 ; 40 g/l Cu; 125 A/m 2; With Additives
130
135
140
145
150
155
160
165
170
175
0 10 20 30 40 50 60 70 80 90Hours
H2S
O4
Con
c (g
/l)
Acid
2 per. Mov. Avg. (Acid)
Linear (Acid)
Test 4
0
0.05
0.1
0.15
0.2
0.25
0.3
0 10 20 30 40 50 60 70 80 90 100
Vol
ts
Hours
Test 4 - Potential Difference Profiles160 g/l H 2SO4; 40 g/l Cu; 100 A/m 2
Front Cathode
Back Cathode
Rectifier
Figure D.9: H 2SO4 Concentration profile during test 3 (Base-case with additives)
Figure D.10: Potential difference between back cathode and anode, front cathode and anode and the rectifier potential for test 4

Univers
ity of
Cap
e Tow
n
PAGE 141 OF 181-
Test 4 - Cu Concentration
160 g/l H 2SO4; 40 g/l Cu; 100 A/m 2
30
32
34
36
38
40
42
44
46
48
50
0 20 40 60 80 100Hours
Cu
Con
c (g
/l)
Cu2 per. Mov. Avg. (Cu)Linear (Cu)
Test 4 - H 2SO4 Concentration
160 g/l H 2SO4 ; 40 g/l Cu; 100 A/m 2
130
140
150
160
170
180
190
200
0 20 40 60 80 100Hours
H2S
O4
Con
c (g
/l)
Acid2 per. Mov. Avg. (Acid)Linear (Acid)
Figure D.11: Cu concentration profile during test 4 (100 A/m 2)
FigureD.12: H 2SO4 Concentration profile during test 4 (100 A/m 2)

Univers
ity of
Cap
e Tow
n
PAGE 142 OF 181-
Test 5
0
0.1
0.2
0.3
0.4
0.5
0.6
0.7
0.8
0 10 20 30 40 50 60 70
Vol
ts
Hours
Test 5 - Potential Difference Profiles160 g/l H 2SO4; 40 g/l Cu; 150 A/m 2
Front Cathode
Back Cathode
Rectifier
Test 5 - Cu Concentration
160 g/l H 2SO4; 40 g/l Cu; 150 A/m 2
30
32
34
36
38
40
42
44
46
48
50
0 10 20 30 40 50 60 70Hours
Cu
Con
c (g
/l)
Cu2 per. Mov. Avg. (Cu)Linear (Cu)
Figure D.13: Potential difference between back cathode and anode, front cathode and anode and the rectifier potential for test 5
Figure D.14: Cu concentration profile during test 5 (150 A/m 2)

Univers
ity of
Cap
e Tow
n
PAGE 143 OF 181-
Test 5 - H 2SO4 Concentration
160 g/l H 2SO4 ; 40 g/l Cu; 150 A/m 2
130
140
150
160
170
180
190
0 10 20 30 40 50 60 70Hours
H2S
O4
Con
c (g
/l)
Acid2 per. Mov. Avg. (Acid)Linear (Acid)
Test 6
0
0.05
0.1
0.15
0.2
0.25
0.3
0 10 20 30 40 50 60 70 80
Vol
ts
Hours
Test 6 - Potential Difference Profiles160 g/l H 2SO4; 30 g/l Cu; 125 A/m 2
Front Cathode
Back Cathode
Rectifier
Figure D.15: H 2SO4 Concentration profile during test 5 (150 A/m 2)
Figure D.16: Potential difference between back cathode and anode, front cathode and anode and the rectifier potential for test 6

Univers
ity of
Cap
e Tow
n
PAGE 144 OF 181-
Test 6 - Cu Concentration
160 g/l H 2SO4; 30 g/l Cu; 125 A/m 2
20
22
24
26
28
30
32
34
36
38
40
0 10 20 30 40 50 60 70 80Hours
Cu
Con
c (g
/l)
Cu2 per. Mov. Avg. (Cu)Linear (Cu)
Test 6 - H 2SO4 Concentration
160 g/l H 2SO4 ; 30 g/l Cu; 125 A/m 2
130
135
140
145
150
155
160
165
170
175
0 10 20 30 40 50 60 70 80 90Hours
H2S
O4
Con
c (g
/l)
Acid2 per. Mov. Avg. (Acid)Linear (Acid)
Figure D.17: Cu concentration profile during test 6 (30 g/l Cu)
Figure D.18: H 2SO4 Concentration profile during test 6 (30 g/l Cu)

Univers
ity of
Cap
e Tow
n
PAGE 145 OF 181-
Test 7
0
0.05
0.1
0.15
0.2
0.25
0.3
0.35
0.4
0.45
0.5
0 10 20 30 40 50 60 70 80
Vol
ts
Hours
Test 7 - Potential Difference Profiles160 g/l H 2SO4; 50 g/l Cu; 125 A/m 2
Front Cathode
Back Cathode
Rectifier
Test 7 - Cu Concentration
160 g/l H 2SO4; 50 g/l Cu; 125 A/m 2
36
38
40
42
44
46
48
50
52
54
56
0 10 20 30 40 50 60 70 80Hours
Cu
Con
c (g
/l)
Cu2 per. Mov. Avg. (Cu)Linear (Cu)
Figure D.19: Potential difference between back cathode and anode, front cathode and anode and the rectifier potential for test 7
FigureD.20: Cu concentration profile during test 7 (50 g/l Cu)

Univers
ity of
Cap
e Tow
n
PAGE 146 OF 181-
Test 7 - H 2SO4 Concentration
160 g/l H 2SO4 ; 50 g/l Cu; 125 A/m 2
130
135
140
145
150
155
160
165
170
175
180
0 10 20 30 40 50 60 70 80 90Hours
H2S
O4
Con
c (g
/l)
Acid2 per. Mov. Avg. (Acid)Linear (Acid)
Test 8
Test 8 - Potential Difference Profiles
130 g/l H 2SO4; 40 g/l Cu; 125 A/m 2
0
0.2
0.4
0.6
0.8
1
1.2
1.4
1.6
1.8
0 10 20 30 40 50 60 70 80
Hours
Vol
ts
Front Cathode
Back Cathode
Rectifier
Figure D.21: H 2SO4 Concentration profile during test 7 (50 g/l Cu)
Figure D.22: Potential difference between back cathode and anode, front cathode and anode and the rectifier potential for test 8

Univers
ity of
Cap
e Tow
n
PAGE 147 OF 181-
Test 8 - Cu Concentration
130 g/l H 2SO4; 40g/l Cu; 125A/m 2
30
32
34
36
38
40
42
44
46
48
50
0 10 20 30 40 50 60 70 80
Hours
Cu
Con
c (g
/l)
Cu2 per. Mov. Avg. (Cu)Linear (Cu)
Test 8 - H 2SO4 Concentration
130 g/l H 2SO4 ; 40 g/l Cu; 125 A/m 2
124
126
128
130
132
134
136
0 10 20 30 40 50 60 70 80 90Hours
H2S
O4
Con
c (g
/l)
Acid2 per. Mov. Avg. (Acid)Linear (Acid)
Figure D.23: Cu concentration profile during test 8 (130 g/l H 2SO4)
Figure D.24: H 2SO4 Concentration profile during test 8 (130 g/l H 2SO4)

Univers
ity of
Cap
e Tow
n
PAGE 148 OF 181-
Test 9
Test 9 - Potential Difference Profiles
190 g/l H 2SO4; 40 g/l Cu; 125 A/m 2
0
0.2
0.4
0.6
0.8
1
1.2
1.4
1.6
1.8
2
0 10 20 30 40 50 60 70 80Hours
Vol
ts
Front CathodeBack CathodeRectifier
Test 9 - Cu Concentration
190 g/l H 2SO4; 40 g/l Cu; 125 A/m 2
30
32
34
36
38
40
42
44
46
48
50
0 10 20 30 40 50 60 70 80
Hours
Cu
Con
c (g
/l)
Cu2 per. Mov. Avg. (Cu)Linear (Cu)
Figure D.25: Potential difference between back cathode and anode, front cathode and anode and the rectifier potential for test 9
Figure D.26: Cu concentration profile during test 9 (190 g/l H 2SO4)

Univers
ity of
Cap
e Tow
n
PAGE 149 OF 181-
Test 9 - H 2SO4 Concentration
190 g/l H 2SO4 ; 40 g/l Cu; 125 A/m 2
180
182
184
186
188
190
192
194
196
198
200
0 10 20 30 40 50 60 70 80 90Hours
H2S
O4
Con
c (g
/l)
Acid2 per. Mov. Avg. (Acid)Linear (Acid)
Test 10
Test 10 - Potential Difference Profiles
160 g/l H 2SO4; 40 g/l Cu; 250 A/m 2
0
0.2
0.4
0.6
0.8
1
1.2
1.4
1.6
1.8
2
0 5 10 15 20 25 30 35 40
Hours
Vol
ts
Front Cathode
Back Cathode
Rectifier
Figure D.27: H 2SO4 Concentration profile during test 9 (190 g/l H 2SO4)
Figure D.28: Potential difference between back cathode and anode, front cathode and anode and the rectifier potential for test 10

Univers
ity of
Cap
e Tow
n
PAGE 150 OF 181-
Test 10 - Cu Concentration
160 g/l H 2SO4; 40 g/l Cu; 250 A/m 2
30
32
34
36
38
40
42
44
46
48
50
0 5 10 15 20 25 30 35 40 45
Hours
Cu
Con
c (g
/l)
Cu2 per. Mov. Avg. (Cu)Linear (Cu)
Test 10 - H 2SO4 Concentration
160 g/l H 2SO4 ; 40 g/l Cu; 250 A/m 2
150
152
154
156
158
160
162
164
166
168
170
0 5 10 15 20 25 30 35 40 45Hours
H2S
O4
Con
c (g
/l)
Acid2 per. Mov. Avg. (Acid)Linear (Acid)
Figure D.29: Cu concentration profile during test 10 (250 A/m 2)
Figure D.30: H 2SO4 Concentration profile during test 10 (250 A/m 2)

Univers
ity of
Cap
e Tow
n
PAGE 151 OF 181-
Test 11
Test 11 - Potential Difference Profiles
160 g/l H 2SO4; 50 g/l Cu; 300 A/m 2
0
0.5
1
1.5
2
2.5
0 5 10 15 20 25 30 35 40Hours
Vol
ts
Front CathodeBack CathodeRectifier
Test 11 - Cu Concentration
160 g/l H 2SO4; 40 g/l Cu; 300 A/m 2
30
32
34
36
38
40
42
44
46
48
50
0 5 10 15 20 25 30 35 40 45
Hours
Cu
Con
c (g
/l)
Cu2 per. Mov. Avg. (Cu)Linear (Cu)
Figure D.31: Potential difference between back cathode and anode, front cathode and anode and the rectifier potential for test 11
Figure D.32: Cu concentration profile during test 11 (300 A/m 2)

Univers
ity of
Cap
e Tow
n
PAGE 152 OF 181-
Test 11 - H 2SO4 Concentration
160 g/l H 2SO4 ; 40 g/l Cu; 300 A/m 2
156
158
160
162
164
166
168
170
172
174
176
178
0 5 10 15 20 25 30 35 40 45Hours
H2S
O4
Con
c (g
/l)
Acid2 per. Mov. Avg. (Acid)Linear (Acid)
Figure D.33: H 2SO4 Concentration profile during test 11 (300 A/m 2)

Univers
ity of
Cap
e Tow
n
-PAGE 153 OF 181-
E. Element Deportment Results
Element Initial Anode
Mass in
Anode
Electrolyte Feed
Mass in Electrolyte
Feed Total In Cathode
Front Cathode
Back Mass in Cathode Slimes
Mass in
Slimes
Spent Electrolyte
Mass in Spent
Electrolyte
Total Out
(g/t) (g) (mg/l) (g) (g) (g/t) (g/t) (g) (g/t) (g) (mg/l) (g) (g) Pt 886 0.7 <0.01 0.0 0.7 4.0 3.8 0.0 33500 0.7 <0.2 0.0 0.7 Pd 5110 3.8 <0.01 0.0 3.8 5.7 3.3 0.0 174300 3.6 <0.2 0.0 3.6 Rh 1152 0.9 2.8 0.4 1.3 2.8 1.5 0.0 47700 1.0 2.8 0.4 1.4 Ru 1025 0.8 16.0 2.3 3.1 0.0 0.0 0.0 34500 0.7 16.0 2.2 3.0 Ir 30.4 0.0 0.4 0.1 0.1 0.0 0.0 0.0 1200 0.0 0.4 0.1 0.1
Os 4.9 0.0 <0.02 0.0 0.0 0.0 0.0 0.0 230 0.0 <0.2 0.0 0.0 Au 421 0.3 <0.01 0.0 0.3 7.5 2.2 0.0 13800 0.3 <0.2 0.0 0.3 Ag 1500 1.1 0.1 0.0 1.1 0.0 0.0 0.0 7330 0.2 0.1 0.0 0.2 Cu 807300 605.5 40100 5727.0 6332.5 0.0 0.0 775.1 187500 3.9 41230 5795.8 6574.9 Ni 127100 95.3 56630 8087.8 8183.2 0.0 0.0 0.0 2800 0.1 56400 7928.3 7928.4 Fe 44600 33.5 2450 349.9 383.4 126.7 51.7 0.1 10500 0.2 2650 372.5 372.8 Co 1700 1.3 869.0 124.1 125.4 0.0 0.0 0.0 <500 0.0 944.0 132.7 132.7 Pb 2750 2.1 7.2 1.0 3.1 8.3 8.3 0.0 52600 1.1 8.7 1.2 2.3 As 2030 1.5 73.0 10.4 11.9 6.7 2.5 0.0 63000 1.3 74.0 10.4 11.7 S 1700 1.3 95330 13614.9 13616.2 0.0 0.0 0.0 95500 2.0 98340 13824.0 13826.0 Si <1000 0.4 91.3 13.0 13.4 63.3 <0.833 0.0 <3000 0.0 112.0 15.7 15.8 Te 665 0.5 40.0 5.7 6.2 7.8 7.8 0.0 61200 1.3 33.0 4.6 5.9 Sb 990 0.7 9.1 1.3 2.0 0.0 0.0 0.0 20000 0.4 10.0 1.4 1.8 Bi 410 0.3 1.0 0.1 0.5 0.0 0.0 0.0 3400 0.1 2.5 0.4 0.4 Sn 161 0.1 <0.2 0.0 0.1 0.0 0.0 0.0 155 0.0 0.9 0.1 0.1 Se 68.6 0.1 11.0 1.6 1.6 4.0 1.8 0.0 7050 0.1 10.0 1.4 1.6 Zn 26 0.0 24.9 3.6 3.6 4.2 4.8 0.0 9.3 0.0 26.1 3.7 3.7
Table E.1: Elemental input and output grades, concentrations and mass flows of test 1 (110 g/l H 2SO4)

Univers
ity of
Cap
e Tow
n
PAGE 154 OF 181-
Element Initial Anode
Mass in
Anode
Electrolyte Feed
Mass in Electrolyte
Feed Total In Cathode
Front Cathode
Back Mass in Cathode Slimes
Mass in
Slimes
Spent Electrolyte
Mass in Spent
Electrolyte
Total Out
(g/t) (g) (mg/l) (g) (g) (g/t) (g/t) (g) (g/t) (g) (mg/l) (g) (g) Pt 954 0.7 <0.01 0.0 0.7 0.2 <0.167 0.0 25700 0.6 <0.2 0.0 0.6 Pd 4950 3.8 <0.01 0.0 3.8 6.8 6.3 0.0 137600 3.3 <0.2 0.0 3.3 Rh 1312 1.0 2.8 0.4 1.4 7.7 8.2 0.0 38700 0.9 2.6 0.3 1.3 Ru 1269 1.0 16.0 2.1 3.1 13.0 14.3 0.0 38800 0.9 17.0 2.2 3.1 Ir 40 0.0 0.4 0.1 0.1 <0.167 <0.167 0.0 1100 0.0 0.4 0.1 0.1
Os 8 0.0 <0.2 0.0 0.0 <0.167 <0.167 0.0 220 0.0 <0.2 0.0 0.0 Au 404 0.3 <0.01 0.0 0.3 0.2 <0.167 0.0 10900 0.3 <0.2 0.0 0.3 Ag 1358 1.0 <0.2 0.0 1.0 0.3 <0.167 0.0 3420 0.1 0.9 0.1 0.2 Cu 795200 608.0 40400 5314 5922 0.0 0.0 723.1 281600 6.7 40100 5193.8 5923.7 Ni 139100 106.4 53660 7058.2 7164.5 85.2 83.5 0.1 6400 0.2 58280 7548.6 7548.8 Fe 48600 37.2 2330 306.5 343.6 266.7 50.0 0.1 6100 0.1 2730 353.6 353.8 Co 1900 1.5 841 110.6 112.1 5.3 5.8 0.0 <500 0.0 931 120.6 120.6 Pb 2480 1.9 8.2 1.1 3.0 <0.167 <0.167 0.0 49800 1.2 5.7 0.7 1.9 As 1902 1.5 73.0 9.6 11.1 7.8 5.0 0.0 57900 1.4 74.0 9.6 11.0 S 1600 1.2 112500 14797.7 14798.9 0.0 0.0 0.0 86500 2.1 118800 15387.2 15389.3 Si <1000 0.4 36.7 4.8 5.2 65.0 85.0 0.1 4800 0.1 30.9 4.0 4.2 Te 592 0.5 41.0 5.4 5.8 123.3 118.8 0.1 46300 1.1 33.0 4.3 5.5 Sb 919 0.7 7.9 1.0 1.7 4.3 2.7 0.0 19300 0.5 8.6 1.1 1.6 Bi 373 0.3 1.0 0.1 0.4 2.3 0.2 0.0 2900 0.1 2.6 0.3 0.4 Sn 151 0.1 <0.2 0.0 0.1 <0.167 <0.167 0.0 53 0.0 1.0 0.1 0.1 Se 64 0.0 11.0 1.4 1.5 1.7 3.0 0.0 7820 0.2 9.2 1.2 1.4 Zn 20.9 0.0 25.3 3.3 3.3 <0.167 <0.167 0.0 12.3 0.0 27.6 3.6 3.6
Table E.2: Elemental input and output grades, concentrations and mass flows of test 2 (Base-case)

Univers
ity of
Cap
e Tow
n
PAGE 155 OF 181-
Element Initial Anode
Mass in
Anode
Electrolyte Feed
Mass in Electrolyte
Feed Total In Cathode
Front Cathode
Back Mass in Cathode Slimes
Mass in
Slimes
Spent Electrolyte
Mass in Spent
Electrolyte
Total Out
(g/t) (g) (mg/l) (g) (g) (g/t) (g/t) (g) (g/t) (g) (mg/l) (g) (g) Pt 828 0.6 <0.01 0.0 0.6 <0.167 <0.167 0.0 27300 0.6 0.0 0.0 0.6 Pd 4920 3.4 <0.01 0.0 3.4 1.3 2.3 0.0 146200 3.2 0.1 0.0 3.2 Rh 1089 0.8 2.9 0.4 1.1 1.3 1.7 0.0 37800 0.8 2.6 0.3 1.2 Ru 1143 0.8 16.0 2.0 2.8 1.0 0.8 0.0 42100 0.9 16.0 2.1 3.1 Ir 34 0.0 0.4 0.0 0.1 <0.167 <0.167 0.0 1300 0.0 0.4 0.1 0.1
Os 5 0.0 <0.2 0.0 0.0 <0.167 <0.167 0.0 260 0.0 <0.2 0.0 0.0 Au 418 0.3 <0.01 0.0 0.3 0.2 0.2 0.0 11900 0.3 <0.01 0.0 0.3 Ag 1797 1.3 <0.2 0.0 1.3 1.2 1.8 0.0 10400 0.2 <0.2 0.0 0.2 Cu 827200 579.4 36200 4501 5081 0.0 0.0 775.1 155200 3.4 36900 4941.4 5720.0 Ni 122100 85.5 56120 6978.0 7063.5 24.0 24.3 0.0 6000 0.1 55860 7480.5 7480.6 Fe 30700 21.5 2370 294.7 316.2 111.7 10.8 0.1 6700 0.1 2560 342.8 343.1 Co 1600 1.1 852 105.9 107.1 13.7 1.5 0.0 630 0.0 877 117.4 117.5 Pb 3040 2.1 6.4 0.8 2.9 1.0 0.7 0.0 57700 1.3 8.4 1.1 2.4 As 2630 1.8 79.0 9.8 11.7 0.8 0.8 0.0 59300 1.3 74.0 9.9 11.2 S 1900 1.3 116800 14522.9 14524.2 0.0 0.0 0.0 93700 2.0 114400 15319.8 15321.9 Si 2600 1.8 44.3 5.5 7.3 8.0 16.7 0.0 14200 0.3 34.8 4.7 5.0 Te 865 0.6 43.0 5.3 6.0 11.8 7.3 0.0 48300 1.1 33.0 4.4 5.5 Sb 1110 0.8 8.3 1.0 1.8 0.3 0.8 0.0 10900 0.2 11.0 1.5 1.7 Bi 488 0.3 0.7 0.1 0.4 0.5 <0.167 0.0 3950 0.1 2.6 0.3 0.4 Sn 183 0.1 0.0 0.0 0.1 0.3 <0.167 0.0 69 0.0 1.0 0.1 0.1 Se 84 0.1 11.0 1.4 1.4 5.8 5.5 0.0 7460 0.2 9.2 1.2 1.4 Zn 72.7 0.1 26.5 3.3 3.3 8.2 14.7 0.0 8.9 0.0 27.7 3.7 3.7
Table E.3: Elemental input and output grades, concentrations and mass flows of test 3 (Base-case with additives)
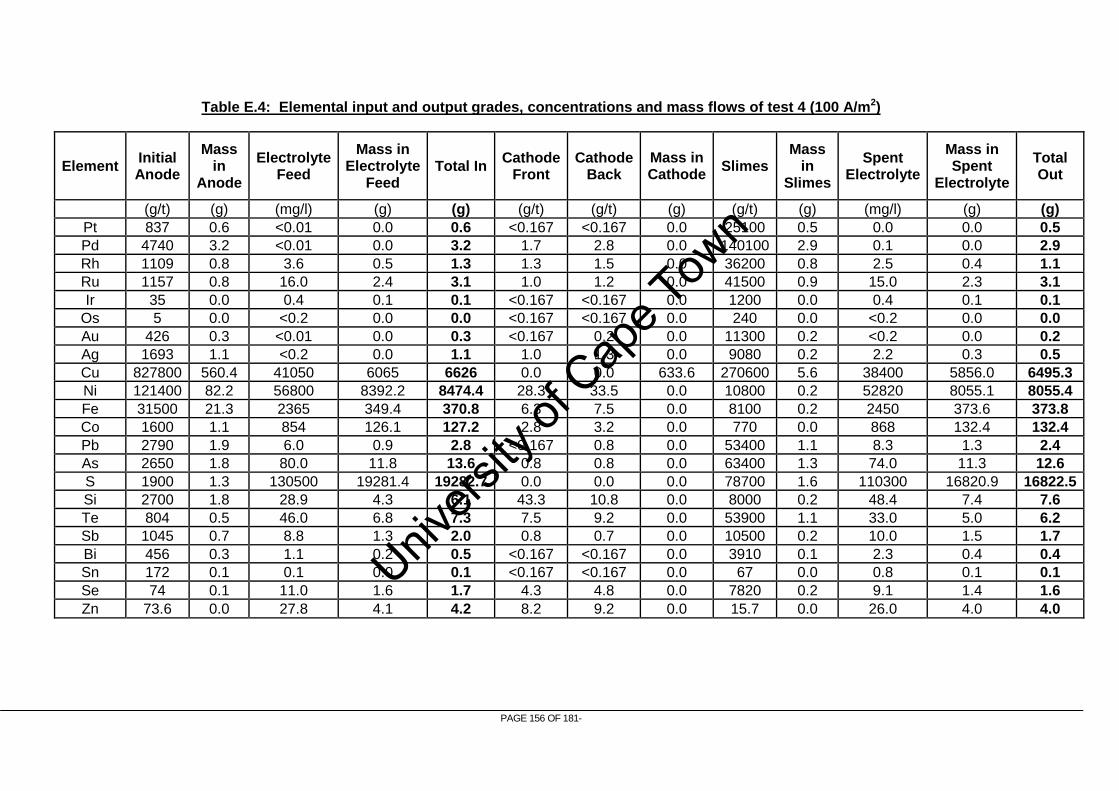
Univers
ity of
Cap
e Tow
n
PAGE 156 OF 181-
Element Initial Anode
Mass in
Anode
Electrolyte Feed
Mass in Electrolyte
Feed Total In Cathode
Front Cathode
Back Mass in Cathode Slimes
Mass in
Slimes
Spent Electrolyte
Mass in Spent
Electrolyte
Total Out
(g/t) (g) (mg/l) (g) (g) (g/t) (g/t) (g) (g/t) (g) (mg/l) (g) (g) Pt 837 0.6 <0.01 0.0 0.6 <0.167 <0.167 0.0 25100 0.5 0.0 0.0 0.5 Pd 4740 3.2 <0.01 0.0 3.2 1.7 2.8 0.0 140100 2.9 0.1 0.0 2.9 Rh 1109 0.8 3.6 0.5 1.3 1.3 1.5 0.0 36200 0.8 2.5 0.4 1.1 Ru 1157 0.8 16.0 2.4 3.1 1.0 1.2 0.0 41500 0.9 15.0 2.3 3.1 Ir 35 0.0 0.4 0.1 0.1 <0.167 <0.167 0.0 1200 0.0 0.4 0.1 0.1
Os 5 0.0 <0.2 0.0 0.0 <0.167 <0.167 0.0 240 0.0 <0.2 0.0 0.0 Au 426 0.3 <0.01 0.0 0.3 <0.167 0.2 0.0 11300 0.2 <0.2 0.0 0.2 Ag 1693 1.1 <0.2 0.0 1.1 1.0 1.3 0.0 9080 0.2 2.2 0.3 0.5 Cu 827800 560.4 41050 6065 6626 0.0 0.0 633.6 270600 5.6 38400 5856.0 6495.3 Ni 121400 82.2 56800 8392.2 8474.4 28.3 33.5 0.0 10800 0.2 52820 8055.1 8055.4 Fe 31500 21.3 2365 349.4 370.8 6.3 7.5 0.0 8100 0.2 2450 373.6 373.8 Co 1600 1.1 854 126.1 127.2 2.8 3.2 0.0 770 0.0 868 132.4 132.4 Pb 2790 1.9 6.0 0.9 2.8 <0.167 0.8 0.0 53400 1.1 8.3 1.3 2.4 As 2650 1.8 80.0 11.8 13.6 0.8 0.8 0.0 63400 1.3 74.0 11.3 12.6 S 1900 1.3 130500 19281.4 19282.7 0.0 0.0 0.0 78700 1.6 110300 16820.9 16822.5 Si 2700 1.8 28.9 4.3 6.1 43.3 10.8 0.0 8000 0.2 48.4 7.4 7.6 Te 804 0.5 46.0 6.8 7.3 7.5 9.2 0.0 53900 1.1 33.0 5.0 6.2 Sb 1045 0.7 8.8 1.3 2.0 0.8 0.7 0.0 10500 0.2 10.0 1.5 1.7 Bi 456 0.3 1.1 0.2 0.5 <0.167 <0.167 0.0 3910 0.1 2.3 0.4 0.4 Sn 172 0.1 0.1 0.0 0.1 <0.167 <0.167 0.0 67 0.0 0.8 0.1 0.1 Se 74 0.1 11.0 1.6 1.7 4.3 4.8 0.0 7820 0.2 9.1 1.4 1.6 Zn 73.6 0.0 27.8 4.1 4.2 8.2 9.2 0.0 15.7 0.0 26.0 4.0 4.0
Table E.4: Elemental input and output grades, concentrations and mass flows of test 4 (100 A/m 2)

Univers
ity of
Cap
e Tow
n
PAGE 157 OF 181-
Element Initial Anode
Mass in
Anode
Electrolyte Feed
Mass in Electrolyte
Feed Total In Cathode
Front Cathode
Back Mass in Cathode Slimes
Mass in
Slimes
Spent Electrolyte
Mass in Spent
Electrolyte
Total Out
(g/t) (g) (mg/l) (g) (g) (g/t) (g/t) (g) (g/t) (g) (mg/l) (g) (g) Pt 860 0.6 <0.01 0.0 0.6 <0.167 <0.167 0.0 24100 0.6 <0.2 0.0 0.6 Pd 4730 3.3 <0.01 0.0 3.3 2.8 2.0 0.0 130400 3.0 <0.2 0.0 3.0 Rh 1135 0.8 2.7 0.3 1.1 3.5 7.3 0.0 34300 0.8 2.5 0.3 1.1 Ru 1179 0.8 15.0 1.6 2.4 14.5 14.2 0.0 36300 0.8 15.0 1.6 2.5 Ir 35 0.0 0.4 0.0 0.1 <0.167 <0.167 0.0 1100 0.0 0.4 0.0 0.1
Os 5 0.0 <0.2 0.0 0.0 <0.167 <0.167 0.0 220 0.0 <0.2 0.0 0.0 Au 403 0.3 <0.01 0.0 0.3 <0.167 <0.167 0.0 10400 0.2 <0.2 0.0 0.2 Ag 1593 1.1 <0.2 0.0 1.1 1.0 1.2 0.0 9600 0.2 <0.2 0.0 0.2 Cu 824000 578.7 37400 3874 4453 0.0 0.0 655.0 272400 6.4 38200 4074.7 4736.0 Ni 126900 89.1 56380 5840.1 5929.2 101.7 112.7 0.1 15500 0.4 55060 5873.1 5873.5 Fe 35000 24.6 2370 245.5 270.1 6.5 4.2 0.0 12300 0.3 2580 275.2 275.5 Co 1700 1.2 898 93.0 94.2 7.3 7.0 0.0 600 0.0 898 95.8 95.8 Pb 2800 2.0 6.6 0.7 2.7 1.0 0.3 0.0 45100 1.1 4.4 0.5 1.5 As 2310 1.6 76.0 7.9 9.5 0.8 0.8 0.0 60000 1.4 73.0 7.8 9.2 S 1700 1.2 114500 11860.5 11861.7 0.0 0.0 0.0 78300 1.8 111600 11904.0 11905.8 Si <1000 0.4 62.5 6.5 6.8 41.7 38.3 0.0 3800 0.1 66.6 7.1 7.2 Te 711 0.5 42.0 4.4 4.8 138.7 139.8 0.1 39100 0.9 33.0 3.5 4.5 Sb 1014 0.7 8.4 0.9 1.6 1.0 0.8 0.0 15900 0.4 10.0 1.1 1.4 Bi 439 0.3 1.1 0.1 0.4 <0.167 <0.167 0.0 3440 0.1 2.9 0.3 0.4 Sn 167 0.1 <0.2 0.0 0.1 <0.167 <0.167 0.0 65 0.0 1.2 0.1 0.1 Se 74 0.1 11.0 1.1 1.2 8.2 9.0 0.0 6610 0.2 9.0 1.0 1.1 Zn 80.0 0.1 26.4 2.7 2.8 9.2 8.8 0.0 10.8 0.0 25.7 2.7 2.7
Table E.5: Elemental input and output grades, concentrations and mass flows of test 5 (150 A/m 2)

Univers
ity of
Cap
e Tow
n
PAGE 158 OF 181-
Element Initial Anode
Mass in
Anode
Electrolyte Feed
Mass in Electrolyte
Feed Total In Cathode
Front Cathode
Back Mass in Cathode Slimes
Mass in
Slimes
Spent Electrolyte
Mass in Spent
Electrolyte
Total Out
(g/t) (g) (mg/l) (g) (g) (g/t) (g/t) (g) (g/t) (g) (mg/l) (g) (g) Pt 851 0.6 <0.01 0.0 0.6 <0.167 <0.167 0.0 22200 0.6 <0.2 0.0 0.6 Pd 4910 3.4 0.0 0.0 3.4 1.7 1.0 0.0 114200 3.1 <0.2 0.0 3.1 Rh 1134 0.8 1.9 0.2 1.0 9.7 8.2 0.0 30200 0.8 1.7 0.2 1.0 Ru 1177 0.8 11.0 1.4 2.2 15.5 13.5 0.0 33500 0.9 11.0 1.4 2.3 Ir 35 0.0 0.3 0.0 0.1 <0.167 <0.167 0.0 960 0.0 0.3 0.0 0.1
Os 7 0.0 <0.2 0.0 0.0 <0.167 <0.167 0.0 230 0.0 <0.2 0.0 0.0 Au 402 0.3 <0.01 0.0 0.3 <0.167 0.2 0.0 8900 0.2 <0.2 0.0 0.2 Ag 1609 1.1 0.1 0.0 1.1 1.5 2.2 0.0 17700 0.5 0.4 0.0 0.5 Cu 810700 567.2 28350 3490 4058 0.0 0.0 671.6 266500 7.2 28200 3560.0 4238.8 Ni 124100 86.8 39830 4903.9 4990.7 88.5 86.3 0.1 23800 0.6 40950 5169.5 5170.2 Fe 40100 28.1 1745 214.8 242.9 6.8 3.8 0.0 32200 0.9 1972 248.9 249.8 Co 1600 1.1 633 77.9 79.1 6.2 2.7 0.0 1400 0.0 644 81.3 81.3 Pb 2510 1.8 5.2 0.6 2.4 2.0 0.5 0.0 37800 1.0 6.5 0.8 1.8 As 2340 1.6 43.0 5.3 6.9 0.8 0.8 0.0 46300 1.3 54.0 6.8 8.1 S 1900 1.3 91550 11271.6 11273.0 0.0 0.0 0.0 56100 1.5 98950 12491.4 12492.9 Si 4500 3.1 62.5 7.7 10.8 66.7 68.3 0.0 42800 1.2 74.0 9.3 10.5 Te 745 0.5 30.0 3.7 4.2 148.5 168.3 0.1 32400 0.9 22.0 2.8 3.8 Sb 1021 0.7 6.7 0.8 1.5 1.8 2.3 0.0 11100 0.3 8.9 1.1 1.4 Bi 410 0.3 0.7 0.1 0.4 <0.167 <0.167 0.0 2870 0.1 1.9 0.2 0.3 Sn 165 0.1 0.1 0.0 0.1 <0.167 0.3 0.0 63 0.0 1.0 0.1 0.1 Se 70 0.0 8.7 1.1 1.1 9.5 9.8 0.0 5260 0.1 6.6 0.8 1.0 Zn 120.0 0.1 20.6 2.5 2.6 92.5 96.3 0.1 37.2 0.0 21.9 2.8 2.8
Table E.6: Elemental input and output grades, concentrations and mass flows of test 6 (30 g/l Cu)

Univers
ity of
Cap
e Tow
n
PAGE 159 OF 181-
Element Initial Anode
Mass in
Anode
Electrolyte Feed
Mass in Electrolyte
Feed Total In Cathode
Front Cathode
Back Mass in Cathode Slimes
Mass in
Slimes
Spent Electrolyte
Mass in Spent
Electrolyte
Total Out
(g/t) (g) (mg/l) (g) (g) (g/t) (g/t) (g) (g/t) (g) (mg/l) (g) (g) Pt 851 0.6 <0.01 0.0 0.6 <0.167 <0.167 0.0 19500 0.6 <0.2 0.0 0.6 Pd 4840 3.4 <0.01 0.0 3.4 <0.167 <0.167 0.0 106600 3.2 <0.2 0.0 3.2 Rh 1101 0.8 2.6 0.3 1.1 1.0 0.8 0.0 28100 0.8 2.5 0.3 1.1 Ru 1177 0.8 15.0 1.6 2.4 1.2 0.8 0.0 30000 0.9 15.0 1.7 2.6 Ir 35 0.0 0.4 0.0 0.1 <0.167 <0.167 0.0 850 0.0 0.4 0.0 0.1
Os 6 0.0 <0.2 0.0 0.0 <0.167 <0.167 0.0 200 0.0 <0.2 0.0 0.0 Au 403 0.3 <0.01 0.0 0.3 <0.167 <0.167 0.0 8300 0.2 <0.2 0.0 0.2 Ag 1589 1.1 <0.2 0.0 1.1 1.8 1.3 0.0 17000 0.5 <0.2 0.0 0.5 Cu 819800 575.1 37500 4039 4614 0.0 0.0 672.0 84700 2.5 40500 4526.0 5200.5 Ni 122000 85.6 54140 5830.9 5916.5 14.7 8.3 0.0 14400 0.4 52390 5854.8 5855.2 Fe 40100 28.1 2300 247.7 275.8 416.7 <0.833 0.1 21800 0.7 2520 281.6 282.4 Co 1600 1.1 835 89.9 91.1 0.5 0.3 0.0 930 0.0 838 93.6 93.7 Pb 2540 1.8 7.9 0.9 2.6 74.3 95.0 0.1 37600 1.1 5.1 0.6 1.7 As 2340 1.6 73.0 7.9 9.5 <0.167 <0.167 0.0 38300 1.1 71.0 7.9 9.1 S 1700 1.2 114100 12288.6 12289.8 0.0 0.0 0.0 84700 2.5 113200 12650.5 12653. Si 5300 3.7 69.9 7.5 11.2 45.0 233.3 0.1 96800 2.9 66.7 7.5 10.4 Te 743 0.5 42.0 4.5 5.0 5.7 3.7 0.0 27800 0.8 34.0 3.8 4.6 Sb 1023 0.7 8.5 0.9 1.6 0.5 0.3 0.0 8020 0.2 11.0 1.2 1.5 Bi 412 0.3 1.0 0.1 0.4 <0.167 <0.167 0.0 2430 0.1 2.4 0.3 0.3 Sn 167 0.1 0.0 0.0 0.1 1.3 1.2 0.0 291 0.0 2.2 0.2 0.3 Se 72 0.1 11.0 1.2 1.2 9.2 12.7 0.0 4580 0.1 8.6 1.0 1.1 Zn 114.0 0.1 28.4 3.1 3.1 6.8 12.5 0.0 23.9 0.0 25.1 2.8 2.8
Table E.7: Elemental input and output grades, concentrations and mass flows of test 7 (50 g/l Cu)

Univers
ity of
Cap
e Tow
n
-PAGE 160 OF 181-
Recovery From Anode + Electrolyte Element Accountability To
slimes To
Electrolyte To
Cathodes
Mass in Slimes Mass from Anode
% % % % Fraction Pt 105.7% 99.6% 0.0% 0.4% 0.996 Pd 95.0% 99.9% 0.0% 0.1% 0.999 Rh 110.1% 71.6% 28.3% 0.1% 1.047 Ru 97.2% 24.2% 75.8% 0.0% 0.963 Ir 101.7% 30.8% 69.2% 0.0% 1.080
Os 130.9% 100.0% 0.0% 0.0% 1.000 Au 92.8% 98.3% 0.0% 1.7% 0.983 Ag 14.6% 91.6% 8.4% 0.0% 0.929 Cu 103.8% 0.1% 88.2% 11.8% 0.006 Ni 96.9% 0.0% 100.0% 0.0% 0.001 Fe 97.3% 0.1% 99.9% 0.0% 0.007 Co 105.8% 0.0% 100.0% 0.0% 0.000 Pb 75.3% 47.2% 52.6% 0.3% 0.707 As 98.1% 11.2% 88.7% 0.0% 0.880 S 101.5% 0.0% 100.0% 0.0% 1.539 Si 117.6% 0.0% 99.8% 0.2% 0.000 Te 95.3% 21.6% 78.3% 0.1% 2.686 Sb 89.3% 22.9% 77.1% 0.0% 0.630 Bi 93.8% 16.8% 83.2% 0.0% 0.246 Sn 107.5% 2.5% 97.5% 0.0% 0.025 Se 95.9% 9.5% 90.4% 0.2% 2.983 Zn 102.8% 0.0% 99.9% 0.1% 0.010
Recovery From Anode + Electrolyte Element Accountability
To slimes To Electrolyte To Cathodes Mass in Slimes
Mass from Anode
% % % % Fraction Pt 84.0% 100.0% 0.0% 0.0% 1.000 Pd 86.8% 99.9% 0.0% 0.1% 0.999 Rh 92.2% 72.9% 26.6% 0.5% 0.997 Ru 102.0% 29.5% 70.2% 0.3% 0.934 Ir 93.6% 33.6% 66.4% 0.0% 0.911
Os 90.9% 100.0% 0.0% 0.0% 1.000 Au 84.1% 100.0% 0.0% 0.0% 1.000 Ag 18.5% 42.5% 57.4% 0.1% 0.425 Cu 100.0% 0.1% 87.7% 12.2% 0.011 Ni 105.4% 0.0% 100.0% 0.0% 0.001 Fe 103.0% 0.0% 99.9% 0.0% 0.004 Co 107.6% 0.0% 100.0% 0.0% 0.000 Pb 64.7% 61.7% 38.3% 0.0% 0.967
Table E.8: Elemental accountability and deportment for test 1 (110 g/l H 2SO4)
Table E.9: Elemental accountability and deportment for test 2 (Base-case)

Univers
ity of
Cap
e Tow
n
PAGE 161 OF 181-
Recovery From Anode + Electrolyte Element Accountability
To slimes To Electrolyte To Cathodes Mass in Slimes
Mass from Anode
As 99.2% 12.6% 87.4% 0.0% 0.957 S 104.0% 0.0% 100.0% 0.0% 1.621 Si 80.0% 2.7% 95.9% 1.3% 0.374 Te 93.5% 20.2% 78.2% 1.6% 2.608 Sb 90.5% 29.2% 70.7% 0.2% 0.723 Bi 97.6% 17.0% 82.8% 0.2% 0.248 Sn 113.3% 1.0% 99.0% 0.0% 0.010 Se 92.2% 13.5% 86.4% 0.1% 4.130 Zn 107.0% 0.0% 100.0% 0.0% 0.017
Recovery From Anode + Electrolyte Element Accountability To slimes To Electrolyte To Cathodes
Mass in Slimes Mass from Anode
% % % % Fraction Pt 92.1% 99.7% 0.3% 0.0% 0.996 Pd 90.9% 99.6% 0.3% 0.0% 0.999 Rh 87.9% 66.3% 33.7% 0.1% 1.047 Ru 100.1% 27.3% 72.6% 0.0% 0.963 Ir 103.7% 29.0% 71.0% 0.0% 1.080
Os 139.3% 100.0% 0.0% 0.0% 1.000 Au 81.3% 100.0% 0.0% 0.0% 0.983 Ag 46.0% 35.7% 64.2% 0.1% 0.929 Cu 98.0% 0.1% 90.2% 9.8% 0.006 Ni 95.1% 0.0% 100.0% 0.0% 0.001 Fe 100.8% 0.0% 100.0% 0.0% 0.007 Co 104.1% 0.0% 100.0% 0.0% 0.000 Pb 85.5% 46.7% 53.3% 0.0% 0.707 As 92.6% 10.4% 89.6% 0.0% 0.880 S 87.2% 0.0% 100.0% 0.0% 1.539 Si 124.0% 2.2% 97.6% 0.2% 0.000 Te 83.9% 18.2% 81.8% 0.1% 2.686 Sb 86.8% 12.5% 87.5% 0.0% 0.630 Bi 91.6% 18.8% 81.2% 0.0% 0.246 Sn 90.0% 1.1% 98.9% 0.0% 0.025 Se 92.7% 10.4% 89.4% 0.2% 2.983 Zn 95.5% 0.0% 99.9% 0.1% 0.010
Recovery From Anode + Electrolyte Element Accountability
To slimes To Electrolyte To Cathodes Mass in Slimes
Mass from Anode % % % % Fraction
Pt 92.1% 99.7% 0.3% 0.0% 0.997 Pd 90.9% 99.6% 0.3% 0.0% 0.996
Table E.10: Elemental accountability and deportment for test 3 (With additives)
Table E.11: Elemental accountability and deportment for test 4 (100 A/m 2)

Univers
ity of
Cap
e Tow
n
PAGE 162 OF 181-
Recovery From Anode + Electrolyte Element Accountability
To slimes To Electrolyte To Cathodes Mass in Slimes
Mass from Anode Rh 87.9% 66.3% 33.7% 0.1% 1.138 Ru 100.1% 27.3% 72.6% 0.0% 1.098 Ir 103.7% 29.0% 71.0% 0.0% 1.013
Os 139.3% 100.0% 0.0% 0.0% 1.000 Au 81.3% 100.0% 0.0% 0.0% 1.000 Ag 46.0% 35.7% 64.2% 0.1% 0.357 Cu 98.0% 0.1% 90.2% 9.8% 0.010 Ni 95.1% 0.0% 100.0% 0.0% 0.003 Fe 100.8% 0.0% 100.0% 0.0% 0.008 Co 104.1% 0.0% 100.0% 0.0% 0.014 Pb 85.5% 46.7% 53.3% 0.0% 0.686 As 92.6% 10.4% 89.6% 0.0% 0.792 S 87.2% 0.0% 100.0% 0.0% 1.455 Si 124.0% 2.2% 97.6% 0.2% 0.073 Te 83.9% 18.2% 81.8% 0.1% 2.449 Sb 86.8% 12.5% 87.5% 0.0% 0.355 Bi 91.6% 18.8% 81.2% 0.0% 0.287 Sn 90.0% 1.1% 98.9% 0.0% 0.013 Se 92.7% 10.4% 89.4% 0.2% 3.488 Zn 95.5% 0.0% 99.9% 0.1% 0.007
Recovery From Anode + Electrolyte Element Accountability
To slimes To Electrolyte To Cathodes Mass in Slimes
Mass from Anode % % % % Fraction
Pt 93.2% 100.0% 0.0% 0.0% 1.000 Pd 91.7% 99.9% 0.0% 0.1% 0.999 Rh 99.5% 74.8% 24.9% 0.3% 1.010 Ru 103.2% 34.5% 65.1% 0.4% 0.993 Ir 103.6% 37.6% 62.4% 0.0% 1.009
Os 140.5% 100.0% 0.0% 0.0% 1.000 Au 85.8% 100.0% 0.0% 0.0% 1.000 Ag 20.1% 99.7% 0.0% 0.3% 0.997 Cu 106.4% 0.1% 86.0% 13.8% 0.010 Ni 99.1% 0.0% 100.0% 0.0% 0.004 Fe 102.0% 0.1% 99.9% 0.0% 0.011 Co 101.7% 0.0% 100.0% 0.0% 0.012 Pb 57.5% 69.2% 30.8% 0.0% 0.932 As 96.8% 15.3% 84.7% 0.0% 0.893 S 100.4% 0.0% 100.0% 0.0% 1.526 Si 105.8% 1.2% 98.4% 0.4% 0.239 Te 93.3% 20.2% 77.8% 2.0% 1.961 Sb 90.9% 25.8% 74.1% 0.0% 0.574 Bi 92.3% 20.6% 79.4% 0.0% 0.282 Sn 110.4% 1.2% 98.8% 0.0% 0.012 Se 94.0% 13.8% 85.7% 0.5% 3.181 Zn 98.4% 0.0% 99.8% 0.2% 0.005
Table E.12: Elemental accountability and deportment for test 5 (150 A/m 2)

Univers
ity of
Cap
e Tow
n
PAGE 163 OF 181-
Recovery From Anode + Electrolyte Element Accountability
To slimes To Electrolyte To Cathodes Mass in Slimes
Mass from Anode
% % % % Fraction Pt 101.3% 100.0% 0.0% 0.0% 1.000 Pd 90.3% 100.0% 0.0% 0.0% 1.000 Rh 101.3% 78.8% 20.6% 0.6% 1.020 Ru 106.0% 39.4% 60.2% 0.4% 1.042 Ir 110.5% 40.8% 59.2% 0.0% 0.958
Os 132.7% 100.0% 0.0% 0.0% 1.000 Au 86.0% 100.0% 0.0% 0.0% 1.000 Ag 46.4% 90.9% 8.8% 0.2% 0.920 Cu 104.5% 0.2% 84.0% 15.8% 0.012 Ni 103.6% 0.0% 100.0% 0.0% 0.007 Fe 102.9% 0.4% 99.6% 0.0% 0.030 Co 102.9% 0.0% 99.9% 0.0% 0.033 Pb 77.1% 55.6% 44.4% 0.0% 0.758 As 116.5% 15.6% 84.4% 0.0% 0.659 S 110.8% 0.0% 100.0% 0.0% 1.034 Si 97.3% 11.0% 88.6% 0.4% 0.380 Te 89.3% 23.4% 73.8% 2.8% 1.891 Sb 92.7% 21.1% 78.8% 0.1% 0.455 Bi 85.2% 24.5% 75.5% 0.0% 0.319 Sn 104.3% 1.3% 98.6% 0.1% 0.014 Se 87.7% 14.5% 84.8% 0.7% 3.326 Zn 108.1% 0.0% 97.7% 2.2% 0.011
Recovery From Anode + Electrolyte Element Accountability
To slimes To Electrolyte To Cathodes Mass in Slimes
Mass from Anode
% % % % Fraction Pt 97.4% 100.0% 0.0% 0.0% 1.000 Pd 93.6% 100.0% 0.0% 0.0% 1.000 Rh 106.2% 75.0% 25.0% 0.1% 1.021 Ru 105.3% 34.8% 65.2% 0.0% 1.029 Ir 103.5% 36.2% 63.8% 0.0% 0.995
Os 146.6% 100.0% 0.0% 0.0% 1.000 Au 87.5% 100.0% 0.0% 0.0% 1.000 Ag 45.6% 99.8% 0.0% 0.2% 0.998 Cu 112.7% 0.0% 87.0% 12.9% 0.004 Ni 99.0% 0.0% 100.0% 0.0% 0.005 Fe 102.4% 0.2% 99.7% 0.0% 0.023 Co 102.9% 0.0% 100.0% 0.0% 0.024 Pb 66.4% 64.1% 32.6% 3.3% 0.947 As 95.5% 12.6% 87.4% 0.0% 0.728
Table E.13: Elemental accountability and deportment for test 6 (30 g/l Cu)
Table E.14: Elemental accountability and deportment for test 7 (50 g/l Cu)

Univers
ity of
Cap
e Tow
n
PAGE 164 OF 181-
Recovery From Anode + Electrolyte Element Accountability
To slimes To Electrolyte To Cathodes Mass in Slimes
Mass from Anode
S 103.0% 0.0% 100.0% 0.0% 2.057 Si 92.9% 27.6% 71.4% 1.0% 0.836 Te 91.8% 17.9% 82.0% 0.1% 1.732 Sb 89.9% 16.3% 83.7% 0.0% 0.371 Bi 85.9% 21.3% 78.7% 0.0% 0.292 Sn 218.0% 3.4% 96.3% 0.3% 0.034 Se 89.5% 12.4% 87.0% 0.7% 3.022 Zn 89.4% 0.0% 99.7% 0.2% 0.010
F. Product Characterisation Results
Anode Slimes Composition
Special Condition PGMs BMs Ag, As, Te, Se & Pb
Al, Si, Sb, Bi, Sn & Zn S
110 g/l Acid 30.52% 20.08% 19.12% 2.56% 9.55%
Base-case 25.30% 29.41% 16.52% 2.89% 8.65%
With Additives 26.69% 16.85% 18.32% 2.91% 9.37%
100 CD 25.56% 29.03% 18.76% 2.25% 7.87%
150 CD 23.68% 30.08% 16.04% 2.32% 7.83%
30 g/l Cu 21.02% 32.39% 13.95% 5.69% 5.61%
50 g/l Cu 19.36% 12.18% 12.53% 10.76% 8.47%
130 g/l Acid 3.92% 62.53% 1.81% 18.44% 1.05%
190 g/l Acid 2.79% 31.87% 1.78% 18.99% 4.61%
250 CD 3.17% 59.60% 1.40% 15.99% 2.02%
300 CD 3.36% 60.92% 8.18% 16.96% 1.92%
PMR 0.5847 0.172 4.28% 0.43% 0.02
Element 130 g/l H2SO4
190 g/l H2SO4
250 A/m 2
300 A/m 2
PMR Feed
Ag (g/t) 4270 2960 3340 3510 300000 Cu (g/t) 21700 17500 18800 20400 170000 Ni (g/t) 5220 2900 3800 3900 35000 Fe (g/t) 5750 2980 3980 3970 46000 Co (g/t) 142 72 100 105 14000 Pb (g/t) 2110 1529 1700 1751 13000 As (g/t) 8200 6950 7300 75100 4700 Al (g/t) 75700 39500 81500 84500 50000 S (g/t) 391400 191300 346800 354500 90000 Cr (g/t) 152600 85200 162900 165400 30000 Mg (g/t) 5600 2700 4800 4800 2000
Table F.1: Element group composition of anode slimes
Table F.2: Impurity grade in PMR feed and slimes produced by altered anode material
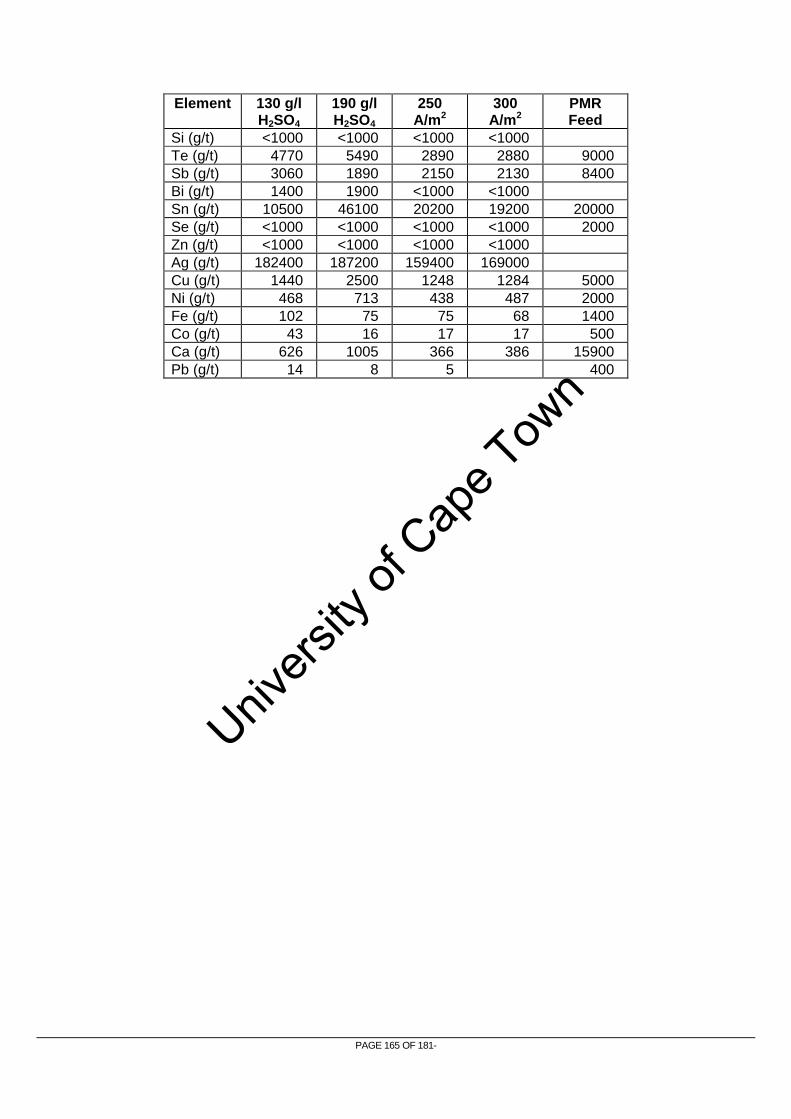
Univers
ity of
Cap
e Tow
n
PAGE 165 OF 181-
Element 130 g/l H2SO4
190 g/l H2SO4
250 A/m 2
300 A/m 2
PMR Feed
Si (g/t) <1000 <1000 <1000 <1000 Te (g/t) 4770 5490 2890 2880 9000 Sb (g/t) 3060 1890 2150 2130 8400 Bi (g/t) 1400 1900 <1000 <1000 Sn (g/t) 10500 46100 20200 19200 20000 Se (g/t) <1000 <1000 <1000 <1000 2000 Zn (g/t) <1000 <1000 <1000 <1000 Ag (g/t) 182400 187200 159400 169000 Cu (g/t) 1440 2500 1248 1284 5000 Ni (g/t) 468 713 438 487 2000 Fe (g/t) 102 75 75 68 1400 Co (g/t) 43 16 17 17 500 Ca (g/t) 626 1005 366 386 15900 Pb (g/t) 14 8 5 400

Univers
ity of
Cap
e Tow
n
-PAGE 166 OF 181-
G. Effect of Blended Feed on PMR Feed Composition
Anodes t/month: 110 Test 1 Test 2 Slimes Slimes
FC % Slimes/Anode 2.78%
New Total % Slimes/Anode 3.12%
New Total
kg/month % kg/month % kg/month %
Over initial mean
kg/month % kg/month %
Over initial mean
Total 22078.54 91.72% 3058.00 82.18% 25136.54 90.56% 3432.00 82.82% 25510.54 90.52% Pt 7134.94 32.32% 102.44 3.35% 7237.39 28.79% -3.52% 88.20 2.57% 7223.15 28.31% -4.00% Pd 3831.67 17.35% 533.01 17.43% 4364.68 17.36% 0.01% 472.24 13.76% 4303.91 16.87% -0.48% Au 215.77 0.98% 42.20 1.38% 257.97 1.03% 0.05% 37.41 1.09% 253.18 0.99% 0.02% Rh 935.39 4.24% 145.87 4.77% 1081.26 4.30% 0.06% 132.82 3.87% 1068.21 4.19% -0.05% Ir 364.01 1.65% 3.67 0.12% 367.68 1.46% -0.19% 3.78 0.11% 367.79 1.44% -0.21%
Ru 1235.27 5.59% 105.50 3.45% 1340.77 5.33% -0.26% 133.16 3.88% 1368.43 5.36% -0.23% Os 129.99 0.59% 0.70 0.02% 130.69 0.52% -0.07% 0.76 0.02% 130.74 0.51% -0.08% Ag 50.24 0.23% 22.42 0.73% 72.66 0.29% 0.06% 11.74 0.34% 61.98 0.24% 0.02% Fe 1050.03 4.76% 32.11 1.05% 1082.14 4.31% -0.45% 20.94 0.61% 1070.97 4.20% -0.56% Ni 2880.86 13.05% 8.56 0.28% 2889.42 11.49% -1.55% 21.96 0.64% 2902.83 11.38% -1.67% Cu 1026.47 4.65% 573.38 18.75% 1599.84 6.36% 1.72% 966.45 28.16% 1992.92 7.81% 3.16% S 441.57 2.00% 292.04 9.55% 733.61 2.92% 0.92% 296.87 8.65% 738.44 2.89% 0.89%
Co 39.06 0.18% 1.53 0.05% 40.59 0.16% -0.02% 1.72 0.05% 40.77 0.16% -0.02% Te 81.30 0.37% 187.15 6.12% 268.45 1.07% 0.70% 158.90 4.63% 240.20 0.94% 0.57% Se 202.52 0.92% 21.56 0.71% 224.08 0.89% -0.03% 26.84 0.78% 229.36 0.90% -0.02% Pb 273.68 1.24% 160.85 5.26% 434.53 1.73% 0.49% 170.91 4.98% 444.59 1.74% 0.50% Zn 17.66 0.08% 0.03 0.00% 17.69 0.07% -0.01% 0.04 0.00% 17.70 0.07% -0.01% Sb 32.22 0.15% 61.16 2.00% 93.38 0.37% 0.23% 66.24 1.93% 98.46 0.39% 0.24% As 228.99 1.04% 192.65 6.30% 421.65 1.68% 0.64% 198.71 5.79% 427.71 1.68% 0.64% Bi 55.96 0.25% 10.40 0.34% 66.36 0.26% 0.01% 9.95 0.29% 65.91 0.26% 0.00% Sn 6.32 0.03% 0.47 0.02% 6.80 0.03% 0.00% 0.18 0.01% 6.50 0.03% 0.00% Al 16.33 0.07% 6.12 0.20% 22.45 0.09% 0.02% 6.18 0.18% 22.51 0.09% 0.01% Si 9.17 0.30% 9.17 0.04% 0.04% 16.47 0.48% 16.47 0.06% 0.06%
Table G.1: Monthly throughput of typical PMR feed, slimes and new blended feed with the change in average composition (Test1 Test 2)

Univers
ity of
Cap
e Tow
n
PAGE 167 OF 181-
Test 3 Test 4 Slimes Slimes
% Slimes/Anode 3.11% New Total
% Slimes/Anode 3.08% New Total
kg/month % kg/month %
Over initial mean
kg/month % kg/month %
Over initial mean
Total 3421.00 74.24% 25499.54 89.37% 3388.00 83.57% 25466.54 90.64% Pt 93.39 2.73% 7228.34 28.35% -3.97% 85.04 2.51% 7219.98 28.35% -3.97% Pd 500.15 14.62% 4331.82 16.99% -0.37% 474.66 14.01% 4306.33 16.91% -0.44% Au 40.71 1.19% 256.48 1.01% 0.03% 38.28 1.13% 254.06 1.00% 0.02% Rh 129.31 3.78% 1064.70 4.18% -0.06% 122.65 3.62% 1058.04 4.15% -0.08% Ir 4.45 0.13% 368.46 1.44% -0.20% 4.07 0.12% 368.08 1.45% -0.20%
Ru 144.02 4.21% 1379.29 5.41% -0.19% 140.60 4.15% 1375.87 5.40% -0.19% Os 0.96 0.03% 130.94 0.51% -0.08% 0.85 0.03% 130.83 0.51% -0.07% Ag 35.58 1.04% 85.82 0.34% 0.11% 30.76 0.91% 81.01 0.32% 0.09% Fe 22.92 0.67% 1072.95 4.21% -0.55% 27.44 0.81% 1077.48 4.23% -0.52% Ni 20.53 0.60% 2901.39 11.38% -1.67% 36.59 1.08% 2917.45 11.46% -1.59% Cu 530.94 15.52% 1557.41 6.11% 1.46% 916.79 27.06% 1943.26 7.63% 2.98% S 320.55 9.37% 762.12 2.99% 0.99% 266.64 7.87% 708.21 2.78% 0.78%
Co 2.16 0.06% 41.21 0.16% -0.02% 2.61 0.08% 41.67 0.16% -0.01% Te 165.23 4.83% 246.54 0.97% 0.60% 182.61 5.39% 263.91 1.04% 0.67% Se 25.52 0.75% 228.04 0.89% -0.02% 26.49 0.78% 229.02 0.90% -0.02% Pb 197.39 5.77% 471.07 1.85% 0.61% 180.92 5.34% 454.60 1.79% 0.55% Zn 0.03 0.00% 17.69 0.07% -0.01% 0.05 0.00% 17.72 0.07% -0.01% Sb 37.29 1.09% 69.51 0.27% 0.13% 35.57 1.05% 67.80 0.27% 0.12% As 202.87 5.93% 431.86 1.69% 0.66% 214.80 6.34% 443.79 1.74% 0.71% Bi 13.51 0.40% 69.47 0.27% 0.02% 13.25 0.39% 69.21 0.27% 0.02% Sn 0.24 0.01% 6.56 0.03% 0.00% 0.23 0.01% 6.55 0.03% 0.00% Al 3.42 0.10% 19.75 0.08% 0.00% 3.39 0.10% 19.72 0.08% 0.00% Si 48.58 1.42% 48.58 0.19% 0.19% 27.10 0.80% 27.10 0.11% 0.11%
Table G.2: Monthly throughput of typical PMR feed, slimes and new blended feed with the change in average composition (Test3 Test 4)
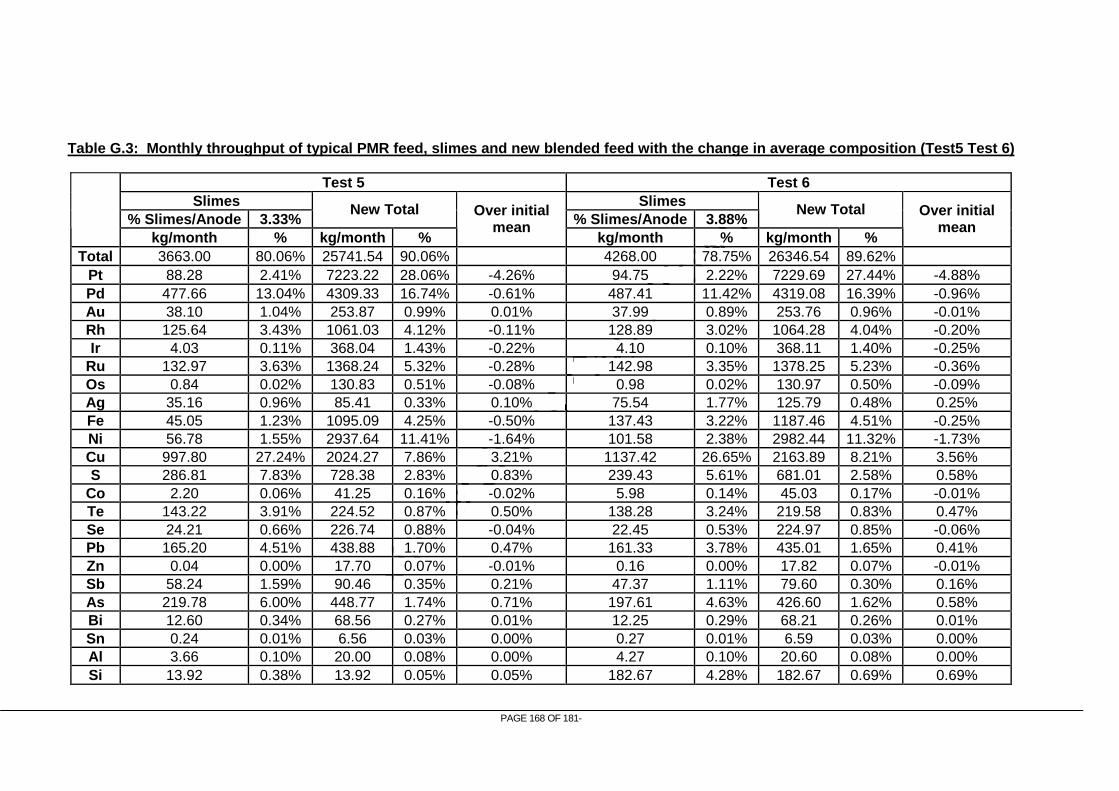
Univers
ity of
Cap
e Tow
n
PAGE 168 OF 181-
Test 5 Test 6 Slimes Slimes
% Slimes/Anode 3.33% New Total
% Slimes/Anode 3.88% New Total
kg/month % kg/month %
Over initial mean
kg/month % kg/month %
Over initial mean
Total 3663.00 80.06% 25741.54 90.06% 4268.00 78.75% 26346.54 89.62% Pt 88.28 2.41% 7223.22 28.06% -4.26% 94.75 2.22% 7229.69 27.44% -4.88% Pd 477.66 13.04% 4309.33 16.74% -0.61% 487.41 11.42% 4319.08 16.39% -0.96% Au 38.10 1.04% 253.87 0.99% 0.01% 37.99 0.89% 253.76 0.96% -0.01% Rh 125.64 3.43% 1061.03 4.12% -0.11% 128.89 3.02% 1064.28 4.04% -0.20% Ir 4.03 0.11% 368.04 1.43% -0.22% 4.10 0.10% 368.11 1.40% -0.25%
Ru 132.97 3.63% 1368.24 5.32% -0.28% 142.98 3.35% 1378.25 5.23% -0.36% Os 0.84 0.02% 130.83 0.51% -0.08% 0.98 0.02% 130.97 0.50% -0.09% Ag 35.16 0.96% 85.41 0.33% 0.10% 75.54 1.77% 125.79 0.48% 0.25% Fe 45.05 1.23% 1095.09 4.25% -0.50% 137.43 3.22% 1187.46 4.51% -0.25% Ni 56.78 1.55% 2937.64 11.41% -1.64% 101.58 2.38% 2982.44 11.32% -1.73% Cu 997.80 27.24% 2024.27 7.86% 3.21% 1137.42 26.65% 2163.89 8.21% 3.56% S 286.81 7.83% 728.38 2.83% 0.83% 239.43 5.61% 681.01 2.58% 0.58%
Co 2.20 0.06% 41.25 0.16% -0.02% 5.98 0.14% 45.03 0.17% -0.01% Te 143.22 3.91% 224.52 0.87% 0.50% 138.28 3.24% 219.58 0.83% 0.47% Se 24.21 0.66% 226.74 0.88% -0.04% 22.45 0.53% 224.97 0.85% -0.06% Pb 165.20 4.51% 438.88 1.70% 0.47% 161.33 3.78% 435.01 1.65% 0.41% Zn 0.04 0.00% 17.70 0.07% -0.01% 0.16 0.00% 17.82 0.07% -0.01% Sb 58.24 1.59% 90.46 0.35% 0.21% 47.37 1.11% 79.60 0.30% 0.16% As 219.78 6.00% 448.77 1.74% 0.71% 197.61 4.63% 426.60 1.62% 0.58% Bi 12.60 0.34% 68.56 0.27% 0.01% 12.25 0.29% 68.21 0.26% 0.01% Sn 0.24 0.01% 6.56 0.03% 0.00% 0.27 0.01% 6.59 0.03% 0.00% Al 3.66 0.10% 20.00 0.08% 0.00% 4.27 0.10% 20.60 0.08% 0.00% Si 13.92 0.38% 13.92 0.05% 0.05% 182.67 4.28% 182.67 0.69% 0.69%
Table G.3: Monthly throughput of typical PMR feed, slimes and new blended feed with the change in average composition (Test5 Test 6)
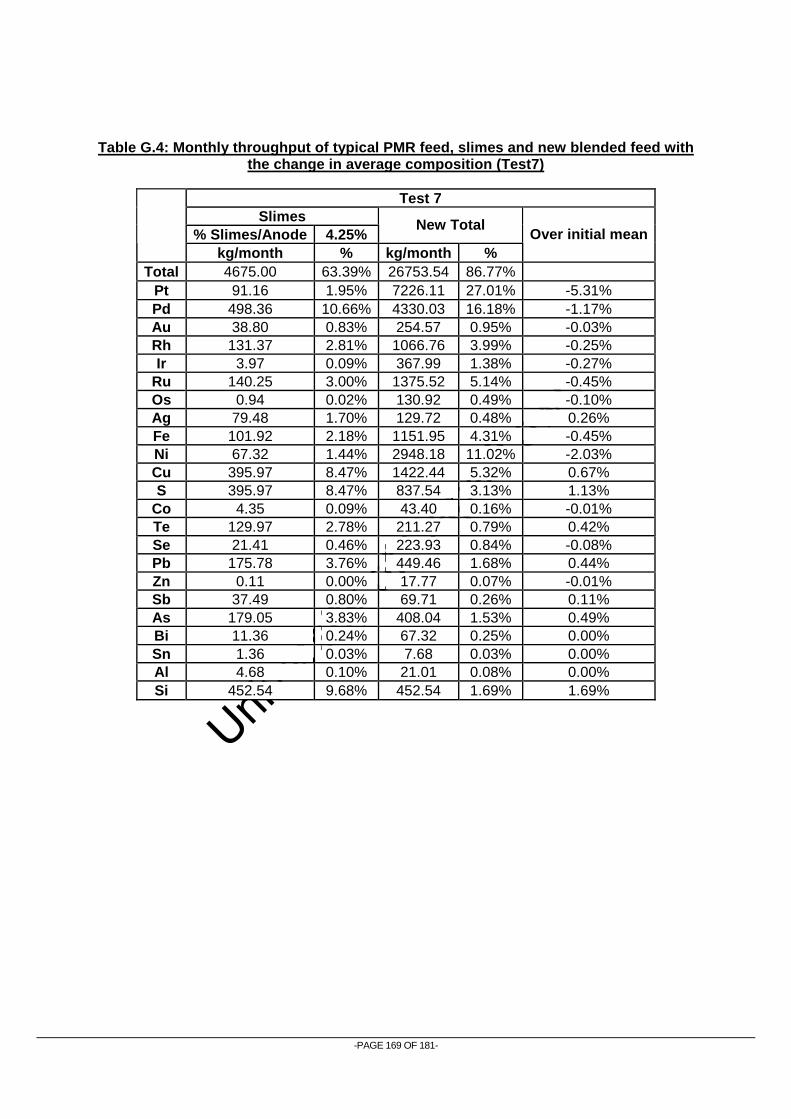
Univers
ity of
Cap
e Tow
n
-PAGE 169 OF 181-
Test 7 Slimes
% Slimes/Anode 4.25% New Total
kg/month % kg/month % Over initial mean
Total 4675.00 63.39% 26753.54 86.77% Pt 91.16 1.95% 7226.11 27.01% -5.31% Pd 498.36 10.66% 4330.03 16.18% -1.17% Au 38.80 0.83% 254.57 0.95% -0.03% Rh 131.37 2.81% 1066.76 3.99% -0.25% Ir 3.97 0.09% 367.99 1.38% -0.27%
Ru 140.25 3.00% 1375.52 5.14% -0.45% Os 0.94 0.02% 130.92 0.49% -0.10% Ag 79.48 1.70% 129.72 0.48% 0.26% Fe 101.92 2.18% 1151.95 4.31% -0.45% Ni 67.32 1.44% 2948.18 11.02% -2.03% Cu 395.97 8.47% 1422.44 5.32% 0.67% S 395.97 8.47% 837.54 3.13% 1.13%
Co 4.35 0.09% 43.40 0.16% -0.01% Te 129.97 2.78% 211.27 0.79% 0.42% Se 21.41 0.46% 223.93 0.84% -0.08% Pb 175.78 3.76% 449.46 1.68% 0.44% Zn 0.11 0.00% 17.77 0.07% -0.01% Sb 37.49 0.80% 69.71 0.26% 0.11% As 179.05 3.83% 408.04 1.53% 0.49% Bi 11.36 0.24% 67.32 0.25% 0.00% Sn 1.36 0.03% 7.68 0.03% 0.00% Al 4.68 0.10% 21.01 0.08% 0.00% Si 452.54 9.68% 452.54 1.69% 1.69%
Table G.4: Monthly throughput of typical PMR feed, slimes and new blended feed with the change in average composition (Test7)

Univers
ity of
Cap
e Tow
n
PAGE 170 OF 181-
H. Mineralogical Results for Initial Anodes
Figure H.1: MLA Backscattered Electron images for initial anodes

Univers
ity of
Cap
e Tow
n
-PAGE 171 OF 181-
Phase Element Test 1 Test 2 Test 3 Test 4 Test 5 Test 6 Test 7 Test 8 Test 9 Test 10 Test 11 Cu 78.4 78.3 84.5 82.0 83.2 83.9 81.2 92.5 90.2 93.8 93.8 Pd 0.0 1.2 0.6 0.0 1.1 0.0 0.3 0.7 1.2 0.5 0.5 Ru 0.0 1.0 0.0 0.0 0.0 0.0 0.0 0.0 0.0 0.0 0.0 Ni 16.2 14.6 11.8 13.7 12.5 11.8 13.8 4.3 5.0 3.6 3.6 Fe 5.4 4.8 2.7 3.2 2.8 3.3 3.8 1.9 2.3 1.5 1.5 Si 0.0 0.0 0.3 0.7 0.0 0.6 0.6 0.7 1.3 0.6 0.6
Light Grey Matrix
Co 0.0 0.0 0.1 0.5 0.4 0.4 0.2 0.0 0.0 0.0 0.0 Cu 64.7 65.3 68.8 69.5 68.8 62.2 67.3 77.5 77.5 Ni 1.1 1.0 0.4 0.8 0.8 1.1 1.5 0.7 0.7 Fe 6.5 5.9 4.7 3.4 3.5 3.9 5.4 5.4 5.4 S 21.2 20.3 20.1 19.8 19.1 18.2 20.0 9.5 9.5 Te 6.0 5.2 5.8 6.5 7.8 6.5 3.6 5.9 5.9 Co 0.2 0.0 0.0 0.0 0.0 0.0 0.0 0.0 0.0 Se 0.3 0.7 0.2 0.0 0.0 8.1 0.5 0.5 0.5
Dark Grey Blebs
Pb 0.0 3.9 0.0 0.0 0.0 0.0 1.7 0.0 0.0 Pb 42.7 32.7 Bi 23.7 7.0 Ag 18.9 cu 8.0 28.0 Ni 7.5 3.7 Fe 18.0
Bright Dots
Te 9.2 Cu 15.0 11.0 15.0 12.3 12.3 Pd 0.3 0.2 1.0 0.4 0.4 Rh 1.5 1.1 0.9 0.2 0.2 Ru 4.6 1.1 1.1 1.7 1.7 Ni 43.5 51.2 46.8 36.2 36.2 Fe 25.7 18.3 19.4 33.2 33.2 Si 7.7 16.2 15.5 15.1 15.1
Nested Needles
Co 1.6 0.9 0.3 1.0 1.0
Table H.1: Phases in anode material and their compositions at different operating parameters

Univers
ity of
Cap
e Tow
n
-PAGE 172 OF 181-
I. Mineralogical Results for Anode Slimes
T1 - 110 g/l Acid T2 – Base Case T3 - Additives
T4 – 100 A/m2 T5 – 150 A/m2 T6 – 30 g/l Cu
T7 – 50 g/l Cu T8 –130 g/l H2SO4
T1 - 110 g/l Acid T2 – Base Case T3 - Additives
T4 – 100 A/m2 T5 – 150 A/m2 T6 – 30 g/l Cu
T7 – 50 g/l Cu T8 –130 g/l H2SO4
Blue blebs: Cu sulphide
Massive vague zone: Pd-Te-As
Bright phase: Alloys of Pb-Bi-Pd-Ag-Pt
Figure I.1: Reflected Light Microscope Pictures for Anode Slimes

Univers
ity of
Cap
e Tow
n
PAGE 173 OF 181-
T1 - 110 g/l Acid T2 – Base Case T5 - 150 A/m2T1 - 110 g/l Acid T2 – Base Case T5 - 150 A/m2
J. Mineralogy Procedures
X-RAY POWDER DIFFRACTION METHODOLOGY
Mineralogical investigation of the anode slimes was performed by Petra Dinham &
Anelda van Staden. The methodology that was used during the XRD Diffraction investigation
has been supplied in report form and is quoted underneath for reference:
Ten percent corundum was added as an internal standard to all samples and in
combination with the sample material was micronized in a McCrone micronizing
mill for 4 minutes with methanol and then air-dried.
X-ray powder diffraction (XRD) (Bish and Post, 1989) patterns were collected using
powder pellets, produced by front-loading. The instrument used to acquire the XRD
data is a Bruker D8 Advance diffractometer employing the settings depicted in
Table .
A search-match routine based on profile and peak data in association with the
Powder Diffraction (PDF) 2 database was used to identify the best-fitting phases in
the database. Amorphous material present below 10 volume percent will not be
detected and the detection limit of XRD is approximately 5 volume percent.
Figure I.2: MLA Backscattered Electron images for anodes slimes

Univers
ity of
Cap
e Tow
n
PAGE 174 OF 181-
Detector type LynxEye Start Position [°2Th.] 15 End Position [°2Th.] 70
Step Size [°2Th.] 0.02 Scan Step Time [s] 2.5
No. of steps 2784 Scan time (hh:mm:ss) 0:09:52
Anode Material Cu Generator Settings 40 mA, 40 kV
Due to the amorphous nature of Tests 1 to 7, as observed through a large
amorphous hump as part of the background (see appended XRD traces, Figure to
Figure ) and the absence of representative structures in the Inorganic Crystal
Structure Database (ICSD) for phases in Tests 8 to 12, it was not possible to
determine the absolute quantities of the phases present. An attempt was
nonetheless made to determine an approximate amount of amorphous material
present by modelling the amorphous hump and taking into account the crystal
structure data related to the best-fitting phases from the ICSD with the TOPAS 4
software. The TOPAS 4 software employs the Rietveld method (Young, 2002) and
the fundamental parameters approach was used. The amount of internal standard,
corundum, was used as reference and Rietveld parameters were subsequently
refined to a point where optimal agreement was reached between the calculated
pattern and the observed pattern.
The relative phase abundances of Tests 1 to 7 were determined with the
Reference Intensity Ratio (RIR) method. The RIR method is based on the inclusion
of corundum as an internal standard, as referenced in the International Centre for
Diffraction Database (ICDD). The RIR technique allows for concentration
comparison between the same species within different samples but not between
different mineral species in the same sample.
X-ray powder diffraction patterns are given in Figure to Figure . Please note that
some samples were re-run with a different instrument set-up so as to standardise
all the patterns and corundum is therefore absent in some of the traces.
Table J.1: Difractometer settings

Univers
ity of
Cap
e Tow
n
-PAGE 175 OF 181-
Figure J.1: XRD traces of anode slimes samples of test 1 - 7

Univers
ity of
Cap
e Tow
n
PAGE 176 OF 181-
Figure J.2: XRD traces of anode slimes samples of test 1 – 7 showing amorphous phase

Univers
ity of
Cap
e Tow
n
PAGE 177 OF 181-
Figure J.3: XRD traces of anode slimes samples of test 8 – 11 (1)

Univers
ity of
Cap
e Tow
n
PAGE 178 OF 181-
Figure J.4: XRD traces of anode slimes samples of test 8 – 11 (2)
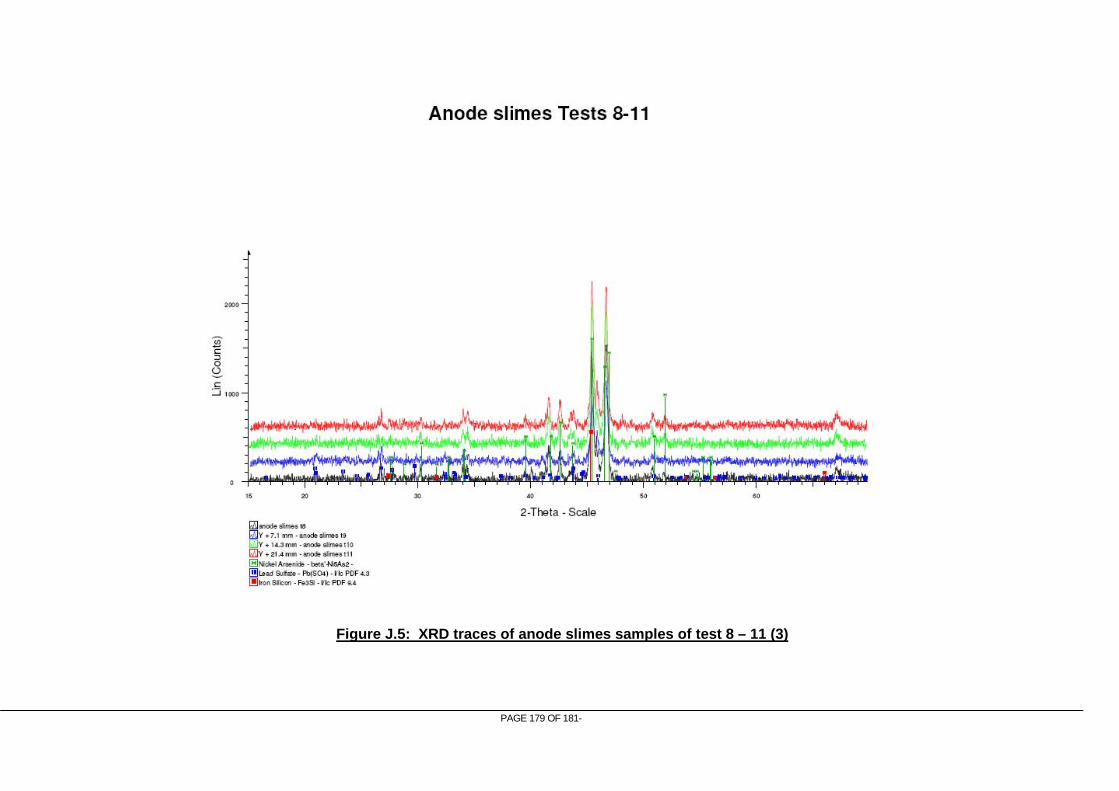
Univers
ity of
Cap
e Tow
n
PAGE 179 OF 181-
Figure J.5: XRD traces of anode slimes samples of test 8 – 11 (3)

Univers
ity of
Cap
e Tow
n
-PAGE 180 OF 181-
Appendix II

Univers
ity of
Cap
e Tow
n
PAGE 181 OF 181-
II. APPENDIX II

Univers
ity of
Cap
e Tow
n
Specialists in mineral and metallurgical technology
EXTERNAL REPORT
[enter report number]
MELTING AND CASTING OF COPPER BULLION TO PRODUCE ANODES FOR ELECTROREFINING PROCESS
by
Joseph Moema, Tiyani Khoza, Sibusiso Kantwela, Tutu Madiba, Given Maruma, Chris Fletcher and Clement Dhlamini
CONFIDENTIAL
06 July 2009

Univers
ity of
Cap
e Tow
n
© MINTEK Subject to any contrary agreement in writing all proprietary rights in and to this report vest in Mintek. This report is confidential and may not be disclosed, quoted, referenced or reproduced without the prior written consent of Mintek. Mintek accepts no liability for any misstatement made by the client or for the interpretation or use by others of this report.
EXTERNAL REPORT : xxxx TITLE: MELTING AND CASTING OF COPPER BULLION TO PRODUCE ANODES FOR ELECTROREFINING PROCESS
CLIENT: Hydro Metallurgy Division
DIVISION: Advanced Materials PROJECT NO : HMC-100
AUTHOR: J.S Moema, T Khoza, S Kantwela, T Madiba G Maruma, C Fletcher and C Dhlamini
COMPACT NO : 2010-18
DATE: 28 July 2009 NUMBER PAGES: 40 COPY NO: 01 of 10 Issued
QUALITY CONTROL:
SUBMITTED BY CHECKED BY APPROVED BY
[SIGNATURE]
[SIGNATURE]
[SIGNATURE]
Joseph S Moema
Chief Investigator
M . Jones Papo
Head: Physical Metallurgy
Elma van der Lingen
Manager: Advanced Materials
E-Mail:[email protected] E-Mail:[email protected] E-Mail:[email protected]
QUALITY ASSURANCE:
Mintek’s quality, environmental, safety, and health management systems are certified compliant to ISO 9001: 2000, ISO 14001: 2004, and OHSAS 18001: 1999. The quality systems of Mintek’s Analytical Services Division are accredited to ISO 17025:2005.
Specialists in mineral and metallurgical technology
C o n f i d e n t i a l
Mintek 200 Malibongwe Drive, (Formerly Hans Strijdom) Randburg, South Africa Private Bag X3015, Randburg 2125, South Africa Tel : +27-11-709-4111 Fax : +27-11-709-2413 Website : http://www.mintek.co.za

Univers
ity of
Cap
e Tow
n
CONFIDENTIAL
i
SUMMARY
This report summarises the work undertaken in the development of method to melt and cast the copper nickel alloy. This report detailed the laboratory production of ten anodes and problems encountered during the project.

Univers
ity of
Cap
e Tow
n
CONFIDENTIAL
i
TABLE OF CONTENTS
1. INTRODUCTION ............................................................................................................. 5 1.1. Cast Copper Alloys.................................................................................................... 6
2. EXPERIMENTAL PROCEDURES ...................................................................................... 7
2.1. Anode Casting .......................................................................................................... 8 2.1.1. Pattern Design.......................................................................................... 8 2.1.2. Pattern Preparation ................................................................................... 9 2.1.3. Mould Preparation................................................................................... 10 2.1.4. Melting and Casting................................................................................. 12 2.1.5. Casting Knockout and Fettling .................................................................. 13
3. RESULTS AND DISCUSSION ......................................................................................... 13 3.1. Integrity of Cast Anodes ........................................................................................... 13 3.2. Visual Examination .................................................................................................. 16 3.3. Chemical Analysis ................................................................................................... 19 3.4. Weight of Copper Bullion and Anodes ........................................................................ 21
4. CONCLUSION............................................................................................................... 22
5. REFERENCES .............................................................................................................. 22
APPENDIX 1 ..................................................................................................................... 24
CALCULATION OF THE SIZE OF THE FEEDER/RISER.................................................... 24
DISTRIBUTION ..................................................................................................................... 26

Univers
ity of
Cap
e Tow
n
CONFIDENTIAL
ii
LIST OF FIGURES
Figure 1.1. A schematic phase diagram of the Cu – Ni system .......................................................7
Figure 2. 1. Photograph of the as received copper matte (copper Bullion) ........................................7
Figure 2. 2. Photograph of the pattern used in mould preparation of anodes (first design) ...................9
Figure 2. 3. Photograph of the modified pattern used in mould preparation of anodes (second design)10
Figure 2. 4.Photograph of the bottom mould (drag) used for sand casting anodes (first design)..........11
Figure 2. 5.Photograph of the top mould (cope) used for sand casting anodes.................................11
Figure 2. 6. Photograph of the modified mould used for sand casting anodes (third design)...............12

Univers
ity of
Cap
e Tow
n
CONFIDENTIAL
iii
LIST OF TABLES
Table 2 1. Typical chemical composition ....................................................................................13
Table 3 1. The composition of Copper Bullion ( wt.-%) .................................................................20
Table 3 2. The weights of copper bullion anodes (grams) .............................................................21
Univers
ity of
Cap
e Tow
n
CONFIDENTIAL
iv
GLOSSARY
Cope: Top half of the mould box.
Drag: Bottom half of the mould box.
Ingate: The channel though which the metal leaves the runner to enter either the mould cavity or risers adjacent to the cavity.
Mould: Compacted sand enclosed in the mould box containing the cavity in which has to be moulded.
Pattern: Casting replica around which moulding sand is compacted
Ramming: Compacting of foundry sand in the mould box or core box.
Riser: A reservoir connected to the casting so as to provide liquid metal to the casting during solidification to offset the shrinkage which takes place when casting solidifies.
Runner: Horizontal channel through which the metal flows towards or distributed around the mould cavity.
Shrinkage Porosity: This is porosity in a casting caused by insufficient feed metal.
Sprue: The opening into which the metal is poured first.
Vent: A small channel from the top of the mould cavity through for allowing air to escape as the metal fills the mould.

Univers
ity of
Cap
e Tow
n
CONFIDENTIAL
5
1. INTRODUCTION
Copper alloys are extremely difficult to cast as well as being prone to surface cracking, porosity problems, and to the formation of internal cavities. The copper-base casting alloy family is subdivided into three groups according to solidification (freezing range). Unlike pure metals, alloys solidify over a range of temperatures. Solidification begins when the temperature drops below the liquidus; it is completed when the temperature reaches the solidus. The liquidus is the temperature at which the metal begins to freeze, and the solidus is the temperature at which the metal is completely frozen. The copper nickel alloys are Group II alloys that have an intermediate freezing range, that is, a freezing range of 50 to 110°C between the liquidus and the solidus. Casting is a multiple step process that includes melting the metal into molten, pouring the molten into a mould and cooling it back to a solid. Casting has both artistic and industrial uses, and is a preferred method for fabricating custom pieces.
The Hydrometallurgy Division (HMD) approached the Advanced Materials Division (AMD) at Mintek to develop a melting and casting technique for a copper matte1 (referred to as Copper Bullion). The objective of this work was to melt the copper matte produced from SLC in a two stage process in an Ausmelt TSL Furnace and cast2 into the moulds to produce anodes that will later be used in an electro-refining process. It was also requested to compare the chemical composition and the colour of the supplied material with the produced anodes in order to gauge any significant differences. A total of ten anodes were requested to be produced. A sand casting route was chosen for this project because it is a commonly used process used in the foundry industry, relatively cheap and can be employed economically to a small scale producer. The sand casting process involves different steps as listed below and each step is discussed in detail in the experimental technique section of this report:
§ Pattern manufacture § Core manufacture § Manufacture of the casting mould § Melting and pouring § Cleaning and finishing
1 Copper Matte – This was described as a copper-nickel (Cu-Ni) alloy with some trace amounts of PGMs (i.e. Platinum Group Metals)

Univers
ity of
Cap
e Tow
n
CONFIDENTIAL
6
The client requested a T-shaped anode with the following dimensions:
• 20mm thick
• 150mm width
• 240mm long
The width on the T slots was supposed to be 250mm. About 156kg of the copper matte was supplied for use in the production of the anodes. AMD‘s task was to design a pattern that would result into an anode with the dimensions as indicated above. The anodes were to be supplied to HMD in the machined condition for further processing.
1.1. Cast Copper Alloys
Cast copper alloys are often selected for their excellent corrosion resistance, favourable mechanical properties, good friction and wear properties, high electrical and thermal conductivity, good castability and excellent machinability and fabricability.
Like other cast materials, solidification of copper-based alloys usually takes place by nucleation and growth of dendrites of a copper-rich face centered cubic (FCC) solid solution in which all of the problems associated with dendritic growth can and will occur. These problems include micro-segregation of alloying elements within the dendrites producing cored structures, entrapment of solidification shrinkage and gas porosity in between dendrite arms, and the presence of complex interdendritic phases [1].
In addition, like the transformations that occur in aluminium and ferrous alloys, solid state phase transformations such as eutectoid transformations, martensitic transformations and precipitation hardening are all possible in these materials. The appropriate phase diagram is a ternary in which the Ni is completely soluble in the Cu in the solid state. A schematic phase diagram of the Cu – Ni system is given below in Figure 1.1.
2 Casting – This is a process whereby a molten liquid is poured into a mould which resembles the final shape of the component.

Univers
ity of
Cap
e Tow
n
CONFIDENTIAL
7
Figure 1.1. A schematic phase diagram of the Cu – Ni system
2. EXPERIMENTAL PROCEDURES
The as received copper nickel alloys were visually examined, broken into small pieces and sorted out into equal weights in preparation for melting. Two pieces of the supplied copper nickel metals were randomly selected, and prepared for chemical analysis prior melting. The supplied broken pieces of copper nickel alloy are shown in Figures 2.1(a) and (b). It consisted of slag (black in colour) on the surface that formed when it was being processed at the supplier’s premises.
a b
Figure 2. 2. Photograph of the as received copper matte (copper Bullion)
Entrapped Slag Copper Nickel Alloy
1445°C

Univers
ity of
Cap
e Tow
n
CONFIDENTIAL
8
2.1. Anode Casting There are three broad stages that need to the completed in order to obtain a desired casting. The stages are, namely; pre-casting, casting and post-casting. The pre-casting stage involves the design of pattern, sand preparation, mould making and lastly putting together the mould. The casting process involves charging the furnace, melting and pouring into the melt into the mould. The post casting stage involves removing casting from mould, cleaning, fettling and inspection. These stages are described in detail as follows.
2.1.1. Pattern Design
A pattern is used to produce a casting with the desired dimensions. However, it is rarely dimensionally identical to the final casting. The pattern used in this project was mainly manufactured from wood due to its affordability and easy to process. The design of patterns must include the following components:
§ An allowance for the solid state shrinkage that will always accompany a casting as it cools from the melting temperature to room temperature. This depends upon the metal being cast, given
that each metal has its own unique coefficient of thermal expansion (α). For example, α for
copper is 16.5 x 10⁻⁶ in/in °C. Thus, the linear dimensions of a pattern will always be larger than the casting by an amount determined by the linear expansion coefficient.
§ Inclusion of a draft angle so that the pattern can be removed from the mould after the moulding sand has been rammed around the pattern. These draft angles can vary from one casting to another but angles in the range 1 - 2° are quite common.
During solidification, casting defects can form due to shrinkage, presence of dissolved gases and dendrite formation. The primary objective of a mould design is to prevent these phenomena. The following parts are very important in the mould design:
§ Risers § Gating system § Runners
The method for calculating the sizes of these mould parts is shown in Appendix 1.

Univers
ity of
Cap
e Tow
n
CONFIDENTIAL
9
2.1.2. Pattern Preparation
Before moulding, the pattern was painted with a release agent to prevent the moulding sand from adhering to it. Exothermic cored sleeves were placed on the top of each anode-pattern to act as feeders to the cast anode. The types of the patterns used in this project are shown in Figures 2.2 and 2.3 below.
For each sleeve, a 6mm diameter ventilation hole was pierced on the surface of the mould, to allow gas to escape during casting. When the pattern was removed from the completed mould, the sleeves remained in the mould.
Figure 2. 3. Photograph of the pattern used in mould preparation of anodes (first design)

Univers
ity of
Cap
e Tow
n
CONFIDENTIAL
10
Figure 2. 4. Photograph of the modified pattern used in mould preparation of anodes (second design)
2.1.3. Mould Preparation
Cast iron mould boxes (0.5m length, 0.38m width and 0.14m depth) were used to accommodate both the drag (bottom) and cope (top) parts of the pattern. Approximately 50kg of silica (SiO2) sand with a particle size range of 0.075 to 0.65mm was mixed with 1000ml of sodium silicate (Na2SiO3) binding agent. The mould box with the pattern in place was then filled with moist sand, with the sand being pushed firmly into recessed areas. More sand was gradually added and rammed until the mould was completely filled. This was done in order to allow the mould to be gassed with carbon dioxide (CO2) which was introduced through the holes. This results in the hardening of the mould through the reaction of CO2 with Na2SiO3, which produces silica gel (SiO2.xH2O or H2O3Si). The mould was then lifted from the pattern and loose sand was removed by blowing with compressed air. The mould was coated with an alcohol-based ceramic mould wax that helps to prevent sand burn-on during casting, and improves the surface finish. The moulds were ignited in order to burn off excess alcohol and all remnant moisture that may cause gas porosity in the casting. The drag and cope were glued and clamped tightly in order to prevent any leakages. Photographs of the moulds used can be seen in Figures 2.4 to 2.6.

Univers
ity of
Cap
e Tow
n
CONFIDENTIAL
11
Figure 2. 5.Photograph of the bottom mould (drag) used for sand casting anodes (first design)
Figure 2. 6.Photograph of the top mould (cope) used for sand casting anodes
Ingate
Runner
Feeder
Riser
240mm
140mm
250mm

Univers
ity of
Cap
e Tow
n
CONFIDENTIAL
12
Figure 2. 7. Photograph of the modified mould used for sand casting anodes (third design)
In some case, however, an open mould is used for casting purposes. A typical design of such a mould is shown in Figure 2.6. In this type of casting technique, no cope is required.
2.1.4. Melting and Casting Melting was done in a medium frequency induction furnace open to the atmosphere and with a capacity of about 150kg. A 50kg Silicon Carbide Cast crucible with the dimensions, Height (H) = 318mm, Outside Diameter (OD) at the top = 232mm and at the bottom = 160mm, was fitted in this furnace for melting of the alloy.
When the charge was completely molten, the slag coagulant, SLAX 30, was poured over the molten metal surface so as to grip the slag3. At the molten metal temperatures, the SLAX 30 granules expand and form a low density, high volume crust which mops up the slag. The slag can then easily be lifted off the metal with ease leaving the metal surface clean. A typical chemical composition of the SLAX 30 slag coagulant is shown in Table 2.1. The slag coagulant does not trap the metal nor not contaminate the melt in any way. After leaving the coagulant for a few seconds on the melt surface, the slag was skimmed out of the furnace.
3 Slag - unwanted impurities within the molten metal.
Ingate Runner
Feeder

Univers
ity of
Cap
e Tow
n
CONFIDENTIAL
13
Table 2. 1. Typical chemical composition of SLAX 30 slag coagulant
Chemical Percentage (%) SiO2 73 – 75 Al2O3 12 – 14 Fe2O3 0.61 TiO2 0.29 CaO 0.83 – 1.0 MgO 0.16 Na2O 3.08 K2O 4.65
The temperature was measured with a disposable-tip immersion thermocouple, and then adjusted to ≈ 1640°C. Upon reaching the desired temperature, the melt was tapped into a pre-heated insulated magnesia-lined hand ladle. The slag grip was again added into the ladle to ensure that all unwanted impurities are removed. The molten metal was subsequently poured into the mould while at the same care was taken to ensure that the pouring rate was such that the sprue was always full with molten metal.
2.1.5. Casting Knockout and Fettling The castings were removed from the mould 3 hours after pouring, and allowed to cool on their trees, on a sand floor. Thereafter, the runners and risers were removed by nicking with an angle grinder. The remains of the feeding system were flash removed by light grinding. Before proceeding with any machining of the cast anodes, it was deemed critical to ascertain their integrity. Several cast anodes were sent to Engineering Support Division (ESD) to be machined and visually examined for any casting defects, such shrinkage porosity, etc.
3. RESULTS AND DISCUSSION
3.1. Integrity of Cast Anodes
All the anodes produced were checked for surface defects such as burnt-on sand, flashes, etc. Photographs of the sand cast anodes showing, feeder, runner and riser system can be seen in Figures 3.2 to 3.4. It can be seen that some of the foundry sand is adhered to the casting and referred to as sand burnt-on.

Univers
ity of
Cap
e Tow
n
CONFIDENTIAL
14
Silica (SiO2) sand and Silchem (sodium silicate – Na2SiO3) is used in foundries to produce moulds for casting as a standard practice. Before melting the sand on these risers, feeders and runners is removed to a degree and there will be no elemental silicon (Si) pick up into the metal as any remaining sand attached to the metal would go into the slag. Quartz consists of a three network of SiO44- tetrahedral with a hexagonal crystal structure. When heated, quartz undergoes structural changes coupled with volume expansion. The conversion of SiO2 → Si is not a simple reaction and it cannot happen under these normal casting conditions. The transformation of silica (SiO2) sand or quartz occurs as follow:
α-quartz β-quartz tridymite cristobalite
The transformation α → β occurs very rapidly, coupled with a large volume expansion. While the β →
tridymite transformation is very slow and would normally not occur during heating with pouring. The
rapid volume change during the α → β transformation can cause fragmentation of the mould during
pouring. Slow heating of moulds to 600°C before pouring reduces this risk.
Figure 3.1. As-cast anode on a tree showing a feeder, runner and risers (second design)
Riser at the Centre
Feeder
Riser at the T slot
540°C 879°C 1470°C

Univers
ity of
Cap
e Tow
n
CONFIDENTIAL
15
Figure 3.2. As-cast anode showing a removed feeder and one of the risers
Figure 3.3. As-cast anode produced using a third design
A high prevalence of shrinkage porosity was observed in the first batch of castings, this necessitated a redesign of the entire feeding system. The calculation of the gating and feeding system is shown in section 2.1.1. Risers are used in the production of castings for the purpose of providing molten metal for the solidifying and shrinking casting. Riser design in sand castings requires, at a minimum, that the riser solidify after the casting. A casting and riser are shown schematically in a sand mould below. The desired situation after solidification would result in all the shrinkage within the riser as illustrated in Figure 3.5.
Riser
Sectioned Ingate

Univers
ity of
Cap
e Tow
n
CONFIDENTIAL
16
Figure 3.4. Schematic casting set-up showing shrinkage in a riser [2-4]
Therefore, feeders with a geometric modulus of 1.2 times that of the cast were incorporated on the pattern and positioned at the centre of each anode to ensure an effective feed path (shown in Figure 3.6 of Section 3.2). This ensured that the feeders solidified after the anodes had already solidified. The feeders proved effective in eliminating shrinkage cavities in all the subsequent casts.
3.2. Visual Examination
Visual examination of the first set of anodes showed large cavities close to the centre and at the T slot of the anodes (Figure 3.6). Further examination with the aid of a magnifying glass showed the inside of these cavities to be rough and dendritic - the tell-tale signs of shrinkage porosity as opposed to gas-related porosity, which is smooth. The redesigning of the entire feeding system, whereof feeders with a modulus 1.2 times that of the anodes was incorporated on to the pattern. This ensured that the feeders solidified after the anodes had already solidified. Figures 3.7 and 3.8 show the machined as cast anodes before and after modification of the feeding system respectively. The feeders proved effective in eliminating shrinkage cavities in all the subsequent casts. The colour of the anode also changed from a silvery colour to a reddish-brown colour.
Shrinkage Cavity

Univers
ity of
Cap
e Tow
n
CONFIDENTIAL
17
Figure 3.5. As-cast anode prior to machining showing shrinkage and gas porosities
Figure 3.6. Machined as-cast anode showing shrinkage and gas porosities
Shrinkage Porosity
Gas Porosity
Shrinkage Porosity
Gas Porosity ppopor
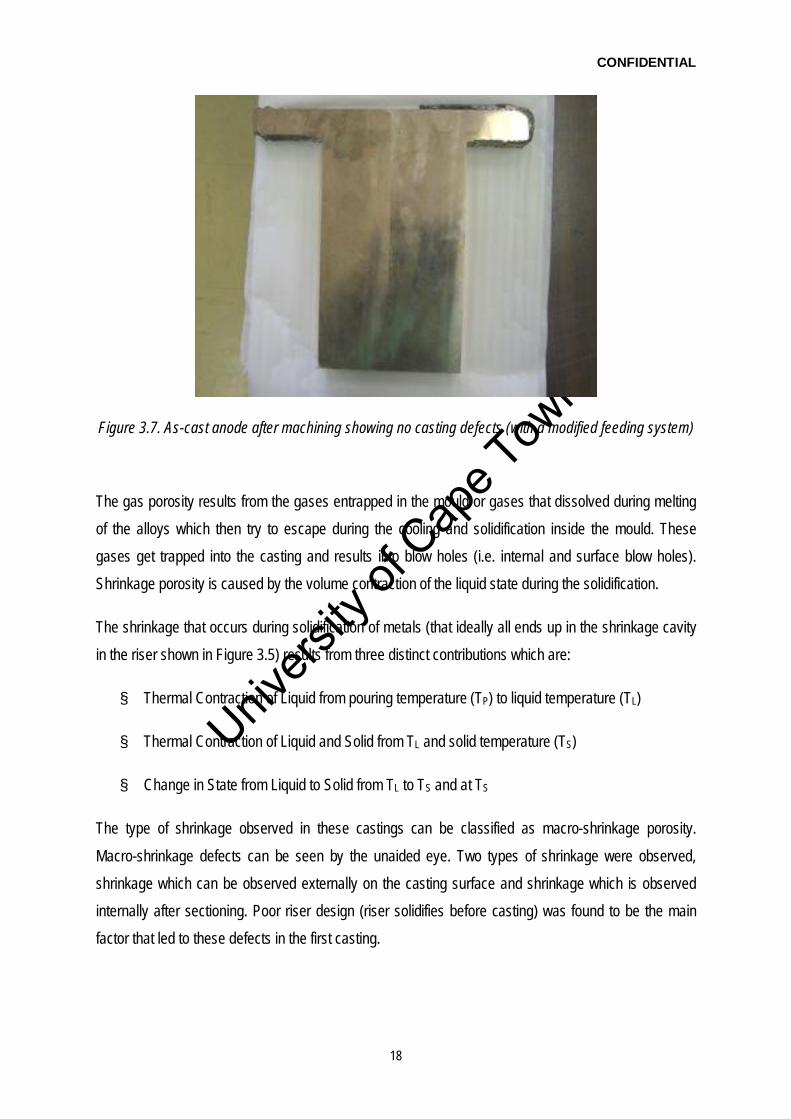
Univers
ity of
Cap
e Tow
n
CONFIDENTIAL
18
Figure 3.7. As-cast anode after machining showing no casting defects (with a modified feeding system)
The gas porosity results from the gases entrapped in the mould or gases that dissolved during melting of the alloys which then try to escape during the cooling and solidification inside the mould. These gases get trapped into the casting and results into blow holes (i.e. internal and surface blow holes). Shrinkage porosity is caused by the volume contraction of the liquid state during the solidification.
The shrinkage that occurs during solidification of metals (that ideally all ends up in the shrinkage cavity in the riser shown in Figure 3.5) results from three distinct contributions which are:
§ Thermal Contraction of Liquid from pouring temperature (TP) to liquid temperature (TL)
§ Thermal Contraction of Liquid and Solid from TL and solid temperature (TS)
§ Change in State from Liquid to Solid from TL to TS and at TS
The type of shrinkage observed in these castings can be classified as macro-shrinkage porosity. Macro-shrinkage defects can be seen by the unaided eye. Two types of shrinkage were observed, shrinkage which can be observed externally on the casting surface and shrinkage which is observed internally after sectioning. Poor riser design (riser solidifies before casting) was found to be the main factor that led to these defects in the first casting.

Univers
ity of
Cap
e Tow
n
CONFIDENTIAL
19
3.3. Chemical Analysis No specifications were supplied for the Copper Bullion, however, the analysis performed by the client were received for comparison purposes. The chemical composition of the copper bullion before and after casting is shown in Table 3.1 below. It can be seen that there is a compositional change on anode number 10 as compared to anodes 1 to 3 which have similar composition to that of the as received metal. The silicon content for anode number 10 is 10 times more than that of the as received copper matte. This silicon pickup might be from the shavings that were used as a top up during melting of the anodes. It is envisaged that the shaving were contaminated and could possibly be the source of silicon pick up. Unfortunately, the spectrometer in AMD is not equipped to analyze the precious metals and only four anodes were analyzed. A copper program was used to analyze the anodes.
The client requested 10 anodes and the supplied material was not enough to make these anodes. Therefore, it was necessary to start recycling shavings that were machined off the previous material or produced and tested anodes. The shavings that were gathered from the machine that was used to clean the anodes also poses another possibility of contamination because it was not guaranteed that the area from the shavings were collected was 100% free of other metals.
During the casting process, the anode composition changed (see anode 10), it had a slightly different composition to that of anodes 1 to 3 (as shown in Table 3.1). The main difference was the silicon content and the other elements were within the initial analysis. The copper and nickel content also decreased and this might have led to colour change of the anode. The primary cause of the change in anode composition has not been confirmed but the multiple re-casting could have contributed to an extent. This needs to be investigated to find the source of the silicon that was picked up in Anodes number 10. Another possible cause could be the use of anode shavings collected from the milling machine. It is envisaged that the shavings could have also contained some silicon or other contaminant; however the latter was not confirmed.

Univers
ity of
Cap
e Tow
n
CONFIDENTIAL
20
Table 3. 1. The composition of Copper Bullion ( wt.-%)
Elements Copper Matte (supplied) Anode 1 Anode 2 Anode 3 Anode 10
Pt 0.0912 - - - - Pd 0.5464 - - - - Au 0.0443 - - - - Rh 0.1374 - - - - Ir 0.0041 - - - -
Ru 0.1579 - - - - Os 0.0007 - - - - Ag 0.1484 - - - - As 0.3040 - - - - Bi 0.0447 0.045 0.036 0.051 0.014 Cd <0.0005 - - - - Mn 0.0017 <0.0008 <0.0008 <0.0008 0.023 Mo <0.0008 - - - - Pb 0.2460 >0.114 >0.114 >0.114 0.093 Sb 0.0994 - - - - Se 0.0148 - - - - Sn 0.0194 0.020 0.018 0.024 0.014 Te 0.1051 - - - - Ti 0.0026 0.0080 0.0083 0.0085 0.013 Zr <0.0010 - - - - Cu 79.16 83.0 82.0 83.9 61.8 Ni 12.49 12.62 13.66 12.21 10.11 Fe 5.39 >3.12 >3.12 2.44 >3.12 Cr <0.23 - - - - Co 0.123 0.144 0.161 0.149 0.102 Si <0.3000 0.0026 0.0034 0.253 >1.08 Al 0.1880 - - - - Ca <0.2500 - - - - Mg <0.2000 <0.0002 <0.0002 0.0002 0.005 S 0.2600 >0.144 0.140 >0.144 >0.144 Zn - <0.002 <0.002 0.0023 0.0150 P - 0.0025 0.0027 0.0030 0.0017 Cr - <0.005 <0.005 <0.005 0.042 C - 0.003 0.011 0.041 0.014

Univers
ity of
Cap
e Tow
n
CONFIDENTIAL
21
3.4. Weight of Copper Bullion and Anodes
The as-received material was unfortunately not weighed by AMD; therefore it is difficult to determine an overall casting yield. The casting yield is defined as the ratio:
Casting Yield (CY) = Weight of Castings Shipped x 100% Weight of Metal Poured
It is obvious that the goal for a metal casting plant would be to make casting yield as high as possible. It is also obvious that the riser size and number of risers has a big impact on the casting yield. It is common practice for metal casting plants to have overall casting yields of between 40 and 80%. Maximization of the yield will involve reducing the number and size of the risers as an important contributor. Of course, reducing the size of the gating system will also have a significant effect on casting yield.
Also, it is impossible to confirm the initial weight which will be used to estimate the material loss during casting trials. It is however a norm that in the foundry you will definitely lose some material during melting and casting but not as high as 60 kg. Of the 160 kg that were provided to be re-melted and cast into anodes – only 90-100 kg can be accounted for. The supplied material before and during melting trials was kept in the material storage area of Bay 7 which is locked every night. The likelihood that the material could have been stolen is unlikely. All the anodes produced were weighed after machining prior to sending for electro-refining test as summarised in Table 3.2 below.
Table 3 2. The weights of copper bullion anodes (grams)
Anode Number Weight after Machining (grams)
1 7750 2 5120 3 5622 4 5443 5 5766 6 5594 7 5838 8 4039 9 2160 10 6177

Univers
ity of
Cap
e Tow
n
CONFIDENTIAL
22
4. CONCLUSION
• Casting is a multiple step process that includes melting the metal into molten, pouring the molten into a mould and cooling it back to a solid.
• A pattern to be used in the making of mould for producing of the copper nickel alloy anodes have been successfully designed and made.
• Calculations were made to make sure that the pattern can be removed easily from the casting cavity without damaging the mould. The modified feeders proved effective in eliminating shrinkage cavities in all the casts.
• It has been found that Copper-Nickel Alloys must be melted carefully because the presence of nickel in high percentages raises not only the melting point but also the susceptibility to hydrogen pickup.
• The copper nickel alloys were melted in coreless electric induction furnaces, because the melting rate is much faster than it is with other furnace. It has been found that when ingot is melted in this manner, the metal should be quickly heated to a temperature slightly above the pouring temperature and deoxidized either by the use of one of the proprietary degasifiers used with nickel bronzes or, better yet, by plunging 0.1% Mg stick to the bottom of the transfer ladle. The purpose of this is to remove all the oxygen and to prevent any possibility of steam-reaction porosity from occurring.
• It has been found out that there is little need to use cover fluxes especially if the material melted is cleaned prior to melting.
• During the melting and casting process, the anode composition and colour changed, the main difference was the silicon, copper and nickel contents. It is envisaged that this might have also led to a change in colour. This needs to be investigated to find the source of the silicon that was picked up.
5. REFERENCES
[1] Rundman, K.B, Metal Casting, Dept. of Materials Science and Engineering Michigan Tech. University, [2] Clegg, A.J, Precision Casting Processes, 1st Edition, Pergamon Press. 1991
[3] Heine, R and Rosenthal, P, Principle of Metal Casting, International Student Edition, Mcgraw-Hill Book Company, Inc. 1955

Univers
ity of
Cap
e Tow
n
CONFIDENTIAL
23
[4] Flinn R.A, Fundamentals of Metal Casting, Addison-Wesley Publishing Company, Inc, United States of America. 1963
5.1.1. SHE Risks
"Kindly note that all safety, health and environmental (“SHE”) risk information are given for information purposes only and does not constitute a risk assessment for any SHE purposes, nor does it substitute any statutory risk assessment that the client is required to undertake. Mintek assumes no risk or liability on behalf of the client or any of its officers or employees in respect of SHE legislative requirements."

Univers
ity of
Cap
e Tow
n
CONFIDENTIAL
24
APPENDIX 1
CALCULATION OF THE SIZE OF THE FEEDER/RISER
Risers are used to feed molten metal into the mould cavity during solidification in order to compensate for shrinkage. Riser design in sand mould castings requires, as a minimum, that the riser solidify after the casting, i.e.:
tS(riser) > tS(casting)
where ts refers to solidification time. The shape, size and positioning of risers is very important. The size of the riser/feeder is calculated according to the Chvorinov’s Rule [2-4] which is given below as:
t = B. (V/A) 2
where: t is the solidification time, V is the volume of the metal, A is the area of the casting, and B is a constant which is dependent on the type of mould material. According to the Wlodawer [1-3], the modulus1 of the feeder/riser should be at least 20% greater than the modulus of the casting according to the formula below:
Mf =1.2Mc
where:
Mf is the modulus of the feeder which is equivalent to
f
f
AV
and Mc is the modulus of the casting
which is equivalent to
c
c
AV . Vf, Vc, Ac and Af refere to the volume of the feeder, the volume of the
casting, the area of the casting and the area of the feeder, respectively.
The following information on the requested anodes was obtained and this helped in the design of the pattern:
1 Modulus – This is

Univers
ity of
Cap
e Tow
n
CONFIDENTIAL
25
For a plate-like casting with the dimensions, Length = 220mm, Width = 140mm and Thickness = 20mm, the volume and area were calculated as follows:
Mc =
c
c
AV
Vc= L x W x T = 22cm x 14cm x 2cm = 616cm3
Ac = 2(L x B) + 2(L x T) + 2(B X T) = 760cm2
Mc = (616/760) = 0.81 cm
Mf =1. 2Mc = 1.2(0.81) = 0.97 cm
0.97=
f
f
AV
Using a cylindrical feeder/riser:
Volume of the feeder = πr2h
h = 2D = 4r
Therefore,
V = πr2x4r = 4πr3
The area of the feeder = A = 2πrh = 8πr2
0.97 =
f
f
AV
=
2
3
84
rr
ππ =
2r
r = 1.94cm
h = 7.78cm
The size of the riser of the anode was made such that both the solidification and shrinkage criterion are met simultaneously. For the above criterion to be met the solidification time of the riser should be longer
than the solidification time of the casting, i.e. tr > tc. This will be met if rA
V
>
cAV
.
h
D

Univers
ity of
Cap
e Tow
n
CONFIDENTIAL
26
DISTRIBUTION
Copy Number Issued to
1-6
7
8
9
10
11
12
13
14
15
16
17
18
Ms T Thulare
Mr A Mngomezulu
Dr RL Paul
Dr M Motuku
Dr D Hulbert
Dr E van der Lingen
Dr MJ Papo
Mr SJ Moema
Mr C Fletcher
Mr S Kantwela
Mr T Madiba
Mr T Khoza
File
Draft Electronic copies of the report were issued to the following by e-mail:
Ms Thembi Thulare
Ms Ndina Mulaudzi
Copyright © 2022 FDOKUMEN