The Effects of Isoniazid and Rifapentine on Tuberculosis
15
1 The Effects of Isoniazid and Rifapentine on Tuberculosis Mathematics 19a: Modeling and Differential Equations for the Life Sciences Joshua M. Elkington May 2, 2012
-
Upload
independent -
Category
Documents
-
view
0 -
download
0
Transcript of The Effects of Isoniazid and Rifapentine on Tuberculosis

1
The Effects of Isoniazid and Rifapentine on Tuberculosis
Mathematics 19a: Modeling and Differential Equations for the Life Sciences
Joshua M. Elkington
May 2, 2012

2
Background
Tuberculosis has the second highest mortality rate of any infectious agent. A type of
bacteria called mycobacterium tuberculosis causes tuberculosis. Tuberculosis (TB) is an
infectious disease that commonly attacks the lungs, and the disease is spread through the
air via phlegm. In many people, infection by mycobacterium tuberculosis causes no
symptoms, but the disease is still detectable by a tuberculin test. People infected with
tuberculosis are non-infectious (latent) or infectious (active). Approximately, one-third of
the world’s population has latent tuberculosis; however, these people only have a 10%
chance of becoming active throughout their lifetime, but people with weak immune
systems due to HIV or other diseases have a higher risk of becoming active.
Over 95% of the cases and deaths of tuberculosis are in developing countries
especially in Africa and Asia. Twenty-two countries account for around 80% of the TB
cases reported with TB declining in some countries such as China (5). Due to
tuberculosis’s global prevalence in poor countries, a treatment that is cheap and effective is
needed.
In The New England Journal of Medicine, researchers show that a combination
therapy of tuberculosis is more effective in treating latent Mycobacterium tuberculosis than
using a single drug. The researchers determined that use of rifapentine and isoniazid
(combination therapy) for three months was jut as effective as nine months of treatment
with only isoniazid. From this, I determined that the rate of recovery due to combination
therapy is twice the rate due to isoniazid (2).

3
The paper will investigate the effects of quarantine and drug treatments on TB. A
SIR model will initially be used to model TB; however, the model will be modified to
include a latent infected population. The inclusion of this latent population will change
the dynamics of the SIR model, and the effects of rifapentine and isoniazid on the latent
infectious will be modeled in order determine how long a treatment program needs to be
used in order to eradicate this disease. In order to provide estimates for the various rates in
the model, I used documented rates and reasonable assumptions.
Ultimately, the model shows that combination therapy is an effective way to reduce
the infectious population when compared to other methods. However, the quarantine of
infected individuals should still be used. Furthermore, this treatment is a cheaper way to
treat TB because the time frame for treatment is one-third the time needed for treatment
with only isoniazid.

4
Mathematical Model
In this paper two models are used: a SIR model and a model with two classes of
infected people (3).
In the models, S(t) represents the population of susceptible individuals, I(t)
represents the infectious population, and R(t) represents the recovered population. In the
SIR model, I use the assumption that once an individual has recovered, the person cannot
be re-infected. The model with two classes of infected individuals, !! represents the
population of active infectious people and !! represents the population of latent infectious
!" !"
= -‐βS! !"!"
= βS! -‐ α ! !"!"
= α!
!" !"
= -‐βS!!
!"!!"
= βS!!-‐ γ!!
!"!!"
= γ!! -‐α !!
!"!"
= α!!
Terms: β – infection rate α – recovery rate µ - birth rate ε - death rate ω - death rate due to TB γ – rate of changing from latent to active t – time (in years) ϕ – effects of Isoniazid on latent recovery 2ϕ – effects of Isoniazid and Rifapentine on latent recovery η – relapse rate Q – Quarantine population q – rate at which infected population is quarantined α*- recovery rate of quarantined population
Terms Values: β = .002 (using N=300 [units in millions] and !! = 12) α = .05 (assuming that within a year 1/20 of infected recover within a year) µ = .02 ε =.01 ω = .00045 (4) γ = .001 (using that within a lifetime a latent individual has a 10% chance of becoming active) ϕ = .28 (assuming within a year one fourth of infected recover due to treatment) η = .05 (using that within 2 years 10% of recovered people relapse) (1) q = .1 α* = .16 (assuming that within a year 3/20 of infected recover within a year)

5
people. The constant rate β represents the rate of infection, and α represents the rate of
recovery. The rate γ represents the rate at which a latent infected person becomes active.
For the models, I make the following assumptions:
(1) The rate of infection and recovery is constant for the population
(2) The initial population is healthy and disease free
For the model with two classes of infectious, I make the assumption that eventually
all individuals with latent TB become active. In reality, most people with latent TB do not
develop active TB so a more realistic model would have a death rate.
Using these two models, I make adjustments by adding a relapse rate (η), a death rate
due to TB (ω), a net birth and death rate (µ), a rate of recovery due to drug treatment (ϕ),
and a rate of quarantine (q).
!" !"
= -‐βS!! + µ(S+!!+ !!+R) – εS !"!!"
= βS!!-‐ (γ+ ε)!!
!"!!"
= γ!! -‐ (α+ε) !!
!"!"
= α!! – εR
6
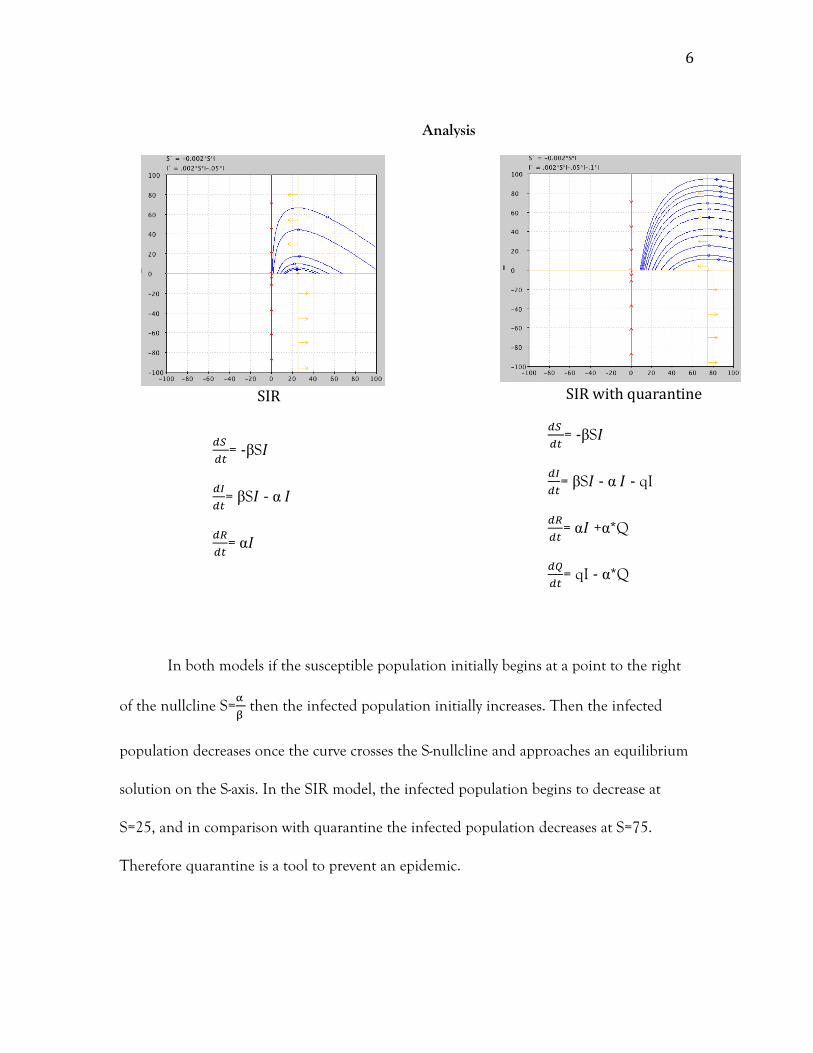
Analysis
In both models if the susceptible population initially begins at a point to the right
of the nullcline S=! !
then the infected population initially increases. Then the infected
population decreases once the curve crosses the S-nullcline and approaches an equilibrium
solution on the S-axis. In the SIR model, the infected population begins to decrease at
S=25, and in comparison with quarantine the infected population decreases at S=75.
Therefore quarantine is a tool to prevent an epidemic.
SIR
SIR with quarantine
!" !"
= -‐βS! !"!"
= βS! -‐ α ! !"!"
= α!
!" !"
= -‐βS! !"!"
= βS! -‐ α ! -‐ qI
!"!"
= α! +α*Q
!"!"
= qI -‐ α*Q

7
People with Tuberculosis (Latent and Active with effects of Isoniazid) !" !"
= -‐βS!!
!"!!"
= βS!!-‐(γ+ϕ)!!
!"!!"
= γ!! -‐α !!
!"!"
= α!! + ϕ!!
People with Tuberculosis (Latent and Active with effects of combination therapy) !" !"
= -‐βS!!
!"!!"
= βS!!-‐ (γ+2ϕ)!!
!"!!"
= γ!! -‐α !!
!"!"
= α!!+2ϕ!!
Graph with no treatment
Blue-Susceptible Red-Latent Infected
Graph with Isoniazid
Graph with Combination Therapy
8
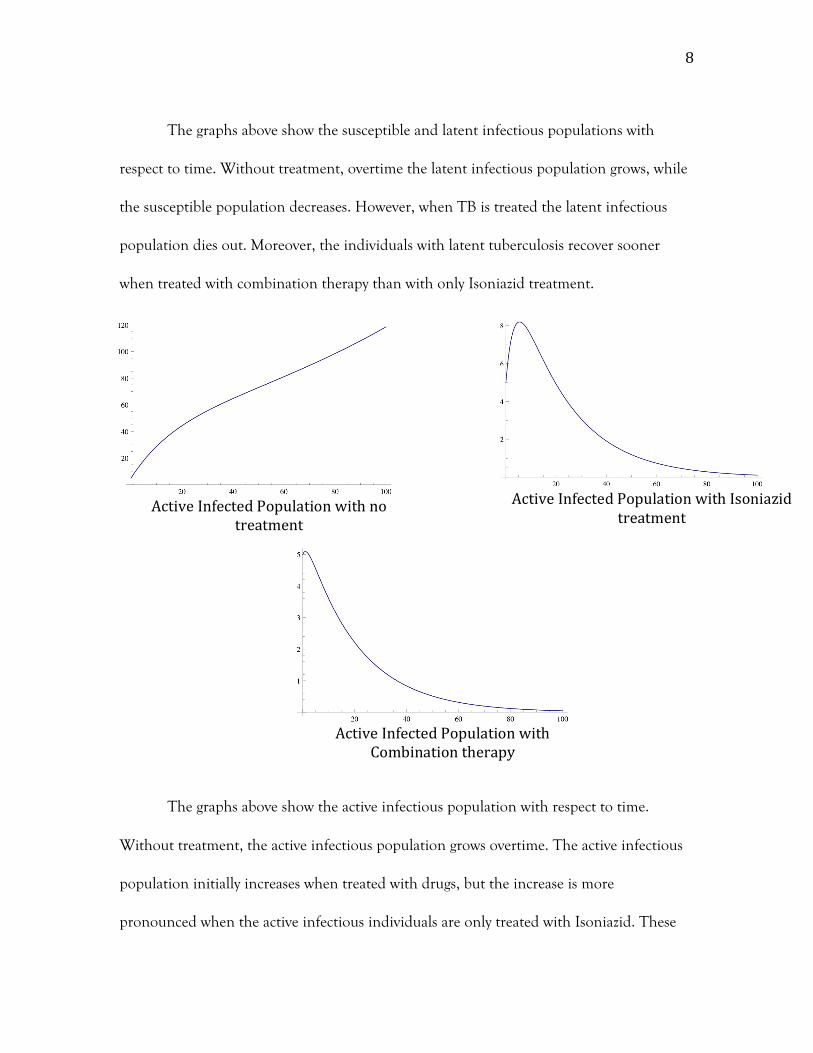
The graphs above show the susceptible and latent infectious populations with
respect to time. Without treatment, overtime the latent infectious population grows, while
the susceptible population decreases. However, when TB is treated the latent infectious
population dies out. Moreover, the individuals with latent tuberculosis recover sooner
when treated with combination therapy than with only Isoniazid treatment.
The graphs above show the active infectious population with respect to time.
Without treatment, the active infectious population grows overtime. The active infectious
population initially increases when treated with drugs, but the increase is more
pronounced when the active infectious individuals are only treated with Isoniazid. These
Active Infected Population with Isoniazid
treatment
Active Infected Population with
Combination therapy
Active Infected Population with no
treatment

9
results imply that the latent population will initially grow as well, and if the infected
population grows initially more with only Isoniazid treatment then TB will survive longer
within the population compared to a Combination treatment program.
Finally, I determined the trace and determinant of the Jacobian matrix for the
model given above in order to determine the stability of certain points. There is a stable
equilibrium point at R=N and S=!!=!!=0, which makes sense because everyone recovers
from TB. Also, there is an unstable equilibrium point at !!=!!=0, S=K, and R=N-K where
K is an element of [0,N], which makes sense because the disease will not die out when
there is a susceptible population.
Latent and Active TB with birth, death, and relapse rates !" !"
= -‐βS!! + µ(S+!!+ !!+R) – εS !"!!"
= βS!! - (γ+ ε)!!+ηR
!"!!"
= γ!! -‐ (α+ω+ ε) !!+ηR
!"!"
= α!! – (2η+ ε)R
Graph with No Treatment
Blue-Susceptible Red-Latent Infected Yellow-Active Infected Green-Recovered
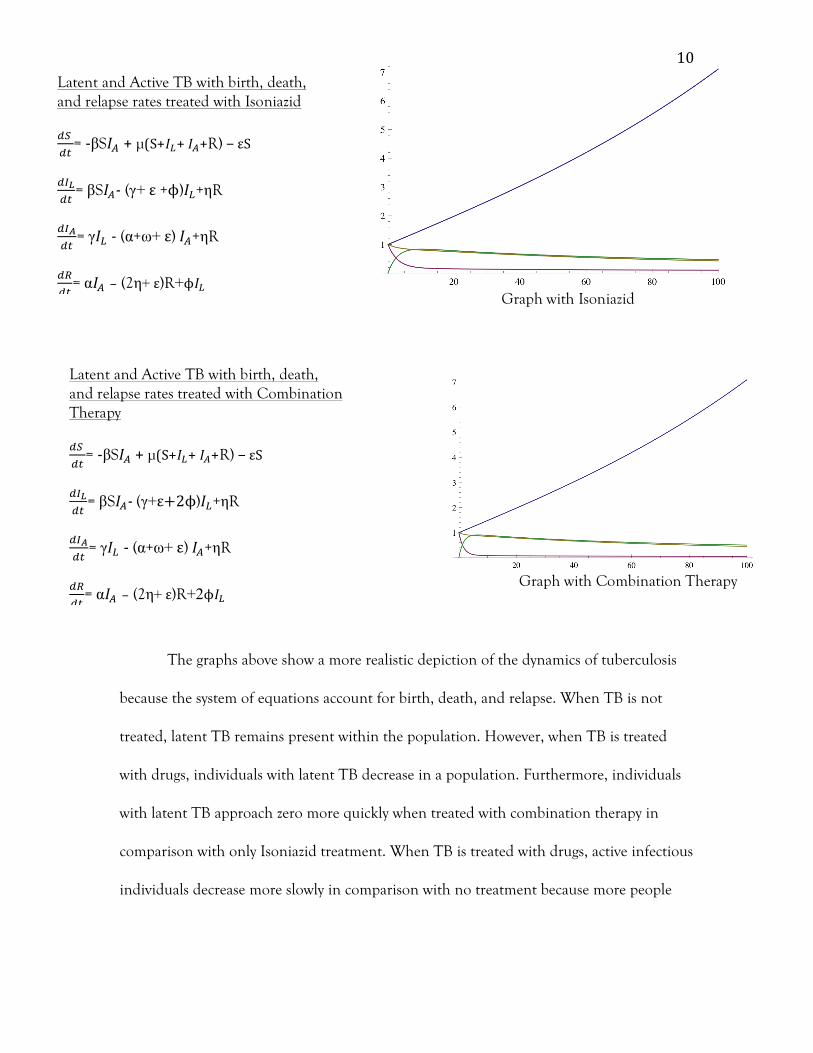
10
The graphs above show a more realistic depiction of the dynamics of tuberculosis
because the system of equations account for birth, death, and relapse. When TB is not
treated, latent TB remains present within the population. However, when TB is treated
with drugs, individuals with latent TB decrease in a population. Furthermore, individuals
with latent TB approach zero more quickly when treated with combination therapy in
comparison with only Isoniazid treatment. When TB is treated with drugs, active infectious
individuals decrease more slowly in comparison with no treatment because more people
Latent and Active TB with birth, death, and relapse rates treated with Isoniazid !" !"
= -‐βS!! + µ(S+!!+ !!+R) – εS !"!!"
= βS!!-‐ (γ+ ε +ϕ)!!+ηR
!"!!"
= γ!! -‐ (α+ω+ ε) !!+ηR
!"!"
= α!! – (2η+ ε)R+ϕ!!
Latent and Active TB with birth, death, and relapse rates treated with Combination Therapy !" !"
= -‐βS!! + µ(S+!!+ !!+R) – εS !"!!"
= βS!!-‐ (γ+ε+2ϕ)!!+ηR
!"!!"
= γ!! -‐ (α+ω+ ε) !!+ηR
!"!"
= α!! – (2η+ ε)R+2ϕ!!
Graph with Combination Therapy
Graph with Isoniazid

11
recover and have a greater chance of relapsing and becoming active or latent infectious. So
in reality, treatment will lead to a slow reduction in the active infectious population.
Conclusion
The models used show that quarantine is an effective tool to prevent an epidemic.
Furthermore, my analysis shows that combination therapy is a more effective and quicker
treatment than only using Isoniazid. Ultimately, the models prove that a treatment that has
a shorter time span is more effective and naturally cheaper. Creating treatment program for
tuberculosis that is cheap is important because TB is concentrated in developing countries.
Therefore, combination therapy would be a more effective way to deal with this disease
when compared to a single drug treatment.

12
References
1. Lambert Marie-Laurence, Epco Hasker, Armand Van Deun, Dominique Roberfroid,
Marleen Boelaert, Patrick van der Stuyft. Recurrence in tuberculosis: relapse or reinfection? The
Lancet Infectious Diseases 3 (2003): 282–287.
2. Sterling Timothy R., M. Elsa Villarino, Andrey S. Borisov, et al. Three months of
rifapentine and isoniazid for latent tuberculosis infection. The New England Journal of Medicine
365.6 (2011): 2155–2166.
3. Young Douglas, Jaroslav Stark, Denise Kirschner. Systems biology of persistent infection:
tuberculosis as a case study. Nature Reviews Microbiology 6 (2008): 520–528.
4. “TB Deaths per 100,000 population 2010.” globalhealthfacts. The Henry J. Kaiser Family
Foundation, n.d. Web. 26 Apr. 2012.
5. World Health Organization. World Heath Organization, 26 Apr. 2012. Web. 26 Apr.
2012.

13
Appendix
Total Population: N=S(t)+!(!)!"#$%#+!(!)!"#$%&+R(t)
S – Susceptible I – Infected R – Recovered SIR Model !" !"
= -‐βS! !"!"
= βS! -‐ α ! !"!"
= α! SIR with quarantine
SIR with relapse !" !"
= -‐βS! !"!"
= βS! -‐ α ! +ηR
!"!"
= α!-‐ηR
Terms: β – infection rate α – recovery rate µ - birth rate ε -death rate ω - death rate due to TB γ – rate of changing from latent to active t – time (in years) ϕ – effects of Isoniazid on latent recovery 2ϕ – effects of Isoniazid and Rifapentine on latent recovery η – relapse rate Q – Quarantine population q – rate at which infected population is quarantined α*- recovery rate of quarantined population Terms Values: β = .002 (using N=300 [units in millions] and !! = 12) α = .05 (assuming that within a year 1/20 of infected recover within a year) µ = .02 ε =.01 ω = .00045 (4) γ = .001 (using that within a lifetime a latent individual has a 10% chance of becoming active) ϕ = .28 (assuming within a year one fourth of infected recover) η = .05 (using that within 2 years 10% of recovered people relapse) (1) q = .1 α* = .16 (assuming that within a year 3/20 of infected recover within a year)
!! = !!!
!" !"
= -‐βS! !"!"
= βS! -‐ α ! -‐ qI
!"!"
= α! +α*Q
!"!"
= qI -‐ α*Q

14
Latent and Active TB
Latent and Active TB with effects of combination therapy !" !"
= -‐βS!!
!"!!"
= βS!!-‐ (γ+2ϕ)!!
!"!!"
= γ!! -‐α !!
!"!"
= α!!+2ϕ!! Latent and Active TB with birth and death rates !" !"
= -‐βS!! + µ(S+!!+ !!+R) – εS !"!!"
= βS!!-‐ (γ+ ε)!!
!"!!"
= γ!! -‐ (α+ω+ ε) !!
!"!"
= α!! – εR
!" !"
= -‐βS!!
!"!!"
= βS!!-‐ γ!!
!"!!"
= γ!! -‐α !!
!"!"
= α!!
Latent and Active TB with effects of Isoniazid !" !"
= -‐βS!!
!"!!"
= βS!!-‐(γ+ϕ)!!
!"!!"
= γ!! -‐α !!
!"!"
= α!! + ϕ!!
Latent and Active TB with birth, death, and relapse rates !" !"
= -‐βS!! + µ(S+!!+ !!+R)– εS !"!!"
= βS!! - (γ+ ε)!!+ηR
!"!!"
= γ!! -‐ (α+ω+ ε) !!+ηR
!"!"
= α!! – (2η+ ε)R

15
Latent and Active TB with birth, death, and relapse rates treated with Isoniazid !" !"
= -‐βS!! + µ(S+!!+ !!+R) – εS !"!!"
= βS!!-‐ (γ+ ε +ϕ)!!+ηR
!"!!"
= γ!! -‐ (α+ω+ ε) !!+ηR
!"!"
= α!! – (2η+ ε)R+ϕ!! Latent and Active TB with birth, death, and relapse rates treated with Combination Therapy !" !"
= -‐βS!! + µ(S+!!+ !!+R) – εS !"!!"
= βS!!-‐ (γ+ε+2ϕ)!!+ηR
!"!!"
= γ!! -‐ (α+ω+ ε) !!+ηR
!"!"
= α!! – (2η+ ε)R+2ϕ!!