tuberculosis treatment with diabetes comorbidity - eLife
19
*For correspondence: [email protected] † These authors contributed equally to this work ‡ These authors also contributed equally to this work Competing interests: The authors declare that no competing interests exist. Funding: See page 16 Received: 28 February 2019 Accepted: 20 June 2019 Published: 04 July 2019 Reviewing editor: Bavesh D Kana, University of the Witwatersrand, South Africa Copyright Kumar et al. This article is distributed under the terms of the Creative Commons Attribution License, which permits unrestricted use and redistribution provided that the original author and source are credited. Persistent inflammation during anti- tuberculosis treatment with diabetes comorbidity Nathella Pavan Kumar 1† , Kiyoshi F Fukutani 2,3,4† , Basavaradhya S Shruthi 5 , Thabata Alves 2,6 , Paulo S Silveira-Mattos 2,4 , Michael S Rocha 2 , Kim West 7 , Mohan Natarajan 8 , Vijay Viswanathan 5 , Subash Babu 1 , Bruno B Andrade 2,3,4,6‡ , Hardy Kornfeld 7‡ * 1 National Institutes of Health, National Institute for Research in Tuberculosis, International Center for Excellence in Research, Chennai, India; 2 Multinational Organization Network Sponsoring Translational and Epidemiological Research (MONSTER), Fundac ¸a ˜ o Jose ´ Silveira, Salvador, Brazil; 3 Instituto Gonc ¸ alo Moniz, Fundac ¸a ˜ o Oswaldo Cruz, Salvador, Brazil; 4 Faculdade de Tecnologia e Cie ˆ ncias, Salvador, Brazil; 5 Prof. M. Viswanathan Diabetes Research Center, Chennai, India; 6 Universidade Salvador, Laureate Universities, Salvador, Brazil; 7 University of Massachusetts Medical School, Worcester, United States; 8 National Institute for Research in Tuberculosis, Chennai, India Abstract Diabetes mellitus (DM) increases risk for pulmonary tuberculosis (TB) and adverse treatment outcomes. Systemic hyper-inflammation is characteristic in people with TB and concurrent DM (TBDM) at baseline, but the impact of TB treatment on this pattern has not been determined. We measured 17 plasma cytokines and growth factors in longitudinal cohorts of Indian and Brazilian pulmonary TB patients with or without DM. Principal component analysis revealed virtually complete separation of TBDM from TB individuals in both cohorts at baseline, with hyper- inflammation in TBDM that continued through treatment completion at six months. By one year after treatment completion, there was substantial convergence of mediator levels between groups within the India cohort. Non-resolving systemic inflammation in TBDM comorbidity could reflect delayed lesion sterilization or non-resolving sterile inflammation. Either mechanism portends unfavorable long-term outcomes including risk for recurrent TB and for damaging immune pathology. DOI: https://doi.org/10.7554/eLife.46477.001 Introduction It is now well established that diabetes mellitus (DM) is associated with increased the risk to become infected with Mycobacterium tuberculosis (Mtb), to progress from latent infection to active pulmo- nary tuberculosis (TB) disease, and to suffer adverse TB outcomes including delayed sputum conver- sion on treatment, treatment failure, death, and recurrent TB (Critchley et al., 2017). The biochemical and cellular mechanisms of increased TB susceptibility in DM are incompletely under- stood. Emerging evidence ties the complication of diabetic immunopathy to the well-studied dia- betic complications of microvascular, macrovascular and renal disease driven by pathways primary driven by chronic hyperglycemia and related oxidative stress (Giacco and Brownlee, 2010; Martinez and Kornfeld, 2014). Kumar et al. eLife 2019;8:e46477. DOI: https://doi.org/10.7554/eLife.46477 1 of 19 RESEARCH ARTICLE
-
Upload
khangminh22 -
Category
Documents
-
view
0 -
download
0
Transcript of tuberculosis treatment with diabetes comorbidity - eLife

*For correspondence:
†These authors contributed
equally to this work‡These authors also contributed
equally to this work
Competing interests: The
authors declare that no
competing interests exist.
Funding: See page 16
Received: 28 February 2019
Accepted: 20 June 2019
Published: 04 July 2019
Reviewing editor: Bavesh D
Kana, University of the
Witwatersrand, South Africa
Copyright Kumar et al. This
article is distributed under the
terms of the Creative Commons
Attribution License, which
permits unrestricted use and
redistribution provided that the
original author and source are
credited.
Persistent inflammation during anti-tuberculosis treatment with diabetescomorbidityNathella Pavan Kumar1†, Kiyoshi F Fukutani2,3,4†, Basavaradhya S Shruthi5,Thabata Alves2,6, Paulo S Silveira-Mattos2,4, Michael S Rocha2, Kim West7,Mohan Natarajan8, Vijay Viswanathan5, Subash Babu1, Bruno B Andrade2,3,4,6‡,Hardy Kornfeld7‡*
1National Institutes of Health, National Institute for Research in Tuberculosis,International Center for Excellence in Research, Chennai, India; 2MultinationalOrganization Network Sponsoring Translational and Epidemiological Research(MONSTER), Fundacao Jose Silveira, Salvador, Brazil; 3Instituto Goncalo Moniz,Fundacao Oswaldo Cruz, Salvador, Brazil; 4Faculdade de Tecnologia e Ciencias,Salvador, Brazil; 5Prof. M. Viswanathan Diabetes Research Center, Chennai, India;6Universidade Salvador, Laureate Universities, Salvador, Brazil; 7University ofMassachusetts Medical School, Worcester, United States; 8National Institute forResearch in Tuberculosis, Chennai, India
Abstract Diabetes mellitus (DM) increases risk for pulmonary tuberculosis (TB) and adverse
treatment outcomes. Systemic hyper-inflammation is characteristic in people with TB and
concurrent DM (TBDM) at baseline, but the impact of TB treatment on this pattern has not been
determined. We measured 17 plasma cytokines and growth factors in longitudinal cohorts of Indian
and Brazilian pulmonary TB patients with or without DM. Principal component analysis revealed
virtually complete separation of TBDM from TB individuals in both cohorts at baseline, with hyper-
inflammation in TBDM that continued through treatment completion at six months. By one year
after treatment completion, there was substantial convergence of mediator levels between groups
within the India cohort. Non-resolving systemic inflammation in TBDM comorbidity could reflect
delayed lesion sterilization or non-resolving sterile inflammation. Either mechanism portends
unfavorable long-term outcomes including risk for recurrent TB and for damaging immune
pathology.
DOI: https://doi.org/10.7554/eLife.46477.001
IntroductionIt is now well established that diabetes mellitus (DM) is associated with increased the risk to become
infected with Mycobacterium tuberculosis (Mtb), to progress from latent infection to active pulmo-
nary tuberculosis (TB) disease, and to suffer adverse TB outcomes including delayed sputum conver-
sion on treatment, treatment failure, death, and recurrent TB (Critchley et al., 2017). The
biochemical and cellular mechanisms of increased TB susceptibility in DM are incompletely under-
stood. Emerging evidence ties the complication of diabetic immunopathy to the well-studied dia-
betic complications of microvascular, macrovascular and renal disease driven by pathways primary
driven by chronic hyperglycemia and related oxidative stress (Giacco and Brownlee, 2010;
Martinez and Kornfeld, 2014).
Kumar et al. eLife 2019;8:e46477. DOI: https://doi.org/10.7554/eLife.46477 1 of 19
RESEARCH ARTICLE

Pulmonary TB disease with concurrent DM is associated with a higher burden of immune pathol-
ogy and systemic inflammation compared to TB in euglycemic hosts (Martinez and Kornfeld, 2014).
Restrepo et al. were the first to describe increased expression of a broad range of cytokines from
antigen-stimulated whole blood from patients with concurrent TB and DM as compared to TB alone
eLife digest Tuberculosis is the leading cause of death from infection worldwide. The bacteria
that causes tuberculosis infect one in every four people on the planet, though most never develop
the disease. People with diabetes are more likely to develop tuberculosis and they develop more
severe symptoms, which may contribute to further spread of the disease. As diabetes rates are
growing worldwide, particularly in countries with a high burden of tuberculosis, it is becoming to
increasingly important to understand how these two conditions interact.
People with diabetes often have more severe inflammation at the time they are diagnosed with
tuberculosis than tuberculosis patients without diabetes. Inflammation can cause permanent lung
damage in patients with tuberculosis, which can have serious consequences. Learning more about
how treatment for tuberculosis affects inflammation in people with diabetes could help improve the
outcomes for these patients.
Now, Kumar, Fukutani et al. show that people with diabetes experience higher levels of
inflammation than patients without diabetes throughout the course of treatment for tuberculosis.
The analysis compared 17 markers of inflammation in tuberculosis patients with and without
diabetes at diagnosis, and at two time periods during the 6-month course of treatment. Kumar,
Fukutani et al. also looked at two separate groups of patients, one from India and one from Brazil.
Inflammation was measured in the patients in India one year after the completion of treatment. One-
year after treatment for tuberculosis in India, inflammation levels were the same in patients with and
without diabetes.
Persistently higher levels of inflammation likely explain why patients with diabetes experience
more severe symptoms and suggests they may have more permanent lung damage after
tuberculosis. Scientists are currently developing new treatments that can be used with antibiotics to
more quickly cure tuberculosis and protect the lungs by reducing inflammation. Patients with
diabetes and tuberculosis may benefit from these new treatments or from existing drugs like
metformin or statins that may reduce inflammation.
DOI: https://doi.org/10.7554/eLife.46477.002
Table 1. Clinical and demographic characteristics of participants in the India cohort.
Characteristic TBDM TB P value
n = 43 n = 44
Age, median years (IQR) 46 (38–52) 39.5 (30–47) 0.0146
Male sex, no. (%) 32 (74.4) 37 (84) 0.0408
Smoking status, no. (%) 0.0584
Current smoker 5 (11.6) 12 (27.3)
Former smoker 9 (21) 13 (29.5)
Never smoked 29 (67.4) 19 (43.2)
Alcohol use, no. (%) 0.7410
Current use 11 (25.6) 21 (47.7)
Former user 16 (37.2) 10 (22.7)
Never used 16 (37.2) 13 (29.6)
BMI kg/m2, median (IQR) 20.3 (163–23) 16�4 (15.2–18.3) <0.0001
HbA1c %, median (IQR) 10.0 (7.3–11.8) 5.6 (5.4–5.8) <0.0001
Vitamin D ng/dL, median (IQR) 15 (9.3–24) 17 (13–27) 0.1502
DOI: https://doi.org/10.7554/eLife.46477.003
Kumar et al. eLife 2019;8:e46477. DOI: https://doi.org/10.7554/eLife.46477 2 of 19
Research article Immunology and Inflammation Microbiology and Infectious Disease
(Restrepo et al., 2008). This was subsequently verified by several studies reporting higher plasma
cytokine levels and higher frequencies of cytokine-expressing T cells assessed by flow cytometry in
samples from individuals with TBDM comorbidity (Kumar et al., 2013a; Kumar et al., 2013b;
Prada-Medina et al., 2017). Published studies have focused on samples obtained at baseline,
before or shortly after the initiation of anti-TB treatment (ATT). We hypothesized that the hyperin-
flammatory phenotype of TBDM comorbidity is driven by a higher lung bacterial burden and/or by
impaired counter regulatory mechanisms that normally limit bystander tissue injury from protective
immune responses. To test the prediction that the DM would be associated with delayed resolution
of inflammation during TB treatment, we conducted a longitudinal assessment of plasma cytokine
and growth factor levels in cohorts of adult pulmonary TB patients with and without DM recruited in
India and Brazil.
Results
Characteristics of the study populationsAdults suspected to have pulmonary TB disease were screened for participation in the Effects of Dia-
betes on Tuberculosis Severity (EDOTS) study on presentation to the government clinic system in
Chennai, India. Candidates conforming to the inclusion and exclusion criteria where tested for glyce-
mic status based on medical history, oral glucose tolerance test (only for those without prior DM his-
tory), and glycohemogloblin (HbA1c; for all enrolled participants). Follow-up visits occurred at
monthly intervals during the 6 month course of ATT for drug-sensitive TB and then quarterly through
the final study visit one year after ATT completion (month-18). Enrolled participants were withdrawn
from the study and not included in the current analysis if their baseline sputum culture was negative
or if it was positive for multi-drug resistant Mtb.
Selected demographic, anthropometric and behavioral variables of the India cohort are shown in
Table 1. Compared to the normoglycemic TB group, the TBDM group had higher median age and
higher body mass index (BMI). The median and interquartile range of BMI in the normoglycemic TB
group fell below the WHO cutoff for undernutrition of 18.5 kg/m2 (WHO Expert Consultation,
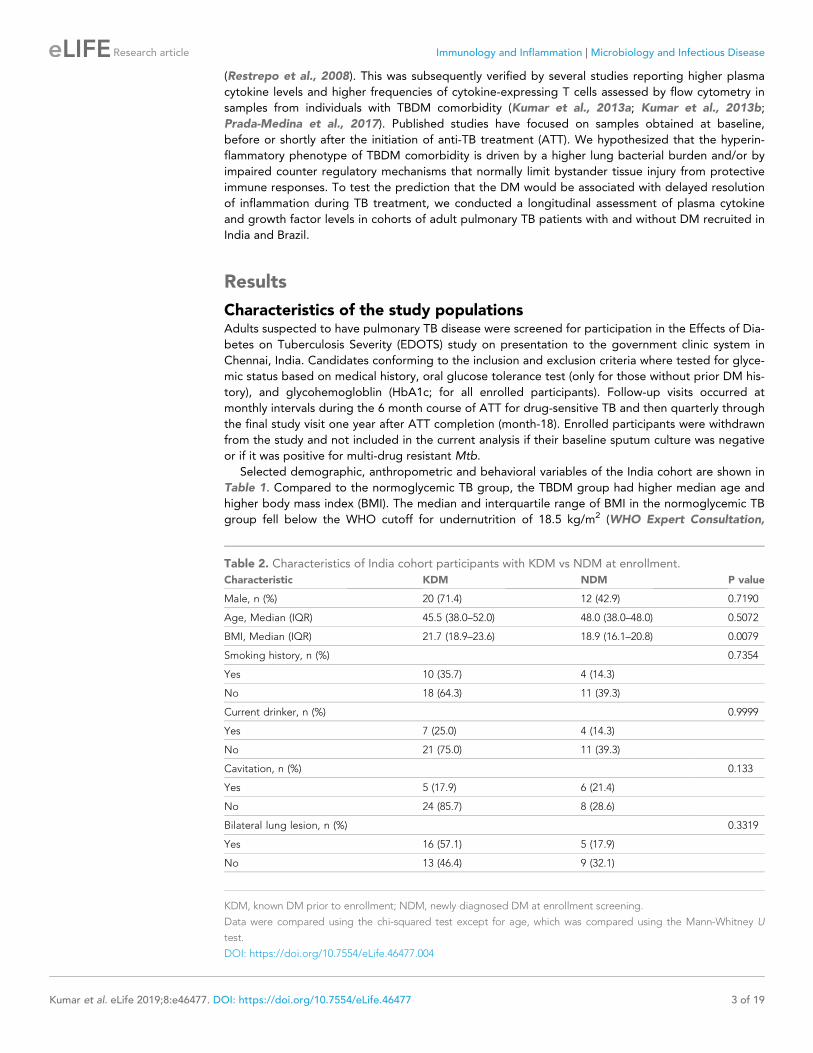
Table 2. Characteristics of India cohort participants with KDM vs NDM at enrollment.
Characteristic KDM NDM P value
Male, n (%) 20 (71.4) 12 (42.9) 0.7190
Age, Median (IQR) 45.5 (38.0–52.0) 48.0 (38.0–48.0) 0.5072
BMI, Median (IQR) 21.7 (18.9–23.6) 18.9 (16.1–20.8) 0.0079
Smoking history, n (%) 0.7354
Yes 10 (35.7) 4 (14.3)
No 18 (64.3) 11 (39.3)
Current drinker, n (%) 0.9999
Yes 7 (25.0) 4 (14.3)
No 21 (75.0) 11 (39.3)
Cavitation, n (%) 0.133
Yes 5 (17.9) 6 (21.4)
No 24 (85.7) 8 (28.6)
Bilateral lung lesion, n (%) 0.3319
Yes 16 (57.1) 5 (17.9)
No 13 (46.4) 9 (32.1)
KDM, known DM prior to enrollment; NDM, newly diagnosed DM at enrollment screening.
Data were compared using the chi-squared test except for age, which was compared using the Mann-Whitney U
test.
DOI: https://doi.org/10.7554/eLife.46477.004
Kumar et al. eLife 2019;8:e46477. DOI: https://doi.org/10.7554/eLife.46477 3 of 19
Research article Immunology and Inflammation Microbiology and Infectious Disease

2004). Trends for higher likelihood of self-reported current or past smoking in the normoglycemic
TB group did not reach statistical significance. There was no difference in the proportion of TB or
TBDM participants who reported current or past alcohol consumption. The median HbA1c in TBDM
participants was 10.0%, indicating poor glycemic control. There were no statistically significant dif-
ferences in sex, age, smoking or alcohol consumption between TBDM participants with DM newly
diagnosed during screening for this (NDM) study vs known DM diagnosis prior to incident TB (KDM),
but median BMI was higher in the KDM group (Table 2). All participants in the non-diabetic TB
group were classified as euglycemic based on oral glucose tolerance test but sixteen had
HbA1c � 5.8%, placing them in the prediabetic range by American Diabetes Association criteria.
There was no difference in median 25-hydroxyvitamin D levels between TB and TBDM participants,
although the median for both groups fell below a common threshold for insufficiency (20 ng/mL)
(Thacher and Clarke, 2011). There were no significant differences between groups in the TB radio-
graphic severity score, the presence of lower lung zone lesions or cavitary lesions.
The Brazil cohort differed from the India cohort in several respects (Table 3). In that cohort, DM
status was classified based only on HbA1c, there was no difference in median age between TBDM
and TB participants, roughly equal proportions of male and female participants, and no differences
between groups in smoking or alcohol consumption. There was no difference in median BMI
between TBDM and TB participants in the Brazil cohort and nearly all participants had BMI above
the undernutrition cutoff of 18.5 kg/m2. Median HbA1c was lower in the Brazilian TBDM and TB
groups compared to their Indian counterparts, but glycemic control was nonetheless poor (�7.5%)
in the majority of Brazilian TBDM participants.
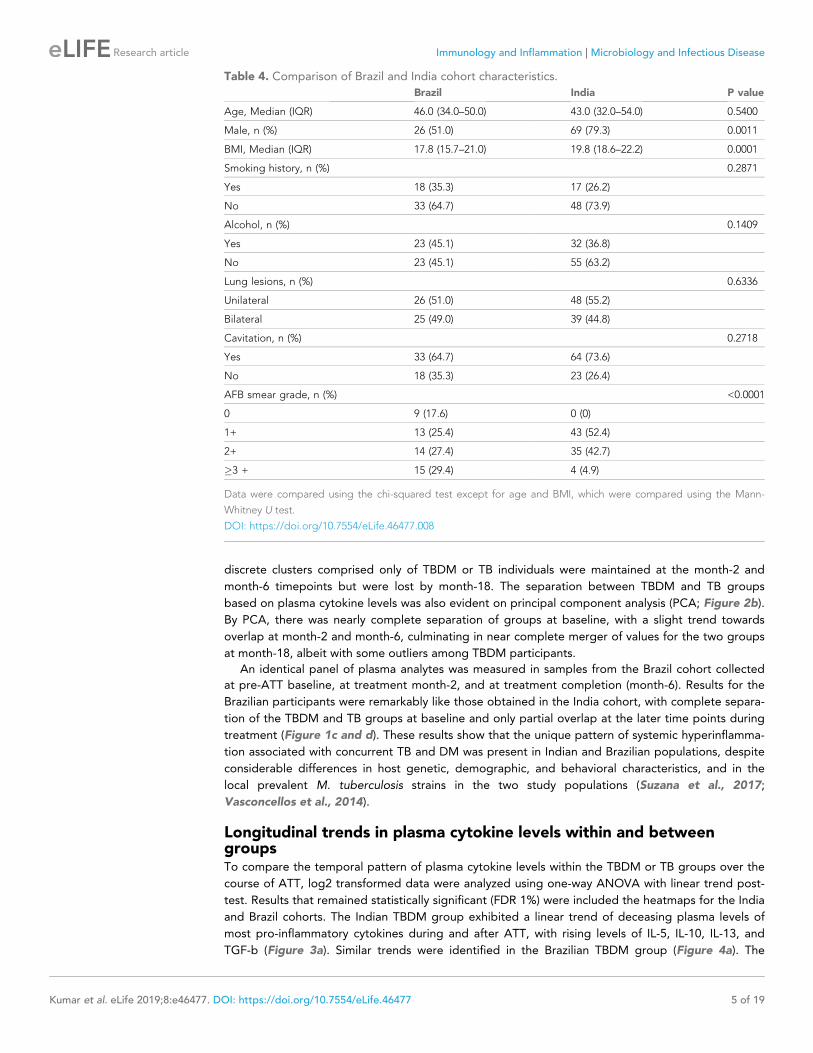
A comparison of demographic and clinical characteristics between the cohorts from Brazil and
India is shown in Table 4 and further stratified into TB and TBDM subgroups within each cohort in
Table 5. Statistically significant differences included a higher proportion of female sex and higher
BMI in the Brazil cohort, while the cohorts did not differ with respect to alcohol or consumption or
smoking. Sputum acid-fast bacilli smear grades were significantly higher in TBDM than TB partici-
pants from India with a similar trend in the Brazil cohort that did not reach statistical significance
(Figure 1a). Sputum smear grade differences between TBDM and TB were highly significant when
the combined participants from both countries were considered (Figure 1b).
TBDM and TB are associated with distinct plasma cytokine profilesPlasma levels of seventeen cytokines and growth factors were measured in samples from participants
in the Indian TBDM and TB groups at baseline (pre-ATT), after the intensive phase of ATT (month-2),
at the completion of ATT (month-6), and one year after TB treatment completion (month-18). Hierar-
chical cluster analysis of log2-transformed and z-score normalized values for each analyte identified
two main clusters exclusively comprised of TBDM or TB, respectively, at baseline (Figure 2a). The
TBDM group exhibited higher levels of nearly all analytes compared to the TB group. The two
Table 3. Clinical and demographic characteristics of participants in the Brazil cohort.
Characteristic TBDM TB P value
n = 25 n = 26
Age, median years (IQR) 45 (30.5–49.5) 46 (37–56) 0.131
Male sex, no. (%) 13 (52) 13 (50) >0.999
Smoking status, no. (%) 0.162
Current smoker 10 (40) 8 (30.7)
Former smoker 3 (12) 9 (34.6)
Never smoked 12 (48) 9 (34.6)
Alcoholism, no. (%) 10 (40) 13 (50) 0.473
BMI kg/m2, median (IQR) 19.5 (18.3–49.5) 20.2 (18.7–22.6) 0.114
HbA1c %, median (IQR) 8.8 (7.3–10.2) 5.2 (4.7–5.5) <0.0001
Alcoholism defined by CAGE questionnaire.
DOI: https://doi.org/10.7554/eLife.46477.005
Kumar et al. eLife 2019;8:e46477. DOI: https://doi.org/10.7554/eLife.46477 4 of 19
Research article Immunology and Inflammation Microbiology and Infectious Disease
discrete clusters comprised only of TBDM or TB individuals were maintained at the month-2 and
month-6 timepoints but were lost by month-18. The separation between TBDM and TB groups
based on plasma cytokine levels was also evident on principal component analysis (PCA; Figure 2b).
By PCA, there was nearly complete separation of groups at baseline, with a slight trend towards
overlap at month-2 and month-6, culminating in near complete merger of values for the two groups
at month-18, albeit with some outliers among TBDM participants.
An identical panel of plasma analytes was measured in samples from the Brazil cohort collected
at pre-ATT baseline, at treatment month-2, and at treatment completion (month-6). Results for the
Brazilian participants were remarkably like those obtained in the India cohort, with complete separa-
tion of the TBDM and TB groups at baseline and only partial overlap at the later time points during
treatment (Figure 1c and d). These results show that the unique pattern of systemic hyperinflamma-
tion associated with concurrent TB and DM was present in Indian and Brazilian populations, despite
considerable differences in host genetic, demographic, and behavioral characteristics, and in the
local prevalent M. tuberculosis strains in the two study populations (Suzana et al., 2017;
Vasconcellos et al., 2014).
Longitudinal trends in plasma cytokine levels within and betweengroupsTo compare the temporal pattern of plasma cytokine levels within the TBDM or TB groups over the
course of ATT, log2 transformed data were analyzed using one-way ANOVA with linear trend post-
test. Results that remained statistically significant (FDR 1%) were included the heatmaps for the India
and Brazil cohorts. The Indian TBDM group exhibited a linear trend of deceasing plasma levels of
most pro-inflammatory cytokines during and after ATT, with rising levels of IL-5, IL-10, IL-13, and
TGF-b (Figure 3a). Similar trends were identified in the Brazilian TBDM group (Figure 4a). The
Table 4. Comparison of Brazil and India cohort characteristics.
Brazil India P value
Age, Median (IQR) 46.0 (34.0–50.0) 43.0 (32.0–54.0) 0.5400
Male, n (%) 26 (51.0) 69 (79.3) 0.0011
BMI, Median (IQR) 17.8 (15.7–21.0) 19.8 (18.6–22.2) 0.0001
Smoking history, n (%) 0.2871
Yes 18 (35.3) 17 (26.2)
No 33 (64.7) 48 (73.9)
Alcohol, n (%) 0.1409
Yes 23 (45.1) 32 (36.8)
No 23 (45.1) 55 (63.2)
Lung lesions, n (%) 0.6336
Unilateral 26 (51.0) 48 (55.2)
Bilateral 25 (49.0) 39 (44.8)
Cavitation, n (%) 0.2718
Yes 33 (64.7) 64 (73.6)
No 18 (35.3) 23 (26.4)
AFB smear grade, n (%) <0.0001
0 9 (17.6) 0 (0)
1+ 13 (25.4) 43 (52.4)
2+ 14 (27.4) 35 (42.7)
�3 + 15 (29.4) 4 (4.9)
Data were compared using the chi-squared test except for age and BMI, which were compared using the Mann-
Whitney U test.
DOI: https://doi.org/10.7554/eLife.46477.008
Kumar et al. eLife 2019;8:e46477. DOI: https://doi.org/10.7554/eLife.46477 5 of 19
Research article Immunology and Inflammation Microbiology and Infectious Disease

trends within the normoglycemic TB groups from India (Figure 3a) and Brazil (Figure 4a) where
mutually consistent and differed from the TBDM groups most notably with declining levels of IL-10.
Analysis of plasma cytokines accounting for differences between the TBDM and TB groups of the
India cohort is shown in Figure 3b. There was a statistically significant difference in the levels of
Table 5. Characteristics of normoglycemic TB participants and TBDM participants in the India and Brazil cohorts.
Characteristics TB TBDM
India Brazil P value India Brazil P value
Age, Median (IQR) 39.5 (30.0–47.2) 45.0 (30.5–49.5) 0.6390 47.0 (38.0–51.0) 46.0 (37.0–56.0) 0.5565
Male, n(%) 32 (72.7%) 13 (50%) 0.3001 37 (84,09%) 13 (52%) 0.0058
BMI, Median (IQR) 16.4 (15.3–18.3) 19.5 (18.3–20.6) 0.2579 20.32 (16.6–23.0) 20.20 (18.7–22.6) <0.0001
Smoking, n (%) 0.6148 0.1309
Yes 25 (56.8%) 17 (65.4%) 14 (32.6%) 13 (52%)
No 19 (43.2%) 9 (346%) 29 (67.4%) 12 (48%)
Alcohol, n (%) >0.9999 0.2786
Yes 21 (47.7%) 13 (50%) 11 (25.6%) 10 (40%)
No 23 (52.3%) 13 (50%) 32 (74.4%) 15 (60%)
Lung lesion, n (%) >0.9999 0.4535
Unilateral 26 (591%) 16 (61.5%) 22 (51,16%) 10 (40%)
Bilateral 18 (40.9%) 10 (38.5%) 21 (48,84%) 15 (60%)
Cavitation, n (%) 0.0212 0.0003
Yes 12 (27.3%) 15 (57.7%) 11 (25.6%) 18 (72%)
No 32 (72.7%) 11 (42.3%) 32 (74.4%) 7 (28%)
AFB smear, n (%) 0.0024 <0.0001
0 0 (0%) 6 (23.1%) 0 (0%) 3 (12%)
1+ 26 (61.9%) 9 (34.6%) 17 (42,5%) 4 (16%)
2+ 13 (30.9%) 6 (23.1%) 22 (55%) 8 (32%)
�3 + 3 (7.1%) 5 (19.2%) 1 (2,5%) 10 (40%)
Data were compared using the chi-square test except foe age as BMI, which were compared using the Mann-Whitney U test.
DOI: https://doi.org/10.7554/eLife.46477.009
Figure 1. Mycobacterial burden in sputum smear stratified by glycemic status. Sputum AFB smear grade in participants with DM comorbidity (TBDM,
Orange) or euglycemia (TB, Green). (A) Frequency of India cohort participants (left panel) and Brazil cohort participants (right panel) with different AFB
smear grades ranging from 0 to �3 + . (B) Frequency of TB and TBDM participants from the combined Indian and Brazil cohorts with different AFB
smear grades. Data were analyzed using Pearson’s chi-squared test.
DOI: https://doi.org/10.7554/eLife.46477.006
Kumar et al. eLife 2019;8:e46477. DOI: https://doi.org/10.7554/eLife.46477 6 of 19
Research article Immunology and Inflammation Microbiology and Infectious Disease
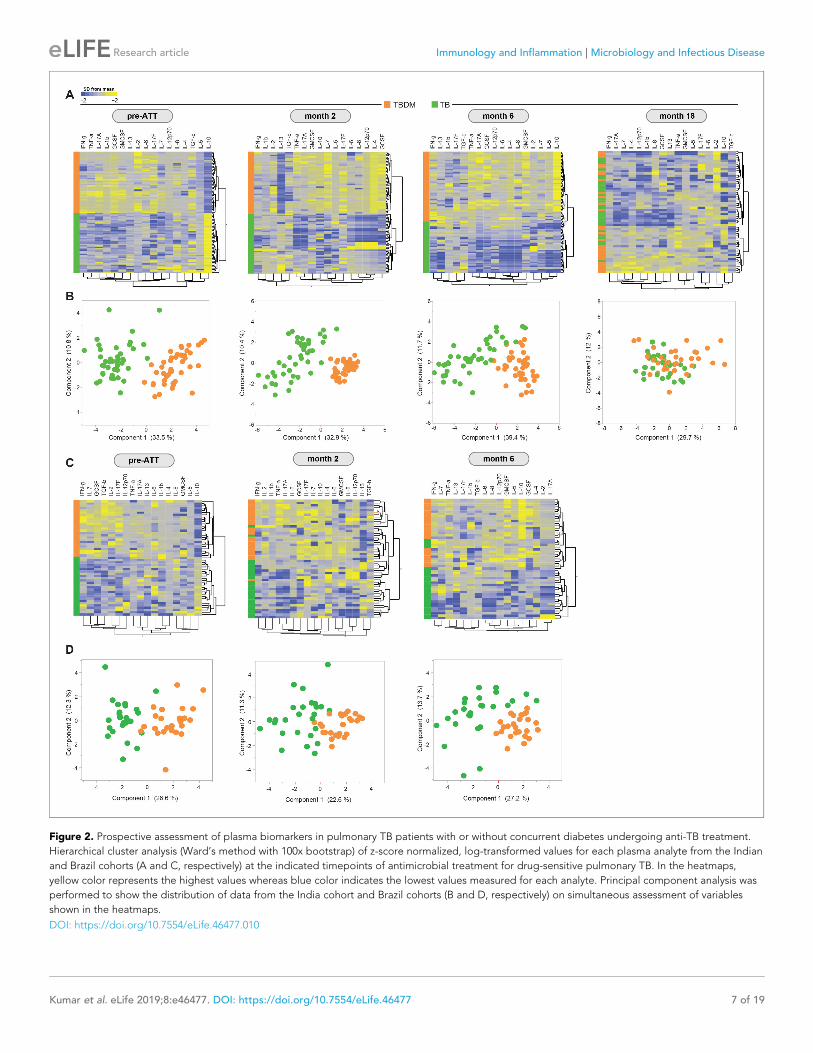
Figure 2. Prospective assessment of plasma biomarkers in pulmonary TB patients with or without concurrent diabetes undergoing anti-TB treatment.
Hierarchical cluster analysis (Ward’s method with 100x bootstrap) of z-score normalized, log-transformed values for each plasma analyte from the Indian
and Brazil cohorts (A and C, respectively) at the indicated timepoints of antimicrobial treatment for drug-sensitive pulmonary TB. In the heatmaps,
yellow color represents the highest values whereas blue color indicates the lowest values measured for each analyte. Principal component analysis was
performed to show the distribution of data from the India cohort and Brazil cohorts (B and D, respectively) on simultaneous assessment of variables
shown in the heatmaps.
DOI: https://doi.org/10.7554/eLife.46477.010
Kumar et al. eLife 2019;8:e46477. DOI: https://doi.org/10.7554/eLife.46477 7 of 19
Research article Immunology and Inflammation Microbiology and Infectious Disease
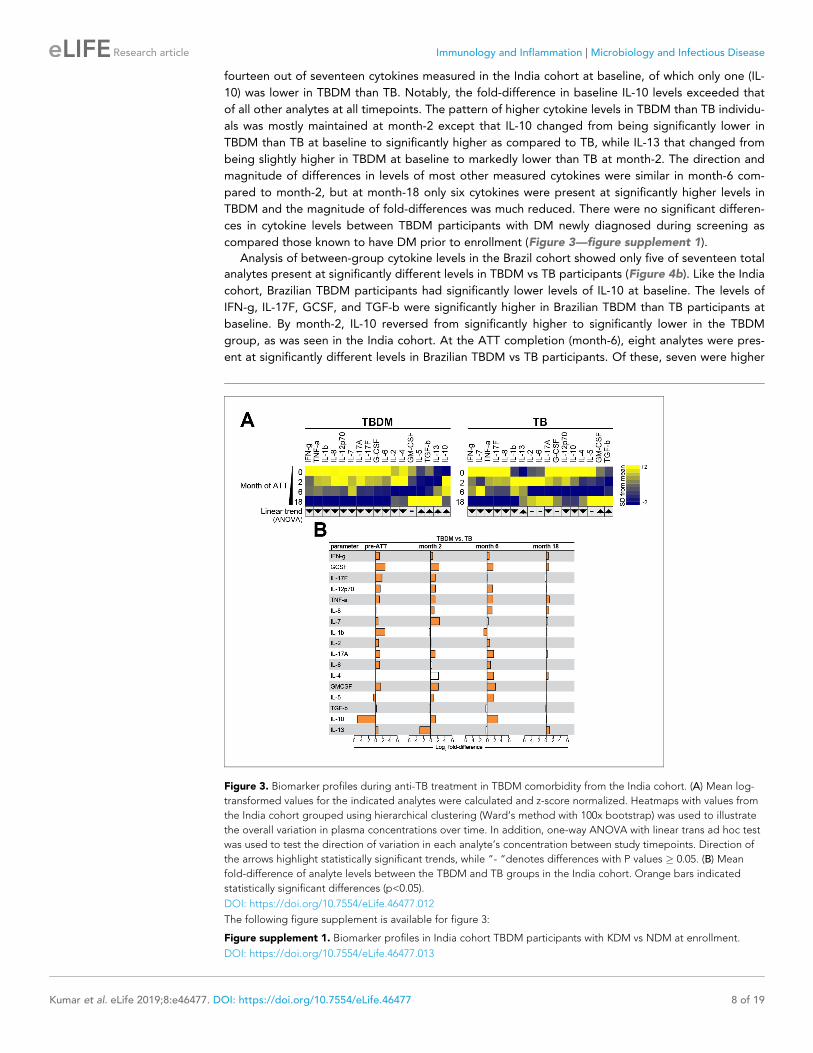
fourteen out of seventeen cytokines measured in the India cohort at baseline, of which only one (IL-
10) was lower in TBDM than TB. Notably, the fold-difference in baseline IL-10 levels exceeded that
of all other analytes at all timepoints. The pattern of higher cytokine levels in TBDM than TB individu-
als was mostly maintained at month-2 except that IL-10 changed from being significantly lower in
TBDM than TB at baseline to significantly higher as compared to TB, while IL-13 that changed from
being slightly higher in TBDM at baseline to markedly lower than TB at month-2. The direction and
magnitude of differences in levels of most other measured cytokines were similar in month-6 com-
pared to month-2, but at month-18 only six cytokines were present at significantly higher levels in
TBDM and the magnitude of fold-differences was much reduced. There were no significant differen-
ces in cytokine levels between TBDM participants with DM newly diagnosed during screening as
compared those known to have DM prior to enrollment (Figure 3—figure supplement 1).
Analysis of between-group cytokine levels in the Brazil cohort showed only five of seventeen total
analytes present at significantly different levels in TBDM vs TB participants (Figure 4b). Like the India
cohort, Brazilian TBDM participants had significantly lower levels of IL-10 at baseline. The levels of
IFN-g, IL-17F, GCSF, and TGF-b were significantly higher in Brazilian TBDM than TB participants at
baseline. By month-2, IL-10 reversed from significantly higher to significantly lower in the TBDM
group, as was seen in the India cohort. At the ATT completion (month-6), eight analytes were pres-
ent at significantly different levels in Brazilian TBDM vs TB participants. Of these, seven were higher
Figure 3. Biomarker profiles during anti-TB treatment in TBDM comorbidity from the India cohort. (A) Mean log-
transformed values for the indicated analytes were calculated and z-score normalized. Heatmaps with values from
the India cohort grouped using hierarchical clustering (Ward’s method with 100x bootstrap) was used to illustrate
the overall variation in plasma concentrations over time. In addition, one-way ANOVA with linear trans ad hoc test
was used to test the direction of variation in each analyte’s concentration between study timepoints. Direction of
the arrows highlight statistically significant trends, while “- “denotes differences with P values � 0.05. (B) Mean
fold-difference of analyte levels between the TBDM and TB groups in the India cohort. Orange bars indicated
statistically significant differences (p<0.05).
DOI: https://doi.org/10.7554/eLife.46477.012
The following figure supplement is available for figure 3:
Figure supplement 1. Biomarker profiles in India cohort TBDM participants with KDM vs NDM at enrollment.
DOI: https://doi.org/10.7554/eLife.46477.013
Kumar et al. eLife 2019;8:e46477. DOI: https://doi.org/10.7554/eLife.46477 8 of 19
Research article Immunology and Inflammation Microbiology and Infectious Disease
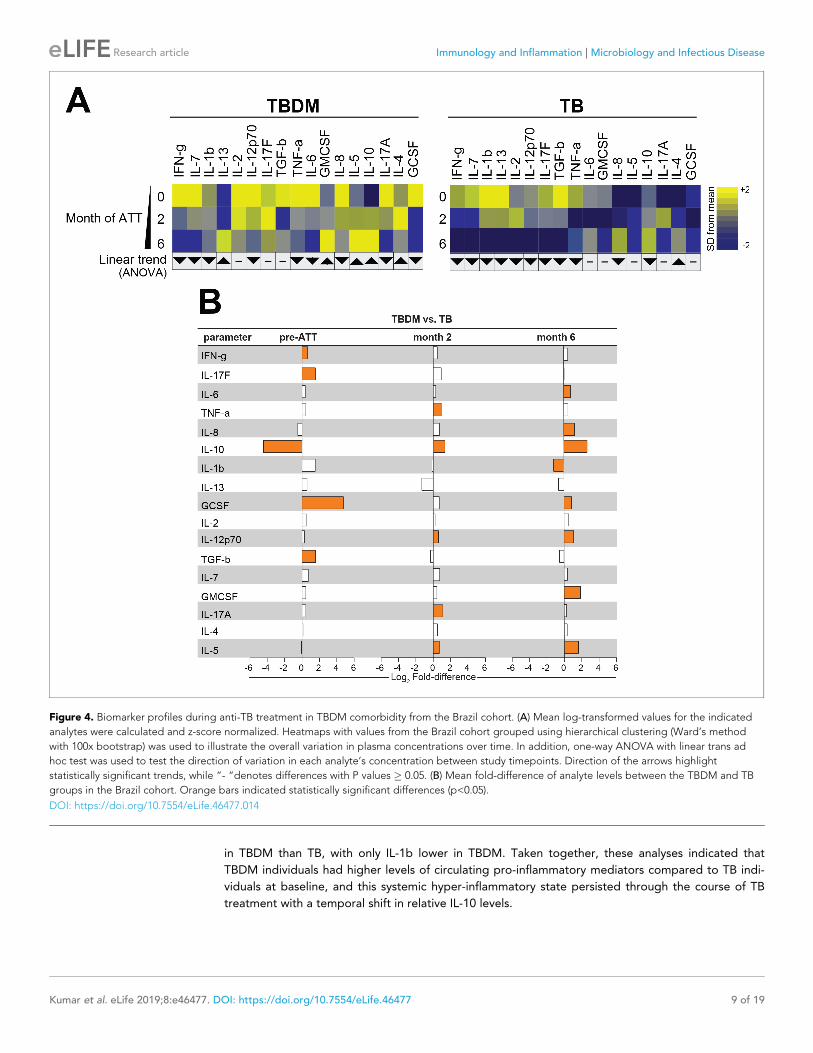
in TBDM than TB, with only IL-1b lower in TBDM. Taken together, these analyses indicated that
TBDM individuals had higher levels of circulating pro-inflammatory mediators compared to TB indi-
viduals at baseline, and this systemic hyper-inflammatory state persisted through the course of TB
treatment with a temporal shift in relative IL-10 levels.
Figure 4. Biomarker profiles during anti-TB treatment in TBDM comorbidity from the Brazil cohort. (A) Mean log-transformed values for the indicated
analytes were calculated and z-score normalized. Heatmaps with values from the Brazil cohort grouped using hierarchical clustering (Ward’s method
with 100x bootstrap) was used to illustrate the overall variation in plasma concentrations over time. In addition, one-way ANOVA with linear trans ad
hoc test was used to test the direction of variation in each analyte’s concentration between study timepoints. Direction of the arrows highlight
statistically significant trends, while “- “denotes differences with P values � 0.05. (B) Mean fold-difference of analyte levels between the TBDM and TB
groups in the Brazil cohort. Orange bars indicated statistically significant differences (p<0.05).
DOI: https://doi.org/10.7554/eLife.46477.014
Kumar et al. eLife 2019;8:e46477. DOI: https://doi.org/10.7554/eLife.46477 9 of 19
Research article Immunology and Inflammation Microbiology and Infectious Disease
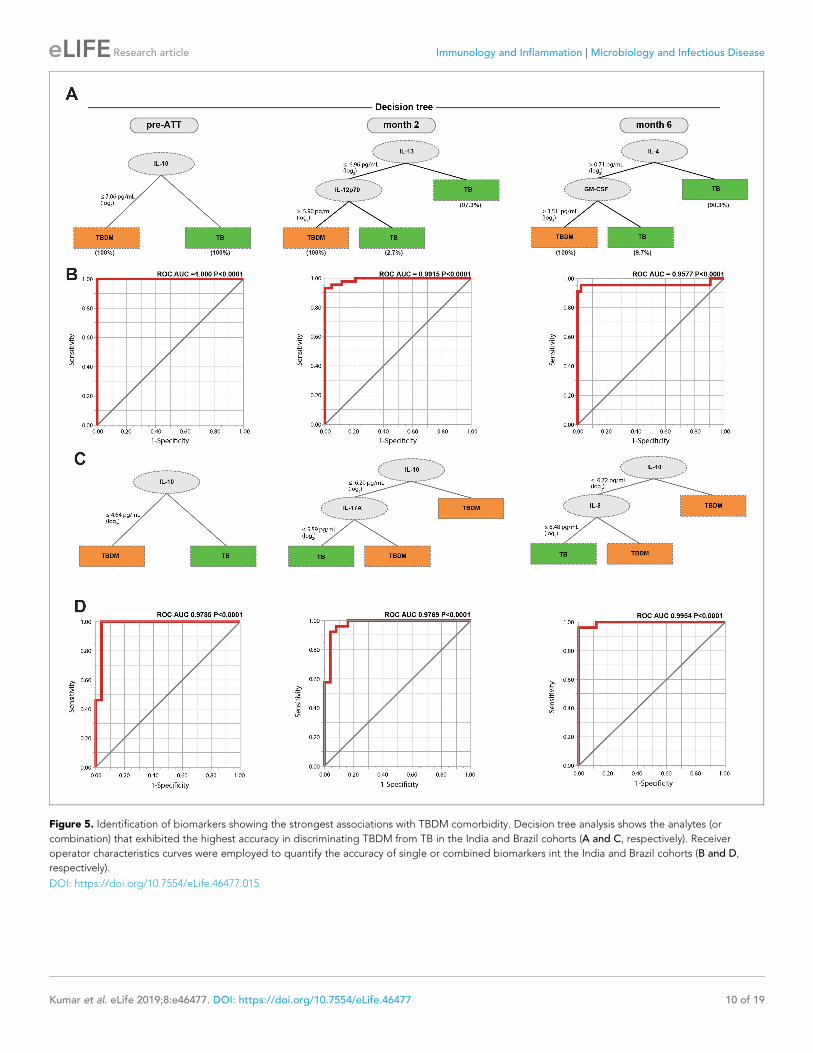
Figure 5. Identification of biomarkers showing the strongest associations with TBDM comorbidity. Decision tree analysis shows the analytes (or
combination) that exhibited the highest accuracy in discriminating TBDM from TB in the India and Brazil cohorts (A and C, respectively). Receiver
operator characteristics curves were employed to quantify the accuracy of single or combined biomarkers int the India and Brazil cohorts (B and D,
respectively).
DOI: https://doi.org/10.7554/eLife.46477.015
Kumar et al. eLife 2019;8:e46477. DOI: https://doi.org/10.7554/eLife.46477 10 of 19
Research article Immunology and Inflammation Microbiology and Infectious Disease

Biomarkers discriminating TBDM from TB over the course of TBtreatmentDecision tree analysis of plasma cytokine data was performed to identify those biomarkers that dif-
ferentiated TBDM from TB individuals with the highest accuracy and minimal numbers of markers,
which might reflect mechanistic differences between groups within the cohorts (Figure 5). At base-
line, IL-10 exhibited the strongest discriminating effect, with lower levels in the TBDM than the TB
groups in both the India and Brazil cohorts (Figure 5a and c, respectively). The patterns in the Indian
and Brazilian participants diverged at later time points. At month-2, lower IL-13 along with higher IL-
12p70 levels powered the difference between TBDM and TB in the India cohort. The pattern shifted
again at month-6 with higher levels of IL-4 and GM-CSF associating with TBDM. In contrast, IL-10
remained the strongest discriminating factor in the Brazil cohort at all time points evaluated, along
with lower IL-17A in the TB group at month-2 and lower IL-8 in the TB group month-6.
Receiver operating characteristic (ROC) analysis showed the single or combined cytokines that
accurately defined the difference between TBDM and TB in both cohorts at the three timepoints,
with area under the curves � 0.9577 and P values < 0.0001 (Figure 5b and d). The underlying bio-
logical mechanisms can only be inferred from the available data, but low baseline levels of the anti-
inflammatory cytokine IL-10 in TBDM comports with higher baseline levels of several pro-inflamma-
tory cytokines in that group (Sugimoto et al., 2016). Overall, the dynamic pattern demonstrated by
these results is consistent with prolonged inflammation and delayed relative rise in pro-resolving
cytokines (IL-10, IL-4, IL-13) (Ortega-Gomez et al., 2013) in the TBDM group.
Association of plasma cytokines with HbA1c and radiographic severityof TBA validated method for grading TB severity by chest x-ray interpretation was used to score images
obtained at baseline, month-6, and month-18 in the India cohort of TBDM and TB individuals
(Ralph et al., 2010). There was considerable individual variation at all timepoints but no statistically
significant difference in median radiographic scores between groups at any timepoint (Figure 6a).
Spearman correlation matrices were built to examine associations between the radiographic score
value at each time point, or the difference in score value between the indicated time points (fold var-
iation), and the individual plasma analyte levels in the entire cohort. The association of baseline
HbA1c with plasma analytes at each time point was also examined. As shown in Figure 6b, the
strongest associations identified were between plasma biomarkers at baseline with HbA1c, particu-
larly TNF-a, IL-2, IL-17F, and IL-1b (positive correlations) and IL-5 and IL-10 (negative correlations).
Biomarkers measured at month-6 remained strongly associated with the HbA1c measured at base-
line, but with shift from strong positive to weak negative correlation with IL-1 and from strong nega-
tive to moderate positive with IL-10. While some statistically significant correlations of radiographic
scores or change in radiographic score were identified, particularly with month-18 biomarker levels,
these were mostly moderate to weak correlations and did not demonstrate a consistent pattern or
trend. The number of analytes having significant correlation with baseline HbA1c by this analysis
changed from sixteen at baseline, to ten at month-6, and one only one (positive correlation with IL-
7) at month-8. Interestingly, IL-7 is known to maintain strong cellular immune responses for months,
in contrast to more short-lived responses to IL-2 (Lynch and Miller, 1994).
DiscussionIncreased circulating levels of numerous cytokines and growth factors, many linked to protective
immunity, typifies TBDM comorbidity at the time of TB diagnosis (Kumar et al., 2013a; Prada-
Medina et al., 2017; Restrepo et al., 2008). Our goal for the current study was to investigate longi-
tudinal trends in plasma levels of these mediators over the course of treatment for drug-sensitive
pulmonary TB in participants rigorously classified as diabetic or normoglycemic at baseline. Plasma
samples from two ongoing observational cohort studies, one in India and one in Brazil, were avail-
able for this investigation. Seventeen plasma mediators were measured by a combination of Luminex
and conventional ELISA. Results from baseline samples were consistent with the previously reported
hyper-inflammatory state of TB with concurrent DM prior to the initiation of ATT. Despite clinically
efficacious antimicrobial chemotherapy, we found that the hyperinflammatory profile of TBDM
Kumar et al. eLife 2019;8:e46477. DOI: https://doi.org/10.7554/eLife.46477 11 of 19
Research article Immunology and Inflammation Microbiology and Infectious Disease

participants persisted in both Indian and Brazil cohorts through the intensive phase of TB treatment
at two months and treatment completion at six months. Samples obtained from the India cohort one
year after treatment completion showed substantial overlap mediator levels between the TBDM and
Figure 6. Associations between radiographic scores, HbA1c, and systemic inflammatory profiles in the India
cohort. (A) Change in radiographic score values before and at the indicated timepoints after the initiation of
antimicrobial treatment for pulmonary TB. Dots represent individual participant values and horizontal lines indicate
median values. Values were compared between TBDM and normoglycemic TB groups using the Mann-Whitney U
test. (B–D). Spearman correlation matrices were built to examine associations between absolute radiographic
score values or difference in score values between the indicated timepoints (fold-variation) and the indicated
plasma analyte value at each study timepoint. The Spearman rank values are shown in a heatmap scale.
Statistically significant correlations (p<0.05) are highlighted in bold squares. Gray squares indicate significant
correlations after adjusting for false discovery rate (FDR 1%). Red dots represent positive correlations while blue
dots represent negative correlations.
DOI: https://doi.org/10.7554/eLife.46477.016
Kumar et al. eLife 2019;8:e46477. DOI: https://doi.org/10.7554/eLife.46477 12 of 19
Research article Immunology and Inflammation Microbiology and Infectious Disease
TB groups, consistent with eventual resolution of TB-related inflammation in the majority of TBDM
participants.
While TBDM was associated with higher levels of many plasma mediators compared to normogly-
cemic TB participants in the India and Brazil cohorts, lower IL-10 at baseline was the most important
parameter accounting for differences between the TBDM and TB groups. IL-10 is a key anti-inflam-
matory mediator, inhibiting the generation of diverse pro-inflammatory cytokines in myeloid and
lymphoid cells (Robb et al., 1985). Even in the absence of concurrent infection, hyperglycemia is
associated with a systemic inflammatory state characterized by elevated ratios of diverse pro-inflam-
matory cytokines to IL-10 in plasma (Butkowski and Jelinek, 2017). Hyporesponsiveness to IL-10
signaling is an additional factor contributing to chronic low-grade inflammation in type 2 DM
(Barry et al., 2016). A causal relationship between low IL-10 at baseline in TBDM and high levels of
pro-inflammatory cannot be established with the data available from our cohort study but there was
striking switch from relatively lower to higher IL-10 levels in TBDM following the initiation of ATT.
While low IL-10 is commonly associated with greater susceptibility to TB (Redford et al., 2011),
emerging evidence suggests that poorly controlled inflammation provides a host environment that
supports rather than limits Mtb replication (Mishra et al., 2017; Mishra et al., 2013).
Among the cytokines analyzed for this study, IL-4, IL-5, IL-10, IL-13, and TGF-b participate in the
resolution of infection-related pulmonary inflammation (Barbosa et al., 2006; Bosurgi et al., 2017;
Schett and Neurath, 2018). While there was some variation in the levels of specific analytes across
the cohorts, an overall trend for declining levels of pro-inflammatory mediators and increasing levels
of pro-resolving mediators was observed in the TBDM and TB groups alike. The data suggest that
DM comorbidity is associated with hyperinflammation prior to TB treatment, which resolves more
slowly than in normoglycemic TB but is not sustained indefinitely. Plasma cytokine elevation in DM is
restricted to the setting of active TB disease since Kumar et al. reported that ESAT-6 or CFP10 stim-
ulated CD4+ T cells from individuals with DM and latent TB infection have lower intracellular expres-
sion of Th1, Th2, and Th17 cytokines compared to T cells from latently infected normoglycemic
individuals (Kumar et al., 2016).
We speculate that the excessive and prolonged inflammation in TBDM comorbidity is driven by a
higher lung bacterial load stimulating innate and adaptive responses and/or a defect in counterregu-
lation intrinsic to the diabetic host that maintains inflammatory foci despite sterilizing antimicrobial
treatment. These hypotheses are not mutually exclusive. In support of the high bacterial burden
hypothesis, animal studies of the TBDM interaction consistently show higher plateau levels of Mtb
colony-forming units in the lung, along with quantitatively more pulmonary immune pathology and
elevated levels of pro-inflammatory cytokines compared to normoglycemic control animals with TB
(Martens et al., 2007; Podell et al., 2014). Clinical studies have variously reported higher sputum
smear and culture scores and greater radiographic severity in TBDM comorbidity, which constitute
crude surrogates for bacterial burden and immune pathology (Alavi et al., 2014; Jimenez-
Corona et al., 2013; Moreno-Martınez et al., 2015; Yoon et al., 2017). In the current study, bacte-
rial burden as reflected by sputum smear score was higher in TBDM than TB (Figure 1). In support
of an intrinsic propensity for hyperinflammatory responses in TBDM, naıve T cells from chronically
hyperglycemic mice were shown to have increased proliferation and production of a broad range of
cytokines following antigen-receptor activation; a phenotype attributed to basal chromatin decon-
densation (Martinez et al., 2014). Furthermore, impaired wound healing is common diabetic com-
plication that is due, in part, to impaired resolution of inflammation (Baltzis et al., 2014).
Our study had several limitations. While the cohorts providing clinical data and samples were
recruited for prospective longitudinal investigation, the projects were not initially designed for cross-
cohort comparison and radiographic scores and plasma samples from one year after TB treatment
completion were not available for the Brazil cohort. The sample sizes for these two cohorts was suffi-
cient for comparison of plasma analytes but underpowered for logistic regression. Higher median
BMI and higher representation of female sex in the Brazil cohort could account at least in part for
lower cytokine levels compared to the India cohort, although there was no difference in radiographic
severity of disease between the two cohorts overall and more cavitary TB in the Brazil cohort (Table 4
and Table 5). Finally, the normoglycemic TB arm of the EDOTS study featured high prevalence of
undernutrition that is an independent risk factor for adverse TB outcomes (Sinha et al., 2019). This
might account for the lack of differences in radiographic severity scores between the TBDM and TB
groups in the India cohort.
Kumar et al. eLife 2019;8:e46477. DOI: https://doi.org/10.7554/eLife.46477 13 of 19
Research article Immunology and Inflammation Microbiology and Infectious Disease

In conclusion, we found that individuals with TBDM comorbidity not only have heightened levels
of pro-inflammatory cytokines prior to ATT, but they maintain this state through the course of TB
treatment. The clinical significance of excessive and prolonged inflammation in TBDM comorbidity
stems from that observation that morbidity and mortality in pulmonary TB largely reflects the conse-
quences of immune-mediated lung damage (Ravimohan et al., 2018). On that basis, we predict that
pulmonary impairment after TB will be greater in patients with concurrent DM. We further speculate
that sustained inflammation contributes to increased risk for TB-related mortality that is associated
with DM (Reed et al., 2013). Matrix metalloproteinases (MMPs) are implicated in immune-mediated
lung matrix destruction in TB (Ong et al., 2014). The anti-diabetic drug metformin was reported to
exert a host-protective anti-inflammatory effect, including reduced MMP expression in normoglyce-
mic mice infected with Mtb by aerosol, and metformin is associated with reduced risk of cavitary TB
and mortality in people with concurrent DM by mechanisms that appear to be independent of any
effect on glycemic control (Degner et al., 2018; Singhal et al., 2014). We previously reported that
TBDM comorbidity is associated with higher plasma MMP levels compared to TB without DM, and
that TBDM patients using metformin had significantly lower MMP levels than those on anti-DM treat-
ment regimens without metformin (Kumar et al., 2018). Together, these observations suggest that
ant-inflammatory host-directed therapies, including metformin, may be particularly beneficial in the
large and growing population of TB patients with concurrent DM.
Materials and methods
Key resources table
Reagent type(species) or resource Designation
Sourceor reference Identifiers Additional information
Commercialassay or kit
Multiplex ELISA, Bio-PlexPro Human Cytokine17-plex Assay
Bio-Rad #m5000031yv
Ethics statementAll research presented here was conducted according to the principles expressed in the Declaration
of Helsinki. The India cohort study was approved by the Ethics Committee of the Prof. M. Viswana-
than Diabetes Research Centre (ECR/51/INST/TN/2013/MVDRC/01). The Brazil cohort study was
approved by the Ethics Committee of the Maternidade Climerio de Oliveira, Federal University of
Bahia (CAAE: 0115.0.054.000–09). Written informed consent was obtained from all participants at
both sites.
Indian study populationAdults (age 25–60 years) with newly diagnosed pulmonary TB disease were screened and enrolled in
the ongoing EDOTS study currently underway in Chennai, India (Kornfeld et al., 2016). Participants
with concurrent TB and DM (TBDM group) who reached the final study visit (month-18) were
selected sequentially for the present investigation of plasma samples and clinical data. The compari-
son group of normoglycemic EDOTS participants (TB group) was matched for age and sex as closely
as possible with the TBDM group. Exclusion criteria were: treatment for any prior episode of TB dis-
ease, more than 7 days treatment for the current TB episode, more than seven doses of a fluoroquin-
olone within 30 days, multi-drug resistant Mtb isolated at baseline pregnant or nursing, HIV-
seropositive, or taking immunosuppressive drugs. The diagnosis TB disease was established by posi-
tive sputum culture on solid media and compatible chest x-ray at baseline. Participants were classi-
fied as having DM by HbA1c � 6.5% for (for those with no known prior history of DM) plasma
glucose �200 mg/dL at 2 hr after 75 gm glucose challenge (American Diabetes Association, 2018).
Participants were classified as normoglycemic by plasma glucose <140 mg/dL at 2 hr after 75 gm
glucose challenge according to World Health Organization (WHO) criteria. Self-reported cigarette
and alcohol use was categorized as current, past, or never. A total of 43 TBDM and 44 TB partici-
pants were included in this study. Treatment for drug-sensitive TB disease was provided by govern-
ment clinics and staff of the Revised National Tuberculosis Control Program in Chennai.
Kumar et al. eLife 2019;8:e46477. DOI: https://doi.org/10.7554/eLife.46477 14 of 19
Research article Immunology and Inflammation Microbiology and Infectious Disease

Brazilian study populationSamples and clinical information used in the present study were selected from an ongoing project
performed at the Instituto Brasileiro para Investigacao da Tuberculose (IBIT, Brazilian Institute for TB
Investigation), Salvador, Bahia, Northeast Brazil. Samples were collected between June 2015 and
January 2018. For the current investigation, data from 26 TB patients with type-2 DM
(HbA1c � 6.5%) from whom cryopreserved plasma samples were available for the immunoassays at
month 0 (pre-ATT), month 2 and month 6 of therapy were selected. Additional TB patients without
DM (n = 25), matched by age, sex, BMI, smoking history and alcohol use were selected. Diagnosis of
TB at IBIT follows the guidelines of the Brazilian Society of Pulmonology and Tisiology (Conde et al.,
2009), which is similar to WHO recommendations. For the present study, TB diagnosis was per-
formed at IBIT’s microbiology referral laboratory as the following: three sputum smears were exam-
ined by fluorescence microscopy, processed by the modified Petroff’s method and cultured on
Lowenstein-Jensen medium. All patients were �18 years old, BCG-vaccinated, HIV-unexposed (con-
firmed with negative serology), had no prior diagnosis of TB, were diagnosed with DM at the time of
study enrollment, and were not taking DM drugs. Exclusion criteria were age <18 years, previous
diagnosis/treatment of TB or DM, self-reported pregnancy, and presence of psychiatric disease that
might hamper proper application of the clinical questionnaire. Alcohol use was assessed by CAGE
questionnaire, with alcoholism classified by positive responses to two or more questions
(Ewing, 1984).
Measurement of plasma mediatorsPlasma samples from both cohorts were purified and stored frozen at �80˚C prior to batch-wise
Luminex assays (Bio-Rad, Hercules, CA). The parameters analyzed were interferon-g (IFN-g), tumor
necrosis factor-a (TNF-a), interleukin (IL) 1-b (IL-1b), IL-2, IL-4, IL-5, IL-6, IL-7, IL-8,IL-10, IL-12p70, IL-
13, IL-17A), granulocyte colony-stimulating factor (G-CSF) and granulocyte macrophage colony-stim-
ulating factor (GM-CSF). Plasma levels of transforming growth factor-b1 (TGF-b; R and D Systems)
and IL-17F (BioLegend, San Diego, CA) were measured by ELISA.
Statistical analysisThe median values with interquartile ranges (IQR) were used as measures of central tendency. Fish-
er’s exact test was used to compare frequencies between the study groups. Continuous variables
were compared between the study groups using the Mann-Whitney U test (2-group comparisons),
or the Kruskall-Wallis test with Dunn’s multiple comparisons ad hoc test (between three or more
groups). Hierarchical cluster analyzes were performed using the Ward’s method with bootstrap
(100X) of z-score normalized values of soluble biomarkers. Dendograms represent Euclidean dis-
tance. A principal component analysis model using data on all the soluble biomarkers was per-
formed to compare and visualize the grouping between TBDM and TB. Fold Change Analysis of
TBDM patients versus TB patients of log2-transformed and t-test comparisons were performed with
the Benjamini–Hochberg false discovery rate (FDR) adjustment for multiple testing set at 1%. Deci-
sion trees were employed to identify a minimal set of targets allowing separation between the
TBDM from TB. This method analyzes all the phenotypic attributes and selects the most relevant
attributes that allow group classification (Fukutani et al., 2017). As input for tree construction, we
used data on all the markers. The J48 algorithm implemented in the WEKA program (Waikato Envi-
ronment for Knowledge Analysis, version 3.6.11, University of Waikato, New Zealand). To estimate
the classification accuracy of the decision tree models, we employed a 10-fold cross validation meth-
odology. The sensibility and specificity were measured from the confusion matrix, the receiver oper-
ating characteristic curve (ROC) and viewed in the scatter plot with the decision tree cutoffs.
Correlations were examined using the Spearman test. P value below 0�05 was considered statistically
significant after adjustments for multiple comparisons (FDR 1%). The statistical analyses were per-
formed using GraphPad Prism 7.0 (GraphPad Software, La Jolla, CA, USA), JMP 13.0 (SAS, Cary,
NC, USA), and R 3.5.1 (R Foundation, Vienna, Austria) programs.
Kumar et al. eLife 2019;8:e46477. DOI: https://doi.org/10.7554/eLife.46477 15 of 19
Research article Immunology and Inflammation Microbiology and Infectious Disease

AcknowledgementsThe authors thank the Greater Chennai Corporation, Dr. Senthil Kumar (City Health Officer), and Dr.
Lavanya J (RNTCP Program Officer) for permission to conduct the study in the TB Units of Chennai.
We also thank the health care workers at IBIT, Ms. Vanessa Nascimento and sDr. Nelia Araujo, and
Betania Nogueira for critical help in conducting the clinical study as well as Ms. Alice Andrade, Ms.
Jessica Rebolcas and Mrs. Hayna Malta, from Instituto Goncalo Moniz (FIOCRUZ), for logistics sup-
port with the laboratory work.
Additional information
Funding
Funder Grant reference number Author
CRDF Global USB1-31149-XX-13 Hardy KornfeldVijay Viswanathan
National Institutes of Health U01AI115940 Bruno B Andrade
Conselho Nacional de Desen-volvimento Cientıfico e Tecno-logico
Kiyoshi F FukutaniThabata Alves
Fundacao de Amparo a Pes-quisa do Estado da Bahia
Paulo S Silveira-Mattos
Coordenacao de Aperfeicoa-mento de Pessoal de NıvelSuperior
Kiyoshi F FukutaniBruno B Andrade
The funders had no role in study design, data collection and interpretation, or the
decision to submit the work for publication.
Author contributions
Nathella Pavan Kumar, Conceptualization, Investigation, Methodology, Writing—original draft,
Writing—review and editing; Kiyoshi F Fukutani, Conceptualization, Data curation, Software, Formal
analysis, Validation, Visualization, Writing—original draft; Basavaradhya S Shruthi, Data curation,
Investigation, Writing—original draft, Project administration; Thabata Alves, Data curation, Formal
analysis; Paulo S Silveira-Mattos, Data curation, Software, Formal analysis, Methodology; Michael S
Rocha, Investigation, Methodology; Kim West, Resources, Data curation, Project administration;
Mohan Natarajan, Data curation; Vijay Viswanathan, Conceptualization, Resources, Supervision,
Funding acquisition, Project administration; Subash Babu, Conceptualization, Supervision, Writing—
original draft, Project administration, Writing—review and editing; Bruno B Andrade,
Conceptualization, Resources, Software, Formal analysis, Supervision, Visualization, Writing—original
draft, Project administration, Writing—review and editing; Hardy Kornfeld, Conceptualization,
Supervision, Funding acquisition, Investigation, Methodology, Writing—original draft, Project
administration, Writing—review and editing
Author ORCIDs
Kim West http://orcid.org/0000-0002-5744-0280
Bruno B Andrade https://orcid.org/0000-0001-6833-3811
Hardy Kornfeld https://orcid.org/0000-0002-8970-7306
Ethics
Human subjects: All research presented here was conducted according to the principles expressed
in the Declaration of Helsinki. The Indian cohort study was approved by the Ethics Committee of the
Prof. M. Viswanathan Diabetes Research Centre (ECR/51/INST/TN/2013/MVDRC/01). The Brazilian
cohort study was approved by the Ethics Committee of the Maternidade Climerio de Oliveira, Fed-
eral University of Bahia (CAAE: 0115.0.054.000-09). Written informed consent was obtained from all
participants at both sites.
Kumar et al. eLife 2019;8:e46477. DOI: https://doi.org/10.7554/eLife.46477 16 of 19
Research article Immunology and Inflammation Microbiology and Infectious Disease
Decision letter and Author response
Decision letter https://doi.org/10.7554/eLife.46477.019
Author response https://doi.org/10.7554/eLife.46477.020
Additional files
Supplementary files. Source data 1. India Cohort.
DOI: https://doi.org/10.7554/eLife.46477.007
. Source data 2. Brazil Cohort.
DOI: https://doi.org/10.7554/eLife.46477.011
. Transparent reporting form
DOI: https://doi.org/10.7554/eLife.46477.017
Data availability
All data generated or analyzed during this study are included in the manuscript and supporting files.
Source data files have been provided for Figures 1 through 5.
ReferencesAlavi SM, Khoshkho MM, Salmanzadeh S, Eghtesad M. 2014. Comparison of epidemiological, clinical, laboratoryand radiological features of hospitalized diabetic and non-diabetic patients with pulmonary tuberculosis at razihospital in Ahvaz. Jundishapur Journal of Microbiology 7:e12447. DOI: https://doi.org/10.5812/jjm.12447,PMID: 25485064
American Diabetes Association. 2018. 2. classification and diagnosis of diabetes: Standards of Medical Care inDiabetes-2018. Diabetes Care 41:S13–S27. DOI: https://doi.org/10.2337/dc18-S002, PMID: 29222373
Baltzis D, Eleftheriadou I, Veves A. 2014. Pathogenesis and treatment of impaired wound healing in diabetesmellitus: new insights. Advances in Therapy 31:817–836. DOI: https://doi.org/10.1007/s12325-014-0140-x,PMID: 25069580
Barbosa T, Arruda S, Chalhoub M, Oliveira F, Melo JF, Fidelis R, Neto AN, Barbosa AA, Barral-Netto M. 2006.Correlation between interleukin-10 and in situ necrosis and fibrosis suggests a role for interleukin-10 in theresolution of the granulomatous response of tuberculous pleurisy patients. Microbes and Infection 8:889–897.DOI: https://doi.org/10.1016/j.micinf.2005.10.017, PMID: 16520077
Barry JC, Shakibakho S, Durrer C, Simtchouk S, Jawanda KK, Cheung ST, Mui AL, Little JP. 2016.Hyporesponsiveness to the anti-inflammatory action of interleukin-10 in type 2 diabetes. Scientific Reports 6:21244. DOI: https://doi.org/10.1038/srep21244, PMID: 26883847
Bosurgi L, Cao YG, Cabeza-Cabrerizo M, Tucci A, Hughes LD, Kong Y, Weinstein JS, Licona-Limon P, Schmid ET,Pelorosso F, Gagliani N, Craft JE, Flavell RA, Ghosh S, Rothlin CV. 2017. Macrophage function in tissue repairand remodeling requires IL-4 or IL-13 with apoptotic cells. Science 356:1072–1076. DOI: https://doi.org/10.1126/science.aai8132, PMID: 28495875
Butkowski EG, Jelinek HF. 2017. Hyperglycaemia, oxidative stress and inflammatory markers. Redox Report 22:257–264. DOI: https://doi.org/10.1080/13510002.2016.1215643, PMID: 28277069
Conde MB, Melo FA, Marques AM, Cardoso NC, Pinheiro VG, Dalcin PT, Machado Junior A, Lemos AC, NettoAR, Durovni B, Sant’Anna CC, Lima D, Capone D, Barreira D, Matos ED, Mello FC, David FC, Marsico G, AfiuneJB, Silva JR, et al. 2009. III brazilian thoracic association guidelines on tuberculosis. Jornal Brasileiro DePneumologia : Publicacao Oficial Da Sociedade Brasileira De Pneumologia E Tisilogia 35:1018–1048.DOI: https://doi.org/10.1590/s1806-37132009001000011, PMID: 19918635
Critchley JA, Restrepo BI, Ronacher K, Kapur A, Bremer AA, Schlesinger LS, Basaraba R, Kornfeld H, van CrevelR. 2017. Defining a research agenda to address the Converging Epidemics of Tuberculosis and Diabetes: Part1: Epidemiology and Clinical Management. Chest 152:165–173. DOI: https://doi.org/10.1016/j.chest.2017.04.155, PMID: 28434936
Degner NR, Wang JY, Golub JE, Karakousis PC. 2018. Metformin use reverses the increased mortality associatedwith diabetes mellitus during tuberculosis treatment. Clinical Infectious Diseases 66:198–205. DOI: https://doi.org/10.1093/cid/cix819, PMID: 29325084
Ewing JA. 1984. Detecting alcoholism. The CAGE questionnaire. JAMA 252:1905–1907. DOI: https://doi.org/10.1001/jama.252.14.1905, PMID: 6471323
Fukutani KF, Kasprzykowski JI, Paschoal AR, Gomes MS, Barral A, de Oliveira CI, Ramos PIP, de Queiroz ATL.2017. Meta-Analysis of aedes aegypti Expression Datasets: Comparing Virus Infection and Blood-FedTranscriptomes to Identify Markers of Virus Presence. Frontiers in Bioengineering and Biotechnology 5:84.DOI: https://doi.org/10.3389/fbioe.2017.00084, PMID: 29376049
Kumar et al. eLife 2019;8:e46477. DOI: https://doi.org/10.7554/eLife.46477 17 of 19
Research article Immunology and Inflammation Microbiology and Infectious Disease
Giacco F, Brownlee M. 2010. Oxidative stress and diabetic complications. Circulation Research 107:1058–1070.DOI: https://doi.org/10.1161/CIRCRESAHA.110.223545, PMID: 21030723
Jimenez-Corona ME, Cruz-Hervert LP, Garcıa-Garcıa L, Ferreyra-Reyes L, Delgado-Sanchez G, Bobadilla-Del-Valle M, Canizales-Quintero S, Ferreira-Guerrero E, Baez-Saldana R, Tellez-Vazquez N, Montero-Campos R,Mongua-Rodriguez N, Martınez-Gamboa RA, Sifuentes-Osornio J, Ponce-de-Leon A. 2013. Association ofdiabetes and tuberculosis: impact on treatment and post-treatment outcomes. Thorax 68:214–220.DOI: https://doi.org/10.1136/thoraxjnl-2012-201756, PMID: 23250998
Kornfeld H, West K, Kane K, Kumpatla S, Zacharias RR, Martinez-Balzano C, Li W, Viswanathan V. 2016. Highprevalence and heterogeneity of diabetes in patients with TB in south India: a report from the effects ofdiabetes on tuberculosis severity (EDOTS) Study. Chest 149:1501–1508. DOI: https://doi.org/10.1016/j.chest.2016.02.675, PMID: 26973015
Kumar NP, Sridhar R, Banurekha VV, Jawahar MS, Fay MP, Nutman TB, Babu S. 2013a. Type 2 diabetes mellituscoincident with pulmonary tuberculosis is associated with heightened systemic type 1, type 17, and otherproinflammatory cytokines. Annals of the American Thoracic Society 10:441–449. DOI: https://doi.org/10.1513/AnnalsATS.201305-112OC, PMID: 23987505
Kumar NP, Sridhar R, Banurekha VV, Jawahar MS, Nutman TB, Babu S. 2013b. Expansion of pathogen-specificT-helper 1 and T-helper 17 cells in pulmonary tuberculosis with coincident type 2 diabetes mellitus. The Journalof Infectious Diseases 208:739–748. DOI: https://doi.org/10.1093/infdis/jit241, PMID: 23715661
Kumar NP, Moideen K, George PJ, Dolla C, Kumaran P, Babu S. 2016. Coincident diabetes mellitus modulatesTh1-, Th2-, and Th17-cell responses in latent tuberculosis in an IL-10- and TGF-b-dependent manner. EuropeanJournal of Immunology 46:390–399. DOI: https://doi.org/10.1002/eji.201545973, PMID: 26518995
Kumar NP, Moideen K, Viswanathan V, Shruthi BS, Sivakumar S, Menon PA, Kornfeld H, Babu S. 2018. Elevatedlevels of matrix metalloproteinases reflect severity and extent of disease in tuberculosis-diabetes co-morbidityand are predominantly reversed following standard anti-tuberculosis or metformin treatment. BMC InfectiousDiseases 18:345. DOI: https://doi.org/10.1186/s12879-018-3246-y, PMID: 30045688
Lynch DH, Miller RE. 1994. Interleukin 7 promotes long-term in vitro growth of antitumor cytotoxic Tlymphocytes with immunotherapeutic efficacy in vivo. Journal of Experimental Medicine 179:31–42.DOI: https://doi.org/10.1084/jem.179.1.31, PMID: 8270874
Martens GW, Arikan MC, Lee J, Ren F, Greiner D, Kornfeld H. 2007. Tuberculosis susceptibility of diabetic mice.American Journal of Respiratory Cell and Molecular Biology 37:518–524. DOI: https://doi.org/10.1165/rcmb.2006-0478OC, PMID: 17585110
Martinez N, Vallerskog T, West K, Nunes-Alves C, Lee J, Martens GW, Behar SM, Kornfeld H. 2014. Chromatindecondensation and T cell hyperresponsiveness in diabetes-associated hyperglycemia. The Journal ofImmunology 193:4457–4468. DOI: https://doi.org/10.4049/jimmunol.1401125, PMID: 25246495
Martinez N, Kornfeld H. 2014. Diabetes and immunity to tuberculosis. European Journal of Immunology 44:617–626. DOI: https://doi.org/10.1002/eji.201344301, PMID: 24448841
Mishra BB, Rathinam VA, Martens GW, Martinot AJ, Kornfeld H, Fitzgerald KA, Sassetti CM. 2013. Nitric oxidecontrols the immunopathology of tuberculosis by inhibiting NLRP3 inflammasome-dependent processing of IL-1b. Nature Immunology 14:52–60. DOI: https://doi.org/10.1038/ni.2474, PMID: 23160153
Mishra BB, Lovewell RR, Olive AJ, Zhang G, Wang W, Eugenin E, Smith CM, Phuah JY, Long JE, Dubuke ML,Palace SG, Goguen JD, Baker RE, Nambi S, Mishra R, Booty MG, Baer CE, Shaffer SA, Dartois V, McCormickBA, et al. 2017. Nitric oxide prevents a pathogen-permissive granulocytic inflammation during tuberculosis.Nature Microbiology 2:17072. DOI: https://doi.org/10.1038/nmicrobiol.2017.72, PMID: 28504669
Moreno-Martınez A, Casals M, Orcau A, Gorrindo P, Masdeu E, Cayla JA, TB Diabetes Working Group of theBarcelona TB Investigation Unit. 2015. Factors associated with diabetes mellitus among adults with tuberculosisin a large European City, 2000-2013. The International Journal of Tuberculosis and Lung Disease 19:1507–1512.DOI: https://doi.org/10.5588/ijtld.15.0102, PMID: 26614193
Ong CW, Elkington PT, Friedland JS. 2014. Tuberculosis, pulmonary cavitation, and matrix metalloproteinases.American Journal of Respiratory and Critical Care Medicine 190:9–18. DOI: https://doi.org/10.1164/rccm.201311-2106PP, PMID: 24713029
Ortega-Gomez A, Perretti M, Soehnlein O. 2013. Resolution of inflammation: an integrated view. EMBOMolecular Medicine 5:661–674. DOI: https://doi.org/10.1002/emmm.201202382, PMID: 23592557
Podell BK, Ackart DF, Obregon-Henao A, Eck SP, Henao-Tamayo M, Richardson M, Orme IM, Ordway DJ,Basaraba RJ. 2014. Increased severity of tuberculosis in guinea pigs with type 2 diabetes: a model of diabetes-tuberculosis comorbidity. The American Journal of Pathology 184:1104–1118. DOI: https://doi.org/10.1016/j.ajpath.2013.12.015, PMID: 24492198
Prada-Medina CA, Fukutani KF, Pavan Kumar N, Gil-Santana L, Babu S, Lichtenstein F, West K, Sivakumar S,Menon PA, Viswanathan V, Andrade BB, Nakaya HI, Kornfeld H. 2017. Systems immunology of Diabetes-Tuberculosis comorbidity reveals signatures of disease complications. Scientific Reports 7:1999. DOI: https://doi.org/10.1038/s41598-017-01767-4, PMID: 28515464
Ralph AP, Ardian M, Wiguna A, Maguire GP, Becker NG, Drogumuller G, Wilks MJ, Waramori G, Tjitra E,Sandjaja, Kenagalem E, Pontororing GJ, Anstey NM, Kelly PM. 2010. A simple, valid, numerical score forgrading chest x-ray severity in adult smear-positive pulmonary tuberculosis. Thorax 65:863–869. DOI: https://doi.org/10.1136/thx.2010.136242, PMID: 20861290
Ravimohan S, Kornfeld H, Weissman D, Bisson GP. 2018. Tuberculosis and lung damage: from epidemiology topathophysiology. European Respiratory Review 27:170077. DOI: https://doi.org/10.1183/16000617.0077-2017,PMID: 29491034
Kumar et al. eLife 2019;8:e46477. DOI: https://doi.org/10.7554/eLife.46477 18 of 19
Research article Immunology and Inflammation Microbiology and Infectious Disease
Redford PS, Murray PJ, O’Garra A. 2011. The role of IL-10 in immune regulation during M. tuberculosis infection.Mucosal Immunology 4:261–270. DOI: https://doi.org/10.1038/mi.2011.7, PMID: 21451501
Reed GW, Choi H, Lee SY, Lee M, Kim Y, Park H, Lee J, Zhan X, Kang H, Hwang S, Carroll M, Cai Y, Cho SN,Barry CE, Via LE, Kornfeld H. 2013. Impact of diabetes and smoking on mortality in tuberculosis. PLOS ONE 8:e58044. DOI: https://doi.org/10.1371/journal.pone.0058044, PMID: 23469139
Restrepo BI, Fisher-Hoch SP, Pino PA, Salinas A, Rahbar MH, Mora F, Cortes-Penfield N, McCormick JB. 2008.Tuberculosis in poorly controlled type 2 diabetes: altered cytokine expression in peripheral white blood cells.Clinical Infectious Diseases 47:634–641. DOI: https://doi.org/10.1086/590565, PMID: 18652554
Robb RJ, Mayer PC, Garlick R. 1985. Retention of biological activity following radioiodination of humaninterleukin 2: comparison with biosynthetically labeled growth factor in receptor binding assays. Journal ofImmunological Methods 81:15–30. DOI: https://doi.org/10.1016/0022-1759(85)90118-8, PMID: 3926900
Schett G, Neurath MF. 2018. Resolution of chronic inflammatory disease: universal and tissue-specific concepts.Nature Communications 9:3261. DOI: https://doi.org/10.1038/s41467-018-05800-6, PMID: 30111884
Singhal A, Jie L, Kumar P, Hong GS, Leow MK, Paleja B, Tsenova L, Kurepina N, Chen J, Zolezzi F, Kreiswirth B,Poidinger M, Chee C, Kaplan G, Wang YT, De Libero G. 2014. Metformin as adjunct antituberculosis therapy.Science Translational Medicine 6:263ra159. DOI: https://doi.org/10.1126/scitranslmed.3009885,PMID: 25411472
Sinha P, Davis J, Saag L, Wanke C, Salgame P, Mesick J, Horsburgh CR, Hochberg NS. 2019. Undernutrition andtuberculosis: public health implications. The Journal of Infectious Diseases 219:1356–1363. DOI: https://doi.org/10.1093/infdis/jiy675, PMID: 30476125
Sugimoto MA, Sousa LP, Pinho V, Perretti M, Teixeira MM. 2016. Resolution of inflammation: what controls itsonset? Frontiers in Immunology 7:160. DOI: https://doi.org/10.3389/fimmu.2016.00160, PMID: 27199985
Suzana S, Shanmugam S, Uma Devi KR, Swarna Latha PN, Michael JS. 2017. Spoligotyping of Mycobacteriumtuberculosis isolates at a tertiary care hospital in India. Tropical Medicine & International Health 22:703–707.DOI: https://doi.org/10.1111/tmi.12875, PMID: 28374900
Thacher TD, Clarke BL. 2011. Vitamin D insufficiency. Mayo Clinic Proceedings 86:50–60. DOI: https://doi.org/10.4065/mcp.2010.0567, PMID: 21193656
Vasconcellos SE, Acosta CC, Gomes LL, Conceicao EC, Lima KV, de Araujo MI, Leite ML, Tannure F, Caldas PC,Gomes HM, Santos AR, Gomgnimbou MK, Sola C, Couvin D, Rastogi N, Boechat N, Suffys PN. 2014. Strainclassification of Mycobacterium tuberculosis isolates in Brazil based on genotypes obtained by spoligotyping,mycobacterial interspersed repetitive unit typing and the presence of large sequence and single nucleotidepolymorphism. PLOS ONE 9:e107747. DOI: https://doi.org/10.1371/journal.pone.0107747, PMID: 25314118
WHO Expert Consultation. 2004. Appropriate body-mass index for Asian populations and its implications forpolicy and intervention strategies. The Lancet 363:157–163. DOI: https://doi.org/10.1016/S0140-6736(03)15268-3
Yoon YS, Jung JW, Jeon EJ, Seo H, Ryu YJ, Yim JJ, Kim YH, Lee BH, Park YB, Lee BJ, Kang H, Choi JC. 2017.The effect of diabetes control status on treatment response in pulmonary tuberculosis: a prospective study.Thorax 72:263–270. DOI: https://doi.org/10.1136/thoraxjnl-2015-207686, PMID: 27553224
Kumar et al. eLife 2019;8:e46477. DOI: https://doi.org/10.7554/eLife.46477 19 of 19
Research article Immunology and Inflammation Microbiology and Infectious Disease