The effects of display size on performance - Ben D. Sawyer
18
The effects of display size on performance P.A. Hancock*, B.D. Sawyer and S. Stafford MIT 2 Laboratory, University of Central Florida, 4000 Central Florida Boulevard, Orlando, FL 32816, USA (Received 6 June 2014; accepted 29 September 2014) We examined the systematic effects of display size on task performance as derived from a standard perceptual and cognitive test battery. Specifically, three experiments examined the influence of varying viewing conditions on response speed, response accuracy and subjective workload at four differing screen sizes under three different levels of time pressure. Results indicated a ubiquitous effect for time pressure on all facets of response while display size effects were contingent upon the nature of the viewing condition. Thus, performance decrement and workload elevation were evident only with the smallest display size under the two most restrictive levels of time pressure. This outcome generates a lower boundary threshold for display screen size for this order of task demand. Extrapolations to the design and implementation of all display sizes and forms of cognitive and psychomotor demand are considered. Practitioner Summary: This work specifies the effect of display size on operator performance. It presents a threshold for an acceptable level of response time and accuracy contingent upon time pressure imposed and display size presented. The procedure provides vital information for all future designers and users of displays. Keywords: display size; time pressure; response capacity; speed; accuracy Introduction Display size and its influences on operator performance have long been of ergonomic concern and relevance to a wide variety of application domains (e.g. see, Alluisi 1955; U.S. Armed Forces 1950). Since these early investigations however, the numbers of, and differing forms of displays, have grown at an almost exponential rate in our contemporary society (DeGusta 2012). It is now becoming ever more difficult in both the developed and developing worlds to find circumstances in which visual displays do not play a critical role in both work and leisure. Displays permeate our lives in areas as diverse as commercial systems, transportation, military operations, industrial control, health care, entertainment as well as the handheld devices which characterise modern personal life. In light of this ubiquity, as well as the associated costs of such displays, our current experimental goal was to evaluate the effects of the size of the visual display on the capacity of individuals to respond speedily and accurately to representative task demands. We anticipate that our results might be used to provide design guidelines to specify trade-offs concerning display size and resultant performance so as to meet the needs of designers, manufacturers, engineers and eventually all end-users of such technologies (see also e.g. Boff, Kaufman, and Thomas 1986). Larger displays are often considered beneficial but they are clearly not always better (and see Czerwinski, Smith, et al. 2003). From a simple utilitarian perspective, larger screens are most often heavier and have a greater physical footprint which necessitates more operational workspace and power. While larger screens may give an advantage through capacities for increased detection of targets (e.g. screening for weapons in luggage), smaller screens are portable and more easily manipulated by a single user. Large displays allow for social groups to view a single screen simultaneously (e.g. stadia screens at sporting events) and thus they provide a common view across a large audience (Guimbretiere, Stone, and Winograd 2001), but smaller screens provide much greater privacy. As a result, there are immediate and evident macro- level trade-offs concerning screen size which are independent of the sorts of variations in micro-level task response capacity that we investigated empirically here. In respect of performance trade-offs, Tan et al. (2006) for example found that large displays improved response capacity on the Guilford and Zimmerman task (Guilford 1948). The difference between the display sizes they used were quite extreme with the comparison consisting of a 76 inch by 57 inch projection screen versus a 14 inch by 10.5 inch desktop display. While this observation is important, such pairwise point comparisons fall short of providing a full functional relationship between size, viewing condition and performance variation which is the primary goal of our present sequence of experiments. Among many interested parties, display designers want to know at what display size do performance gains become advantageous enough to allow for an increase in foot print. For example, could a smaller 30 by 20 inch display offer the q 2014 Taylor & Francis *Corresponding author. Email: [email protected] TERG 973914—16/12/2014—MANIVANNAN.E—497143———Style 2 Ergonomics, 2014 Vol. 00, No. 0, 1–18, http://dx.doi.org/10.1080/00140139.2014.973914 1 2 3 4 5 6 7 8 9 10 11 12 13 14 15 16 17 18 19 20 21 22 23 24 25 26 27 28 29 30 31 32 33 34 35 36 37 38 39 40 41 42 43 44 45 46 47 48 49 50 51 52 53 54 55
-
Upload
khangminh22 -
Category
Documents
-
view
0 -
download
0
Transcript of The effects of display size on performance - Ben D. Sawyer

The effects of display size on performance
P.A. Hancock*, B.D. Sawyer and S. Stafford
MIT2 Laboratory, University of Central Florida, 4000 Central Florida Boulevard, Orlando, FL 32816, USA
(Received 6 June 2014; accepted 29 September 2014)
We examined the systematic effects of display size on task performance as derived from a standard perceptual and cognitivetest battery. Specifically, three experiments examined the influence of varying viewing conditions on response speed,response accuracy and subjective workload at four differing screen sizes under three different levels of time pressure.Results indicated a ubiquitous effect for time pressure on all facets of response while display size effects were contingentupon the nature of the viewing condition. Thus, performance decrement and workload elevation were evident only with thesmallest display size under the two most restrictive levels of time pressure. This outcome generates a lower boundarythreshold for display screen size for this order of task demand. Extrapolations to the design and implementation of all displaysizes and forms of cognitive and psychomotor demand are considered.
Practitioner Summary: This work specifies the effect of display size on operator performance. It presents a threshold for anacceptable level of response time and accuracy contingent upon time pressure imposed and display size presented. Theprocedure provides vital information for all future designers and users of displays.
Keywords: display size; time pressure; response capacity; speed; accuracy
Introduction
Display size and its influences on operator performance have long been of ergonomic concern and relevance to a wide
variety of application domains (e.g. see, Alluisi 1955; U.S. Armed Forces 1950). Since these early investigations however,
the numbers of, and differing forms of displays, have grown at an almost exponential rate in our contemporary society
(DeGusta 2012). It is now becoming ever more difficult in both the developed and developing worlds to find circumstances
in which visual displays do not play a critical role in both work and leisure. Displays permeate our lives in areas as diverse
as commercial systems, transportation, military operations, industrial control, health care, entertainment as well as the
handheld devices which characterise modern personal life. In light of this ubiquity, as well as the associated costs of such
displays, our current experimental goal was to evaluate the effects of the size of the visual display on the capacity of
individuals to respond speedily and accurately to representative task demands. We anticipate that our results might be used
to provide design guidelines to specify trade-offs concerning display size and resultant performance so as to meet the needs
of designers, manufacturers, engineers and eventually all end-users of such technologies (see also e.g. Boff, Kaufman, and
Thomas 1986).
Larger displays are often considered beneficial but they are clearly not always better (and see Czerwinski, Smith, et al.
2003). From a simple utilitarian perspective, larger screens are most often heavier and have a greater physical footprint
which necessitates more operational workspace and power. While larger screens may give an advantage through capacities
for increased detection of targets (e.g. screening for weapons in luggage), smaller screens are portable and more easily
manipulated by a single user. Large displays allow for social groups to view a single screen simultaneously (e.g. stadia
screens at sporting events) and thus they provide a common view across a large audience (Guimbretiere, Stone, and
Winograd 2001), but smaller screens provide much greater privacy. As a result, there are immediate and evident macro-
level trade-offs concerning screen size which are independent of the sorts of variations in micro-level task response capacity
that we investigated empirically here. In respect of performance trade-offs, Tan et al. (2006) for example found that large
displays improved response capacity on the Guilford and Zimmerman task (Guilford 1948). The difference between the
display sizes they used were quite extreme with the comparison consisting of a 76 inch by 57 inch projection screen versus a
14 inch by 10.5 inch desktop display. While this observation is important, such pairwise point comparisons fall short of
providing a full functional relationship between size, viewing condition and performance variation which is the primary
goal of our present sequence of experiments.
Among many interested parties, display designers want to know at what display size do performance gains become
advantageous enough to allow for an increase in foot print. For example, could a smaller 30 by 20 inch display offer the
q 2014 Taylor & Francis
*Corresponding author. Email: [email protected]
TERG 973914—16/12/2014—MANIVANNAN.E—497143———Style 2
Ergonomics, 2014
Vol. 00, No. 0, 1–18, http://dx.doi.org/10.1080/00140139.2014.973914
1
2
3
4
5
6
7
8
9
10
11
12
13
14
15
16
17
18
19
20
21
22
23
24
25
26
27
28
29
30
31
32
33
34
35
36
37
38
39
40
41
42
43
44
45
46
47
48
49
50
51
52
53
54
55

same performance advantages to the projection display used in Tan et al.’s (2006) procedure? So, for design purposes we
need to understand exactly how such performance changes across a representative range of display sizes. For example, if we
were to presume that a user needs a mobile display for a critical task, we might agree that the appropriate size lies
somewhere between a PDA and a small desktop-sized monitor. We might presume this choice depends on distance to the
screen in addition to factors such as the type of task and type of information to be displayed on the screen. Such performance
trade-off curves can only be established via controlled multiple display size evaluations.
Any such decision concerning display size must take into account performance assessment, but it also needs some
comprehension of the physical, perceptual and cognitive capabilities of each individual male and female user as well as the
physical limitations of the work/operational environment (e.g. specific operational dimensions). Other practical
considerations include the power consumption of the display as well as its weight and durability, among many other
technical considerations. Therefore, display size selection from both an engineering and behavioural perspective, is all a
matter of trade-offs. We must also remain constantly cognizant of the problem of technological innovation since differing
display types are always evolving and constantly presenting new technical characteristics. Thus, we need to labour towards
a meta-level understanding of such trade-off issues using nomothetic approaches where possible to determine the precise
effects of these respective influential factors. This latter strategy permits the development of a descriptive relationship
which can be used to assess various interactive influences regardless of changes in individual display technology.
To accomplish this goal, we must start from known nomothetic effects.
Nomothetic effects
In perhaps the most important of these general laws we find that the ‘law of visual angle’ posits that an increase or decrease
in viewing angle must be accompanied by a proportional increase or decrease in the dimensions of display and thus
maintain a constant visual angle (Churchill 1959). An even earlier work (Holoway and Boring 1941) emphasised the
crucial need in these circumstances to understand the difference between what was referred to as the ‘true’ versus the
‘phenomenal’ dimension of the display. By ‘true’ they meant the actual physical measurement of the display itself, no
matter what the distance between the display and the observer. Such physical specifications remain constant regardless of
variations in the viewing distance or viewing angle adopted by any viewer. This concern anticipates but replicates what
Hancock and Warm (1989) referred to generally as the ‘input’ form of demand of any information source; that is, the
engineering determination of the ambient environment. In contrast, ‘phenomenal’ size indicates how large an observer
perceives the display to be. From the phenomenal viewpoint, a wall-sized projection at great distance could appear to be the
equivalent of a 12 inch display held in the hand. Since individuals adapt their viewing habits to make themselves most
comfortable, information as to this ‘adaptive’ behaviour is most telling. That phenomenal display size was at least as
influential, if not more important than the visual angle subtended was postulated and subsequently supported by early HF/E
researchers such as Alluisi (1955).
Our knowledge of the eye’s anatomy helps to explain why this law of visual angle rarely creates linear performance
changes with increases in display size over a distance. Such non-linearity results from several factors which can include, but
are not limited to, the amount of light that reaches the eye as well as the resting state of visual accommodation (see Hubel
and Wiesel 2005; Boff, Kaufman, and Thomas 1986). At resting accommodation, an observer acts to reduce their intrinsic
eye strain by relaxing eye muscles thereby reducing tension on the lens. This resting accommodation is widely reported to
be at 30 inches, and is measured when the eyes have nothing to focus on (e.g. are in complete darkness). However, as
participants focus on objects which are either closer to or further from this resting accommodation, the ciliary muscles
adjust beyond their relaxed state. It can be argued that a distant display requires more muscular innervation on behalf of the
ocular muscles (e.g. manipulation of the lens via the ciliary muscles) than a display at 30 inches regardless, within reason of
course, of their respective size. This cost of accommodation is thus a potential confound of any experiment which seeks to
investigate multiple viewing distances.
Fatigue of these self-same ocular muscles can also have lasting effects when combined with the uncontrolled viewing
conditions (e.g. free head movement or ‘phenomenal’ distance) which are often afforded in the real world (Lin et al. 1998).
For example, reading a textbook at 15 inches for a number of hours will fatigue the muscles of the eye such that subsequent
participation in a video-game shortly after will show a strong performance decrement as compared with, for example, a
video game being played by an individual who only read for five minutes. The same is true for an operator in the field who
for example, controls a UAV on a 3-inch display at distance of 15 inches over the course of a three-hour mission or an
everyday individual spending three hours reading on their PDA on an airline flight. Therefore, our considerations here
embrace not only the immediate task at hand, but also any subsequent tasks which follow upon prior exposure. Thus,
designers who are naturally concerned with immediate demands, must also consider the potential for subsequent negative
transfer, as may well occur now with the use of so many contemporary handheld displays.
[AQ1]
[AQ2]
[AQ3]
TERG 973914—16/12/2014—MANIVANNAN.E—497143———Style 2
P.A. Hancock et al.2
56
57
58
59
60
61
62
63
64
65
66
67
68
69
70
71
72
73
74
75
76
77
78
79
80
81
82
83
84
85
86
87
88
89
90
91
92
93
94
95
96
97
98
99
100
101
102
103
104
105
106
107
108
109
110

Compounding fatigue effects, power-saving strategies in portable displays can mean a significant decrease in both
brightness and contrast. Users may therefore bring the visual display closer to their eye point or go through elaborate spatial
manipulation of the display to help maximise visibility. Also, the effect of ambient lighting plays a role on information
assimilation from such displays. Environmental light sources as well as resultant glare can drive adaptive behaviours that
can be stressful, costly and/or induce maladaptive levels of workload (see Hancock and Warm 1989). For example, an
observer perusing a 3-inch display approximately 14 inches from their eyes might well look to create a ‘blocking’ effect of
some of the surrounding ambient light sources (i.e. interpose the display between the light and their eyes). The magnitude of
this blocking effect depends, of course, on the location and intensity of such light sources in relation to the observer and
display. A 3-inch display at viewing distance of 14 inches might not allow for a direct view of an overhead competing light
source located approximately three feet above the observer and one foot behind the observer’s point of view. As observers
increase their viewing distance to a larger display in order to create the same visual angle, their adjusted viewpoint then
allows for this overhead light source to clearly infringe upon their field of view. This induces greater problems as the
additional light source(s) increase in intensity. It is also possible that the now revealed overhead light may cause a shift in
attention towards it, resulting in a performance decrement purely from distracted attention (and see also, Hancock,
Mouloua, and Senders 2008). Also, viewer age here is a perennial concern. Thus, the full context of viewing is always of
critical concern.
Observers compensating for any sub-optimal viewing distance will tend to become stressed and eventually fatigued.
Consequently, understanding optimal display size/performance curves during the typical brief duration of laboratory
experiments can give only an understandably limited representation of the full chronic effects of such fixed displays that we
use in the real world. Visual angle manipulations require a change in distance and each such change in distance can produce
varying environmental and observer conditions. In order to control for these factors the introduction of initially stable
experimental conditions becomes of paramount importance.
Display characteristics
Modern digital displays are complex technologies. Thus, contemporary researchers have to consider many more variables
than their forebears when displays were realised through the use of transparency projections or other comparatively simple
analogue technologies. Relatively recent sources of variation include the resolution of a given screen, hardware pixel size,
spacing and pitch, colour reproduction and contrast ratio, to name just a few. The digital technologies used in the present
experiments may also soon be rendered obsolete by technical advances. However, we believe that the general principles
derived from our current procedures will remain useful and applicable even to practitioners and designers of future
envisioned displays.
Most display size experiments fail to report software and hardware resolutions together, but rather choose to report only
hardware resolution. This is a significant omission since uncertainty often lies in the diversity of software resolutions which
can be reproduced within any given hardware resolution. Further confusing matters, hardware resolution can describe the
capabilities of the display or monitor as well as the capabilities of the video co-processor or video card. For example, a
QXGA capable monitor with the potential 2048 £ 1536 pixel hardware resolution may be crippled by a video coprocessor
capable of only WXGA resolution at 1280 £ 800 pixel output. In varying contexts, both may be referred to as the
‘hardware’ resolution, although only the former display-based resolution represents the actual physical pixels that emit or
occlude light. The maximum possible hardware resolution is not necessarily indicative of the number of pixels delivered by
the software resolution of any particular application. Software can force a WXGA 1280 £ 800 hardware capable display to
use that resolution, or any lesser resolution; SVGA at 800 £ 600 for example. In this case, larger software pixels are
represented by grids of smaller hardware pixels Figure 1.
Just as each software pixel uses an area of hardware pixels combined, so individual boxlike structures in recent digital
camouflage patterns used by U.S. Armed Forces (Figure 2) combine by using large patches of potentially discreetly
coloured fabric threads. In both situations, a designer (programmer) has made the decision that the full potential fidelity of
the display is unnecessary to achieve the desired effect. The question becomes, what is the performance cost to the user in
using such large software pixels or by analogy, a larger display? Figure 3 shows three images of a dolphin using the same
number of software pixels. These images were modified in Adobe PhotoShop with images A and B set to a software pixel
count of 50 by 46 independent of the size of the image. In this case, image B would be using more hardware pixels on a
screen per software pixel than image A. It could be argued image A is more efficient and reflects a homeomorphic 1
hardware pixel to 1 software pixel count. Display designers often refer to this as the ‘native resolution’ of a display. Image C
represents the use of approximately 165 £ 197 software pixels. The implications for cue detection here are obvious.
Unfortunately, there are few display size studies that account for such software and hardware driven display resolution
issues. In one particularly interesting study of math and verbal scores, a 17 inch 1024 £ 768 display always outperformed a
[AQ4]
[AQ5]
TERG 973914—16/12/2014—MANIVANNAN.E—497143———Style 2
Ergonomics 3
111
112
113
114
115
116
117
118
119
120
121
122
123
124
125
126
127
128
129
130
131
132
133
134
135
136
137
138
139
140
141
142
143
144
145
146
147
148
149
150
151
152
153
154
155
156
157
158
159
160
161
162
163
164
165

17 inch 640 £ 480 display, while a 15 inch 640 £ 480 display occasionally outperformed the 17 inch 640 £ 480 display.
This led the authors to concede that resolution may potentially be more important than size per se (Bridgeman, Lennon, and
Jackenthal 2003). Evidence for increased performance using high software resolution counts on equivalent size hardware
displays can be found in a series of studies repeated by de Bruijin and van Oostendorp (1992) as well as Dillon and
Figure 1. Display (A) at 24 inches and (B) at 50 inches both subtend the same visual angle. Despite this, the display at 24 inches mayexert a greater ‘looming’ effect by seeming perceptually larger.
MonoPrint;
ColourOnline
Figure 2. U.S. Armed Forces Digital Patterns for Fatigues eschew the potential resolution of individual threads in favour of a courserpattern that is effective for the intended purpose. In the same way programmers may choose a resolution lower than the hardware potentialof a display in order to conserve computing resources or simplify design.
Figure 3. A is displayed at pixel count of 50 by 46, as is B at a larger size. B represents an image using more hardware pixels persoftware pixel than image A, but with no greater resolution. C is displayed at a pixel count of 165 £ 197 pixels.
TERG 973914—16/12/2014—MANIVANNAN.E—497143———Style 2
P.A. Hancock et al.4
166
167
168
169
170
171
172
173
174
175
176
177
178
179
180
181
182
183
184
185
186
187
188
189
190
191
192
193
194
195
196
197
198
199
200
201
202
203
204
205
206
207
208
209
210
211
212
213
214
215
216
217
218
219
220

McKnight (1990). However, more available pixels have other effects as well, essentially increasing the ability to display
more information no matter the actual display size. Bridgeman, Lennon, and Jackenthal (2003) pointed out that increased
screen size allows for more words per screen which may increase capacities such as test comprehension, causing increases
in performance not directly related to screen size increase per se but simply as a result of the length of the sentence available
for viewing without having to switch screens (i.e. a memory facilitation process; and see Ni, Bowman, and Chen 2006).
Finally, from a practical design perspective, higher software resolutions require more video processing and so may entail
more expensive components and higher power draw, having an impact on size, life, or cost of a device. In essence, macro-
level trade-offs bleed into micro-level performance trade-offs and vice versa.
With an understanding of hardware and software resolutions, we are now confronted with another potential confound
which concerns changing monitors when showing different display sizes. For example, in two readily available liquid
crystal display hardware, pixels sizes are 0.25mm (height and width) and 0.29mm (height and width). These noticeable
hardware pixel size differences could be a determinant of which display would be preferred by a participant, even when
performance might indicate otherwise. Hardware pixel size is referred to as dot-pitch and is widely unreported in display
size experiments when two different monitors are used. For example, researchers found that a display with the smaller
pixels was reported by participants as ‘looking sharper’ and preferable, an indication that resolution and sharpness of
hardware pixel size is an additional variable to be controlled directly (Cosenzo and Stafford 2007). A 0.25mm pixel
monitor will appear to the eye as having a sharper image than a 0.29mm monitor given that both images use the same
number of software and hardware pixels. This differentiation is similar to pixelation effect shown in Figure 1 and has been
studied as the so-called ‘jaggedness’ effect (Schenkman 2003). It is true that a 1600 £ 1200 2 0.25mm display will be
slightly smaller than a 1600 £ 1200 2 0.29mm display though not in a linear fashion because hardware manufactures also
manipulate the distance between pixels by varying between pixel degrees when using the different pixel dot-pitches.
Assessing distance between pixels is not an easy proposition and this metric is unlisted even in most technical manuals.
Other questions about screen size effects surround issues as to how colour, contrast and brightness characteristics each
affect performance. Many studies use different display types whenmanipulating screen size. A controlled shift in display size
using different monitors nearly always introduces potential changes in brightness, contrast, angle viewing and colour
capability. These changes are not trivial. For example, contrast shifts needed to detect a target varywith size (Blackwell 1946),
and the smaller the target, the greater the contrast difference needed for detection (Lamar et al. 1947). In some studies, focus
has been given to visual lighting factors. For example, a laborious calibration of brightness and contrast between the two vastly
different displays; a projection-based display anddesktop-based display, is described in the previously referenced study byTan
et al. (2006). They claimed to have eliminated the effects of colour, contrast ratio and brightness through use of colour
matching equipment and participant questionnaires regarding brightness levels. It is worth noting that another challenge to this
type of research is the rapid evolution and diversification of display technologies (see Ni, Schmidt, et al. 2006).
Tasks in display studies
Understanding what display size is beneficial for a specific type of task may well depend onrunning a complete and
controlled screen size study for each and every possible form of task. This is an empirical endeavour potentially without
end. Even when the performance curves related to display size are developed through careful, identifiable experimentation,
the need to account for input devices and the ergonomics of the display as it impacts the operator in their environment may
well be even more critical than the performance changes effected through screen size alone (Cosenzo and Stafford 2007). In
addition, critical to building a robust description of screen size effects is the need for studies with multiple display size
points including the commonly used displays available to the domains of interest (e.g. display sizes that could be used by all
individuals on the move, see Szalma et al. 2014).
One of the major difficulties of conducting a comprehensive and integrative analysis of the display size literature is the
use of varying and sometimes abstract tasks that have been employed as dependent measures. One of our current goals was
to use a readily available and well-validated set of tasks to explore the effects of screen size on performance. Furthermore,
we choose tasks that represented cognitive skills used by people in everyday settings as well as tasks that are employed in
professional and operational settings. The use of standardised cognitive batteries therefore represents a logical choice to
achieve this aim. Trade-offs in ease, accessibility and reliability of cognitive tasks meant that we used the Automated
Neurological Assessment Metric (ANAM; Harris, Hancock, and Harris 2005).
Research hypotheses
In respect to the foregoing observations, especially those concerning the large number of influential and interactive factors,
we sought here to focus our efforts on two essential dimensions; namely display size, holding as many of the cited variables
[AQ6]
[AQ7]
[AQ8]
[AQ9]
TERG 973914—16/12/2014—MANIVANNAN.E—497143———Style 2
Ergonomics 5
221
222
223
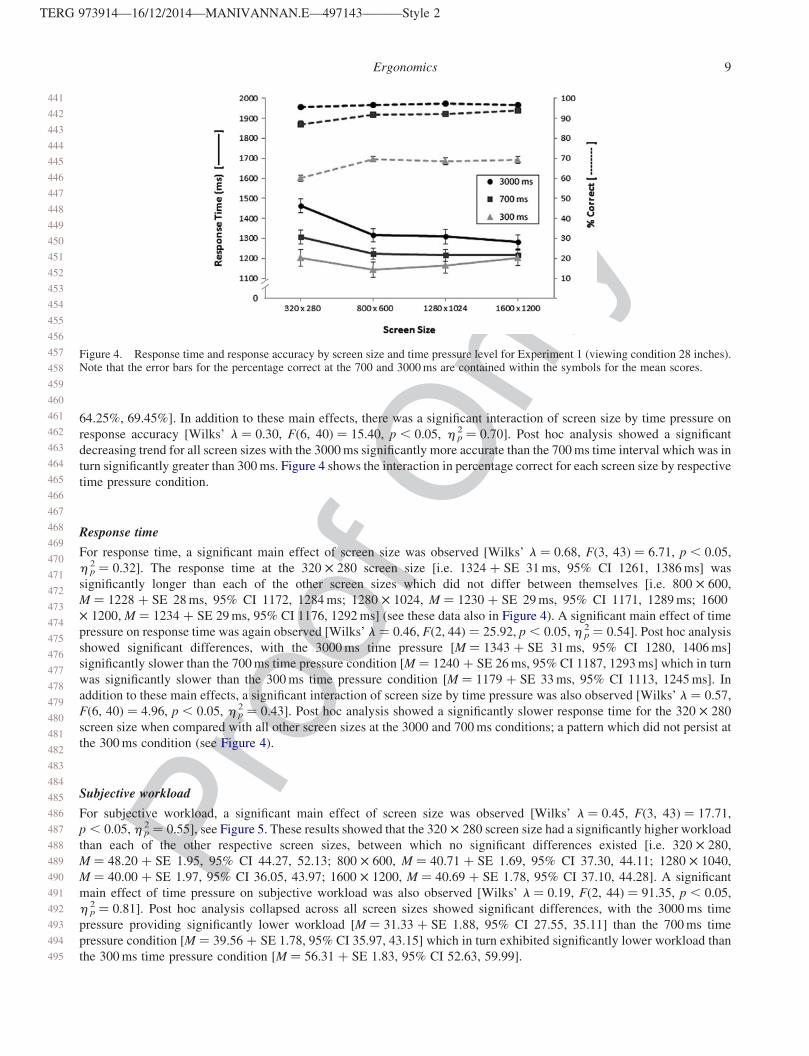
224
225
226
227
228
229
230
231
232
233
234
235
236
237
238
239
240
241
242
243
244
245
246
247
248
249
250
251
252
253
254
255
256
257
258
259
260
261
262
263
264
265
266
267
268
269
270
271
272
273
274
275

constant as is feasible, and the time window for response. The latter was explicitly identified since in almost all tasks there is
either an obligatory response window or an implicit time horizon for successful performance. In consequence, our
hypotheses here were as follows. First, that screen size would systematically affect the speed of operator response and the
subsequent accuracy of that response. Furthermore, as a codicil to this primary hypothesis, we anticipated that increasing
screen size would be accompanied by indications of reduced cognitive effort as reflected in subjective workload response.
Our second hypothesis focused directly upon the temporal dimension. We expected that imposed time pressure would also
exert systematic effects on both objective performance and subjective workload such that increasing time pressure would
lead to reduced performance quality in terms of response speed and accuracy and that these trends would also be reflected in
increased perceived cognitive workload with increasing time pressure. Finally, we hypothesised that the specific viewing
conditions (e.g. fixed vs. free head motion) would also exert substantive and systematic influences on recorded response
capacities such that a freely chosen viewing location would produce superior performance and decreased workload when
compared with an a priori fixed viewing location.
Experimental methodology
Experimental participants
The study was conducted at a large university in the south-eastern USA. Participants were solicited from an online
recruitment system available to undergraduates of all majors who were enrolled in a basic psychology course. A total of 138
different individuals (n ¼ 138), 51 male and 87 female, participated in the three total experiments. Each experiment was
made up of one specific viewing condition. Forty-six participants were randomly assigned to one of these three
experimental viewing conditions (i.e. 3 Experiments £ 46 Participants ¼ Overall N of 138). There have been suggestions
that gender may play an important role in mediating performance with differing sizes of displays (see Czerwinski, Tan, and
Robertson 2003). In the present experiments, the gender profile varied by experiment (i.e. Experiment 1: 17 males and 29
females, Experiment 2: 18 males and 28 females, Experiment 3: 16 males and 30 females). All participants were screened
for vision using the near and far versions of the Snellen Eye chart. All participants were required to have a minimum of
20/40 vision or corrected to 20/40 vision to be initially entered into the experiment. Participants were also screened for any
colour vision problems using Dvorine Pseudo-Isochromatic Plates (Dvorine 1963).
Experimental apparatus and stimuli
A custom-built system with a 1024 MB video card, 3GHz processor, 2 GB of memory and an Apple 30-inch cinema display
were used to present all four screen sizes. The four screen resolutions, corresponding width and height, and dimensions of
the task are listed in Table 1. These four screen sizes were intended to generally represent (i) a PDA, (ii) a handheld tablet,
(iii) a standard monitor and (iv) a large monitor. In order to control for differing screen brightness ratios, contrast ratios, dot
pitches, colour capabilities and refresh rates, we used the same Apple 30 inch cinema display for all four screen sizes. This
was accomplished by placing a 128/128/128 RGB value flat grey custom fit 1/4 inch foam board over the unused portion of
the monitor. A participant using the 320 £ 280 resolution display would only have a 4.292 inch £ 2.486 inch display
opening in this foam board. Four foam boards were custom cut to each of the resolution specifications listed in Table 1. The
experiment was conducted in an office environment with normal office lighting. The monitor was placed on a table while
the keyboard and mouse were placed on an attached rolling table capable of being either locked in place or moved as
appropriate to the respective procedure. When connected, the two tables presented a uniform flat surface to the participant.
A chin rest was used to establish a fixed head position and distance to the display in order to accurately control viewing
distance in the appropriate condition. An adjustable chair allowed for height differences between participants to be nullified.
Table 1. Screen resolution, size (0.255 dot pitch pixels).
Main task width HeightDistance betweenarray symbols
Distance – arrayto code
Resolution Inches Pixels Inches Pixels Inches Pixels Inches Pixels
320 £ 280 4.292 309 2.4S6 179 0.211 15 0.5 36800 £ 600 10.708 771 6.181 445 0.542 39 1.25 901280 £ 1024 17.139 1234 9.875 711 0.903 65 1.736 1251600 £ 1200 21.431 1543 12.333 888 1.07 77 2.514 181
TERG 973914—16/12/2014—MANIVANNAN.E—497143———Style 2
P.A. Hancock et al.6
276
277
278
279
280
281
282
283
284
285
286
287
288
289
290
291
292
293
294
295
296
297
298
299
300
301
302
303
304
305
306
307
308
309
310
311
312
313
314
315
316
317
318
319
320
321
322
323
324
325
326
327
328
329
330

The task used a modified version of the code ANAM substitution task, commonly found in a number of differing
cognitive batteries (see Harris, Hancock, and Harris 2005; Kabat et al. 2001). Standard keyboard character stimuli found in
font programs were chosen for this task, to simplify future replications of this procedure. Symbol size was calculated as
angle subtended by the viewer to determine whether vision was a factor in determining performance on any of the tasks. The
smallest symbol used in our experiment provided 12.732 minutes of arc, allowing a person of 20/40 vision the ability to
correctly identify each symbol at the farthest distance used in the controlled visual angle condition.
Modified ANAM task
The code substitution task used a collection of nine symbols analogous to the symbols found above the numbers on a
standard computer keyboard. These symbols were matched to the standard numbers from one to nine. The nine numbers and
nine symbols were always in the same order and were presented horizontally across the screen from left to right with a
number directly above each symbol. The numbers remained in sequential order for the entire experiment so the participant
could learn where to look when a cueing number was presented. A random code pair consisted of a cueing random number,
and symbols were presented below this array of nine symbols for three seconds. The participant needed to decide whether
this random number and symbol matched the number and symbol pair found in the array of nine numbers and associated
symbols. If the random presented code and number did match, the participant pressed the right mouse button. If the random
number and symbol did not match, the participant pressed the left mouse button. This is effectively a memory task since the
top array of nine symbols and numbers never changed. Participants could eventually learn the relationship of all symbols
and therefore, obviate the need to look at the array.
The modified version of this task uses similar numbers and symbols, created through the use of Adobe
Photoshop. Photoshop allowed control over the resolution so that each image could be displayed at a given software
resolution. Our modified version shares the number and symbol concept found in the original ANAM and APTS cognitive
batteries, with two distinct differences. First, the numbers in the array of nine symbols at the top of the screen remain in
constant sequential order across the top of the screen but the symbols were constantly shuffled to prevent the participant
from memorising their locations. This prevents the participant from memorising the array of nine symbols and numbers.
Second, the array of nine numbers and associated symbols on the top of the screen are removed after a period of time that
varied as a function of three separate difficulty levels, described here as the time pressure levels. The removal of this array is
referred to as the time pressure component.
Experimental design
Time pressure was manipulated as a within-participant factor with three levels (i.e. 3000, 700 and 300ms, respectively).
The ANAM task’s nine symbol and number array was displayed for a number of milliseconds defined by each time pressure
condition before being removed. For example, this provided participants in the 3000ms time pressure condition three
seconds to determine whether the random code matched the corresponding number and random symbol in the array of nine
presented above.
Viewing condition was manipulated as a between-participant factor among three conditions which represented each of
the three sequential experiments. In Experiment 1, the standard distance viewing condition (SDVC), participants were
positioned at a set distance of 28 inches from the centre of the display and their heads were fixed on a chin rest as described
earlier. This distance was selected from the seminal US Army standards (U.S. Armed Forces NRCVision Committee 1950).
In the choice distance viewing condition (CDVC) which is described in Experiment 2, participants were permitted to
establish their own self-selected viewing distance. Before each screen size was presented, the chair and table containing the
keyboard and mouse were arranged so that the participant needed to alter the distance with respect to the screen. Participants
were told that it was very important that they sit a comfortable distance to the display which would represent the distance
they would typically adopt when using such a display in the real world. The participant was allowed to adjust this distance
during the course of a self-paced, five-minute practice session. Before data were collected in the CDVC, the experimenters
measured the distance to the display taking note whether the participants adjusted this during the practice session. This
distance to the display was used subsequently to help calculate the distances used in the controlled visual angle viewing
condition (CVAVC) which is reported in Experiment 3.
In the CVAVC, the visual angle to the display was controlled. Using the average viewing distance from the 320 £ 280
display from the CDVC, the remaining distances for each screen size were calculated which served to keep the visual angle
constant. The calculation was applied to the distance as measured from the far left to far right of the array of nine symbols.
Each image was built to hold task stimuli dimensions both proportional and constant (in terms of visual angle) while
increasing distance as the display size increased. The smallest display of 320 £ 280 whose primary task scanning area – far
TERG 973914—16/12/2014—MANIVANNAN.E—497143———Style 2
Ergonomics 7
331
332
333
334
335
336
337
338
339
340
341
342
343
344
345
346
347
348
349
350
351
352
353
354
355
356
357
358
359
360
361
362
363
364
365
366
367
368
369
370
371
372
373
374
375
376
377
378
379
380
381
382
383
384
385

left to far right distance – was 4.292 inches was viewed at an average of 21 inches in the CDVC which subtended 0.203
radians or 11.6 degrees. The horizontal distance of the main scanning area was approximately 1 inch and proportionally
controlled for horizontal distance for each screen size, making an adjustment for horizontal distance unnecessary when
calculating visual angle. This is because a corresponding horizontal change allowed for a proportional change in the
vertical, making our visual angle calculation accurate (see Figure 8). Lack of task distortion in terms of height and width by
screen size is extremely important in keeping visual angle constant. As such, ratios of height to width remained the same
across screen sizes with the effort of taking up as much of the display as possible. In order to keep visual angle constant, the
800 £ 600 display whose task scanning area was 10.7 inches would need to be viewed at 52 inches, subtending 0.205
radians or 11.7 degrees. The 1280 £ 1024 display whose task scanning area was 17.139 inches had to be viewed at 80
inches, subtending 0.200 radians or 11.5 degrees. The 1600 £ 1200 display whose task scanning area was 21.431 inches had
to be viewed at 104 inches, subtending 0.205 radians or 11.7 degrees, see Table 2. Accordingly, the participants were moved
to the appropriate viewing distances for each display size. The adjustable tables allowed for the chin rest, mouse and
keyboard to be moved without affecting monitor position. Display size and time pressure were always manipulated as a
within-participant factor among four screen sizes and associated resolutions, and the three specified time pressures, as
described earlier and in Table 2.
Experimental procedure
Each participant was given up to five practice sessions with unlimited time before the experiment began. Participants were
trained to a criterion of three practice sessions of 20 matching pairs at 100% performance before beginning the first
experimental trial. All participants learned the task and all scored 100% by the fourth practice session. After the practice
session at each time pressure, participants were given a NASA-TLX test to rate the workload demands. Before beginning
the first display size, participants were told that they should respond as quickly and accurately as they possibly could. Pilot
testing had shown that sudden changes between extreme screen sizes could prove rather startling. To compensate for this
startle effect, when participants switched screen sizes, they were given an additional five-minute practice on the new screen
before recording began on that condition. Prior to all analyses, the data were reviewed for abnormalities and outliers. All
significance tests were set at the p , 0.05 level. All experimental results were analysed using a 4 (display size) £ 3 (time
pressure) £ 3 (viewing condition) repeated measures analysis of variance and the results are reported accordingly.
Experimental results
Experiment 1: SDVC
Response accuracy
For the SDVC, significant main effect of screen size was observed on response accuracy [Wilks’ l ¼ 0.39, F(3,
43) ¼ 22.57, p , 0.05, h 2p ¼ 0.61]. Response accuracy at the 320 £ 280 screen size [i.e. M ¼ 80.87 þ SE 0.94%, 95% CI
78.99%, 82.76%] was significantly lower than each of the other screen sizes which did not vary significantly from one
another [i.e. 800 £ 600,M ¼ 85.99 þ SE 0.68%, 95% CI 84.63%, 87.36%; 1280 £ 1024,M ¼ 86.04 þ SE 0.75%, 95% CI
84.54%, 87.54%; 1600 £ 1200, M ¼ 86.66 þ SE 0.71%, 95% CI 85.23%, 88.08%]. As well as the main effect for screen
size, there was also a significant main effect of time pressure [Wilks’ l ¼ 0.07, F(2, 44) ¼ 287.43, p ,0.05, h 2p ¼ 0.93].
Post hoc analysis of data showed significant differences in response accuracy between all time pressures, with the 3000ms
time pressure showing significantly higher accuracy than the 700ms time pressure condition, which was in turn
significantly more accurate than the 300ms time pressure condition [i.e. 3000ms, M ¼ 95.54 þ SE 0.35%, 95% CI
95.84%, 97.24%; 700ms, M ¼ 91.28 þ SE 0.74%, 95% CI 89.79%, 92.78%; 300ms, M ¼ 66.85 þ SE 1.29%, 95% CI
Table 2. Screen resolution and associated viewing distance and subtended viewing angle.
ResolutionFar left to far right array
of nine symbols Viewing distance Subtended angle
Hardware pixels Inches Inches Degrees
320 £ 280 4.292 21 11.6800 £ 600 10.708 52 11.71280 £ 1024 17.139 85 11.51600 £ 1200 21.431 104 11.7
[AQ10]
[AQ11]
[AQ12]
TERG 973914—16/12/2014—MANIVANNAN.E—497143———Style 2
P.A. Hancock et al.8
386
387
388
389
390
391
392
393
394
395
396
397
398
399
400
401
402
403
404
405
406
407
408
409
410
411
412
413
414
415
416
417
418
419
420
421
422
423
424
425
426
427
428
429
430
431
432
433
434
435
436
437
438
439
440
64.25%, 69.45%]. In addition to these main effects, there was a significant interaction of screen size by time pressure on
response accuracy [Wilks’ l ¼ 0.30, F(6, 40) ¼ 15.40, p , 0.05, h 2p ¼ 0.70]. Post hoc analysis showed a significant
decreasing trend for all screen sizes with the 3000ms significantly more accurate than the 700ms time interval which was in
turn significantly greater than 300ms. Figure 4 shows the interaction in percentage correct for each screen size by respective
time pressure condition.
Response time
For response time, a significant main effect of screen size was observed [Wilks’ l ¼ 0.68, F(3, 43) ¼ 6.71, p , 0.05,
h 2p ¼ 0.32]. The response time at the 320 £ 280 screen size [i.e. 1324 þ SE 31ms, 95% CI 1261, 1386ms] was
significantly longer than each of the other screen sizes which did not differ between themselves [i.e. 800 £ 600,
M ¼ 1228 þ SE 28ms, 95% CI 1172, 1284ms; 1280 £ 1024, M ¼ 1230 þ SE 29ms, 95% CI 1171, 1289ms; 1600
£ 1200,M ¼ 1234 þ SE 29ms, 95% CI 1176, 1292ms] (see these data also in Figure 4). A significant main effect of time
pressure on response time was again observed [Wilks’ l ¼ 0.46, F(2, 44) ¼ 25.92, p , 0.05, h 2p ¼ 0.54]. Post hoc analysis
showed significant differences, with the 3000ms time pressure [M ¼ 1343 þ SE 31ms, 95% CI 1280, 1406ms]
significantly slower than the 700ms time pressure condition [M ¼ 1240 þ SE 26ms, 95% CI 1187, 1293ms] which in turn
was significantly slower than the 300ms time pressure condition [M ¼ 1179 þ SE 33ms, 95% CI 1113, 1245ms]. In
addition to these main effects, a significant interaction of screen size by time pressure was also observed [Wilks’ l ¼ 0.57,
F(6, 40) ¼ 4.96, p , 0.05, h 2p ¼ 0.43]. Post hoc analysis showed a significantly slower response time for the 320 £ 280
screen size when compared with all other screen sizes at the 3000 and 700ms conditions; a pattern which did not persist at
the 300ms condition (see Figure 4).
Subjective workload
For subjective workload, a significant main effect of screen size was observed [Wilks’ l ¼ 0.45, F(3, 43) ¼ 17.71,
p , 0.05, h 2p ¼ 0.55], see Figure 5. These results showed that the 320 £ 280 screen size had a significantly higher workload
than each of the other respective screen sizes, between which no significant differences existed [i.e. 320 £ 280,
M ¼ 48.20 þ SE 1.95, 95% CI 44.27, 52.13; 800 £ 600, M ¼ 40.71 þ SE 1.69, 95% CI 37.30, 44.11; 1280 £ 1040,
M ¼ 40.00 þ SE 1.97, 95% CI 36.05, 43.97; 1600 £ 1200, M ¼ 40.69 þ SE 1.78, 95% CI 37.10, 44.28]. A significant
main effect of time pressure on subjective workload was also observed [Wilks’ l ¼ 0.19, F(2, 44) ¼ 91.35, p , 0.05,
h 2p ¼ 0.81]. Post hoc analysis collapsed across all screen sizes showed significant differences, with the 3000ms time
pressure providing significantly lower workload [M ¼ 31.33 þ SE 1.88, 95% CI 27.55, 35.11] than the 700ms time
pressure condition [M ¼ 39.56 þ SE 1.78, 95% CI 35.97, 43.15] which in turn exhibited significantly lower workload than
the 300ms time pressure condition [M ¼ 56.31 þ SE 1.83, 95% CI 52.63, 59.99].
Figure 4. Response time and response accuracy by screen size and time pressure level for Experiment 1 (viewing condition 28 inches).Note that the error bars for the percentage correct at the 700 and 3000ms are contained within the symbols for the mean scores.
TERG 973914—16/12/2014—MANIVANNAN.E—497143———Style 2
Ergonomics 9
441
442
443
444
445
446
447
448
449
450
451
452
453
454
455
456
457
458
459
460
461
462
463
464
465
466
467
468
469
470
471
472
473
474
475
476
477
478
479
480
481
482
483
484
485
486
487
488
489
490
491
492
493
494
495

Experiment 2: CDVC
Response accuracy
For the self-selected or CDVC, a significant main effect of screen size was observed on response accuracy, [Wilks’
l ¼ 0.42, F(3, 43) ¼ 19.49, p , 0.05, h 2p ¼ 0.58]. The 320 £ 280 screen size had a significantly lower mean percentage
correct [i.e. 320 £ 280, M ¼ 82.38 þ SE 0.67%, 95% CI 81.02%, 83.73%] than each of the other respective screen sizes
which exhibited no such significant differences between each other [i.e. 800 £ 600, M ¼ 85.79 þ SE 0.73%, 95% CI
84.31%, 87.26%; 1280 £ 1024,M ¼ 86.25 þ SE 0.63%, 95% CI 84.98%, 87.52%; 1600 £ 1200,M ¼ 85.62 þ SE 0.63%,
95% CI 84.36%, 86.89%], see Figure 6. A significant main effect of time pressure was also observed [Wilks’ l ¼ 0.07, F(2,
44) ¼ 305.56, p , 0.05, h 2p ¼ 0.93]. Post hoc analysis revealed significant differences between all conditions, with the
3000ms time pressure [M ¼ 96.89 þ SE 0.29%, 95% CI 96.31%, 97.48%] showing significantly more accurate response
than the 700ms time pressure condition [M ¼ 92.78 þ SE 0.50%, 95% CI 91.78%, 93.78%] which in turn was significantly
more accurate than the 300ms time pressure condition [M ¼ 65.36 þ SE 1.28%, 95% CI 62.77%, 67.94%]. A significant
interaction between screen size and time pressure was also observed [Wilks’ l ¼ 0.42, F(6, 40) ¼ 9.36, p , 0.05,
h 2p ¼ 0.58]. Post hoc analysis confirmed the pattern of difference as shown in Figure 6, a significant decreasing trend for all
screen sizes with the 3000ms significantly more accurate than the 700ms time interval which was in turn significantly
greater than 300ms. It should be noted that this pattern is highly consistent with the previous performance effects in the
SDVC.
Figure 6. Response time and response accuracy results for Experiment 2.
Figure 5. Total workload, viewing condition ¼ 28 inches.
[AQ13]
TERG 973914—16/12/2014—MANIVANNAN.E—497143———Style 2
P.A. Hancock et al.10
496
497
498
499
500
501
502
503
504
505
506
507
508
509
510
511
512
513
514
515
516
517
518
519
520
521
522
523
524
525
526
527
528
529
530
531
532
533
534
535
536
537
538
539
540
541
542
543
544
545
546
547
548
549
550

Response time
A significant main effect of screen size on response time was observed in the CDVC, [Wilks’ l ¼ 0.83, F(3, 43) ¼ 3.04,
p , 0.05, h 2p ¼ 0.18]. The 320 £ 280 screen size had a significantly longer response time [M ¼ 1289 þ SE 23ms, 95% CI
1243, 1334] than each of the other respective screen sizes [i.e. 800 £ 600, M ¼ 1224 þ SE 28ms, 95% CI 1168, 1280ms;
1280 £ 1040, M ¼ 1217 þ SE 24ms, 95% CI 1168, 1267ms; 1600 £ 1200, M ¼ 1240 þ SE 29ms, 95% CI 1181,
1299ms], which did not differ amongst each other, see Figure 6. The significant main effect of time pressure [Wilks’
l ¼ 0.57, F(2, 44) ¼ 16.58, p , 0.05, h 2p ¼ 0.43], upon post hoc analysis, revealed that the 3000ms time pressure
[M ¼ 1328 þ SE 25ms, 95% CI 1276, 1379ms] was significantly slower than the 700ms time pressure condition
[M ¼ 1244 þ SE 22ms, 95% CI 1200, 1288ms] which in turn was significantly slower than the 300ms time pressure
condition [M ¼ 1155 þ SE 37ms, 95% CI 1082, 1230ms]. No interaction for screen size by time pressure was observed in
this particular viewing condition.
Subjective workload
A significant main effect of screen size on subjective workload was observed for the choice viewing condition [Wilks’
l ¼ 0.72, F(3, 43) ¼ 5.65, p , 0.05, h 2p ¼ 0.28]. The 320 £ 280 screen size exerted a significantly higher workload
[M ¼ 44.11 þ SE 2.44, 95% CI 39.19, 49.03] than each of the other respective screen sizes which did not differ between
themselves [i.e. 800 £ 600, M ¼ 39.48 þ SE 2.18, 95% CI 35.09, 43.87; 1280 £ 1040, M ¼ 39.24 þ SE 2.35, 95% CI
34.51, 43.96; 1600 £ 1200, M ¼ 39.21 þ SE 2.23, 95% CI 34.72, 43.71]. A significant main effect of time pressure was
also observed [Wilks’ l ¼ 0.16, F(2, 44) ¼ 116.76, p , 0.05, h 2p ¼ 0.84]. Post hoc analysis showed significant differences
between all three levels of time pressure on workload [i.e. 3000ms, M ¼ 28.90 þ SE 2.26, 95% CI 24.35, 33.45; 700ms,
M ¼ 38.41 þ SE 2.24, 95% CI 33.89, 42.92; 300ms time, M ¼ 54.23 þ SE 2.31, 95% CI 49.59, 58.87], see Figure 7.
As with the results for the response time, there was no significant interaction for screen size by time pressure here.
Experiment 3: CVAVC
Response accuracy
For the procedure in which the viewing angle was controlled (see Figure 8), a significant main effect of screen size on
response accuracy was observed here [Wilks’ l ¼ 0.68, F(3, 42) ¼ 6.46, p , 0.05, h 2p ¼ 0.32], and see Figure 9. The 320
£ 280 screen size has a significantly lower mean percentage correct [M ¼ 80.70 þ SE 0.87%, 95% CI 78.95%, 82.46%]
than each of the other respective screen sizes which did not differ among themselves [i.e. 800 £ 600,M ¼ 83.33 þ SE 0.75,
95% CI 81.83%, 84.84%; 1280 £ 1040,M ¼ 82.94 þ SE 0.67%, 95% CI 81.58%, 84.30%; 1600 £ 1200,M ¼ 83.73 þ SE
0.68%, 95% CI 82.36%, 85.10%]. A significant main effect of time pressure on response accuracy was also observed
[Wilks’ l ¼ 0.03, F(2, 43) ¼ 614.44, p , 0.05, h 2p ¼ 0.97], see Figure 9. Post hoc analysis showed significant differences
Figure 7. Total workload as a factor of screen size and time viewing condition ¼ free movement.
TERG 973914—16/12/2014—MANIVANNAN.E—497143———Style 2
Ergonomics 11
551
552
553
554
555
556
557
558
559
560
561
562
563
564
565
566
567
568
569
570
571
572
573
574
575
576
577
578
579
580
581
582
583
584
585
586
587
588
589
590
591
592
593
594
595
596
597
598
599
600
601
602
603
604
605

between all conditions [3000ms,M ¼ 96.19 þ SE 0.40%, 95% CI 95.38%, 96.99%; 700ms,M ¼ 89.49 þ SE 0.78%, 95%
CI 87.96%, 91.07%; 300ms,M ¼ 62.35 þ SE 1.04%, 95% CI 60.25%, 64.45%]. A significant interaction for screen size by
time pressure was also observed [Wilks’ l ¼ 0.69, F(6, 40) ¼ 2.89, p , 0.05, h 2p ¼ 0.31]. Post hoc analysis revealed a
significant decreasing trend for all screen sizes with the 3000ms was significantly more accurate than the 700ms time
interval which was in turn significantly greater than 300ms, a pattern of data closely mirroring those of the two previous
viewing condition experiments.
Response time
For response time, no significant main effect of screen size was observed. However, there was a significant main effect of
time pressure [F(2, 44) ¼ 15.39, p , 0.05, h 2p ¼ 0.41]. Post hoc analysis showed distinguished significant differences
between all conditions, [i.e. 3000ms,M ¼ 1352 þ SE 24ms, 95% CI 1304, 1399ms; 700ms,M ¼ 1266 þ SE 27ms, 95%
CI 1212, 1320ms; 300ms,M ¼ 1186 þ SE 38ms, 95% CI 1110, 1263ms]. There was, however, no significant interaction
for screen size by time pressure here for response time which again followed the results for the prior viewing condition.
Subjective workload
Analysis of the subjective workload data showed no significant main effect of screen size. A significant main effect of time
pressure on subjective workload was once again present [F(2, 44) ¼ 94.47, p , 0.05, h 2p ¼ 0.81] with post hoc analysis
again distinguishing between all three time pressure levels [i.e. 3000ms, M ¼ 29.98 þ SE 2,16, 95% CI 25.63, 34.33;
Figure 8. Experimental set-up allowing for the same visual angle of the task to be subtended to the centre of vision of the participant.
Figure 9. Response time and response accuracy results for Experiment 3.
TERG 973914—16/12/2014—MANIVANNAN.E—497143———Style 2
P.A. Hancock et al.12
606
607
608
609
610
611
612
613
614
615
616
617
618
619
620
621
622
623
624
625
626
627
628
629
630
631
632
633
634
635
636
637
638
639
640
641
642
643
644
645
646
647
648
649
650
651
652
653
654
655
656
657
658
659
660

700ms,M ¼ 39.20 þ SE 2.22, 95% CI 34.72, 43.67; 300ms,M ¼ 57.11 þ SE 2.09, 95% CI 52.91, 51.32], as illustrated in
Figure 10. No significant interaction for screen size by time pressure was observed.
In order to establish both illustrative as well as numerical representations of our overall findings, we have provided a
complete summary of our complete results from the three experiments in Table 3 (and of course see Figures 4, 6 and 9).
Discussion
Response accuracy
The lack of previous work examining performance across a range of screen sizes and time pressures serves to provide little
precedent for our present findings, but they do conform well to existing models of human performance. Results for the
overall pattern, which include both response speed and response accuracy, can be interpreted using the Hancock and Warm
(1989). Accuracy, in terms of both time pressure and screen size, remains stable across a fairly wide range of these
combinatorial conditions then drops off at a threshold of incipient failure as predicted by the extended ‘U’ model (Hancock
and Warm 1989). Across time pressures, this threshold can be seen between 700 and 300ms conditions, where accuracy
plummets to 65%. An additional increase of 400ms of viewing time produced an average 15% increase in accuracy
(average of 92%), and the final increase of 2300ms more viewing time provides only another 5% increase in performance
accuracy (average of 97%), although it should be noted that we are close to ceiling effects at this juncture. Across screen
sizes, this drop occurs between the 800 £ 600 and 320 £ 240 displays, where mean accuracy drops from 85% to 81%. It is
in examining the Time Pressure by Screen Size interaction that it becomes clear that in sum, these effects mean that while a
substantial accuracy drop-off happens between 700 and 300ms of time pressure, this drop-off is especially precipitous for
the 320 £ 240 screen. Thus, this threshold identifies what are considered the ‘shoulders’ of incipient failure in the extended-
U model characterising the demand–response relationship.
Response time
The response time data for each experiment indicated a significant main effect and moderated Cohen’s d (d . 0.5) only for
time pressure. While statistical significance existed for the smallest screen size in one condition and only at the greatest time
pressure levels (700 and 300ms), the resultant Cohen’s d effect sizes were small (d , 0.1). It is important to note that no a-
priori hypothesis had been generated for response time. Feedback from participants as to how they felt they were doing on
each time pressure elicited response such as:jIt felt like I reacted faster during the faster time pressure and that I had to try
harder during the fastest time pressure. Such an outcome could be explained through an idea proposed initially by Norman
and Bobrow (1975) that increasing resources given to a task, with the same common strategy being employed, would
Figure 10. Total workload as a factor of screen size and time viewing condition, Experiment 3.
TERG 973914—16/12/2014—MANIVANNAN.E—497143———Style 2
Ergonomics 13
661
662
663
664
665
666
667
668
669
670
671
672
673
674
675
676
677
678
679
680
681
682
683
684
685
686
687
688
689
690
691
692
693
694
695
696
697
698
699
700
701
702
703
704
705
706
707
708
709
710
711
712
713
714
715

shorten the time the participant would take to make a decision as to the correctness of the task (compare also with Kantowitz
and Knight 1976). As such, higher workload ratings would, and in this case do, follow faster task response times (and see
Hancock and Caird 1993). In all viewing conditions examined here, the faster time pressures have higher workload and
quicker response times.
Subjective response
Subjective workload showed significant increases only at the smallest display size. However, this effect occurred only in the
SDVC. Cohen’s d effect sizes were below 0.1, indicating this effect though statistically significant ( p , 0.05) was
relatively weak. The lack of any real change in workload when looked at by screen size could be explained by the nature of
how our experiments were set up. Each of our present experiments was almost two hours long and consisted of four screen
sizes with three time pressures. Woodworth (1938) explained that an automation effect often takes place in experiments that
are repeatedly practiced. It is possible that participants employed a strategy that did not change when screen size was
changed. Indeed, 18 of our 20 participants in a pilot study for the present procedures reported using the same strategy for all
screen sizes. These participants reported scanning the top array of nine symbols and numbers until such time they felt
comfortable they had all of the information. In CVAVC and CDVC the distance to the smallest display was the same.
In these two now equivalent viewing conditions, the workload ratings were unsurprisingly, equal. No increased demands
were placed on users when observing displays over progressively longer distances in the CVAVC or in the CDVC. The law
of visual angle would suggest no change in performance across screen sizes when visual angle is controlled with the display
subtending the same visual angle to the observer no matter the distance. We found that larger displays outperformed smaller
displays for hit rate (only at 700 and 300ms) in all viewing conditions in line with predictions anticipated when equal angles
are subtended.
Table 3. Means and standard errors for screen resolutions and time pressure conditions by experiment.
320 £ 280 800 £ 600 1280 £ 1040 1600 £ 1200
DV Study Time pressure (ms) Mean SE Mean SE Mean SE Mean SE
Accuracy SDVC 3000 95.57 0.51 96.51 0.52 97.36 0.37 96.71 0.42(%) 700 87.00 1.33 91.89 0.80 92.24 0.89 94.01 0.66
300 60.04 1.55 69.58 1.49 68.52 1.47 69.25 1.58CDVC 3000 96.81 0.51 96.56 0.52 97.12 0.37 97.08 0.42
700 90.24 1.33 93.36 0.80 94.02 0.89 93.50 0.66300 60.08 1.55 67.45 1.49 67.61 1.47 66.29 1.58
CVAC 3000 95.57 0.51 96.45 0.52 96.60 0.37 96.06 0.42700 87.15 1.33 90.33 0.80 89.33 0.89 90.75 0.66300 58.13 1.55 62.95 1.49 62.46 1.47 64.14 1.58
Response SDVC 3000 1462 32 1317 30 1309 32 1283 31(ms) 700 1306 29 1223 27 1215 28 1215 29
300 1203 49 1144 44 1166 42 1204 42CDVC 3000 1420 32 1303 30 1282 32 1306 31
700 1303 29 1233 27 1205 28 1235 29300 1143 49 1136 44 1165 42 1179 42
CVAC 3000 1410 32 1328 30 1323 32 1342 31700 1282 29 1248 27 1274 28 1262 29300 1134 49 1151 44 1202 42 1197 42
Workload SDVC 3000 38.38 2.43 29.87 2.33 28.57 2.46 28.50 2.40(NASA TLX) 700 45.16 2.50 38.59 2.41 36.55 2.52 37.94 2.22
300 61.06 2.45 53.65 2.30 54.90 2.24 55.63 2.31CDVC 3000 31.80 2.43 28.36 2.33 27.84 2.46 27.59 2.40
700 42.71 2.50 37.87 2.41 36.52 2.52 36.52 2.22300 57.83 2.45 52.21 2.30 53.34 2.24 53.54 2.31
CVAC 3000 29.21 2.43 30.10 2.33 28.64 2.46 31.94 2.40700 40.32 2.50 37.96 2.41 38.21 2.52 40.28 2.22300 57.21 2.45 56.51 2.30 56.92 2.24 57.82 2.31
Note: In the SDVC, participants were positioned 28 inches from the centre of the display and visual angle was controlled. In the CDVC, participants werepermitted to establish their own self-selected viewing distance. This distance to the display was used in the CVAVC while visual angle to the display wascontrolled.
[AQ14]
TERG 973914—16/12/2014—MANIVANNAN.E—497143———Style 2
P.A. Hancock et al.14
716
717
718
719
720
721
722
723
724
725
726
727
728
729
730
731
732
733
734
735
736
737
738
739
740
741
742
743
744
745
746
747
748
749
750
751
752
753
754
755
756
757
758
759
760
761
762
763
764
765
766
767
768
769
770

However, the same angle subtended to the observer in the CVAVC and CDVC, did eliminate the high workload
significance of the smallest display size found in the SDVC. The SDVC required the display to be a full 7 inches further than
the distance (21 inches) chosen by participants in the CDVC. In the SDVC, all screen sizes performed the same in terms of
hit rate at the 3000ms time pressure. However, the smallest screen size of 320 £ 280 had a significantly higher workload
though objective performance was equal to other screen sizes. As such, we have higher workload with stable performance
for the smallest display. This workload dissociation (Chignell and Hancock 1986) was supported by participants’ free
responses. ‘It was somewhat difficult to look at the small screen from this distance.’ The indistinguishable workloads for
display size and distance in the controlled visual angle experiment produced similar post-experiment observations, namely
‘I had to try harder as distance increased because it looked more difficult even though the screen grew in size as I moved
back, because I would never be that far away from a screen.’ This quote as well as others suggests that users actively tried
harder as distance increased. Part of our procedure as required by IRB protocol was to explain to the user what was going to
occur before the experiment began. This meant all users saw all distance markers (marked with tape on the floor) prior to
starting the task which may have produced pre-experimental judgements as to prospective difficulty and effort. The CDVC
gave control of distance to the observer which may have resulted in equal workload ratings as well. One participant was
quoted as saying ‘Being able to adjust distance to the display made the smallest display easier to use, though I know I did
really bad on that display size it didn’t feel too difficult.’ This could be seen as workload dissociation, with stable workload
levels allied to a reduction in performance as display size decreases (Chignell and Hancock 1986).
Associations, dissociations and insensitivities
As noted earlier, in any experimental procedure where there are both objective and subjective measures of response
(Hancock, Weaver, and Parasuraman 2002), we can ask about the ways in which the pattern of each relate. As a general
proposition, we can see an improvement in objective performance, a decrement in such performance or no evident change.
Similarly, subjective responses which in the present case are given by a reflection of cognitive workload can also show an
increase, a decrease or no change. These combinatorial conditions provide a possible three by three matrix which has been
articulated by Hancock (1996). If, for example, performance changes in one direction or the other, but workload remains the
same, this is referred to as ‘workload insensitivity’. The opposite pattern in which performance stays stable but workload
scores change is termed ‘performance insensitivity’. In another possible pattern, it is conceivable that workload increases
while performance actually improves, or vice versa, these are termed ‘dissociations’ (see also Yeh and Wickens 1988).
However, if workload increases while performance decreases, or again vice versa, this pattern is termed ‘association’.
Associations provide us with greater confidence that the overall pattern of outcome we are observing is a strong and
consistent one. What is important to note here is that there are strong and consistent associated relationships between
objective performance and workload responses in essentially all of the experimental procedures (i.e. viewing conditions)
reported here. This provides a substantive empirical foundation upon which to generate strong assertions as to the influence
of display size and time pressure on operator response capability.
Variability as a critical indicator of resilience
Hancock (2009) has recently provided an extension to the original Hancock and Warm (1989) model by focusing on the
second moment of the response distribution, namely the variability in response. Thus, we can understand response to
demand not merely in terms of mean level alone but can also use variability as a strong indicator of response output and
incipient levels of resilience to continuing or increasing demand. From the present experiments, it is clear that the smallest
size display resulted in the worst performance. Thus, we can test the increasing variability with increasing demand
hypothesis directly. In accord with the non-linear failure hypothesis of the Hancock and Warm (1989) extended-U model,
we would expect little change between the 3000ms and the 700ms condition but much greater change between the 700ms
and the 300ms conditions in each of the three experimental procedures. The data for each of the reported experiments act to
confirm this pattern. Thus, as well as the mean level of reported response, in both performance and workload, the indications
derived from the second moment of the objective response distributions also confirms the highly consistent outcome for
display size effects on observer response capacity.
Evaluation of original hypotheses
Given the foregoing observations, we can now address the predictions derived from our original hypotheses. Our first
hypothesis was that screen size would systematically affect both speed and accuracy of response and the associated
workload. This proposition was generally supported. As was evident, there were systematic effects and they transcended the
[AQ15]
TERG 973914—16/12/2014—MANIVANNAN.E—497143———Style 2
Ergonomics 15
771
772
773
774
775
776
777
778
779
780
781
782
783
784
785
786
787
788
789
790
791
792
793
794
795
796
797
798
799
800
801
802
803
804
805
806
807
808
809
810
811
812
813
814
815
816
817
818
819
820
821
822
823
824
825

specific viewing conditions as represented in each of the three experimental procedures. The second hypothesis that such
viewing conditions would themselves influence response was not supported. In retrospect, this lack of difference is
somewhat understandable. In essence, there proved to be, after the relevant manipulations (e.g. individually self-selected
preferred viewing distance) limited if indeed any substantive differences between these three respective viewing conditions.
It may well be argued that because in reality, such conditions themselves did not vary greatly then no great performance or
workload variations should be anticipated. Thus, our a priori expectation that these differing procedures would result in
substantially different viewing conditions was itself proved incorrect.
Implications of the present results for design
Our current results suggest avoiding small PDA like displays unless the task itself is either relatively slow or self-paced (i.e.
a task with a time pressure demand of 3000ms or slower). Those responsible for acquisition should use caution when giving
operators any display in situations where the task demands are primarily reflected by increases in time pressure (i.e. 700ms
or faster), especially if and when there are negative consequences for low response accuracy. Before replacing displays with
smaller/cheaper versions, account should be taken of the nature of the methods we have discussed. Reactivity to the
experimental situation could account for lower performance in some tasks (Shadish, Cook, and Campbell 2002). Our
participants did not complain about smaller screen sizes nor did they have to use any of the display sizes for an extended
period of time (e.g. a full work shift). Reactivity to the experimental situation suggested that participants in our study were
actively participating with a potentially positive attitude regardless of using a very small display, possibly keeping their
personal preference of a larger display size in check. Furthermore, comparing performance with preference suggested that
often times a user preferred a display that did not match optimal performance. Extending this notion, users can also prefer
incrementally larger displays with no actual performance gains. The need for larger displays can be driven by factors which
we do not pertain in experimental settings. For example, a co-worker who has a larger display which may or may not offer a
performance advantage might produce an envious effect in those who have smaller displays. As Shadish, Cook, and
Campbell (2002) suggested in internal threats to validity, resentful demoralisation threats suggest those not receiving
special treatment (i.e. getting a small display instead of a large display) will be inclined not to perform as well on set or
common tasks. Finally, we have here evaluated only one particular memory search and matching task. While we believe
that this generalises to many common interface tasks (e.g. website search), it cannot generalise to all display-based tasks.
Note should be taken of this limitation.
Future research
In previous and classic work, Garner (1970) has described the limitations of single experiment information processing tasks.
As we have noted, it is thus evident that our single task acts to limit our external validity. However, the power of a basic
controlled experiment in eliminating extraneous and reactive variances found to be commonly produced in field studies
makes the formal evaluation of screen size well suited to the laboratory. In our screen size studies, we have shown that the
independent variables of screen size, task and the manipulation of time pressure are intricately linked with hit rate response
time and workload. Future evaluations should examine cognitive capacities beyond our memory-based substitution task.
In terms of testing different screen sizes, caution should be exercised where extreme size shifts occur. For example, in our
studies we found no performance benefits beyond the 800 £ 600 resolution. Had we only studied the 320 £ 280 screen size
and the 1600 £ 1200 screen size we might have concluded that larger screens offer ubiquitous performance advantage. Such
pairwise comparison lacks appropriate functional specification. Financial constraints also frequently impact display size
decisions along with other specific contextual factors. As displays continue to become an increasing part of our daily life
and display technology evolves, the search for an optimal screen size continues. Future research may well be able to use the
proliferation of the gaming industry to conduct extensive epidemiological field tests as consumers’ responses can
presumably be tracked online (although privacy remains a central issue here). We single out the entertainment industry here
not only because it has such a wide variety of video games which contain a vast sampling of cognitive tasks that can be
tested across multiple display sizes, but because it is increasingly the point of first mass-distribution of novel display
technologies. Just as Google Glass is presently introducing the public to optical head mounted displays (see Kress and
Starner 2013), the Oculus Rift and a wave of similar consumer virtual reality headsets are introducing wearable wrap-
around displays. Such technologies present displays at a variety of virtualised ‘working distances’. As such, in conjunction
with the above-mentioned affordances of video games, they present a compelling opportunity to investigate the efficacy of
different combinations of phenomenological display distance and viewing angle. As to the present question of what display
size is best for which task, it may always be a contingent answer. Explication of putative ‘optimality’ will always be
complex and at present, we can minimally say that it depends on task type and temporal demands. Conservatively, as
[AQ16]
TERG 973914—16/12/2014—MANIVANNAN.E—497143———Style 2
P.A. Hancock et al.16
826
827
828
829
830
831
832
833
834
835
836
837
838
839
840
841
842
843
844
845
846
847
848
849
850
851
852
853
854
855
856
857
858
859
860
861
862
863
864
865
866
867
868
869
870
871
872
873
874
875
876
877
878
879
880

technology continues to change, empirical confirmation will be needed as to the continuing validity of the functions we
have generated.
References
Alluisi, E. A. 1955. Measured Visual Acuity as a Function of Phenomenal Size (USAF: WADC TR. Technical Report No. 55-384.)Washington, DC: United States Air Force.
Blackwell, H. R. 1946. “Contrast Thresholds of the Human Eye.” Journal of the Optical Society of America 36 (11): 624–643.Boff, K. R., L. Kaufman, and J. P. Thomas. 1986. Handbook of Perception and Performance: Volume I – Sensory Processes and
Perception. New York: John Wiley & Sons.Bridgeman, B., M. L. Lennon, and A. Jackenthal. 2003. “Effects of Screen Size, Screen Resolution, and Display Rate on Computer-Based
Test Performance.” Applied Measurement in Education 16 (3): 191–205.Chignell, M. H., and P. A. Hancock. 1986. “Integration of the Cognitive and PhysicalAspects of the Human-machine Interface.”
Proceedings of the Human Factorsand Ergonomics Society Annual Meeting 30 (10): 1007–1011.Churchill, A. V. 1959. “Optimal Interval Length for Visual Interpolation: The Effect of Viewing Distance.” Journal of Applied
Psychology 43 (2): 125–128.Cosenzo, K. A., and S. C. Stafford. 2007. Usability Assessment of Displays for Dismounted Soldier Applications. Army Research
Laboratories Publication No. ARL-TR-4326. Washington, DC: Army Research Labs.Czerwinski, M., G. Smith, T. Regan, B. Meyers, G. Robertson, and G. Starkweather. 2003. “Toward Characterizing the Productivity
Benefits of Very Large Displays.” In Human–Computer Interaction ’03. Paper presented at the ninth IFIP international conference onhuman–computer interaction, Zurich, Switzerland, edited by A. Rauterberg, M. Manozzi, and J Wesson, 9–16. Amsterdam: IOSPress.
Czerwinski, M., M. Tan, and G. Robertson. 2003. “Women take a Wider View.” CHI ’02. Paper presented at the SIGCHI conference onhuman factors in computing systems, Ft. Lauderdale, FL, 195–201. New York: ACM.
de Bruijin, D. D., and H. Van Oostendorp. 1992. “The Influence of Screen Size and Text Layout on the Study of Text.” Behaviour andInformation Technology 11 (2): 71–78.
Degusta, M. 2012. “Are Smart Phones Spreading Faster than Any Technology in Human History?” MIT Technology Review BusinessImpact 1–2.
Dillon, R. A., and C. McKnight. 1990. “The Effects of Display Size and Text Splitting on Reading Lengthy Text from Screen.” Behaviorand Information Technology 9 (3): 215–227.
Dvorine, I. 1963. Dvorine Pseudo-Isochromatic Plates. 2nd ed. New York: Harcourt, Brace & World.Garner, W. R. 1970. “The Stimulus and Information Processing.” American Psychologist 25 (4): 350–358.Guimbretiere, F., M. Stone, and T. Winograd 2001. “Fluid Interaction with High-Resolution Wall-Size Displays.” Proceedings of the
14th Annual ACM Symposium on User Interface Software and Technology, Orlando, FL, November 11–14, 21–30. New York:ACM Press.
Guliford, J. P., and W. S. Zimmerman. 1948. “The Guilford–Zimmerman Aptitude Survey.” Journal of Applied Psychology 32 (1):24–34.
Hancock, P. A. 1996. “Effects of Control Order, Augmented Feedback, Input Device and Practice on Tracking Performance andPerceived Workload.” Ergonomics 39 (2): 1146–1162.
Hancock, P. A. 2009. “Performance on the Very Edge.” Military Psychology 21 (1): S68–S74.Hancock, P. A., and J. K. Caird. 1993. “Experimental Evaluation of a Model of Mental Workload.” Human Factors 35 (3): 413–429.Hancock, P. A., M. Mouloua, and J. W. Senders. 2008. “On the Philosophical Foundations of Driving Distraction and the Distracted
Driver.” In Driver Distraction: Theory, Effects and Mitigation, edited by M. A. Regan, J. D. Lee, and K. L. Young, 11–30. BocaRaton, FL: CRC Press.
Hancock, P. A., and J. S. Warm. 1989. “A Dynamic Model of Stress and Sustained Attention.” Human Factors 31 (5): 519–537.Hancock, P. A., J. L. Weaver, and R. Parasuraman. 2002. “Sans Subjectivity, Ergonomics is Engineering.” Ergonomics 45 (14): 991–994.Harris, W. C., P. A. Hancock, and S. C. Harris. 2005. “Information Processing Changes Following Extended Stress.”Military Psychology
17 (2): 115–128.Holoway, A. H., and E. G. Boring. 1941. “Determinants of Apparent Visual Size with Distance Variant.” American Journal of Psychology
54 (1): 21–37.Hubel, D. H., and T. N. Wiesel. 2005. Brain and Visual Perception: The Story of a 25-Year Collaboration. Oxford: Oxford University
Press.Kabat, M. H., R. L. Kane, A. L. Jefferson, and R. K. Dipino. 2001. “Construct Validity of Selected Automated Neuropsychological
Assessment Metrics (ANAM) Battery Measures.” The Clinical Neuropsychologist 15 (4): 498–507.Knight, J. L., and B. H. Kantowitz. 1976. “Speed-accuracy Tradeoff in Double Stimulation: II. Effects on the Second Response.”Memory
& cognition 4 (6): 690–700.Kress, B., and T. Starner. 2013. A Review of Head-Mounted Displays (HMD) Technologies and Applications forConsumer Electronics
Proc. SPIE 8720: 87200A-1-87200A-13. doi:10.1117/12.2015654.Lamar, E. S., S. Hecht, S. Shlaer, and C. D. Hendley. 1947. “Size, Shape, and Contrast in Detection of Targets by Daylight Vision I. Data
and Analytical Description.” Journal of the Optical Society of America 37 (7): 531–545.Lin, C. J., Y. Hsieh, H. Chen, and J. C. Chen. 1998. “Visual Performance and Fatigue in Reading Vibrating Numeric Displays.” Displays
29: 386–392.Ni, T., D. A. Bowman, and J. Chen. 2006. “Increased Display Size and Resolution Improve Task Performance in Information-Rich
Virtual Environments.” In Proceedings of Graphics Interface (GI ’06, 139–146). Toronto, Ontario: Canadian Information ProcessingSociety.
[AQ17] [AQ18]
[AQ19]
[AQ20]
[AQ21]
[AQ22] [AQ23]
[AQ24] [AQ25]
[AQ26]
TERG 973914—16/12/2014—MANIVANNAN.E—497143———Style 2
Ergonomics 17
881
882
883
884
885
886
887
888
889
890
891
892
893
894
895
896
897
898
899
900
901
902
903
904
905
906
907
908
909
910
911
912
913
914
915
916
917
918
919
920
921
922
923
924
925
926
927
928
929
930
931
932
933
934
935

Ni, T., G. S. Schmidt, O. G. Staadt, M. A. Livingston, R. Ball, and R. May. 2006. “A Survey of Large High-Resolution DisplayTechnologies, Techniques, and Applications.” In Virtual Reality Conference, 223–236, IEEE, March.
Norman, D. A., and D. G. Bobrow. 1975. “On Data-Limited and Resource-Limited Processes.” Cognitive Psychology 7: 44–64.Schhenkman, B. N. 2003. “Appearance, Clarity, Acceptance and Beauty of Jagged Letters on Computer Screens.” Displays 24: 15–23.Shadish, W. R., T. D. Cook, and D. T. Campbell. 2002. Experimental and Quasi-Experimental Designs for Generalized Causal Inference.
Boston, MA: Houghton Mifflin Company.Szalma, J. L., T. N. Schmidt, G. L. Teo, and P. A. Hancock. 2014. “Vigilance on the Move: Video-Game Based Measurement of
Sustained Attention.” Ergonomics. Forthcoming.Tan, D. S., D. Gergle, P. Scupelli, and R. Pausch. 2006. “Physically Large Displays Improve Performance on Spatial Tasks.” ACM
Transactions on Computer–Human Interaction 13 (1): 71–99.U.S. Armed Forces NRC Vision Committee. 1950. Standards to be Employed in Research on Visual Displays. Washington, DC: U.S.
Armed Forces Department of Defense.Woodworth, R. S. 1938. Experimental Psychology. New York: Holt, Rinehart, and Winston.Yeh, Y. Y., and C. D. Wickens. 1988. “Dissociation of Performance and Subjective Measures of Workload.” Human Factors 30 (1):
111–120.
[AQ27]
[AQ28]
[AQ29]
[AQ30] [AQ31]
[AQ32]
TERG 973914—16/12/2014—MANIVANNAN.E—497143———Style 2
P.A. Hancock et al.18
936
937
938
939
940
941
942
943
944
945
946
947
948
949
950
951
952
953
954
955
956
957
958
959
960
961
962
963
964
965
966
967
968
969
970
971
972
973
974
975
976
977
978
979
980
981
982
983
984
985
986
987
988
989
990