
Copyright Statement General copyright and disclaimer - CiteSeerX
Upload
khangminh22Category
view
1download
0
!
!
Copyright
Yiyuan Ben Yin
2019


!!
ABSTRACT
Sensing and Mitigating Water Contaminants with Engineered Gold-Based Nanostructures
by
Yiyuan Ben Yin
Decentralized or distributed water monitoring and treatment systems are expected to be a
fundamental tenant of the next generation of solutions aimed at addressing the global
water crisis. Within this context, emerging nanotechnology-based options provide a
promising approach to overcome many of the shortcomings associated with traditional,
centralized water treatment technologies. For example, in the realm of water monitoring,
gold-based nanostructures exhibit unique optical properties compared with bulk Au
which can be employed as more rapid and affordable options for contaminant detection
than conventional technologies (e.g., ion chromatography). However, there are still many
technological challenges that limit practical implementation. Typically, Au
nanostructures lack the sensitivity to detect contaminants at low concentration levels
relevant to drinking water standards, and/or display insufficient selectivity to find
practical use in real complex water matrices. Similarly, regarding remediation, Au-based
nanostructures display promising catalytic performance towards the degradation of
contaminants but are often negatively impacted by other co-present species in the water
matrix. This is particularly problematic in the treatment of highly complex waters such as
oil and gas hydraulic fracturing produced waters (HFPW). Here, two Au-bases
nanostructures, luminescent gold nanoclusters (Au NCs) and bimetallic palladium gold

!!
nanoparticles (PdAu NPs), were investigated for their ability to circumvent these
limitations for contaminant sensing and catalytic water treatment, respectively.
Hexavalent chromium (Cr(VI)) is a carcinogenic contaminant regulated by the
United States Environmental Protection Agency (US EPA) with the maximum
contaminant level (MCL) of 100 ppb in drinking water. As Cr(VI) detection probes,
novel Au nanostructures with Au NCs encapsulated in silica-coated microcapsule
structures were developed, which have a 5× luminescence enhancement compared to
traditional luminescent Au NCs, and can detect Cr(VI) at concentrations as low as 6 ppb.!
The Au microcapsules can also be successfully extended to a simple test strip system,
similar to that of a pH indicator paper.
The reuse of HFPW requires the removal of organic compounds. Bimetallic PdAu
NPs were investigated as catalysts to degrade phenol, a model organic compound, at
room temperature and atmospheric pressure via the in-situ catalytic formation of H2O2.
PdAu showed the highest rate of phenol degradation compared with pure Pd and Au in
simulated HFPW with total dissolved solid (TDS) concentration as high as ~16,000 ppm.
However, while viable, performance was still negatively impacted by neutral pH and
elevated TDS concentrations. It was further found that with a cost-effective additive,
bimetallic PdAu NPs can degrade phenol with a TDS of ~160,000 ppm even at neutral
pH. Again compared to pure Pd and Au, bimetallic PdAu NPs showed greater resistance
to high TDS and lower byproduct formation rates. As a proof of concept, a scaled-up
model of this technology was built implementing a circulating trickle bed reactor to
successfully treat model HFPW.!

!
!
Acknowledgments
When I looked back my five-year Ph.D. research on catalysis and nanomaterials, I
surprisingly found this journey somewhat resembled a typical catalytic reaction pathway.
Looking at the reaction coordinate diagram, which shows the energy changes of a
molecule along its reaction pathway, I am thinking myself as the molecule. How similar
the energy ups and downs of the molecule is to the countless ups and downs during my
Ph.D. path. More similarly, catalysts could accelerate the reaction by reducing the energy
barrier and there are actually many excellent “catalysts” making my Ph.D. path less
struggled. Here, I would like to express my deep gratitude for these “catalysts”.
Firstly, I would like to thank my Ph.D. advisor Dr. Michael S. Wong for
providing guidance and supports along my Ph.D. journey at Rice University. I’m always
thankful for being offered by numerous opportunities from Dr. Wong. The training I
received at Wong Group significantly improved my research logics and presentation
skills, which benefited me for my time as a Ph.D. student and will be a treasure for my
future career. The high standards set by Dr. Wong seemed scary but eventually pushed
me to be a better and well-rounded person.
I appreciate Dr. Aditya Mohite, Dr. Eilaf Egap, and Dr. Michael Reynolds served
in my thesis committee and provided feedback for my research work. As a collaborator
and sponsor for parts of my research, Dr. Reynolds generously shared his knowledge
with me and continuously encouraged and helped me along my Ph.D. journey.
I am deeply gratitude for all my co-authors and collaborators contributing to my
research. I thank Dr. Z. Conrad Zhang for hosting me as a visiting scholar at Dalian

vi!!
Institute of Chemical Physics (DICP), China for our collaboration project in the summer
of 2016. Dr. Zhang’s patience, kindness, humbleness and high working efficiency always
impress and motivate me. I thank Dr. Nathan Cai and Ms. Christina Robinson for the
helpful discussion on commercialization opportunities of my sensing project. I thank
Ibrahim A. Said for the help of constructing the recirculating trickle bed reactor. I thank
all staff, faculty and members in the Nanotechnology Enabled Water Treatment (NEWT)
Center, especially the Director Dr. Pedro J. J. Alvarez, for providing a collaborative and
interactive research platform.
I would like to thank all my current and previous colleagues in the Catalysis and
Nanomaterials Laboratory for being parts of my Ph.D. journey. Specifically I thank Dr.
Li Chen for her tremendous mentorship not only for my research but also for my life. I
clearly remembered numerous late nights we worked and discussed together in the lab
and office. Your braveness always encourages me. I thank Dr. Kimberly Heck for her
huge help on revising my manuscripts and providing insights for my research. I thank Mr.
Christian Coonrod for helping edit my thesis and offer strong help for various my
projects. I thank Dr. Varun Gangoli and Mr. Yinhong Cheng for their guidance and help
for my first project at the beginning of my Ph.D. journey. I thank Dr. Ciceron Ayala for
his kind supports on transmission electron microscope imaging. I thank Ms. Sujin Guo
and Ms. Camilah Powell for their continuous encouragement and supports along the
journey. I thank Ms. Chelsea Clark for her technical supports on various instrumentation
and helpful discussions on my research. I also thank Dr. Zhun Zhao, Dr. Yu-lun Fang,
Dr. Zhen Wang, Dr. Welman Elias, Dr. Mayank Gupta, Dr. Sivaram Pradhan, Dr. Pinn-
Tsong Chiang, Ms. Yan Xu, Ms. Priscilla Dias, Mr. Jake Lobb, Ms. Samantha

vii!!
Samaniego, Mr. Hunter Jacobs, Ms. Tanya Rogers, Mr. Austin Fehr, Ms. Lijie Duan, Mr.
Bo Wang, and Ms. Xinying Luan for being together with me and helping me at the
Catalysis and Nanomaterials Laboratory.
I would like to thank my friends who have walked together with me though my
toughest five years. Especially to Dr. Jieyi Zhang, Dr. Jun Kuang, Dr. Yuchong Zhang,
Dr. Yan Yan, Mr. Leilei Zhang, Dr. Zeliang Chen, without the encouragement and
accompany from you, I could not make through my Ph.D. journey. I thank Dr. Yongchao
Zeng, Dr. Le Wang, Dr. Xiaoqun Mu and Dr. Luqing Qi for providing helpful career
advice.
Last but not least, I would like to express my deepest gratitude to my family: my
father Lixin Yin, mother Yinzhi Xu, wife YanLin Cai and daughter Lexi Yin. My parents
persuaded me to pursue my Ph.D. that was not my plan five years ago. Look back from
now, I was thankful to take their suggestion and start this incredible journey. My parents
did not understand much about my research, but they were always willing to listen and
ready to provide unconditional supports. I met my wife during the time when my projects
get stuck and I was depressed to think of quitting. The optimism, proactivity and
confidence her brought to me changed my life. The career advice from my wife pushed
me stepped of my comfort zone, which led directly to my job offer. Lexi came to my
family towards the end of my Ph.D. journey, which motivated me to take more
responsibilities as a father.
Yiyuan Ben Yin
December 2019

!
!
Table of Contents
Acknowledgments ............................................................................................................. v!
Table of Contents ........................................................................................................... viii!
List of Figures ................................................................................................................. xiii!
List of Tables ................................................................................................................. xvii!
List of Scheme .............................................................................................................. xviii!
Chapter 1 Background and Research Overview ............................................................ 1!
1.1. Centralized versus decentralized water treatment and monitoring systems!.............!1!
1.1.1. Point of use (POU) drinking water monitoring!.................................................!4!
1.1.2. On-site hydraulic fracturing produced water treatment and reuse!.....................!5!
1.2. Nanostructures-enabled DWTM systems!.................................................................!7!
1.3. Gold nanostructures as sensing materials!.................................................................!9!
1.3.1. Luminescent gold nanoclusters!.......................................................................!10!
1.3.2. Au NCs for water contaminant sensing!...........................................................!11!
1.4. Gold-based nanostructures as catalytic materials!...................................................!11!
1.4.1. Bimetallic PdAu catalysts!................................................................................!12!
1.4.2. PdAu catalyst for water contaminant degradation!...........................................!12!
1.5. Research overview and thesis layout!.....................................................................!13!
1.6. Reference!...............................................................................................................!17!
Chapter 2 Microencapsulated Photoluminescent Gold for ppb-level Chromium(VI) Sensing ............................................................................................................................. 23!
2.1. Introduction!............................................................................................................!23!
2.2. Experimental!..........................................................................................................!26!
2.2.1. Materials!..........................................................................................................!26!
2.2.2. Synthesis of Luminescent Glutathione-capped Gold Nanoclusters (GSH-Au NCs)!..........................................................................................................................!27!
2.2.3. Synthesis of Luminescent GSH-Au NC-containing Microcapsules (Au-MCs)!...................................................................................................................................!28!
2.2.4. Characterization!...............................................................................................!28!
2.2.5. Quantum Yield (QY) Measurements!...............................................................!29!

ix!!
2.2.6. Cr(VI) Sensing Studies!....................................................................................!30!
2.2.7. Synthesis of RBITC-conjugated PAH!.............................................................!32!
2.2.8. Test Strip Study!...............................................................................................!32!
2.3. Results and Discussion!...........................................................................................!32!
2.3.1. Characterization of GSH-Au NCs!...................................................................!32!
2.3.2. Encapsulation of GSH-Au NCs!.......................................................................!33!
2.3.3. Photoluminescence enhancement of Au-MCs!.................................................!38!
2.3.4. Sensitivity of GSH-Au NCs to Different Ions!.................................................!40!
2.3.5. Sensitivity of GSH-Au NCs and Au-MCs to Cr(VI) at different concentrations!...................................................................................................................................!42!
2.3.6. Indirect evidence for low pH inside the microcapsules!...................................!46!
2.3.7. Cr(VI) strip-based sensor using Au-MCs!........................................................!47!
2.4. Conclusions!............................................................................................................!48!
2.5. Supplementary Information!...................................................................................!49!
2.5.1. Synthesis of RBITC!.........................................................................................!50!
2.5.2. Synthesis and testing of RBITC-PAH MCs!....................................................!51!
2.5.3. Characterization of GSH-Au NCs!...................................................................!52!
2.5.4. Estimating Au content of Au-MCs!..................................................................!53!
2.6. Reference!...............................................................................................................!60!
Chapter 3 Treating Water by Degrading Oxyanions Using Metallic Nanostructures........................................................................................................................................... 66!
3.1. Introduction!............................................................................................................!66!
3.1.1. Sustainability of water!.....................................................................................!66!
3.1.2. Toxic oxyanion contamination!........................................................................!67!
3.1.3. Metallic nanostructure based catalytic water treatment as a sustainable process!...................................................................................................................................!70!
3.2. Catalytic Detoxification of Oxyanions Using Metallic Nanostructures!.................!72!
3.2.1. Nitrogen oxyanions!.........................................................................................!73!
3.2.1.1. Occurrence and health effects!...................................................................!73!3.2.1.2. Current technology!....................................................................................!73!3.2.1.3. Catalytic chemistry!...................................................................................!74!3.2.1.4. Assessment of technology readiness!.........................................................!81!

x!!
3.2.2. Chromium Oxyanions!.....................................................................................!82!
3.2.2.1. Occurrence and health effects!...................................................................!82!3.2.2.2. Current technologies!.................................................................................!82!3.2.2.3. Catalytic chemistry!...................................................................................!83!3.2.2.4. Assessment of technology readiness!.........................................................!86!
3.2.3. Halogen oxyanions!..........................................................................................!86!
3.2.3.1. Occurrence and health effects!...................................................................!86!3.2.3.2. Current technologies!.................................................................................!87!3.2.3.3. Catalytic chemistry for bromine oxyanion!................................................!88!3.2.3.4. Catalytic chemistry for chlorine oxyanions!..............................................!90!3.2.3.5. Assessment of the technology readiness!...................................................!91!
3.3. Perspective and Research Opportunities!................................................................!92!
3.3.1. Comparison of reduction catalytic activity for the different oxyanions!...........!92!
3.3.2. Applicability of catalytic remediation to other oxyanions!...............................!93!
3.3.3. Possible catalytic water treatment scenarios using metallic nanostructures!....!94!
3.3.4. Roadmap for deployment of catalysts for oxyanion treatments!.......................!95!
3.3.5. Practical implementation issues of catalytic water treatment!..........................!95!
3.4. Conclusions!............................................................................................................!97!
3.5. References!..............................................................................................................!97!
Chapter 4 PdAu-catalyzed Oxidation through in situ Generated H2O2 in Simulated Produced Water ............................................................................................................ 115!
4.1. Introduction!..........................................................................................................!115!
4.2. Experimental!........................................................................................................!118!
4.2.1. Materials!........................................................................................................!118!
4.2.2. Catalyst preparation and characterization!......................................................!119!
4.2.3. H2O2 formation and detection!........................................................................!119!
4.2.4. Detection of hydroxyl radicals!......................................................................!122!
4.2.5. Phenol degradation reaction!..........................................................................!123!
4.3. Results and discussion!.........................................................................................!124!
4.3.1. H2O2 and hydroxyl radical generation!...........................................................!124!
4.3.2. Phenol degradation!........................................................................................!130!
4.3.3. Effect of ferrous iron!.....................................................................................!134!
4.3.4. Effect of pH and salinity!................................................................................!135!

xi!!
4.4. Conclusion!...........................................................................................................!137!
4.5. Supplementary Information!.................................................................................!138!
4.6. Reference!.............................................................................................................!145!
Chapter 5 Room-temperature Catalytic Treatment of High-salinity Produced Water at Neutral pH ................................................................................................................. 150!
5.1. Introduction!..........................................................................................................!150!
5.2. Experimental!........................................................................................................!153!
5.2.1. Materials!........................................................................................................!153!
5.2.2. Catalyst preparation and characterization!......................................................!153!
5.2.3. H2O2 formation in batch reactor!....................................................................!154!
5.2.4. Phenol degradation in batch reactor!..............................................................!156!
5.2.5. Quantification of nitrogen byproducts from HA oxidation!...........................!157!
5.2.6. Phenol degradation in recirculating trickle bed reactor (TBR)!......................!157!
5.2.7. Modeling of overall phenol degradation rate in recirculating TBR!...............!159!
5.3. Results and discussion!.........................................................................................!160!
5.3.1. H2O2 generation from HA oxidation in batch reactor!....................................!160!
5.3.2. Phenol degradation in batch reactor!..............................................................!163!
5.3.3. Effect of pH and salinity in batch reactor!......................................................!165!
5.3.4. HA oxidation byproduct detection!.................................................................!167!
5.3.5. Phenol degradation in circulated TBR!...........................................................!168!
5.4. Conclusion!...........................................................................................................!170!
5.5. Supplementary Information!.................................................................................!172!
5.6. Reference!.............................................................................................................!173!
Chapter 6 Towards Glucuronic Acid through Oxidation of Methyl-glucoside Using PdAu Catalysts .............................................................................................................. 177!
6.1. Introduction!..........................................................................................................!177!
6.2. Experimental!........................................................................................................!180!
6.2.1. Catalyst preparation and characterization!......................................................!180!
6.2.2. Catalytic testing!.............................................................................................!180!
6.3. Results and discussion!.........................................................................................!183!
6.3.1. Catalyst structure!...........................................................................................!183!

xii!!
6.3.2. Effect of Pd surface coverage on catalyst activity of MG oxidation!.............!184!
6.3.3. Effect of Pd surface coverage on MGA yield from MG oxidation!................!186!
6.4. Conclusion!...........................................................................................................!189!
6.5. Supplementary Information!.................................................................................!189!
6.5.1. Materials!........................................................................................................!189!
6.5.2. NP Synthesis!..................................................................................................!190!
6.5.3. Carbon-supported catalyst preparation!..........................................................!192!
6.5.4. Catalyst characterization!................................................................................!193!
6.5.4.1. Transmission electron microscopy (TEM)!..............................................!193!6.5.4.2. Inductively Couples Plasma Optical Emission Spectrometer (ICP-OES)!.............................................................................................................................!193!
6.6. Reference!.............................................................................................................!196!
Chapter 7 Recommendations for Future Work ......................................................... 200!
7.1. Recommendations for future work!.......................................................................!200!
7.1.1. Simultaneous sensing multiple contaminants using luminescent Au nanostructures!..........................................................................................................!200!
7.1.2. Improving the catalyst and reactor for on-site produced water cleanup!........!203!
7.1.3. Development of the simultaneous contaminants sensing and degradation systems!....................................................................................................................!205!
7.2. Reference!.............................................................................................................!206!

!
!
List of Figures
Figure 1.1 Global freshwater use over long run and the percentage of freshwater used in different categories. ............................................................................................................. 2
Figure 1.2 Centralized water management systems including wastewater treatment and monitoring facility and the drinking water treatment and monitoring facility. .................. 3
Figure 1.3 Example of water quality test kit for various contaminants monitoring .......... 5
Figure 1.4 Example of a mobile oil and gas wastewater treatment unit operated on the production site to treat the produced water. ........................................................................ 7
Figure 1.5 An example of modular water treatment and monitoring system using multifunctional nanostructures. ........................................................................................... 8
Figure 1.6 Examples of the most common gold nanostructures. ..................................... 10
Figure 2.1 (a) SEM image of Au-MCs (containing 4.8 wt% Au). (b) Size histogram of Au-MCs based on 200 imaged particles. TEM images of (c) an individual Au-MC and (d) shell structure of the Au-MC with SiO2 NPs circled in red. ............................................. 36
Figure 2.2 Water suspensions of MCs that (a) contain and (b) not contain GSH-Au NCs. Dried MCs (c) containing and (d) not containing GSH-Au NCs, recovered after centrifugation and vacuum drying. Upper panels: visible light illumination. Lower panels: UV light illumination (at 365 nm). ................................................................................... 37
Figure 2.3 (a) Au-MC suspensions with increasing Au loading (0, 0.125×10⁷, 0.25×10⁷, 0.5×10⁷, 1×10⁷, 2×10⁷, 3×10⁷ Au NCs per microcapsule) (upper: visible light; (lower: UV illumination) MC concentration of ~108 capsules/mL. (b) Luminescence peak intensity (at 600 nm; excitation wavelength of 365 nm) as function of Au content. (c) Brightfield and confocal microscope images of Au-MCs (4.8 wt% Au). ........................................... 38
Figure 2.4 (a) Suspensions of GSH-Au NCs and Au-MCs under UV illumination (365 nm), and corresponding (b) photoemission (365 nm excitation) and (c) absorbance/photoextinction spectra. (overall Au concentration in vial for both suspensions = 0.03 mM on Au atom basis). ..................................................................... 39
Figure 2.5 Relative luminescence intensity (F/F0 at 600 nm, where F and F0 are the corresponding luminescence intensities at 600 nm with and without 20 µM tested ion) of the GSH-Au NCs (a) in acidified DI water (pH 1) and (b) in DI water (pH 7), and of (c) the Au-MCs in DI water (pH 7). Final Au atom concentration of 0.003 mM. ................. 40

xiv!!
Figure 2.6 Luminescence ratio (F/F0) of (a) GSH-Au NCs and (b) Au-MCs versus Cr(VI) concentration, where F0 and F are the corresponding luminescence intensities at 600 nm (365 nm excitation) in the absence and presence of Cr(VI), respectively. Solution pH = 1 or 7 (or 7.5), Gold content = 3 µmol-Au atom per 1 L solution). ..................................... 43
Figure 2.7 Peak wavelength of UV-vis absorbance of RBITC-PAH (a) inside the MCs, and (b-d) in bulk solution at pH values of (b) 1-2, (c) pH 2-3, and (d) pH 3-9. ............... 47
Figure 2.8 Image of paper test strips with Au-MCs (0.19 µg Au per strip) (a) under visible light as it fabricated, and (b) under 365 nm UV illustration after dipping into simulated drinking water with different Cr(VI) concentrations and plot of the relative color intensity (I/I0) versus Cr(VI) concentration ............................................................. 48
Figure 3.1 Periodic table showing the most common oxyanion and cation species (marked by color) under drinking water conditions (pH 6.5~8.5, Eh 0.1~0.4 V). Thermodynamically stable oxyanions are peach-colored, kinetically stable oxyanions are in red, and cationic elements are in blue. .......................................................................... 68
Figure 3.2 Pourbaix diagram of (a) sulfur (modified from Vermeulen et al.[13]), (b) chlorine (modified from Radepont et al.[16]), and (c) iron (modified from Tolouei et al.[17]). The blue dashed lines indicate the water electrochemical potential window. .... 69
Figure 4.1 (a-c) TEM image (scale bar =50 nm) and (d-f) size distribution of alumina supported PdAu (a, d), Pd (b, e) and Au (c, f) NPs catalysts. Each bar represents percentage of NPs in the diameter range 0.5 nm. ........................................................... 125
Figure 4.2 Time profiles for (a) H2O2 concentrations, (b) H2O2 formation rates, and (c) formic acid conversion using PdAu, Pd, and Au catalysts. (d) H2O2 selectivity-formic acid conversion plot. Reaction conditions: 20 mg PdAu/Al2O3 or 20 mg Pd/Al2O3 or 200 mg Au/Al2O3, 23 °C, 100 mL, 0.2 M formic acid, 50 mL min-1 O2, and initial pH = 2. 126
Figure 4.3 (a, c, e) Phenol and catechol concentration profiles using (a) PdAu, (c) Pd and (e) Au catalysts; (b, d, f) formic acid and H2O2 concentration profiles using (b) PdAu, (d) Pd and (f) Au catalysts. Reaction conditions: 50 mg PdAu/Al2O3, or 50 mg Pd/Al2O3 or 200 mg PdAu/Al2O3, 23 °C, 100 mL, 0.2 M formic acid, 100 ppm phenol, 50 mL min-1 O2, and initial pH = 2. ..................................................................................................... 131
Figure 4.4 Phenol degradation reaction constant (on a g-metal basis) in PdAu, Pd, and Au catalytic systems with the presence of different concentration of ferrous iron. Reaction conditions: 20 mg PdAu/Al2O3 or 20 mg Pd/Al2O3 or 200 mg Au/Al2O3, 23 °C, 100 mL, 0.2 M formic acid, 100 ppm phenol, 0-10 ppm Fe(II), 50 mL min-1 O2, and initial pH = 2. .................................................................................................................. 135

xv!!
Figure 4.5 Initial phenol degradation reaction rate constant on a g-metal basis (kcat) in water ([TDS]~0 mg/L) (a) at different pH and (b) with different TDS concentrations (corresponding to 1×, 10×, 102×, 103×, 104×, 105×, and 106× dilutions of simulated HF-PW stock solution). Reaction conditions: 20 mg PdAu/Al2O3 or 20 mg Pd/Al2O3 or 200 mg Au/Al2O3, 23 °C, 100 mL, 0.2 M formic acid, 100 ppm phenol, 5 ppm Fe(II), 50 mL min-1 O2. .......................................................................................................................... 136
Figure 5.1 Time profiles for (a) H2O2 and (b) HA concentrations, and (c) H2O2 selectivity-HA conversion plots for PdAu, Pd, and Au catalysts. Reaction conditions: 20 mg PdAu/Al2O3 or 20 mg Pd/Al2O3 or 200 mg Au/Al2O3, 23 °C, 100 mL, 10 mM HA, 50 mL min-1 O2, and initial pH = 9.0. .................................................................................. 161
Figure 5.2 Time profiles for (a) phenol (solid lines) and TOC (dashed lines), (b) HA, and (c) H2O2 concentration using PdAu, Pd, and Au catalysts. Reaction conditions: 20 mg PdAu/Al2O3, or 20 mg Pd/Al2O3 or 200 mg PdAu/Al2O3, 23 °C, 100 mL, 10 mM HA, 100 ppm phenol (~1.06 mM), 50 mL min-1 O2, and initial pH = 9. ................................ 163
Figure 5.3 Initial phenol degradation reaction rate constant on a g-metal basis (kcat) (a) in DI water ([Cl-] ~ 0 mg/L) at pH 5-8 buffered by phosphate, and (b) in water with chloride concentrations of 0, 3, 30, 300, 3000 mM (or 0, 100, 1000, 10000, 100000 ppm) buffered at pH 7. Reaction conditions: 20 mg PdAu/Al2O3 or 20 mg Pd/Al2O3 or 200 mg Au/Al2O3, 23 °C, 100 mL, 10 mM HA, 100 ppm phenol, 8 mM phosphate, 50 mL min-1 O2. ................................................................................................................................... 166
Figure 5.4 HA, NO2- and NO3
- concentration profiles using (a) PdAu, (b) Pd and (c) Au catalysts during phenol oxidation. Reaction conditions: 20 mg PdAu/Al2O3 or 20 mg Pd/Al2O3 or 200 mg Au/Al2O3, 23 °C, 100 mL, 10 mM HA, 100 ppm phenol, 8 mM phosphate, 50 mL min-1 O2, and pH ~ 7. ........................................................................ 167
Figure 5.5 Experimental (dots) and modeled (curves) phenol degradation profiles in recirculating TBR in DI water and simulated HFPW. Solid curve and dash curve indicate semi-batch reactor model without (Eqn 1) and with (Eqn 2) considering performance decay, respectively. Reaction condition: 250 g Pd/Al2O3, 23 °C, 100 ppm phenol, 8 mM phosphate, pH~7, 12 L min-1 air. .................................................................................... 169
Figure 6.1 (a) Concentration-time profiles for 0, 30, 50 and 80 sc% Pd-on-Au/C catalysts and (b) concentration-time profiles for 80, 100, 150, 300 sc% Pd-on-Au/C and Pd/C (both synthesized and purchased) catalysts. Reaction conditions: 50 °C, 50 mL, 0.1 M MG, 0.4 M NaOH, pH = 13, and 100 mL min-1 O2. ..................................................................... 185
Figure 6.2 Plot of initial TOF with Pd surface coverage. Reaction conditions: 50 °C, 50 mL, 0.1 M MG, 0.4 M NaOH, pH = 13, and 100 mL min-1 O2. ..................................... 186

xvi!!
Figure 6.3 Reaction products and carbon balance of MG oxidation using 80 sc% Pd-on-Au/C catalyst. Reaction conditions: 50 °C, 50 mL, 0.1 M MG, 0.4 M NaOH, pH = 13, and 100 mL min-1 O2. ...................................................................................................... 187
Figure 6.4 Plot of MGA yields (at the end of the 8-hr reaction) with Pd surface coverage (black squares). Glucuronic acid yield from glucose oxidation using 80 sc% Pd-on-Au NPs (blue cross). Reaction conditions: 50 °C, 50 mL, 0.1 M MG (or glucose), 0.4 M NaOH, pH =13, and 100 mL min-1 O2. ........................................................................... 188
Figure 7.1 (a) Fluorescence intensity spectra of BSA-Au NCs for different concentrations of Pb2+ at pH ~7. (b) Fluorescence quenching as a function of Pb2+ concentration in water at pH ~7. F denotes the fluorescence intensity at a certain amount of Pb2+ present, while F0 represents the original fluorescence of BSA-Au NCs with no Pb in the water sample. ........................................................................................................ 202
Figure 7.2 Effect of 10 !M of chloride metals on the fluorescence of 2 !M of BSA-AuNCs at a neutral pH. ................................................................................................... 202
Figure 7.3 Plot of initial H2O2 productivity with Pd surface coverage. Reaction conditions: 23 °C, 50 mL, 10 mM hydroxylamine, pH = 9, and 50 mL min-1 O2. ......... 204

!
!
List of Tables
Table 2.1 Comparison of KSV and LOD for GSH-Au NCs and Au-MCs. ....................... 43
Table 3.1 Concentration level and health effect of common toxic oxyanions ................. 71
Table 3.2 Performance of metallic nanostructures in the catalytic reduction of nitrite ... 77
Table 3.3 Performance of metallic nanostructures in the catalytic reduction of nitrate ... 80
Table 3.4 Performance of metallic nanostructures in the catalytic reduction of chromate........................................................................................................................................... 85
Table 3.5 Performance of metallic nanostructures in the catalytic reduction of bromate 89
Table 3.6 Performance of metallic nanostructures in the catalytic reduction of perchlorate........................................................................................................................................... 90
Table 4.1 Initial H2O2 formation rate, initial formic acid reaction constant and zero-conversion H2O2 selectivity of PdAu, Pd, and Au catalysts. .......................................... 127
Table 4.2 Initial phenol degradation reaction constant, initial formic acid decomposition reaction constant and formic acid utilization efficiency of PdAu, Pd, and Au catalysts. 133
Table 5.1 Catalyst pellet characteristics ......................................................................... 158
Table 5.2 Initial H2O2 formation rate, initial HA reaction constant and zero-conversion H2O2 selectivity for PdAu, Pd, and Au catalysts. ........................................................... 161
Table 5.3 Initial phenol degradation reaction constant, initial HA reaction constant and zero-conversion H2O2 selectivity for PdAu, Pd, and Au catalysts. ................................ 164
Table 5.4 NO2-/NO3
- byproduct selectivity from HA oxidation in phenol degradation experiments at different Cl- concentrations of 0, 3, 30, and 300, mM (or 0, 10, 100, 1000 ppm). ............................................................................................................................... 168
Table 5.5 Fitted phenol degradation reaction rate constants at DI water and simulated HFPW conditions using semi-batch reactor model ........................................................ 170

!
!
List of Scheme
Scheme 2.1 Formation of charged-assembled microcapsules (MCs) that (a) contain and (b) not contain the luminescent GSH-Au NCs. ................................................................ 35
Scheme 3.1 Reduction reaction of nitrite and nitrate, to nitrogen gas and ammonia with corresponding standard Gibbs free energy values (25 °C, 1 atm, 1 M reactant concentrations, pH 0) ........................................................................................................ 75
Scheme 3.2 Nitrite catalytic reduction pathway on Pd surface with hydrogen gas as a reducing agent (modified from Martínez et al.[68]). The DFT calculated pathway is kinetically unlikely to occur. ............................................................................................. 76
Scheme 3.3 Nitrate catalytic reaction pathway to nitrite on Pd surface with M (Cu, Sn, or In) as a secondary metal promoter and hydrogen gas as a reducing agent (modified from Guo et al.[36]) ................................................................................................................... 79
Scheme 3.4 Formic acid (HCOOH) decomposition to hydrogen and carbon dioxide, reduction reaction of chromium oxyanion, and formation of chromium hydroxide with their corresponding standard Gibbs free energy values (25 °C, 1 atm, 1 M reactant concentrations, pH 0) ........................................................................................................ 83
Scheme 3.5 Reduction reactions of bromate, chlorite, chlorate and perchlorate with the corresponding standard Gibbs free energy values (25 °C, 1 atm, 1 M reactant concentrations, pH 0) ........................................................................................................ 88
Scheme 3.6 Reduction reaction of arsenate/arsenite to arsenic metal, and selenate to selenium metal with corresponding standard Gibbs free energy values (25 °C, 1 atm, 1 M reactant concentrations, pH 0) .......................................................................................... 93
Scheme 3.7 Technology readiness level (TRL) for catalytic reduction of oxyanion contaminants. The colored boxes represent current and past activities in research and development. ..................................................................................................................... 95
Scheme 4.1 Proposed reaction mechanism of formic acid decomposition, surface •OH radical and H2O2 formation PdAu catalyst surfaces ....................................................... 130
Scheme 5.1 (a) Schematic of TBR operating in recirculating mode, and (b) corresponding semi-batch reactor model to account for phenol concentration changes in reservoir tank.......................................................................................................................................... 158
xix!!
Scheme 6.1 Direct synthesis of glucuronic acid via biocatalyzed glucose oxidation (red path), and indirect synthesis of glucuronic acid via metal-catalyzed MG oxidation (blue path). ............................................................................................................................... 180
Scheme 7.1 Example of paper-based multiple contaminants test strip. Different colors indicate different contaminants sensing areas with different Au NCs ............................ 201

!
!
Chapter 1
Background and Research Overview
1.1. Centralized versus decentralized water treatment and monitoring
systems
Fresh water is essential for human activities including household use, irrigation
for food production, industrial use, and for energy production. Currently around four
trillion cubic meter of water is consumed globally every year, among which 70% is for
agricultural use, 22% is for industrial use, 6% is for household use and 2% is as drinking
water. (Fig. 1.1) However, readily available fresh water only accounts for ~1% of the
total water on earth.[1] Ensuring a safe and sustainable water supply is critical for the
continuous and stable development of human society.

2!!
Figure 1.1 Global freshwater use over long run and the percentage of freshwater used in different categories. (Figure adapted from https://ourworldindata.org/water-use-stress)
Towards this goal, considerable effort has been put towards developing
technologies for water treatment and quality monitoring which can function at high
throughput. Modern examples include Centralized Water Treatment and Monitoring
(CWTM) facilities (Fig. 1.2), which are typically used to service urban areas.[2] CWTM
facilities treat and monitor millions of cubic meter water every day, providing clean water
for millions of people.

3!!
!
Figure 1.2 Centralized water management systems including wastewater treatment and monitoring facility and the drinking water treatment and monitoring facility. (Figure adapted from https://www.epa.ie/pubs/reports/water/wastewater/).
However, CWTM facilities have several key disadvantages.[3] CWTM facilities
are large, centralized treatment plants and thus are often unable to address the supply
needs for the people living in rural areas and/or developing regions. More than 800
million people live without the access to safe drinking water, and two million children
under the age of five die each year due to the lack of safe drinking water.[4] Similarly,
the prohibitively expensive infrastructure (e.g., piping, pumping) required to transport
wastewaters generated far from CWTM facilities also implies that out-of-network regions
not only have freshwater supply issues, but limited means of removing generated
wastewater. Third, CWTM facilities cannot be easily or affordably upgraded to increase
capacity or capabilities, thus CWTM facilities are unable to treat emerging classes of
wastewater, such as the produced water generated from hydraulic fracturing sites.[5]

4!!These limitations highlight the need for decentralized (distributed) water
treatment and/or monitoring (DWTM) systems, which can complement the disadvantages
of the centralized system. Two examples of the DWTM systems, point of use (POU)
drinking water monitoring and on-site hydraulic fracturing produced water treatment, are
highlighted below.
1.1.1. Point of use (POU) drinking water monitoring
Although water quality is carefully monitored at CWTM facilities, the water
quality at the residence of many users may change as a result of transportation through
the pipelines. Corrosion, bacteria contamination, or metal leaching from the pipeline can
contaminate water making it unsafe to use.[6] In a tragic recent example, lead leached
from water pipes into drinking water, exposed over 100,000 residents to elevated lead
levels in the city of Flint, MI in 2014.[7]
Water obtained from CWTM facilities is also greatly affected by the weather
conditions. Extreme weather conditions, such as hurricanes, may lower the treatment
capacity, which results in the poor household water quality.[8] In 2017, Hurricane
Harvey made landfall in southeast Texas, disrupting power and causing at least 45
CWTM facilities to shut down. This left hundreds of communities in southeast Texas
without safe drinking water.[9]
In the rural areas of some developing countries (e.g., Zambian, Bangladesh)
where CWTM facilities are not available, fresh water is primarily obtained from wells
and surface water.[10] The quality of these waters is often unknown and may have
negative impacts on human health.
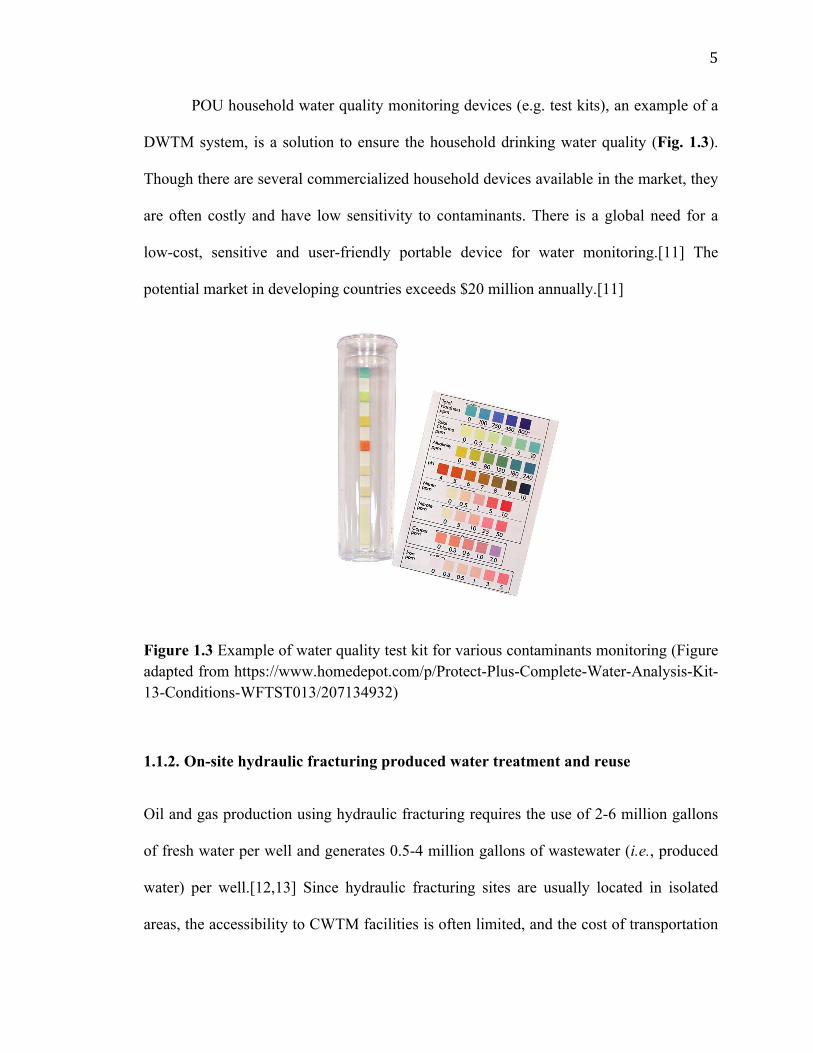
5!!POU household water quality monitoring devices (e.g. test kits), an example of a
DWTM system, is a solution to ensure the household drinking water quality (Fig. 1.3).
Though there are several commercialized household devices available in the market, they
are often costly and have low sensitivity to contaminants. There is a global need for a
low-cost, sensitive and user-friendly portable device for water monitoring.[11] The
potential market in developing countries exceeds $20 million annually.[11]
!
Figure 1.3 Example of water quality test kit for various contaminants monitoring (Figure adapted from https://www.homedepot.com/p/Protect-Plus-Complete-Water-Analysis-Kit-13-Conditions-WFTST013/207134932)
1.1.2. On-site hydraulic fracturing produced water treatment and reuse
Oil and gas production using hydraulic fracturing requires the use of 2-6 million gallons
of fresh water per well and generates 0.5-4 million gallons of wastewater (i.e., produced
water) per well.[12,13] Since hydraulic fracturing sites are usually located in isolated
areas, the accessibility to CWTM facilities is often limited, and the cost of transportation

6!!
of produced water to a CWTM facility is often too high to be economical. [14]
Additionally, CWTM facilities are usually designed to treat far less contaminated
municipal wastewater [15] implying that traditional CWTM facilities may not have the
capacity to treat produced water effectively; the introduction of produced water may
overload the facilities and affect normal operations.
Therefore, there is a need for DWTM units that can be operated at oil and gas
production sites (Fig. 1.4). After on-site treatment, produced water can be reused for
other hydraulic fracturing operations, which may be both more economical and
sustainable.[16] Though there are some commercialized on-site treatment options such as
ozonation[17] and filtration[18], more effective technologies with lower operating cost
are desired. An ideal DWTM unit should be small-sized, effective, low-cost and generate
no additional waste streams.

7!!
!
Figure 1.4 Example of a mobile oil and gas wastewater treatment unit operated on the production site to treat the produced water. (Figure adapted from http://www.okcrich.com/contents.php?contents=m_mobilewater)
1.2. Nanostructures-enabled DWTM systems
Nanomaterials are promising candidates for the design of DWTM systems.[19] As the
name suggests, the size of a nanomaterial is small enough to enable a miniature DWTM
system. Nanomaterials with specific sizes and structures can exhibit various properties
(e.g., optical, catalytic, magnetic, electrochemical) that may be useful for DWTM
systems. For example, the optical property of some nanostructures may change when
interacting with contaminants in water.[20] These nanostructures can therefore be
implemented as sensors to detect the presence of certain contaminants. Their catalytic
properties accelerates chemical reactions occurring on the nanostructure surface, which
can convert harmful contaminants to non-toxic species.[21] Nanostructures may also
achieve better performance while using less material. A modular water treatment and
monitoring system using multifunctional nanostructures was proposed by National
8!!
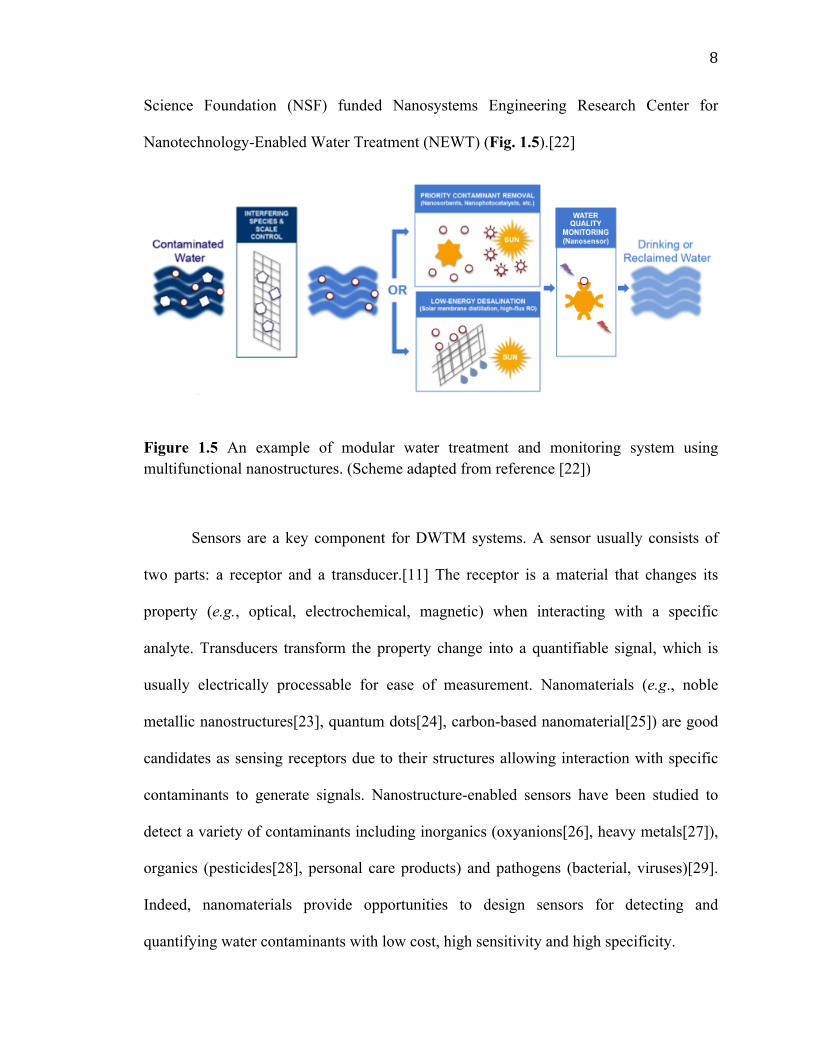
Science Foundation (NSF) funded Nanosystems Engineering Research Center for
Nanotechnology-Enabled Water Treatment (NEWT) (Fig. 1.5).[22]
!
Figure 1.5 An example of modular water treatment and monitoring system using multifunctional nanostructures. (Scheme adapted from reference [22])
Sensors are a key component for DWTM systems. A sensor usually consists of
two parts: a receptor and a transducer.[11] The receptor is a material that changes its
property (e.g., optical, electrochemical, magnetic) when interacting with a specific
analyte. Transducers transform the property change into a quantifiable signal, which is
usually electrically processable for ease of measurement. Nanomaterials (e.g., noble
metallic nanostructures[23], quantum dots[24], carbon-based nanomaterial[25]) are good
candidates as sensing receptors due to their structures allowing interaction with specific
contaminants to generate signals. Nanostructure-enabled sensors have been studied to
detect a variety of contaminants including inorganics (oxyanions[26], heavy metals[27]),
organics (pesticides[28], personal care products) and pathogens (bacterial, viruses)[29].
Indeed, nanomaterials provide opportunities to design sensors for detecting and
quantifying water contaminants with low cost, high sensitivity and high specificity.

9!!Nanostructures are also promising for their ability to remove contaminants from
water.[30] Nanostructures with large surface area to volume ratio (e.g. nano-magnetite)
can be used as adsorbents for trapping and separating contaminants. Some nanostructures
with catalytic and/or photocatalytic properties (e.g. nano-sized titania, noble metallic
nanoparticles, nanoscale zero-valent iron) can be used for oxidative or reductive
degradation of various contaminants including organic and inorganic compounds.
Gold-based nanostructures are one of the most investigated nanomaterials since
they are easy to synthesize, biocompatible, have functionalizable surfaces, and have
distinct structure-dependent physiochemical properties. The gold nanostructures used as
sensing and catalytic materials for contaminant monitoring and degradation is discussed
in detail in the following sections.
1.3. Gold nanostructures as sensing materials
Gold nanostructures refer to gold materials with nanometer-scale sizes and with well-
defined morphology, composition and surface structures.[31] Some common examples
are gold nanoparticles (Au NPs), gold nanoclusters (Au NCs), gold nanorods (Au NRs),
and gold nanoshells (Au NSs) (Fig. 1.6).[32] Gold nanostructures usually exhibit unique
optical, electrochemical and catalytic properties, which strongly depend on their physical
structures and can be changed by altering their structures. This distinct feature makes
gold nanostructures a promising material as a sensing element. Extensive research on
using gold nanostructures for sensing chemical and biological species such as metal ions,
small organics, proteins, cells and microorganisms has been conducted for over twenty
years, which has been highlighted by several review articles.[33–37]

10!!
!
Figure 1.6 Examples of the most common gold nanostructures. (Scheme adapted from reference [32])
1.3.1. Luminescent gold nanoclusters
Gold nanostructures with particle sizes smaller than two nanometers are typically called
gold nanoclusters (Au NCs).[38] The number of gold atoms in one Au NC varies from a
few atoms to ~100 atoms. Since Au NCs are usually stabilized by encapsulation in
polymer matrix (e.g. dendrimers) or by surface ligands (e.g. thiolates or proteins), the
terminology of “Au NCs” refers to the entire ensemble consisting of gold atoms and
stabilizers. The Au NCs exhibit different properties compared with Au NPs larger than 2
nm due to their small size and special structures. Rather than having surface plasmon
resonance (SPR), the Au NCs exhibit photoluminescent properties, which are attributed
to a combination of quantum confinement effect[39] and the electron transfer between
gold and the surface ligands.[40] Luminescence will disappear (or “quench”) if either the
structure of the Au NC or the ligands is damaged. This “luminescence quenching”
phenomenon of Au NCs can therefore be used for sensing.

11!!
1.3.2. Au NCs for water contaminant sensing
One popular application using luminescent Au NC is environmental analysis.[41]
Luminescent Au NCs provide highly sensitive and specific responses to detect water
contaminants at low concentrations (several ppb or ppm level) and in complex water
matrices.[42] By far, luminescent Au NCs research has been focused on heavy metals
(e.g., Cu2+, Hg+, Cd2+) and inorganic anions (e.g., NO3-, NO2-, CN-). Sensing organics
(organohalides, pesticides, personal care products) and organisms (e.g., bacteria, viruses)
water contaminants using Au NCs are relative less explored. [43,44] Multiple review
articles have summarized recent developments on luminescent Au NCs for sensing
applications.[41,45] However, low luminescence intensity limits the practical
applications of Au NCs.[46] There is a need to enhance the luminescence and improve
the sensitivity for contaminants at low concentration, especially as environmental
regulations are getting stricter. Engineered Au NCs with improved sensitivity are thus
desired to design an effective point-of-use water quality monitoring system as a part of a
DWTM system.
1.4. Gold-based nanostructures as catalytic materials
Although the use of gold materials for decorative purpose can be dated back to the fourth
century A.D., the use of gold for catalytic applications is much more recent.[47] Gold
was believed to be catalytically inactive due to its non-oxidizable appearance in bulk
phase. In the late 1980s, the findings of gold catalysis for CO oxidation by Haruta[48]
and ethylene hydrochlorination by Hutchings[49] precipitated extensive research on gold

12!!
as a catalytic material for different chemical reactions, such as alcohol oxidation to
acids[50] and direct formation of hydrogen peroxide from H2 and O2.[51]
Gold can also be added to other metallic materials (e.g., Pd, Pt, Ru) to form a
bimetallic structure. Bimetallic structures can be core-shell, segregated, or mixed, which
depends on the physical properties of the two metals and the preparation methods.
Compared with the monometallic structures, the bimetallic structures typically showed
enhanced catalytic activity, selectivity to desired products, and/or higher stability due to
synergistic effects such as geometric effect, electronic effect and bifunctional effect.
1.4.1. Bimetallic PdAu catalysts
PdAu bimetallic nanoparticles are among the most investigated Au-based bimetallic
nanostructures. One reason is that PdAu usually show superior catalytic performance than
monometallic Pd or Au catalysts. Another reason is that Au is miscible with Pd at all
compositions, which allowing the design of PdAu with different structures to investigate
the structure-performance relationship. Though the nature of synergistic effect of PdAu is
still under debate, in most common cases, Au can increases deactivation resistance of Pd
by electronic effect, dilute the Pd atoms to create single Pd atom active site,[52,53] or
provide bifunctional sites for bonding of reactants to the surface.[54] PdAu bimetallic
catalysts for different reactions are summarized by Prati and co-workers.[55]
1.4.2. PdAu catalyst for water contaminant degradation
Though PdAu catalysts have been applied to various reactions for chemical synthesis
including the commercialized process for production of vinyl acetate monomer (VAM),

13!!
its application to water remediation is still emerging.[56] Most water remediation
reactions using PdAu catalysts are based on a reductive mechanism. For example, the
reduction of halogenated hydrocarbons (e.g. trichloroethylene[57,58],
perchloroethylene[59]), oxyanions (nitrite[60,61], nitrate[62]), and nitroarenes[63]. In
most cases, the Au behaves as a catalytic support with the active sites being the Pd
ensembles deposited on Au. Bimetallic PdAu showed significantly enhanced (>10 times)
catalytic activity in contaminant degradation reactions compared with pure Pd and Au.
PdAu was also found to be more resistant to catalyst poisoning agents such as chloride.
These findings suggested PdAu nanostructures can provide an effective and economical
approach for the design of DWTM systems. PdAu's use as a catalyst in oxidative
treatment of water contaminants is less explored, which presents opportunities for
researchers.
1.5. Research overview and thesis layout
The overall goal of this thesis is to address the challenges in the design of DTWM
systems. On the contaminant sensing side, luminescent Au NCs are promising materials
for POU household contaminant sensors. However, the challenge remains to improve the
sensitivity to detect trace amounts of contaminants. One of the contributions of this thesis
is that a novel Au material called luminescent Au microcapsules (Au MCs) were
engineered with enhanced sensitivity to a toxic water contaminant, hexavalent chromium
(Cr(VI)).
On the contaminant mitigation side, Au-based nanostructures as catalysts can be
used to design a mobile catalytic converter unit, which enables on-site cleanup of
14!!
produced water. The challenge is to find a robust and low-cost catalytic process that
remains effective in high salinity conditions. In this thesis, bimetallic PdAu nanoparticles
were found to be a robust catalyst that can degrade organics in produced water and is
resistant to high salinity compared with monometallic Pd and Au. The catalytic unit
based on PdAu catalyst, air, and/or cheap additive can potentially be a cost-effective
approach for on-site produced water treatment.
Chapter 2 discusses the development of novel Au-based composite materials,
named luminescent Au microcapsules (Au MCs), as ultra sensitive probe for contaminant
detection and quantification, and served as a platform to design an affordable and
effective POU contaminant sensor. Au microcapsules were synthesized by inducing
glutathione-capped Au NCs to aggregate within silica-coated microcapsule structures via
polymer–salt aggregate self-assembly chemistry. The Au MCs have a 5× luminescence
enhancement compared to free Au NCs and can detect Cr(VI) at concentrations as low as
6 ppb through luminescence quenching, compared to free Au NCs which have a limit of
detection (LOD) of 52 ppb. The LOD is 16× lower than the United States Environmental
Protection Agency maximum contaminant level of 100 ppb for total chromium in
drinking water. The luminescent microcapsule material can sense Cr(VI) in simulated
drinking water with a ∼20–30 ppb LOD, serving as a possible basis for a practical Cr(VI)
sensor. This work has been published as: Y.B. Yin, C.L. Coonrod, K.N. Heck, and M.S.
Wong, “Microencapsulated Photoluminescent Gold for ppb-level Chromium(VI)
Sensing”, ACS Applied Material & Interface, 2019, 11, 19, 17491-17500.[64]
Chapter 3 describes the recent progresses in the usage of noble metallic
nanostructures (e.g. Au, Pd, Pt) for contaminant cleanup of drinking water sources. Toxic

15!!
oxyanions of nitrogen (NO2-, NO3
-), chromium (CrO42-), chlorine (ClO2
-, ClO3-, ClO4
-),
and bromine (BrO3-) were used as contaminant examples. An assessment of practical
implementation issues, and additional opportunities for metal nanostructures to contribute
to improved quality and sustainability of water resources were provided.!This work has
been published as: Y.B. Yin, S. Guo, K.N. Heck, C.A. Clark, C.L. Coonrod, and M.S.
Wong, “Treating Water by Degrading Oxyanions Using Metallic Nanostructures”, ACS
Sustainable Chemistry & Engineering, 2018, 6, 9, 11160-11175.[26]
Chapter 4 studied the ability of alumina-supported bimetallic PdAu to degrade
organic compounds at room temperature and atmospheric pressure via the catalytic
formation of H2O2. PdAu catalyst produced H2O2 and hydroxyl radicals in the presence
of oxygen and formic acid. The bimetallic catalyst was the most active in terms of initial
•OH formation rate, and when phenol was present, PdAu showed the highest rate of
phenol degradation. We assessed the promotional and inhibitory effects of other species
present in produced water including ferrous ion concentration, pH, and salt concentration
on catalytic phenol oxidation. PdAu was catalytically active for phenol degradation in
simulated produced water at salinities as high as ~0.3"M (~16,000"ppm). The combination
of air-formic acid-bimetallic catalyst is an intriguing approach for the degradation of
organics in contaminated water at low pH and moderate salinity. This work has been
published as: Y.B. Yin, K.N. Heck, C.L. Coonrod, C.D. Powell, S. Guo, M.A. Reynolds,
and M.S. Wong, “In-situ PdAu Catalytic Oxidation of Organic Compounds in Simulated
Produced Water”, Catalysis Today, 2020, 339, 362-370.[65]
Chapter 5 reports an approach to overcome the limitations of the previous study
that was restricted to acidic pH conditions and intolerant to high concentrations of total

16!!
dissolved solids (TDS). The new approach generated H2O2 in-situ through the oxidation
of a low-cost additive, hydroxylamine, over PdAu catalyst. This improved system
successfully degraded a model organic compound (phenol) in simulated HFPW with a
TDS of ~149,000 ppm at neutral pH. Furthermore, the bimetallic PdAu catalyst
demonstrated superior activity in high TDS (>100,000 ppm) waters and a lower
formation rate of undesired byproducts (e.g., NO2- and NO3
-) compared to monometallic
Pd and Au. As proof of concept, a circulating trickle bed reactor (TBR) was constructed
which could reduce the organic load of model HFPW by ~50% in 48 hrs.
Chapter 6 highlights the work done at the beginning of my graduate research,
which is not as relevant to the field of water monitoring and remediation but is just as
important in advancing science. This work investigated the structure and performance of
the bimetallic PdAu catalyst using a biomass oxidation model reaction, which provided a
way to optimize the structure of PdAu catalysts used in the produced water treatment
study. We studied the oxidation of methoxy-protected glucose (MG) using Pd-on-Au
nanoparticle model catalysts to generate methoxy-protected glucuronic acid (MGA), a
precursor to glucuronic acid. Pd-on-Au showed volcano-shape activity dependence on
calculated Pd surface coverage (sc). The 80 sc% Pd-on-Au catalyst composition showed
maximum initial turnover frequency (413 mol-MG mol-surface-atom-1 h-1) that was 5×
higher than that of Au/C, while Pd/C was inactive. This Pd-on-Au composition gave the
highest MGA yield (46%), supporting a bimetallic approach to glucuronic acid
production. This work has been submitted as: Y.B. Yin, L. Chen, K.N. Heck, Z.C. Zhang,
and M.S. Wong, “Indirect Oxidation of Glucose to Glucuronic Acid Using Pd-decorated
Au Catalysts”, Catalysis Communication, 2019, in revision.

17!!Chapter 7 proposes several directions for future work. The selective sensing of
other contaminants using luminescent Au-based nanostructures will provide a way to
design a sensor with the capacity to detect multiple contaminants simultaneously. The
continued investigations to tune the structure of PdAu to find better PdAu catalysts for
produced water on-site treatment are noted. Other non-metal nanostructures can also be a
direction to find the cost-effective method for design of DWTM system.
1.6. Reference
[1] P.H. Gleick, Water in crisis": a guide to the world’s fresh water resources, Oxford University Press, 1993. https://books.google.com/books/about/Water_in_Crisis.html?id=8--6swEACAAJ (accessed April 27, 2018).
[2] E.D. Mintz, J. Bartram, P. Lochery, M. Wegelin, Not just a drop in the bucket: Expanding access to point-of-use water treatment systems, Am. J. Public Health. 91 (2001) 1565–1570. doi:10.2105/AJPH.91.10.1565.
[3] P. Gikas, G. Tchobanoglous, The role of satellite and decentralized strategies in water resources management, J. Environ. Manage. 90 (2009) 144–152. doi:10.1016/j.jenvman.2007.08.016.
[4] P.J.J. Alvarez, C.K. Chan, M. Elimelech, N.J. Halas, D. Villagrán, Emerging opportunities for nanotechnology to enhance water security, Nat. Nanotechnol. 13 (2018) 634–641. doi:10.1038/s41565-018-0203-2.
[5] J.-S. Shih, E. Swiedler, A. Krupnick, A Model for Shale Gas Wastewater Management, SSRN Electron. J. (2016) 16–44. doi:10.2139/ssrn.2854268.
[6] T. Viraraghavan, K.S. Subramanian, B. Venkata Rao, Impact of household plumbing fixtures on drinking water quality - A review, Int. J. Environ. Stud. 56 (1999) 717–743. doi:10.1080/00207239908711234.
[7] K.J. Pieper, R. Martin, M. Tang, L. Walters, J. Parks, S. Roy, C. Devine, M.A. Edwards, Evaluating Water Lead Levels during the Flint Water Crisis, Environ. Sci. Technol. 52 (2018) 8124–8132. doi:10.1021/acs.est.8b00791.
[8] T.C. Peterson, T.R. Karl, J.P. Kossin, K.E. Kunkel, J.H. Lawrimore, J.R. McMahon, R.S. Vose, X. Yin, Changes in weather and climate extremes: State of knowledge relevant to air and water quality in the United States, J. Air Waste
18!!
Manag. Assoc. 64 (2014) 184–197. doi:10.1080/10962247.2013.851044.
[9] US EPA, Status of Water Systems in Areas Affected by Harvey , (2017). https://www.epa.gov/newsreleases/status-water-systems-areas-affected-harvey (accessed November 5, 2019).
[10] P.R. Hunter, D. Zmirou-Navier, P. Hartemann, Estimating the impact on health of poor reliability of drinking water interventions in developing countries, Sci. Total Environ. 407 (2009) 2621–2624. doi:10.1016/j.scitotenv.2009.01.018.
[11] P.J. Vikesland, Nanosensors for water quality monitoring, Nat. Nanotechnol. 13 (2018) 651–660. doi:10.1038/s41565-018-0209-9.
[12] K.B. Gregory, R.D. Vidic, D.A. Dzombak, Water Management Challenges Associated with the Production of Shale Gas by Hydraulic Fracturing, Elements. 7 (2011) 181–186. doi:10.2113/gselements.7.3.181.
[13] J.M. Estrada, R. Bhamidimarri, A review of the issues and treatment options for wastewater from shale gas extraction by hydraulic fracturing, Fuel. 182 (2016) 292–303. doi:10.1016/J.FUEL.2016.05.051.
[14] J.A. Slutz, J.A. Anderson, R. Broderick, P.H. Horner, Key Shale Gas Water Management Strategies: An Economic Assessment, in: Int. Conf. Heal. Saf. Environ. Oil Gas Explor. Prod., Society of Petroleum Engineers, 2012. doi:10.2118/157532-MS.
[15] R.D. Vidic, S.L. Brantley, J.M. Vandenbossche, D. Yoxtheimer, J.D. Abad, Impact of shale gas development on regional water quality, Science (80-. ). 340 (2013). doi:10.1126/science.1235009.
[16] P. Boschee, Produced and Flowback Water Recycling and Reuse: Economics, Limitations, and Technology, Oil Gas Facil. 3 (2014) 16–21. doi:10.2118/0214-0016-OGF.
[17] Ozonix Technology Limited – Produced water solutions, (n.d.). http://www.ozonixtechnologies.com/ (accessed November 6, 2019).
[18] Mobile Produced Water Recycling System-SCOUT | On-The-Fly Water Reuse, (n.d.). https://www.filtrasystems.com/products/mobile-produced-water-recycling-system-scout/?gclid=Cj0KCQiA-4nuBRCnARIsAHwyuPrURX9KnVP8oyFntqjXLC8VGrWUZnWWtbfmA95DX_PY1rV2iK_zDCgaAh7SEALw_wcB (accessed November 6, 2019).
[19] P.J.J. Alvarez, C.K. Chan, M. Elimelech, N.J. Halas, D. Villagrán, Emerging opportunities for nanotechnology to enhance water security, Nat. Nanotechnol. 13 (2018) 634–641. doi:10.1038/s41565-018-0203-2.
[20] S. Mao, J. Chang, G. Zhou, J. Chen, Nanomaterial-enabled rapid detection of water contaminants, Small. 11 (2015) 5336–5359. doi:10.1002/smll.201500831.

19!!
[21] K.N. Heck, S. Garcia-Segura, P. Westerhoff, M.S. Wong, Catalytic Converters for Water Treatment, Acc. Chem. Res. 52 (2019) 906–915. doi:10.1021/acs.accounts.8b00642.
[22] P. Westerhoff, P. Alvarez, Q. Li, J. Gardea-Torresdey, J. Zimmerman, Overcoming implementation barriers for nanotechnology in drinking water treatment, Environ. Sci. Nano. 3 (2016) 1241–1253. doi:10.1039/c6en00183a.
[23] S. Guo, E. Wang, Noble metal nanomaterials: Controllable synthesis and application in fuel cells and analytical sensors, Nano Today. 6 (2011) 240–264. doi:10.1016/j.nantod.2011.04.007.
[24] C.J. Murphy, Peer Reviewed: Optical Sensing with Quantum Dots, Anal. Chem. 74 (2002) 520 A-526 A. doi:10.1021/ac022124v.
[25] M.S. Mauter, M. Elimelech, Environmental applications of carbon-based nanomaterials, Environ. Sci. Technol. 42 (2008) 5843–5859. doi:10.1021/es8006904.
[26] Y.B. Yin, S. Guo, K.N. Heck, C.A. Clark, C.L. Coonrod, M.S. Wong, Treating Water by Degrading Oxyanions Using Metallic Nanostructures, ACS Sustain. Chem. Eng. 6 (2018) 11160–11175. doi:10.1021/acssuschemeng.8b02070.
[27] M. Li, H. Gou, I. Al-Ogaidi, N. Wu, Nanostructured sensors for detection of heavy metals: A review, ACS Sustain. Chem. Eng. 1 (2013) 713–723. doi:10.1021/sc400019a.
[28] G. Aragay, F. Pino, A. Merkoçi, Nanomaterials for sensing and destroying pesticides, Chem. Rev. 112 (2012) 5317–5338. doi:10.1021/cr300020c.
[29] P.J. Vikesland, K.R. Wigginton, Nanomaterial enabled biosensors for pathogen monitoring - A review, Environ. Sci. Technol. 44 (2010) 3656–3669. doi:10.1021/es903704z.
[30] X. Qu, P.J.J. Alvarez, Q. Li, Applications of nanotechnology in water and wastewater treatment, Water Res. 47 (2013) 3931–3946. doi:10.1016/j.watres.2012.09.058.
[31] Y. Xiong, X. Lu, M. Nanostructures, Metallic Nanostructures: From Controlled Synthesis to Applications, 2014. doi:10.1007/978-3-319-11304-3.
[32] L. Freitas de Freitas, G. Varca, J. dos Santos Batista, A. Benévolo Lugão, An Overview of the Synthesis of Gold Nanoparticles Using Radiation Technologies, Nanomaterials. 8 (2018) 939. doi:10.3390/nano8110939.
[33] K. Saha, S.S. Agasti, C. Kim, X. Li, V.M. Rotello, Gold nanoparticles in chemical and biological sensing, Chem. Rev. 112 (2012) 2739–2779. doi:10.1021/cr2001178.
[34] H. Jans, Q. Huo, Gold nanoparticle-enabled biological and chemical detection and

20!!
analysis, Chem. Soc. Rev. 41 (2012) 2849–2866. doi:10.1039/c1cs15280g.
[35] L. Qin, G. Zeng, C. Lai, D. Huang, P. Xu, C. Zhang, M. Cheng, X. Liu, S. Liu, B. Li, H. Yi, “Gold rush” in modern science: Fabrication strategies and typical advanced applications of gold nanoparticles in sensing, Coord. Chem. Rev. 359 (2018) 1–31. doi:10.1016/j.ccr.2018.01.006.
[36] G. Zhang, Functional gold nanoparticles for sensing applications, Nanotechnol. Rev. 2 (2013) 269–288. doi:10.1515/ntrev-2012-0088.
[37] Y. Zhang, W. Chu, A.D. Foroushani, H. Wang, D. Li, J. Liu, C.J. Barrow, X. Wang, W. Yang, New gold nanostructures for sensor applications: A review, Materials (Basel). 7 (2014) 5169–5201. doi:10.3390/ma7075169.
[38] R. Jin, C. Zeng, M. Zhou, Y. Chen, Atomically Precise Colloidal Metal Nanoclusters and Nanoparticles: Fundamentals and Opportunities, Chem. Rev. 116 (2016) 10346–10413. doi:10.1021/acs.chemrev.5b00703.
[39] J. Zheng, C. Zhang, R.M. Dickson, Highly Fluorescent, Water-Soluble, Size-Tunable Gold Quantum Dots, Phys. Rev. Lett. 93 (2004) 077402. doi:10.1103/PhysRevLett.93.077402.
[40] Z. Wu, R. Jin, On the Ligand’s Role in the Fluorescence of Gold Nanoclusters, Nano Lett. 10 (2010) 2568–2573. doi:10.1021/nl101225f.
[41] M. Liu, F. Tang, Z. Yang, J. Xu, X. Yang, Recent Progress on Gold-Nanocluster-Based Fluorescent Probe for Environmental Analysis and Biological Sensing, J. Anal. Methods Chem. 2019 (2019). doi:10.1155/2019/1095148.
[42] X. Yuan, Z. Luo, Y. Yu, Q. Yao, J. Xie, Luminescent noble metal nanoclusters as an emerging optical probe for sensor development, Chem. - An Asian J. 8 (2013) 858–871. doi:10.1002/asia.201201236.
[43] D. Cheng, M. Yu, F. Fu, W. Han, G. Li, J. Xie, Y. Song, M.T. Swihart, E. Song, Dual Recognition Strategy for Specific and Sensitive Detection of Bacteria Using Aptamer-Coated Magnetic Beads and Antibiotic-Capped Gold Nanoclusters, Anal. Chem. 88 (2016) 820–825. doi:10.1021/acs.analchem.5b03320.
[44] G. Guan, S.Y. Zhang, Y. Cai, S. Liu, M.S. Bharathi, M. Low, Y. Yu, J. Xie, Y. Zheng, Y.W. Zhang, M.Y. Han, Convenient purification of gold clusters by co-precipitation for improved sensing of hydrogen peroxide, mercury ions and pesticides, Chem. Commun. 50 (2014) 5703–5705. doi:10.1039/c4cc02008a.
[45] L.Y. Chen, C.W. Wang, Z. Yuan, H.T. Chang, Fluorescent gold nanoclusters: Recent advances in sensing and imaging, Anal. Chem. 87 (2015) 216–229. doi:10.1021/ac503636j.
[46] Z. Luo, X. Yuan, Y. Yu, Q. Zhang, D.T. Leong, J.Y. Lee, J. Xie, From aggregation-induced emission of Au(I)-thiolate complexes to ultrabright Au(0)@Au(I)-thiolate core-shell nanoclusters, J. Am. Chem. Soc. 134 (2012)
21!!
16662–16670. doi:10.1021/ja306199p.
[47] G.J. Hutchings, M. Brust, H. Schmidbaur, Gold-an introductory perspective, Chem. Soc. Rev. 37 (2008) 1759–1765. doi:10.1039/b810747p.
[48] M. Haruta, N. Yamada, T. Kobayashi, S. Iijima, Gold catalysts prepared by coprecipitation for low-temperature oxidation of hydrogen and of carbon monoxide, J. Catal. 115 (1989) 301–309. doi:10.1016/0021-9517(89)90034-1.
[49] G.J. Hutchings, Vapor phase hydrochlorination of acetylene: Correlation of catalytic activity of supported metal chloride catalysts, J. Catal. 96 (1985) 292–295. doi:10.1016/0021-9517(85)90383-5.
[50] S. Biella, L. Prati, M. Rossi, Selective Oxidation of D-Glucose on Gold Catalyst, J. Catal. 206 (2002) 242–247. doi:10.1006/jcat.2001.3497.
[51] D.A. Crole, S.J. Freakley, J.K. Edwards, G.J. Hutchings, Direct synthesis of hydrogen peroxide in water at ambient temperature, Proc. R. Soc. A Math. Phys. Eng. Sci. 472 (2016) 20160156. doi:10.1098/rspa.2016.0156.
[52] H. Miura, K. Endo, R. Ogawa, T. Shishido, Supported Palladium-Gold Alloy Catalysts for Efficient and Selective Hydrosilylation under Mild Conditions with Isolated Single Palladium Atoms in Alloy Nanoparticles as the Main Active Site, ACS Catal. 7 (2017) 1543–1553. doi:10.1021/acscatal.6b02767.
[53] L. Ouyang, G.J. Da, P.F. Tian, T.Y. Chen, G. Da Liang, J. Xu, Y.F. Han, Insight into active sites of Pd-Au/TiO2 catalysts in hydrogen peroxide synthesis directly from H2 and O2, J. Catal. 311 (2014) 129–136. doi:10.1016/j.jcat.2013.11.008.
[54] J. Xu, T. White, P. Li, C. He, J. Yu, W. Yuan, Y.F. Han, Biphasic Pd-Au alloy catalyst for low-temperature CO oxidation, J. Am. Chem. Soc. 132 (2010) 10398–10406. doi:10.1021/ja102617r.
[55] A. Villa, D. Wang, D.S. Su, L. Prati, New challenges in gold catalysis: Bimetallic systems, Catal. Sci. Technol. 5 (2015) 55–68. doi:10.1039/c4cy00976b.
[56] M.S. Wong, P.J.J. Alvarez, Y.L. Fang, N. Akçin, M.O. Nutt, J.T. Miller, K.N. Heck, Cleaner water using bimetallic nanoparticle catalysts, J. Chem. Technol. Biotechnol. 84 (2009) 158–166. doi:10.1002/jctb.2002.
[57] M.O. Nutt, J.B. Hughes, M.S. Wong, Designing Pd-on-Au Bimetallic Nanoparticle Catalysts for Trichloroethene Hydrodechlorination, Environ. Sci. Technol. 39 (2005) 1346–1353. doi:10.1021/es048560b.
[58] M.O. Nutt, K.N. Heck, P. Alvarez, M.S. Wong, Improved Pd-on-Au bimetallic nanoparticle catalysts for aqueous-phase trichloroethene hydrodechlorination, Appl. Catal. B Environ. 69 (2006) 115–125. doi:10.1016/j.apcatb.2006.06.005.
[59] Z. Zhao, Y.-L. Fang, P.J.J. Alvarez, M.S. Wong, Degrading perchloroethene at ambient conditions using Pd and Pd-on-Au reduction catalysts, Appl. Catal. B

22!!
Environ. 140 (2013) 468–477. doi:10.1016/j.apcatb.2013.04.032.
[60] H. Qian, Z. Zhao, J. Velazquez, L. Pretzer, Supporting palladium metal on gold nanoparticles improves its catalysis for nitrite reduction, Nanoscale. (2014) 358–364. doi:10.1039/c3nr04540d.
[61] S. Seraj, P. Kunal, H. Li, G. Henkelman, S.M. Humphrey, C.J. Werth, PdAu Alloy Nanoparticle Catalysts: Effective Candidates for Nitrite Reduction in Water, ACS Catal. 7 (2017) 3268–3276. doi:10.1021/acscatal.6b03647.
[62] K.-D. VORLOP, U. PRÜSSE, CATALYTICAL REMOVING NITRATE FROM WATER, in: 1999: pp. 195–218. doi:10.1142/9781848160613_0010.
[63] L.A. Pretzer, K.N. Heck, S.S. Kim, Y.-L. Fang, Z. Zhao, N. Guo, T. Wu, J.T. Miller, M.S. Wong, Improving gold catalysis of nitroarene reduction with surface Pd, Catal. Today. 264 (2016) 31–36. doi:10.1016/j.cattod.2015.07.040.
[64] Y.B. Yin, C.L. Coonrod, K.N. Heck, F. Lejarza, M.S. Wong, Microencapsulated Photoluminescent Gold for ppb-Level Chromium(VI) Sensing, ACS Appl. Mater. Interfaces. 11 (2019) 17491–17500. doi:10.1021/acsami.9b04699.
[65] Y.B. Yin, K.N. Heck, C.L. Coonrod, C.D. Powell, S. Guo, M.A. Reynolds, M.S. Wong, PdAu-catalyzed oxidation through in situ generated H2O2 in simulated produced water, Catal. Today. (2019). doi:10.1016/J.CATTOD.2019.05.001.

23!!
Chapter 2
Microencapsulated Photoluminescent Gold for ppb-level Chromium(VI) Sensing
2.1. Introduction
Luminescent gold nanoclusters (Au NCs) have emerged as a promising material for
sensing due to their inherent luminescent properties, ultrafine size (< 2 nm), high
photostability, good biocompatibility, and ease of synthesis[1–3]. They have been
investigated as a probe for the detection of hazardous heavy metal ions such as
mercury[4], copper[5] and hexavalent chromium[6].
Although it is commonly used in metallurgy, pigment manufacturing and wood
treatment processes[7], hexavalent chromium has cytotoxic and carcinogenic
properties.[8] The United States Environmental Protection Agency (US EPA) set the
maximum contaminant level (MCL) of total chromium (= Cr(III) + Cr(VI)) to 100 ppb
for drinking water. Certain U.S. states have more stringent regulations; California, for
24!!
example, has a MCL of 50 ppb for total chromium.[9,10] The World Health Organization
(WHO) provides a drinking water guideline value of 50 ppb for Cr(VI).[11] The Ministry
of Environmental Protection in China set the legal limit of Cr(VI) in drinking water to 50
ppb,[12] and the industrial waste water discharge limit to 100 ppb[13]
The US EPA provides two protocols for Cr(VI) detection in drinking water,
groundwater, and wastewater. Methods 218.6 and 218.7 have respective limits of
detection (LOD) of 0.3 ppb and 0.0044 ppb, with the latter one most recently published in
2011. For both protocols, an aqueous sample containing Cr(VI) is filtered (0.45 µm),
treated with a base, and then passed through an ion chromatography column. The
recovered Cr(VI) is reacted with diphenylcarbazide to form a pink colored complex,
which can be detected using a UV detector (at 530 nm). These methods are highly
sensitive and accurate, but are not appropriate for household use; they involve the use of
expensive instrumentation, chemical treatment steps, and a basic competency with
advanced chemical techniques. A portable test kit for Cr(VI) based on diphenylcarbazide
chemistry is commercially available,[14] but it has a LOD of 100 ppb, which is
inconveniently close to the 100-ppb MCL for total Cr. A rapid, easy-to-use, sensitive
(<100 ppb), and inexpensive method for selective Cr(VI) detection is highly desired for
household use.
Luminescent Au NCs could be the basis of such a method, but practical
implementation has not been demonstrated yet. Sun et al. reported the synthesis of 11-
mercaptoundecanoic acid-capped gold nanoclusters (MUA-Au NCs) with a QY of 2.4%.
Finding that Cr(III), but not Cr(VI), quenched the luminescence at pH 7, they chemically
reduced Cr(VI) using ascorbic acid to Cr(III), for quantification; a Cr(VI) LOD was not
25!!
reported.[6] Zhang et al. reported the synthesis of glutathione-capped gold nanoclusters
(GSH-Au NCs) with a QY of 1.5%. Under acidic conditions, they reported a LOD value
of 0.5 ppb (0.0096 µM as CrO42-).[15] Guo et al. reported the synthesis of bovine serum
albumin-capped gold nanoclusters (BSA-Au NCs) that had a LOD value of 0.03 ppb (0.6
nM as CrO42-) at pH 1.[16] Low pH values are necessary for Cr(VI)-induced
luminescence quenching. Selectivity for Cr(VI) can be introduced into the system by
using ethylenediaminetetraacetic acid as a masking agent to sequester other metal
ions.[15]
The photoluminescence of Au NCs can come from fluorescence or
phosphorescence depending on the composition.[17] The origin of Au NC fluorescence is
generally attributed to the quantum confinement of the metallic core or/and the charge
transfer of the surface ligands.[18–20] The fluorescence of Au NC is generally too low
(QY<1%) to be practically used. Xie and coworkers reported one Au NC composition
with to be phosphorescent based on lifetime measurements (with a QY OF 15%).[21]
They attributed the luminescence to aggregation-induced emission (AIE): non-
luminescent Au(I)-thiolate complexes, when localized into a shell around a Au(0) metal
core, became luminescent as a result of increased inter-Au(I) interactions.[22] Yahia-
Ammar et al. showed that Au NC luminescence could be increased by aggregating Au
NCs within a poly(allylamine hydrochloride) gel network, with the QY reportedly
increasing from 7% to 25%.[23]
In this study, we synthesized luminescent glutathione-capped gold nanoclusters
(GSH-Au NCs) and entrapped them inside micron-sized capsules (Au-MCs). The capsule
formation process is based on polymer-salt assembly (PSA), in which polyamines and

26!!
polyvalent anions combine to form polymer-salt aggregates around which charged
nanoparticles deposit to form a multilayer-thick, semipermeable shell.[24–28] The
encapsulation step occurs when the cargo is introduced to the polymer-salt aggregates
and before shell formation is initiated. We hypothesized that confining the GSH-Au NCs
within a polymer-salt matrix would increase luminescence, and that a shell of SiO2
nanoparticles would allow Cr(VI) to diffuse through and interact with the encapsulated
GSH-Au NCs. We indeed found the Au MCs were more luminescent than GSH-Au NCs,
due to light scattering of the emitted color caused by the microcapsular particles (0.9±0.2
µm). We quantified the Cr(VI) LOD in deionized water and in simulated drinking water
to be less than 100-ppb MCL for total Cr. We found that Cr(VI) in neutral-pH water
surprisingly induced luminescence quenching, suggesting the capsule interior contains a
low-pH environment, which we confirmed by synthesizing pH-sensitive MCs. Finally,
we demonstrated a user-friendly Cr(VI) strip test with ppb sensitivity, using Au MCs
deposited onto paper.
2.2. Experimental
2.2.1. Materials
Reduced L-glutathione ("GSH", molecular weight of 307 g/mol), hydrogen
tetrachloroaurate trihydrate (HAuCl4•3H2O), LiCl, NaCl, KCl, MgCl2, CaCl2, BaCl2,
CrCl3, MnCl2, FeCl2, FeCl3, CoCl2, NiCl2, CuCl2, ZnCl2, AlCl3, CdCl2, PbCl2, K2CrO4,
K2MnO4, Na2SO4, NaNO3, NaNO2, Na2CO3 and NaHCO3 were purchased from Sigma-
Aldrich. Poly(allylamine hydrochloride) ("PAH", ~70,000 g/mol) was purchased from
Alfa Aesar. Polyethyleneimine (PEI, ~750,000 g/mol) was purchased as a 50 w/v%

27!!
solution from Sigma. Disodium hydrogen phosphate heptahydrate (Na2HPO4·7H2O), and
disodium citrate dihydrate (Na2CIT•2H2O) were purchased from EMD Chemicals. Stock
solutions of all polymer and sodium salts were prepared using deionized water (Milli-Q)
with a resistivity of 18.2 MΩ, and stored at 4 °C before use. Silicon oxide NPs (~13 nm)
were available as an aqueous colloidal suspension (20.5 wt%, pH = 3.4, Snowtex-ST-O,
Nissan Chemicals). All purchased chemicals in this study were used without further
purification. Filter media (Disruptor, Grade 4601) comprised of a blend of alumina (in
the form of pseudoboehmite or AlO(OH)), glass fiber, and cellulose was provided by
Ahlstrom Corporation. For the conjugation of PAH to a dye compound, rhodamine B
isothiocyanate (RBITC) was purchased from Sigma-Aldrich.
2.2.2. Synthesis of Luminescent Glutathione-capped Gold Nanoclusters (GSH-Au
NCs)
An aqueous solution of HAuCl4 (20 mM, 5 mL) was added into 43.5 mL of deionized
water in a 100 mL single neck round bottom flask and stirred with magnetic stirring at
room temperature (~23 °C). GSH solution (100 mM, 1.5 mL) was then added into the
solution.[21] The flask with the reaction mixture was sealed with a glass stopper and
heated in a 70 °C oil bath under gentle stirring (~500 rpm) for 24 h. The synthesized
product was loaded into a dialysis bag (molecular weight cut-off of 3.5 kDa) and placed
in 2 L deionized water for 24 h to remove any unreacted precursors. The GSH-Au NC sol
(2 mM on gold atom basis and 0.056 mM on Au36SG32 particle basis) was stored in a
Duran laboratory bottle at 4 °C until use. The bottle was covered in aluminum foil to
shield the sample from ambient light.

28!!
2.2.3. Synthesis of Luminescent GSH-Au NC-containing Microcapsules (Au-MCs)
Luminescent GSH-Au NCs were encapsulated using polyamine-salt aggregate (PSA)
assembly chemistry.[27,28] A volume (0.5 mL) of cooled PAH solution (4 °C, 2 mg/mL,
pH = 4.3) was combined with 3-mL of cooled Na2HPO4 solution (4 °C, 0.01 M, pH =
7.4) for 10 s with a vortex mixer (speed 5 from 1-10), and the resulting suspension was
aged at 4 °C for 10 min. The ratio of total negative charge of added Na2HPO4 to the total
positive charge of the PAH, or the R ratio, was controlled as 6. The NC sol (0.5 mL) at a
given gold concentration (up to 2 mM on a Au atom basis) was then added, vortex mixed
for 10 s, and aged for an additional 10 min at 4 °C. Finally, a SiO2 NP sol (diluted to 7 wt
%, 1.5 mL) was added and vortex-mixed for 10 s. The synthesis of Au-MCs using two
different polymer types (PAH or PEI), two salt linkers (Na2HPO4 or Na2CIT) and R
ratios (3 or 6) were also investigated.
The resulting material (herein termed "Au-MCs" for gold-containing
microcapsules) was aged for an additional 2 h at 4 °C, washed twice with a deionized
water rinse and centrifugation (3000 rpm for 20 min), redispersed in deionized water
(final volume of 5.5 mL), and stored in the dark at 4 °C until use. The luminescence of
the supernatant was analyzed after centrifugation of the Au-MCs to ensure that all the
GSH-Au NCs were encapsulated. As a control sample, MCs without GSH-Au NCs were
synthesized using 0.5 mL DI water (instead of 0.5 mL of the Au NC sol).
2.2.4. Characterization
UV-vis absorbance spectra (or extinction spectra, for Au MC suspensions) were recorded
on a Shimadzu UV 2401 spectrophotometer. Photoluminescence (PL) spectra were
29!!
recorded on a Jobin-Yvon-Horiba photoluminescence spectrometer (FluoroMax 3). Zeta
potential values were measured through phase analysis light scattering (PALS) with a
Brookhaven ZetaPALS instrument. A dip-in electrode system with a 4-mL polystyrene
cuvette was used, and measurements were taken at 25 °C. Transmission electron
microscopy (TEM) images were taken using a JEOL JEM 2010 microscope with an
operating voltage of 200 kV. Scanning electron microscopy (SEM) images were
performed with FEI Helios SEM operating at 10 kV with a working distance of 10.0 mm.
The MCs were loaded on a SEM specimen stub, and dried under air overnight before
SEM imaging. Laser-scanning confocal microscopy was performed on a Carl Zeiss LSM
710 microscope (laser excitation of 405 nm). Samples were mounted on a glass slide and
sealed under a cover slip to prevent drying.
2.2.5. Quantum Yield (QY) Measurements
The QY of GSH-Au NCs was calculated, following International Union of Pure and
Applied Chemistry (IUPAC) methodology.[29] Fluorescein dissolved in 0.1 M NaOH
aqueous solution (QY = 95%) was used as a reference sample. For both GSH-Au NC and
reference samples at different concentrations, the absorbance at 365 nm and the
corresponding PL spectra (excitation wavelength of 365 nm) were recorded. The
absorbance was kept below 0.1 at the 365 nm excitation wavelength. The integrated
luminescence intensity versus absorbance was linearly fitted. The fitted gradients (slope
of luminescence intensity-absorbance line) of GSH-Au NCs sample and reference sample
were recorded. The QY of the test sample was determined with the formula below:

30!!
!" = !"!"#×!"#$!"#$!"#
× !!!"#
!
where the Grad is the gradient and η = the refractive index of the solvent.
The QY of Au MCs was determined using a method that accounted for light
scattering effects on UV-vis extinction spectra.[30] The experimental procedure was the
same as described above, except fluorescein combined with Au-MCs (at the same
suspension concentration as the Au-MCs) was used as the reference.
2.2.6. Cr(VI) Sensing Studies
Two stock solutions of Cr(VI) (0.01"M) were prepared by dissolving 19.4 mg K2CrO4 in
10 mL of either DI water or simulated drinking water. The simulated drinking water (pH
~ 7.5) comprises sodium (Na+, 3.86 mM) calcium (Ca2+, 1.0 mM) magnesium (Mg2+, 0.5
mM), bicarbonate (HCO3-, 3 mM), chloride (Cl-, 2 mM), sulfate (SO4
2-, 0.5 mM), nitrate
(NO3-, 0.14 mM), fluoride (F-, 0.053 mM), phosphate (PO4
3-, 0.0013 mM), and silica
(SiO2, 0.33 mM) (Table S2.1). This composition is used in the NSF/ANSI Standard 53
for water treatment system certification.[31] Cr(VI) solutions with various concentrations
were obtained by serial dilution of the stock solution.
A series of solutions with different Cr(VI) concentrations (up to 3120 ppb-Cr, or
60 µM-CrO42-) were prepared in separate vials. In testing GSH-Au NCs for Cr(VI)
sensitivity, the photoluminescence spectra of each sample solution (3 mL) were recorded
after addition of GSH-Au NC sol (5 µL), with and without 1 M HCl solution (to lower
pH to 1). In testing Au-MCs, spectra of each sample (3 mL) were similarly collected after
31!!
the addition of Au-MC suspension (50 µL), with and without 1 M HCl solution (to lower
pH to 1). To adjust pH of deionized water to 7, 1 M NaOH solution was used.
The effect of other cations and anions that may be present in natural water on the
sensing performance was evaluated as follows. Separate vials of a 20-µM solution
containing one of 24 common ions were prepared in DI water (i.e., one ion type per vial)
and acidified to pH 1 by adding 1 M HCl. PL spectra of each sample solution (3 mL)
were recorded after the addition of 5 µL of GSH-Au NCs sol (2 mM, Au atom basis).
These screening tests included 17 cations (Li+, Na+, K+, Mg2+, Ca2+, Ba2+, Cr3+, Mn2+,
Fe2+, Fe3+, Co2+, Ni2+, Cu2+, Zn2+, Al3+, Cd2+ and Pb2+, with Cl- as the counter-ion) and 6
anions (Cl-, SO42-, NO3
-, NO2-, CO3
2- and HCO3-, with Na+ as the counter-ion). The
luminescence intensity at 600 nm of the ion-spiked solutions (F) and the intensity of the
solution without additional ions (F0) was used to calculate the relative luminescent
intensity, F/F0.
The limit of detection (LOD), calculated using IUPAC protocol,[32] is the lowest
concentration of analyte that can be detected with a statistically significant signal change
from an analyzer. The LOD for Cr(VI) was determined by finding the lowest Cr(VI)
concentration that induces a luminescence decrease change (F0-F) that is equal to three
times of the luminescence background signal (3×N). F0 is the mean value of the
luminescence intensity measurements of the NCs (or MCs) in absence of Cr(VI), and F is
the luminescent intensity measured after addition of Cr(VI).
32!!
2.2.7. Synthesis of RBITC-conjugated PAH
RBITC-conjugated PAH (RBITC-PAH) was synthesized and used to prepared MCs to
assess the pH environment within the capsules. The synthesis route of the RBITC-PAH
was adapted from Begum et al.[33] (Supplementary Information).
2.2.8. Test Strip Study
To prepare the paper test strip containing Au-MCs, 50 µL Au-MCs solution was
dispersed onto a 2 cm × 0.5 cm (1 cm2) piece of filter paper (Ahlstrom Disruptor, Grade
4601) with the same Au metal loading (0.19 µg per strip), and dried at room temperature
overnight. To test the sensitivity of the method, the test strip was immersed in a 10 mL
solution with Cr(VI) for 10 min. The test strip was removed from solution and placed
under the UV illumination (365 nm, UVP UVLMS-38 EL Series UV Lamp, illumination
distance of 20 cm). Images of the test strips were recorded with a handheld camera device
(Apple iPhone 8), and analysis using ImageJ software for color intensities. The total
analysis time of each test is roughly 20 min (10 min for test strip immersion and 10 min
for imaging and analysis). The test strip can be stored at atmospheric condition for at
least three months and used with stable luminescence and sensing performance.
2.3. Results and Discussion
2.3.1. Characterization of GSH-Au NCs
The GSH-Au NCs were successfully synthesized, with properties consistent with
previous reports (Supplementary Information, Fig. S2.1). An aqueous GSH-Au NC
33!!
suspension luminesced with a yellow-orange color in the 500-800 nm range, with a QY
of 15%. Photoluminescence lifetime measurements indicated light emission was due to
phosphorescence. The particles had an average TEM-based diameter of 1.6 nm, and a
zeta potential of -11.2±1.3 mV.
These GSH-Au NCs have a core-shell structure with a Au(0) cluster as the core
and GSH as part of the shell, specifically as GS-Au(I)-SG groups surrounding the Au(0)
core.[21] The probable molecular formulae of the GSH-Au NCs are Au29SG27, Au30SG28,
Au36SG32, Au39SG35, and Au43SG37, based on polyacrylamide gel electrophoresis and
electrospray ionization mass spectrometry analyses.[34] For the purpose of calculating
Au content in this work, we assumed the synthesized GSH-Au NCs are Au36SG32, i.e., 32
deprotonated glutathione ligands, and 36 atoms of Au (of which 32 are Au(I) and 4 are
Au(0)). A gold concentration of 2 mM on Au atom basis is equivalent to 3.4 × 10¹⁶
particles/mL (0.056 mM) on a Au36SG32 basis.
2.3.2. Encapsulation of GSH-Au NCs
The characterizations of the luminescent GSH-Au NCs including the photographs of an
aqueous sol of GSH-Au NCs (Fig. S2.1a), PL spectra (Fig. S2.1b), quantum yield,
luminescence lifetime (Fig. S2.1c), TEM image (Fig. S2.1d), particle size distribution
(Fig. S2.1e), and zeta potential were detailed in Supporting Information.
Photoluminescence lifetime measurements indicated light emission was due to
phosphorescence.
Scheme 2.1 depicts the encapsulation of luminescent GSH-Au NCs and formation
of the resulting Au-MC, via the well-established PSA charge-assembly chemistry.[28,35]

34!!
In step #1, polymer-salt aggregates (PSA) form instantaneously upon mixing of the
polymer and salt solutions, which is driven by electrostatic interactions between the PAH
amine groups and phosphate anions. In step #2a, the GSH-Au NC sol is added to the
suspension. The NCs have a net negative surface charge, allowing them to incorporate
within the crosslinked network structure of the PSAs. To this Au-PSA suspension, a SiO2
NP sol (13 nm) is added in step #3a, and these NPs (negatively charged at neutral
pH)[36] diffuse and deposit within the outer portion of the Au-PSA to form the shell. The
SiO2 shell, held together by the polymer, is structurally robust, allowing the MCs to
undergo typical powder processing.

35!!
!
Scheme 2.1 Formation of charged-assembled microcapsules (MCs) that (a) contain and (b) not contain the luminescent GSH-Au NCs.
The SEM image showed that the Au-MCs retained their spherical shape after
centrifugation and drying at room temperature and under the vacuum conditions of
microscopy imaging (Fig. 2.1a). The Au-MCs ranged from 0.4 to 1.5 µm in size, with an
average diameter of 0.9 µm and standard deviation of 0.2 µm (Fig. 2.1b). The shell
thickness was estimated to be 0.1 µm (Fig. 2.1c and 2.1d).[37] SiO2 NPs (~12 nm) that
comprise the shell are identifiable through TEM imaging (Fig. 2.1d).

36!!
Figure 2.1 (a) SEM image of Au-MCs (containing 4.8 wt% Au). (b) Size histogram of Au-MCs based on 200 imaged particles. TEM images of (c) an individual Au-MC and (d) shell structure of the Au-MC with SiO2 NPs circled in red.
The Au-MC suspension was slightly yellow and cloudy under visible light,
displaying a yellow-orange emission under UV illumination (Fig. 2.2a). For comparison,
the "empty" MCs (without the Au NCs) formed a white, turbid suspension under visible
light and show no luminescence under UV illumination (Fig. 2.2b). The Au-MC and MC
suspensions settled after ~2 h, and were readily suspended upon agitation. Light yellow
and white powders were respectively obtained after centrifugation, decanting the
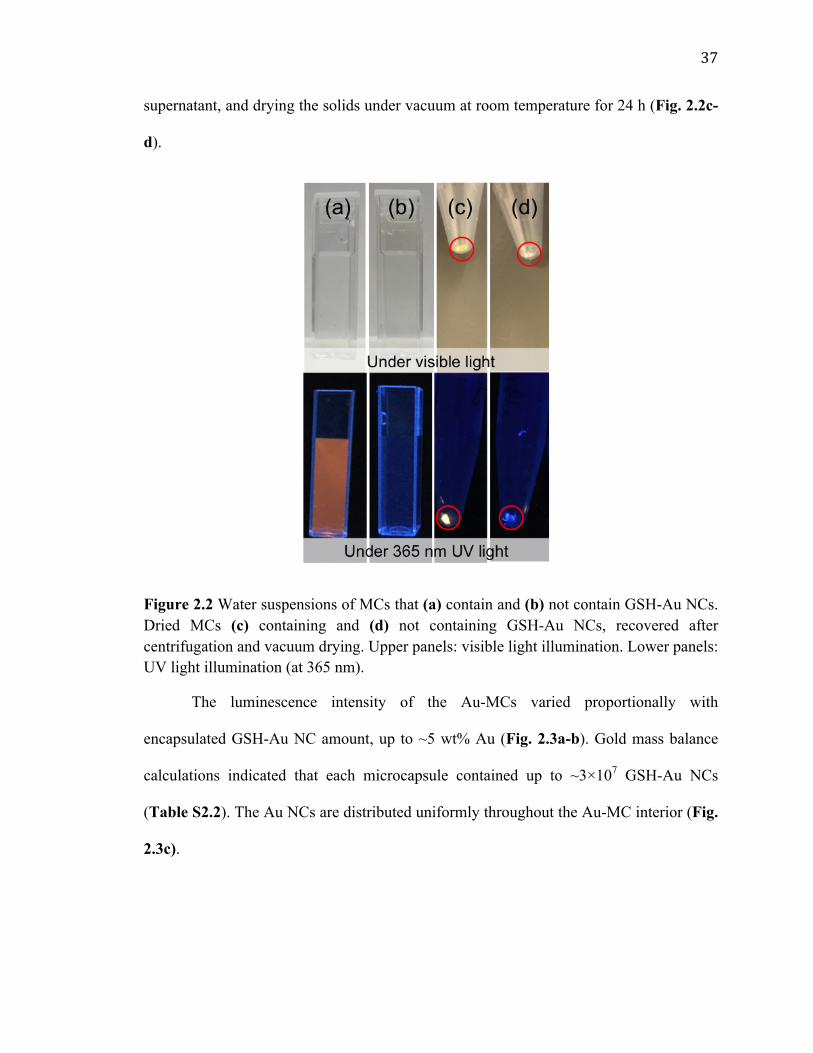
37!!
supernatant, and drying the solids under vacuum at room temperature for 24 h (Fig. 2.2c-
d).
Figure 2.2 Water suspensions of MCs that (a) contain and (b) not contain GSH-Au NCs. Dried MCs (c) containing and (d) not containing GSH-Au NCs, recovered after centrifugation and vacuum drying. Upper panels: visible light illumination. Lower panels: UV light illumination (at 365 nm).
The luminescence intensity of the Au-MCs varied proportionally with
encapsulated GSH-Au NC amount, up to ~5 wt% Au (Fig. 2.3a-b). Gold mass balance
calculations indicated that each microcapsule contained up to ~3×10⁷ GSH-Au NCs
(Table S2.2). The Au NCs are distributed uniformly throughout the Au-MC interior (Fig.
2.3c).

38!!
Figure 2.3 (a) Au-MC suspensions with increasing Au loading (0, 0.125×10⁷, 0.25×10⁷, 0.5×10⁷, 1×10⁷, 2×10⁷, 3×10⁷ Au NCs per microcapsule) (upper: visible light; (lower: UV illumination) MC concentration of ~108 capsules/mL. (b) Luminescence peak intensity (at 600 nm; excitation wavelength of 365 nm) as function of Au content. (c) Brightfield and confocal microscope images of Au-MCs (4.8 wt% Au).
The PSA charge-assembly chemistry can be carried out using different cationic
polymers, anionic linkers and charge ratios.[24] We found that maximum luminescence
intensity was achieved using PAH as the cationic polymer, phosphate as the salt linker,
and 6 as the charge ratio (Fig. S2.2).
2.3.3. Photoluminescence enhancement of Au-MCs
The encapsulation of GSH-Au NCs in the MCs had a strong effect on the luminescence
properties (Fig. 2.4a). GSH-Au NCs and Au-MCs were both luminescent with the same
color, with a broad orange emission peak centered at 600 nm, but the latter material was

39!!
5× brighter, i.e., showed 5× greater luminescence intensity (Fig. 2.4b). The comparison
of luminescence intensity between Au-PSAs and Au-MCs (Fig. S2.3) indicated Au-PSA
is the major contribution for the luminescence increase while SiO2 had little effect. We
initially thought that the luminescence enhancement was due to QY increase, since
Yahia-Ammar et al. observed a 4-fold luminescence enhancement and concluded that the
QY increased from 7% to 25%, after aggregating the GSH-Au NCs using PAH.[23]
In our case, the absorbance spectra of Au-MCs (Fig. 2.4c) showed non-zero
"absorbance" throughout the UV-vis range, which is due to significant light (Mie)
scattering within the suspension of the micron-sized capsules. By accounting for this
scattering,[30] we calculated the Au-MCs to have a QY of 13%, slightly lower than the
15% QY for the unencapsulated GSH-Au NCs. The Au MCs are more luminescent than
GSH-Au NCs because of light scattering by the submicron-sized capsule particles and not
because of QY differences.
Figure 2.4 (a) Suspensions of GSH-Au NCs and Au-MCs under UV illumination (365 nm), and corresponding (b) photoemission (365 nm excitation) and (c) absorbance/photoextinction spectra. (overall Au concentration in vial for both suspensions = 0.03 mM on Au atom basis).
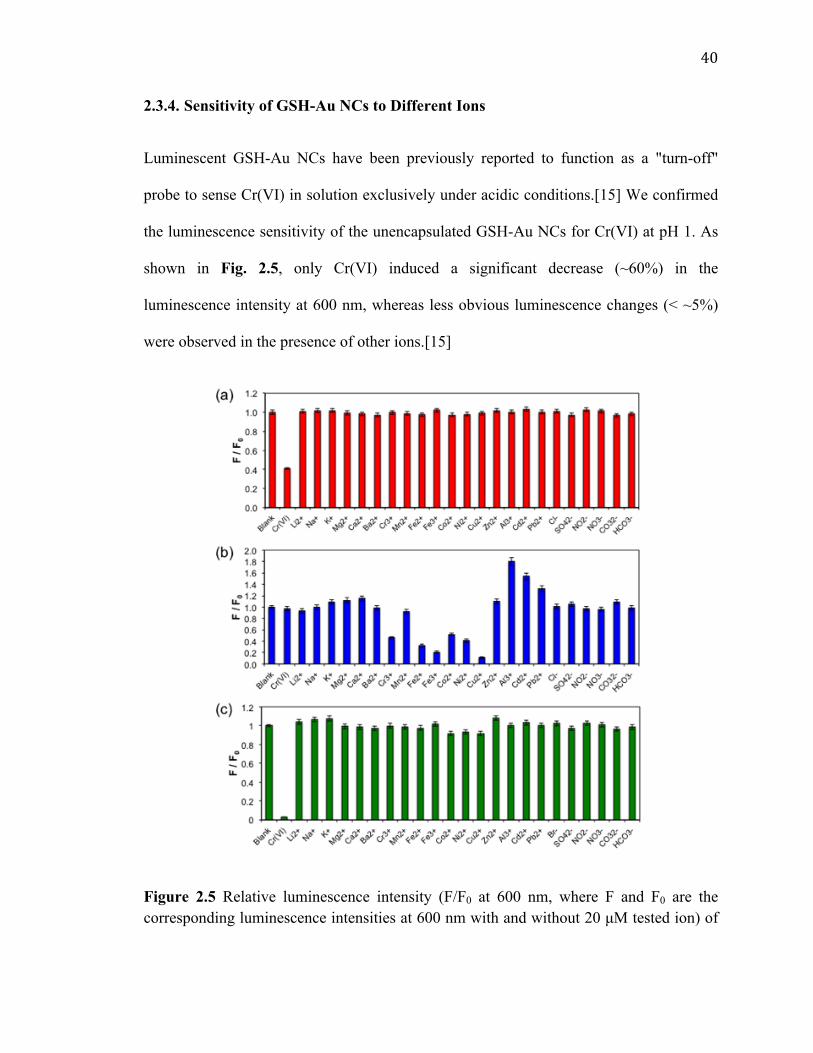
40!!
2.3.4. Sensitivity of GSH-Au NCs to Different Ions
Luminescent GSH-Au NCs have been previously reported to function as a "turn-off"
probe to sense Cr(VI) in solution exclusively under acidic conditions.[15] We confirmed
the luminescence sensitivity of the unencapsulated GSH-Au NCs for Cr(VI) at pH 1. As
shown in Fig. 2.5, only Cr(VI) induced a significant decrease (~60%) in the
luminescence intensity at 600 nm, whereas less obvious luminescence changes (< ~5%)
were observed in the presence of other ions.[15]
Figure 2.5 Relative luminescence intensity (F/F0 at 600 nm, where F and F0 are the corresponding luminescence intensities at 600 nm with and without 20 µM tested ion) of
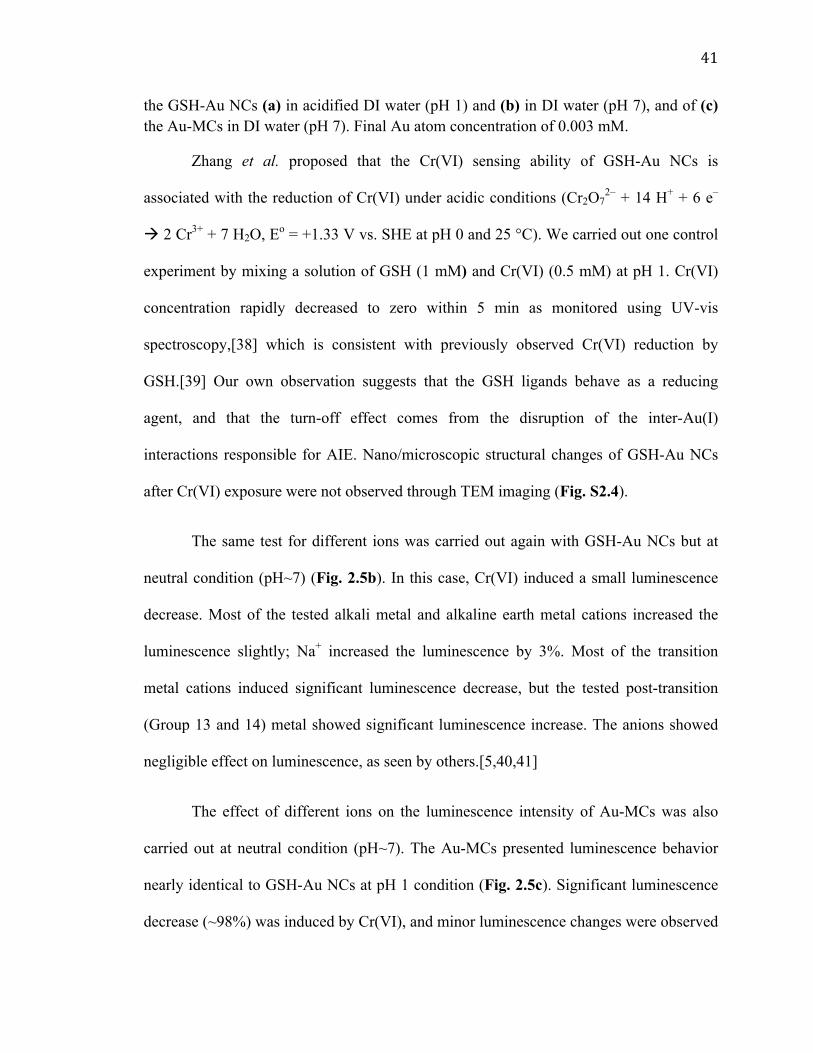
41!!
the GSH-Au NCs (a) in acidified DI water (pH 1) and (b) in DI water (pH 7), and of (c) the Au-MCs in DI water (pH 7). Final Au atom concentration of 0.003 mM.
Zhang et al. proposed that the Cr(VI) sensing ability of GSH-Au NCs is
associated with the reduction of Cr(VI) under acidic conditions (Cr2O72– + 14 H+ + 6 e–
! 2 Cr3+ + 7 H2O, Eo = +1.33 V vs. SHE at pH 0 and 25 °C). We carried out one control
experiment by mixing a solution of GSH (1 mM) and Cr(VI) (0.5 mM) at pH 1. Cr(VI)
concentration rapidly decreased to zero within 5 min as monitored using UV-vis
spectroscopy,[38] which is consistent with previously observed Cr(VI) reduction by
GSH.[39] Our own observation suggests that the GSH ligands behave as a reducing
agent, and that the turn-off effect comes from the disruption of the inter-Au(I)
interactions responsible for AIE. Nano/microscopic structural changes of GSH-Au NCs
after Cr(VI) exposure were not observed through TEM imaging (Fig. S2.4).
The same test for different ions was carried out again with GSH-Au NCs but at
neutral condition (pH~7) (Fig. 2.5b). In this case, Cr(VI) induced a small luminescence
decrease. Most of the tested alkali metal and alkaline earth metal cations increased the
luminescence slightly; Na+ increased the luminescence by 3%. Most of the transition
metal cations induced significant luminescence decrease, but the tested post-transition
(Group 13 and 14) metal showed significant luminescence increase. The anions showed
negligible effect on luminescence, as seen by others.[5,40,41]
The effect of different ions on the luminescence intensity of Au-MCs was also
carried out at neutral condition (pH~7). The Au-MCs presented luminescence behavior
nearly identical to GSH-Au NCs at pH 1 condition (Fig. 2.5c). Significant luminescence
decrease (~98%) was induced by Cr(VI), and minor luminescence changes were observed

42!!
in the presence of other ions. Nano/microscopic structural changes of Au- MCs after
Cr(VI) exposure were not significant based on SEM imaging (Fig. S2.5). Intriguingly,
low pH was not needed for Au-MCs to show Cr(VI) sensitivity. Low-pH testing of Au-
MCs was not performed for comparison, because acidic conditions damaged the capsule
structure (see next section).
2.3.5. Sensitivity of GSH-Au NCs and Au-MCs to Cr(VI) at different concentrations
We next assessed the luminescence sensitivity of GSH-Au NCs and Au-MCs towards
Cr(VI) at different concentrations. A series of solutions with different Cr(VI)
concentrations (up to 1040 ppb-Cr or 20 µM) were prepared in DI water and acidified to
pH 1. PL spectra of each sample solution were recorded after the addition of 5 µL of
GSH-Au NCs stock solution (Fig. S2.6a). Quenching was correlated to Cr(VI)
concentration added (Fig. 2.6a).
Quenching efficiency was quantified using the Stern-Volmer equation, F0/(F0-
F)=1/f+1/(fKSV[Q]), where F0 and F are the luminescence intensity in the absence and
presence of Cr(VI), respectively. f is fraction of Au NCs that are accessible to the
quencher, [Q] is the concentration of analyte quencher, and KSV is the Stern-Volmer
quenching constant.[42,43] A higher KSV value indicates a more sensitive system. The
Stern-Volmer plot (F0/(F0-F) vs. 1/[Q]) for Au NCs (Fig. S2.6b) indicated f = 1,
consistent with the idea that all the freely suspended, unencapsulated Au NCs can come
into contact with Cr(VI) oxyanions (Table 2.1).

43!!
Figure 2.6 Luminescence ratio (F/F0) of (a) GSH-Au NCs and (b) Au-MCs versus Cr(VI) concentration, where F0 and F are the corresponding luminescence intensities at 600 nm (365 nm excitation) in the absence and presence of Cr(VI), respectively. Solution pH = 1 or 7 (or 7.5), Gold content = 3 µmol-Au atom per 1 L solution).
The GSH-Au NCs were less sensitive for Cr(VI) at pH 7 (Fig. 2.6a), with the KSV
value decreasing from 1.44 ppm-1 to 0.14 ppm-1 (Table 2.1). Luminescence quenching of
GSH-Au NCs at neutral condition is much weaker than that under acidic condition, which
can be explained by the lower redox potential at pH 7 than that at pH 1 (0.41 V vs. 1.24 V
for 10 µM Cr(VI)) calculated using the Nernst equation. The lower redox potential
indicates a lower thermodynamic tendency of Cr(VI) to undergo reduction.
Table 2.1 Comparison of KSV and LOD for GSH-Au NCs and Au-MCs.
Sample Water type pH KSV (ppm-1) f Cr(VI) LOD (ppb)
GSH-Au NCs DI water 1 1.30 1 52
GSH-Au NCs DI water 7 0.14 1 700
Au-MCs DI water 1 1.10 0.93 50
Au-MCs DI water 7 13.28 0.93 6

44!!
Au-MCs DI water 7.5 6.75 0.93 8
Au-MCs Simulated drinking water 7.5 3.58 0.93 21
Cr(VI) sensing using Au-MCs was carried out following the same procedure
except that 50 µL of Au-MCs suspension with same Au content was used. With an
increase in Cr(VI) concentration, the luminescence intensity of Au-MCs gradually
decreased (Fig. 2.6b). A linear decrease in luminescence intensity was observed with
increasing Cr(VI) concentration up to 0.05 ppm. Different from the free Au NCs, the
fraction of Au NCs within the microcapsule accessible to Cr(VI) (f) was 0.93, according
to the Stern-Volmer plot (Fig. S2.7). A small portion (7%) of the encapsulated Au NCs is
not accessible to Cr(VI), and do not quench. KSV of Au-MCs at pH 1 and 7 were 1.30
ppm-1 and 13.28 ppm−1, respectively (Table 2.1). The KSV of Au-MCs and GSH-Au NCs
were essentially the same at pH 1(Table 2.1), which we attributed to the breakdown of
the former into their polymer and nanoparticle constituents at the low pH. The Au-MCs
were not found anywhere on the TEM grid, but instead individual silica nanoparticles
were found, consistent with structural breakdown and dis-assembly at pH 1 (Fig.
S2.8).[28] The Au-MCs were very sensitive to Cr(VI) at pH 7, which was >90× higher
than that of the free GSH-Au NCs at the same pH.
The Cr(VI) limit of detection (LOD) for GSH-Au NCs was 52 ppb and 700 ppb at
pH 1 and pH 7, respectively (Table 2.1). The higher LOD is a direct consequence of the
NC's lower sensitivity at pH 7. The LOD of 52 ppb at pH 1 is lower than the 100 ppb of
U.S. EPA MCL for total chromium, but practical use dictates that no pH adjustment is
needed and that NCs not be used in sol form.
45!!The Cr(VI) LOD for Au-MCs was 50 ppb and 6 ppb at pH 1 and pH 7,
respectively (Table 2.1). While LOD at pH 1 is also lower than the total chromium MCL,
the low pH condition is not appropriate for Au-MC use. The LOD at pH 7 is 15× lower
than the MCL which is one important attribute towards implementation. This much lower
LOD stems from the higher sensitivity (large KSV value) resulting from the higher
luminescence intensity of the Au-MCs (Fig. 2.4).
We next tested Au-MCs for Cr(VI) sensitivity in simulated drinking water.
Compared to deionized water at pH 7, the simulated drinking water (pH 7.5) lowered the
sensitivity and raised the detection limit of Au-MCs toward Cr(VI). The KSV value was
3.58 ppm-1, roughly 4× lower than the DI water case (Table 2.1, Fig. S2.9). The Cr(VI)
LOD increased from 6 to 21 ppb in the simulated drinking water, which was calculated
based on a modified calibration curve that corrected the effects of interference (Fig.
S2.10). This LOD was still lower than 100 ppb (total chromium MCL). There were two
possible effects causing the lowered sensitivity and the raised detection limit: the pH
difference and the presence of additional ions (e.g., HCO3-, SO4
2-, Cl-, Na+, Ca2+, Mg2+).
As a control, only raising the pH of DI water from 7 to 7.5 caused KSV to decrease from
13.28 to 6.75 ppm-1 (Fig. S2.7b) and Cr(VI) LOD to increase from 6 to 8 ppb. The
Cr(VI) sensitivity is lower because the Au-MC became less luminescent at pH values
above 7 (Fig. S2.11). In comparing the simulated drinking water (pH 7.5) to DI water at
pH 7.5, the KSV further decreased to 3.58 ppm-1 and LOD increased to 21 ppb. The
differences in KSV and LOD are possibly due to the additional ions, which could have
also contributed to some subtle change to the materials structure.

46!!
2.3.6. Indirect evidence for low pH inside the microcapsules
One of the most interesting observations of the Au-MC system is no acidification of the
sample was needed, implying the capsule interior provides the acidic environment
required for de-luminescence. Within the Au-MCs, the effective proton concentration can
be thought to be higher than bulk concentration due to the high density of PAH (carrying
protonated amine functional groups) distributed throughout the capsule wall and interior
(Scheme 2.1). To test this possibility, we synthesized PAH conjugated to a pH-sensitive
dye molecule (rhodamine B isothiocyanate, RBITC) and used it in the preparation of
MCs containing no Au NCs (Supplementary Information).
The resulting RBITC-PAH MCs, suspended in a DI water solution with a bulk pH
of ~7, showed a peak absorbance at 566 nm, identical to that shown by a RBITC-PAH
solution at pH 2 and below (Fig. 2.7). RBITC-PAH solution at higher pH values showed
a ~10-nm UV-vis absorbance blue shift (Fig. S2.12). Similar local acidic environments
was observed inside dendrimer structures[44] that have a high volume density of protons
associated with the amine groups in the interior.[45]
552
554
556
558
560
562
564
566
568
Inside MCs
pH 1-2 pH 2-3 pH 3-10
Peak
wav
elen
gth
(nm
)
a b c d
47!!
Figure 2.7 Peak wavelength of UV-vis absorbance of RBITC-PAH (a) inside the MCs, and (b-d) in bulk solution at pH values of (b) 1-2, (c) pH 2-3, and (d) pH 3-9.
2.3.7. Cr(VI) strip-based sensor using Au-MCs
This method can also be successfully extended to a simple test strip system, similar to
that of pH indicator paper. The Au-MCs immobilized on paper showed similar Cr(VI)
induced luminescence quenching behavior as if they were in suspension. The test strips
exhibited a gradual decrease in luminescence intensity after they were dipped in
simulated drinking water (pH~7.5) with Cr(VI) of increasing concentrations (Fig. 2.8).
The LOD for the Au-MC-containing test strip was estimated to be 30 ppb, which
is 3× lower than the 100 ppb MCL. The LOD for the Au-MC-containing test strip is
slightly higher than 21 ppb, the LOD for non-immobilized Au-MCs (Table 2.1), which
we attribute to the camera being less sensitive than the photoluminescence spectrometer.
In comparison, unencapsulated Au NCs were dispersed on paper with the same Au
loading, and tested in the same manner. These test strips showed negligible luminescence
decrease with increasing Cr(VI) concentration increased, showing the importance of
encapsulation (Fig. S2.13). The test strip is one-time use due to the irreversible
fluorescence quenching of the Au-MCs.
We also tested the reproducibility of the paper-based sensor in detecting Cr(VI)
by preparing 10 test strips and evaluating the luminescence response of each. The average
signal remained consistent after reaction with 0.5 ppm Cr(VI) (Table S2.3), with a
relative standard deviation (RSD) of 2.9%, indicating high reproducibility.

48!!
Figure 2.8 Image of paper test strips with Au-MCs (0.19 µg Au per strip) (a) under visible light as it fabricated, and (b) under 365 nm UV illustration after dipping into simulated drinking water with different Cr(VI) concentrations and plot of the relative color intensity (I/I0) versus Cr(VI) concentration
2.4. Conclusions
Luminescent glutathione-capped gold nanoclusters (GSH-Au NCs) were synthesized and
incorporated into 0.9 µm-sized capsular particles through polymer-salt assembly (PSA)
chemistry. These microcapsules (MCs) were five times more luminescent than the free
Au NCs at the same Au content. The enhanced luminescence comes from Mie scattering
introduced by the capsule structure. Cr(VI) sensitivity consequently increases, allowing
the LOD of 52 ppb (for free GSH-Au NCs) to improve to 6 ppb after encapsulation. The
amine polymer-containing capsule interior likely provides a low-pH environment for the
NCs to de-luminescense in the presence of Cr(VI), allowing the MCs to be used without
the need for pH adjustment. Cr(VI) was detected in simulated drinking water at
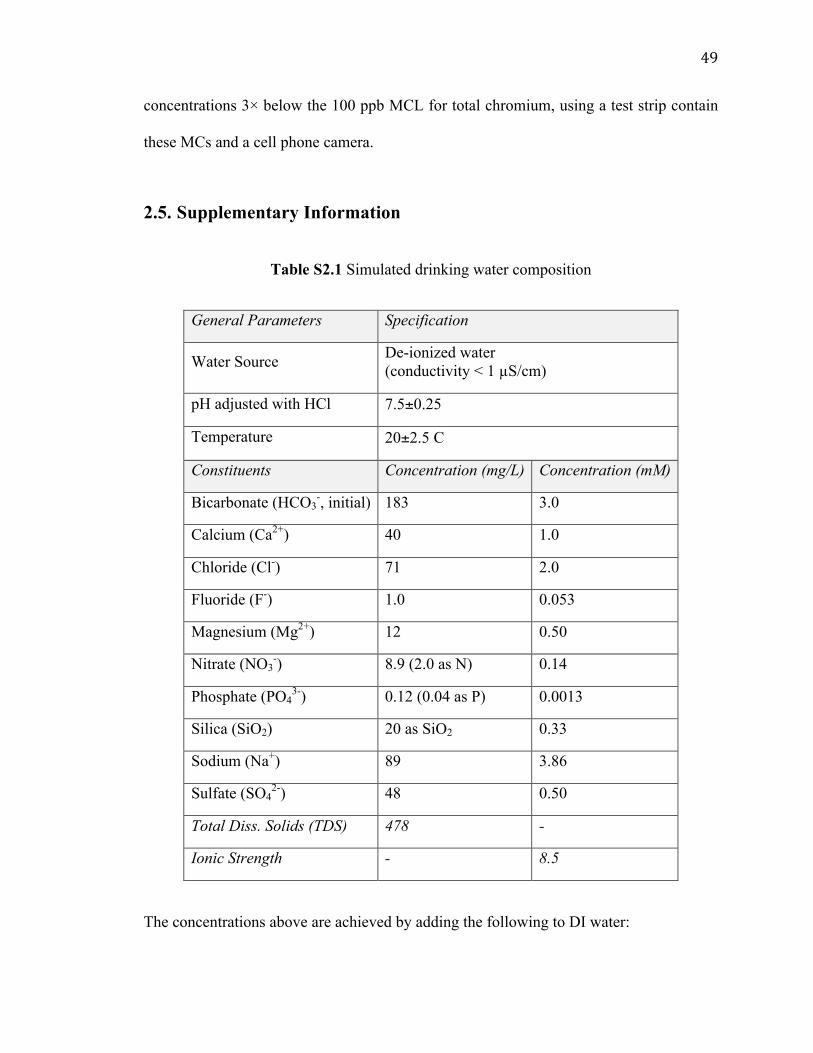
49!!
concentrations 3× below the 100 ppb MCL for total chromium, using a test strip contain
these MCs and a cell phone camera.
2.5. Supplementary Information
Table S2.1 Simulated drinking water composition
General Parameters Specification
Water Source De-ionized water (conductivity < 1 µS/cm)
pH adjusted with HCl 7.5±0.25
Temperature 20±2.5 C
Constituents Concentration (mg/L) Concentration (mM)
Bicarbonate (HCO3-, initial) 183 3.0
Calcium (Ca2+) 40 1.0
Chloride (Cl-) 71 2.0
Fluoride (F-) 1.0 0.053
Magnesium (Mg2+) 12 0.50
Nitrate (NO3-) 8.9 (2.0 as N) 0.14
Phosphate (PO43-) 0.12 (0.04 as P) 0.0013
Silica (SiO2) 20 as SiO2 0.33
Sodium (Na+) 89 3.86
Sulfate (SO42-) 48 0.50
Total Diss. Solids (TDS) 478 -
Ionic Strength - 8.5
The concentrations above are achieved by adding the following to DI water:

50!!
A. 252 mg/L NaHCO3
B. 147 mg/L CaCl2-2H2O
C. 124 mg/L MgSO4-7H2O
D. 95 mg/L Na2SiO3-9H2O
E. 12 mg/L NaNO3
F. 2.2 mg/L NaF
G. 0.18 mg/L NaH2PO4-H2O
After adjusting the pH down to 7.5 with HCl, the solution is expected to have an
alkalinity of approximately 2.8 meq/L.
2.5.1. Synthesis of RBITC
Briefly, 4.2 mg of rhodamine B isothiocyanate (RBITC) was dissolved in 1 mL of
dimethylsulfoxide (DMSO). This solution was sonicated for 10 min before being cooled
to 4 °C. The PAH solution was prepared by dissolving PAH (305.9 mg) in a sodium
hydroxide solution (1.0 mL of 0.1 N sodium hydroxide diluted in 4.0 mL of deionized
water). This second solution was also sonicated for 10 min and allowed to cool to 4 °C.
Once both solutions cooled to 4 °C, the PAH solution was poured into the RBITC
solution and vortex mixed for 10 sec. The 15-mL plastic vial was then covered in
aluminum foil and placed on a shake table for 48 h.
This solution was then placed within a 3.5-kDa MWCO dialysis bag submerged
in 1.0 L of DI water. Dialysis was performed for 90 min under slow stirring until the bulk
dialysis solution had turned a light red under visible light. The content of the dialysis bag
was transferred to a 50-mL plastic vial which was then centrifuged for 20 min at 10,000
RPM. The supernatant was decanted and the final product was re-suspended in 30 mL of

51!!
DI water and sonicated for 10 min. This vial was covered in aluminum foil and stored
under refrigeration (4 °C) until use.
2.5.2. Synthesis and testing of RBITC-PAH MCs
The synthesis route of the RBITC-conjugated PAH MCs was analogous to normal MCs.
In a typical synthesis, cooled RBITC-PAH solution (4 °C, 10 mg/mL, 0.2 mL) was added
into cooled Na2HPO4 solution (4 °C, 0.03 M, 3 mL) in a 15 mL plastic centrifuge tube
(VWR, SuperClear) at room temperature. PAH/Phosphate aggregates readily formed
upon mixing as evidence by the rapid change from a clear, colorless solution to a slight-
pink, turbid suspension. The resulting suspension was vortex-mixed at a high speed (8
speed on a 1-10 scale, Fisher Scientific Mini Vortex Mixer) for 10 seconds and then aged
for 10 min at 4 °C. SiO2 solution (diluted to 7 wt %, 3.0 mL) was then added into the
suspension to initiate MC formation. This solution was aged for 24 h at 4 °C then washed
twice with deionized water through centrifugation (3500 rpm for 20 min), and re-
dispersed in the 3.0 mL of deionized water.
The RBITC-PAH was suspended in solutions with different pH values ranging
from pH 1~9. UV-Vis absorbance was measured at each condition and it was observed
that the spectra could be categorized by three transitions. Unique spectra were acquired
(Fig. S2.12) at pH 1-2, pH 2-3, and pH 3-9. The wavelength of maximum absorbance
corresponds to 566 nm for pH 1-2, 562 nm for pH 2-3, and 557 nm for pH 3-9 (Fig. 2.7).

52!!
2.5.3. Characterization of GSH-Au NCs
The as-synthesized GSH-Au NCs sol appears bright yellow under visible light and emits
a yellow-orange color under 365 nm irradiation (Fig. S2.1a). The UV-vis absorption
spectrum do not exhibit the surface plasmon resonance absorption peak (~520 nm)
associated with a particle diameter greater than ~2 nm. The GSH-Au NCs show a broad
excitation spectrum (250-500 nm), a large Stokes shift of >200 nm, and a broad emission
spectrum (500-800 nm) with the peak centered at 600 nm (Fig. S2.1b). The typical
lifetime for fluorescence ranges from femtoseconds to nanoseconds while for
phosphorescence it ranges from microseconds to seconds.[17] The microsecond-scale
lifetime [3.27 µs (41%), 0.91µs (46%), and 0.18 µs (13%)] of the luminescent Au
NCs (Fig. S2.1c) suggests that the emission was mainly phosphorescence. Luo et al.
measured the luminescence lifetime of the Au NCs synthesized using the same procedure
to be on the order of microsecond, which was consistent with our results.[46]
53!!
Figure S2.1 (a) Photographs of an aqueous sol of GSH-Au NCs (2 mM on Au atom basis) under visible light (left) and 365 nm UV illumination (right). (b) UV-vis absorption (green line), photoexcitation (red line, emission wavelength of 600 nm) and photoemission (blue line, excitation wavelength of 365 nm) spectra of GSH-Au NCs. (c) Photoluminescence decay profile of GSH-Au NCs (d) TEM image of GSH-Au NCs. (e) Size histogram of GSH-Au NCs based on 200 imaged particles.
The QY was measured to be 15% in aqueous solution (pH ~ 7).[21] The purified
GSH-Au NC sol was stable under storage for at least one month, based on a periodic
luminescence measurements. The zeta potential of the GSH-Au NCs sol was -12.4±1.5
mV, due to the negative charge of deprotonated carboxylate groups of GSH at neutral pH.
The zeta potential measured after two months (-13.5±1.6 mV) was consistent with the
fresh-prepared GSH-Au NCs. Though, the zeta potential was not in the commonly stable
range of nanoparticles (<-30 mV or >30 mV)[47], the steric effects of the surface ligand
GSH can stabilize the Au NCs. Before each experiment, Au NCs solution was sonicated
for 10 min to ensure homogeneous dispersion.
Transmission electron microscopy showed the spherical shape of the GSH-Au
NCs (Fig. S2.1d). The particles are unimodal in size, with an average diameter of 1.6 nm
(Fig. S2.1e). At this length scale though, the standard deviation (0.4 nm) reflects image
resolution limitations more than true particle size distribution.[48]
2.5.4. Estimating Au content of Au-MCs
The amount of GSH-Au NCs per microcapsule was calculated by assuming
monodisperse microcapsules of 1 µm and same loading of GSH-Au NCs in each
microcapsule. The average concentration of typical as-synthesized MCs was previously
reported as ~108 capsules/mL through Coulter counter measurements.[25] The average
yield of dried Au-MCs per batch synthesis is 4.1 mg. Based on these values and

54!!
assumptions, Au mass balance calculation indicates that each microcapsule was
comprised up to ~3×10⁷ GSH-Au NCs (Table S2.2).
Table S2.2 MC formulation showing the GSH-Au NCs per MC and GSH-Au NCs (wt%) and Au content (wt%) normalized to dried microcapsule weight.
GSH-Au NCs per MC (×107) GSH-Au NCs per MC (wt%) Au content per MC (wt%)
0 0 0
0.125 0.5 0.2
0.25 1.0 0.4
0.5 1.9 0.8
1 3.8 1.6
2 7.7 3.2
3 11.5 4.8
Figure S2.2 Photoemission spectra of seven types of Au-MCs made from different cationic polymers (PAH or PEI), anionic salt linkers (Na2HPO4 or Na2CIT) and charge ratios (R=3 or 6) in water (overall Au concentration in vial for both suspensions = 0.03 mM on Au atom basis).

55!!
Figure S2.3 (a) Photoemission (365 nm excitation) and (b) photoextinction spectra of GSH-Au NCs, Au-MCs and Au-PSAs. (overall Au concentration in vial for both suspensions = 0.03 mM on Au atom basis).
Figure S2.4 (a) TEM image of GSH-Au NCs after Cr(VI) exposure. (b) Size histogram of GSH-Au NCs based on 200 imaged particles.

56!!
Figure S2.5 SEM image of Au-MCs after Cr(VI) exposure (pH~7)
Figure S2.6 (a) Photoemission spectra of 5 µL GSH-Au NCs in acidified DI water (3 mL, pH=1, 3 µM Au atom) with different concentration (0 – 1.04 ppm) of Cr(VI) at the excitation wavelength of 365 nm; (b) Stern–Volmer Plot of the luminescence ratio (F0/(F0-F)) of GSH-Au NCs versus the reverse of Cr(VI) concentration with a linear correlation range of 0.05 to 0.52 ppm of Cr(VI), where F0 and F are the corresponding luminescence intensities at 600 nm in the absence and presence of Cr(VI), respectively.
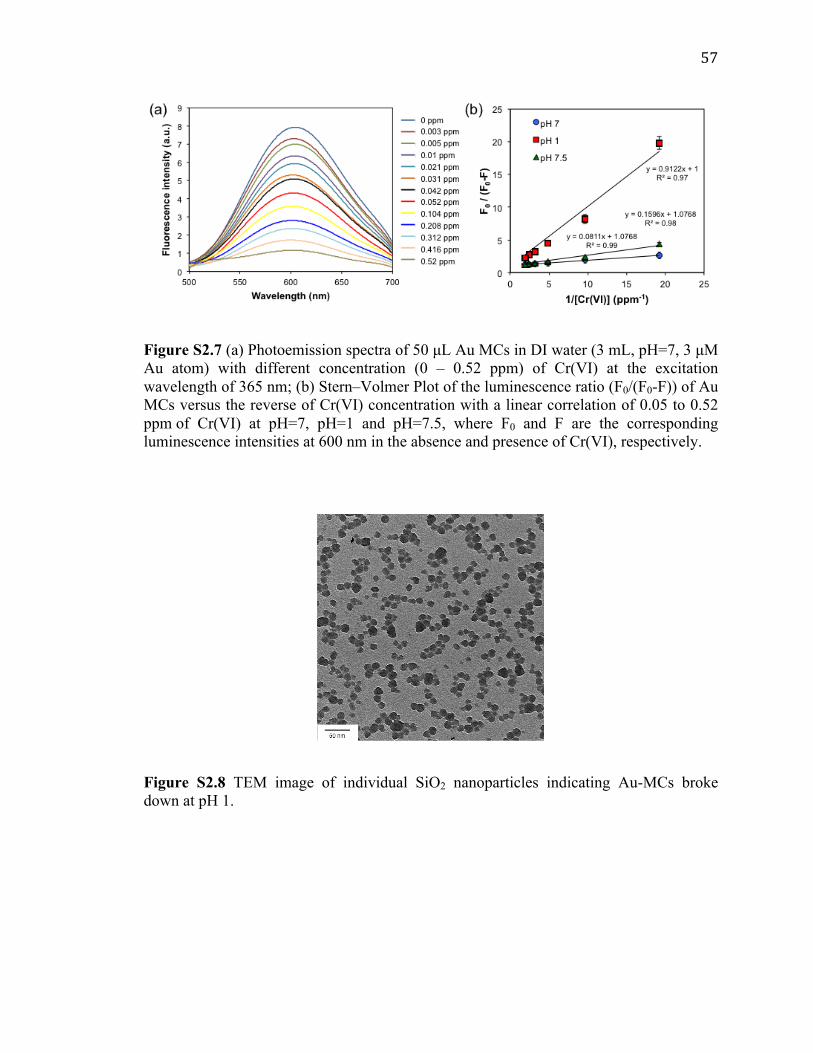
57!!
Figure S2.7 (a) Photoemission spectra of 50 µL Au MCs in DI water (3 mL, pH=7, 3 µM Au atom) with different concentration (0 – 0.52 ppm) of Cr(VI) at the excitation wavelength of 365 nm; (b) Stern–Volmer Plot of the luminescence ratio (F0/(F0-F)) of Au MCs versus the reverse of Cr(VI) concentration with a linear correlation of 0.05 to 0.52 ppm of Cr(VI) at pH=7, pH=1 and pH=7.5, where F0 and F are the corresponding luminescence intensities at 600 nm in the absence and presence of Cr(VI), respectively.
Figure S2.8 TEM image of individual SiO2 nanoparticles indicating Au-MCs broke down at pH 1.

58!!
Figure S2.9 (a) Photoemission spectra of 50 µL Au MCs in simulated drinking water (3 mL, pH=7.5, 3 µM Au atom) with different concentration (0 – 3.12 ppm) of Cr(VI) at the excitation wavelength of 365 nm; (b) Stern–Volmer Plot of the luminescence ratio (F0/(F0-F)) of Au MCs versus the reverse of Cr(VI) concentration with a linear detection range of 0.05 to 0.52 ppm of Cr(VI), where F0 and F are the corresponding luminescence intensities at 600 nm in the absence and presence of Cr(VI), respectively.
Figure S2.10 Luminescence ratio (F/F0) of Au-MCs versus Cr(VI) concentration at simulated drinking water condition, where F0 and F are the corresponding luminescence intensities at 600 nm (365 nm excitation) in the absence and presence of Cr(VI), respectively. Solution pH = 7.5, Gold content = 3 µmol-Au atom per 1 L solution).
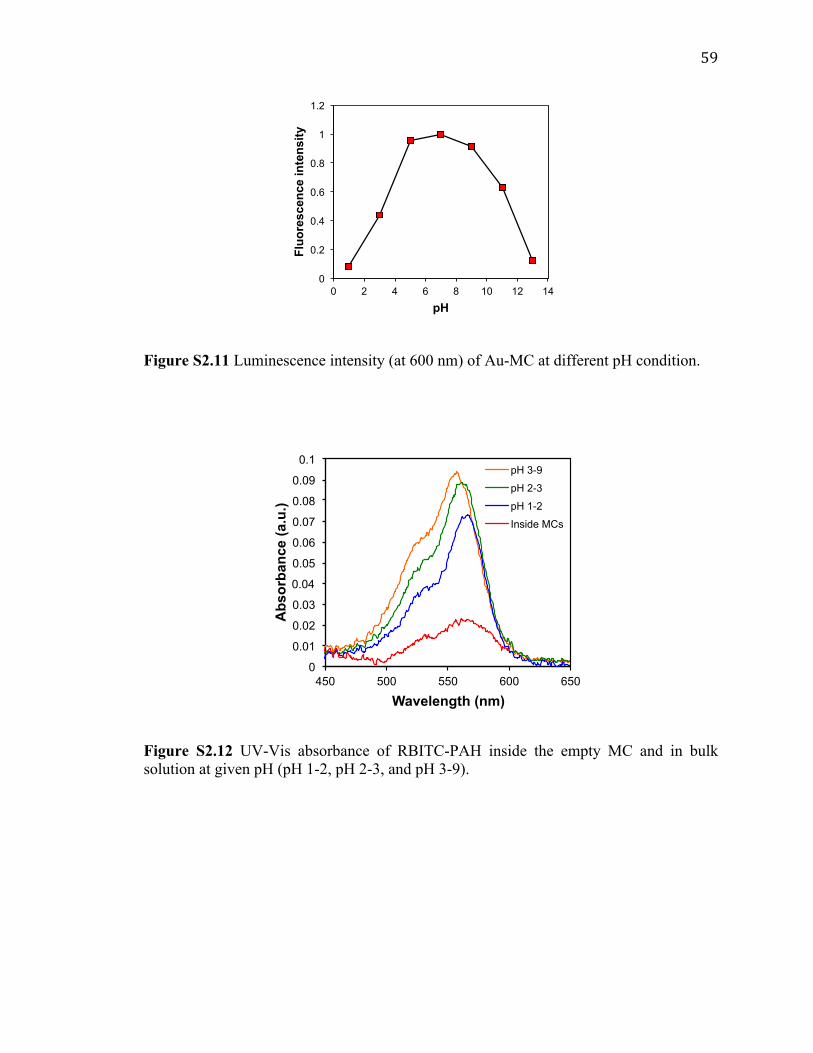
59!!
Figure S2.11 Luminescence intensity (at 600 nm) of Au-MC at different pH condition.
Figure S2.12 UV-Vis absorbance of RBITC-PAH inside the empty MC and in bulk solution at given pH (pH 1-2, pH 2-3, and pH 3-9).
0
0.2
0.4
0.6
0.8
1
1.2
0 2 4 6 8 10 12 14 Fl
uore
scen
ce in
tens
ity
pH
0
0.01
0.02
0.03
0.04
0.05
0.06
0.07
0.08
0.09
0.1
450 500 550 600 650
Abs
orba
nce
(a.u
.)
Wavelength (nm)
pH 3-9
pH 2-3
pH 1-2
Inside MCs

60!!
Figure S2.13 Image of paper test strips with unencapulated GSH-Au NCs (0.19 µg Au per strip) under 365 nm UV illustration after dipping into simulated drinking water (pH 7.5) with different Cr(VI) concentrations and plot of the relative color intensity (I/I0) versus Cr(VI) concentration
Table S2.3 The reproducibility of the paper-based sensor in analyzing Cr(VI) in 10
batches
Test# 1 2 3 4 5 6 7 8 9 10
I/I0 0.56 0.57 0.56 0.58 0.55 0.53 0.56 0.59 0.55 0.56
2.6. Reference
[1] X. Yuan, Z. Luo, Y. Yu, Q. Yao, J. Xie, Luminescent noble metal nanoclusters as an emerging optical probe for sensor development, Chem. - An Asian J. 8 (2013) 858–871. doi:10.1002/asia.201201236.

61!!
[2] L.Y. Chen, C.W. Wang, Z. Yuan, H.T. Chang, Fluorescent gold nanoclusters: Recent advances in sensing and imaging, Anal. Chem. 87 (2015) 216–229. doi:10.1021/ac503636j.
[3] J. Sun, Y. Jin, Fluorescent Au nanoclusters: recent progress and sensing applications, J. Mater. Chem. C. 38 (2014) 8000–8011. doi:10.1039/c4tc01489h.
[4] J. Xie, Y. Zheng, J.Y. Ying, Highly selective and ultrasensitive detection ofHg2+ based on fluorescence quenching of Au nanoclusters by Hg2+–Au+ interactions, Chem. Commun. 46 (2010) 961–963. doi:10.1039/B920748A.
[5] G. Zhang, Y. Li, J. Xu, C. Zhang, S. Shuang, C. Dong, M.M.F. Choi, Glutathione-protected fluorescent gold nanoclusters for sensitive and selective detection of Cu2+, Sensors Actuators B Chem. 183 (2013) 583–588. doi:10.1016/j.snb.2013.04.023.
[6] J. Sun, J. Zhang, Y. Jin, J.D. Gu, J.P. Borel, T. Tsukuda, Y.Y. Chen, W.T. Hung, X. Cai, E. Li, I.M. Kempson, Y. Hwu, C.S. Yang, E.S. Tok, H.R. Tan, M. Lin, G. Margaritondo, 11-Mercaptoundecanoic acid directed one-pot synthesis of water-soluble fluorescent gold nanoclusters and their use as probes for sensitive and selective detection of Cr 3+ and Cr 6+, J. Mater. Chem. C. 1 (2013) 138–143. doi:10.1039/C2TC00021K.
[7] Y.B. Yin, S. Guo, K.N. Heck, C.A. Clark, C.L. Coonrod, M.S. Wong, Treating Water by Degrading Oxyanions Using Metallic Nanostructures, ACS Sustain. Chem. Eng. 6 (2018) 11160–11175. doi:10.1021/acssuschemeng.8b02070.
[8] H. Sun, J. Brocato, M. Costa, Oral chromium exposure and toxicity., Curr. Environ. Heal. Reports. 2 (2015) 295–303. doi:10.1007/s40572-015-0054-z.
[9] State Water Resources Control Board Division of Water Quality GAMA Program, Groundwater information sheet - hexavalent chromium, 2017. http://www.waterboards.ca.gov/gama/docs/coc_hexchromcr6.pdf (accessed August 25, 2017).
[10] The California Water Boards, Maximum contaminant levels and regulatory dates for drinking water U.S. EPA vs California, 2014. http://www.waterboards.ca.gov/drinking_water/certlic/drinkingwater/Documents/DWdocuments/MCLsEPAvsDWP-2014-07-01.pdf (accessed August 25, 2017).
[11] World Health Organization (WHO), Chromium in Drinking-water Background document for development of WHO Guidelines for Drinking-water Quality, 1996. http://www.who.int/water_sanitation_health/dwq/chemicals/chromium.pdf (accessed August 3, 2017).
[12] The Ministry of Environmental Protection of the People’s Republic of China, Standard for drinking water quality (GB5749-2006), 2006.

62!!
[13] The Ministry of Environmental Protection of the People’s Republic of China, Discharge standard of pollutants for chrome and its compound industry, 2008. http://www.mep.gov.cn/gkml/hbb/bgth/200910/W020080721435394989316.pdf (accessed August 25, 2017).
[14] Chromium Color Disc Test Kit, Model CH-8 | Hach USA - Overview, (n.d.). https://www.hach.com/chromium-color-disc-test-kit-model-ch-8/product?id=7640217301 (accessed March 10, 2018).
[15] H. Zhang, Q. Liu, T. Wang, Z. Yun, G. Li, J. Liu, G. Jiang, Facile preparation of glutathione-stabilized gold nanoclusters for selective determination of chromium (III) and chromium (VI) in environmental water samples, Anal. Chim. Acta. 770 (2013) 140–146. doi:10.1016/j.aca.2013.01.042.
[16] G. Jian-feng, H. Chang-jun, Y. Mei, H. Dan-qun, F. Huan-bao, J. Liu, G. Jiang, X.Y. Zeng, X. Chen, X. Jiang, Ultra-sensitive fluorescence determination of chromium(VI) in aqueous solution based on selectively etching of protein-stabled gold nanoclusters, RSC Adv. 6 (2016) 104693–104698. doi:10.1039/C6RA23222A.
[17] M.Y. Berezin, S. Achilefu, Fluorescence lifetime measurements and biological imaging, Chem. Rev. 110 (2010) 2641–84. doi:10.1021/cr900343z.
[18] J. Zheng, P.R. Nicovich, R.M. Dickson, Highly fluorescent noble-metal quantum dots., Annu. Rev. Phys. Chem. 58 (2007) 409–31. doi:10.1146/annurev.physchem.58.032806.104546.
[19] Z. Wu, R. Jin, On the Ligand’s Role in the Fluorescence of Gold Nanoclusters, Nano Lett. 10 (2010) 2568–2573. doi:10.1021/nl101225f.
[20] R. Jin, C. Zeng, M. Zhou, Y. Chen, Atomically Precise Colloidal Metal Nanoclusters and Nanoparticles: Fundamentals and Opportunities, Chem. Rev. 116 (2016) 10346–10413. doi:10.1021/acs.chemrev.5b00703.
[21] Z. Luo, X. Yuan, Y. Yu, Q. Zhang, D.T. Leong, J.Y. Lee, J. Xie, From aggregation-induced emission of Au(I)-thiolate complexes to ultrabright Au(0)@Au(I)-thiolate core-shell nanoclusters, J. Am. Chem. Soc. 134 (2012) 16662–16670. doi:10.1021/ja306199p.
[22] N. Goswami, Q. Yao, Z. Luo, J. Li, T. Chen, J. Xie, Luminescent Metal Nanoclusters with Aggregation-Induced Emission, J. Phys. Chem. Lett. 7 (2016) 962–975. doi:10.1021/acs.jpclett.5b02765.
[23] A. Yahia-Ammar, D. Sierra, F. Mérola, N. Hildebrandt, X. Le Guével, Self-Assembled Gold Nanoclusters for Bright Fluorescence Imaging and Enhanced Drug Delivery, ACS Nano. 10 (2016) 2591–2599. doi:10.1021/acsnano.5b07596.

63!!
[24] V.S. Murthy, R.K. Rana, M.S. Wong, Nanoparticle-Assembled Capsule Synthesis: Formation of Colloidal Polyamine−Salt Intermediates, 110 (2006) 25619–25627. doi:10.1021/JP061826B.
[25] J. Yu, V.S. Murthy, R.K. Rana, M.S. Wong, Synthesis of nanoparticle-assembled tin oxide/polymer microcapsules, Chem. Commun. 0 (2006) 1097–1099. doi:10.1039/b513901e.
[26] V.S. Murthy, S.B. Kadali, M.S. Wong, Polyamine-Guided Synthesis of Anisotropic, Multicompartment Microparticles, ACS Appl. Mater. Interfaces. 1 (2009) 590–596. doi:10.1021/am8001499.
[27] J. Yu, D. Javier, M.A. Yaseen, N. Nitin, R. Richards-Kortum, B. Anvari, M.S. Wong, Self-Assembly Synthesis, Tumor Cell Targeting, and Photothermal Capabilities of Antibody-Coated Indocyanine Green Nanocapsules, J. Am. Chem. Soc. 132 (2010) 1929–1938. doi:10.1021/ja908139y.
[28] H.G. Bagaria, M.S. Wong, Polyamine–salt aggregate assembly of capsules as responsive drug delivery vehicles, J. Mater. Chem. 21 (2011) 9454–9466. doi:10.1039/c1jm10712g.
[29] A.M. Brouwer, Standards for photoluminescence quantum yield measurements in solution (IUPAC Technical Report), Pure Appl. Chem. 83 (2011) 2213–2228. doi:10.1351/PAC-REP-10-09-31.
[30] M. Martini, M. Montagna, M. Ou, O. Tillement, S. Roux, P. Perriat, How to measure quantum yields in scattering media: Application to the quantum yield measurement of fluorescein molecules encapsulated in sub-100 nm silica particles, Cit. J. Appl. Phys. 106 (2009) 94304–94312. doi:10.1063/1.3248302.
[31] Nationa Sanitation Foundation (NSF), NSF/ANSI, n.d. http://www.nsf.org/consumer-resources/water-quality/water-filters-testing-treatment/standards-water-treatment-systems (accessed August 25, 2017).
[32] IUPAC, IUPAC Gold Book - limit of detection in analysis, 2014. doi:10.1351/goldbook.L03540.
[33] G. Begum, S. Singh, N. Rangaraj, G. Srinivas, R.K. Rana, J. Soto, P. Amorós, J. Cano, E. Ruiz, M. Zhou, K. Tang, G.Y. Li, Cellular permeation with nuclear infiltration capability of biomimetically synthesised fluorescent monodisperse mesoporous silica nanospheres in HeLa and human stem cells, J. Mater. Chem. 20 (2010) 8563–8570. doi:10.1039/c0jm00992j.
[34] Z. Luo, X. Yuan, Y. Yu, Q. Zhang, D.T. Leong, J.Y. Lee, J. Xie, From Aggregation-Induced Emission of Au(I)–Thiolate Complexes to Ultrabright Au(0)@Au(I)–Thiolate Core–Shell Nanoclusters, J. Am. Chem. Soc. 134 (2012) 16662–16670. doi:10.1021/ja306199p.
64!!
[35] R.K. Rana, V.S. Murthy, J. Yu, M.S. Wong, Nanoparticle Self-Assembly of Hierarchically Ordered Microcapsule Structures, Adv. Mater. 17 (2005) 1145–1150. doi:10.1002/adma.200401612.
[36] G.A. Parks, The Isoelectric Points of Solid Oxides, Solid Hydroxides, and Aqueous Hydroxo Complex Systems, Chem. Rev. 65 (1965) 177–198. doi:10.1021/cr60234a002.
[37] H.G. Bagaria, S.B. Kadali, M.S. Wong, Shell thickness control of nanoparticle/polymer assembled microcapsules, Chem. Mater. 23 (2011) 301–308. doi:10.1021/cm102472h.
[38] M.-C. Fournier-Salaün, P. Salaün, Quantitative determination of hexavalent chromium in aqueous solutions by UV-Vis spectrophotometer, Cent. Eur. J. Chem. 5 (2007) 1084–1093. doi:10.2478/s11532-007-0038-4.
[39] H.J. Wiegand, H. Ottenwälder, H.M. Bolt, The reduction of chromium (VI) to chromium (III) by glutathione: An intracellular redox pathway in the metabolism of the carcinogen chromate, Toxicology. 33 (1984) 341–348. doi:10.1016/0300-483X(84)90050-7.
[40] M.A.E. Francos, R. Badía-Laíño, M.E. Díaz-García, Fluorescence sensitization of gold-glutathione nanoclusters by aqueous solutions of sodium and potassium ions, Microchim. Acta. 182 (2015) 1591–1598. doi:10.1007/s00604-015-1475-y.
[41] M.M.F. Baig, C.-T. Chen, Y.-C. Chen, Photoluminescence Determination of Aluminum Using Glutathione-Capped Gold Nanoclusters, Anal. Lett. 49 (2016) 2246–2258. doi:10.1080/00032719.2016.1143477.
[42] A. Mills, Controlling the sensitivity of optical oxygen sensors, Sensors Actuators B. 51 (1998) 60–68. http://ac.els-cdn.com/S0925400598002111/1-s2.0-S0925400598002111-main.pdf?_tid=2997315c-966e-11e7-8fe0-00000aab0f6b&acdnat=1505078735_38fab8c47cd55d8eb2f4e41342672958 (accessed September 10, 2017).
[43] C. Fan, S. Wang, J.W. Hong, G.C. Bazan, K.W. Plaxco, A.J. Heeger, Beyond superquenching: hyper-efficient energy transfer from conjugated polymers to gold nanoparticles., Proc. Natl. Acad. Sci. U. S. A. 100 (2003) 6297–301. doi:10.1073/pnas.1132025100.
[44] J. Yang, Q. Zhang, H. Chang, Y. Cheng, Surface-Engineered Dendrimers in Gene Delivery, Chem. Rev. 115 (2015) 5274–5300. doi:10.1021/cr500542t.
[45] M. Markowicz, P. Szymański, M. Ciszewski, A. Kłys, E. Mikiciuk-Olasik, Evaluation of poly(amidoamine) dendrimers as potential carriers of iminodiacetic derivatives using solubility studies and 2D-NOESY NMR spectroscopy, J. Biol. Phys. 38 (2012) 637–656. doi:10.1007/s10867-012-9277-5.

65!!
[46] K.G. Stamplecoskie, Y.-S. Chen, P. V. Kamat, Excited-State Behavior of Luminescent Glutathione-Protected Gold Clusters, J. Phys. Chem. C. 118 (2014) 1370–1376. doi:10.1021/jp410856h.
[47] R.J. Hunter, Zeta potential in colloid science: principles and applications, 1981. doi:https://doi.org/10.1016/C2013-0-07389-6.
[48] W.D. Pyrz, D.J. Buttrey, Particle Size Determination Using TEM: A Discussion of Image Acquisition and Analysis for the Novice Microscopist, Langmuir. 24 (2008) 11350–11360. doi:10.1021/la801367j.
!
! !

66!!
Chapter 3
Treating Water by Degrading Oxyanions Using Metallic Nanostructures
3.1. Introduction
3.1.1. Sustainability of water
Fresh water is essential for life and is a key element of food and energy production, yet it
makes up for only 3% of all earthly water.[1] Roughly ~30% of fresh water is readily
usable, with the rest locked in ice caps and glaciers.[2] In 2014, an estimated 346 billion
gallons per day of fresh surface and groundwater were consumed in the U.S. for energy
production, agriculture, and other needs.[3] As a consequence of anthropogenic activities,
millions of tons of toxic chemicals are unfortunately released into the water supply every
year, negatively impacting water quality.[4] Clean fresh water is critical to both human
health and industrial development, and proper management is required for its sustainable
use.[5]

67!!
3.1.2. Toxic oxyanion contamination
When in the water environment, many elements speciate into oxyanions depending on pH
and electrochemical potential.[6,7] Their molecular formulae can be generalized as
AxOyz, where A represents a chemical element, O represents oxygen, and z is the overall
charge of the ion.[8,9] Oxyanions are highly soluble and mobile in water, and are
widespread in drinking water sources such as surface and groundwater.[8]
Fig. 3.1 shows elements that commonly form thermodynamically and/or
kinetically stable oxyanions at pH 6.5~8.5 and at electrochemical potential (Eh) values of
0.1~0.4, which are the conditions commonly found in drinking water system.[10] An
oxyanion of a given element is considered thermodynamically stable if it is the lowest
free energy state compared with other species of the element.[11] Pourbaix diagrams map
the most thermodynamically stable species for a given element as a function of pH and
electrochemical potential.[12] The sulfate (SO42-) anion, for example, is the
thermodynamically stable species of sulfur at pH 6.5~8.5 and Eh 0.1~0.4 V as shown in
the Fig. 3.2a.[13]
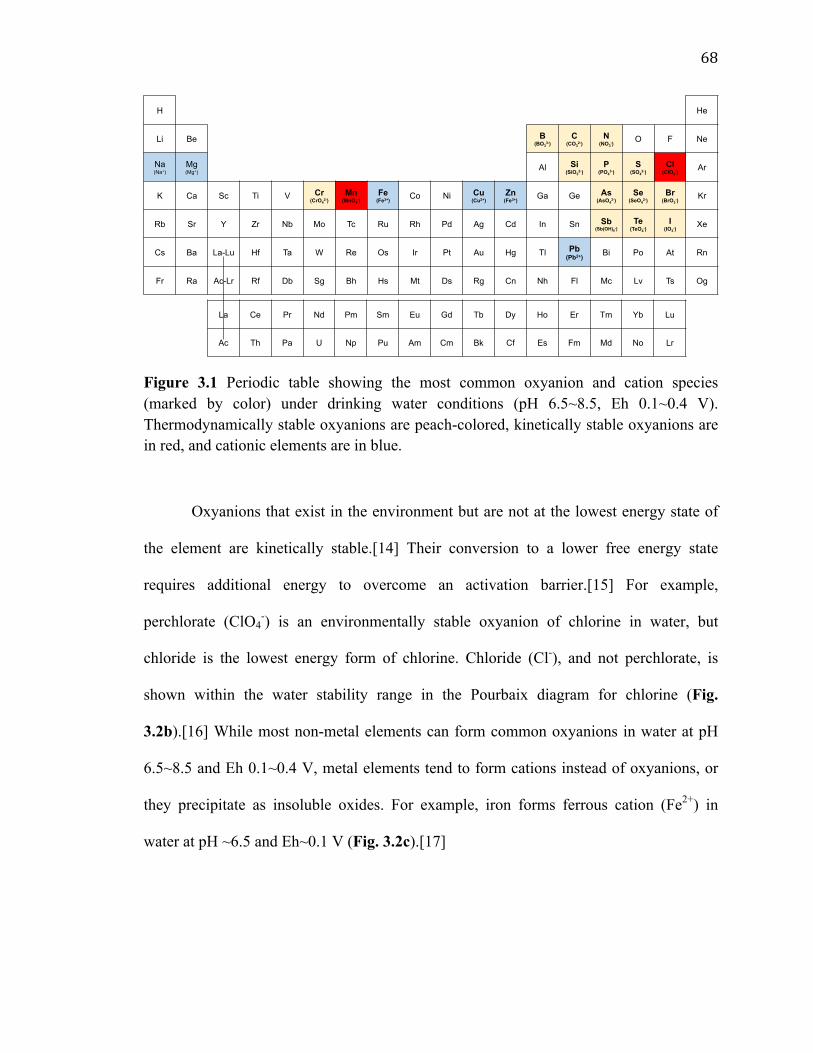
68!!
!Figure 3.1 Periodic table showing the most common oxyanion and cation species (marked by color) under drinking water conditions (pH 6.5~8.5, Eh 0.1~0.4 V). Thermodynamically stable oxyanions are peach-colored, kinetically stable oxyanions are in red, and cationic elements are in blue.
!
Oxyanions that exist in the environment but are not at the lowest energy state of
the element are kinetically stable.[14] Their conversion to a lower free energy state
requires additional energy to overcome an activation barrier.[15] For example,
perchlorate (ClO4-) is an environmentally stable oxyanion of chlorine in water, but
chloride is the lowest energy form of chlorine. Chloride (Cl-), and not perchlorate, is
shown within the water stability range in the Pourbaix diagram for chlorine (Fig.
3.2b).[16] While most non-metal elements can form common oxyanions in water at pH
6.5~8.5 and Eh 0.1~0.4 V, metal elements tend to form cations instead of oxyanions, or
they precipitate as insoluble oxides. For example, iron forms ferrous cation (Fe2+) in
water at pH ~6.5 and Eh~0.1 V (Fig. 3.2c).[17]
H He
Li Be B (BO3
3-) C
(CO32-)
N (NO3
-) O F Ne
Na (Na+)
Mg (Mg+)
Al Si (SiO3
2-) P
(PO43-)
S (SO4
2-) Cl
(ClO2-)
Ar
K Ca Sc Ti V Cr (CrO4
2-) Mn
(MnO4-)
Fe (Fe3+)
Co Ni Cu (Cu2+)
Zn (Fe3+)
Ga Ge As (AsO4
3-) Se
(SeO42-)
Br (BrO3
-) Kr
Rb Sr Y Zr Nb Mo Tc Ru Rh Pd Ag Cd In Sn Sb (Sb(OH)6
-) Te
(TeO4-)
I (IO3
-) Xe
Cs Ba La-Lu Hf Ta W Re Os Ir Pt Au Hg Tl Pb (Pb2+) Bi Po At Rn
Fr Ra Ac-Lr Rf Db Sg Bh Hs Mt Ds Rg Cn Nh Fl Mc Lv Ts Og
La Ce Pr Nd Pm Sm Eu Gd Tb Dy Ho Er Tm Yb Lu
Ac Th Pa U Np Pu Am Cm Bk Cf Es Fm Md No Lr
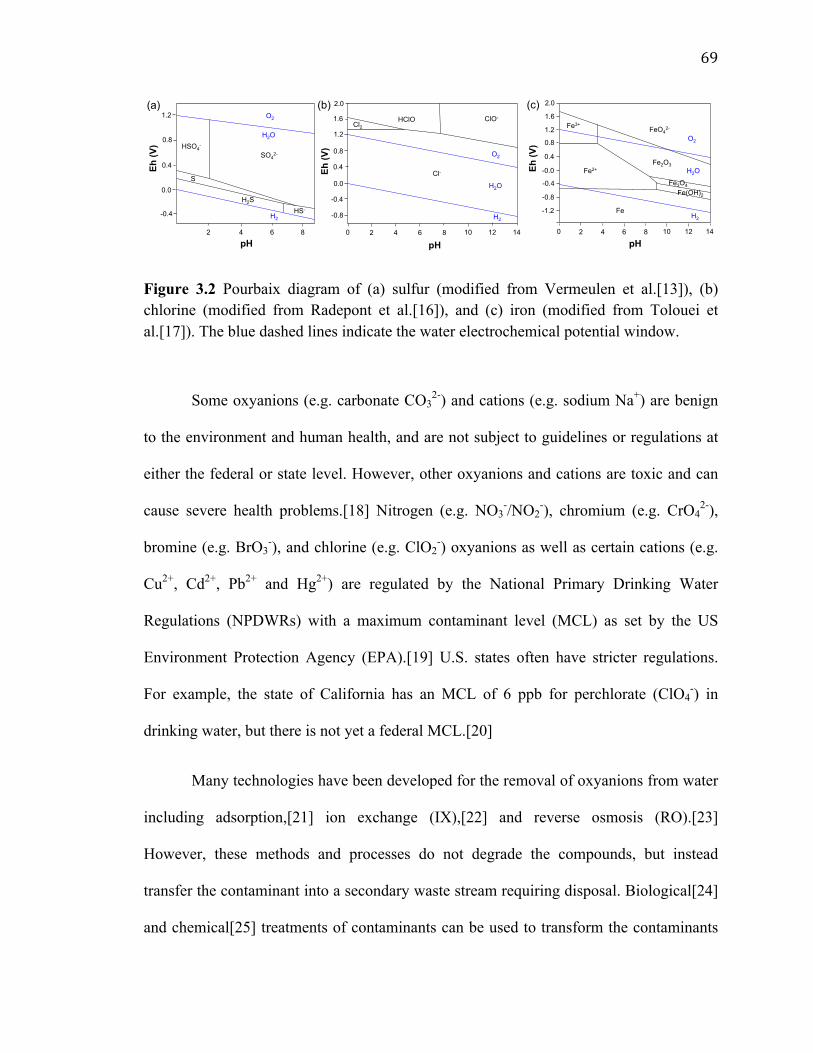
69!!
Figure 3.2 Pourbaix diagram of (a) sulfur (modified from Vermeulen et al.[13]), (b) chlorine (modified from Radepont et al.[16]), and (c) iron (modified from Tolouei et al.[17]). The blue dashed lines indicate the water electrochemical potential window.
Some oxyanions (e.g. carbonate CO32-) and cations (e.g. sodium Na+) are benign
to the environment and human health, and are not subject to guidelines or regulations at
either the federal or state level. However, other oxyanions and cations are toxic and can
cause severe health problems.[18] Nitrogen (e.g. NO3-/NO2
-), chromium (e.g. CrO42-),
bromine (e.g. BrO3-), and chlorine (e.g. ClO2
-) oxyanions as well as certain cations (e.g.
Cu2+, Cd2+, Pb2+ and Hg2+) are regulated by the National Primary Drinking Water
Regulations (NPDWRs) with a maximum contaminant level (MCL) as set by the US
Environment Protection Agency (EPA).[19] U.S. states often have stricter regulations.
For example, the state of California has an MCL of 6 ppb for perchlorate (ClO4-) in
drinking water, but there is not yet a federal MCL.[20]
Many technologies have been developed for the removal of oxyanions from water
including adsorption,[21] ion exchange (IX),[22] and reverse osmosis (RO).[23]
However, these methods and processes do not degrade the compounds, but instead
transfer the contaminant into a secondary waste stream requiring disposal. Biological[24]
and chemical[25] treatments of contaminants can be used to transform the contaminants
O2
H2
H2S
S
SO42-
HSO4-
HS-
H2O
2 4 6 8
1.2
0.8
0.4
0.0
-0.4
Eh (V
)
pH 2 4 6 8
pH 10 12 14
ClO- HClO Cl2
Cl-
O2
H2O
H2 -0.8
-0.4
0.0
0.4
0
0.8
1.2
1.6
2.0
Eh (V
)
Fe2+
Fe3+
Fe2O3
Fe
Fe3O4
Fe(OH)2
FeO42-
O2
H2O
H2
2 4 6 8
pH 10 12 14 0
Eh (V
)
-1.2
-0.8
-0.4
-0.0
0.4
0.8
1.2
1.6
2.0 (a) (b) (c)
70!!
to inert products. Biological processes are sensitive to operational conditions (e.g. pH and
salinity) and require long startup times though, and chemical treatments often require an
excess of chemical reagents and can generate toxic byproducts.
3.1.3. Metallic nanostructure based catalytic water treatment as a sustainable
process
Commonly used water treatment technologies based on IX and reverse osmosis not only
generate concentrated waste streams but they also require large energy input.[26]
Catalysis offers the desirable advantages of less energy usage and no waste generation,
though it is not yet a common treatment approach. As one of the principles of green
chemistry in reducing and eliminating the formation of hazardous compounds,[27]
catalysis can also play an enabling role in their degradation and removal from the water
environment, once formed. Any chemicals needed for catalysis should also be sustainably
produced. For reduction reactions, for example, hydrogen gas can be obtained through
water electrolysis (with electricity generated from solar panels or wind turbines) and
formic acid can be obtained from biomass conversion.[28,29]
The most studied materials are metal-based catalysts due to their outstanding
catalytic properties, with regard to activity, selectivity, and/or stability.[30,31] Metallic
nanostructures are defined as metallic objects with at least one dimension in the range of
one to a few hundred of nanometers, for example, spherical nanoparticles, nanorods,
nanosheets, and nanocubes.[32,33] The occupancy of d-bands of metal atoms allows
reversible bonding to reactants via electron transfer, initiating surface reactions and
affording them their catalytic activity.[32] Metal catalysts generally contain nanoparticles

71!!
(zero-dimensional metallic nanostructures) attached to a porous support, and have been
used for both oxidative and reductive catalytic processes to convert contaminants in water
to environmentally inert compounds.[34] Oxyanions (e.g. nitrite,[35] nitrate,[36]
bromate, [37] and perchlorate3,5) and organohalides (e.g. trichloroethene[39] and
chloroform[40]) have been widely studied as target contaminants for catalytic reduction.
A 2012 review by Werth and coworkers assessed the state of knowledge
concerning palladium-based catalysts for water remediation[34] of several contaminants
(halogen and nitrogen containing organic compounds), and briefly addressed the catalytic
reduction of oxyanions. In this contribution, we focus on oxyanions (Table 3.1) and the
current state of understanding of their catalytic chemistry and prospects of catalytic water
treatment.
Table 3.1 Concentration level and health effect of common toxic oxyanions
Contaminant Regulated concentration level (ppm)
Potential health effects
Nitrate 10 (measured as nitrogen, US EPA)
Infant methemoglobinemia (blue-baby syndrome); probable carcinogen
Nitrite 1 (measured as nitrogen, US EPA)
Infant methemoglobinemia (blue-baby syndrome), probable carcinogen
Chromium(VI) 0.1 (measured as total chromium, US EPA)
Probable carcinogen
Bromate 0.01 (measured as bromate, US EPA)
Probable carcinogen
Chlorite 1 (measured as chlorite, US EPA)
Anemia; nervous system effects
[Chlorate] [Not regulated] Thyroid disfunction

72!!
Perchlorate 0.002 (measured as perchlorate, Massachusetts state level) 0.006 (measured as perchlorate, California state level)
Thyroid disfunction
Arsenic (as arsenate and arsenite)
0.01 (measured as total arsenic, US EPA)
Probable carcinogen
Selenium (as selenate and
selenite)
0.05 (measured as total selenium, US EPA)
Circulatory system disfunction
3.2. Catalytic Detoxification of Oxyanions Using Metallic
Nanostructures
Monometallic nanostructures can function as a materials platform for catalytic reduction
to 1) adsorb and dissociate reducing agents (e.g. H2 to surface adsorbed hydrogen atom),
2) adsorb oxyanion contaminants on the surface of catalyst, 3) abstract oxygen from
oxyanions by reacting with hydrogen adatoms, and 4) desorb the deoxygenated products
from the surface of catalyst.[34] Monometallic compositions are sufficient to convert
nitrite,[41] bromate,[42] and chromate[43] to inert species. However, some oxyanions
like nitrate[44] and perchlorate[45] require a second metal as a promoter. The promoter
metals are typically more oxophilic and can more efficiently abstract oxygen from
oxyanion contaminants.[46] The promoter metal would then be re-reduced by hydrogen
adatoms generated on the primary metal.[36]

73!!
3.2.1. Nitrogen oxyanions
3.2.1.1. Occurrence and health effects
Nitrogen oxyanions like nitrate (NO3-) and nitrite (NO2
-) are widespread contaminants of
surface water and groundwater.[47,48] The sources of these nitrogen oxyanions mainly
come from chemical fertilizers and industrial waste.[49] A number of medical issues are
associated with NO3-/NO2
- intake, such as damage to the nervous system, spleen, and
kidneys. Evidence is building that nitrogen oxyanions are carcinogenic and that they have
a strong correlation with high cancer levels.[50] Nitrogen oxyanions can cause the in-situ
formation of cancerous nitrosoamines in the body, and ingestion of nitrates during
pregnancy can also cause infant methemoglobinemia (i.e. “blue baby syndrome”).[51]
The US EPA has placed a MCL of 10 ppm and 1 ppm (measured as nitrogen) in drinking
water for NO3- and NO2
-, respectively.[19]
3.2.1.2. Current technology
Ion exchange (IX), reverse osmosis (RO), and electrodialysis reversal (EDR) are the only
methods accepted by the US EPA for NO3-/NO2
- removal from water.[52–54] IX is the
most widespread technology used in for removing NO3-/NO2
- from drinking water
sources, and has proven very effective in small to medium sized treatment plants, while
RO is the second most common NO3-/NO2
- treatment alternative.[55] The most
significant drawback of IX is the cost for disposal of the brine waste (which contains
concentrated NO3-/NO2
- after IX regeneration), especially for inland communities.[56]
For RO, key drawbacks include pretreatment requirements, power consumption, the
management of waste concentrate, and higher electricity costs relative to IX.[57] The use
74!!
of EDR in potable water treatment has increased in recent years, offering the potential for
lower residual volumes through improved water recovery, the ability to selectively
remove nitrate ions, and the minimization of chemical and energy requirements.[58]
3.2.1.3. Catalytic chemistry
Catalytic nitrate/nitrite reduction using metallic nanostructures is a promising method for
direct drinking water treatment and IX waste brine treatment. Scheme 3.1 shows the
Gibbs free energy (∆G) values for nitrate/nitrite reduction to dinitrogen and ammonia
using hydrogen at standard conditions are -229 kJ/mol and -530 kJ/mol, respectively.[59]
For nitrate reduction to dinitrogen and ammonia, the free energy values are -835 and -733
kJ/mol, respectively.[59] Under laboratory conditions (1 mM nitrate ~ 14 ppm-N, pH 7,
25 °C, 1 atm), the calculated corresponding free energy values decrease to -778 and -653
kJ/mol. Since ∆G is negative (exergonic reaction), the reduction of nitrate (and nitrite) to
the two end-products is thermodynamically favorable at room temperature. These
reactions do not proceed without catalysts that lower the activation barriers for the
respective reactions.
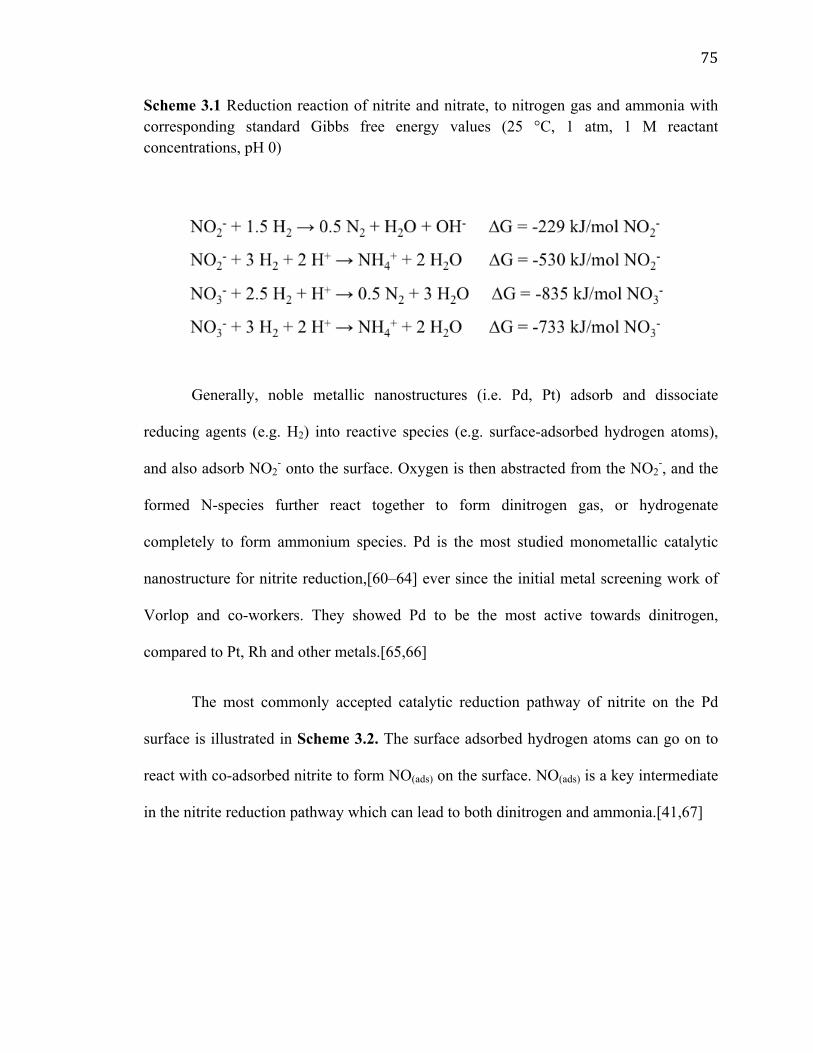
75!!
Scheme 3.1 Reduction reaction of nitrite and nitrate, to nitrogen gas and ammonia with corresponding standard Gibbs free energy values (25 °C, 1 atm, 1 M reactant concentrations, pH 0)
!
Generally, noble metallic nanostructures (i.e. Pd, Pt) adsorb and dissociate
reducing agents (e.g. H2) into reactive species (e.g. surface-adsorbed hydrogen atoms),
and also adsorb NO2- onto the surface. Oxygen is then abstracted from the NO2
-, and the
formed N-species further react together to form dinitrogen gas, or hydrogenate
completely to form ammonium species. Pd is the most studied monometallic catalytic
nanostructure for nitrite reduction,[60–64] ever since the initial metal screening work of
Vorlop and co-workers. They showed Pd to be the most active towards dinitrogen,
compared to Pt, Rh and other metals.[65,66]
The most commonly accepted catalytic reduction pathway of nitrite on the Pd
surface is illustrated in Scheme 3.2. The surface adsorbed hydrogen atoms can go on to
react with co-adsorbed nitrite to form NO(ads) on the surface. NO(ads) is a key intermediate
in the nitrite reduction pathway which can lead to both dinitrogen and ammonia.[41,67]

76!!
Scheme 3.2 Nitrite catalytic reduction pathway on Pd surface with hydrogen gas as a reducing agent (modified from Martínez et al.[68]). The DFT calculated pathway is kinetically unlikely to occur.
In the formation of dinitrogen, NO(ads) can dissociate to allow for dinitrogen
formation through the direct coupling of N(ads) species.[41] Dinitrogen can also be formed
through a mechanism where NO(ads) is converted through the intermediate N2O. In the
formation of ammonia, NO(ads) can lead to NH4+ through the stepwise hydrogenation of a
presumed N(ads) species. Werth and coworkers showed, using isotopically labeled N
species that N2O forms N2 exclusively, while NO forms both N2 and ammonium.[67]
Direct NO(ads) hydrogenation has been proposed for NH4+ formation via HNO(ads),
H2NO(ads), and H2NOH(ads) intermediates,[68] though we are doubtful of this pathway.
While NO(ads) hydrogenation has been demonstrated experimentally over Pt, this pathway
was ruled out experimentally for Pd, and was determined computationally to be more
unlikely to occur compared to N(ads) formation and hydrogenation.[41,60]
Improving the activity of Pd-based catalysts has been a main focus of many
studies (Table 3.2). Various catalyst structures, support and compositions with addition
of secondary metal have been studied in catalytic nitrite reduction.[61,69,70] Seraj et al.
synthesized Pd-Au alloy catalysts and found that the addition of Au improves the nitrite
NO2- (aq) NO2
- (ads) NO (ads)
N2O (ads) N2 (g)
N2 (g)
NH (ads) NH2 (ads)
HNO (ads) H2NO (ads) H2NO (ads)
NH4+ (ads)
NH4+ (aq)
Pd
Pd Pd
Pd
Pd
Pd Pd
Pd Pd
Pd
Pd
DFT calculated pathway

77!!
reduction activity, and the alloy structure showed reduced loss of catalytic activity in
sulfide fouling tests.[71] Their DFT (density functional theory) calculations indicated that
Au enhanced the activity of Pd through electronic effects, and reduced sulfur poisoning
by weakening the sulfide bonding at the Pd-Au surface. Wong and coworkers synthesized
Au nanoparticles (NPs) covered with submonolayer amounts of Pd, and observed
improved nitrite reduction activity by an order of magnitude.[35] The enhancement effect
of Au on Pd catalysis of nitrite reduction was attributed to the creation of zerovalent two-
dimensional Pd ensembles and high Pd dispersion.
Table 3.2 Performance of metallic nanostructures in the catalytic reduction of nitrite
* Re-calculated kcat normalized by total metal amount based on the published data.
Researchers have also focused on enhancing the nitrite reduction selectivity to
nontoxic N2. Higher N2 selectivity was found to relate to large catalyst particle sizes,[64]
specific shapes (e.g. Pd rods and cubes),[31] type of stabilizing surfactants,[73] and
Catalyst kcat*
(L/ g metal/min) Hydrogen donor Initial pH Reaction temperature Ref.
5wt% Pd/Al2O3 5wt% Pt/Al2O3
- - H2 5.2 Room temperature [60]
Pd80Cu20/PVP 1.67 H2 5.5-7.5 Room temperature [46] 5wt%Pd/Al2O3
5%Pd 0.5%In/Al2O3 4
6.9 H2 5 Room temperature [70]
5.42%Pd 0.86%In/Al2O3 17.43 H2 7 Room temperature [67]
2.8nmPd/PVP 3.2nmPd/PVA
1.53 1.47 H2 8.5 Room temperature [62]
1wt%Pd/Al2O3 Pd NPs
Pd-on-Au NPs
76 40
576 H2 5-7 Room temperature [35]
1wt% Pt/Al2O3 1wt% Pt Cu/Al2O3
0.6 0.7 H2 5.5 10 °C [72]
0.25wt%Pd/ACC 7.06 H2 4.5 25 °C [69]
5wt%Pd/CNF 2.44 H2 5 21 °C [64]
PdAu alloy 5 H2 6.4 22 °C [71]

78!!
especially reaction conditions. An increase in pH generally decreased both the activity of
nitrogen oxyanion reduction and the selectivity to N2, though the mechanistic reason is
still not completely understood.[44] Lefferts and co-workers reported surface coverage
changes of the reaction intermediates at different pH values using attenuated total
reflectance infrared spectroscopy, which could be the source of reactivity and selectivity
differences.[60] Reactant concentration has little effect on the normalized activity (in unit
of liter per gram-catalyst per min) if the reaction is in the kinetically-controlled region,
while it has strong effect on the selectivity of nitrogen oxyanion reduction. Shin et al.
showed that an increased initial nitrite concentration or lower H2 flow rate both enhanced
N2 selectivity, and concluded that surface adsorbed nitrogen reacts with NO2- in solution
to form dinitrogen.[41]
While effective for nitrite, monometallic Pd (or Pt) nanostructures show little
activity for nitrate reduction,[74] and require a secondary promoter metal, such as copper
(Cu), tin (Sn), or indium (In) (Table 3.3).[75–78] The secondary metal is thought to be
oxidized after abstracting the oxygen from nitrate, and converting it to nitrite. The
oxidized secondary metal is then re-reduced by hydrogen atoms adsorbed on the Pd or Pt
surface. The nitrate-to-nitrite catalytic cycle is shown in the Scheme 3.3. The nitrite
presumably reduces to dinitrogen or ammonia via Scheme 3.2.
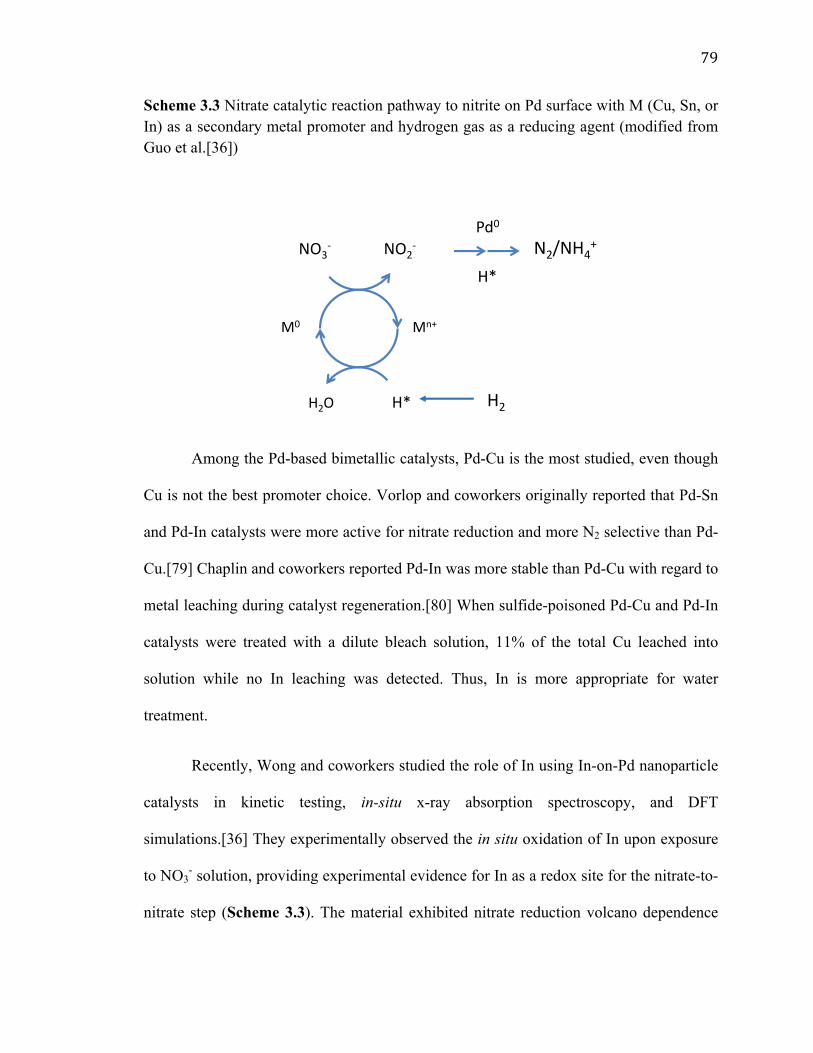
79!!
Scheme 3.3 Nitrate catalytic reaction pathway to nitrite on Pd surface with M (Cu, Sn, or In) as a secondary metal promoter and hydrogen gas as a reducing agent (modified from Guo et al.[36])
Among the Pd-based bimetallic catalysts, Pd-Cu is the most studied, even though
Cu is not the best promoter choice. Vorlop and coworkers originally reported that Pd-Sn
and Pd-In catalysts were more active for nitrate reduction and more N2 selective than Pd-
Cu.[79] Chaplin and coworkers reported Pd-In was more stable than Pd-Cu with regard to
metal leaching during catalyst regeneration.[80] When sulfide-poisoned Pd-Cu and Pd-In
catalysts were treated with a dilute bleach solution, 11% of the total Cu leached into
solution while no In leaching was detected. Thus, In is more appropriate for water
treatment.
Recently, Wong and coworkers studied the role of In using In-on-Pd nanoparticle
catalysts in kinetic testing, in-situ x-ray absorption spectroscopy, and DFT
simulations.[36] They experimentally observed the in situ oxidation of In upon exposure
to NO3- solution, providing experimental evidence for In as a redox site for the nitrate-to-
nitrate step (Scheme 3.3). The material exhibited nitrate reduction volcano dependence
NO3$ NO2
$
In3+In0
H+ H*
H2 2H*Pd0
Pd0
H*
N2
a
b
c
d
H2H2O$ H2$
N2/NH4+$
M0$ Mn+$
NO3-$ NO2
-$
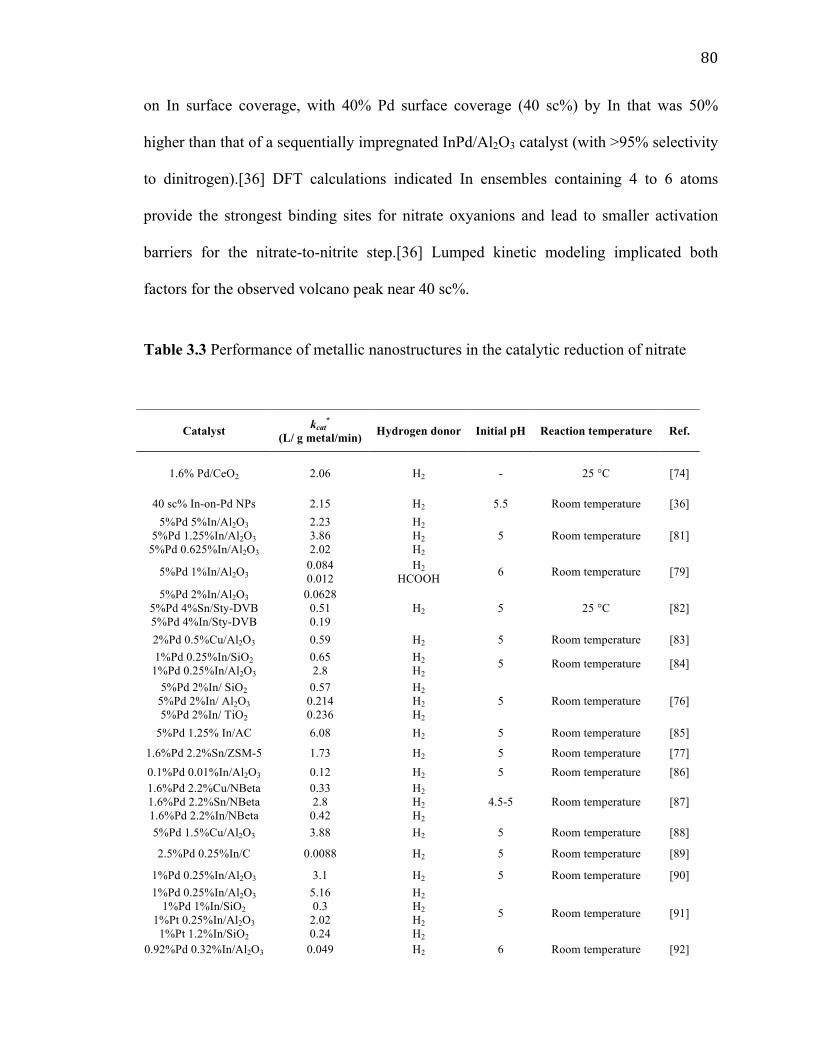
80!!
on In surface coverage, with 40% Pd surface coverage (40 sc%) by In that was 50%
higher than that of a sequentially impregnated InPd/Al2O3 catalyst (with >95% selectivity
to dinitrogen).[36] DFT calculations indicated In ensembles containing 4 to 6 atoms
provide the strongest binding sites for nitrate oxyanions and lead to smaller activation
barriers for the nitrate-to-nitrite step.[36] Lumped kinetic modeling implicated both
factors for the observed volcano peak near 40 sc%.
Table 3.3 Performance of metallic nanostructures in the catalytic reduction of nitrate
Catalyst kcat*
(L/ g metal/min) Hydrogen donor Initial pH Reaction temperature Ref.
1.6% Pd/CeO2 2.06 H2 - 25 °C [74]
40 sc% In-on-Pd NPs 2.15 H2 5.5 Room temperature [36] 5%Pd 5%In/Al2O3
5%Pd 1.25%In/Al2O3 5%Pd 0.625%In/Al2O3
2.23
3.86
2.02
H2 H2 H2
5 Room temperature [81]
5%Pd 1%In/Al2O3 0.084
0.012 H2
HCOOH 6 Room temperature [79]
5%Pd 2%In/Al2O3 5%Pd 4%Sn/Sty-DVB 5%Pd 4%In/Sty-DVB
0.0628 0.51 0.19
H2 5 25 °C [82]
2%Pd 0.5%Cu/Al2O3 0.59 H2 5 Room temperature [83]
1%Pd 0.25%In/SiO2 1%Pd 0.25%In/Al2O3
0.65
2.8 H2 H2
5 Room temperature [84]
5%Pd 2%In/ SiO2 5%Pd 2%In/ Al2O3 5%Pd 2%In/ TiO2
0.57
0.214
0.236
H2 H2 H2
5 Room temperature [76]
5%Pd 1.25% In/AC 6.08 H2 5 Room temperature [85]
1.6%Pd 2.2%Sn/ZSM-5 1.73 H2 5 Room temperature [77] 0.1%Pd 0.01%In/Al2O3 0.12 H2 5 Room temperature [86] 1.6%Pd 2.2%Cu/NBeta 1.6%Pd 2.2%Sn/NBeta 1.6%Pd 2.2%In/NBeta
0.33 2.8
0.42
H2 H2 H2
4.5-5 Room temperature [87]
5%Pd 1.5%Cu/Al2O3 3.88 H2 5 Room temperature [88]
2.5%Pd 0.25%In/C 0.0088 H2 5 Room temperature [89]
1%Pd 0.25%In/Al2O3 3.1 H2 5 Room temperature [90] 1%Pd 0.25%In/Al2O3
1%Pd 1%In/SiO2 1%Pt 0.25%In/Al2O3
1%Pt 1.2%In/SiO2
5.16 0.3
2.02 0.24
H2 H2 H2 H2
5 Room temperature [91]
0.92%Pd 0.32%In/Al2O3 0.049 H2 6 Room temperature [92]

81!!
*Re-calculated kcat normalized by total metal amount based on the published data.
3.2.1.4. Assessment of technology readiness
Attempts have been made to scale-up the catalytic reduction process for nitrate
treatment.[69,100,102,103] For example, a company has developed a catalytic unit based
on Pd-Cu supported on activated carbon cloth, and is conducting pilot tests with the
Southern Nevada Water Authority to treat 90-ppm nitrate-containing water at a
throughput of 2-8 m3/h.[102]
Werth and co-workers have worked on developing Pd-In catalyst-based trickle-
bed flow reactors (TBR) for nitrate treatment of drinking water and IX waste
brine.[86,89,104] Gas and liquid flow rates, catalyst metal loading, and catalyst pellet
size were varied to optimize TBR performance. Catalytic activity in the flow reactor was
~18% that of the same catalyst tested in batch mode, which was attributed to H2 mass
transfer limitations. Catalytic activity was lower by ~50% in the IX waste brine treatment
0.75%Pt 0.25%Cu/Al2O3 1.1 H2 6.5 10 °C [93]
4.7%Pd 1.5%Sn/Al2O3 0.3 HCOOH 5 Room temperature [94] 1.6%Pt 0.8%Cu/Al2O3 1.6%Pd 0.5%Cu/Al2O3 1.6%Pt 0.8%Ag/Al2O3 1.6%Pd 0.8%Ag/Al2O3
0.5 0.39 0.39 0.44
H2 H2 H2 H2
- 10 °C [95]
1.5%Pd 0.5%Cu/Al2O3 1.5%Pd 0.5%Co/Al2O3 1.5%Pd 0.9%In/Al2O3
0.28 0.048 0.12
H2 H2 H2
5 - [96]
2%Pd 0.6%Cu/ACC 0.08 H2 5.5 25 °C [97]
5%Pd 0.5%Sn/PPy 1.7 H2 3.5 25 °C [98]
Pd60Cu40/PVP 0.08 H2 5.5-7.5 Room temperature [46]
0.75%Pt 0.25%Cu/Al2O3 1.1 H2 5.5 10 °C [72]
5%Pd 0.86Cu/ASA 1.09 H2 5.4 25 °C [99]
0.13%Pd 0.03%Cu/GFC 0.96 H2 5.1 25 °C [100]
5%Pd 1.5%Cu/SnO2 4.9%Pd 1.5%Cu/ZrO2
0.089 3.92 H2 4 25 °C [101]

82!!
compared to drinking water treatment, which was caused by competitive adsorption
between the chloride and sulfate anions with the nitrate reactant.
3.2.2. Chromium Oxyanions
3.2.2.1. Occurrence and health effects
In the US, chromium is the second most common inorganic contaminant, after
lead.[105,106] The most common forms of chromium are trivalent chromium (Cr(III))
and hexavalent chromium ("chromium-6", Cr(VI)). Chromium oxyanions (e.g. chromate
CrO42-) are frequently used in metallurgy, pigment manufacturing, and wood treatment
processes.[107] Inappropriate disposal of industrial wastewaster results in chromium
contamination. Chromium oxyanions have cytotoxic and carcinogenic properties.[108]
The US EPA set a MCL of total chromium (Cr(III) + Cr(VI)) to 0.1 ppm for drinking
water.[19] California has a more restrictive MCL of 0.05 ppm for total
chromium.[109,110] The World Health Organization (WHO) provides a drinking water
guideline value of 0.05 ppm for Cr(VI).[111]
3.2.2.2. Current technologies
Numerous removal methods, including chemical reduction,[112] IX,[113]
adsorption,[114] biodegradation,[115] and membrane filtration[116] have been studied
for Cr(VI) (in the form of CrO42-). Barrera-Díaz and coworkers reviewed chemical,
electrochemical and biological methods for aqueous chromate reduction.[117] Some of
the most common remediation strategies use redox reactions to convert chromate to a
chromium oxide solid by adding Fe(II) as the electron donor (6 Fe2+(aq) + 2 CrO4
2–(aq) + 13
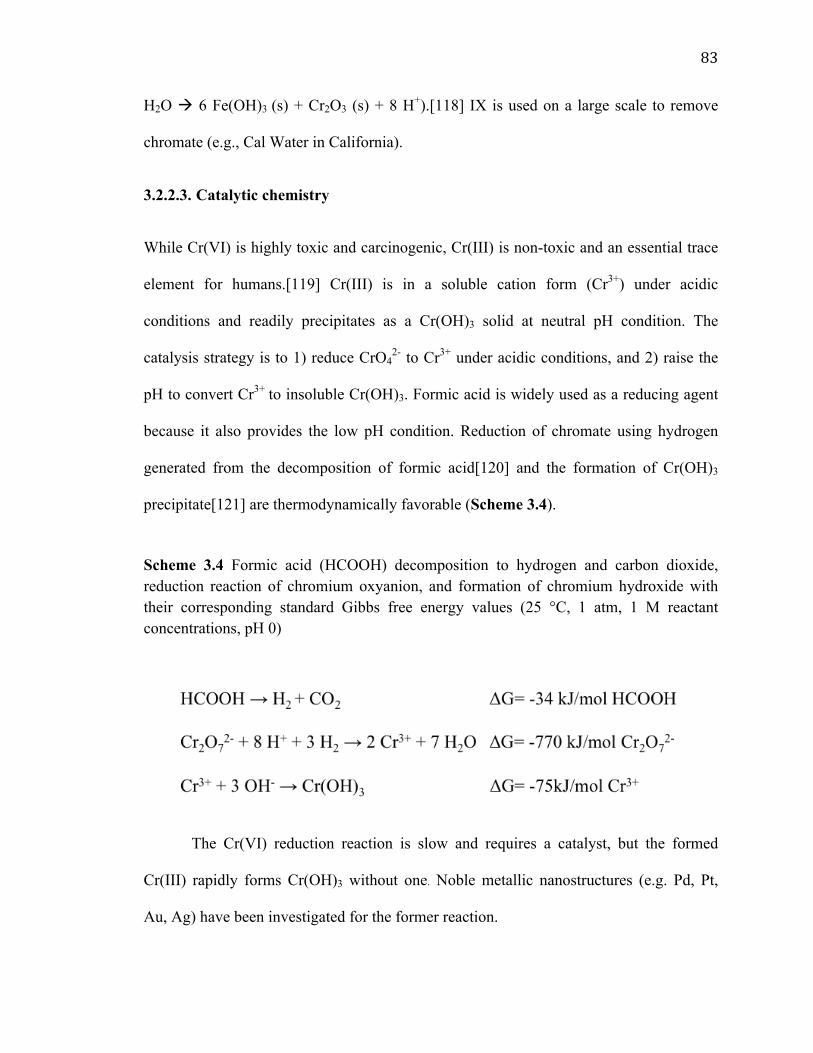
83!!
H2O ! 6 Fe(OH)3 (s) + Cr2O3 (s) + 8 H+).[118] IX is used on a large scale to remove
chromate (e.g., Cal Water in California).
3.2.2.3. Catalytic chemistry
While Cr(VI) is highly toxic and carcinogenic, Cr(III) is non-toxic and an essential trace
element for humans.[119] Cr(III) is in a soluble cation form (Cr3+) under acidic
conditions and readily precipitates as a Cr(OH)3 solid at neutral pH condition. The
catalysis strategy is to 1) reduce CrO42- to Cr3+ under acidic conditions, and 2) raise the
pH to convert Cr3+ to insoluble Cr(OH)3. Formic acid is widely used as a reducing agent
because it also provides the low pH condition. Reduction of chromate using hydrogen
generated from the decomposition of formic acid[120] and the formation of Cr(OH)3
precipitate[121] are thermodynamically favorable (Scheme 3.4).
Scheme 3.4 Formic acid (HCOOH) decomposition to hydrogen and carbon dioxide, reduction reaction of chromium oxyanion, and formation of chromium hydroxide with their corresponding standard Gibbs free energy values (25 °C, 1 atm, 1 M reactant concentrations, pH 0)
The Cr(VI) reduction reaction is slow and requires a catalyst, but the formed
Cr(III) rapidly forms Cr(OH)3 without one. Noble metallic nanostructures (e.g. Pd, Pt,
Au, Ag) have been investigated for the former reaction.
84!!Sadik's group first reported the reduction of chromate to Cr3+ over colloidal Pd
NP catalysts using formic acid.[43] The reaction likely follows a Langmuir-Hinshelwood
surface reaction mechanism, involving H adatom formed from the dehydrogenation of
formic acid on the metal surface.[122] Surface adsorbed hydrogen then reduce the co-
adsorbed chromate/dichromate to Cr3+ via a hydrogen transfer pathway.[122] Although
formic acid has been the most commonly studied, other reducing agents, such as
hydrogen gas,[43,123] sulfur,[124] and poly(amic acids)[125] have also been studied.
Other noble metallic nanostructures, such as Pt,[126–128] Ag102,103 and
Au[126,129], as well as their bimetallic forms, such as PdAu and AuAg[129,131] have
also been investigated for chromate reduction (Table 3.4). Yadav et al. compared Pt, Pd,
and Au nanoparticles immobilized in a metal-organic framework, and found that Pt was
the most active while Au was inactive.[126] The reason for Pt as the most active catalyst
is not clear. Bimetallic NPs (e.g. AuAg and PdAu) were found to have enhanced catalytic
activities compared with their monometallic forms in the chromate reduction
reactions.[129] The relative importance of electronic, geometric and bifunctional effects
on Cr(VI) reduction using bimetallic nanostructures is not known at this point.
To understand the structure-property relationships of monometallic catalysts, Pd-
based materials with different shapes were synthesized and studied for catalytic chromate
reduction (Table 3.4). Zhang et al. found Pd icosahedron-shaped NPs to be the most
active among other shaped studed (spheres, rods, spindles, cubes and wires).[132] They
attributed its reduction ability to the icosahedron having a greater fraction of surface Pd
atoms exposed on {111} facets. We recommend normalizing measured reaction rate
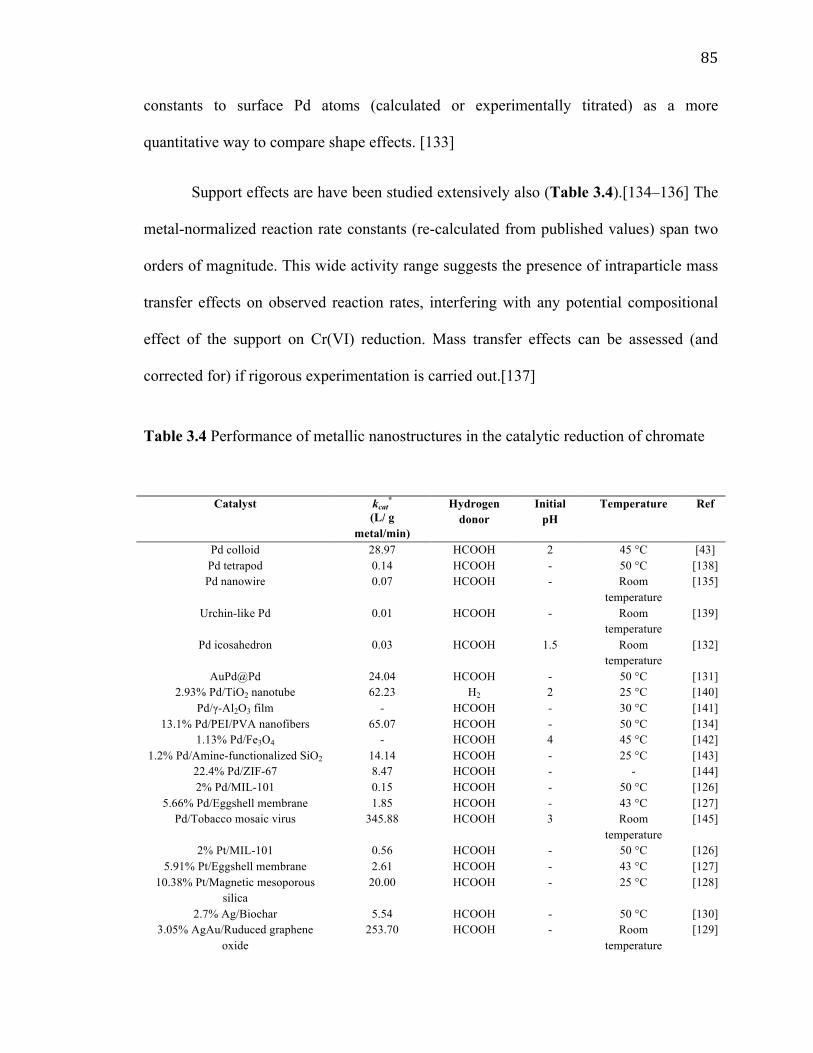
85!!
constants to surface Pd atoms (calculated or experimentally titrated) as a more
quantitative way to compare shape effects. [133]
Support effects are have been studied extensively also (Table 3.4).[134–136] The
metal-normalized reaction rate constants (re-calculated from published values) span two
orders of magnitude. This wide activity range suggests the presence of intraparticle mass
transfer effects on observed reaction rates, interfering with any potential compositional
effect of the support on Cr(VI) reduction. Mass transfer effects can be assessed (and
corrected for) if rigorous experimentation is carried out.[137]
Table 3.4 Performance of metallic nanostructures in the catalytic reduction of chromate
Catalyst kcat*
(L/ g metal/min)
Hydrogen donor
Initial pH
Temperature Ref
Pd colloid 28.97 HCOOH 2 45 °C [43] Pd tetrapod 0.14 HCOOH - 50 °C [138] Pd nanowire 0.07 HCOOH - Room
temperature [135]
Urchin-like Pd 0.01 HCOOH - Room temperature
[139]
Pd icosahedron 0.03 HCOOH 1.5 Room temperature
[132]
AuPd@Pd 24.04 HCOOH - 50 °C [131] 2.93% Pd/TiO2 nanotube 62.23 H2 2 25 °C [140]
Pd/γ-Al2O3 film - HCOOH - 30 °C [141] 13.1% Pd/PEI/PVA nanofibers 65.07 HCOOH - 50 °C [134]
1.13% Pd/Fe3O4 - HCOOH 4 45 °C [142] 1.2% Pd/Amine-functionalized SiO2 14.14 HCOOH - 25 °C [143]
22.4% Pd/ZIF-67 8.47 HCOOH - - [144] 2% Pd/MIL-101 0.15 HCOOH - 50 °C [126]
5.66% Pd/Eggshell membrane 1.85 HCOOH - 43 °C [127] Pd/Tobacco mosaic virus 345.88 HCOOH 3 Room
temperature [145]
2% Pt/MIL-101 0.56 HCOOH - 50 °C [126] 5.91% Pt/Eggshell membrane 2.61 HCOOH - 43 °C [127]
10.38% Pt/Magnetic mesoporous silica
20.00 HCOOH - 25 °C [128]
2.7% Ag/Biochar 5.54 HCOOH - 50 °C [130] 3.05% AgAu/Ruduced graphene
oxide 253.70 HCOOH - Room
temperature [129]
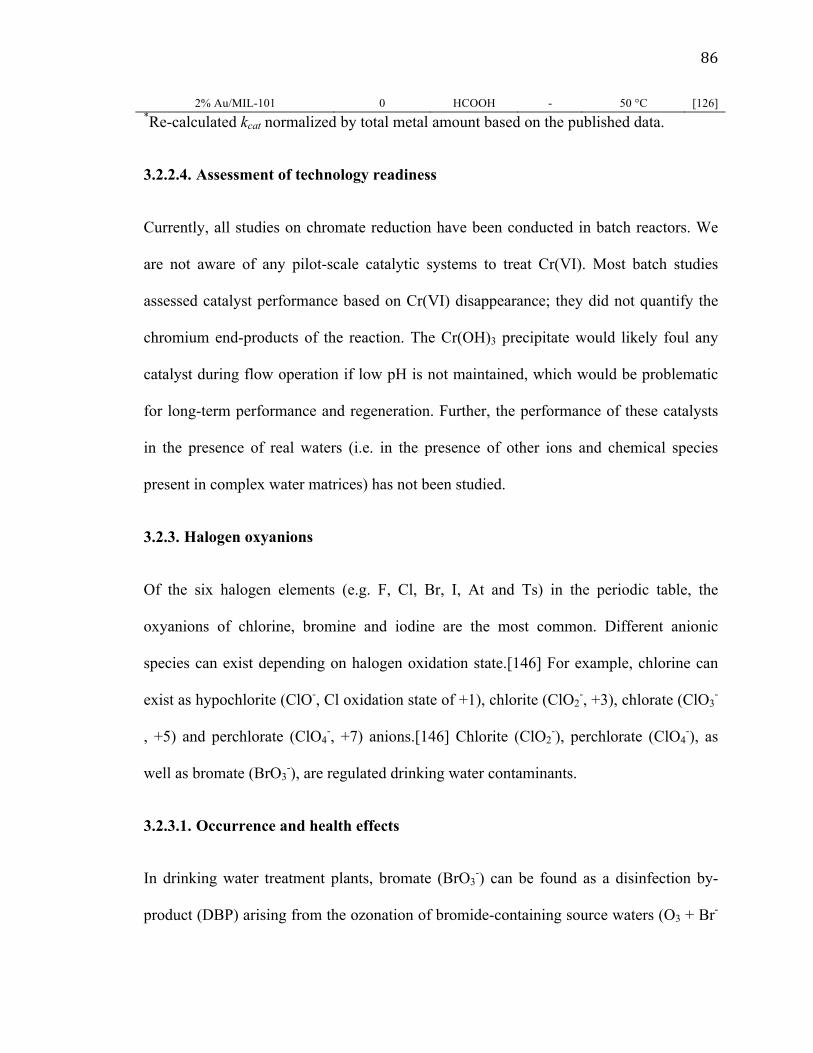
86!!2% Au/MIL-101 0 HCOOH - 50 °C [126]
*Re-calculated kcat normalized by total metal amount based on the published data.
3.2.2.4. Assessment of technology readiness
Currently, all studies on chromate reduction have been conducted in batch reactors. We
are not aware of any pilot-scale catalytic systems to treat Cr(VI). Most batch studies
assessed catalyst performance based on Cr(VI) disappearance; they did not quantify the
chromium end-products of the reaction. The Cr(OH)3 precipitate would likely foul any
catalyst during flow operation if low pH is not maintained, which would be problematic
for long-term performance and regeneration. Further, the performance of these catalysts
in the presence of real waters (i.e. in the presence of other ions and chemical species
present in complex water matrices) has not been studied.
3.2.3. Halogen oxyanions
Of the six halogen elements (e.g. F, Cl, Br, I, At and Ts) in the periodic table, the
oxyanions of chlorine, bromine and iodine are the most common. Different anionic
species can exist depending on halogen oxidation state.[146] For example, chlorine can
exist as hypochlorite (ClO-, Cl oxidation state of +1), chlorite (ClO2-, +3), chlorate (ClO3
-
, +5) and perchlorate (ClO4-, +7) anions.[146] Chlorite (ClO2
-), perchlorate (ClO4-), as
well as bromate (BrO3-), are regulated drinking water contaminants.
3.2.3.1. Occurrence and health effects
In drinking water treatment plants, bromate (BrO3-) can be found as a disinfection by-
product (DBP) arising from the ozonation of bromide-containing source waters (O3 + Br-

87!!
� O2 + BrO-; 2 O3 + BrO- � 2 O2 + BrO3-).[147] A suspected carcinogen, the US EPA
has set a MCL of 0.01 ppm for bromate in drinking water.[19]
Chlorite (ClO2-) and chlorate (ClO3
-) are also DBPs in drinking water caused by
the decomposition of chlorine dioxide, another strong oxidizing agent used in water
treatment.[148] Chlorite can cause anemia and affect the human nervous system; it has a
MCL of 1 ppm.[19] Chlorate was evaluated under the US EPA 2012-2016 Unregulated
Contaminant Monitoring Rule (UCMR-3) and is on the 2016 Contaminant Candidate List
(CCL-4), indicating it can potentially be regulated in the future.[149]
Perchlorate (ClO4-) occurs naturally in arid regions and in potash ore.[150] It also
used in the manufacture of rocket propellant, explosives, and fireworks, and
contamination of water resources arises from improper disposal of these
materials.[20,151] Perchlorate can cause dysfunction of the human thyroid, leading to
metabolic problems, such as heart rate, blood pressure and body temperature
regulation.[151] It was evaluated under the US EPA 2001-2005 Unregulated
Contaminant Monitoring Rule (UCMR-1) and is on the 2009 Contaminant Candidate List
(CCL-3), suggesting a federally mandated MCL is possible. Several states have set
drinking water standards for perchlorate, e.g. Massachusetts has an MCL of 0.002 ppm
and California an MCL of 0.006 ppm.[152]
3.2.3.2. Current technologies
Numerous treatment methods have been explored to remove bromate in water, including
IX, activated carbon adsorption, membrane filtration, biodegradation, chemical reduction,
and photocatalysis.[153–157] Although many of these technologies are still in the

88!!
laboratory evaluation and development stages, some have been tested in the pilot
scale.[158] Perchlorate can be removed from contaminated water through similar
means.[152] A full-scale IX treatment system was successfully operated in California to
lower perchlorate concentration from 10-200 ppb to <4 ppb.[159] The disposal of the IX
waste brine is a costly concern. Chlorite removal is comparatively less studied, and done
only at the laboratory scale.[160][161]
3.2.3.3. Catalytic chemistry for bromine oxyanion
Thermodynamically, the reduction of bromate (BrO3-), chlorite (ClO2
-), chlorate (ClO3-),
and perchlorate (ClO4-) are energetically favorable (Scheme 3.5), but the kinetics for
these transformations are slow.
Scheme 3.5 Reduction reactions of bromate, chlorite, chlorate and perchlorate with the corresponding standard Gibbs free energy values (25 °C, 1 atm, 1 M reactant concentrations, pH 0)
Chen et al. reported that bromate (BrO3-) could be directly reduced over Pd and Pt
catalysts using hydrogen.[37] The role of metallic nanostructures (e.g. Pd, Pt) is to adsorb
and dissociate hydrogen which subsequently reacts with adsorbed BrO3-.[42] This
reaction leads to the formation of the reduced product Br- and water. The oxidized metal

89!!
is then reduced by hydrogen, thus closing the catalytic cycle.[42] Subsequent studies
focused on improving the catalytic activity of monometallic nanoparticles, in particular
Pd, as well as catalyst stability by using different supports including metal
oxides,[37,162–164] silica,[37,165] carbon based materials,[37,42,163,166–171] and
zeolites (Table 3.5).[172,173]
Table 3.5 Performance of metallic nanostructures in the catalytic reduction of bromate
Catalyst
kcat*
(L/ g metal/min) Hydrogen
donor Initial
pH Temperature
(°C) Ref.
1.93% Pd/Al2O3 0.69 H2 5.6 Room temperature
[37]
2% Pd/SiO2 0.004 H2 5.6 Room temperature
[37]
2% Pd/Activated carbon 0.04 H2 5.6 Room temperature
[37]
2% Pt/Al2O3 0.27 H2 5.6 Room temperature
[37]
0.3% Pd/5% CNF/SMF 0.15 H2 6.5 25 °C [166] 2.2% Pd/Mesoporous carbon nitride 4.07 H2 5.6 25 °C [168]
0.1% Pd/Fe3O4 0.69 H2 6 27 °C [174] 2% Pd/Magnetic MCM-41 0.55 H2 5.6 25 °C [175] 1.3% Pd/Core-shell silica 1.1 H2 7 20 °C [165]
0.86% Pd/Ce1-xZrxO2 4.16 H2 5.6 25 °C [162] 1.5% Pd/ZSM-5 0.10 H2 - 25 °C [172]
1.4% Pd 1% Cu/ZSM-5 0.92 H2 - 25 °C [172] 0.92% Pd/Faujasite zeolite Y 0.07 H2 - Room
temperature [173]
1.6% Pd 0.84% Cu/Faujasite zeolite Y 0.92 H2 - Room temperature
[173]
*Re-calculated kcat normalized by total metal amount based on the published data.
The support composition significantly increases reduction activity, which appears
to relate to the isoelectric point (IEP) of support.[37] It was explained that Pd/Al2O3 (IEP
~8.0) is more active than the Pd/SiO2 (IEP ~2.0) and Pd/C (IEP <2.0), because the Al2O3
is positively charged at the reaction pH of 5.6, thereby electrostatically increasing the
local oxyanion concentration near the Pd domains.[37] Incorporating a second metal,

90!!
such as Cu, appears to increase bromate reduction activity.[171,173] The catalytic
behavior of bimetallic nanostructures for this reaction may be similar to that for other
oxyanions, but this has not been established yet.
3.2.3.4. Catalytic chemistry for chlorine oxyanions
Few have studied chlorite and chlorate reduction. As early as 1995, patent literature
disclosed the use of monometallic Pd and other precious metals for the catalytic reduction
of chlorite/chlorate, as well as bromate anions.[176] Perchlorate catalytic reduction is
difficult to achieve using monometallic Pd, requiring a second metal (in this case,
rhenium, Table 3.6).[45,177–180] Pd adsorbs and dissociates hydrogen to reactive
species (e.g. surface-adsorbed hydrogen atoms) which go on to reduce the oxidized
Re.[178] The role of Re, an oxophilic metal, is to adsorb chlorine oxyanions and abstract
an oxygen atom from perchlorate to form chlorate.[181] Chlorate can undergo the same
process to be reduced to lower-valent chlorine oxyanion. The reaction pathway follows
ClO4- ! ClO3
- ! ClO2- ! Cl-.[45] Using ex-situ X-ray photoelectron spectroscopy
(XPS), Choe et al. concluded that Re likely cycled between a higher oxidation state (+7)
and lower oxidation states (+5/+4 and +1) during perchlorate reduction.[178]
Table 3.6 Performance of metallic nanostructures in the catalytic reduction of perchlorate
Catalyst kcat*
(L/ g metal/min) Hydrogen donor Initial pH Temperature Ref.
5%Re 5%Pd/C 1%Re 5%Pd/C
0.03 0.04 H2 2.9 25 °C [180]
13%Re 4.71%Pd/C 9.4%Re 5%Pd/C 2.9%Re 5%Pd/C
0.04 0.034 0.007
H2 3 23 °C [45]
5%Pd 5.5%Re 0.24 0.098 H2
2.7 3.8 23 °C [179]
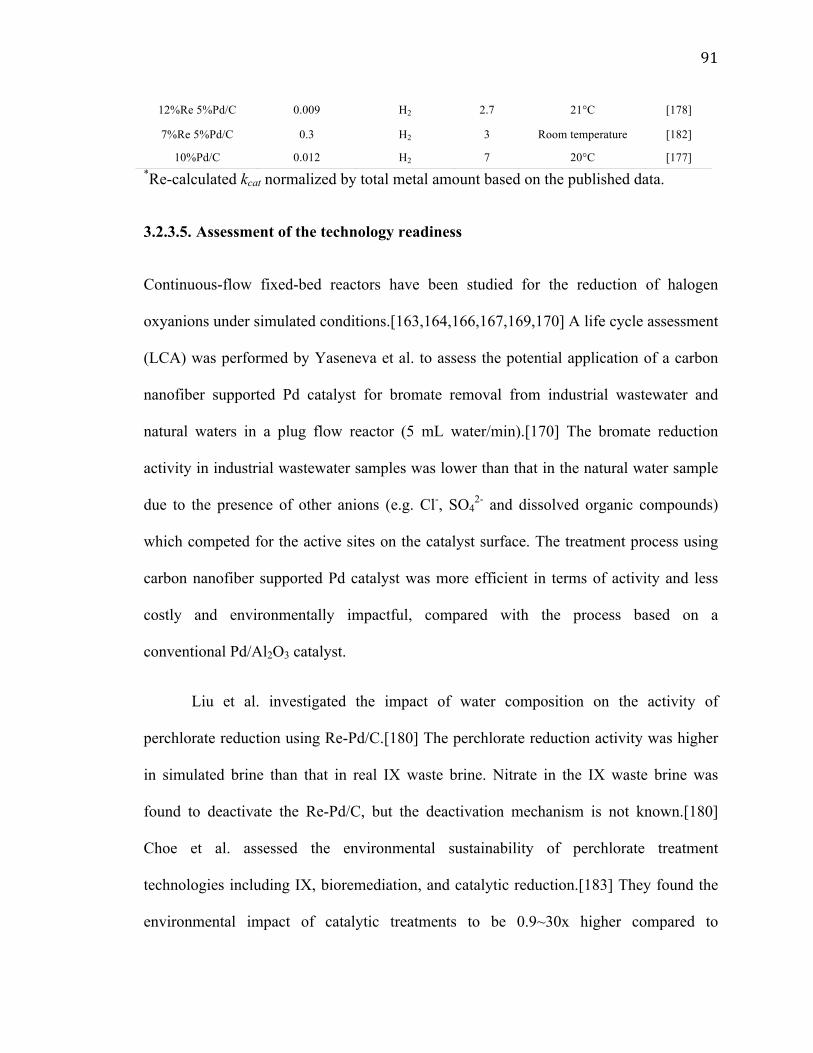
91!!
*Re-calculated kcat normalized by total metal amount based on the published data.
3.2.3.5. Assessment of the technology readiness
Continuous-flow fixed-bed reactors have been studied for the reduction of halogen
oxyanions under simulated conditions.[163,164,166,167,169,170] A life cycle assessment
(LCA) was performed by Yaseneva et al. to assess the potential application of a carbon
nanofiber supported Pd catalyst for bromate removal from industrial wastewater and
natural waters in a plug flow reactor (5 mL water/min).[170] The bromate reduction
activity in industrial wastewater samples was lower than that in the natural water sample
due to the presence of other anions (e.g. Cl-, SO42- and dissolved organic compounds)
which competed for the active sites on the catalyst surface. The treatment process using
carbon nanofiber supported Pd catalyst was more efficient in terms of activity and less
costly and environmentally impactful, compared with the process based on a
conventional Pd/Al2O3 catalyst.
Liu et al. investigated the impact of water composition on the activity of
perchlorate reduction using Re-Pd/C.[180] The perchlorate reduction activity was higher
in simulated brine than that in real IX waste brine. Nitrate in the IX waste brine was
found to deactivate the Re-Pd/C, but the deactivation mechanism is not known.[180]
Choe et al. assessed the environmental sustainability of perchlorate treatment
technologies including IX, bioremediation, and catalytic reduction.[183] They found the
environmental impact of catalytic treatments to be 0.9~30x higher compared to
12%Re 5%Pd/C 0.009 H2 2.7 21°C [178]
7%Re 5%Pd/C 0.3 H2 3 Room temperature [182]
10%Pd/C 0.012 H2 7 20°C [177]

92!!
conventional IX, which could be mitigated with increased catalytic activity and increased
H2 mass transfer.[183] To date, there is no published work on catalytic treatment of
chlorite/chlorate oxyanions at the testbed level.
3.3. Perspective and Research Opportunities
3.3.1. Comparison of reduction catalytic activity for the different oxyanions
Based on the re-calculated values compiled in Tables 3.2-3.6, we found that the reaction
rate constants for NO2-, NO3
-, CrO42-, BrO3
-, and ClO4- reduction using monometallic Pd
catalyst were roughly 1, 0, 10, 0.1 and 0.01 liter per gram metal per min, respectively. In
terms of their reactivity on Pd, the oxyanions were ordered in the following way: CrO42-
> NO2- > BrO3
- >> ClO4- > NO3
-. These oxyanions are broadly less reactive compared to
halogenated organic compounds like trichloroethene, due to the latter's ability to bind
more readily to metal surfaces.[39]
Chaplin et al. compared rate constants for several oxyanion contaminants over
mono- and bi-metallic Pd catalysts and suggested that the X-O bond strength was one
factor in determining reaction rates.[34] Another factor is molecular geometry, which can
can affect the adsorption and activation of the oxyanion to the catalyst surface. NO2- has a
bent shape, different from the trigonal planar shape of NO3-. CrO4
- and ClO4- are
tetrahedral in shape, and BrO3- is trigonal pyramidal. Tetrahedral molecules tend to be
more stable and are more difficult to adsorb, which could be a reason for the low
reactivity of ClO4- compared with BrO3
-, even though the Cl-O bond (197 kJ/mol) is
weaker than the Br-O bond (242 kJ/mol). Considering CrO4- and ClO4
- have the same
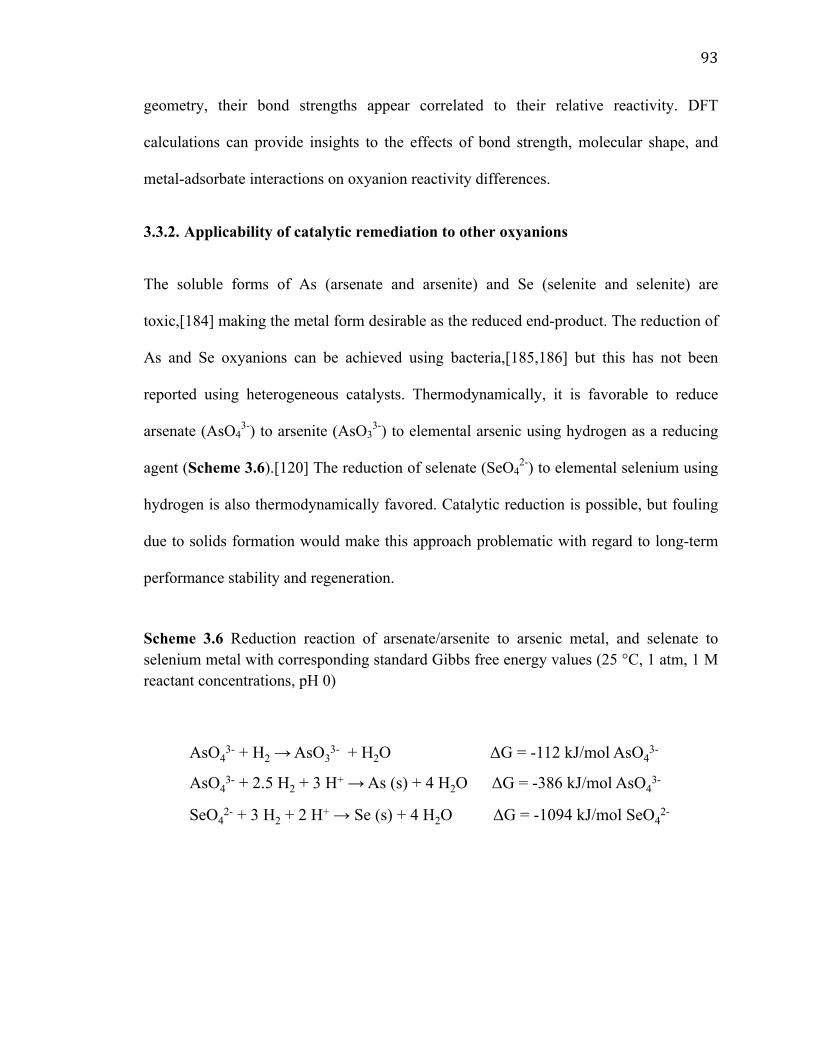
93!!
geometry, their bond strengths appear correlated to their relative reactivity. DFT
calculations can provide insights to the effects of bond strength, molecular shape, and
metal-adsorbate interactions on oxyanion reactivity differences.
3.3.2. Applicability of catalytic remediation to other oxyanions
The soluble forms of As (arsenate and arsenite) and Se (selenite and selenite) are
toxic,[184] making the metal form desirable as the reduced end-product. The reduction of
As and Se oxyanions can be achieved using bacteria,[185,186] but this has not been
reported using heterogeneous catalysts. Thermodynamically, it is favorable to reduce
arsenate (AsO43-) to arsenite (AsO3
3-) to elemental arsenic using hydrogen as a reducing
agent (Scheme 3.6).[120] The reduction of selenate (SeO42-) to elemental selenium using
hydrogen is also thermodynamically favored. Catalytic reduction is possible, but fouling
due to solids formation would make this approach problematic with regard to long-term
performance stability and regeneration.
Scheme 3.6 Reduction reaction of arsenate/arsenite to arsenic metal, and selenate to selenium metal with corresponding standard Gibbs free energy values (25 °C, 1 atm, 1 M reactant concentrations, pH 0)
AsO43- + 2.5 H2 + 3 H+ → As (s) + 4 H2O ΔG = -386 kJ/mol AsO4
3-
SeO42- + 3 H2 + 2 H+ → Se (s) + 4 H2O ΔG = -1094 kJ/mol SeO4
2-
AsO43- + H2 → AsO3
3- + H2O ΔG = -112 kJ/mol AsO43-

94!!
3.3.3. Possible catalytic water treatment scenarios using metallic nanostructures
We highlight several opportunities for the use of metallic nanostructure enabled catalytic
systems. A passive in-situ groundwater treatment could be envisioned using permeable
reactive barriers or horizontal-flow treatment wells filled with catalytic material and
supplied with reductant (e.g. formic acid).[187] Pilot scale tests have been carried out in
both US and Europe.[188,189] Although the studies focused on halogenated organic
compounds, the approach and associated reactor design can be applied to treat oxyanion
contaminants as well. For the latter, bench scale and pilot scale studies have been carried
out successfully for nitrate and perchlorate.[89,104,180]
Catalysis is an exciting concept to address the issue of spent IX brine, especially
if the metal catalysts can be designed to be more active in high-salinity water.[104]
Researchers have shown that nitrate brine treatment is feasible using a combined IX-
catalytic treatment system, and can have a lower environmental impact than IX alone.[89]
Current technical challenges of this system include the depressed activity of the catalyst
(due to the high concentrations of salt species), and possible, unquantified metal loss
during operation. Metal nanostructures that can operate at high-salinity conditions
durably are desired.
Catalytic processes could also potentially be used at a consumer, point-of-use
level. A major concern would be the safe use and storage of hydrogen. Alternative safe
and inexpensive reductants (e.g. formic acid) could be used instead of hydrogen gas; a
water electrolysis (as part of an under-the-sink treatment unit) could be used to produce
the required amounts of hydrogen on-demand. Catalysis could also be useful in the

95!!
treatment of decentralized water supplies at the community level, if hydrogen can be
sustainably supplied on a larger scale, e.g., using wind energy[190] or photovoltaics.
3.3.4. Roadmap for deployment of catalysts for oxyanion treatments
The progress of technology of catalytic reduction of oxyanions can be roughly assessed
using technology readiness level (TRL) values, as introduced by the National Aeronautics
and Space Administration (NASA) in the 1970s (Scheme 3.7).[191] Most academic
laboratory studies are at the TRL 1 (e.g. batch reactors), with fewer at TRL 2 (e.g, flow
reactors, LCA and techno-economic analysis, TEA). Of the oxyanions, nitrate treatment
by catalysis is the furthest along with respect to technology development. IX-brine and
fresh water treatments described in previous sections can be characterized to be at least at
TRL 4. There is much room to develop catalyst technologies for the other oxyanions,
which can be enabled by university-industry partnerships.[192]
!
Scheme 3.7 Technology readiness level (TRL) for catalytic reduction of oxyanion contaminants. The colored boxes represent current and past activities in research and development.
3.3.5. Practical implementation issues of catalytic water treatment
Strong progress has been made in developing new catalysts and catalytic reduction
processes for oxyanions in drinking water and waste brine treatment. However, practical
0 1" 2" 3" 4" 5" 6" 7" 8" Ideation Batch
tests Continuous
tests Test bed" Integrated
system Integrated
system Prototype
system Prototype
system Actual system
9"Commercialization
TRL Levels

96!!
application requires the sufficient and low-cost supply of reducing agents, usually
hydrogen. As mentioned earlier, catalytic treatment unit using stored H2 gas will likely
not be adopted for home use, but its electrolytic production is appropriate. The estimated
amount of H2 needed to treat one cubic meter of nitrate-contaminated water (from 100 to
9 mg-N/L) is 0.33 kg H2, assuming 100% selectivity to dinitrogen and 10% H2 utilization
efficiency. Its production would cost ~$1.65 based on electricity priced at
~$0.08/kWh.[193] In comparison, a small IX system (serving a community of <500
people) would cost ~$2.70 to treat the same water to the same treatment goal.[52] The H2
production cost is lower than the IX cost, indicating the margin for cost competitiveness
for a catalytic water treatment, which would need to accommodate other operations and
maintenance costs and capital costs. To further reduce the hydrogen cost, future research
should focus on ways to increase hydrogen utilization efficiency, for example, improving
hydrogen mass transfer.
The high per-mass cost of the precious metals used in the catalyst material could
be of some concern. However, the catalyst itself accounts for only a small fraction of the
overall capital cost. A study by Reinhard and co-workers found that the catalyst was
~10% of the total cost of a treatment unit they designed and constructed, which was
designed to remove trichloroethene from groundwater using Pd/Al2O3.[189] Lowering
the metal content or replacing with an earth-abundant catalyst are helpful, though not
critical, research goals. Instead, the more important opportunity is to design metal
catalysts that perform stably under realistic water conditions and that require less
downtime for regeneration. Long-term studies on the operation and effective regeneration
of the catalyst are lacking.

97!!To make more informed decisions on whether catalysis could be competitive
against the available technologies, catalytic treatment approaches need to incorporate a
technoeconomic analysis of capital and operational costs, and a LCA to address their
environmental footprint. The LCA work on the combined IX-catalyst nitrate system[89]
and a catalytic perchlorate system[183] are a promising start.
3.4. Conclusions
Metal nanostructures can degrade toxic water-borne oxyanions at ambient conditions in
the form of supported precious metal reduction catalysts. The hydrogenation of
oxyanions (nitrite/nitrate, chromate, bromate, chlorite and perchlorate) is exergonic (∆G
< 0), but the reaction can be slow without combining the primary metal with a second
one. An understanding of the surface reaction mechanisms continues to be needed,
especially in water systems (e.g., a drinking water source or spent IX brine) that contain
other chemical species besides the target oxyanion. It can lead to more active, selective,
and durable catalysts (e.g., what are the appropriate metal particle size and shape, and
support composition). Scale-up of catalytic systems will require attention to mass transfer
effects associated with the imposition of intraparticle and interparticle transport rules, and
engineering and reactor design issues associated with hydrogen gas as the reducing agent.
3.5. References
[1] P.H. Gleick, Water in crisis": a guide to the world’s fresh water resources, Oxford University Press, 1993. https://books.google.com/books/about/Water_in_Crisis.html?id=8--6swEACAAJ (accessed April 27, 2018).

98!!
[2] S.L. Postel, G.C. Daily, P.R. Ehrlich, Human appropriation of renewable fresh water, Science. 271 (1996) 785–788. doi:10.1126/science.271.5250.785.
[3] US Department of Energy, The water-energy nexus: challenges and opportunities, 2014. https://www.energy.gov/sites/prod/files/2014/07/f17/Water Energy Nexus Executive Summary July 2014.pdf (accessed June 7, 2018).
[4] R.P. Schwarzenbach, T. Egli, T.B. Hofstetter, U. von Gunten, B. Wehrli, Global water pollution and human health, Annu. Rev. Environ. Resour. 35 (2010) 109–136. doi:10.1146/annurev-environ-100809-125342.
[5] P.H. Gleick, M. Palaniappan, Peak water limits to freshwater withdrawal and use., Proc. Natl. Acad. Sci. U. S. A. 107 (2010) 11155–62. doi:10.1073/pnas.1004812107.
[6] R.H. Byrne, Inorganic speciation of dissolved elements in seawater: the influence of pH on concentration ratios, Geochem. Trans. 3 (2002) 11. doi:10.1186/1467-4866-3-11.
[7] J.A. Plant, D.G. Kinniburgh, P.L. Smedley, F.M. Fordyce, B.A. Klinck, Arsenic and Selenium, in: Treatise on Geochemistry, Elsevier, 2003: pp. 17–66. doi:10.1016/B0-08-043751-6/09047-2.
[8] A.J. Howarth, Y. Liu, J.T. Hupp, O.K. Farha, Metal–organic frameworks for applications in remediation of oxyanion/cation-contaminated water, CrystEngComm. 17 (2015) 7245–7253. doi:10.1039/C5CE01428J.
[9] K.D. Hristovski, J. Markovski, Engineering metal (hydr)oxide sorbents for removal of arsenate and similar weak-acid oxyanion contaminants: A critical review with emphasis on factors governing sorption processes, Sci. Total Environ. 598 (2017) 258–271. doi:10.1016/j.scitotenv.2017.04.108.
[10] V. V. Goncharuk, V.A. Bagrii, L.A. Mel’nik, R.D. Chebotareva, S.Y. Bashtan, The use of redox potential in water treatment processes, J. Water Chem. Technol. 32 (2010) 1–9. doi:10.3103/S1063455X10010017.
[11] S.H. Laurie, Kinetic stability versus thermodynamic stability, J. Chem. Educ. 49 (1972) 746. doi:10.1021/ed049p746.
[12] P. Delahay, M. Pourbaix, P. Van Rysselberghe, Potential-pH diagrams, J. Chem. Educ. 27 (1950) 683. doi:10.1021/ed027p683.
[13] M. Vermeulen, J. Sanyova, K. Janssens, G. Nuyts, S. De Meyer, K. De Wael, The darkening of copper- or lead-based pigments explained by a structural modification of natural orpiment: a spectroscopic and electrochemical study, J. Anal. At. Spectrom. 32 (2017) 1331–1341. doi:10.1039/C7JA00047B.
[14] D. Johnson, Thermodynamic and kinetic stability, in: D. Johnson (Ed.), Met. Chem. Chang., Royal Society of Chemistry, Cambridge, 1999: pp. 98–101. doi:10.1039/9781847557919-00098.

99!!
[15] B. Chapman, A. Jarvis, Organic chemistry, energetics, kinetics and equilibium, Nelson Thornes, 2003. https://books.google.com/books?id=1dHUAvz_CXwC&pg=PA67&dq=activation+energy+kinetically+stable&hl=en&sa=X&ved=0ahUKEwi8sqyQwN3aAhWC6oMKHXNPBooQ6AEILzAB#v=onepage&q=activation energy kinetically stable&f=false (accessed April 28, 2018).
[16] M. Radepont, Y. Coquinot, K. Janssens, J.-J. Ezrati, W. de Nolf, M. Cotte, Thermodynamic and experimental study of the degradation of the red pigment mercury sulfide, J. Anal. At. Spectrom. 30 (2015) 599–612. doi:10.1039/C4JA00372A.
[17] R. Tolouei, J. Harrison, C. Paternoster, S. Turgeon, P. Chevallier, D. Mantovani, The use of multiple pseudo-physiological solutions to simulate the degradation behavior of pure iron as a metallic resorbable implant: a surface-characterization study, Phys. Chem. Chem. Phys. 18 (2016) 19637–19646. doi:10.1039/C6CP02451C.
[18] J. Wright, Environmental chemistry, Routledge, 2003. https://books.google.com/books/about/Environmental_Chemistry.html?id=eSNMCQ_8kFQC (accessed April 28, 2018).
[19] US EPA, National Primary Drinking Water Regulations, (n.d.). https://www.epa.gov/ground-water-and-drinking-water/national-primary-drinking-water-regulations#content (accessed April 28, 2018).
[20] G. Charnley, Perchlorate: Overview of risks and regulation, Food Chem. Toxicol. 46 (2008) 2307–2315. doi:10.1016/J.FCT.2008.03.006.
[21] H.I. Adegoke, F.A. Adekola, O.S. Fatoki, B.J. Ximba, Sorptive interactions of oxyanions with iron oxides: a review, Polish J. Environ. Stud. 22 (2013) 7–24.
[22] C.T. Matos, R. Fortunato, S. Velizarov, M.A.M. Reis, J.G. Crespo, Removal of mono-valent oxyanions from water in an ion exchange membrane bioreactor: Influence of membrane permselectivity, Water Res. 42 (2008) 1785–1795. doi:10.1016/j.watres.2007.11.006.
[23] J.J. Schoeman, A. Steyn, Nitrate removal with reverse osmosis in a rural area in South Africa, Desalination. 155 (2003) 15–26. doi:10.1016/S0011-9164(03)00235-2.
[24] R. Bhande, P.K. Ghosh, Oxyanions removal by biological processes: a review, in: Springer, Singapore, 2018: pp. 37–54. doi:10.1007/978-981-10-5795-3_4.
[25] J.C. Fanning, The chemical reduction of nitrate in aqueous solution, Coord. Chem. Rev. 199 (2000) 159–179. doi:10.1016/S0010-8545(99)00143-5.
[26] G. Centi, S. Perathoner, Remediation of water contamination using catalytic technologies, Appl. Catal. B Environ. 41 (2003) 15–29. doi:10.1016/S0926-

100!!
3373(02)00198-4.
[27] P. Anastas, N. Eghbali, Green Chemistry: Principles and Practice, Chem. Soc. Rev. 39 (2010) 301–312. doi:10.1039/B918763B.
[28] J.A. Turner, Sustainable hydrogen production, Science. 305 (2004) 972–974. doi:10.1126/science.1103197.
[29] M. Grasemann, G. Laurenczy, Formic acid as a hydrogen source – recent developments and future trends, Energy Environ. Sci. 5 (2012) 8171. doi:10.1039/c2ee21928j.
[30] A.T. Bell, The impact of nanoscience on heterogeneous catalysis., Science. 299 (2003) 1688–91. doi:10.1126/science.1083671.
[31] D. Shuai, D.C. McCalman, J.K. Choe, J.R. Shapley, W.F. Schneider, C.J. Werth, Structure sensitivity study of waterborne contaminant hydrogenation using shape- and size-controlled Pd nanoparticles, ACS Catal. 3 (2013) 453–463. doi:10.1021/cs300616d.
[32] Y. Xiong, X. Lu, M. Nanostructures, Metallic Nanostructures: From Controlled Synthesis to Applications, 2014. doi:10.1007/978-3-319-11304-3.
[33] H.M. Chen, R.S. Liu, Architecture of metallic nanostructures: synthesis strategy and specific applications, J. Phys. Chem. C. 115 (2011) 3513–3527. doi:10.1021/jp108403r.
[34] B.P. Chaplin, M. Reinhard, W.F. Schneider, C. Schüth, J.R. Shapley, T.J. Strathmann, C.J. Werth, Critical review of Pd-based catalytic treatment of priority contaminants in water, Environ. Sci. Technol. 46 (2012) 3655–3670. doi:10.1021/es204087q.
[35] H. Qian, Z. Zhao, J.C. Velazquez, L.A. Pretzer, K.N. Heck, M.S. Wong, Supporting palladium metal on gold nanoparticles improves its catalysis for nitrite reduction, Nanoscale. 6 (2014) 358–364. doi:10.1039/C3NR04540D.
[36] S. Guo, K. Heck, S. Kasiraju, H. Qian, Z. Zhao, L.C. Grabow, J.T. Miller, M.S. Wong, Insights into nitrate reduction over indium-decorated palladium nanoparticle catalysts, ACS Catal. 8 (2017) 503–515. doi:10.1021/acscatal.7b01371.
[37] H. Chen, Z. Xu, H. Wan, J. Zheng, D. Yin, S. Zheng, Aqueous bromate reduction by catalytic hydrogenation over Pd/Al2O3 catalysts, Appl. Catal. B Environ. 96 (2010) 307–313. doi:10.1016/j.apcatb.2010.02.021.
[38] Q. Yang, F. Yao, Y. Zhong, D. Wang, F. Chen, J. Sun, S. Hua, S. Li, X. Li, G. Zeng, Catalytic and electrocatalytic reduction of perchlorate in water – A review, Chem. Eng. J. 306 (2016) 1081–1091. doi:10.1016/j.cej.2016.08.041.
[39] M.O. Nutt, K.N. Heck, P. Alvarez, M.S. Wong, Improved Pd-on-Au bimetallic

101!!
nanoparticle catalysts for aqueous-phase trichloroethene hydrodechlorination, Appl. Catal. B Environ. 69 (2006) 115–125. doi:10.1016/j.apcatb.2006.06.005.
[40] J.C. Velázquez, S. Leekumjorn, Q.X. Nguyen, Y.-L. Fang, K.N. Heck, G.D. Hopkins, M. Reinhard, M.S. Wong, Chloroform hydrodechlorination behavior of alumina-supported Pd and PdAu catalysts, AIChE J. 59 (2013) 4474–4482. doi:10.1002/aic.14250.
[41] H. Shin, S. Jung, S. Bae, W. Lee, H. Kim, Nitrite reduction mechanism on a Pd surface, Environ. Sci. Technol. 48 (2014) 12768–12774. doi:10.1021/es503772x.
[42] J. Restivo, O.S.G.P. Soares, J.J.M. Órfão, M.F.R. Pereira, Metal assessment for the catalytic reduction of bromate in water under hydrogen, Chem. Eng. J. 263 (2015) 119–126. doi:10.1016/j.cej.2014.11.052.
[43] M.A. Omole, I.O. K’Owino, O.A. Sadik, Palladium nanoparticles for catalytic reduction of Cr(VI) using formic acid, Appl. Catal. B Environ. 76 (2007) 158–167. doi:10.1016/j.apcatb.2007.05.018.
[44] U. Prüsse, K.-D. Vorlop, Supported bimetallic palladium catalysts for water-phase nitrate reduction, J. Mol. Catal. A Chem. 173 (2001) 313–328. doi:10.1016/S1381-1169(01)00156-X.
[45] K.D. Hurley, J.R. Shapley, Efficient heterogeneous catalytic reduction of perchlorate in water., Environ. Sci. Technol. 41 (2007) 2044–2049. doi:doi:10.1021/es0624218.
[46] K. a. Guy, H. Xu, J.C. Yang, C.J. Werth, J.R. Shapley, Catalytic nitrate and nitrite reduction with Pd-Cu/PVP colloids in water: Composition, structure, and reactivity correlations, J. Phys. Chem. C. 113 (2009) 8177–8185. doi:10.1021/jp810049y.
[47] N.E. Spahr, N.M. Dubrovsky, J.M. Gronberg, O.L. Franke, D.M. Wolock, Scientific investigations report 2010–5098 nitrate loads and concentrations in surface-water base flow and shallow groundwater for selected basins in the United States, water years 1990–2006, 2010. https://pubs.usgs.gov/sir/2010/5098/pdf/SIR10-5098.pdf (accessed June 7, 2018).
[48] K.R. Burow, B.T. Nolan, M.G. Rupert, N.M. Dubrovsky, Nitrate in groundwater of the United States, 1991−2003, Environ. Sci. Technol. 44 (2010) 4988–4997. doi:10.1021/es100546y.
[49] D.E. Canfield, A.N. Glazer, P.G. Falkowski, The evolution and future of Earth’s nitrogen cycle., Science. 330 (2010) 192–6. doi:10.1126/science.1186120.
[50] J. Schullehner, B. Hansen, M. Thygesen, C.B. Pedersen, T. Sigsgaard, Nitrate in drinking water and colorectal cancer risk: A nationwide population-based cohort study, Int. J. Cancer. 143 (2018) 73–79. doi:10.1002/ijc.31306.
[51] L. Fewtrell, Drinking-water nitrate, methemoglobinemia, and global burden of disease: a discussion., Environ. Health Perspect. 112 (2004) 1371–4.

102!!
doi:10.1289/EHP.7216.
[52] V.B. Jensen, J.L. Darby, C. Seidel, C. Gorman, Drinking Water Treatment for Nitrate, Tech. Rep. 6, Rep. State Water Resour. Control Board Rep. to Legis. Chad Seidel Craig Gorman Jacobs Eng. Group, Inc. (2012).
[53] T. Harter, J.R. Lund, Addressing Nitrate in California’s Drinking Water, Calif. State Water Resour. Control Board. (2012).
[54] A.M. Fan, V.E. Steinberg, Health implications of nitrate and nitrite in drinking water: an update on methemoglobinemia occurrence and reproductive and developmental toxicity, Regul. Toxicol. Pharmacol. 23 (1996) 35–43. doi:10.1006/RTPH.1996.0006.
[55] A. Kapoor, T. Viraraghavan, Nitrate removal from drinking water—review, J. Environ. Eng. 123 (1997) 371–380. doi:10.1061/(ASCE)0733-9372(1997)123:4(371).
[56] A.M. Bergquist, J.K. Choe, T.J. Strathmann, C.J. Werth, Evaluation of a hybrid ion exchange-catalyst treatment technology for nitrate removal from drinking water, Water Res. 96 (2016) 177–187. doi:10.1016/J.WATRES.2016.03.054.
[57] Washington State Department of Environmental Public Health, Nitrate treatment and remediation for small water systems, 2018. https://www.doh.wa.gov/portals/1/Documents/pubs/331-309.pdf (accessed June 7, 2018).
[58] V.B. Jensen, J.L. Darby, C. Seidel, C. Gorman, Nitrate in potable water supplies: alternative management strategies, Crit. Rev. Environ. Sci. Technol. 44 (2014) 2203–2286. doi:10.1080/10643389.2013.828272.
[59] D. Shriver, P. Atkins, Inorganic Chemistry, Oxford University Press, 2010. https://books.google.com/books/about/Inorganic_Chemistry.html?id=OVG0PwAACAAJ (accessed April 25, 2018).
[60] S.D. Ebbesen, B.L. Mojet, L. Lefferts, Effect of pH on the nitrite hydrogenation mechanism over Pd/Al 2O3 and Pt/Al2O3: Details obtained with ATR-IR spectroscopy, J. Phys. Chem. C. 115 (2011) 1186–1194. doi:10.1021/jp106521t.
[61] S.D. Ebbesen, B.L. Mojet, L. Lefferts, In situ ATR-IR study of nitrite hydrogenation over Pd/Al2O3, J. Catal. 256 (2008) 15–23. doi:10.1016/j.jcat.2008.02.013.
[62] Y. Zhao, J.A. Baeza, N. Koteswara Rao, L. Calvo, M.A. Gilarranz, Y.D. Li, L. Lefferts, Unsupported PVA- and PVP-stabilized Pd nanoparticles as catalyst for nitrite hydrogenation in aqueous phase, J. Catal. 318 (2014) 162–169. doi:10.1016/j.jcat.2014.07.011.
[63] C. Sui, F. Yuan, Z. Zhang, C. Zhang, X. Niu, Y. Zhu, Effect of Ru species on N2O decomposition over Ru/Al2O3 catalysts, Catalysts. 6 (2016) 173.

103!!
doi:10.3390/catal6110173.
[64] D. Shuai, J.K. Choe, J.R. Shapley, C.J. Werth, Enhanced Activity and Selectivity of Carbon Nanofiber Supported Pd Catalysts for Nitrite Reduction, Environ. Sci. Technol. 46 (2012) 2847–2855. doi:10.1021/es203200d.
[65] S. Hörold, T. Tacke, K. Vorlop, Catalytical removal of nitrate and nitrite from drinking water: 1. Screening for hydrogenation catalysts and influence of reaction conditions on activity and selectivity, Environ. Technol. 14 (1993) 931–939.
[66] S. Hörold, K.-D. Vorlop, T. Tacke, M. Sell, Development of catalysts for a selective nitrate and nitrite removal from drinking water, Catal. Today. 17 (1993) 21–30. doi:10.1016/0920-5861(93)80004-K.
[67] R. Zhang, D. Shuai, K. a. Guy, J.R. Shapley, T.J. Strathmann, C.J. Werth, Elucidation of nitrate reduction mechanisms on a Pd-In bimetallic catalyst using isotope labeled nitrogen species, ChemCatChem. 5 (2013) 313–321. doi:10.1002/cctc.201200457.
[68] J. Martínez, A. Ortiz, I. Ortiz, State-of-the-art and perspectives of the catalytic and electrocatalytic reduction of aqueous nitrates, Appl. Catal. B Environ. 207 (2017) 42–59. doi:10.1016/J.APCATB.2017.02.016.
[69] Y. Matatov-Meytal, Y. Shindler, M. Sheintuch, Cloth catalysts in water denitrification III. pH inhibition of nitrite hydrogenation over Pd/ACC, Appl. Catal. B Environ. 45 (2003) 127–134. doi:10.1016/S0926-3373(03)00126-7.
[70] D. Shuai, B.P. Chaplin, J.R. Shapley, N.P. Menendez, D.C. Mccalman, W.F. Schneider And, C.J. Werth, Enhancement of oxyanion and diatrizoate reduction kinetics using selected azo dyes on Pd-based catalysts, Environ. Sci. Technol. 44 (2010) 1773–1779. doi:10.1021/es9029842.
[71] S. Seraj, P. Kunal, H. Li, G. Henkelman, S.M. Humphrey, C.J. Werth, PdAu Alloy Nanoparticle Catalysts: Effective Candidates for Nitrite Reduction in Water, ACS Catal. 7 (2017) 3268–3276. doi:10.1021/acscatal.6b03647.
[72] F. Epron, F. Gauthard, C. Pinéda, J. Barbier, Catalytic reduction of nitrate and nitrite on Pt–Cu/Al2O3 catalysts in aqueous solution: role of the interaction between copper and platinum in the reaction, J. Catal. 198 (2001) 309–318. doi:10.1006/jcat.2000.3138.
[73] A.M. Perez-Coronado, L. Calvo, J.A. Baeza, J. Palomar, L. Lefferts, J.J. Rodriguez, M.A. Gilarranz, Selective reduction of nitrite to nitrogen with carbon-supported Pd-AOT nanoparticles, Ind. Eng. Chem. Res. 56 (2017) 11745–11754. doi:10.1021/acs.iecr.7b02944.
[74] F. Epron, F. Gauthard, J. Barbier, Catalytic reduction of nitrate in water on a monometallic Pd/CeO2 catalyst, J. Catal. 206 (2002) 363–367. doi:10.1006/jcat.2001.3498.

104!!
[75] A.E. Palomares, C. Franch, A. Corma, Nitrates removal from polluted aquifers using (Sn or Cu)/Pd catalysts in a continuous reactor, Catal. Today. 149 (2010) 348–351. doi:10.1016/j.cattod.2009.05.013.
[76] N. Krawczyk, S. Karski, I. Witońska, The effect of support porosity on the selectivity of Pd-In/support catalysts in nitrate reduction, React. Kinet. Mech. Catal. 103 (2011) 311–323. doi:10.1007/s11144-011-0321-4.
[77] S. Hamid, M.A. Kumar, W. Lee, Highly reactive and selective Sn-Pd bimetallic catalyst supported by nanocrystalline ZSM-5 for aqueous nitrate reduction, Appl. Catal. B Environ. 187 (2016) 37–46. doi:10.1016/j.apcatb.2016.01.035.
[78] J. Jung, S. Bae, W. Lee, Nitrate reduction by maghemite supported Cu-Pd bimetallic catalyst, Appl. Catal. B Environ. 127 (2012) 148–158. doi:10.1016/j.apcatb.2012.08.017.
[79] U. Prüsse, M. Hähnlein, J. Daum, K.-D. Vorlop, Improving the catalytic nitrate reduction, Catal. Today. 55 (2000) 79–90. doi:10.1016/S0920-5861(99)00228-X.
[80] B.P. Chaplin, J.R. Shapley, C.J. Werth, Regeneration of sulfur-fouled bimetallic Pd-based catalysts, Environ. Sci. Technol. 41 (2007) 5491–5497. doi:10.1021/es0704333.
[81] Z. Gao, Y. Zhang, D. Li, C.J. Werth, Y. Zhang, X. Zhou, Highly active Pd-In/mesoporous alumina catalyst for nitrate reduction, J. Hazard. Mater. 286 (2015) 425–431. doi:10.1016/j.jhazmat.2015.01.005.
[82] D.P. Barbosa, P. Tchiéta, M.D.C. Rangel, F. Epron, The use of a cation exchange resin for palladium-tin and palladium-indium catalysts for nitrate removal in water, J. Mol. Catal. A Chem. 366 (2013) 294–302. doi:10.1016/j.molcata.2012.10.008.
[83] A. Pintar, Catalytic hydrogenation of aqueous nitrate solutions in fixed-bed reactors, Catal. Today. 53 (1999) 35–50. doi:10.1016/S0920-5861(99)00101-7.
[84] G. Mendow, F. a. Marchesini, E.E. Mir, C. a. Querini, Evaluation of Pd-In supported catalysts for water nitrate Abatement in a fixed-bed continuous reactor, Ind. Eng. Chem. Res. 50 (2011) 1911–1920. doi:10.1021/ie102080w.
[85] L. Lemaignen, C. Tong, V. Begon, R. Burch, D. Chadwick, Catalytic denitrification of water with palladium-based catalysts supported on activated carbons, Catal. Today. 75 (2002) 43–48. doi:10.1016/S0920-5861(02)00042-1.
[86] W.C. Bertoch M, Bergquist AM, Gildert G, Strathmann TJ, Catalytic nitrate removal in a trickle bed reactor: direct drinking water treatment, J. Am. Water Work. Assoc. 109 (2017) 144–171.
[87] S. Hamid, M.A. Kumar, J.-I. Han, H. Kim, W. Lee, Nitrate reduction on the surface of bimetallic catalysts supported by nano-crystalline beta-zeolite (NBeta), Green Chem. 19 (2017) 853–866. doi:10.1039/C6GC02349E.

105!!
[88] B.P. Chaplin, E. Roundy, K.A. Guy, J.R. Shapley, C.I. Werth, Effects of natural water ions and humic acid on catalytic nitrate reduction kinetics using an alumina supported Pd-Cu catalyst, Environ. Sci. Technol. 40 (2006) 3075–3081. doi:10.1021/es0525298.
[89] J.K. Choe, A.M. Bergquist, S. Jeong, J.S. Guest, C.J. Werth, T.J. Strathmann, Performance and life cycle environmental benefits of recycling spent ion exchange brines by catalytic treatment of nitrate, Water Res. 80 (2015) 267–280. doi:10.1016/j.watres.2015.05.007.
[90] F. a. Marchesini, N. Picard, E.E. Miró, Study of the interactions of Pd,In with SiO2 and Al2O3 mixed supports as catalysts for the hydrogenation of nitrates in water, Catal. Commun. 21 (2012) 9–13. doi:10.1016/j.catcom.2012.01.015.
[91] F.A. Marchesini, S. Irusta, C. Querini, E. Miró, Spectroscopic and catalytic characterization of Pd-In and Pt-In supported on Al2O3 and SiO2, active catalysts for nitrate hydrogenation, Appl. Catal. A Gen. 348 (2008) 60–70. doi:10.1016/j.apcata.2008.06.026.
[92] C.L. Constantinou, C.N. Costa, A.M. Efstathiou, The remarkable effect of oxygen on the N2 selectivity of water catalytic denitrification by hydrogen, Environ. Sci. Technol. 41 (2007) 950–956. doi:10.1021/es061392y.
[93] F. Deganello, L.F. Liotta, a. Macaluso, a. M. Venezia, G. Deganello, Catalytic reduction of nitrates and nitrites in water solution on pumice-supported Pd-Cu catalysts, Appl. Catal. B Environ. 24 (2000) 265–273. doi:10.1016/S0926-3373(99)00109-5.
[94] A. Garron, F. Epron, Use of formic acid as reducing agent for application in catalytic reduction of nitrate in water, Water Res. 39 (2005) 3073–3081. doi:10.1016/j.watres.2005.05.012.
[95] F. Gauthard, F. Epron, J. Barbier, Palladium and platinum-based catalysts in the catalytic reduction of nitrate in water: Effect of copper, silver, or gold addition, J. Catal. 220 (2003) 182–191. doi:10.1016/S0021-9517(03)00252-5.
[96] F.A. Marchesini, S. Irusta, C. Querini, E. Miró, Nitrate hydrogenation over Pt,In/Al2O3 and Pt,In/SiO2. Effect of aqueous media and catalyst surface properties upon the catalytic activity, Catal. Commun. 9 (2008) 1021–1026. doi:10.1016/j.catcom.2007.09.037.
[97] U. Matatov-Meytal, M. Sheintuch, Activated carbon cloth-supported Pd-Cu catalyst: Application for continuous water denitrification, Catal. Today. 102–103 (2005) 121–127. doi:10.1016/j.cattod.2005.02.015.
[98] I. Dodouche, D.P. Barbosa, M.D.C. Rangel, F. Epron, Palladium-tin catalysts on conducting polymers for nitrate removal, Appl. Catal. B Environ. 93 (2009) 50–55. doi:10.1016/j.apcatb.2009.09.011.

106!!
[99] Y. Xie, H. Cao, Y. Li, Y. Zhang, J.C. Crittenden, Highly selective PdCu/amorphous silica-alumina (ASA) catalysts for groundwater denitration, Environ. Sci. Technol. 45 (2011) 4066–4072. doi:10.1021/es104050h.
[100] Y. Matatov-Meytal, V. Barelko, I. Yuranov, L. Kiwi-Minsker, A. Renken, M. Sheintuch, Cloth catalysts for water denitrification: II. Removal of nitrates using Pd–Cu supported on glass fibers, Appl. Catal. B Environ. 31 (2001) 233–240. doi:10.1016/S0926-3373(00)00284-8.
[101] R. Gavagnin, L. Biasetto, F. Pinna, G. Strukul, Nitrate removal in drinking waters: The effect of tin oxides in the catalytic hydrogenation of nitrate by Pd/SnO2catalysts, Appl. Catal. B Environ. 38 (2002) 91–99. doi:10.1016/S0926-3373(02)00032-2.
[102] WellToDo, WellToDo Nitrate Removal Water Treatment, (n.d.). http://welltodo.co.il/ (accessed May 4, 2018).
[103] Y. Matatov-Meytal, V. Barelko, I. Yuranov, M. Sheintuch, Cloth catalysts in water denitrification: I. Pd on glass fibers, Appl. Catal. B Environ. 27 (2000) 127–135. doi:10.1016/S0926-3373(00)00141-7.
[104] A.M. Bergquist, M. Bertoch, G. Gildert, T.J. Strathmann, C.J. Werth, Catalytic denitrification in a trickle bed reactor: Ion exchange waste brine treatment, J. Am. Water Works Assoc. 109 (2017) 129–143. doi:10.5942/jawwa.2017.109.0055.
[105] National Research Council; Division on Earth and Life Studies; Board on Environmental Studies and Toxicology; Commission on Life Sciences;Committee on Environmental Epidemiology, Environmental Epidemiology, Volume 1: Public Health and Hazardous Wastes, National Academies Press, Washington, D.C., 1991. doi:10.17226/1802.
[106] B. Wielinga, M.M. Mizuba, C.M. Hansel, S. Fendorf, Iron promoted reduction of chromate by dissimilatory iron-reducing bacteria, Environ. Sci. Technol. 35 (2000) 522–527. doi:10.1021/ES001457B.
[107] J. Sun, J. Zhang, Y. Jin, J.D. Gu, J.P. Borel, T. Tsukuda, Y.Y. Chen, W.T. Hung, X. Cai, E. Li, I.M. Kempson, Y. Hwu, C.S. Yang, E.S. Tok, H.R. Tan, M. Lin, G. Margaritondo, 11-Mercaptoundecanoic acid directed one-pot synthesis of water-soluble fluorescent gold nanoclusters and their use as probes for sensitive and selective detection of Cr 3+ and Cr 6+, J. Mater. Chem. C. 1 (2013) 138–143. doi:10.1039/C2TC00021K.
[108] H. Sun, J. Brocato, M. Costa, Oral chromium exposure and toxicity., Curr. Environ. Heal. Reports. 2 (2015) 295–303. doi:10.1007/s40572-015-0054-z.
[109] State Water Resources Control Board Division of Water Quality GAMA Program, Groundwater information sheet - hexavalent chromium, 2017. http://www.waterboards.ca.gov/gama/docs/coc_hexchromcr6.pdf (accessed August 25, 2017).

107!!
[110] The California Water Boards, Maximum contaminant levels and regulatory dates for drinking water U.S. EPA vs California, 2014. http://www.waterboards.ca.gov/drinking_water/certlic/drinkingwater/Documents/DWdocuments/MCLsEPAvsDWP-2014-07-01.pdf (accessed August 25, 2017).
[111] World Health Organization (WHO), Chromium in Drinking-water Background document for development of WHO Guidelines for Drinking-water Quality, 1996. http://www.who.int/water_sanitation_health/dwq/chemicals/chromium.pdf (accessed August 3, 2017).
[112] R.R. Patterson, S. Fendorf, Reduction of hexavalent chromium by amorphous iron sulfide, Environ. Sci. Technol. 31 (1997) 2039–2044. doi:10.1021/ES960836V.
[113] B. Galán, D. Castañeda, I. Ortiz, Removal and recovery of Cr(VI) from polluted ground waters: A comparative study of ion-exchange technologies, Water Res. 39 (2005) 4317–4324. doi:10.1016/J.WATRES.2005.08.015.
[114] H.-J. Park, L.L. Tavlarides, Adsorption of chromium(VI) from aqueous solutions using an imidazole functionalized adsorbent, Ind. Eng. Chem. Res. 47 (2008) 3401–3409. doi:10.1021/IE7017096.
[115] E.N. Chirwa, Y.-T. Wang, Simultaneous chromium(VI) reduction and phenol degradation in an anaerobic consortium of bacteria, Water Res. 34 (2000) 2376–2384. doi:10.1016/S0043-1354(99)00363-2.
[116] C.A. Kozlowski, W. Walkowiak, Removal of chromium(VI) from aqueous solutions by polymer inclusion membranes, Water Res. 36 (2002) 4870–4876. doi:10.1016/S0043-1354(02)00216-6.
[117] C.E. Barrera-Díaz, V. Lugo-Lugo, B. Bilyeu, A review of chemical, electrochemical and biological methods for aqueous Cr(VI) reduction, J. Hazard. Mater. 223–224 (2012) 1–12. doi:10.1016/J.JHAZMAT.2012.04.054.
[118] E.L. Hawley, R.A. Deeb, M.C. Kavanaugh, J.A. Jacobs, Treatment technologies for chromium(VI), in: Chromium(VI) Handb., Wiley-Blackwell, 2005: pp. 275–310. doi:10.1002/chin.200614270.
[119] S.A. Katz, H. Salem, The toxicology of chromium with respect to its chemical speciation: A review, J. Appl. Toxicol. 13 (1993) 217–224. doi:10.1002/jat.2550130314.
[120] P. Vanýsek, Electrochemical series, in: CRC Handb. Chem. Phys., 91st ed., 2002. http://sites.chem.colostate.edu/diverdi/all_courses/CRC reference data/electrochemical series.pdf (accessed April 25, 2018).
[121] J. Guertin, J.A. Jacobs, C.P. Avakian, Chromium (VI) handbook, CRC Press, 2005.
[122] C. Yang, J.H. Meldon, B. Lee, H. Yi, Investigation on the catalytic reduction kinetics of hexavalent chromium by viral-templated palladium nanocatalysts,
108!!
Catal. Today. 233 (2014) 108–116. doi:10.1016/j.cattod.2014.02.043.
[123] M.P. Watts, V.S. Coker, S.A. Parry, R.A.P. Thomas, R. Kalin, J.R. Lloyd, Effective treatment of alkaline Cr(VI) contaminated leachate using a novel Pd-bionanocatalyst: Impact of electron donor and aqueous geochemistry, Appl. Catal. B Environ. 170–171 (2015) 162–172. doi:10.1016/j.apcatb.2015.01.017.
[124] I.O. K’Owino, M.A. Omole, O.A. Sadik, Tuning the surfaces of palladium nanoparticles for the catalytic conversion of Cr(VI) to Cr(III), J. Environ. Monit. 9 (2007) 657–665. doi:10.1039/b706225g.
[125] M.A. Omole, V.A. Okello, V. Lee, L. Zhou, O.A. Sadik, C. Umbach, B. Sammakia, Catalytic reduction of hexavalent chromium using flexible nanostructured poly(amic acids), ACS Catal. 1 (2011) 139–146. doi:10.1021/cs100034z.
[126] M. Yadav, Q. Xu, Catalytic chromium reduction using formic acid and metal nanoparticles immobilized in a metal–organic framework, Chem. Commun. 49 (2013) 3327. doi:10.1039/c3cc00293d.
[127] M. Liang, R. Su, W. Qi, Y. Zhang, R. Huang, Y. Yu, L. Wang, Z. He, Reduction of Hexavalent chromium using recyclable Pt/Pd nanoparticles immobilized on procyanidin-grafted eggshell membrane, Ind. Eng. Chem. Res. 53 (2014) 13635–13643. doi:10.1021/ie5021552.
[128] Z. Mai, Y. Hu, P. Huang, X. Zhang, X. Dong, Y. Fang, C. Wu, J. Cheng, W. Zhou, Outside-in stepwise bi-functionalization of magnetic mesoporous silica incorporated with Pt nanoparticles for effective removal of hexavalent chromium, Powder Technol. 312 (2017) 48–57. doi:10.1016/j.powtec.2017.02.028.
[129] B. Vellaichamy, P. Periakaruppan, A facile, one-pot and eco-friendly synthesis of gold/silver nanobimetallics smartened rGO for enhanced catalytic reduction of hexavalent chromium, RSC Adv. 6 (2016) 57380–57388. doi:10.1039/C6RA10544K.
[130] W.-J. Liu, L. Ling, Y.-Y. Wang, H. He, Y.-R. He, H.-Q. Yu, H. Jiang, One-pot high yield synthesis of Ag nanoparticle-embedded biochar hybrid materials from waste biomass for catalytic Cr(VI) reduction, Environ. Sci. Nano. 3 (2016) 745–753. doi:10.1039/C6EN00109B.
[131] F.Q. Shao, J.J. Feng, X.X. Lin, L.Y. Jiang, A.J. Wang, Simple fabrication of AuPd@Pd core-shell nanocrystals for effective catalytic reduction of hexavalent chromium, Appl. Catal. B Environ. 208 (2017) 128–134. doi:10.1016/j.apcatb.2017.02.051.
[132] L. Zhang, Y. Guo, A. Iqbal, B. Li, M. Deng, D. Gong, W. Liu, W. Qin, Palladium nanoparticles as catalysts for reduction of Cr(VI) and Suzuki coupling reaction, J. Nanoparticle Res. 19 (2017) 150. doi:10.1007/s11051-017-3829-3.
109!!
[133] R. Narayanan, M.A. El-Sayed, Shape-dependent catalytic activity of platinum nanoparticles in colloidal solution, Nano Lett. 4 (2004) 1343–1348. doi:10.1021/NL0495256.
[134] Y. Huang, H. Ma, S. Wang, M. Shen, R. Guo, X. Cao, M. Zhu, X. Shi, Efficient catalytic reduction of hexavalent chromium using palladium nanoparticle-immobilized electrospun polymer nanofibers, ACS Appl. Mater. Interfaces. 4 (2012) 3054–3061. doi:10.1021/am300417s.
[135] L.L. Wei, R. Gu, J.M. Lee, Highly efficient reduction of hexavalent chromium on amino-functionalized palladium nanowires, Appl. Catal. B Environ. 176–177 (2015) 325–330. doi:10.1016/j.apcatb.2015.03.056.
[136] C. Yang, A.K. Manocchi, B. Lee, H. Yi, Viral templated palladium nanocatalysts for dichromate reduction, Appl. Catal. B Environ. 93 (2010) 282–291. doi:10.1016/j.apcatb.2009.10.001.
[137] Y.-L. Fang, K.N. Heck, P.J.J. Alvarez, M.S. Wong, Kinetics analysis of palladium/gold nanoparticles as colloidal hydrodechlorination catalysts, ACS Catal. 1 (2011) 128–138. doi:10.1021/cs100067k.
[138] G.T. Fu, X. Jiang, R. Wu, S.H. Wei, D.M. Sun, Y.W. Tang, T.H. Lu, Y. Chen, Arginine-assisted synthesis and catalytic properties of single-crystalline palladium tetrapods, ACS Appl. Mater. Interfaces. 6 (2014) 22790–22795. doi:10.1021/am506965f.
[139] U.S. Markad, A.M. Kalekar, D.B. Naik, K.K.K. Sharma, K.J. Kshirasagar, G.K. Sharma, Photo enhanced detoxification of chromium (VI) by formic acid using 3D palladium nanocatalyst, J. Photochem. Photobiol. A Chem. 338 (2017) 115–122. doi:10.1016/j.jphotochem.2017.01.034.
[140] H. Chen, Y. Shao, Z. Xu, H. Wan, Y. Wan, S. Zheng, D. Zhu, Effective catalytic reduction of Cr(VI) over TiO2 nanotube supported Pd catalysts, Appl. Catal. B Environ. 105 (2011) 255–262. doi:10.1016/j.apcatb.2011.04.004.
[141] A. Dandapat, D. Jana, G. De, Pd nanoparticles supported mesoporous γ-Al2O3 film as a reusable catalyst for reduction of toxic CrVI to CrIII in aqueous solution, Appl. Catal. A Gen. 396 (2011) 34–39. doi:10.1016/j.apcata.2011.01.032.
[142] W. Tu, K. Li, X. Shu, W.W. Yu, Reduction of hexavalent chromium with colloidal and supported palladium nanocatalysts, J. Nanoparticle Res. 15 (2013) 1593–1601. doi:10.1007/s11051-013-1593-6.
[143] M. Celebi, M. Yurderi, A. Bulut, M. Kaya, M. Zahmakiran, Palladium nanoparticles supported on amine-functionalized SiO2 for the catalytic hexavalent chromium reduction, Appl. Catal. B Environ. 180 (2016) 53–64. doi:10.1016/j.apcatb.2015.06.020.
[144] H.-C. Li, W.-J. Liu, H.-X. Han, H.-Q. Yu, Hydrophilic swellable metal–organic

110!!
framework encapsulated Pd nanoparticles as an efficient catalyst for Cr(VI) reduction, J. Mater. Chem. A. 4 (2016) 11680–11687. doi:10.1039/C6TA03688K.
[145] C. Yang, C.H. Choi, C.S. Lee, H. Yi, A facile synthesis-fabrication strategy for integration of catalytically active viral-palladium nanostructures into polymeric hydrogel microparticles via replica molding, ACS Nano. 7 (2013) 5032–5044. doi:10.1021/nn4005582.
[146] A. Turk, Introduction to chemistry, Academic Press, 1968.
[147] W.R. Haag, J. Holgné, Ozonation of Bromide-Containing Waters: Kinetics of Formation of Hypobromous Acid and Brómate, Environ. Sci. Technol. 17 (1983) 261–267. doi:10.1021/es00111a004.
[148] N. Gonce, E.A. Voudrias, Removal of chlorite and chlorate ions from water using granular activated carbon, Water Res. 28 (1994) 1059–1069. doi:10.1016/0043-1354(94)90191-0.
[149] K. Alfredo, B. Stanford, J.A. Roberson, A. Eaton, Chlorate challenges for water systems, J. Am. Water Works Assoc. 107 (2015) 187–196. doi:10.5942/jawwa.2015.107.0036.
[150] P. Brandhuber, S. Clark, K. Morley, A review of perchlorate occurrence in public drinking water systems, J. Am. Water Works Assoc. 101 (2009) 63–73. doi:10.1002/j.1551-8833.2009.tb09991.x.
[151] A. Srinivasan, T. Viraraghavan, Perchlorate: health effects and technologies for its removal from water resources, Int. J. Environ. Res. Public Health. 6 (2009) 1418–1442. doi:10.3390/ijerph6041418.
[152] R. Srinivasan, G.A. Sorial, Treatment of perchlorate in drinking water: A critical review, Sep. Purif. Technol. 69 (2009) 7–21. doi:10.1016/J.SEPPUR.2009.06.025.
[153] J. Liu, J. Yu, D. Li, Y. Zhang, M. Yang, Reduction of bromate in a biological activated carbon filter under high bulk dissolved oxygen conditions and characterization of bromate-reducing isolates, Biochem. Eng. J. 65 (2012) 44–50. doi:10.1016/j.bej.2012.04.004.
[154] M. Asami, T. Aizawa, T. Morioka, W. Nishijima, A. Tabata, Y. Magara, Bromate removal during transition from new granular activated carbon (GAC) to biological activated carbon (BAC), Water Res. 33 (1999) 2797–2804. doi:10.1016/S0043-1354(98)00504-1.
[155] X. Zhao, H. Liu, Y. Shen, J. Qu, Photocatalytic reduction of bromate at C60 modified Bi2MoO6 under visible light irradiation, Appl. Catal. B Environ. 106 (2011) 63–68. doi:10.1016/j.apcatb.2011.05.005.
[156] T. Li, Y. Chen, P. Wan, M. Fan, X. Jin Yang, Chemical degradation of drinking water disinfection byproducts by millimeter-sized particles of iron-silicon and magnesium-aluminum alloys, J. Am. Chem. Soc. 132 (2010) 2500–2501.
111!!
doi:10.1021/ja908821d.
[157] K. Listiarini, J.T. Tor, D.D. Sun, J.O. Leckie, Hybrid coagulation-nanofiltration membrane for removal of bromate and humic acid in water, J. Memb. Sci. 365 (2010) 154–159. doi:10.1016/j.memsci.2010.08.048.
[158] R. Butler, A. Godley, L. Lytton, E. Cartmell, Bromate environmental contamination: review of impact and possible treatment, Crit. Rev. Environ. Sci. Technol. 35 (2005) 193–217. doi:10.1080/10643380590917888.
[159] The Interstate Technology & Regulatory Council, Remediation Technologies for Perchlorate Contamination in Water and Soil, 2008. https://www.itrcweb.org/Guidance/GetDocument?documentID=61 (accessed April 23, 2018).
[160] S. Sorlini, C. Collivignarelli, Chlorite removal with granular activated carbon, Desalination. 176 (2005) 255–265. doi:10.1016/J.DESAL.2004.10.030.
[161] S. Sorlini, C. Collivignarelli, Chlorite removal with ferrous ions, Desalination. 176 (2005) 267–271. doi:10.1016/J.DESAL.2004.11.013.
[162] J. Zhou, K. Wu, W. Wang, Y. Han, Z. Xu, H. Wan, S. Zheng, D. Zhu, Simultaneous removal of monochloroacetic acid and bromate by liquid phase catalytic hydrogenation over Pd/Ce1-xZrxO2, Appl. Catal. B Environ. 162 (2015) 85–92. doi:10.1016/j.apcatb.2014.06.041.
[163] J. Restivo, O.S.G.P. Soares, J.J.M. Órfão, M.F.R. Pereira, Catalytic reduction of bromate over monometallic catalysts on different powder and structured supports, Chem. Eng. J. 309 (2017) 197–205. doi:10.1016/j.cej.2016.10.025.
[164] Y. Gao, W. Sun, W. Yang, Q. Li, Creation of Pd/Al2O3 catalyst by a spray process for fixed bed reactors and its effective removal of aqueous bromate, Sci. Rep. 7 (2017) 41797. doi:10.1038/srep41797.
[165] Y. Wang, J. Liu, P. Wang, C.J. Werth, T.J. Strathmann, Palladium nanoparticles encapsulated in core − shell silica": a structured hydrogenation catalyst with enhanced activity for reduction of oxyanion water pollutants, ACS Catal. 4 (2014) 3551–3559.
[166] T. Yuranova, L. Kiwi-Minsker, C. Franch, A.E. Palomares, S. Armenise, E. García-Bordejé, Nanostructured catalysts for the continuous reduction of nitrates and bromates in water, Ind. Eng. Chem. Res. 52 (2013) 13930–13937. doi:10.1021/ie302977h.
[167] Y. Marco, E. García-Bordejé, C. Franch, A.E. Palomares, T. Yuranova, L. Kiwi-Minsker, Bromate catalytic reduction in continuous mode using metal catalysts supported on monoliths coated with carbon nanofibers, Chem. Eng. J. 230 (2013) 605–611. doi:10.1016/j.cej.2013.06.040.
[168] P. Zhang, F. Jiang, H. Chen, Enhanced catalytic hydrogenation of aqueous
112!!
bromate over Pd/mesoporous carbon nitride, Chem. Eng. J. 234 (2013) 195–202. doi:10.1016/j.cej.2013.08.111.
[169] A.E. Palomares, C. Franch, T. Yuranova, L. Kiwi-Minsker, E. García-Bordeje, S. Derrouiche, The use of Pd catalysts on carbon-based structured materials for the catalytic hydrogenation of bromates in different types of water, Appl. Catal. B Environ. 146 (2014) 186–191. doi:10.1016/j.apcatb.2013.02.056.
[170] P. Yaseneva, C.F. Marti, E. Palomares, X. Fan, T. Morgan, P.S. Perez, M. Ronning, F. Huang, T. Yuranova, L. Kiwi-Minsker, S. Derrouiche, A.A. Lapkin, Efficient reduction of bromates using carbon nanofibre supported catalysts: Experimental and a comparative life cycle assessment study, Chem. Eng. J. 248 (2014) 230–241. doi:10.1016/j.cej.2014.03.034.
[171] J. Restivo, O.S.G.P. Soares, J.J.M. Órfão, M.F.R. Pereira, Bimetallic activated carbon supported catalysts for the hydrogen reduction of bromate in water, Catal. Today. 249 (2015) 213–219. doi:10.1016/j.cattod.2014.10.048.
[172] C.M.A.S. Freitas, O.S.G.P. Soares, J.J.M. Órfão, A.M. Fonseca, M.F.R. Pereira, I.C. Neves, Highly efficient reduction of bromate to bromide over mono and bimetallic ZSM5 catalysts, Green Chem. 17 (2015) 4247–4254. doi:10.1039/C5GC00777A.
[173] O.S.G.P. Soares, C.M.A.S. Freitas, A.M. Fonseca, J.J.M. Órfão, M.F.R. Pereira, I.C. Neves, Bromate reduction in water promoted by metal catalysts prepared over faujasite zeolite, Chem. Eng. J. 291 (2016) 199–205. doi:10.1016/j.cej.2016.01.093.
[174] W. Sun, Q. Li, S. Gao, J.K. Shang, Highly efficient catalytic reduction of bromate in water over a quasi-monodisperse superparamagnetic Pd/Fe3O4 catalyst, J. Mater. Chem. A. 1 (2013) 9215–9224. doi:10.1039/C3TA11455D.
[175] H. Chen, P. Zhang, W. Tan, F. Jiang, R. Tang, Palladium supported on amino functionalized magnetic MCM-41 for catalytic hydrogenation of aqueous bromate, RSC Adv. 4 (2014) 38743–38749. doi:10.1039/C4RA05593D.
[176] A. Becker, M. Sell, G. Neuenfeldt, V. Koch, H. Schindler, Method of removing chlorine and halogen-oxygen compounds from water by catalytic reduction, US5779915, 1995. https://patents.google.com/patent/US5779915/en (accessed May 30, 2018).
[177] D.M. Wang, S.I. Shah, J.G. Chen, C.P. Huang, Catalytic reduction of perchlorate by H2 gas in dilute aqueous solutions, Sep. Purif. Technol. 60 (2008) 14–21. doi:10.1016/j.seppur.2007.07.039.
[178] J.K. Choe, J.R. Shapley, T.J. Strathmann, C.J. Werth, Influence of rhenium speciation on the stability and activity of Re/Pd bimetal catalysts used for perchlorate reduction, Environ. Sci. Technol. 44 (2010) 4716–4721. doi:10.1021/es100227z.

113!!
[179] Y. Zhang, K.D. Hurley, J.R. Shapley, Heterogeneous catalytic reduction of perchlorate in water with Re-Pd/C catalysts derived from an oxorhenium(V) molecular precursor, Inorg. Chem. 50 (2011) 1534–1543. doi:10.1021/ic102158a.
[180] J. Liu, J.K. Choe, Z. Sasnow, C.J. Werth, T.J. Strathmann, Application of a Re-Pd bimetallic catalyst for treatment of perchlorate in waste ion-exchange regenerant brine, Water Res. 47 (2013) 91–101. doi:10.1016/j.watres.2012.09.031.
[181] J.K. Choe, M.I. Boyanov, J. Liu, K.M. Kemner, C.J. Werth, T.J. Strathmann, X-ray spectroscopic characterization of immobilized rhenium species in hydrated rhenium-palladium bimetallic catalysts used for perchlorate water treatment, J. Phys. Chem. C. 118 (2014) 11666–11676. doi:10.1021/jp5006814.
[182] K.D. Hurley, Y. Zhang, J.R. Shapley, Ligand-enhanced reduction of perchlorate in water with heterogeneous Re-Pd/C catalysts, J. Am. Chem. Soc. 131 (2009) 14172–14173. doi:10.1021/ja905446t.
[183] J.K. Choe, M.H. Mehnert, J.S. Guest, T.J. Strathmann, C.J. Werth, Comparative assessment of the environmental sustainability of existing and emerging perchlorate treatment technologies for drinking water, Environ. Sci. Technol. 47 (2013) 4644–4652. doi:10.1021/es3042862.
[184] V.K. Sharma, M. Sohn, Aquatic arsenic: Toxicity, speciation, transformations, and remediation, Environ. Int. 35 (2009) 743–759. doi:10.1016/j.envint.2009.01.005.
[185] S. Silver, L.T. Phung, Genes and enzymes involved in bacterial oxidation and reduction of inorganic arsenic., Appl. Environ. Microbiol. 71 (2005) 599–608. doi:10.1128/AEM.71.2.599-608.2005.
[186] Y. V. Nancharaiah, P.N.L. Lens, Ecology and biotechnology of selenium-respiring bacteria, Microbiol. Mol. Biol. Rev. 79 (2015) 61–80. doi:10.1128/MMBR.00037-14.
[187] R. Thiruvenkatachari, S. Vigneswaran, R. Naidu, Permeable reactive barrier for groundwater remediation, J. Ind. Eng. Chem. 14 (2008) 145–156. doi:10.1016/J.JIEC.2007.10.001.
[188] V. Birke, H. Burmeier, D. Rosenau, Permeable reactive barriers (PBRs) in Germany and Austria: state-of-the-art report 2003, Gehrden, Germany, 2003. http://www.efuc.org/old/suderburg03/papers/BIRKE_PRB_1.pdf (accessed May 31, 2018).
[189] M. Reinhard, In situ catalytic groundwater treatment using palladium catalysts and horizontal flow treatment wells, 2008. http://www.dtic.mil/dtic/tr/fulltext/u2/a604036.pdf (accessed May 31, 2018).
[190] M. Reese, C. Marquart, M. Malmali, K. Wagner, E. Buchanan, A. McCormick, E.L. Cussler, Performance of a small-scale Haber process, Ind. Eng. Chem. Res. 55 (2016) 3742–3750. doi:10.1021/acs.iecr.5b04909.

114!!
[191] J.C. Mankins, Technology readiness assessments: A retrospective, Acta Astronaut. 65 (2009) 1216–1223. doi:10.1016/J.ACTAASTRO.2009.03.058.
[192] Nanosystems Engineering Research Center for Nanotechnology-Enabled Water Treatment, (n.d.). http://www.newtcenter.org/ (accessed June 27, 2018).
[193] National Renewable Energy Laboratory, Technology Brief: Analysis of Current-Day Commercial Electrolyzers: National Renewable Energy Laboratory (Fact Sheet), 2003. https://www.nrel.gov/docs/fy04osti/36705.pdf (accessed May 5, 2018).

115!!
Chapter 4
PdAu-catalyzed Oxidation through in situ Generated H2O2 in Simulated Produced
Water
4.1. Introduction
Oil and gas (O&G) production from hydraulic fracturing accounts for more than 50% of
total oil production and 70% of the total gas production in the United States since
2016.[1] One of the critical steps in hydraulic fracturing is to pump a large amount of
fracturing fluid and proppant into the wellbore at high pressure to fracture the shale
formation, and release the oil and gas.[2] Fresh water is the predominant component of
the fracturing fluid, but also contains a mixture of chemical additives used to improve
performance of the hydraulic fracturing process.[3] During production, the fracturing
fluid, formation water, crude oil and/or natural gas are produced back to surface where
they are separated and recovered.

116!!All waters that are recovered from an O&G well are termed "produced water"
with produced water from hydraulic fracturing wells (HF-PW) being especially
problematic due to the number of different contaminants. The composition of HF-PW can
include total organic content (TOC) in a variety of organic compounds, concentrated,
multivalent inorganic salts, naturally occurring radioactive materials (NORM), suspended
solids and bacteria. The complicated compositions make the treatment of produced water
a great challenge for O&G operators.[4,5] Currently, the most common way to manage
HF-PW is to inject it into a disposal well.[6] However, because of the concern of possible
water and soil contamination, the limited availability of disposal wells, and the cost of
transporting water to wells, there is a desire to treat and reuse HF-PW.[7][8]
Many technologies have been proposed and investigated for the treatment of
conventional produced water.[9–11] Ion exchange, reverse osmosis, membrane
distillation and evaporative crystallization have been studied to reduce the total dissolved
solids (TDS) in produced water.[9] Organic compounds, which can contaminate
groundwater and facilitate bacteria growth in produced water, can be removed by
adsorption using activated carbon materials but with mixed results depending on the
technology, process efficiencies and deployment cost.
Oxidation processes have been studied to degrade organic compounds through
chemical oxidation[12] or advanced oxidation processes including electrochemical
methods[13], Fenton oxidation [14], and heterogeneous Fenton-like chemistry.[15]
Electrochemical treatments are limited by the high cost of electrodes and high energy
requirements.[13,16] Fenton oxidation requires the continuous delivery and use of
chemicals (i.e., H2O2 and ferrous iron, Fe2+) and operation at low pH values, such that

117!!
H2O2 is converted into the reactive "OH radical species. Hydroxyl radicals are desirable
for organic oxidative removal due to its higher redox potential (2.80 V vs. SHE) than
H2O2 (1.78 V vs. SHE), but they are highly reactive and have short lifetime (τ < 1 s)
unless generated in situ.[17] Catalytic wet peroxide oxidation replaces the homogeneous
iron catalyst with a heterogeneous supported version, but material stability remains a
challenge and H2O2 input is still required.[18] The on-site production of the oxidant
would be advantageous towards a cost-effective technology for organics removal.
Formic acid is an organic acid commonly found in HF-PW, and is a potential
precursor in the production of H2O2 oxidant. Yalfani et al. reported that H2O2 production
from formic acid and O2 can be accomplished using a supported palladium (Pd)
catalyst.[19] They later demonstrated the degradation of phenol by in situ generated H2O2
combined with ferrous iron [20] and with Pd-Fe catalyst [21]. The iron content generated
"OH radicals from the H2O2 via Fenton/Fenton-like chemistry. The irreversible loss of
ferrous iron activity and iron leaching from Pd-Fe catalyst at acidic conditions require the
continuous addition of active iron reagents. However, these systems would not be
economical for treating the large volumes of HF-PW that is the focus of this study. Iron is
not strictly required to generate "OH radicals from H2O2, as Han et al. reported that a
monometallic gold (Au) catalyst can degrade organic compounds with H2O2 in water at
70 °C.[22]
Bimetallic PdAu catalysts are generally more active (and often times more
selective and resistant to deactivation) than monometallic Pd or Au for various reactions,
including hydrogen production from formic acid [23–26] and H2O2 generation from H2
and O2 [27]. In this work, we studied the generation of H2O2 from formic acid and

118!!
oxygen using PdAu/Al2O3, and compared it to monometallic Pd/Al2O3 and Au/Al2O3,
quantifying H2O2 generation rate and also that of "OH radicals. We inferred the
mechanism of organic compound degradation using phenol as a model compound.
Considering Fe2+ species are present in HF-PW, we studied its concentration effect on
phenol degradation. We also studied the effects of salinity and pH on phenol degradation,
identifying the limits of catalytic activity. Our results show, for the first time, that PdAu
are more active than the monometallic precious metals in degrading phenol in moderately
saline water, using formic acid and O2.
4.2. Experimental
4.2.1. Materials
The bimetallic catalyst containing 1 wt% Pd and 1 wt% Au supported on Al2O3 pellets
("PdAu/Al2O3") was provided by Johnson Matthey. A monometallic Au catalyst
containing 1.2 wt% Au supported on alumina extrudates ("Au/Al2O3") was purchased
from Strem Chemicals. The following chemicals were purchased from Sigma-Aldrich
and used as-received: 1 wt% Pd supported on alumina ("Pd/Al2O3," in the form of a
powder), formic acid (>95%), hydrogen peroxide solution (30 wt% in water),
titanium(IV) oxysulfate solution (~15 wt% in sulfuric acid, >99.99%), phenol (>99%),
1,2-dihydroxylbenzene (>99%), hydroquinone (>99.5%), terephthalic acid (>98%),
iron(II) sulfate heptahydrate (>99%), sodium chloride (>99%), calcium chloride
dihydrate (>99%), magnesium chloride hexahydrate (>99%), magnesium sulfate
heptahydrate (>98%), and sodium bicarbonate (>99.7%). The fluorescent standard, 2-
Hydroxyterephthalic acid (>98%) was purchased from TCI. Sodium hydroxide solution

119!!
(1 N) was purchased from Fisher Scientific. Oxygen gas (99.99%) was purchased from
Airgas. All experiments were conducted using deionized (DI) water (>18 MΩ cm).
4.2.2. Catalyst preparation and characterization
The PdAu/Al2O3 pellets and Au/Al2O3 extrudates were crushed using mortar and pestle
and then sieved into finer powders with particle sizes smaller than 300 µm (US standard
50 mesh). The Pd/Al2O3 powder was sieved to 50 mesh particle sizes.
The images of PdAu/Al2O3, Pd/Al2O3, and Au/Al2O3 samples were obtained using
a JEOL 2010 transmission electron microscope (TEM). The samples for TEM were
prepared by depositing droplets of each catalyst as a methanol-suspended powder onto
200-mesh carbon/Formvar TEM grids, and then dried at room temperature (23 °C). The
number-average particle size distribution for each sample was determined by measuring
at least 200 particles using ImageJ program from the National Institutes of Health (NIH).
Each catalyst was analyzed by powder x-ray diffraction (XRD) using a Rigaku
diffractometer with Cu Kα radiation (1.5418 Å). The data was collected from 35° to 90°.
Metal leaching was assessed after the reaction experiments with highest acidity
(pH 2). The liquid was filtered using a 0.2 µm micro fiber syringe filter, and Pd and Au
concentrations were analyzed by ICP-OES.
4.2.3. H2O2 formation and detection
The H2O2 formation reaction using formic acid and O2 (HCOOH + O2 ! H2O2 + CO2)
was conducted using a screw-cap bottle (250 mL, Alltech) as a semi-batch reactor. The
bottle was capped by a Teflon-silicone septum with one stainless steel needle inserted

120!!
into the liquid as the oxygen inlet, and another syringe inserted just above the liquid level
as the oxygen outlet. In a typical experiment, a 0.2 M (~10,000 ppm) formic acid solution
was prepared from formic acid (820 µL) and 100 mL of DI water. As formic acid was
used as a model organic acid compound, the concentration of formic acid was selected in
the possible concentration range of organic acids (<0.001–10,000 ppm) in produced
water.[28] The resulting solution had an initial pH of 2. The reaction temperature was at
room temperature (23 °C) as measured by a thermometer and stirred using a magnetic stir
bar. The catalyst powder (20 mg PdAu/Al2O3, 20 mg of Pd/Al2O3, or 200 mg Au/Al2O3)
was added to the reactor. The reactions of formic acid conversion and H2O2 formation
were too slow to be accurately quantified if the same amount of Au catalyst was used as
PdAu or Pd catalyst. Though 10 times of Au catalyst than the PdAu or Pd catalyst was
used in the reaction, when comparing the different catalyst, the reaction rate constants of
different catalysts were normalized by the amount of catalyst. Oxygen gas - from an
oxygen cylinder was then continuously bubbled into the reactor at 50 mL min-1, and
stirring rate was adjusted to, and maintained at, 1000 rpm marking the start of the
reaction. Aliquots of the reaction fluid (2 mL) were periodically withdrawn by a 5 mL
plastic syringe using a stainless-steel needle, filtered by a 0.2 µm syringe filter (25 mm,
VWR). and stored in the 2 mL microcentrifuge tube at 4 °C prior to analysis.
Solution [H2O2] was quantified by reaction with a titanium(IV) oxysulfate reagent
to produce a yellow solution of pertitanic acid (Ti4+ + H2O2 + 2 H2O ! H2TiO4 + 4 H+).
This solution was quantified using UV-vis at the wavelength of 405 nm. In a typical
experiment, a 1.0 mL aliquot and 50 µL titanium(IV) oxysulfate was added into a capped
quartz cuvette sequentially and then vigorously shaken. The UV-vis spectrum (365-450

121!!
nm) of the solution was recorded and the concentration of H2O2 was calculated indirectly
using a calibration curve of concentration verses absorbance (at 405 nm).
Formic acid concentration in the aliquot was quantified using an Agilent/HP 1100
series system (Cambridge Scientific Product, Watertown, MA, USA) equipped with an
HPX-87H organic acid column (Bio-Rad, Hercules, CA, USA), a refractive index
detector (RID) and a UV detector (210 nm). The operation conditions for the HPLC were
at 30 °C with 5 mM H2SO4 as mobile phase flowing at 0.3 cm3 min-1. Pure reactants were
used for determining their retention times and concentration calibration curves.
The conversion of formic acid as the reactant XHCOOH was defined by:
!!"##! =!!"##!,! − !!"##!
!!"##!,!
where CHCOOH,0 is the initial formic acid concentration and CHCOOH is formic acid
concentration at each sampling time. Reaction kinetics were modeled as a first-order
reaction with respect to the formic acid concentration[23,29,30]:
−!!!"##!!" = !!"#$×!!"##!
The formic acid efficiency (ηHCOOH) in the phenol degradation experiments was
defined by:
!!"##! =!!!!"#$,! − !!!!"#$!!"##!,! − !!"##!
Yield of H2O2 (YH2O2) was defined as:
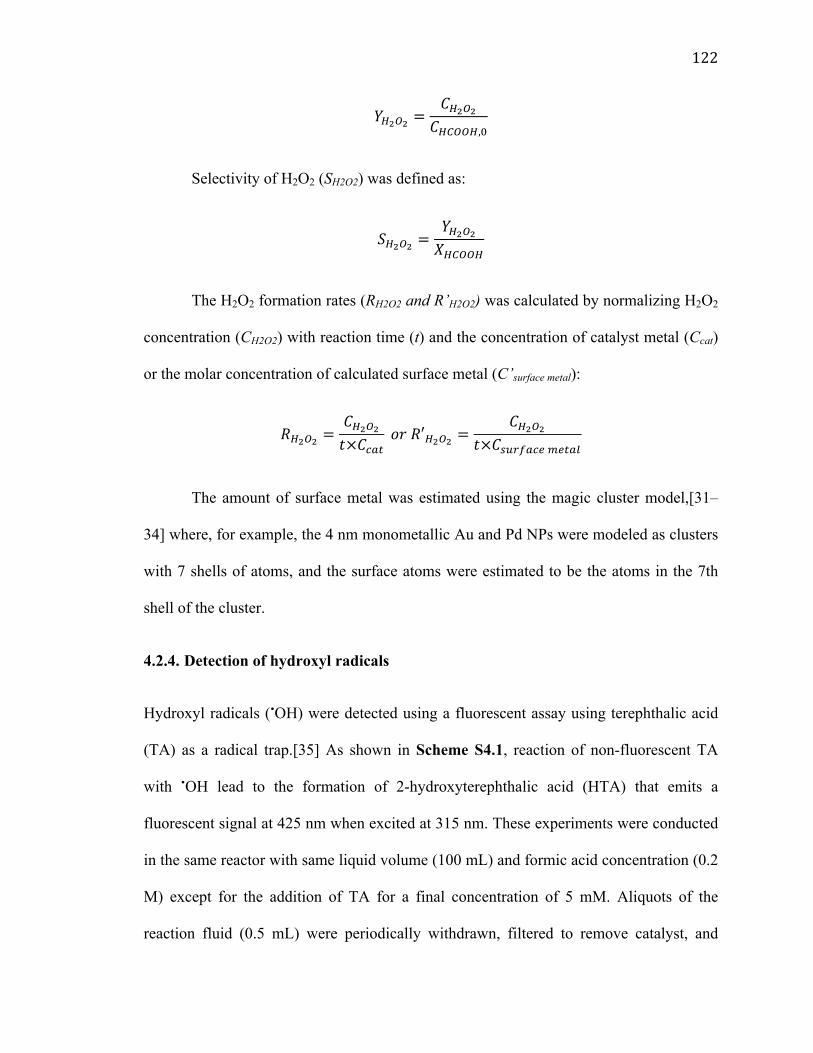
122!!
!!!!! =!!!!!
!!"##!,!
Selectivity of H2O2 (SH2O2) was defined as:
!!!!! =!!!!!!!"##!
The H2O2 formation rates (RH2O2 and R’H2O2) was calculated by normalizing H2O2
concentration (CH2O2) with reaction time (t) and the concentration of catalyst metal (Ccat)
or the molar concentration of calculated surface metal (C’surface metal):
!!!!! =!!!!!!×!!"#
!!"!!′!!!! =!!!!!
!×!!"#$%&'!!"#$%
The amount of surface metal was estimated using the magic cluster model,[31–
34] where, for example, the 4 nm monometallic Au and Pd NPs were modeled as clusters
with 7 shells of atoms, and the surface atoms were estimated to be the atoms in the 7th
shell of the cluster.
4.2.4. Detection of hydroxyl radicals
Hydroxyl radicals ("OH) were detected using a fluorescent assay using terephthalic acid
(TA) as a radical trap.[35] As shown in Scheme S4.1, reaction of non-fluorescent TA
with "OH lead to the formation of 2-hydroxyterephthalic acid (HTA) that emits a
fluorescent signal at 425 nm when excited at 315 nm. These experiments were conducted
in the same reactor with same liquid volume (100 mL) and formic acid concentration (0.2
M) except for the addition of TA for a final concentration of 5 mM. Aliquots of the
reaction fluid (0.5 mL) were periodically withdrawn, filtered to remove catalyst, and
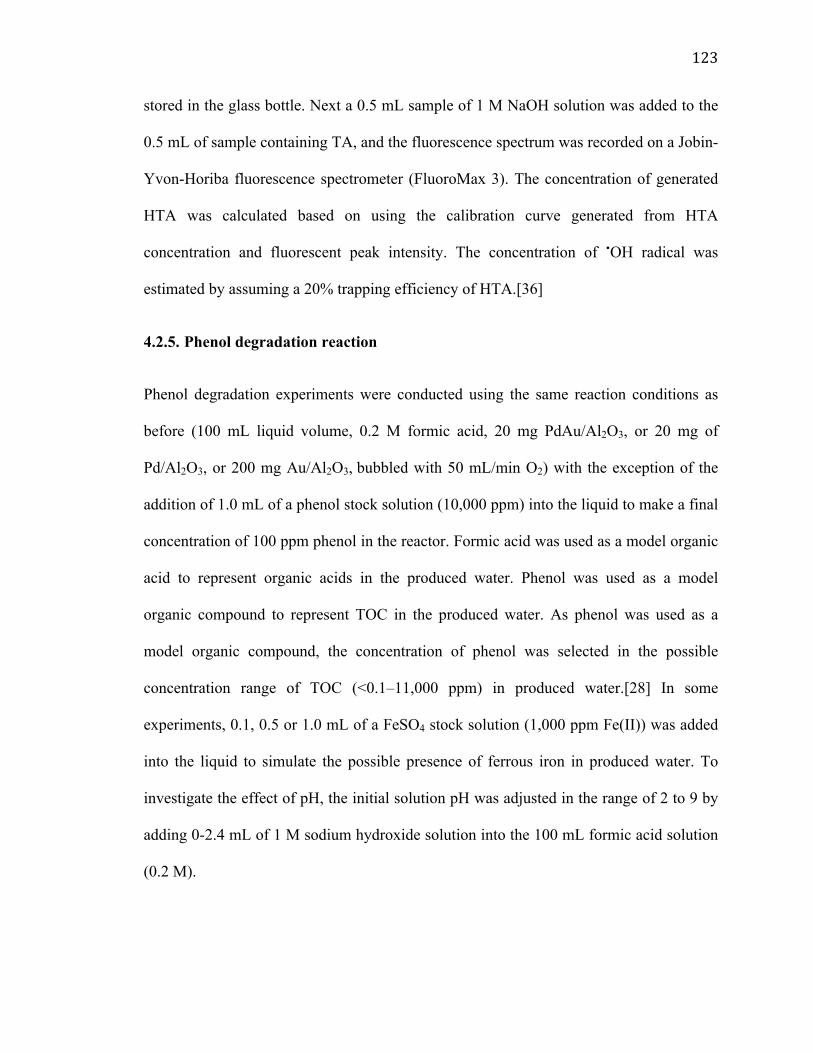
123!!
stored in the glass bottle. Next a 0.5 mL sample of 1 M NaOH solution was added to the
0.5 mL of sample containing TA, and the fluorescence spectrum was recorded on a Jobin-
Yvon-Horiba fluorescence spectrometer (FluoroMax 3). The concentration of generated
HTA was calculated based on using the calibration curve generated from HTA
concentration and fluorescent peak intensity. The concentration of "OH radical was
estimated by assuming a 20% trapping efficiency of HTA.[36]
4.2.5. Phenol degradation reaction
Phenol degradation experiments were conducted using the same reaction conditions as
before (100 mL liquid volume, 0.2 M formic acid, 20 mg PdAu/Al2O3, or 20 mg of
Pd/Al2O3, or 200 mg Au/Al2O3, bubbled with 50 mL/min O2) with the exception of the
addition of 1.0 mL of a phenol stock solution (10,000 ppm) into the liquid to make a final
concentration of 100 ppm phenol in the reactor. Formic acid was used as a model organic
acid to represent organic acids in the produced water. Phenol was used as a model
organic compound to represent TOC in the produced water. As phenol was used as a
model organic compound, the concentration of phenol was selected in the possible
concentration range of TOC (<0.1–11,000 ppm) in produced water.[28] In some
experiments, 0.1, 0.5 or 1.0 mL of a FeSO4 stock solution (1,000 ppm Fe(II)) was added
into the liquid to simulate the possible presence of ferrous iron in produced water. To
investigate the effect of pH, the initial solution pH was adjusted in the range of 2 to 9 by
adding 0-2.4 mL of 1 M sodium hydroxide solution into the 100 mL formic acid solution
(0.2 M).

124!!The salinity of the reaction fluid was varied by dilution of simulated HF-PW. The
simulated HF-PW had a total dissolved solids (TDS) content of ~164,000 ppm and
contains primarily Na+, Cl-, and Ca2+ (Table S4.1). Formic acid, phenol, and degradation
products (catechol) were detected and quantified via HPLC. The possible formation of
hydroquinone was also considered and monitored via HPLC, but none was detected in
any of the reactions.
4.3. Results and discussion
4.3.1. H2O2 and hydroxyl radical generation
Fig. 4.1 shows example TEM images of alumina supported PdAu, Pd, and Au NP
catalysts. The NPs had a relatively uniform size distribution, with similar mean diameters
of 3.7, 2.7, and 3.4 nm and standard deviations of 1.2, 1.0, and 1.8 nm, respectively.
These catalysts were evaluated for the synthesis of H2O2 without any pretreatment.
According to the closest calculated NP size with the actual NP size, the Pd NPs were
modeled as magic clusters with 4 shells (Table S4.2), and Au NPs were modeled as
magic clusters with 6 shells (Table S4.3). PdAu NPs were modeled as clusters with 6
shells with the surface shell having 362 atoms (including Pd and Au). Though XRD
results were not able to distinguish the bimetallic PdAu catalyst structure due to the
overlap of Al2O3, Pd and Au peaks (Fig. S4.1), the unclear structure does not affect the
using of magic cluster model (which based on the size) and the calculations of reaction
rate constants (which based on the catalyst weight or the surface atoms amount).
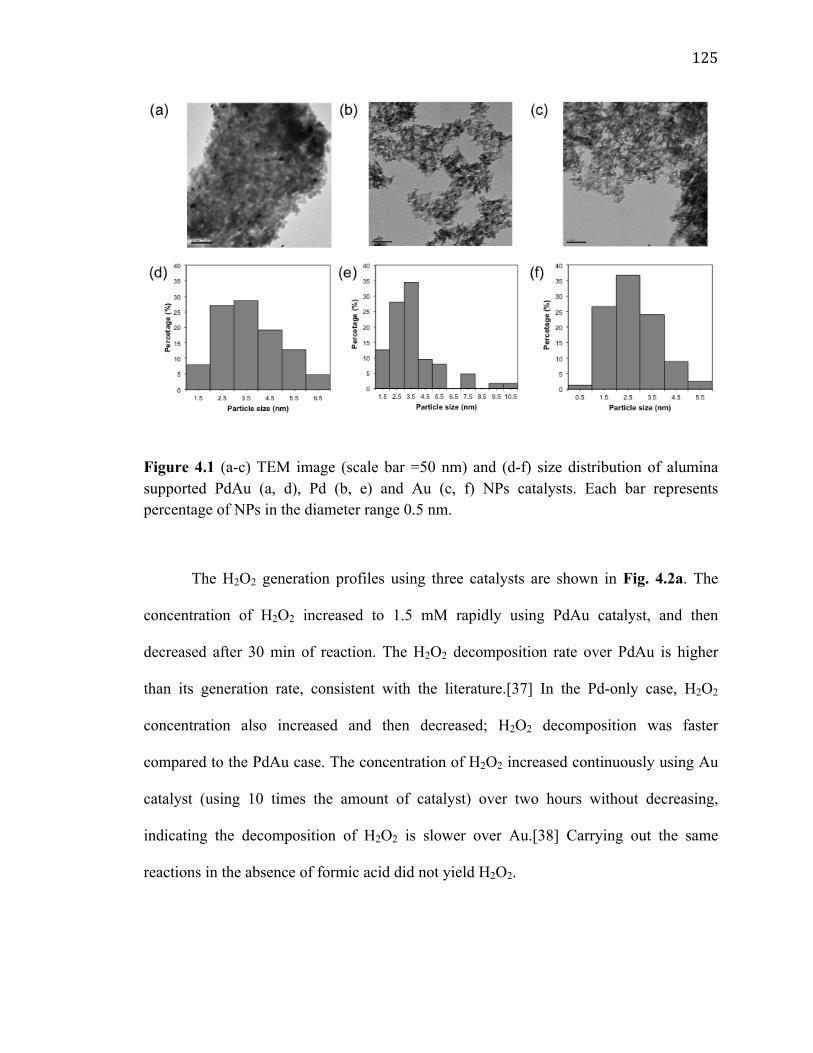
125!!
!
Figure 4.1 (a-c) TEM image (scale bar =50 nm) and (d-f) size distribution of alumina supported PdAu (a, d), Pd (b, e) and Au (c, f) NPs catalysts. Each bar represents percentage of NPs in the diameter range 0.5 nm.
The H2O2 generation profiles using three catalysts are shown in Fig. 4.2a. The
concentration of H2O2 increased to 1.5 mM rapidly using PdAu catalyst, and then
decreased after 30 min of reaction. The H2O2 decomposition rate over PdAu is higher
than its generation rate, consistent with the literature.[37] In the Pd-only case, H2O2
concentration also increased and then decreased; H2O2 decomposition was faster
compared to the PdAu case. The concentration of H2O2 increased continuously using Au
catalyst (using 10 times the amount of catalyst) over two hours without decreasing,
indicating the decomposition of H2O2 is slower over Au.[38] Carrying out the same
reactions in the absence of formic acid did not yield H2O2.

126!!
Figure 4.2 Time profiles for (a) H2O2 concentrations, (b) H2O2 formation rates, and (c) formic acid conversion using PdAu, Pd, and Au catalysts. (d) H2O2 selectivity-formic acid conversion plot. Reaction conditions: 20 mg PdAu/Al2O3 or 20 mg Pd/Al2O3 or 200 mg Au/Al2O3, 23 °C, 100 mL, 0.2 M formic acid, 50 mL min-1 O2, and initial pH = 2.
Since the total amounts of metals charged to the batch reactor and the metallic NP
sizes were different, H2O2 formation rates were normalized on a g-metal and also on a
molsurface metal basis calculated from magic cluster model. H2O2 formation rate (Fig. 4.2b)
decreased greatly with time in the PdAu and Pd cases, while H2O2 formation rate was low
but steady in the Au case. The initial H2O2 formation rate on a gmetal basis using PdAu
catalyst (2.7 mmol-H2O2 g-metal-1 h-1) was 1.5× lower than that using Pd catalyst (4.3
mmol-H2O2 g-metal-1 h-1), but 27× higher than that using Au catalyst (0.1 mmol-H2O2 g-
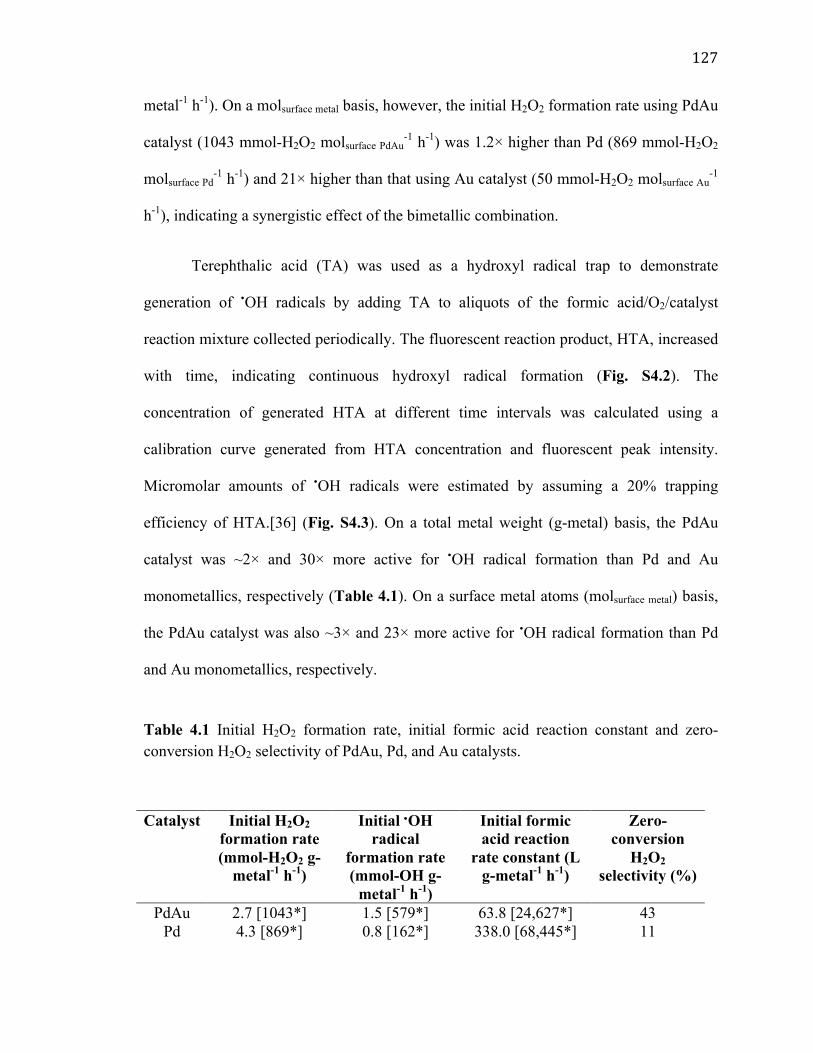
127!!
metal-1 h-1). On a molsurface metal basis, however, the initial H2O2 formation rate using PdAu
catalyst (1043 mmol-H2O2 molsurface PdAu-1 h-1) was 1.2× higher than Pd (869 mmol-H2O2
molsurface Pd-1 h-1) and 21× higher than that using Au catalyst (50 mmol-H2O2 molsurface Au
-1
h-1), indicating a synergistic effect of the bimetallic combination.
Terephthalic acid (TA) was used as a hydroxyl radical trap to demonstrate
generation of "OH radicals by adding TA to aliquots of the formic acid/O2/catalyst
reaction mixture collected periodically. The fluorescent reaction product, HTA, increased
with time, indicating continuous hydroxyl radical formation (Fig. S4.2). The
concentration of generated HTA at different time intervals was calculated using a
calibration curve generated from HTA concentration and fluorescent peak intensity.
Micromolar amounts of "OH radicals were estimated by assuming a 20% trapping
efficiency of HTA.[36] (Fig. S4.3). On a total metal weight (g-metal) basis, the PdAu
catalyst was ~2× and 30× more active for "OH radical formation than Pd and Au
monometallics, respectively (Table 4.1). On a surface metal atoms (molsurface metal) basis,
the PdAu catalyst was also ~3× and 23× more active for "OH radical formation than Pd
and Au monometallics, respectively.
Table 4.1 Initial H2O2 formation rate, initial formic acid reaction constant and zero-conversion H2O2 selectivity of PdAu, Pd, and Au catalysts.
Catalyst Initial H2O2 formation rate (mmol-H2O2 g-
metal-1 h-1)
Initial "OH radical
formation rate (mmol-OH g-
metal-1 h-1)
Initial formic acid reaction
rate constant (L g-metal-1 h-1)
Zero-conversion
H2O2 selectivity (%)
PdAu 2.7 [1043*] 1.5 [579*] 63.8 [24,627*] 43 Pd 4.3 [869*] 0.8 [162*] 338.0 [68,445*] 11
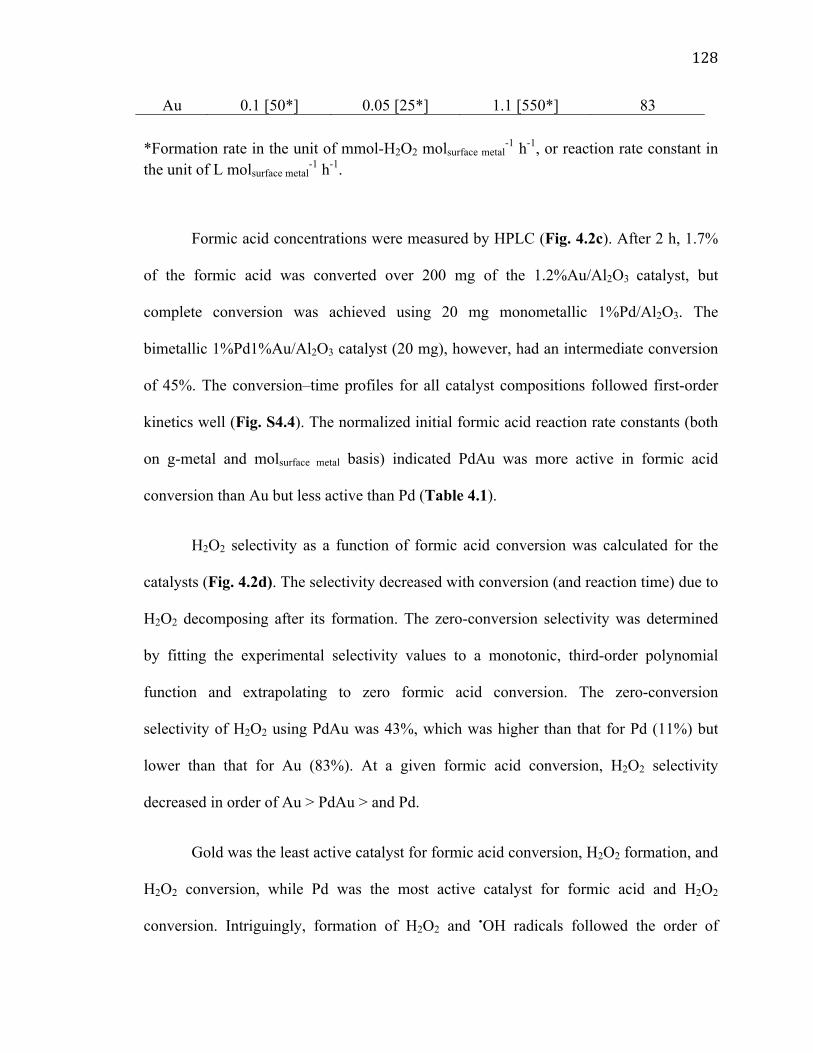
128!!
Au 0.1 [50*] 0.05 [25*] 1.1 [550*] 83
*Formation rate in the unit of mmol-H2O2 molsurface metal-1 h-1, or reaction rate constant in
the unit of L molsurface metal-1 h-1.
Formic acid concentrations were measured by HPLC (Fig. 4.2c). After 2 h, 1.7%
of the formic acid was converted over 200 mg of the 1.2%Au/Al2O3 catalyst, but
complete conversion was achieved using 20 mg monometallic 1%Pd/Al2O3. The
bimetallic 1%Pd1%Au/Al2O3 catalyst (20 mg), however, had an intermediate conversion
of 45%. The conversion–time profiles for all catalyst compositions followed first-order
kinetics well (Fig. S4.4). The normalized initial formic acid reaction rate constants (both
on g-metal and molsurface metal basis) indicated PdAu was more active in formic acid
conversion than Au but less active than Pd (Table 4.1).
H2O2 selectivity as a function of formic acid conversion was calculated for the
catalysts (Fig. 4.2d). The selectivity decreased with conversion (and reaction time) due to
H2O2 decomposing after its formation. The zero-conversion selectivity was determined
by fitting the experimental selectivity values to a monotonic, third-order polynomial
function and extrapolating to zero formic acid conversion. The zero-conversion
selectivity of H2O2 using PdAu was 43%, which was higher than that for Pd (11%) but
lower than that for Au (83%). At a given formic acid conversion, H2O2 selectivity
decreased in order of Au > PdAu > and Pd.
Gold was the least active catalyst for formic acid conversion, H2O2 formation, and
H2O2 conversion, while Pd was the most active catalyst for formic acid and H2O2
conversion. Intriguingly, formation of H2O2 and "OH radicals followed the order of

129!!
PdAu > Pd > Au on a molsurface metal basis. All three catalysts were stable with no metal
leaching during the reaction according to the ICP measurement.
To understand how the bimetallic catalyst performs differently form the
monometallics, we considered the related reaction of hydrogen production from formic
acid. PdAu bimetallic catalysts have enhanced selectivity to hydrogen compared with Pd,
which is due to the geometric effect of the bimetallic catalyst.[23,24] Formate adsorbs on
the Pd ensembles on Au (or the PdAu neighboring interfacial sites) in a bridge form,
which favors formic acid dehydrogenation (HCOOH ! CO2 + H2) and not the undesired
dehydration pathway (HCOOH ! CO + H2O).[39] We further considered the mechanism
of the direct synthesis of H2O2 from H2 and O2. Pd dissociates H2 while Au adsorbs the
O2, which then hydrogenates to form H2O2 via spillover of H adatoms.[40]
We propose a reaction mechanism for the H2O2 generation through formic acid
oxidation on a PdAu catalyst surface (Scheme 4.1). Formic acid decomposes to adsorbed
hydrogen atoms and CO2 through a HCOO intermediate on the PdAu catalyst surface,
and the adsorbed dioxygen is hydrogenated sequentially by the surface hydrogen to H2O2
through a "OOH intermediate. The "OOH intermediate can further dissociate to form
surface "OH radicals. "OH could be generated from H2O2 decomposition on Au
nanoparticles through a redox cycle (Au0 +H2O2 ! "OH + OH- + Au+; Au+ + H2O2 !
"OOH + H+ +Au0).[41]

130!!
!
Scheme 4.1 Proposed reaction mechanism of formic acid decomposition, surface •OH radical and H2O2 formation PdAu catalyst surfaces
4.3.2. Phenol degradation
PdAu catalyst was tested for the phenol degradation using the same system with Pd and
Au as a control. As shown in the Fig. 4.3a, the phenol concentration decreased ~16%
after 8 h of reaction time and using PdAu catalyst, while the concentration of the product
catechol increased. The total concentration of phenol and catechol decreased and more
peaks showed up in the HPLC spectra (Fig. S4.5), indicating the presence of other
oxidized products, including small organic acids such as acetic acid and oxalic acid.

131!!
Figure 4.3 (a, c, e) Phenol and catechol concentration profiles using (a) PdAu, (c) Pd and (e) Au catalysts; (b, d, f) formic acid and H2O2 concentration profiles using (b) PdAu, (d) Pd and (f) Au catalysts. Reaction conditions: 50 mg PdAu/Al2O3, or 50 mg Pd/Al2O3 or 200 mg PdAu/Al2O3, 23 °C, 100 mL, 0.2 M formic acid, 100 ppm phenol, 50 mL min-1 O2, and initial pH = 2.

132!!The concentrations of formic acid and H2O2 were also measured (Fig. 4.3b). The
formic acid concentration decreased ~90% in 8 hours with a normalized reaction rate
constant of 30.8 L g-metal-1 h-1 (or 11,889 molsurface metal-1 h-1). The reaction constant was
twice as low as compared to that without phenol, which is possibly due to active site
competition between phenol and formic acid. The concentration of H2O2 increased and
then decreased, following the same pattern as the previous case (without phenol
addition). However, the decomposition of H2O2 was slower, which may also be attributed
to the active site competition between phenol and H2O2. Fig. 4.3 shows a 16% conversion
of phenol converted with a 29% generated H2O2 remaining unreacted. Control
experiments conducted by mixing H2O2 (2 mM or 155 mM), phenol and PdAu catalyst.
In the control experiment using the same amount of bulk H2O2 (~2 mM) as the in-situ
generated H2O2 (~2 mM), no phenol degradation was observed. To confirm that H2O2 is
ineffective to degrade phenol, the amount of H2O2 was increased to 155 mM by assuming
~75 mol% of formic acid (200 mM) converted to H2O2 (155 mM). The high
concentration of H2O2 case showed H2O2 is indeed ineffective in phenol degradation in
our system (Fig. S4.6). Another control experiment of phenol degradation using catalyst
and oxygen without formic acid or H2O2 showed no degradation over eight hours, which
suggested oxygen was not capable to oxidize phenol with PdAu catalysts in atmospheric
pressure and room temperature.
The reactant and product profiles were observed using the monometallic Pd (Fig.
4.3c and 4.3d) were similar to those using PdAu catalyst. In contrast, the H2O2 generation
profile (Fig. 4.3e) of the monometallic Au catalyst showed a continuous increase in
concentration, which indicated that H2O2 decomposition is much slower using the Au

133!!
catalyst. This pattern matched with the H2O2 generation experiment in absence of phenol
(Fig. 4.2a).
Table 4.2 summarizes the phenol degradation reaction rate constants and formic
acid reaction rate constants for the three catalysts. The PdAu catalyst showed the highest
phenol degradation reaction rate constant, correlating to the highest •OH radical
formation rate (Table 4.1). The generated highly reactive •OH radicals immediately
reacted with excessive amount of phenol to form catechol. The efficiency of the H2O2
using PdAu catalyst (321.4%) is highest, followed by Au (133.3%) and Pd (17.6%)
catalysts (Table S4.4). The calculated efficiency is larger than 100% because some H2O2
reacted as it formed and therefore cannot be measured ex-situ. The percentage decrease in
initial formic acid reaction rate constant may be attributed to the active site competition
between phenol and formic acid. Significant formic acid reaction rate constant decrease
(~81%) using Pd catalyst indicates stronger adsorption for phenol than for formic acid.
The presence of phenol did not affect the formic acid reaction using Au catalyst,
indicating negligible active site competition between phenol and formic acid on Au
surface. The bimetallic PdAu catalyst showed intermediate formic acid reaction rate
decrease compared with monometallics.
Table 4.2 Initial phenol degradation reaction constant, initial formic acid decomposition reaction constant and formic acid utilization efficiency of PdAu, Pd, and Au catalysts.
Catalyst Initial phenol degradation reaction rate constant (L g-metal-1 h-1)
Initial formic acid reaction rate constant (L g-metal-1 h-1)
PdAu 7.5 [2895*] 30.8 [11,889*] [~52% decrease**] Pd 1.8 [365*] 63.4 [12,856*] [~81%**] Au 0.5 [250*] 1.2 [600*] [~0%**]
134!!
*Reaction rate constant in the unit of L molsurface metal
-1 h-1. **Percentage decrease in initial formic acid reaction rate constant, in the presence of phenol
4.3.3. Effect of ferrous iron
Iron is one of the common cations present in HF-PW.[6] Both ferrous and ferric cations
(Fe(II) and Fe(III), respectively) come mainly from the dissolution of Fe(II)-containing
minerals and the corrosion of carbon steel tubing depending on the water pH.[42] Due to
the highly anoxic conditions downhole, most of the iron remains as Fe(II) ions. The
concentration of iron can vary from a few ppm to several thousand ppm based on
reservoir geochemistry, type of hydrocarbon produced, water pH, and characteristics of
the production well.[43] We expect Fenton chemistry to occur in our reaction system if
Fe(II) is present, which would convert the in situ generated H2O2 into OH radicals at low
pH, thus increasing phenol degradation.[44]
The phenol degradation rates were significantly enhanced with the addition of
ferrous iron (Fig. S4.7). After 8 h, phenol degradation increased from 6.1% to 41.2%
after the addition of 1 ppm ferrous iron with 20 mg PdAu/Al2O3. Similar improvement
was found using 20 mg Pd/Al2O3 (2.2% to 33.2%) and 200 mg Au/Al2O3 (11.7% to
56.4%). The PdAu catalyst showed lower phenol degradation rate than Pd catalyst,
because H2O2 formation rate was higher in the Pd case and the H2O2 was activated by the
ferrous iron to generate additional OH radicals.
The phenol degradation reaction rate constants of PdAu, Pd, and Au catalytic
systems with different concentration of ferrous iron are shown in Fig. 4.4 (on a g-metal

135!!
basis) and Fig. S4.8 (on a molsurface metal basis). Ferrous iron concentration increased the
phenol degradation rate constants for the PdAu and Au catalysts, but it increased to a
much greater extent the phenol degradation rate for the Pd catalyst.
The formic acid conversion of PdAu, Pd, and Au catalytic systems with different
concentration of ferrous iron are shown in Fig. S4.9. The presence of iron sulfate
significantly suppressed the formic acid conversion due to the active sites blocked by the
iron sulfate, while it increased the formic acid efficiency η (Table S4.5). The formic acid
efficiency is highest in the PdAu system in absence of Fe(II) while the formic acid
efficiency is highest in the Au system in presence of Fe(II).
!
Figure 4.4 Phenol degradation reaction constant (on a g-metal basis) in PdAu, Pd, and Au catalytic systems with the presence of different concentration of ferrous iron. Reaction conditions: 20 mg PdAu/Al2O3 or 20 mg Pd/Al2O3 or 200 mg Au/Al2O3, 23 °C, 100 mL, 0.2 M formic acid, 100 ppm phenol, 0-10 ppm Fe(II), 50 mL min-1 O2, and initial pH = 2.
4.3.4. Effect of pH and salinity
The common pH range in the HF-PW is 5 to 9. To test if our system can work in this pH
range, we increased the solution pH by sodium hydroxide addition. As shown in the Fig.

136!!
4.5a, the reaction pH significantly decreased phenol degradation rate; no degradation was
observed above pH 4. As expected, we observed ferrous iron precipitation in the pH
range of 4 to 9, which made the system unable to induce Fenton chemistry.
!
Figure 4.5 Initial phenol degradation reaction rate constant on a g-metal basis (kcat) in water ([TDS]~0 mg/L) (a) at different pH and (b) with different TDS concentrations (corresponding to 1×, 10×, 102×, 103×, 104×, 105×, and 106× dilutions of simulated HF-PW stock solution). Reaction conditions: 20 mg PdAu/Al2O3 or 20 mg Pd/Al2O3 or 200 mg Au/Al2O3, 23 °C, 100 mL, 0.2 M formic acid, 100 ppm phenol, 5 ppm Fe(II), 50 mL min-1 O2.
We next challenged our reaction system by increasing the salinity of the reaction
liquid, while testing at pH 2. The initial phenol degradation reaction constant versus TDS
concentration are shown in Fig. 4.5b (on a g-metal basis) and Fig. S4.10 (on a molsurface
metal basis). The salt concentration significantly suppressed the phenol degradation for the
tested three catalytic systems. No catalysis was detected at the highest salinity value
tested (164,000 ppm). The reason for the reaction rate decrease may be due to the active
site inhibited by adsorption of anions (especially chloride).[45–47]

137!!The Pd-catalyzed phenol degradation rate decreased continuously with increasing
TDS concentration. When the TDS concentration reached 16,400 ppm, Pd was inactive.
The Au-catalyzed phenol degradation rate was comparatively the lowest. It showed some
activity at 16,400 ppm, indicating that Au was more resistant to salt (e.g., Cl)
deactivation than Pd.
PdAu presented contrasting behavior. While it was less active than Pd at 1.64
ppm and below, PdAu showed higher activity compared to Pd at 16.4 ppm and up to
16,400 ppm. It was more active than Au at salinities tested up to 1640 ppm. PdAu was
more resistant to the salinity effect than Pd, which may be attributed to the weaker
chloride chemisorption onto the PdAu bimetallic surface as reported previously.[48] This
unexpected deactivation resistance raises questions as to how the bimetallic structure and
composition contribute to this catalyst property.
4.4. Conclusion
Phenol contained in simulated HF-PW of moderate salinities can be oxidatively degraded
at room temperature and atmospheric pressure, using a combination of oxygen, formic
acid and catalyst (PdAu/Al2O3, Pd/Al2O3, or Au/Al2O3). PdAu/Al2O3 was found to be the
most active catalyst for phenol degradation due to its ability to generate "OH radical most
rapidly. Ferrous ion can improve the generation of •OH radicals which increased the
phenol degradation rate. The bimetallic composition provides improved deactivation
resistance to salinity, as demonstrated by the higher degradation rate of PdAu/Al2O3
compared to that of Pd/Al2O3 and Au/Al2O3. Only one bimetallic composition was tested
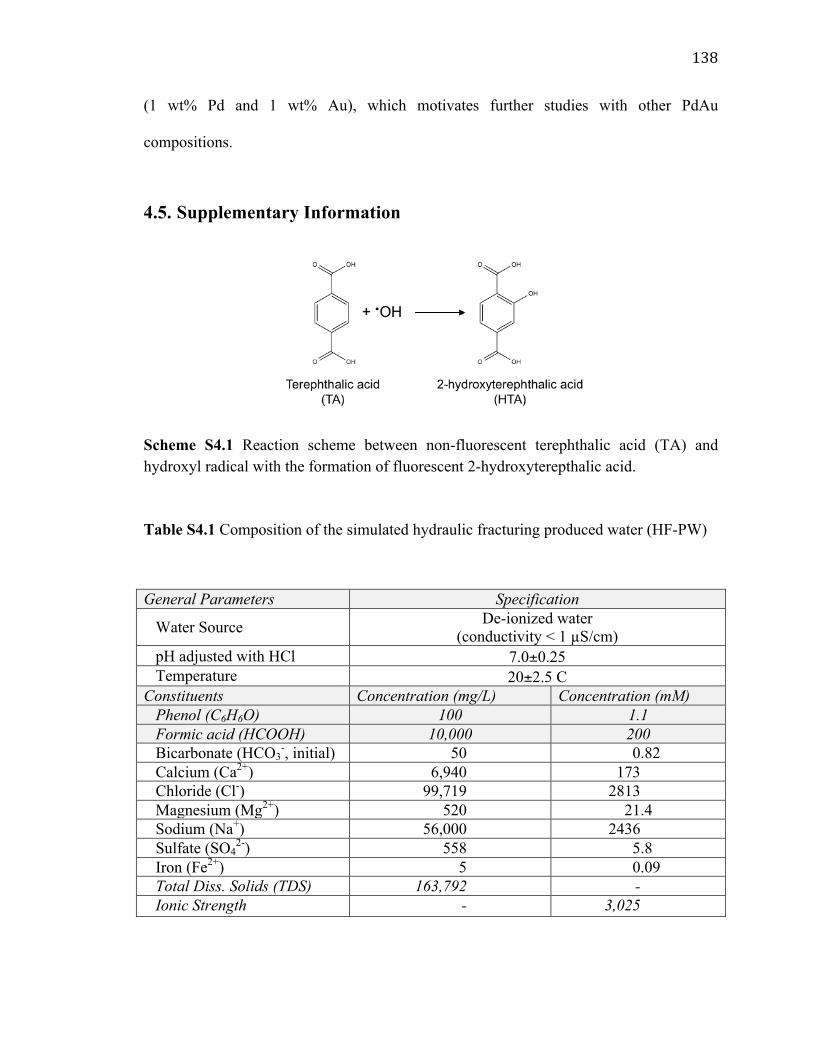
138!!
(1 wt% Pd and 1 wt% Au), which motivates further studies with other PdAu
compositions.
4.5. Supplementary Information
Scheme S4.1 Reaction scheme between non-fluorescent terephthalic acid (TA) and hydroxyl radical with the formation of fluorescent 2-hydroxyterepthalic acid. Table S4.1 Composition of the simulated hydraulic fracturing produced water (HF-PW)
General Parameters Specification
Water Source De-ionized water (conductivity < 1 µS/cm)
pH adjusted with HCl 7.0±0.25 Temperature 20±2.5 C
Constituents Concentration (mg/L) Concentration (mM) Phenol (C6H6O) 100 1.1 Formic acid (HCOOH) 10,000 200 Bicarbonate (HCO3
-, initial) 50 0.82 Calcium (Ca2+) 6,940 173 Chloride (Cl-) 99,719 2813 Magnesium (Mg2+) 520 21.4 Sodium (Na+) 56,000 2436 Sulfate (SO4
2-) 558 5.8 Iron (Fe2+) 5 0.09 Total Diss. Solids (TDS) 163,792 - Ionic Strength - 3,025
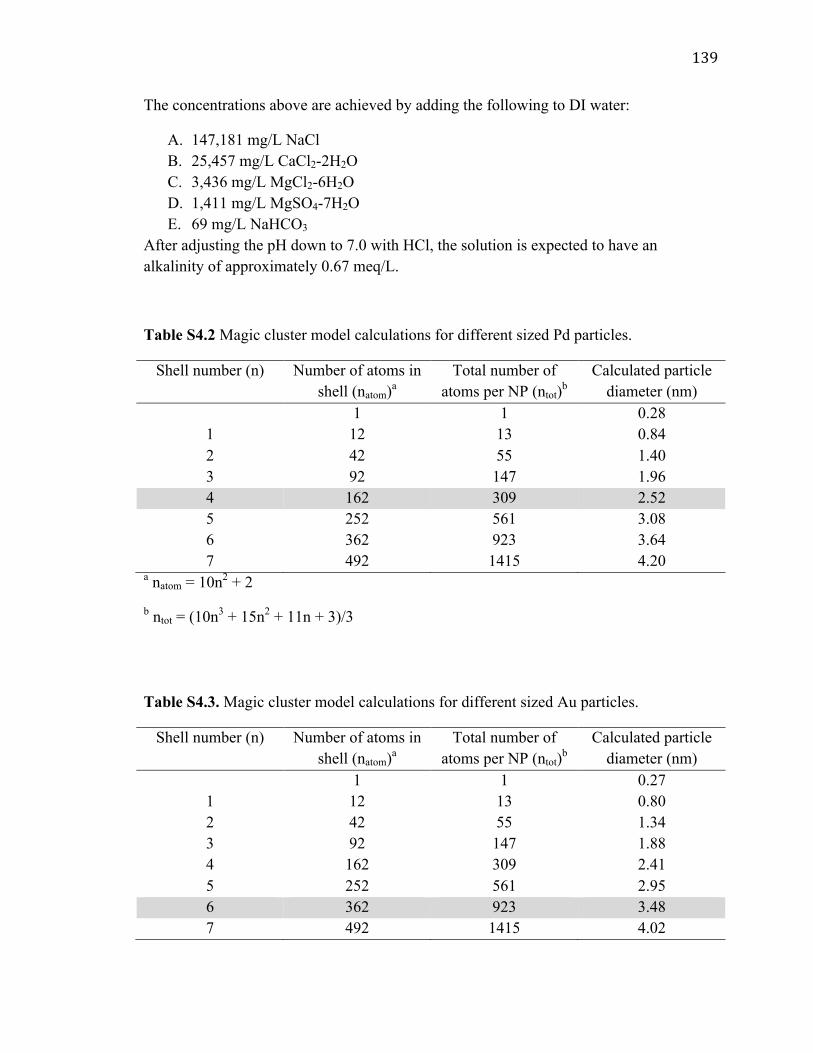
139!!
The concentrations above are achieved by adding the following to DI water:
A. 147,181 mg/L NaCl B. 25,457 mg/L CaCl2-2H2O C. 3,436 mg/L MgCl2-6H2O D. 1,411 mg/L MgSO4-7H2O E. 69 mg/L NaHCO3
After adjusting the pH down to 7.0 with HCl, the solution is expected to have an alkalinity of approximately 0.67 meq/L.
Table S4.2 Magic cluster model calculations for different sized Pd particles.
Shell number (n) Number of atoms in shell (natom)a
Total number of atoms per NP (ntot)b
Calculated particle diameter (nm)
1 1 0.28 1 12 13 0.84 2 42 55 1.40 3 92 147 1.96 4 162 309 2.52 5 252 561 3.08 6 362 923 3.64 7 492 1415 4.20
a natom = 10n2 + 2
b ntot = (10n3 + 15n2 + 11n + 3)/3
!
Table S4.3. Magic cluster model calculations for different sized Au particles.
Shell number (n) Number of atoms in shell (natom)a
Total number of atoms per NP (ntot)b
Calculated particle diameter (nm)
1 1 0.27 1 12 13 0.80 2 42 55 1.34 3 92 147 1.88 4 162 309 2.41 5 252 561 2.95 6 362 923 3.48 7 492 1415 4.02
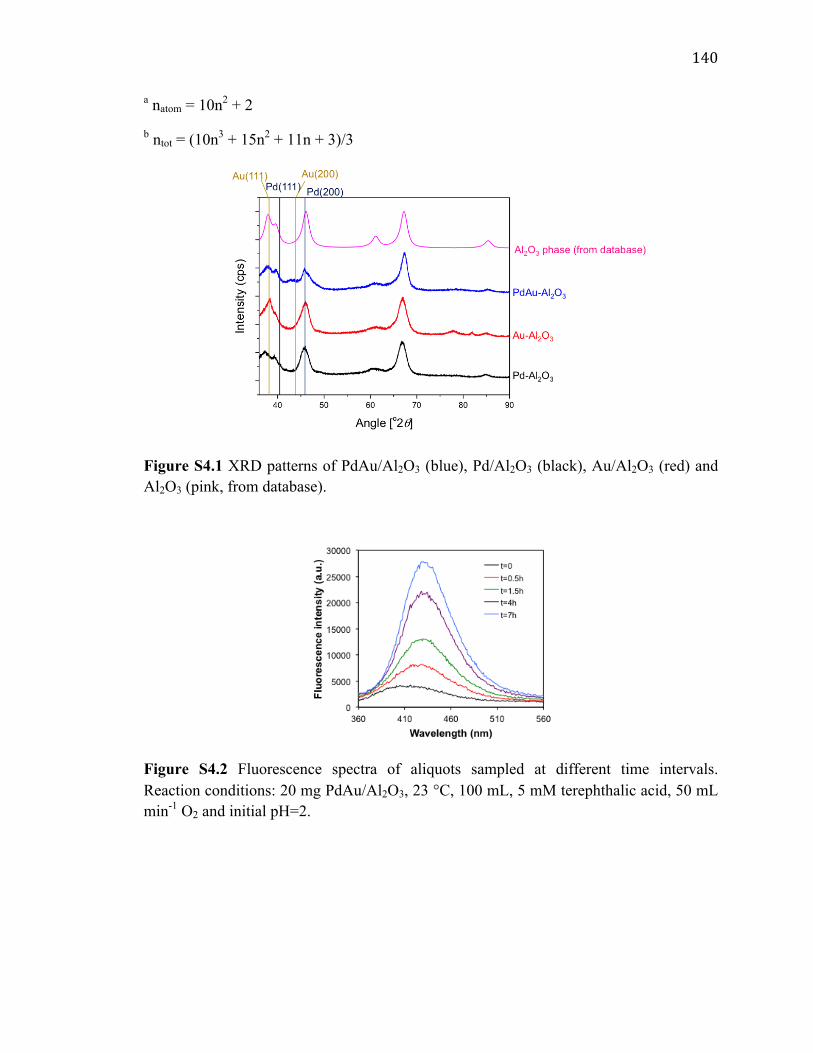
140!!
a natom = 10n2 + 2
b ntot = (10n3 + 15n2 + 11n + 3)/3
!
Figure S4.1 XRD patterns of PdAu/Al2O3 (blue), Pd/Al2O3 (black), Au/Al2O3 (red) and Al2O3 (pink, from database).
!
Figure S4.2 Fluorescence spectra of aliquots sampled at different time intervals. Reaction conditions: 20 mg PdAu/Al2O3, 23 °C, 100 mL, 5 mM terephthalic acid, 50 mL min-1 O2 and initial pH=2.

141!!
!
Figure S4.3 Estimated •OH generation profile (•OH trapping efficiency ~20%). Reaction conditions: 20 mg 1%Pd1%Au/Al2O3, 23 °C, 100 mL, 5 mM terephthalic acid, 50 mL min-1 O2 and initial pH=2. !
!Figure S4.4 Plot of ln(C/C0) vs. time for PdAu/Al2O3, Pd/Al2O3, and Au/Al2O3 catalysts. Solid lines are the fitted values to the reaction profiles using 1st order kinetics for each catalyst. !
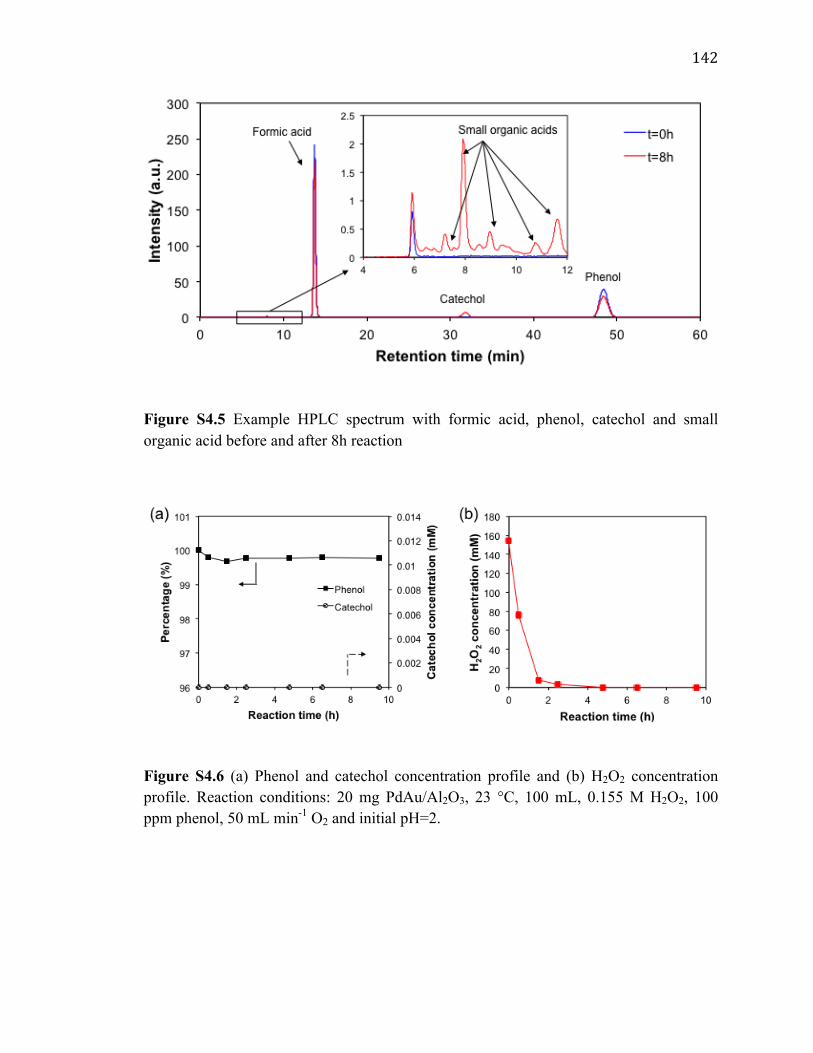
142!!
!
Figure S4.5 Example HPLC spectrum with formic acid, phenol, catechol and small organic acid before and after 8h reaction
!
Figure S4.6 (a) Phenol and catechol concentration profile and (b) H2O2 concentration profile. Reaction conditions: 20 mg PdAu/Al2O3, 23 °C, 100 mL, 0.155 M H2O2, 100 ppm phenol, 50 mL min-1 O2 and initial pH=2.
!

143!!
Table S4.4 Efficiency of H2O2 in the phenol degradation using the alumina supported PdAu, Pd and Au catalysts.
Catalyst Efficiency of H2O2 (%) PdAu/Al2O3 321.4
Pd/Al2O3 17.6 Au/Al2O3 133.3
!
!
Figure S4.7 Phenol degradation profile at different ferrous ion concentrations using (a) 20 mg PdAu/Al2O3, (b) 20 mg Pd/Al2O3, and (c) 200 mg Au/Al2O3. Reaction conditions: 23 °C, 100 mL, 0.2 M formic acid, 100 ppm phenol, 50 mL min-1 O2 and initial pH=2.
!
Figure S4.8 Phenol degradation reaction constant normalized by surface metal atoms (k'cat) in PdAu, Pd, and Au catalytic systems with the presence of different concentration of ferrous iron. Reaction conditions: 20 mg PdAu/Al2O3 or 20 mg Pd/Al2O3 or 200 mg

144!!
Au/Al2O3, 23 °C, 100 mL, 0.2 M formic acid, 100 ppm phenol, 0-10 ppm Fe(II), 50 mL min-1 O2, and initial pH = 2.
!
Figure S4.9 Formic acid conversion profile using (a) 20 mg PdAu/Al2O3, (b) 20 mg Pd/Al2O3, and (c) 200 mg Au/Al2O3. Reaction conditions: 23 °C, 100 mL, 0.2 M formic acid, 100 ppm phenol, 50 mL min-1 O2 and initial pH=2.
!
Table S4.5 Formic acid efficiency in PdAu, Pd and Au systems with 0 ppm, 1 ppm, 5 ppm and 10 ppm Fe(II)
Catalyst ηHCOOH with 0 ppm Fe(II) (%)
ηHCOOH with 1 ppm Fe(II) (%)
ηHCOOH with 5 ppm Fe(II) (%)
ηHCOOH with 10 ppm Fe(II) (%)
PdAu/Al2O3 0.07 0.83 1.91 2.00 Pd/Al2O3 0.01 1.36 2.67 3.40 Au/Al2O3 0.25 3.06 3.50 3.61
!

145!!
!
Figure S4.10 Initial phenol degradation reaction rate constant normalized by surface metal atoms (k’cat) in water ([TDS]~0 mg/L) (a) at different pH and (b) with different TDS concentrations (corresponding to 1×, 10×, 102×, 103×, 104×, 105×, and 106× dilutions of simulated HF-PW stock solution). Reaction conditions: 20 mg PdAu/Al2O3 or 20 mg Pd/Al2O3 or 200 mg Au/Al2O3, 23 °C, 100 mL, 0.2 M formic acid, 100 ppm phenol, 5 ppm Fe(II), 50 mL min-1 O2.
4.6. Reference
[1] United States Environmental Protection Agency, Hydraulic Fracturing for Oil and Gas: Impacts from the Hydraulic Fracturing Water Cycle on Drinking Water Resources in the United States, 2016. doi:EPA-600-R-16-236ES.
[2] R. Barati, J.-T. Liang, A review of fracturing fluid systems used for hydraulic fracturing of oil and gas wells, J. Appl. Polym. Sci. 131 (2014) n/a-n/a. doi:10.1002/app.40735.
[3] B.R. Scanlon, R.C. Reedy, J.-P. Nicot, Comparison of water use for hydraulic fracturing for unconventional oil and gas versus conventional oil, Environ. Sci. Technol. 48 (2014) 12386–12393. doi:10.1021/es502506v.
[4] J.M. Estrada, R. Bhamidimarri, A review of the issues and treatment options for wastewater from shale gas extraction by hydraulic fracturing, Fuel. 182 (2016) 292–303. doi:10.1016/J.FUEL.2016.05.051.
[5] A. Murali Mohan, A. Hartsock, K.J. Bibby, R.W. Hammack, R.D. Vidic, K.B. Gregory, Microbial community changes in hydraulic fracturing fluids and produced water from shale gas extraction, Environ. Sci. Technol. 47 (2013) 13141–13150. doi:10.1021/es402928b.
[6] K. Gregory, A.M. Mohan, Current perspective on produced water management

146!!
challenges during hydraulic fracturing for oil and gas recovery, Environ. Chem. 12 (2015) 261–266. doi:10.1071/EN15001.
[7] K.B. Gregory, R.D. Vidic, D.A. Dzombak, Water Management Challenges Associated with the Production of Shale Gas by Hydraulic Fracturing, Elements. 7 (2011) 181–186. doi:10.2113/gselements.7.3.181.
[8] J. Veil, U.S. Produced Water Volumes and Management Practices in 2012, 2015. http://www.gwpc.org/sites/default/files/Produced Water Report 2014-GWPC_0.pdf (accessed June 22, 2018).
[9] A. Fakhru’l-Razi, A. Pendashteh, L.C. Abdullah, D.R.A. Biak, S.S. Madaeni, Z.Z. Abidin, Review of technologies for oil and gas produced water treatment, J. Hazard. Mater. 170 (2009) 530–551. doi:10.1016/J.JHAZMAT.2009.05.044.
[10] E.T. Igunnu, G.Z. Chen, Produced water treatment technologies, Int. J. Low-Carbon Technol. 9 (2014) 157–177. doi:10.1093/ijlct/cts049.
[11] A. Szép, R. Kohlheb, Water treatment technology for produced water, Water Sci. Technol. 62 (2010) 2372. doi:10.2166/wst.2010.524.
[12] S. Shokrollahzadeh, F. Golmohammad, N. Naseri, H. Shokouhi, M. Arman-mehr, Chemical Oxidation for Removal of Hydrocarbons from Gas–Field Produced Water, Procedia Eng. 42 (2012) 942–947. doi:10.1016/J.PROENG.2012.07.487.
[13] E.V. dos Santos, S.F.M. Sena, D.R. da Silva, S. Ferro, A. De Battisti, C.A. Martínez-Huitle, Scale-up of electrochemical oxidation system for treatment of produced water generated by Brazilian petrochemical industry, Environ. Sci. Pollut. Res. 21 (2014) 8466–8475. doi:10.1007/s11356-014-2779-x.
[14] Y. Ma, B. Chen, B. Zhang, J. Zheng, B. Liu, H. Zhang, Fenton Oxidation Process for Remediation of Produced Water Containing Polycyclic Aromatic Hydrocarbons, (2014) 1–10.
[15] R.S. Ribeiro, A.M.T. Silva, J.L. Figueiredo, J.L. Faria, H.T. Gomes, Catalytic wet peroxide oxidation: a route towards the application of hybrid magnetic carbon nanocomposites for the degradation of organic pollutants. A review, Appl. Catal. B Environ. 187 (2016) 428–460. doi:10.1016/J.APCATB.2016.01.033.
[16] J. Radjenovic, D.L. Sedlak, Challenges and Opportunities for Electrochemical Processes as Next-Generation Technologies for the Treatment of Contaminated Water, Environ. Sci. Technol. 49 (2015) 11292–11302. doi:10.1021/acs.est.5b02414.
[17] E.G. Alvarez, D. Amedro, C. Afif, S. Gligorovski, C. Schoemaecker, C. Fittschen, J.-F. Doussin, H. Wortham, Unexpectedly high indoor hydroxyl radical concentrations associated with nitrous acid, Proc. Natl. Acad. Sci. 110 (2013) 13294–13299. doi:10.1073/PNAS.1308310110.
[18] J. Barrault, C. Bouchoule, K. Echachoui, N. Frini-Srasra, M. Trabelsi, F. Bergaya,

147!!
Catalytic wet peroxide oxidation (CWPO) of phenol over mixed (AlCu)-pillared clays, Appl. Catal. B Environ. 15 (1998) 269–274. doi:10.1016/S0926-3373(97)00054-4.
[19] M.S. Yalfani, S. Contreras, F. Medina, J. Sueiras, Direct generation of hydrogen peroxide from formic acid and O2 using heterogeneous Pd/γ-Al2O3 catalysts, Chem. Commun. 0 (2008) 3885. doi:10.1039/b803149e.
[20] M.S. Yalfani, S. Contreras, F. Medina, J. Sueiras, Phenol degradation by Fenton’s process using catalytic in situ generated hydrogen peroxide, Appl. Catal. B Environ. 89 (2009) 519–526. doi:10.1016/J.APCATB.2009.01.007.
[21] M.S. Yalfani, S. Contreras, J. Llorca, M. Dominguez, J.E. Sueiras, F. Medina, Simultaneous in situ generation of hydrogen peroxide and Fenton reaction over Pd–Fe catalysts, Phys. Chem. Chem. Phys. 12 (2010) 14673. doi:10.1039/c0cp01157f.
[22] Y.-F. Han, N. Phonthammachai, K. Ramesh, Z. Zhong, T. White, Removing Organic Compounds from Aqueous Medium via Wet Peroxidation by Gold Catalysts, Environ. Sci. Technol. 42 (2008) 908–912. doi:10.1021/es071124f.
[23] Z. Zhao, K.N. Heck, P. Limpornpipat, H. Qian, J.T. Miller, M.S. Wong, Hydrogen-generating behavior of Pd-decorated gold nanoparticles via formic acid decomposition, Catal. Today. (2018). doi:10.1016/J.CATTOD.2018.06.044.
[24] W.-Y. Yu, G.M. Mullen, D.W. Flaherty, C.B. Mullins, Selective Hydrogen Production from Formic Acid Decomposition on Pd−Au Bimetallic Surfaces, J. Am. Chem. Soc. (2014). doi:10.1021/ja505192v.
[25] Y. Huang, X. Zhou, M. Yin, C. Liu, W. Xing, Novel PdAu@Au/C Core−Shell Catalyst: Superior Activity and Selectivity in Formic Acid Decomposition for Hydrogen Generation, Chem. Mater. 22 (2010) 5122–5128. doi:10.1021/cm101285f.
[26] X. Gu, Z.-H. Lu, H.-L. Jiang, T. Akita, Q. Xu, Synergistic Catalysis of Metal–Organic Framework-Immobilized Au–Pd Nanoparticles in Dehydrogenation of Formic Acid for Chemical Hydrogen Storage, J. Am. Chem. Soc. 133 (2011) 11822–11825. doi:10.1021/ja200122f.
[27] J.K. Edwards, S.J. Freakley, A.F. Carley, C.J. Kiely, G.J. Hutchings, Strategies for Designing Supported Gold–Palladium Bimetallic Catalysts for the Direct Synthesis of Hydrogen Peroxide, Acc. Chem. Res. 47 (2014) 845–854. doi:10.1021/ar400177c.
[28] J. Neff, K. Lee, E.M. DeBlois, Produced Water: Overview of Composition, Fates, and Effects, in: Prod. Water, Springer New York, New York, NY, 2011: pp. 3–54. doi:10.1007/978-1-4614-0046-2_1.
[29] N. Aas, Y. Li, M. Bowker, The adsorption and decomposition of formic acid on
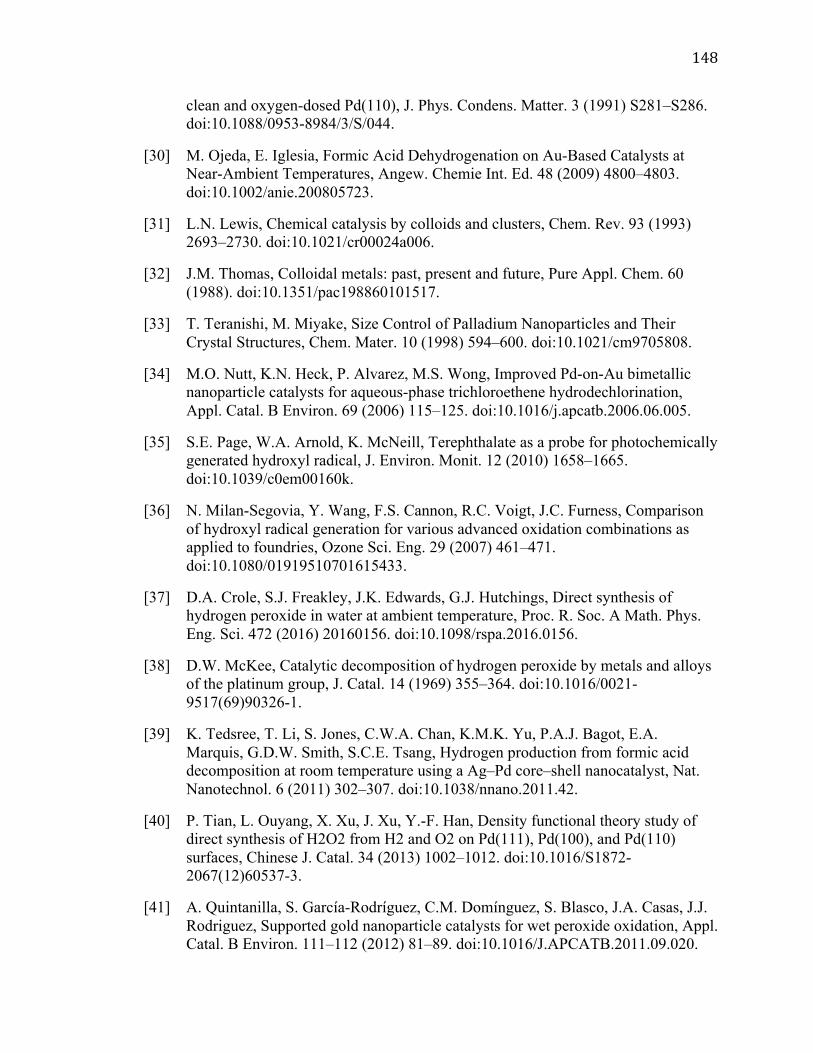
148!!
clean and oxygen-dosed Pd(110), J. Phys. Condens. Matter. 3 (1991) S281–S286. doi:10.1088/0953-8984/3/S/044.
[30] M. Ojeda, E. Iglesia, Formic Acid Dehydrogenation on Au-Based Catalysts at Near-Ambient Temperatures, Angew. Chemie Int. Ed. 48 (2009) 4800–4803. doi:10.1002/anie.200805723.
[31] L.N. Lewis, Chemical catalysis by colloids and clusters, Chem. Rev. 93 (1993) 2693–2730. doi:10.1021/cr00024a006.
[32] J.M. Thomas, Colloidal metals: past, present and future, Pure Appl. Chem. 60 (1988). doi:10.1351/pac198860101517.
[33] T. Teranishi, M. Miyake, Size Control of Palladium Nanoparticles and Their Crystal Structures, Chem. Mater. 10 (1998) 594–600. doi:10.1021/cm9705808.
[34] M.O. Nutt, K.N. Heck, P. Alvarez, M.S. Wong, Improved Pd-on-Au bimetallic nanoparticle catalysts for aqueous-phase trichloroethene hydrodechlorination, Appl. Catal. B Environ. 69 (2006) 115–125. doi:10.1016/j.apcatb.2006.06.005.
[35] S.E. Page, W.A. Arnold, K. McNeill, Terephthalate as a probe for photochemically generated hydroxyl radical, J. Environ. Monit. 12 (2010) 1658–1665. doi:10.1039/c0em00160k.
[36] N. Milan-Segovia, Y. Wang, F.S. Cannon, R.C. Voigt, J.C. Furness, Comparison of hydroxyl radical generation for various advanced oxidation combinations as applied to foundries, Ozone Sci. Eng. 29 (2007) 461–471. doi:10.1080/01919510701615433.
[37] D.A. Crole, S.J. Freakley, J.K. Edwards, G.J. Hutchings, Direct synthesis of hydrogen peroxide in water at ambient temperature, Proc. R. Soc. A Math. Phys. Eng. Sci. 472 (2016) 20160156. doi:10.1098/rspa.2016.0156.
[38] D.W. McKee, Catalytic decomposition of hydrogen peroxide by metals and alloys of the platinum group, J. Catal. 14 (1969) 355–364. doi:10.1016/0021-9517(69)90326-1.
[39] K. Tedsree, T. Li, S. Jones, C.W.A. Chan, K.M.K. Yu, P.A.J. Bagot, E.A. Marquis, G.D.W. Smith, S.C.E. Tsang, Hydrogen production from formic acid decomposition at room temperature using a Ag–Pd core–shell nanocatalyst, Nat. Nanotechnol. 6 (2011) 302–307. doi:10.1038/nnano.2011.42.
[40] P. Tian, L. Ouyang, X. Xu, J. Xu, Y.-F. Han, Density functional theory study of direct synthesis of H2O2 from H2 and O2 on Pd(111), Pd(100), and Pd(110) surfaces, Chinese J. Catal. 34 (2013) 1002–1012. doi:10.1016/S1872-2067(12)60537-3.
[41] A. Quintanilla, S. García-Rodríguez, C.M. Domínguez, S. Blasco, J.A. Casas, J.J. Rodriguez, Supported gold nanoparticle catalysts for wet peroxide oxidation, Appl. Catal. B Environ. 111–112 (2012) 81–89. doi:10.1016/J.APCATB.2011.09.020.

149!!
[42] Z. Zhang, P. Zhang, Z. Li, A.T. Kan, M.B. Tomson, Laboratory Evaluation and Mechanistic Understanding of the Impact of Ferric Species on Oilfield Scale Inhibitor Performance, Energy & Fuels. 32 (2018) 8348–8357. doi:10.1021/acs.energyfuels.8b01837.
[43] Z. Zhang, Y. Liu, Z. Dai, N. Bhandari, F. Zhang, F. Yan, G. Ruan, H. Alsaiari, Y.-T. Lu, G. Deng, A. Kan, M. Tomson, Impact of FeIII/FeII on Scale Inhibition, in: SPE Int. Oilf. Scale Conf. Exhib., Society of Petroleum Engineers, 2016. doi:10.2118/179905-MS.
[44] A. Babuponnusami, K. Muthukumar, A review on Fenton and improvements to the Fenton process for wastewater treatment, J. Environ. Chem. Eng. 2 (2014) 557–572. doi:10.1016/J.JECE.2013.10.011.
[45] K.N. Heck, M.O. Nutt, P. Alvarez, M.S. Wong, Deactivation resistance of Pd/Au nanoparticle catalysts for water-phase hydrodechlorination, J. Catal. 267 (2009) 97–104. doi:10.1016/J.JCAT.2009.07.015.
[46] Brian P. Chaplin, Eric Roundy, Kathryn A. Guy, John R. Shapley, Charles J. Werth, Effects of Natural Water Ions and Humic Acid on Catalytic Nitrate Reduction Kinetics Using an Alumina Supported Pd−Cu Catalyst, (2006). doi:10.1021/ES0525298.
[47] A. Carrasquillo, J.-J. Jeng, R.J. Barriga, W.F. Temesghen, M.P. Soriaga, Electrode-surface coordination chemistry: ligand substitution and competitive coordination of halides at well-defined Pd(100) and Pd(111) single crystals, Inorganica Chim. Acta. 255 (1997) 249–254. doi:10.1016/S0020-1693(96)05371-6.
[48] J.C. Velázquez, S. Leekumjorn, G.D. Hopkins, K.N. Heck, J.S. McPherson, J.A. Wilkens, B.S. Nave, M. Reinhard, M.S. Wong, High activity and regenerability of a palladium-gold catalyst for chloroform degradation, J. Chem. Technol. Biotechnol. 91 (2016) 2590–2596. doi:10.1002/jctb.4851.

150!!
Chapter 5
Room-temperature Catalytic Treatment of High-salinity Produced Water at Neutral pH
5.1. Introduction
Hydraulic fracturing technology enabled the recovery of natural gas and tight oil from
unconventional shale and carbonate formations, which has revolutionized the energy
industry over the last two decades.[1] Along with the desired oil and gas products,
hydraulic fracturing produced water (HFPW) surfaces as a highly complex wastewater on
the order of 0.5-4 million gallons per well. Due to a combination of technological
limitations and economic constraints, the majority of this contaminated wastewater is
typically disposed of via direct injection.[2] An increasingly attractive alternative
management practice for HFPW is to reuse it on site for other hydraulic fracturing
operations, particularly in arid or semi-arid regions.[1]

151!!A crucial requirement for reuse prospects is to remove and/or degrade organic
compounds and suppress the growth of bacteria which can lead well souring or the
corrosion of drilling equipment and wellbore tubulars.[3] Currently, organic
contamination is typically addressed through adsorption, electrocoagulation, or
ozonation, but these treatment processes are still hampered by low process efficiency and
high deployment cost.[4]
Advanced oxidation processes driven by heterogeneous catalysis are a promising
method to selectively degrade organic compounds and suppress bacterial growth in these
waters, potentially enabling on-site HFPW reuse. Heterogeneous catalysis directly
converts toxic or problematic contaminants to non-harmful products without generating
separate, more concentrated waste streams as is typical with other conventional water
treatment technologies.[5,6] It is more stable than bioremediation processes, which are
sensitive to operational conditions (e.g., pH and salinity) and which require long
treatment times. As a heterogeneous catalysis approach, catalytic wet air oxidation
(CWAO) uses air or oxygen gas as oxidants to degrade various organic compounds (e.g.,
BTEX, carbohydrate, organic acids) in industrial wastewaters to CO2 and H2O. [7][8] It
uses metal oxide-supported (e.g., alumina, ceria, titania) noble metal catalysts (e.g., Pt,
Pd, Ru), operating at elevated temperatures and pressures (200-300 °C, 20-200 bar) [9].
A less severe process is catalytic wet peroxide oxidation (CWPO), wherein hydrogen
peroxide (H2O2) is used as the oxidant instead of air.[10][11] However, H2O2 usage
requires continuous addition, which increases treatment cost. In situ H2O2 generation
could be promising method to degrade the organic compounds in produced water.[12]
152!!Recently, we found that a bimetallic PdAu catalyst has activity for the oxidative
degradation of a model organic compound in simulated HFPW in the presence of formic
acid (an organic contaminant found in HFPW) and air [3]. We showed that the catalyst
generated H2O2 (and hydroxyl radicals) during the reaction as the oxidant over a wide
range of salinities. The bimetallic catalyst was the most active in terms of initial hydroxyl
radicals formation rate. At moderate salinities (~100-10,000 ppm), PdAu remained active
and showed the highest rate of phenol degradation. The reaction system was restricted to
acidic conditions (pH 3 and lower), however, as none of the catalysts exhibited activity at
pH 4 and higher.
In this work, we studied the generation of H2O2 from hydroxylamine (HA) and
oxygen gas using PdAu/Al2O3, with monometallic Pd/Al2O3 and Au/Al2O3 serving as
comparisons. HA is a widely used reducing agent effective in a wide pH range.[13]
Choudhary et al. reported the generation of H2O2 from HA and O2 using monometallic
Pd and Au catalysts in neutral pH water.[14,15] However, H2O2 generation at high
salinity conditions has not been studied. We studied the effects of salinity (0-100,000
ppm) and pH (5-8) on the generation of H2O2 from HA oxidation in a semi-batch reactor,
using Al2O3 supported PdAu, Pd and Au catalysts. The reaction system was tested for
organics degradation, using phenol as the model compound. We designed, constructed,
and tested a recirculating trickle bed reactor (TBR) that effectively treated 5 L of
simulated produced water (160,000 ppm TDS, pH ~7) containing 100 ppm phenol.

153!!
5.2. Experimental
5.2.1. Materials
The bimetallic catalyst containing 1 wt.% Pd and 1 wt.% Au supported on Al2O3 pellets
("PdAu/Al2O3") was provided by Johnson Matthey. A monometallic Au catalyst
containing 1.2 wt.% Au supported on alumina extrudate ("Au/Al2O3") was purchased
from Strem Chemicals. 1 wt.% Pd supported on alumina ("Pd/Al2O3," in the form of a
powder) was purchased from Sigma-Aldrich. The following chemicals were purchased
from Sigma-Aldrich and used as-received: hydroxylamine (HA) solution (50 wt.% in
H2O), hydrogen peroxide solution (30 wt.% in water), titanium(IV) oxysulfate solution
(~15 wt.% in sulfuric acid, >99.99%), phenol (>99%), 1,2-dihydroxybenzene (>99%),
potassium hydroxide (≥99.97%), phosphoric acid (85 wt.% in H2O, 99.99%), sodium
chloride (>99%), calcium chloride dihydrate (>99%), magnesium chloride hexahydrate
(>99%), magnesium sulfate heptahydrate (>98%), and sodium bicarbonate (>99.7%).
Oxygen gas (99.99%) was purchased from Airgas. All experiments were conducted using
deionized (DI) water (>18 MΩ cm).
5.2.2. Catalyst preparation and characterization
All three types of catalysts (PdAu/Al2O3, Pd/Al2O3, and Au/Al2O3) were ground using
mortar and pestle and then sieved into fine powders with particle sizes smaller than 300
µm (US standard 50 mesh). The PdAu, Pd and Au NPs had a relatively uniform size
distribution with similar mean diameters of 3.7, 2.7, and 3.4 nm, respectively, as
characterized by TEM in our previous publication.[3] ICP-OES was used to confirm that
no metal leaching had occurred.

154!!
5.2.3. H2O2 formation in batch reactor
Experiments for studying the H2O2 formation reaction using HA and O2 (NH2OH + O2 !
1.5 H2O2 + 0.5 N2) were conducted using a screw-cap bottle (250 mL, Alltech) as a semi-
batch reactor. The bottle was capped by a Teflon-silicone septum with one stainless steel
needle inserted into the liquid as the oxygen inlet, and another needle inserted above the
liquid level as the oxygen outlet. In a typical experiment, a 10 mM HA solution was
prepared from concentrated (50 wt.% in H2O) HA solution (60 µL) and 100 mL of DI
water. The resulting solution had an initial pH of 9.0 measured by pH meter (Thermo
Scientific). Reactions were conducted at room temperature (23 °C) as measured by a
thermometer inserted into the solution and stirred using a magnetic stir bar (1000 rpm).
The liquid filled reactors were charged with catalyst powder (20 mg PdAu/Al2O3,
20 mg of Pd/Al2O3, or 200 mg Au/Al2O3). The metal to reactant HA molar ratio of PdAu,
Pd and Au catalyst in reaction medium is 1:3446, 1:5300 and 1:985, respectively. Note
that the larger (10×) catalyst mass for the Au/Al2O3 trials was employed because the
observed reaction rates for HA conversion and H2O2 formation were too slow to be
accurately quantified within the set reaction time if the same amount (i.e., 20 mg) of Au
catalyst was used. Reaction rate analysis and catalyst comparisons are normalized by the
mass of catalyst. The reaction was then initiated by bubbling oxygen gas into the reactor
at 50 mL·min-1. Aliquots of the reaction fluid (4 mL) were periodically withdrawn by a 5
mL plastic syringe using a stainless-steel needle, filtered by a 0.2-µm syringe filter (25
mm, VWR), and then stored in the 2 mL microcentrifuge tube at 4 °C prior to analysis.

155!!Bulk H2O2 was quantified through the reaction with a titanium (IV) oxysulfate
reagent to produce a yellow solution of pertitanic acid (Ti4+ + H2O2 + 2 H2O ! H2TiO4 +
4H+). This solution was quantified using UV-vis spectroscopy at the wavelength of 405
nm. In a typical experiment, 50 µL of titanium(IV) oxysulfate was added to a 1.0 mL
aliquot of solution in a capped quartz cuvette. The UV-vis spectrum (365-450 nm) of the
solution was recorded and the concentration of H2O2 was calculated using a calibration
curve of concentration vs. absorbance (at 405 nm).
HA concentration was quantified using a Thermo Scientific Dionex Aquion Ion
Chromatograph (IC) system equipped with a cation-exchange column (Dionex IonPac
CS12A, 4×250 mm) for cation separation and a conductivity detector. The IC operated at
25°C with 20 mM methanesulfonic acid as the cation mobile phase at the flowrate of 1
cm3·min-1.
The conversion of HA, XHA, was defined as:
!!" =!!",! − !!"
!!",!
where CHA,0 is the initial HA concentration and CHA is HA concentration at each
sampling time. Reaction kinetics were modeled as a first-order reaction with respect to
the HA concentration:
−!!!"!" = !!"#$×!!"
!!"# =!!"#$!!"#
156!!Selectivity of H2O2 (SH2O2) was defined as:
!!!!! =!!!!!
!!",! − !!"× 23×100%
5.2.4. Phenol degradation in batch reactor
Phenol degradation experiments were also conducted in the same screw-cap bottle
(250 mL, Alltech) as a semi-batch reactor with 50 mL min-1 O2 flowing through. In a
typical experiment, 1.0 mL of a 10,000-ppm phenol stock solution was added into the
100 mL 10 mM HA solution such that the initial phenol concentration was 100 ppm
(~1.06 mM). Catalyst power (20 mg PdAu/Al2O3, 20 mg of Pd/Al2O3 or 200 mg
Au/Al2O3) was then added to the solution to initiate the reaction. Phenol and its oxidation
byproducts (e.g. catechol) were quantified via HPLC (Agilent/HP 1100).[16] The phenol
removal percentage, Xphenol, was defined as:
!!!!"#$ =!!!!"#$,! − !!!!"#$
!!!!"#$,!
where Cphenol,0 is the initial phenol concentration and Cphenol is phenol
concentration at each sampling time.
Total organic carbon (TOC, expressed in unit of ppm) was measured separately
using a Shimadzu TOC analyzer to qualify and quantify the organic compounds from the
experiments. Examples of the organic samples identified include: phenol, catechol, oxalic
acid, and acetic acid. The decrease of TOC concentration indicates the complete
mineralization of phenol. The TOC removal percentage, XTOC, was defined as:
157!!
!!"# =!!"#,! − !!"#
!!"#,!
where CTOC,0 is the initial TOC concentration and CTOC is TOC concentration at
each sampling time.
To investigate the effect of pH on the phenol degradation, the initial solution pH
was adjusted in the range of 5 to 8 using 8 mM phosphate buffer in DI water. To
investigate the effect of salinity, potassium chloride salt was added to the HA solution
such that the chloride concentration was in the range of 0-100,000 ppm (or 0-3,000 mM).
5.2.5. Quantification of nitrogen byproducts from HA oxidation
It is assumed that the H2O2 formation reaction from HA and O2 generates only N2.[15] To
verify this, we measured for any nitrite (NO2-) and nitrate (NO3
-) byproducts using a
Thermo Scientific Dionex Aquion IC system equipped with an anion-exchange column
(Dionex IonPac AS23, 4×250 mm) and a conductivity detector. The IC operated at 25 °C
with a solution of 4.5 mM Na2CO3 and 0.8 mM NaHCO3 as the anion mobile phase at the
flowrate of 1 mL·min-1.
5.2.6. Phenol degradation in recirculating trickle bed reactor (TBR)
To investigate this reaction system under continuous-flow conditions, we
constructed a recirculating TBR connected to a larger-volume reservoir tank (Scheme
5.1a). The specifications and actual photos of the recirculating TBR are detailed in
Supporting Information (SI). The reactor (empty volume of 0.6 L) was loaded with 250 g
of catalyst pellet (0.5 wt.% Pd/Al2O3 or Al2O3 control sample) diluted with an additional

158!!
100 g inert packing of 2-mm diameter glass beads (borosilicate, Sigma Aldrich). The
catalyst-to-inert packing ratio was 2.5. The Pd/Al2O3 catalyst pellets with cylindrical
shape (4-mm length × 3-mm diameter) were purchased from Riogen Inc. (Table 5.1).
!
!
Scheme 5.1 (a) Schematic of TBR operating in recirculating mode, and (b) corresponding semi-batch reactor model to account for phenol concentration changes in reservoir tank.
Table 5.1 Catalyst pellet characteristics
Parameter Value Pd loading (wt%) 0.5
Pellet Diameter (mm) 3 ± 0.1 Pellet Length (mm) 3-5 Pellet Density (g/L) 1850 ± 150

159!!In a typical experiment, the reservoir tank (9.5 L capacity) was charged with 5 L
of water (TDS of 0 or 160,000 ppm) with 100 ppm phenol, which was delivered at a flow
rate of 0.5 L·min-1. Air was supplied at a rate of 12 L·min-1 from an air compressor
mounted on the rear of the reactor housing. All flowrates were set and monitored using
ball flowmeters. A concentrated HA stream (1 wt%) was delivered via a flow pump at 1.4
mL/min at the top of the distributor head. During operation, the reservoir temperature and
pH were recorded. Samples were collected from the reservoir tank at set time intervals to
quantify phenol concentration and TOC values.
5.2.7. Modeling of overall phenol degradation rate in recirculating TBR
We treated the recirculating TBR+tank system as a semi-batch reactor, in which the
overall reaction (C6H5OH + 2 NH2OH + 7.5 O2 ! 6 CO2 + 6 H2O + N2) is carried out
(Scheme 5.1b). The HA inlet stream increases the reservoir liquid volume with time, and
the air stream flows continuously through the system. !
A mole balance on phenol,
!"#$!!" − !"#$!!"# + !"#$!!"!!"#"$%&'(! = [!"#$!!"!!""#$#%!&'()],
gives 0− 0+ !!!!"#$×! ! = !!!!!"#$!" . Since the moles of phenol (Nphenol) is the
product of phenol concentration (Cphenol) and the liquid volume (V), the mole balance
becomes !!!!"!"×! =!(!!!!"#$!×!)
!" = ! !!!!!"#$!" + !!!!"#$ !"!" . The liquid volume (V)
increases with time due the HA solution flowing at constant volumetric flow rate (v):
! = !! + !×!. Phenol degradation is treated as an irreversible first-order reaction (rphenol

160!!
= kCphenol), with k as overall phenol degradation rate constant (units of min-1). The mole
balance equation readily yielded the following differential equation:
!!!!!"#$!" = !!!!!"#$ −
!!!!"#$×!!!!!×!
Eqn 1.
Phenol degradation rate constant values were determined by collecting phenol
concentration data as a function of time and numerically fitting to the differential
equation using MATLAB.
Catalyst performance decay during the reaction (! = !!!!!!!) was also
considered, to improve the data fit. k0 is the overall phenol degradation rate constant and
kd is the catalyst deactivation rate constant. Substituting the rate equation into the mole
balance equation gives
!!!!!"#$!" = !!!!!!!!!!!"#$ −
!!!!"#$×!!!!!×!
, Eqn 2.
The k0 and kd were determined by fitting the experimental data using MATLAB.
5.3. Results and discussion
5.3.1. H2O2 generation from HA oxidation in batch reactor
The H2O2 generation profiles for the three catalysts are shown in Fig. 5.1a. All three
catalysts displayed a similar trend with respect to H2O2 generation and consumption of
HA (Fig. 5.1b) within the first hour of reaction, with Pd exhibiting the greatest activity
(reaching 5.9 mM H2O2 after 60 min). Au was the least active (3.2 mM H2O2), and the
bimetallic showing intermediate activity (4.7 mM H2O2). In the absence of HA or O2,

161!!
none of the catalysts generated H2O2. In the absence of catalyst (i.e., only Al2O3 support),
no HA loss was detected and no H2O2 was formed.
!
Figure 5.1 Time profiles for (a) H2O2 and (b) HA concentrations, and (c) H2O2 selectivity-HA conversion plots for PdAu, Pd, and Au catalysts. Reaction conditions: 20 mg PdAu/Al2O3 or 20 mg Pd/Al2O3 or 200 mg Au/Al2O3, 23 °C, 100 mL, 10 mM HA, 50 mL min-1 O2, and initial pH = 9.0.
Since the total amounts of metals charged to the batch reactor and the metallic NP
sizes were different, H2O2 formation rates were compared on a g-metal basis (and also on
a molsurface metal basis, calculated from magic cluster model) (Table 5.2). The initial H2O2
formation rate using PdAu catalyst (64.9 mmol-H2O2 g-metal-1 min-1) was 2.3× lower
than that using Pd catalyst (151.0 mmol-H2O2 g-metal-1 min-1), but 7.6× higher than that
using Au catalyst (8.5 mmol-H2O2 g-metal-1 min-1).
Table 5.2 Initial H2O2 formation rate, initial HA reaction constant and zero-conversion H2O2 selectivity for PdAu, Pd, and Au catalysts.
Catalyst Initial H2O2 formation rate (mmol-H2O2 g-metal-
1 min-1)
Initial HA reaction rate constant (L g-
metal-1 min-1)
Zero-conversion H2O2 selectivity
(%) PdAu 64.9 [25,071a] 15.8 [6,104b] 33
Pd 151.0 [30,516a] 30.0 [6,063b] 41

162!!
Au 8.5 [4,250 a] 1.6 [800b] 26 a Rate constants normalized to surface atoms (in units of mmol-H2O2 molsurface metal
-1 h-1)
b Rate constants normalized to surface atoms (in units of L molsurface metal-1 h-1)
On a molsurface metal basis, the initial H2O2 formation rate showed similar trend,
with PdAu catalyst (25,071 mmol-H2O2 molsurface metal-1
min-1) 1.2× lower than Pd (30,516
mmol-H2O2 molsurface metal-1
min-1) and 5.9× higher than Au catalyst (4250 mmol-H2O2
molsurface metal-1
min-1).
HA concentrations were measured by IC (Fig. 5.1b). After one hour, 90.4% of the
HA was converted over 200 mg of the 1.2%Au/Al2O3 catalyst whereas 94.6% conversion
was achieved using 20 mg monometallic 1%Pd/Al2O3. The bimetallic 1%Pd1%Au/Al2O3
catalyst (20 mg), however, had a highest conversion of 97.8%. The initial HA reaction
rate constant on a gmetal basis using PdAu catalyst (15.8 L g-metal-1 min-1) was 2× lower
than that using Pd catalyst (30.0 L g-metal-1 min-1), but 10× higher than that using Au
catalyst (1.6 L g-metal-1 min-1). On a molsurface metal basis, however, the initial HA reaction
rate constant using PdAu catalyst (6104 L molsurface metal-1 min-1) was slightly higher than
Pd (6063 L molsurface metal-1 min-1) and 7.6× higher than that using Au catalyst (800 L
molsurface metal-1 min-1).
H2O2 selectivity was determined for each catalyst as a function of HA conversion
(Fig. 5.1c). The selectivity generally did not change much with conversion. Extrapolated
to zero HA conversion, the zero-conversion H2O2 selectivities were 41%, 26%, and 33%
for Pd, Au, and PdAu, respectively. These values were not 100%, indicating a parallel
reaction that consumed HA but did not form H2O2 (and presumably formed H2O).

163!!
5.3.2. Phenol degradation in batch reactor
The PdAu catalyst was tested for phenol degradation using the same system with Pd and
Au as controls. Fig. 5.2a shows that the phenol concentration decreased ~11% after one
hour of reaction time when using 20 mg PdAu catalyst. Over the course of one hour
experiment, phenol mass was degraded by ~11% over 200 mg of the Au/Al2O3 catalyst
whereas 21% degradation was achieved using 20 mg Pd/Al2O3. The Pd catalyst exhibited
the highest initial phenol degradation reaction rate constant (Table 5.3), which was 4×
and 50× higher than PdAu and Au on gmetal basis (or 2× and 20× higher than PdAu and
Au on a molsurface metal basis).
Figure 5.2 Time profiles for (a) phenol (solid lines) and TOC (dashed lines), (b) HA, and (c) H2O2 concentration using PdAu, Pd, and Au catalysts. Reaction conditions: 20 mg PdAu/Al2O3, or 20 mg Pd/Al2O3 or 200 mg PdAu/Al2O3, 23 °C, 100 mL, 10 mM HA, 100 ppm phenol (~1.06 mM), 50 mL min-1 O2, and initial pH = 9.

164!!
Table 5.3 Initial phenol degradation reaction constant, initial HA reaction constant and zero-conversion H2O2 selectivity for PdAu, Pd, and Au catalysts.
Catalyst Initial phenol degradation reaction rate constant (L g-
metal-1 min-1)
Initial HA reaction rate constant (L g-
metal-1 min-1)
Zero-conversion H2O2 selectivity
(%) PdAu 0.53 [204*] 14.9 [5751*]
[6% decrease**] 47
Pd 2.15 [436*] 23.8 [4826*] [21% decrease**]
49
Au 0.04 [20*] 1.3 [650*] [19% decrease**]
46
*Reaction rate constant in the unit of L molsurface metal-1 min-1.
**Percentage decrease in initial HA reaction rate constant, in the presence of phenol
There was no decrease in TOC of the liquid samples before 30 min reaction time
using PdAu, indicating that the phenol was converted to mostly intermediate products
(e.g., catechol, small organic acids) (dash lines, Fig. 5.2a). TOC removal by 2.7 wt%
was observed after a 1 h reaction using PdAu catalyst. A similar TOC removal trend was
observed using Au catalyst (2.1%) after 1 h while Pd showed the highest TOC removal of
4.8%.
The HA was completely consumed in one hour with the PdAu catalyst (Fig.
5.2b), with a normalized reaction rate constant of 14.9 L g-metal-1 min-1 (or 5751
molsurface metal-1 min-1) (Table 5.3). The reaction rate constant was 6% lower compared to
that without phenol (Table 5.2), believed to be due to active site competition between
phenol and HA. In the monometallic Pd and Au catalyst cases, 21% and 19% decrease of

165!!
HA reaction rate constant were observed, respectively. The bimetallic PdAu catalyst was
least affected by the presence of the organic contaminant.
H2O2 accumulated during the phenol degradation reaction (Fig. 5.2c): selectivity
gradually decreased as HA converted (Fig. S5.2) indicating the consumption of H2O2 in
the phenol oxidation. Interestingly, the zero-conversion H2O2 selectivity for all three
catalysts were higher compared with the previous cases (Table 5.3), suggesting that
phenol partially blocked active sites that oxidize HA to H2O instead of H2O2.!
5.3.3. Effect of pH and salinity in batch reactor
The common pH range of the HFPW is 5 to 8. To test the performance of the catalytic
oxidation system in this pH range, we adjusted the solution pH using phosphate buffer.
Phenol degradation was observed in all buffered and unbuffered reaction systems (Fig.
5.3a). Compared with the unbuffered system (Fig. 5.2a), the buffered systems showed
greatly decreased phenol degradation reaction rates due to competitive adsorption
between phenol and phosphate species. Increased pH in the buffered systems slightly
decreased phenol degradation reaction rates (Fig. 5.3a), which is consistent with the
formation of reactive oxygen species (e.g. "OH) being less favorable at basic
conditions.[17]

166!!
Figure 5.3 Initial phenol degradation reaction rate constant on a g-metal basis (kcat) (a) in DI water ([Cl-] ~ 0 mg/L) at pH 5-8 buffered by phosphate, and (b) in water with chloride concentrations of 0, 3, 30, 300, 3000 mM (or 0, 100, 1000, 10000, 100000 ppm) buffered at pH 7. Reaction conditions: 20 mg PdAu/Al2O3 or 20 mg Pd/Al2O3 or 200 mg Au/Al2O3, 23 °C, 100 mL, 10 mM HA, 100 ppm phenol, 8 mM phosphate, 50 mL min-1 O2.
We challenged our reaction system by increasing the salinity of the reaction
liquid, buffered at neutral condition to prevent pH drift during the reaction. All tested
three catalytic systems were active even at the highest salinity value tested (3000 mM ~
100,000 ppm) (Fig. 5.3b). The reaction rate decreased with increasing salinity due to
competitive adsorption of phenol with chloride (and phosphate).[18–20]
The Pd catalyst was the most active at all salinity conditions, followed by PdAu
and Au catalysts. In increasing the chloride concentration from 0 to 3000 mM, it dropped
71% in activity, similar to the Au catalyst (75% drop). PdAu dropped 40% in activity,
indicating its greater resistance to chloride interference. The improved salinity resistance
may be attributed to weaker chloride chemisorption onto the bimetallic surface as
reported earlier.[3,18]

167!!
5.3.4. HA oxidation byproduct detection
The NO2- and NO3
- anions were observed as reaction byproducts for all catalysts,
indicating that the common assumption of N2 as the only nitrogen byproduct from using
HA as the hydrogen donor is not valid (Fig. 5.4).[14,15] The total amount of nitrogen
byproducts (mostly NO2- with a trace amount of NO3
-) increased in order of PdAu (4.5%
of initial HA amount) < Au (7.4%) < Pd (11.5%).
Figure 5.4 HA, NO2- and NO3
- concentration profiles using (a) PdAu, (b) Pd and (c) Au catalysts during phenol oxidation. Reaction conditions: 20 mg PdAu/Al2O3 or 20 mg Pd/Al2O3 or 200 mg Au/Al2O3, 23 °C, 100 mL, 10 mM HA, 100 ppm phenol, 8 mM phosphate, 50 mL min-1 O2, and pH ~ 7.
The formation of NO2- and NO3
- byproducts occurred at all salinity conditions,
and selectivity to NO2-/NO3
- byproducts did not change with HA conversion (Fig. S5.1).
Higher chloride concentrations lowered the formation of NO2- and NO3
-, for all three
catalysts (Table 5.4). The smallest byproduct amount occurred for the Au catalyst at 300
mM (0.5%).

168!!
Table 5.4 NO2-/NO3
- byproduct selectivity from HA oxidation in phenol degradation experiments at different Cl- concentrations of 0, 3, 30, and 300, mM (or 0, 10, 100, 1000 ppm).
Catalyst 0 mM Cl- 3 mM Cl- 30 mM Cl- 300 mM Cl- PdAu 4.5% 4.1% 3.5% 2.5%
Pd 11.5% 11.0% 9.3% 5.4% Au 7.4% 5.8% 1.9% 0.5%
5.3.5. Phenol degradation in circulated TBR
In order to demonstrate the potential application of heterogeneous catalysis systems
towards HFPW treatment, we constructed a recirculating three-phase TBR with a 5-L
treatment capacity. We chose to study a commercially available Pd/Al2O3 catalyst
available in large quantities, and operated the three-phase reactor under trickle flow to
reduce mass transfer limitations of the gas phase to the catalyst surface and ensure that
the oxygen was provided in stoichiometric excess.
The control experiment using catalyst support Al2O3 showed 15% phenol
concentration decrease after 48 h due to the HA solution addition (Fig. 5.5). The
measured TOC concentration also expectedly decreased (by 14%). Two water conditions
with active Pd/Al2O3 catalyst were investigated for the flow-through system: DI water
and simulated HFPW case. Simulated HFPW contained other salts besides chloride (TDS
of ~160,000 ppm, Table S5.1). The pH was maintained around 7 using phosphate buffer
in both cases.

169!!
Figure 5.5 Experimental (dots) and modeled (curves) phenol degradation profiles in recirculating TBR in DI water and simulated HFPW. Solid curve and dash curve indicate semi-batch reactor model without (Eqn 1) and with (Eqn 2) considering performance decay, respectively. Reaction condition: 250 g Pd/Al2O3, 23 °C, 100 ppm phenol, 8 mM phosphate, pH~7, 12 L min-1 air.
After correcting for the dilution effect, 46% and 28% phenol converted after 48 h
in DI water and simulated HFPW, respectively. Based on TOC concentration
measurements at the end of the 48-h experiments, 12% and 7% TOC converted to CO2,
respectively. The TOC decrease was less than the phenol concentration decrease, due to
the formation of organic intermediates.[21]
The numerical solutions to the differential equations of the semi-batch reactor
model without (solid curve of Fig. 5.5) and with performance decay (dash curve of Fig.
5.5) were least-square fit to the concentration-time experimental data. Without
considering catalyst performance decay, the phenol degradation rate constant using
Pd/Al2O3 catalyst in simulated HFPW (1.5×10⁻⁴ min-1) was 42% of that in DI water
(3.6×10⁻⁴ min-1) (Table 5.5). This percentage was consistent with batch reactor results for

170!!
Pd/Al2O3: the phenol degradation rate constant in high salinity (~100,000 ppm) water
(0.11 L g-metal-1 min-1) was 32% of that in DI water (0.34 L g-metal-1 min-1) (Fig. 5.3b).
Table 5.5 Fitted phenol degradation reaction rate constants at DI water and simulated HFPW conditions using semi-batch reactor model
Overall rate constant k (min-1) from Eqn 1
Overall rate constant k0 (min-1) accounting for TBR performance
decay kd (min-1) from Eqn 2 Pd/Al2O3 (DI water) 3.6×10⁻⁴ 8.1×10⁻⁴ kd = 1.0×10⁻³
Pd/Al2O3 (simulated HFPW) 1.5×10⁻⁴ 5.0×10⁻⁴ kd = 1.4×10⁻³ Al2O3 (DI water) 0 0 kd = 0
!
When including performance decay in the model, the phenol degradation rate
constant using Pd/Al2O3 catalyst in simulated HFPW (8.1×10⁻⁴ min-1) is 62% of that in
DI water (5.0×10⁻⁴ min-1) (Table 5.5). The performance decay rate constant (1.4×10⁻³
min-1) was 1.4 times larger than that at in DI water (1.0×10⁻³ min-1) (Table 5.5), which
was possibly due to the fouling the catalyst surface (i.e. blocking of the catalytic active
sites) over time by carbonaceous deposits, mainly of condensation/polymerization
byproducts formed from oxidative coupling side reactions.[10,22] The fouled catalysts
can be potentially regenerated by flushing the reactor bed with bleach (e.g. sodium
hypochlorite) solution.[23,24]!
5.4. Conclusion
Phenol degradation was achieved via catalytic advanced oxidation using in-situ generated
H2O2 from a combination of oxygen, HA and catalysts (PdAu/Al2O3, Pd/Al2O3, or

171!!
Au/Al2O3). This reaction works at neutral pH with high salinity (>100,000 ppm or >3,000
mM) in atmospheric temperature and pressure conditions. Dinitrogen gas was the major
product from HA oxidation with a small amount (<5%) of NO2- and NO3
- formed, which
is in contrast to the literature report. A recirculating TBR was constructed and used to
demonstrate as proof of concept that ~28% phenol degradation and ~8% TOC removal
could be achieved in simulated HFPW in 48 hours. TBR experimental results were
consistent with batch experiments. The ratio of phenol degradation rate constants in DI
water and simulated HFPW of TBR tests calculated from a semi-batch reactor model
matched with the rate results of batch systems. This work further demonstrates that
advanced oxidation using heterogeneous catalysts is a promising approach to treat
HFPW.
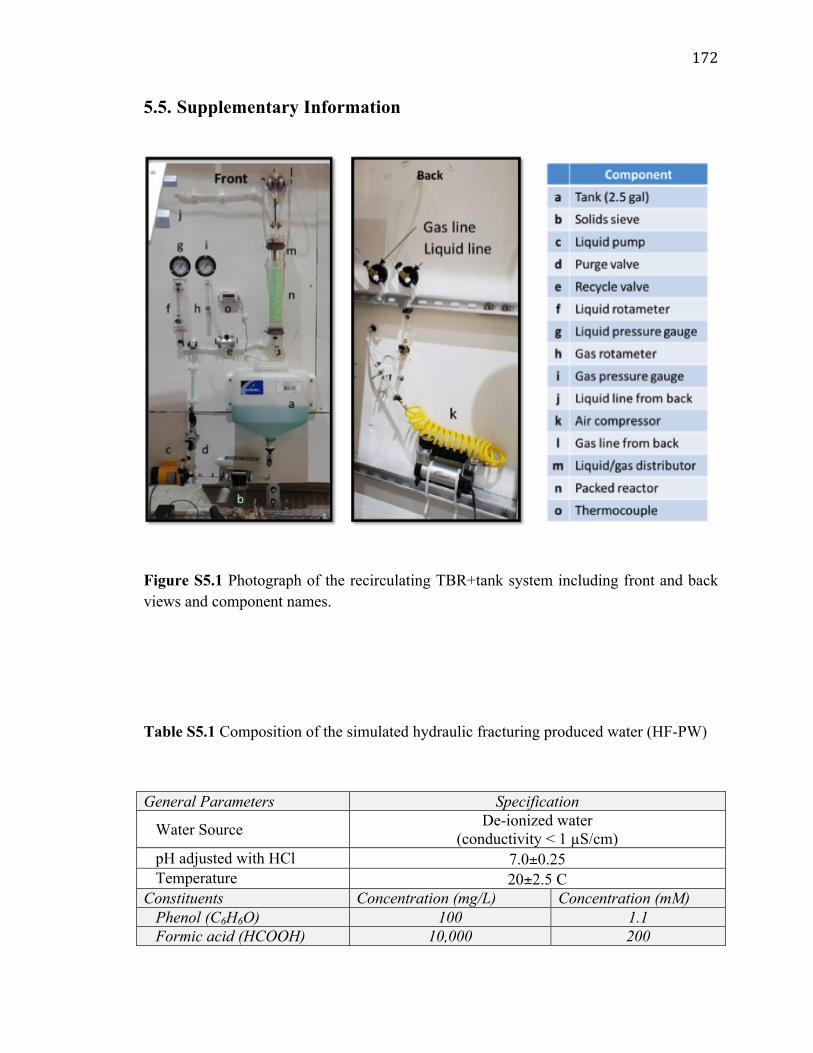
172!!
5.5. Supplementary Information
!
Figure S5.1 Photograph of the recirculating TBR+tank system including front and back views and component names.
!
Table S5.1 Composition of the simulated hydraulic fracturing produced water (HF-PW)
General Parameters Specification
Water Source De-ionized water (conductivity < 1 µS/cm)
pH adjusted with HCl 7.0±0.25 Temperature 20±2.5 C
Constituents Concentration (mg/L) Concentration (mM) Phenol (C6H6O) 100 1.1 Formic acid (HCOOH) 10,000 200

173!!
Bicarbonate (HCO3-, initial) 50 0.82
Calcium (Ca2+) 6,940 173 Chloride (Cl-) 99,719 2813 Magnesium (Mg2+) 520 21.4 Sodium (Na+) 56,000 2436 Sulfate (SO4
2-) 558 5.8 Iron (Fe2+) 5 0.09 Total Diss. Solids (TDS) 163,792 - Ionic Strength - 3,025
!
!
Figure S5.2 H2O2 selectivity-HA conversion plot. Reaction conditions: 20 mg PdAu/Al2O3, or 20 mg Pd/Al2O3 or 200 mg PdAu/Al2O3, 23 °C, 100 mL, 10 mM HA, 100 ppm phenol, 50 mL min-1 O2, and initial pH = 9.
5.6. Reference
[1] United States Environmental Protection Agency, Hydraulic Fracturing for Oil and Gas: Impacts from the Hydraulic Fracturing Water Cycle on Drinking Water Resources in the United States, 2016. doi:EPA-600-R-16-236ES.
[2] P. Boschee, Produced and Flowback Water Recycling and Reuse: Economics, Limitations, and Technology, Oil Gas Facil. 3 (2014) 16–21. doi:10.2118/0214-0016-OGF.
[3] Y.B. Yin, K.N. Heck, C.L. Coonrod, C.D. Powell, S. Guo, M.A. Reynolds, M.S. Wong, PdAu-catalyzed oxidation through in situ generated H2O2 in simulated produced water, Catal. Today. (2019). doi:10.1016/J.CATTOD.2019.05.001.
174!!
[4] A. Butkovskyi, H. Bruning, S.A.E. Kools, H.H.M. Rijnaarts, A.P. Van Wezel, Organic Pollutants in Shale Gas Flowback and Produced Waters: Identification, Potential Ecological Impact, and Implications for Treatment Strategies, Environ. Sci. Technol. 51 (2017) 4740–4754. doi:10.1021/acs.est.6b05640.
[5] K.N. Heck, S. Garcia-Segura, P. Westerhoff, M.S. Wong, Catalytic Converters for Water Treatment, Acc. Chem. Res. 52 (2019) 906–915. doi:10.1021/acs.accounts.8b00642.
[6] B.P. Chaplin, M. Reinhard, W.F. Schneider, C. Schu, J.R. Shapley, T.J. Strathmann, C.J. Werth, Critical review of Pd-based catalytic treatment of priority contaminants in water, Environ. Sci. Technol. 46 (2012) 3655–3670. doi:10.1021/es204087q.
[7] K.-H. Kim, S.-K. Ihm, Heterogeneous catalytic wet air oxidation of refractory organic pollutants in industrial wastewaters: A review, J. Hazard. Mater. 186 (2011) 16–34. doi:10.1016/J.JHAZMAT.2010.11.011.
[8] J. Levec, A. Pintar, Catalytic wet-air oxidation processes: A review, Catal. Today. 124 (2007) 172–184. doi:10.1016/J.CATTOD.2007.03.035.
[9] F. Arena, R. Di Chio, B. Gumina, L. Spadaro, G. Trunfio, Recent advances on wet air oxidation catalysts for treatment of industrial wastewaters, Inorganica Chim. Acta. 431 (2015) 101–109. doi:10.1016/J.ICA.2014.12.017.
[10] J.A. Zazo, J.A. Casas, A.F. Mohedano, J.J. Rodríguez, Catalytic wet peroxide oxidation of phenol with a Fe/active carbon catalyst, Appl. Catal. B Environ. 65 (2006) 261–268. doi:10.1016/J.APCATB.2006.02.008.
[11] P. Bautista, A.F. Mohedano, J.A. Casas, J.A. Zazo, J.J. Rodriguez, Highly stable Fe/γ-Al2O3 catalyst for catalytic wet peroxide oxidation, J. Chem. Technol. Biotechnol. 86 (2011) 497–504. doi:10.1002/jctb.2538.
[12] M.S. Yalfani, S. Contreras, F. Medina, J. Sueiras, Phenol degradation by Fenton’s process using catalytic in situ generated hydrogen peroxide, Appl. Catal. B Environ. 89 (2009) 519–526. doi:10.1016/J.APCATB.2009.01.007.
[13] P. Politzer, J.S. Murray, The Chemistry of Hydroxylamines, Oximes and Hydroxamic Acids, 2008. doi:10.1002/9780470741962.ch1.
[14] V.R. Choudhary, P. Jana, S.K. Bhargava, Reduction of oxygen by hydroxylammonium salt or hydroxylamine over supported Au nanoparticles for in situ generation of hydrogen peroxide in aqueous or non-aqueous medium, Catal. Commun. 8 (2007) 811–816. doi:10.1016/J.CATCOM.2006.08.041.
[15] V.R. Choudhary, P. Jana, In situ generation of hydrogen peroxide from reaction of O2 with hydroxylamine from hydroxylammonium salt in neutral aqueous or non-aqueous medium using reusable Pd/Al2O3 catalyst, Catal. Commun. 8 (2007) 1578–1582. doi:10.1016/J.CATCOM.2007.01.003.

175!!
[16] J. Neff, K. Lee, E.M. DeBlois, Produced Water: Overview of Composition, Fates, and Effects, in: Prod. Water, Springer New York, New York, NY, 2011: pp. 3–54. doi:10.1007/978-1-4614-0046-2_1.
[17] H.S. Joglekar, S.D. Samant, J.B. Joshi, Kinetics of wet air oxidation of phenol and substituted phenols, Water Res. 25 (1991) 135–145. doi:10.1016/0043-1354(91)90022-I.
[18] D.-K. Lee, S.-J. Ahn, D.-S. Kim, Mechanistic studies of formation of carbon deposits on supported Pt catalysts during wet oxidation of phenol, in: 2001: pp. 69–76. doi:10.1016/s0167-2991(01)80182-8.
[19] K.N. Heck, M.O. Nutt, P. Alvarez, M.S. Wong, Deactivation resistance of Pd/Au nanoparticle catalysts for water-phase hydrodechlorination, J. Catal. 267 (2009) 97–104. doi:10.1016/J.JCAT.2009.07.015.
[20] Brian P. Chaplin, Eric Roundy, Kathryn A. Guy, John R. Shapley, Charles J. Werth, Effects of Natural Water Ions and Humic Acid on Catalytic Nitrate Reduction Kinetics Using an Alumina Supported Pd−Cu Catalyst, (2006). doi:10.1021/ES0525298.
[21] A. Carrasquillo, J.-J. Jeng, R.J. Barriga, W.F. Temesghen, M.P. Soriaga, Electrode-surface coordination chemistry: ligand substitution and competitive coordination of halides at well-defined Pd(100) and Pd(111) single crystals, Inorganica Chim. Acta. 255 (1997) 249–254. doi:10.1016/S0020-1693(96)05371-6.
[22] J.C. Velázquez, S. Leekumjorn, G.D. Hopkins, K.N. Heck, J.S. McPherson, J.A. Wilkens, B.S. Nave, M. Reinhard, M.S. Wong, High activity and regenerability of a palladium-gold catalyst for chloroform degradation, J. Chem. Technol. Biotechnol. 91 (2016) 2590–2596. doi:10.1002/jctb.4851.
[23] G.G. Rao, G. Somidevamma, Volumetric determination of iron (III) with hydroxylamine as a reducing agent, Fresenius’ Zeitschrift Für Anal. Chemie. 165 (1959) 432–436. doi:10.1007/BF00462146.
[24] K.R. Brown, M.J. Natan, Hydroxylamine seeding of colloidal Au nanoparticles in solution and on surfaces, Langmuir. 14 (1998) 726–728. doi:10.1021/la970982u.
[25] M.N. Hughes, H.G. Nicklin, Autoxidation of hydroxylamine in alkaline solutions, J. Chem. Soc. A Inorganic, Phys. Theor. Chem. (1971) 164–168. doi:10.1039/J19710000164.
[26] A.J.J. Jebaraj, D.R.M. De Godoi, D. Scherson, The oxidation of hydroxylamine on Pt-, and Pd-modified Au electrodes in aqueous electrolytes: Electrochemical and in situ spectroscopic studies, Catal. Today. 202 (2013) 44–49. doi:10.1016/j.cattod.2012.03.038.

176!!
! !

177!!
Chapter 6
Towards Glucuronic Acid through Oxidation of Methyl-glucoside Using PdAu Catalysts
6.1. Introduction
Biomass-derived carbohydrates are a promising feedstock due to their natural abundance.
[1,2] Value-added chemicals can potentially be produced from carbohydrates by applying
dehydration, hydrogenation, and oxidation treatments.[1] Carboxylic compounds from
the oxidation of carbohydrates is of particular interest.[3,4] One example is glucuronic
acid, a precursor for pharmaceutical chemicals (e.g. heparin and hyaluronic acid) and
drink additives (e.g. glucuronolactone).[5] Current commercial processes to produce
glucuronic acid include the aerobic enzymatic oxidation of glucose by Ustulina deusta
bacteria and Bacterium industrium var. Hoshigaki [6]. However, these suffer from low
productivity. Efforts have been made to improve the productivity by using homogeneous
catalysts [7], but their separation from the product is problematic. Heterogeneous

178!!
catalysts are widely investigated due to their fast biomass conversion, and are, by
definition, readily separable from reaction mixtures [8].
In the liquid-phase catalytic oxidation of glucose over heterogeneous platinum
catalysts, selectivity to glucuronic acid (i.e. glucose oxidized at the C6 primary alcohol
group) is low, forming mostly gluconic acid (i.e. glucose oxidized at the C1 carbonyl
group) instead.[9] This highlights a problem with glucose as a biomass feedstock for
glucuronic acid [10,11]: its selective conversion to the desired product is challenging, due
to the competing functional groups. Protecting groups on the glucose ring can be used to
control selectivity, as reported recently, for example, by Chen et al. [12]. The protection
of the oxidatively more active C1 carbonyl groups was reported to increase the selectivity
toward the glucuronate structure by the oxidation of C6 primary alcohol groups. [13–16]
Acid hydrolysis can be subsequently used to remove the protecting group to generate the
glucuronic acid [15].
However, the reported examples of heterogeneously catalyzed oxidation of
protected glucose were not straightforward to carry out; there is ample room to improve
catalyst activities and glucuronic acid selectivities [13–16]. van Dam et al. studied
glucose 1-phosphate oxidation at 30 °C and pH 9 using activated carbon supported
monometallic platinum (Pt/C).[13] The authors reported ~70% conversion of 0.1 M
glucose 1-phosphate to glucuronic acid 1-phosphate at ~60% selectivity using 40 g/L
5wt%Pt/C after 23 hours. Schuurman et al. studied MG oxidation using a similar catalyst
at the reaction conditions of 20-40 °C and pH 7-10.[14] They reported ~80% conversion
of 0.5 M MG and ~70% selectivity to MGA after 28 h at 35 °C and pH 7. Catalyst
deactivation was observed in both cases though, due to platinum over-oxidation. Yuan et

179!!
al. studied the MG oxidation using supported palladium at 70 °C and pH 9.[15,16] The
authors found that the commercial carbon supported palladium (Pd/C) catalyst was
inactive in MG oxidation, but a complex metal oxide (e.g., La0.5Pb0.5Mn0.9Sn0.1O3)
supported palladium led to ~76% yield of glucuronic acid.
Bimetallic catalysts (e.g. PdPt, PdAu, and PtAu) have enhanced activity,
selectivity and/or stability compared with monometallic catalysts for aqueous alcohol
oxidation, which is commonly attributed to a combination of geometric and electronic
effects.[17,18] PdAu is one of the most widely studied bimetallic catalysts for primary
alcohol oxidation. Silva et al. reported more than 5 times improvement in activity using
Au@Pd core-shell NP catalysts compared to monometallic Au and Pd for the oxidation
of benzyl alcohol, for example.[19] Hutchings's group prepared carbon-supported PdAu
alloy NPs catalysts and found they gave ~80% selectivity to glyceric acid from glycerol
oxidation and were 50% more active than supported monometallic Pd and Au NPs.[20]
Our group has investigated structure–property relationships of Pd-on-Au NPs for the
oxidation of glycerol; the catalytic NPs exhibited volcano-shaped activity dependence on
Pd surface coverage, and had ~10 times higher activity than monometallic Pd or Au
catalysts [21,22]. Also, these Pd-on-Au NPs showed improved resistance to deactivation
from Pd over-oxidation [21,23].
In this work, we explored the oxidation of MG using Pd-on-Au NP model
catalysts to generate MGA as a precursor to glucuronic acid (Scheme 6.1). We studied if
these materials also exhibited volcano-shape oxidation activity dependence on Pd surface
coverage. We quantified MGA selectivity and yield in relation to Pd surface coverage.

180!!
!
Scheme 6.1 Direct synthesis of glucuronic acid via biocatalyzed glucose oxidation (red path), and indirect synthesis of glucuronic acid via metal-catalyzed MG oxidation (blue path).
6.2. Experimental
6.2.1. Catalyst preparation and characterization
The carbon-supported NP catalysts were synthesized as reported previously.[21,24] The
detailed material usage, preparation procedures and catalyst characterization were
provided in Supplementary Information.
6.2.2. Catalytic testing
MG oxidation was conducted using a screw-cap bottle (100 mL, Alltech) as a semi-batch
reactor. The bottle was capped by a teflon-silicone septum with one stainless steel needle
inserted into the liquid as oxygen inlet, and a shorter one above the liquid as gas outlet.
MG was added to 50 mL DI water at a concentration of 0.1 M. The solution pH was

181!!
adjusted to 13 by adding 80 mg NaOH to the solution. The reactor was placed in an oil
bath on a heating plate to control the temperature at 50 °C and magnetically stirred. After
the temperature of liquid stabilized (~30 min), O2 flow (100 mL min-1) was started, the
stirring rate was increased to 1200 rpm, and 10 mg catalyst was added to start the
reaction.
Aliquots of the reaction fluid (1 mL) were periodically withdrawn by a 5 mL
plastic syringe via a stainless steel needle, filtered by a 0.2 µm syringe filter (25 mm,
VWR), stored in the 1 mL clear shell vials (8 × 40 mm, VWR), and analyzed by ion-
exclusion high-performance liquid chromatography (HPLC).
A Shimadzu Prominence SIL 20 system (Shimadzu Scientific Instruments, Inc.,
Columbia, MD, USA) equipped with an HPX-87H organic acid column (Bio-Rad,
Hercules, CA, USA), a refractive index detector (RID), and a UV detector (210 nm) was
used to separate and detect the reaction products. The operation conditions for the
Shimadzu HPLC were at 42 °C with 30 mM H2SO4 as mobile phase flowing at 0.3 cm3
min-1.
Pure reactant MG and reaction products (MGA, glyceric acid, oxalic acid,
glycolic acid, formic acid, acetic acid, and lactic acid) standards were used to determine
retention times, and concentration-peak area calibration curves were prepared in the
range of 0 to 0.2 M. A slight loss in liquid volume due to water evaporation was observed
during the reaction (~0.65 mL volume loss after 1 h at 50 °C), for which the measured
concentrations were corrected during calculation.! pH was checked before and after
reaction, and no significant pH change was observed (<0.4).

182!!The conversion of MG (XMG) was defined as
!!" =!!",! − !!"
!!",!
where CMG,0 is the initial MG concentration and CMG is the MG concentration at
each sampling time. The MG oxidation reaction over the whole reaction time (8 h) cannot
be modeled as pseudo first-order reaction since the generated products can also react on
the catalyst surface competing with the MG oxidation. Due to the low amount of reaction
products at beginning of reaction, MG oxidation was the dominant reaction. Thus, initial
first-order reaction rate constants were calculated using data collected in the first 2 h:
−!!!"!" = !!"#$×!!"
The initial apparent first-order reaction rate constant kmeas (with units of h-1) was
obtained from the following equation:
− ln !!"!!",!
= !!"#$×!
Initial turnover frequency, normalized to the estimated moles of exposed catalytic
surface atoms, (TOF, with units of mol-MG mol-surface-atom-1 h-1) was given by:
!"# = !!"#$×!!"!!"#$%
where Cmetal is the surface metal content of the catalysts. The amount of surface
metal was estimated using the magic cluster model,[25–28] where the 4 nm carbon-
supported monometallic Au and Pd NPs were modeled as clusters with 7 shells of atoms,

183!!
and the surface atoms were estimated to be the atoms in the 7th shell of the cluster. For
carbon-supported Pd-on-Au NPs with Pd surface coverages less than 100 sc%, all Pd
atoms were assumed to be surface atoms in the 8th layer and uncovered Au atoms in the
7th layer were also counted as surface atoms. For Pd surface coverages greater than 100
sc%, the surface atoms were the Pd atoms in the 9th layer and the exposed Pd atoms in 8th
layer. The charge amounts of catalysts with different surface coverage to reactor are
shown in Table S6.4.
To quantify the percentage of reactant MG converted to the desired product MGA
for different surface coverage catalysts, yield (YMGA) of MGA using each catalyst was
defined as:
!!"# =!!"#!!"
where CMGA and CMGA is the MGA and MG concentration, respectively.
MGA selectivity (SMGA) was defined as:
!!"# =!!"#
!!",!−!!"
6.3. Results and discussion
6.3.1. Catalyst structure
Fig. S6.1a shows a TEM image of carbon-supported 80 sc%. Pd-on-Au NPs. The dark
black spheres were the NPs while the gray regions was the carbon support. The NPs had
a narrow size distribution, with a mean diameter of 4.2±0.6 nm (Fig. S6.1b). Elemental

184!!
analysis via ICP-OES of Pd-on-Au NPs with calculated 0, 30, 80, and 150 sc% (Table
S6.5) confirmed that actual metal content was close (within 2%) to calculated values.
From our previous studies on nanostructure analysis [29,30], the Pd-on-Au NPs have a
Pd-rich shell and a Au-rich core. At low surface coverage (<30 sc%), Pd atoms are
distributed as scattered atoms, and at medium surface coverage (30-80 sc%), Pd are
found predominantly as two-dimensional (2D) ensembles on the Au surface. At higher
surface coverages (>80 sc%), Pd additionally form three-dimensional (3D) ensembles.
The tested 80 sc% Pd-on-Au/C catalysts were stable with no detectable Au or Pd (<50
ppb) in the filtered solution after MG oxidation.
6.3.2. Effect of Pd surface coverage on catalyst activity of MG oxidation
Pd-on-Au NPs with surface coverages from 30-300% as well as monometallic Au/C�
Pd/C catalysts and activated carbon were tested for MG oxidation. The concentration–
time profiles of MG oxidation reaction showed that increasing Pd surface coverage from
0% to 80% led to higher MG conversion (Fig. 6.1a). The highest MG conversion of 92%
after 8 h was achieved using the 80 sc% Pd-on-Au catalyst. The conversions for 0 sc%
(monometallic Au), 30 sc% and 50 sc% Pd-on-Au catalysts after 8 h were 32%, 38% and
75%, respectively.
Materials with Pd surface coverages >80 sc% showed decreasing MG conversion
in the same reaction time period (Fig. 6.1b). The conversions for 100 sc%, 150 sc% and
300 sc% Pd-on-Au catalysts after 8 h were 71%, 66% and 40%, respectively. Both
synthesized and purchased monometallic Pd/C catalysts tested showed no activity for
MG oxidation after 8 h of reaction, which may due to the fast oxidation of Pd surface in
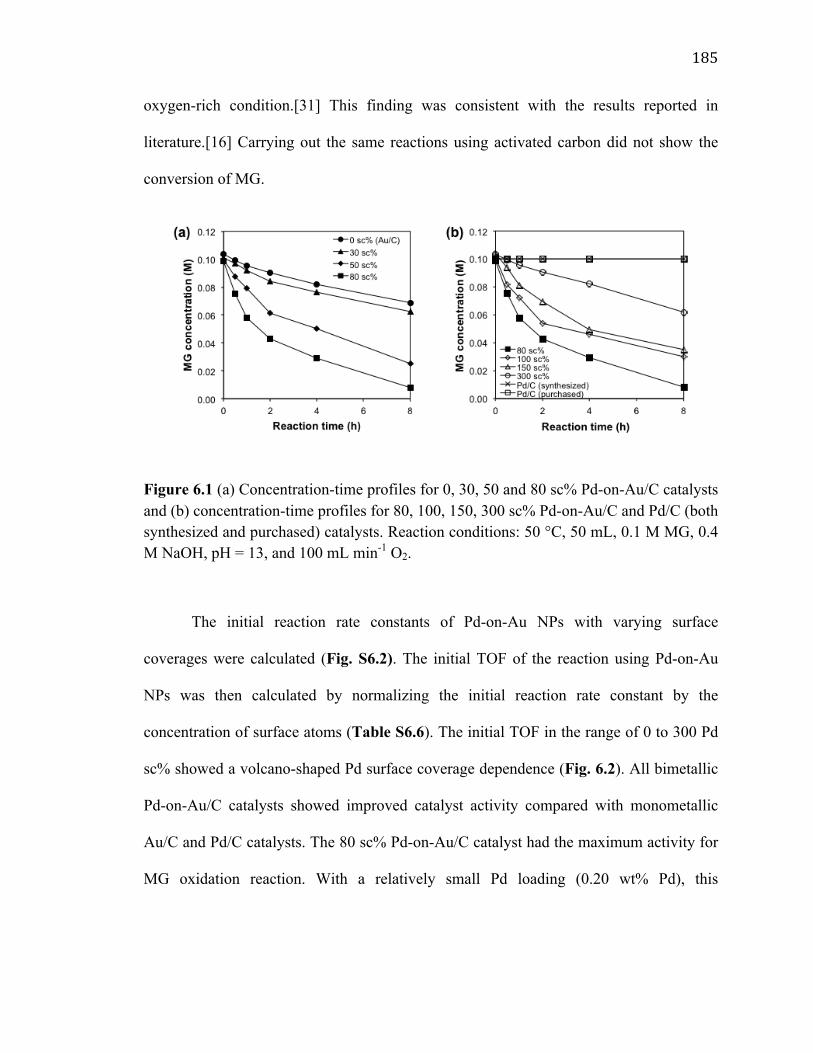
185!!
oxygen-rich condition.[31] This finding was consistent with the results reported in
literature.[16] Carrying out the same reactions using activated carbon did not show the
conversion of MG.
!
Figure 6.1 (a) Concentration-time profiles for 0, 30, 50 and 80 sc% Pd-on-Au/C catalysts and (b) concentration-time profiles for 80, 100, 150, 300 sc% Pd-on-Au/C and Pd/C (both synthesized and purchased) catalysts. Reaction conditions: 50 °C, 50 mL, 0.1 M MG, 0.4 M NaOH, pH = 13, and 100 mL min-1 O2.
The initial reaction rate constants of Pd-on-Au NPs with varying surface
coverages were calculated (Fig. S6.2). The initial TOF of the reaction using Pd-on-Au
NPs was then calculated by normalizing the initial reaction rate constant by the
concentration of surface atoms (Table S6.6). The initial TOF in the range of 0 to 300 Pd
sc% showed a volcano-shaped Pd surface coverage dependence (Fig. 6.2). All bimetallic
Pd-on-Au/C catalysts showed improved catalyst activity compared with monometallic
Au/C and Pd/C catalysts. The 80 sc% Pd-on-Au/C catalyst had the maximum activity for
MG oxidation reaction. With a relatively small Pd loading (0.20 wt% Pd), this

186!!
composition had an initial TOF value (413 h-1) that was >5 times higher than that of
Au/C (80 h-1).
Figure 6.2 Plot of initial TOF with Pd surface coverage. Reaction conditions: 50 °C, 50 mL, 0.1 M MG, 0.4 M NaOH, pH = 13, and 100 mL min-1 O2.
The volcano behavior of Pd-on-Au NPs for this reaction was similar to their
behavior for glycerol oxidation reaction.[21] Previous XAS results showed the Pd surface
species at surface coverages below the volcano peak were in the form of 2D ensembles,
which were relatively resistant to oxidation; and the Pd species above the peak were in
the form of 3D ensembles, which were susceptible to oxidation, resulting in lowered
catalyst activity.[21,23]
6.3.3. Effect of Pd surface coverage on MGA yield from MG oxidation
In the MG oxidation using the 80 sc% Pd-on-Au/C catalyst, the concentration of the
desired product MGA increased from 0 to 45 mM over 8 h (Fig. 6.3). At the same time,
the concentration of small organic acids (e.g. glyceric acid, oxalic acid, glycolic acid,
0
50
100
150
200
250
300
350
400
450
500
0 50 100 150 200 250 300 350
Initi
al T
OF
(mol
-MG
mol
-sur
face
-ato
m-1
h-1
)
Pd surface coverage (sc%)
0
50
100
150
200
250
300
350
400
450
0 50 100 150 200 250 300 350
Initi
al T
OF
(mol
-MG
/mol
-sur
face
ato
m/h
)
Pd surface coverage (sc%) Pd

187!!
formic acid, acetic acid, and lactic acid) were found to increase over time. These products
were generated from the oxidative dehydrogenation of secondary hydroxyl groups in
MG, which led to the cleavage of C-C bonds and the generation of the shorter chain
compounds. The MGA selectivities did not vary with Pd-on-Au composition, which was
roughly 55-57% at 20% MG conversion, higher than that for Au NPs (~50% at 20% MG
conversion) (Fig. S6.3).
Figure 6.3 Reaction products and carbon balance of MG oxidation using 80 sc% Pd-on-Au/C catalyst. Reaction conditions: 50 °C, 50 mL, 0.1 M MG, 0.4 M NaOH, pH = 13, and 100 mL min-1 O2.
By dividing the sum of the carbon content of the HPLC-detected compounds over
the initial carbon content of MG, the carbon balance for the 80 sc% Pd-on-Au/C catalyst
was ~89% at the end of the 8 h reaction (Fig. 6.3). The decreasing carbon balance
suggested the generation of CO and/or CO2 undetected though HPLC, consistent with
glycerol oxidation reported in literature. [21,32]
The concentration of MGA increased with reaction time for all catalysts,
indicating no additional reaction of MGA with further MG conversion. The highest

188!!
concentration of MGA (45 mM) was observed using 80 sc% Pd-on-Au catalyst (Fig. 6.4).
The yield of MGA at reaction time of 8 h (calculated by dividing the concentration of
generated MGA by initial concentration of MG) showed that the highest MGA yield
(~46%) was achieved at the 80% Pd surface coverage, which was >2 times greater than
that for Au/C (20%).
!
Figure 6.4 Plot of MGA yields (at the end of the 8-hr reaction) with Pd surface coverage (black squares). Glucuronic acid yield from glucose oxidation using 80 sc% Pd-on-Au NPs (blue cross). Reaction conditions: 50 °C, 50 mL, 0.1 M MG (or glucose), 0.4 M NaOH, pH =13, and 100 mL min-1 O2.
For comparison, glucose oxidation at the same reaction conditions was conducted
using the 80 sc% Pd-on-Au composition. The conversion of glucose was much faster than
MG oxidation (Fig. S6.4). Glucose was completely oxidized in two hours and yielded
100% of the C1 oxidized product gluconic acid, consistent with literature.[33] The desired
C6 oxidized product (i.e. glucuronic acid) was not detected during the reaction.
189!!
6.4. Conclusion
Carbon supported Pd, Au and Pd-on-Au NPs were tested for MG oxidation. Carbon
supported bimetallic Pd-on-Au NPs exhibited a volcano-shape dependence of activity on
Pd surface coverage, while monometallic Pd/C catalysts were inactive for the reaction.
All Pd-on-Au NP catalysts were more active than monometallic Au/C, with maximum
activity and yield to MGA observed over the 80 sc% Pd-on-Au/C. This study suggests
carbon supported Pd-on-Au NPs are promising catalysts for the selective oxidation of
primary alcohol group in MG for producing glucuronic acid.
6.5. Supplementary Information
6.5.1. Materials
Tetrachloroauric(III) acid (HAuCl4·3H2O, 99.99%), palladium(II) chloride (99.99%),
tannic acid (>99.5%), potassium carbonate (>99.5%), D-(+)-glucose (≥99.5%), D-
gluconic acid sodium salt (≥99%), D-glucuronic acid (≥98%), methyl β-D-
glucopyranoside (methyl-glucoside or "MG" for short, ≥99%) and activated carbon
(Darco G-60) were purchased from Sigma-Aldrich. Methyl-glucuronic acid (1-O-methyl-
β-D-glucuronic acid sodium salt or "MGA" for short, ≥99%) was purchased from Santa
Cruz Biotechnology. Commercially available 1 wt% Pd/C was purchased from Alfa
Aesar. Trisodium citrate (>99.5%), sodium hydroxide solution (1 N), sulfuric acid
solution (0.1 N) and HCl solution (1 N) were purchased from Fisher. Oxygen gas
(99.99%) and hydrogen gas (99.99%) were purchased from Matheson Tri-Gas. All
experiments were conducted using deionized (DI) water (>18 MΩ cm).

190!!
6.5.2. NP Synthesis
Briefly, for Au NPs 0.05 g tannic acid, 0.018 g potassium carbonate and 0.04 g trisodium
citrate were added to 20 mL of DI water. This solution and a second flask containing 80
mL of 315 mM HAuCl4 solutions were heated to 60 °C at which point the first solution
was added to the second. The solution was heated to boiling for 2 min, then cooled to
room temperature and stored at 4 °C. The calculated Au NP concentration was 1.07 ×
1014 NPs per mL using a magic cluster model of 7 shells (Table S6.1).
A similar procedure was followed to synthesize Pd NPs except that the HAuCl4
solution was replaced with a H2PdCl4 solution (12 mL of 2.49 mM H2PdCl4 solution
diluted in 68 mL of H2O) and 25 min boiling time. The resulting sol had a calculated
particle concentration of 1.27×10¹⁴ NPs/mL (31.8 mg Pd/L) assuming complete reduction
of the Pd salt.
To synthesize Pd-on-Au NPs with different surface coverages (30-300 sc%,),
specific volumes of 2.49 mM H2PdCl4 solution were added to 100 mL of Au NPs (Table
S6.2). The mixture was bubbled with H2 gas at a flow rate of 200 mL min-1 for 30 min.
Metal content of Pd-on-Au NPs with varying calculated surface coverages is shown in
Table S6.3.
Table S6.1 Magic cluster model calculations for different sized Au particles.
Shell number (n) Number of atoms in shell (natom)a
Total number of atoms per NP (ntot)b
Calculated particle diameter (nm)
1 1 0.28 1 12 13 0.84 2 42 55 1.40

191!!
3 92 147 1.96 4 162 309 2.52 5 252 561 3.08 6 362 923 3.64 7 492 1415 4.20 8 642 2057 4.76 9 812 2869 5.32 10 1002 3871 5.88
a natom = 10n2 + 2
b ntot = (10n3 + 15n2 + 11n + 3)/3
Table S6.2 Synthesis amounts of Pd precursor and calculated metal content of 4 nm Pd-
on-Au NPs.a
Pd surface coverage (sc%) Volume of H2PdCl4 precursor (mL)b
Pd metal content (mol%)c
30 1.38 12.0 50 2.31 18.5 60 2.77 21.4 80 3.69 26.6 100 4.62 31.2 150 7.55 42.5 300 15.10 63.4
a All calculations are based on the magic cluster model.
b Volumes shown are for addition of a 2.49 mM H2PdCl4 solution to 100 mL of Au NP sol.
c Pd metal content of one Pd-on-Au NP.
Table S6.3 Metal content of Pd-on-Au NPs with varying calculated surface coverages
Pd surface coverage (sc%) wt% of Pd wt% of Au 30 6.8 93.2

192!!
50 10.9 89.1 60 12.8 87.2 80 16.3 83.7 100 19.6 80.4 150 28.5 71.5 300 48.3 51.7
6.5.3. Carbon-supported catalyst preparation
The carbon support helped to stabilize the NPs while the unsupported colloidal
nanoparticles was unstable and precipitated out of suspension at high pH (~13). 0.5 g of
activated carbon support was added to a 0.1 M sulfuric acid solution (pH = 1) and stirred
at 500 rpm for 30 min. For a carbon-supported Au catalyst with a loading of 1 wt% Au
(Au/C), 100 mL of Au NP sol (49.7 mg Au per L) was added to the acidified activated
carbon solution. The mixture was stirred for 2 h at 700 rpm, then filtered and washed
with DI water until the pH of filtrate remained constant (pH~6). The carbon slurry was
dried in a drying oven at 105 °C overnight. The material was then stored in the dark at
ambient condition (23 °C and 1 atm). Both untreated and treated activated carbon were
used for control experiments. Carbon-supported with 1 wt% Pd (Pd/C) was prepared
similarly by mixing 157 mL of Pd sol (31.8 mg Pd per L) with 0.5 g of activated carbon.
For carbon-supported Pd-on-Au catalysts, the immobilization procedure was the
same except that as-synthesized Pd-on-Au sols were used in place of the Au sol. The Au
loading for all Pd-on-Au/C catalysts was kept constant at 1 wt%, while the Pd loading
varied according to the Pd surface coverage. Specifically, 30, 50, 80, 100, 150 and 300

193!!
surface coverage (sc%) Pd-on-Au/C catalysts have calculated Pd loadings of 0.025,
0.074, 0.123, 0.147, 0.245, and 0.938 wt%, respectively.
6.5.4. Catalyst characterization
6.5.4.1. Transmission electron microscopy (TEM)
The images carbon-supported 80 sc% Pd-on-Au NPs samples were obtained using a
JEOL 2010 transmission electron microscope (TEM). The samples for TEM were
prepared by depositing methanol-suspended carbon supported materials onto 200-mesh
carbon/Formvar TEM grids, and then dried at room temperature (23 °C). The number-
average particle size distribution, particle size mean and standard deviation for 80 sc%
Pd-on-Au NPs sample was determined by measuring at least 200 particles using ImageJ.
6.5.4.2. Inductively Couples Plasma Optical Emission Spectrometer (ICP-OES)
To assess the metal loading on carbon support, catalyst powder was mixed with aqua
regia (HCl/HNO3=3/1(v/v)) and digested at room temperature (23 °C) for 24 h. The
solution was treated with a 0.2-µm filter before the analysis of Pd and Au loadings using
Perkin Elmer Optima 8300 Inductively Couples Plasma Optical Emission Spectrometer
(ICP-OES). Metal leaching was assessed after the MG oxidation experiments. The liquid
was filtered using a 0.2 µm micro fiber syringe filter, and Pd and Au concentrations were
analyzed by ICP-OES.
Table S6.4 Catalyst charge amounts to reactor
Catalyst Total amount
Reactor content of
Reactor content of
Reactor content of
Reactor content of

194!!
charged (mg)
total Au (mg L-1)
total Pd (mg L-1)
Au surface atoms (mg
L-1)a
Pd surface atoms (mg
L-1)a 30 sc% Pd-on-Au/C 100 20 1.5 4.9 1.5 50 sc% Pd-on-Au/C 100 20 2.4 2.4 2.4 60 sc% Pd-on-Au/C 100 20 2.9 1.0 2.9 80 sc% Pd-on-Au/C 100 20 3.9 0.2 3.9 100 sc% Pd-on-Au/C 100 20 4.9 0 4.9 150 sc% Pd-on-Au/C 100 20 8.0 0 5.5 300 sc% Pd-on-Au/C 100 20 18.7 0 7.6
Au/C 100 20 0 7.0 0 Pd/C 100 0 20 0 7.0
a Calculated based on the magic cluster model, used to report kcat values.
Figure S6.1 (a) TEM image and (b) size distribution of carbon-supported 80 sc% Pd-on-Au NPs. Each bar in the size distribution diagram represents percentage of NPs in the diameter range of 0.5 nm.
Table S6.5 Comparison of calculated and measured (*) metal loading
Catalyst Total metal loading (%) Au loading (%) Pd loading (%) Au/C 1.000 (1.02*) 1.00 (1.02*) 0.000 (0.00*) 30 sc% Pd-on-Au/C 1.025 (1.04*) 1.00 (1.01*) 0.025 (0.03*) 80 sc% Pd-on-Au/C 1.123 (1.12*) 1.00 (0.99*) 0.123 (0.13*) 150 sc% Pd-on-Au/C 1.245 (1.26*) 1.00 (1.01*) 0.245 (0.25*)
0
5
10
15
20
25
30
35
2.5 3.0 3.5 4.0 4.5 5.0 5.5
Perc
enta
ge (%
)
Particle size (nm) 10 nm
(a) (b)

195!!
Figure S6.2 (a) Plot of ln(C/C0) vs. time for 0, 30, 50 and 80 sc% Pd-on-Au/C catalysts and (b) Plot of ln(C/C0) vs. time for 80, 100, 150, 300 sc% Pd-on-Au/C and Pd/C catalysts. Reaction conditions: 50 °C, 50 mL, 0.1 M MG, 0.4 M NaOH, pH = 13, and 100 mL min-1 O2.
Table S6.6 Initial MG/metal molar ratios and catalytic activity results for carbon-supported Au, Pd, and Pd-on-Au NPs. Reaction conditions: 50°C, 50 mL, 0.1 M MG, 0.4 M NaOH, pH = 13, and 100 mL min-1 O2.
Catalyst kmeas (h-1)
TOF (h-1)
C 0 0 0 sc% Pd-onAu (Au/C) 0.07 80
30 sc% Pd-onAu 0.09 94 50 sc% Pd-onAu 0.24 162 80 sc% Pd-onAu 0.45 413 100 sc% Pd-onAu 0.30 263 150 sc% Pd-onAu 0.21 162 300 sc% Pd-onAu 0.14 78
Pd/C 0 0

196!!
Figure S6.3 MGA selectivity vs. MG conversion. Reaction conditions: 50 °C, 50 mL, 0.1 M MG, 0.4 M NaOH, pH =13, and 100 mL min-1 O2.
Figure S6.4 Glucose and MG conversion-time profiles for their oxidation reaction. Reaction conditions: 80 sc% Pd-on-Au/C, 50 °C, 50 mL, 0.1 M glucose (or MG), pH 13 and 100 mL min-1 O2.
6.6. Reference
197!!
[1] J.N. Chheda, G.W. Huber, J.A. Dumesic, Liquid-Phase Catalytic Processing of Biomass-Derived Oxygenated Hydrocarbons to Fuels and Chemicals, Angew. Chemie Int. Ed. 46 (2007) 7164–7183. doi:10.1002/anie.200604274.
[2] A. Corma Canos, S. Iborra, A. Velty, Chemical routes for the transformation of biomass into chemicals, Chem. Rev. 107 (2007) 2411–2502. doi:10.1021/cr050989d.
[3] S. Biella, L. Prati, M. Rossi, Selective Oxidation of D-Glucose on Gold Catalyst, J. Catal. 206 (2002) 242–247. doi:10.1006/jcat.2001.3497.
[4] B.T. Kusema, D.Y. Murzin, Catalytic oxidation of rare sugars over gold catalysts, Catal. Sci. Technol. 3 (2013) 297–307. doi:10.1039/C2CY20379K.
[5] G.F. Dutton, Glucuronic acid Free and Combined: Chemistry, Biochemistry, Pharmacology, and Medicine, 1966.
[6] H. Röper, Selective Oxidation of D-Glucose: Chiral Intermediates for Industrial Utilization, Starch - Stärke. 42 (1990) 342–349. doi:10.1002/star.19900420905.
[7] P.L. Bragd, A.C. Besemer, H. van Bekkum, Bromide-free TEMPO-mediated oxidation of primary alcohol groups in starch and methyl α-d-glucopyranoside, Carbohydr. Res. 328 (2000) 355–363. doi:10.1016/S0008-6215(00)00109-9.
[8] S. De, S. Dutta, B. Saha, Critical design of heterogeneous catalysts for biomass valorization: current thrust and emerging prospects, Catal. Sci. Technol. 6 (2016) 7364–7385. doi:10.1039/C6CY01370H.
[9] A. Abbadi, H. van Bekkum, Effect of pH in the Pt-catalyzed oxidation of d-glucose to d-gluconic acid, J. Mol. Catal. A Chem. 97 (1995) 111–118. doi:10.1016/1381-1169(94)00078-6.
[10] J. Song, H. Fan, J. Ma, B. Han, Conversion of glucose and cellulose into value-added products in water and ionic liquids, Green Chem. 15 (2013) 2619. doi:10.1039/c3gc41141a.
[11] M.J. Climent, A. Corma, S. Iborra, Converting carbohydrates to bulk chemicals and fine chemicals over heterogeneous catalysts, Green Chem. 13 (2011) 520. doi:10.1039/c0gc00639d.
[12] L. Chen, J. Zhao, S. Pradhan, B.E. Brinson, G.E. Scuseria, Z.C. Zhang, M.S. Wong, Ring-locking enables selective anhydrosugar synthesis from carbohydrate pyrolysis, Green Chem. 18 (2016) 5438–5447. doi:10.1039/C6GC01600F.
[13] H.E. Van Dam, A.P.G. Kieboom, H. Van Bekkum, Pt/C oxidation catalysts. Part 1. Effect of carrier structure on catalyst deactivation during the oxidation of glucose 1-phosphate into glucuronic acid 1-phosphate, Appl. Catal. 33 (1987) 361–372. doi:10.1016/S0166-9834(00)83067-5.
[14] Y. Schuurman, B.F.M. Kuster, K. van der Wiele, G.B. Marin, The Selective

198!!
Oxidation Of Methyl-alpha-D-Glucoside On A Carbon Supported Pt Catalyst, Stud. Surf. Sci. Catal. 72 (1992) 43–55. doi:10.1016/S0167-2991(08)61657-2.
[15] H. Yuan, H. Liu, Z. Du, Y. Wu, Synthesis of glucuronic acid from methyl glucoside by heterogeneous selective catalytic oxidation, Chem. Eng. J. 207 (2012) 72–75. doi:10.1016/j.cej.2012.07.010.
[16] H. Yuan, Z. Du, Z. Yan, Y. Wu, Selective oxidation of primary alcohol from methyl glucoside over Pd/La0.5Pb0.5Mn0.9 Sn0.1O3 catalyst, Acta Chim. Sin. 67 (2009) 345–351.
[17] A. Wang, X.Y. Liu, C.-Y. Mou, T. Zhang, Understanding the synergistic effects of gold bimetallic catalysts, J. Catal. 308 (2013) 258–271. doi:10.1016/j.jcat.2013.08.023.
[18] F. Tao, Synthesis, catalysis, surface chemistry and structure of bimetallic nanocatalysts, Chem. Soc. Rev. 41 (2012) 7977. doi:10.1039/c2cs90093a.
[19] T.A.G. Silva, E. Teixeira-Neto, N. López, L.M. Rossi, Volcano-like behavior of Au-Pd core-shell nanoparticles in the selective oxidation of alcohols, Sci. Rep. 4 (2015) 5766. doi:10.1038/srep05766.
[20] C.L. Bianchi, P. Canton, N. Dimitratos, F. Porta, L. Prati, Selective oxidation of glycerol with oxygen using mono and bimetallic catalysts based on Au, Pd and Pt metals, Catal. Today. 102 (2005) 203–212. doi:10.1016/j.cattod.2005.02.003.
[21] Z. Zhao, J. Arentz, L.A. Pretzer, P. Limpornpipat, J.M. Clomburg, R. Gonzalez, N.M. Schweitzer, T. Wu, J.T. Miller, M.S. Wong, Volcano-shape glycerol oxidation activity of palladium-decorated gold nanoparticles, Chem. Sci. 5 (2014) 3715. doi:10.1039/C4SC01001A.
[22] K.N. Heck, B.G. Janesko, G.E. Scuseria, N.J. Halas, M.S. Wong, Using catalytic and surface-enhanced Raman spectroscopy-active gold nanoshells to understand the role of basicity in glycerol oxidation, ACS Catal. 3 (2013) 2430–2435. doi:10.1021/cs400643f.
[23] Z. Zhao, J. Miller, N.M. Schweitzer, M. Wong, J.T. Miller, @bullet Tianpin, W. @bullet, N.M. Schweitzer, M.S. Wong, EXAFS characterization of palladium-on-gold catalysts before and after glycerol oxidation, (n.d.). doi:10.1007/s11244-015-0371-3.
[24] H. Qian, Z. Zhao, J. Velazquez, L. Pretzer, Supporting palladium metal on gold nanoparticles improves its catalysis for nitrite reduction, Nanoscale. (2014) 358–364. doi:10.1039/c3nr04540d.
[25] L.N. Lewis, Chemical catalysis by colloids and clusters, Chem. Rev. 93 (1993) 2693–2730. doi:10.1021/cr00024a006.
[26] J.M. Thomas, Colloidal metals: past, present and future, Pure Appl. Chem. 60 (1988). doi:10.1351/pac198860101517.
199!!
[27] T. Teranishi, M. Miyake, Size Control of Palladium Nanoparticles and Their Crystal Structures, Chem. Mater. 10 (1998) 594–600. doi:10.1021/cm9705808.
[28] M.O. Nutt, K.N. Heck, P. Alvarez, M.S. Wong, Improved Pd-on-Au bimetallic nanoparticle catalysts for aqueous-phase trichloroethene hydrodechlorination, Appl. Catal. B Environ. 69 (2006) 115–125. doi:10.1016/j.apcatb.2006.06.005.
[29] Y.-L. Fang, J.T. Miller, N. Guo, K.N. Heck, P.J.J. Alvarez, M.S. Wong, Structural analysis of palladium-decorated gold nanoparticles as colloidal bimetallic catalysts, Catal. Today. 160 (2011) 96–102. doi:10.1016/j.cattod.2010.08.010.
[30] L.A. Pretzer, H.J. Song, Y.-L. Fang, Z. Zhao, N. Guo, T. Wu, I. Arslan, J.T. Miller, M.S. Wong, Hydrodechlorination catalysis of Pd-on-Au nanoparticles varies with particle size, J. Catal. 298 (2013) 206–217. doi:10.1016/j.jcat.2012.11.005.
[31] S.E. Davis, M.S. Ide, R.J. Davis, Selective oxidation of alcohols and aldehydes over supported metal nanoparticles, Green Chem. 15 (2013) 17–45. doi:10.1039/C2GC36441G.
[32] S. Carrettin, P. McMorn, P. Johnston, K. Griffin, C.J. Kiely, G.J. Hutchings, Oxidation of glycerol using supported Pt, Pd and Au catalysts, Phys. Chem. Chem. Phys. 5 (2003) 1329–1336. doi:10.1039/b212047j.
[33] M. Comotti, C. Della Pina, M. Rossi, Mono- and bimetallic catalysts for glucose oxidation, J. Mol. Catal. A Chem. 251 (2006) 89–92. doi:10.1016/j.molcata.2006.02.014.
! !

200!!
Chapter 7
Recommendations for Future Work
7.1. Recommendations for future work
The idea of using Au-based nanostructures to deign new DWTM systems including novel
sensors and catalytic converters guided this thesis work and also opens up new thoughts
and directions for future researchers to follow. Several recommendations for future work
are discussed below.
7.1.1. Simultaneous sensing multiple contaminants using luminescent Au
nanostructures
Chapter 2 discussed the use of novel Au microcapsules for selective sensing of Cr(VI) at
ultralow concentration level and the design of paper-based test strip for household water
monitoring. However, multiple contaminants are usually present in water together. It is
desired to have a device that can simultaneously detect the presence of various
contaminants and indicate the contamination level.

201!!The luminescent Au NCs have the capacity to achieve the sensing of multiple
contaminants, because the Au NCs with different surface ligands can interact with
different types of contaminants specifically. For example, lysozyme type VI-stabilized
gold nanoclusters (Lys VI-AuNCs) was studied for the ultrasensitive detection of
Hg2+ based on fluorescence quenching.[1]! L-proline-stabilized fluorescent gold
nanoclusters was studied as sensing probes for iron ion.[2] Depositing Au NCs with
sensing specificity to different contaminates onto a paper strip at different areas is an
approach to design a sensor for detecting multiple contaminants. More research for Au
NCs sensing different contaminant is therefore needed (Scheme 7.1).
!
Scheme 7.1 Example of paper-based multiple contaminants test strip. Different colors indicate different contaminants sensing areas with different Au NCs
Apart from Cr(VI) contaminant discussed in Chapter 2, another common water
contaminants required POU monitoring is lead (Pb). Pb shows adverse effects on the
central nervous system of human. The United States Environmental Protection Agency
(US EPA) has established a maximum contaminant level (MCL) of 15 ppb for Pb in
drinking water. Unfortunately, the unmonitored Pb leaching from pipeline caused the
Flint water crisis in 2014 in Flint, Michigan, which exposed several thousands of people
to high dosages of Pb. Currently, there is no low-cost and high-sensitivity household
device can detect Pb in water.
I have been investigating luminescent Au NCs stabilized by bovine serum

202!!
albumin (BSA-Au NCs) for the sensing of Pb in water with my supervised undergraduate
student and a new graduate student. The preliminary data showed the BSA-Au NCs
experienced strong fluorescence quenching in the presence of Pb ions in water (Fig. 7.1).
The observed fluorescence quenching is hypothesized to occur because of interparticle
aggregation since residual groups in BSA could easily interact with Pb. However, the
specificity of the BSA-Au NCs for sensing Pb is not good (Fig. 7.2) and the current
sensitivity of Pb is still not low enough for practical sensing applications.
!
Figure 7.1 (a) Fluorescence intensity spectra of BSA-Au NCs for different concentrations of Pb2+ at pH ~7. (b) Fluorescence quenching as a function of Pb2+ concentration in water at pH ~7. F denotes the fluorescence intensity at a certain amount of Pb2+ present, while F0 represents the original fluorescence of BSA-Au NCs with no Pb in the water sample.
Figure 7.2 Effect of 10 !M of chloride metals on the fluorescence of 2 !M of BSA-AuNCs at a neutral pH.
Future research could focus on 1) exploring the effect of masking agents such as

203!!
L-cysteine and glutamic acid to improve selectivity towards Pb in water in the presence
of multiple metal ions, 2) investigating the Pb sensitivity in real water samples, 3)
investigating fluorescence enhancement approach to improve the sensitivity, and 4)
investigating other scaffolding materials of Au NCs to improve versatility for POU
applications.
7.1.2. Improving the catalyst and reactor for on-site produced water cleanup
Chapter 4 and 5 discussed the promising usage of PdAu catalyst for H2O2 generation and
phenol degradation in simulated HFPW. Currently, the structure of PdAu catalyst is still
unknown and the configuration of reactor is not optimized. To improve the performance
of this on-site HFPW treatment system, one of the approaches is to improve the catalyst
performance by tuning its structures and another is to optimize the reactor by tuning the
operating parameters.
My earlier research in Chapter 6 demonstrated the successful synthesis of Pd-on-
Au nanostructures. Pd with preciously controlled amounts can be deposited on the 4-nm
Au NPs. The formed Pd-on-Au nanostructures usually has enhanced catalytic activity
and/or stability compared to the monometallic Pd and Au NPs. The Pd-on-Au
nanostructures may be the next version of PdAu catalyst and have the potential
application for design of the on-site produced water treatment unit.
Preliminary experiments on H2O2 generation from the oxidation of
hydroxylamine using Pd-on-Au nanostructures were conducted. The H2O2 generation
activity showed volcano-shape dependence on the Pd surface coverage on Au, with the
highest activity achieved at 100% sc Pd-on-Au catalyst. The 2-D Pd ensembles on the Au

204!!
surface were possibly the active sites for the hydroxylamine oxidation on Pd-on-Au
catalysts.
!
Figure 7.3 Plot of initial H2O2 productivity with Pd surface coverage. Reaction conditions: 23 °C, 50 mL, 10 mM hydroxylamine, pH = 9, and 50 mL min-1 O2.
Although 100% sc Pd-on-Au showed the initial highest H2O2 productivity, the
questions remained if this composition is still the best catalyst for hydroxyl radical
generation and the degradation of organic compounds. Also, further investigations on the
TDS and pH effects on the Pd-on-Au catalysts are needed.
The phenol degradation using a constructed circulating packed bed flow reactor
was demonstrated in Chapter 5, which served as the proof-of-concept purpose. The
design of the reactor is still rudimental and has much room for improvements. The
optimizations of the reactor can be conducted on tuning operating parameters such as the
gas-to-liquid ratio, flowrate, and catalyst dilution.
0
0.01
0.02
0.03
0.04
0.05
0.06
0.07
0 50 100 150 200 250 300 350
H2O
2 pro
duct
ivity
(m
mol
per
h p
er P
d su
rfac
e at
om)
Pd surface coverage (%)
0
0.01
0.02
0.03
0.04
0.05
0.06
0.07
0 50 100 150 200 250 300 350
H2O
2 pro
duct
ivity
(m
mol
per
h p
er P
d su
rfac
e at
om)
Pd surface coverage (%) Pd

205!!
7.1.3. Development of the simultaneous contaminants sensing and degradation
systems
The current DWTM systems maintain high-quality water by using separated sensing and
degradation processes. A desired feature for the future DWTM systems is to
simultaneously sense and degrade contaminants using the same material, which can
minimize the size of the system, reduce the use of materials and lower the cost of the
system.
The idea of simultaneous contaminants sensing and degradation is not new.
Several nanostructures have been proposed and investigated for this application. Kamat et
al. studied the dual roles of ZnO semiconductor film as a luminescence-based sensor and
as a photocatalyst for the simultaneous sensing and degradation of 4-chlorocatechol.[3]
Alam et al. reported the SERS and photocatalytic features of semiconductor-graphene
oxide-metal film, which can be used for organic contaminants sensing and
degradation.[4] Rakkesh et al. studied a similar SERS-based sensor with photocatalytic
property using ZnO-Ag-graphene nanosheets materials.[5] However, the complicated
preparation processof these reported materials limits their practical applications.
Au-based nanostructures exhibiting the catalytic and optical properties at the same
time are good candidates for design of the simultaneous sensing and degradation system.
However, current research focused on investigating these properties separately. Future
research on multi-functional Au-based nanostructures is a promising direction to pursue.

206!!
7.2. Reference
[1] Y.H. Lin, W.L. Tseng, Ultrasensitive sensing of Hg2+ and CH3Hg+ based on the fluorescence quenching of lysozyme Type VI-stabilized gold nanoclusters, Anal. Chem. 82 (2010) 9194–9200. doi:10.1021/ac101427y.
[2] X. Mu, L. Qi, P. Dong, J. Qiao, J. Hou, Z. Nie, H. Ma, Facile one-pot synthesis of l-proline-stabilized fluorescent gold nanoclusters and its application as sensing probes for serum iron, Biosens. Bioelectron. 49 (2013) 249–255. doi:10.1016/j.bios.2013.05.019.
[3] P. V. Kamat, R. Huehn, R. Nicolaescu, A “sense and shoot” approach for photocatalytic degradation of organic contaminants in water, J. Phys. Chem. B. 106 (2002) 788–794. doi:10.1021/jp013602t.
[4] R. Alam, I. V. Lightcap, C.J. Karwacki, P. V. Kamat, Sense and Shoot": Simultaneous Detection and Degradation of Low-Level Contaminants Using Graphene-Based Smart Material Assembly, ACS Nano. 8 (2014) 7272–7278. doi:10.1021/nn502336x.
[5] R.A. Rakkesh, D. Durgalakshmi, S. Balakumar, Graphene based nanoassembly for simultaneous detection and degradation of harmful organic contaminants from aqueous solution, RSC Adv. 6 (2016) 34342–34349. doi:10.1039/c6ra01784c.
!
Copyright © 2022 FDOKUMEN