The Effects of Direct and Indirect Subsidies on Donor Choice: An Experimental Study
17
The Effects of Direct and Indirect Subsidies on Donor Choice: An Experimental Study Abstract This paper presents an experiment to test if the structure of a subsidy accompanied with a revenue neutral tax has an effect on the contributions of a donor, i.e. crowding out, or the type of public good demanded by the donor. The experiment compares voluntary contribution behavior under a direct and an indirect subsidy. Although the crowding out was incomplete for both direct and indirect subsidies, the experiment finds that direct subsidies are more robust to crowding out effects than an indirect subsidy. Conversely, direct subsidies distort a donor’s optimal bundle of public goods more than an indirect subsidy. Thus, the study suggests that there is a tradeoff between crowding out and donor choice when choosing between direct or indirect subsidies. Section 1: Introduction Governments have several options when seeking to promote the private production of public goods through tax supported subsidies. Governments directly subsidize organizations, often referred to a not-for-profit organization (NPO), through grants, preferred contracts, or dedicated taxes. Alternatively, governments indirectly subsidize by providing incentives for individuals to voluntarily contribute to NPO. Indirect subsidies include tax deductions, tax credits, vouchers, and the percentage laws (Brooks 2003, 2004; Torok 2004). Economists have shown that subsidizing the private production of public goods tends to reduce individual donors voluntary contributions to the voluntary sector. The crowding out hypothesis stems from changes in the donor’s income due to a revenue neutral subsidy; thus, the crowding out effect can be viewed as an income effect. Additionally, donors may prefer a particular bundle of public goods from the voluntary sector. When governments directly subsidize NPOs, the marginal rate of substitution between NPOs may change, causing donors to substitute away from the directly subsidized NPOs to an unsubsidized NPO. As such, direct and indirect subsidies can be views as having an income effects as well as substitution effects for each NPO (Wolfson, 1990). This public-good crowding-out hypothesis was first formalized by Warr (1982). Roberts (1984), Bernheim (1986), Bergstrom et al. (1986), and Andreoni (1988) added scope and extent to which public expenditures crowd out voluntary contribution. Although the theory suggests that public expenditures should completely crowd out private donations, several empirical studies have shown that crowding out is incomplete (Abrams and Schmitz 1978, 1984; Clotfelter 1985; Kingma 1989). These results are echoed in laboratory experiment under a variety of controls (Andreoni 1993, Chan et al. 2002; Gronberg et al. 2012). The lack of complete crowding out in empirical and experimental studies suggests that subsidies and voluntary contributions may be weaker substitutes than theorists predicted. Some studies have argued that the reduction in voluntary contributions is cause by changes in the behavior of organizations who receive the subsidies rather than the behavior of donors. For example, Andreoni and Payne (2011) argue that a reduction in fundraising, after a grant is awarded, is largely responsible for observed crowding out.
Transcript of The Effects of Direct and Indirect Subsidies on Donor Choice: An Experimental Study

The Effects of Direct and Indirect Subsidies on Donor Choice:An Experimental Study
Abstract
This paper presents an experiment to test if the structure of a subsidy accompanied with arevenue neutral tax has an effect on the contributions of a donor, i.e. crowding out, or the type ofpublic good demanded by the donor. The experiment compares voluntary contribution behaviorunder a direct and an indirect subsidy. Although the crowding out was incomplete for both directand indirect subsidies, the experiment finds that direct subsidies are more robust to crowding outeffects than an indirect subsidy. Conversely, direct subsidies distort a donor’s optimal bundle ofpublic goods more than an indirect subsidy. Thus, the study suggests that there is a tradeoffbetween crowding out and donor choice when choosing between direct or indirect subsidies.
Section 1: Introduction
Governments have several options when seeking to promote the private production ofpublic goods through tax supported subsidies. Governments directly subsidize organizations,often referred to a not-for-profit organization (NPO), through grants, preferred contracts, ordedicated taxes. Alternatively, governments indirectly subsidize by providing incentives forindividuals to voluntarily contribute to NPO. Indirect subsidies include tax deductions, taxcredits, vouchers, and the percentage laws (Brooks 2003, 2004; Torok 2004). Economists haveshown that subsidizing the private production of public goods tends to reduce individual donorsvoluntary contributions to the voluntary sector. The crowding out hypothesis stems from changesin the donor’s income due to a revenue neutral subsidy; thus, the crowding out effect can beviewed as an income effect. Additionally, donors may prefer a particular bundle of public goodsfrom the voluntary sector. When governments directly subsidize NPOs, the marginal rate ofsubstitution between NPOs may change, causing donors to substitute away from the directlysubsidized NPOs to an unsubsidized NPO. As such, direct and indirect subsidies can be views ashaving an income effects as well as substitution effects for each NPO (Wolfson, 1990).
This public-good crowding-out hypothesis was first formalized by Warr (1982). Roberts(1984), Bernheim (1986), Bergstrom et al. (1986), and Andreoni (1988) added scope and extentto which public expenditures crowd out voluntary contribution. Although the theory suggeststhat public expenditures should completely crowd out private donations, several empiricalstudies have shown that crowding out is incomplete (Abrams and Schmitz 1978, 1984; Clotfelter1985; Kingma 1989). These results are echoed in laboratory experiment under a variety ofcontrols (Andreoni 1993, Chan et al. 2002; Gronberg et al. 2012). The lack of completecrowding out in empirical and experimental studies suggests that subsidies and voluntarycontributions may be weaker substitutes than theorists predicted. Some studies have argued thatthe reduction in voluntary contributions is cause by changes in the behavior of organizations whoreceive the subsidies rather than the behavior of donors. For example, Andreoni and Payne(2011) argue that a reduction in fundraising, after a grant is awarded, is largely responsible forobserved crowding out.

Donor behavior is not limited to the amount donated; they also have choice betweenwhich organizations are funded. Competition for donors forces organizations to differentiate andspecialize in activities which attract the most donors. Through this competition, donors conveypreferences for public goods similar to normal goods in conventional markets (Weisbrod &Dominguez, 1986). Organizations’ substantial expenditures on fundraising to attract and retaindonors are evidence of such competition (Yetman & Yetman, 2003). Conversely, governmentstend to support larger, established organizations with a wider impact. In this case, targetingorganizations that benefit the most people may reduce inefficiencies from donors seeking theirown benefit.
The crowding out hypothesis suggests that any tax incentive enacted by governmentwould cause a reduction in voluntary contributions (income effect), but few studies haveexamined the effects of subsidies on donor choice (substitution effect). Observed crowding outcould originate from a donor substituting between organizations as much as a reduction inoverall contributions to the voluntary sector. Reducing contributions to the voluntary sectorcould result in the under provision of public goods, but substitution between organizations withinthis market maybe revealing preferences for public good bundles. Moreover, the direct andindirect subsidies may differentially affect crowding out and donor choice. Comparing direct andindirect subsidies can yield useful insights into the degree of substitutability.
How these two types of tax subsidies affect donor behavior, both in terms of crowdingout and donor choice, has not been explored with economic experiments. We designed anexperiment to compare the policies of direct subsidies with indirect subsidies on the propensityof individuals to voluntarily contribute to public goods in a multiple producer model. In Section2, we introduce a model of both direct and indirect subsidies within the framework of multiplepublic goods. In Section 3, we design the experiment around the model and define thetreatments. In Section 4, the results are presented and compared to other experiments. In Section5, we discuss the implications of our results.
Section 2: Model
To analyze the effects of direct and indirect subsidies on donor behavior, we modify amultiple public-good model introduced by Blackwell and McKee (2003). In this model,individuals choose between investing their wealth in a private asset and two organizations. Oneorganization provides benefits to the entire populous, a global organization, while the other onlybenefits a subset of the populous, a local organization. The services of these organizationsbehave as public goods, returning less benefit to the individual than the private market, but morebenefit to society as a whole.
Each individual is constrained by her initial wealth. The amount that she can spend on theprivate asset and the organizations must be less than or equal to her initial wealth. Let E be theinitial wealth of the individual. The variables a, x and y are the amount of the endowment that isspent on the private asset, the global organization, and the local organization, respectively.
Since the decisions are constrained such that a + x + y = E, then a = E - x - y. Let all individualsbelong to the set G and one local organization: M1 or M2, where ⊂ G, ⊂ G, ∩ =

∅, = | | = | |, and = | |. The benefit to an individual i who belongs to M1 can bestated as (1). Give the linearity of the payoff function, the Nash equilibrium is a corner solution.That is, players contribute nothing to either organization, and individuals invest all of their
endowment in the private market. The Pareto equilibrium equates to investing all of theendowment into the organizations that produce the greatest public benefit.To analyze the effect of a direct subsidy on an individual’s decision, we can subtract the taxedamount (t) from the endowment, which further constrains the two decision variables. To reflectthe allocation effects of direct investment of tax revenues, we assume that the revenues from thetax are given, without transaction cost, to the global organization and the tax is proportional.When we add the term t to (1) to reflect these assumptions, we find (2). Since t is linearly relatedto the decision variables, αg < 1, and αm < 1; the tax does not change the Nash equilibrium or thePareto equilibrium. The marginal effect of the tax on the decision variables, xi and yi, istheoretically zero. = − − − + +∈ + ∈ (2)
To create a model that would reflect the incentives of an indirect subsidy, we allowed theindividuals to distribute the tax revenues between the global and local organization, but not intothe private asset. We added an additional decision variable, which determines the distributions ofthe tax revenues. Let γ be the distribution of the tax revenues, where 0 ≤ γ ≤ 1. The amount thatan individual gives to the global organization is x+tγ and the local organization is y+t(1-γ).Incorporating this addition variable into (2) we find (3). Once again the Nash equilibriumprediction for choices xi and yi do not change since γ is linearly related to these decisionvariables. At the Nash equilibrium, γ is equal to 1 if αg > αm and zero otherwise. Paretoequilibrium remains unchanged. Strategically, (1), (2), and (3) are equivalent with respect to thevoluntary-contribution decision variables, xi and yi. The tax may increase the predicted allocationof endowment to the organizations, but it should have no effect on the decisions variables: xi andyi, which reflect the voluntary contribution behavior of the individual.= − − − + +∈ + + (1 − )∈ (3)
Unlike (2), individuals have a choice between the global and the local organization in (3).As such, the taxed amount should be placed into the organization with the greater MPCR in Nashequilibrium. Therefore, we can predict that the indirect subsidy with this payoff structure shouldpresent greater funding to the organization with the higher MPCR and no difference when theMPCR of the two organizations are equal. The direct subsidy with this payoff structure shouldalways favor the global organization regardless of the relative MPCR. In addition, both the direct
= − − + ∈ + ∈ (1)
where αg and αm are the marginal per capita return (MPCR) for each organization and 1/ng < αg < 1, 1/nl < αm < 1

and indirect subsidies, should show complete crowding out of voluntary contributions, i.e. weshould observe = = 0.
Section 3: Experiment Design
Section 3.1: Public Goods Game
The experiment was designed to capture a donor’s crowding-out behavior and choicebetween the global public good and two local public goods under the two subsidies. Starting witha standard voluntary contribution mechanism, we extended the public account to a choicebetween two organizations that produce public goods. The global organization (Org A), returnedbenefit to all participants in the experiment and behaved as a pure public good. The localorganizations (either Org 1 or Org 2) returned benefits to a subset of participants (Table 1). Thedesign was an eight participant equivalent of Blackwell and McKee's (2003) 12 participantdesign.
During the experiment participants used experimental dollars, which were exchange forUS$ at a rate of e$50 to US$11. Participants were given an endowment of 20 experimentaldollars (e$) at the beginning of each round. From their initial account, they could distribute theendowment into two accounts: public and private. For each e$1 placed into the private account,the participant received e$1 in return at the end of the round. For each e$1 placed into the publicaccount, the participant had the option of giving the money to one of two organizations: theglobal organization and the local organization. Any money remaining in the initial account orpublic account at the end of the round returned no benefit to the participant.
For each e$1 allocated to the account of global organization, the amount was multipliedby either 1.6 or 3.2, depending on the treatment, and was distributed equally among allparticipants in the experiment. Therefore, each e$1 given to the account of the globalorganization, had a marginal per capita return (MPCR) of either 0.2 or 0.4. The average percapita return2 (APCR) for the global organization was always equal to its MPCR.
There are two local organizations: Org 1 and Org 2. Each local organization had fourmembers and each participant was a member of only one of the local organizations. For each e$1given to the local organization, the amount was multiplied by 1.6 and divided equally among themembers of that group. The MPCR for members of the local group was always 0.4, but theAPCR is only 0.2. Participants were not allowed to contribute to the local organization of whichthey are not a member.
[Table 1]
1 Participants were given the exchange rate of experimental dollar to U.S. dollars in the instructions. The exchangerate was the same for all sessions.2 The APCR reflect benefit to society as a whole. It is the average benefit to each member of society, regardless ofwhether that member actually benefits from the production of that good or service. Therefore, any investment inthe private asset has a MPCR of 1 to the individual and an APCR of 1/8 (there are 8 participant s in theexperiment).

Section 3.2: Treatments
The experiment was a 3 x 2 factorial, between-subject design. Three subsidy policieswere used: no subsidy or tax (NS), a direct subsidy to the global organization with revenueneutral tax (DS), and indirect subsidy with revenue neutral tax (IS). Under NS, participants hadno tax, but could voluntarily give to either the global or local organizations. The NS treatmentwas a replication of Blackwell and McKee's experiments with 2 groups instead of 3. In the DStreatment, a portion of the participants’ endowments were directly placed into the globalorganization’s account. The remaining amount could be distributed voluntarily to the private,global, and local organizations. In the IS treatment, a portion of the endowment was placed intothe public accounts of each participant. Participants could distribute the amount to either theglobal organization or their local organization, but not into their private account. The rest of theendowment could be distributed voluntarily to the private account, global, and localorganizations.
We varied the multiplier for global organization such that the MPCR of globalorganization and the local organizations were equal in one treatment and the APCR were equalin another. When the multiplier was 3.2, the MPCR for the global organization is 0.4, which wasequal to the MPCR of the local organizations. When the multiplier was 1.6, the APCR was 0.2,which was equal to the APCR of the local organizations. Varying the multiplier accounted forthe effect of the tax structure on participants’ ability to recognize and benefit from public goodswith the greatest MPCR, as observed by Blackwell and McKee. The 3 x 2 design has tworeplications of the NS treatment and three replications of the DS and IS treatments. Altogether,we had a total of 16 sessions. The endowment, number of participants, and tax rate were all heldconstant (Table 2).
[Table 2]
Section 3.3: Procedures
George Mason University and Emory University students were recruited through theICES recruiter and posted flyers respectively. In each session, eight participants were seated atcomputers and asked to read and sign a consent form. Participants read the instructions on thecomputer with periodic quizzes and demonstrative tasks. If participants were participating in asubsidy treatment (DS or IS), additional questions were given to ensure the participantscomprehension of the subsidy and tax structure.
If participants participated in the DS or IS treatment, the tax rate (presented as “PortionGiven”) and the taxed amount (presented as “Amount Given”) were displayed beneath theirendowment (see figure 1). In the DS treatment, the taxed amount was subtracted from the initialaccount and directly placed into the global account (Org A). In the IS treatment, the amounttaxed was place into the public account.
All treatments had a tax rate of 20%, an endowment of e$20, and a taxed amount of e$4.Therefore, in the DS treatment, the endowment box displayed 20, the initial account displayed 16
and the Org A account displayed 4. In the IS treatment, the endowment and initial account werethe same, but the public account displayed 4 and the Org A account displayed 0. If participantswere in the NS treatment, both the tax rate and taxed amount were not shown and the initialaccount was equal to the endowment. Participants distributed their endowment from account toaccount using arrows, which they clicked on with their mouse cursors.
Once a participant completed his decision, he submitted his decision by pressing the“submit” button. A confirmation pop-up window confirmed the outcome of his decision andwarned him if any e$ would be lost. If the participant confirmed his decision, he moved to thenext round. If not, he could change his decision. Each participant was allotted 2 minutes tocomplete his/her decision. If the participant failed to complete her decision within the allottedtime, he lost all of his endowment.
Once all participants submitted their decisions, the outcome was displayed and eachparticipant was warned that the next round was about to begin with a pop-up box. Participantswere able to review their decisions and outcomes in a table at the bottom of the screen. Theround and time were displayed at the top right hand corner. There were 30 rounds in eachsession. At the end of the session, the participants were shown their total earnings in e$ and US$.The exchange rate used in all sessions was e$50 to US$1. Participants were paid and dismissedone at a time after the experiment had ended.
[Figure 1]
Section 4: Results
Section 4.1: Hypothesis
Our model predicted that donors should not have contribution to either organizationregardless of the subsidy, but previous behavioral studies of voluntary contributions to publicgoods have established that individuals tend to contribute in spite of the Nash equilibriumpredictions. In addition, studies of crowding-out effects from a subsidy have shown that therevenue neutral tax does not reduce the contributions to the public good by the amount of the tax.It is possible then that the structure of the subsidy could affect an individual’s propensity tocontribute to any organization in the voluntary sector. Thus, one type of subsidy may exhibit alower amount of crowding out than the other. As a starting point let’s assume, as our modelspredict, that the crowding out between the two tax subsidies should be the same. Therefore, ourfirst hypothesis is that voluntary contributions under the DS treatment would be the same asthose under IS treatment.
H1: There was a difference between voluntary contributions under a direct subsidy and anindirect subsidy.
In addition, our model predicts that the direct subsidy should not be affected bydifferences in the MPCRs of the public goods while the indirect subsidy should be sensitive tothese differences. As such, we should have observed a significant difference between the amountgiven to the global organization between the two MPCR treatments with the indirect subsidy and

no significant different between the two MPCR treatment with the direct subsidy. We shouldhave found complementary shifts in contributions in the amount given to the local organization.
H2: The amount contributed to the local good changed when the relative MPCR changes under adirect subsidy.
H3: The amount contributed to the local good changed when the relative MPCR changes underan indirect subsidy.
Section 4.2: ResultsThere were two methods of determining the total contributions by a participant. First, we
could have summed the contributions to the global and the local organizations. The second wasto use the amount placed in the private account as a proxy for the total contributions. That is,since each participant was constrained by the endowment (E), the sum of all accounts must havebeen equal to the endowment ( = + + ). Thus, we could represent the total contributionsas + = − . Since E did not vary, the endowment minus the private account (a) is the totalcontributions to all public goods.
[Table 3]
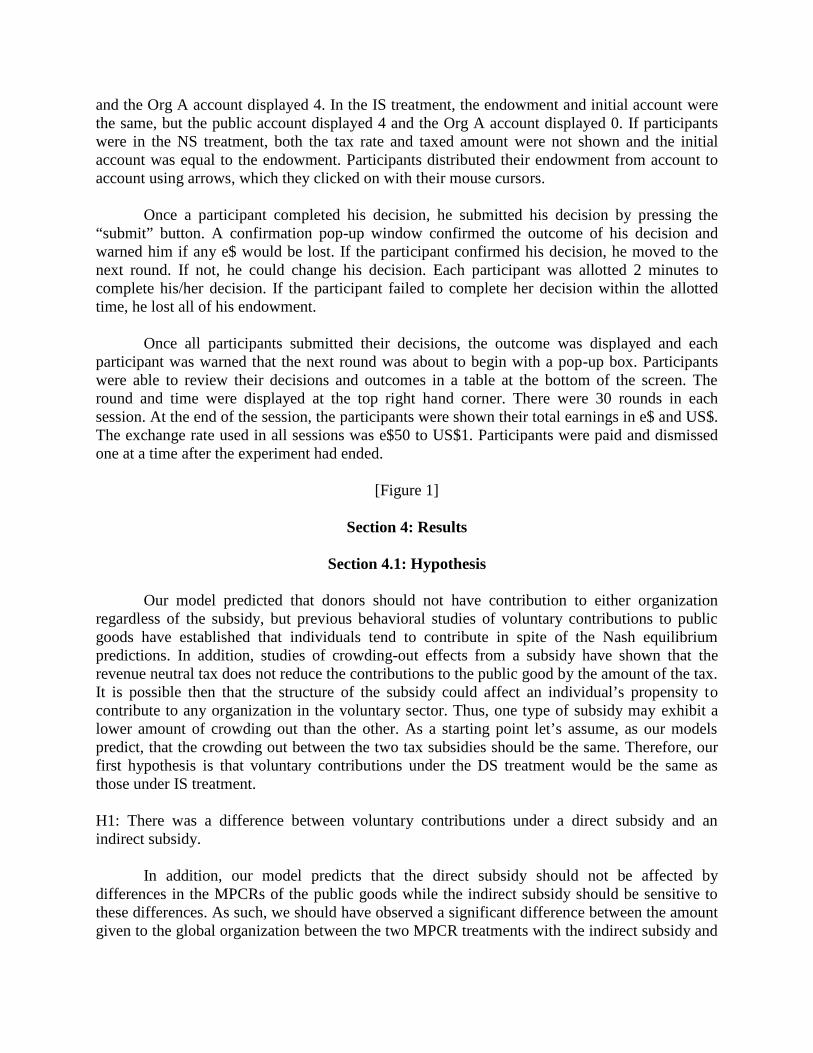
Graphs of the final ten rounds suggested that participants’ contributions were affected bythe type of subsidy (figure 2). When the global MPCR was 0.2, the average global contributionunder the DS treatment was three times that of the IS treatment, but the average localcontribution was similar for both treatments. Although local contributions were on averagegreater than the global contributions, none of the rounds show significant differences. Given thatparticipants were force to contribute at least e$4 of the endowment, participants seemed tovoluntarily give more during the DS treatment than the IS treatment when the MPCR of theglobal good was 0.2. This was supported by the summary data (Table 3).
When the global MPCR was 0.4, the global contributions were similar in both the DS andIS treatment. The local contributions in the DS and IS treatments were also similar, but severalrounds showed significantly greater contributions during the IS treatment when compared to theDS treatment. Participants seemed to behave similarly in both the DS and IS treatments, but theDS treatment showed slightly greater global contributions while the IS treatment showed greaterlocal contributions.
[Figure 2]
Given the effects of repeated play in voluntary contribution mechanisms, we opted to usea regression model to test our hypotheses. Utilizing the NS treatment as a baseline, we addeddummy variables for the treatment DS and IS treatments. The summary statistics and graphssuggested that there were interaction effects between the MPCR of the global organization andthe subsidies. As such, we added a dummy variable for the treatments interacted with theMPCRs. Thus, we had 4 treatment regressors: DSequal, DSunequal, ISequal, and ISunequal, where“equal” means that the local and global organizations have equal MPCR (MPCR of globalorganization = 0.4) and “unequal” means they were different (MPCR of global organization =

0.2). In addition, we included a regressor for the MPCR of the global organization to capture anyeffects specific to the change in MPCR.
= + + + + + _ + (4)
Where s is the participant and r is the round
As Blackwell & McKee (2003) found, the amount contributed to either the global or localpublic good depended on the total contributions to both public goods in the previous round.Regressors for the lagged total contributions to the local and global organizations were added toaccount for these effects. Previous experiments have shown that participants in a voluntarycontributions mechanism trended toward the Nash equilibrium the more rounds they played(Isaac & Walker, 1998). We added a round regressor to account for these trends. Finally, weadded a regressor for any endowment lost due to the procedures.
, = + , + , + , + , + _ ,+ , + , + , + , + , (5)
Where s is the participant and r is the round
The decisions of the participants were bounded by the endowment and zero. To accountfor these artificial limits from the experiment’s design, we implemented a censored Tobitregression. The lower bound was set at 0 while the upper bound was set at 20, the amount of theendowment. We regressed model (5) on the private account, contributions to the localorganizations, and contributions to the global organization as dependent variables (Table 4).
The lagged regressors for the total global and local contributions significantly affectedcontribution behavior, similar to previous studies. An increase in global contributionssignificantly increased global contribution while decreasing local contributions in the followinground. Conversely, an increase in local contributions significantly increased local contributionwhile decreasing global contributions in the following round. The round regressor was alsosignificant and negative for both global and local contributions. These results were consistentwith those of Blackwell and McKee (2003).
In the model with the private account as the dependent variable, all of the treatmentregressors were significant. The coefficients for the treatment variables were negative,suggesting that the subsidies increased the total contributions to the public goods. As Andreoniand others suggested (Andreoni 1993, Auten et al. 2002), there was some crowding out, but itwas not complete. In all subsidy treatments, the taxed amount was e$4. Thus, any coefficient lessthan 4 suggests some crowding out from the tax.
All but one of the subsidy treatments showed an increase contribution to the public goodsof around e$2.5. That is, there was only an e$1.5 reduction to voluntary contributions with the

subsidy. The unequal IS treatment was the only treatment to show a greater reduction involuntary contributions. The unequal IS treatment decreased private investment by e$1.5 orreduced voluntary contributions by e$2.5. Thus, it seems that the IS treatment may be moresensitive to a difference in the MPCR than the DS treatment.
[Table 4]
When the MPCR of the global and local organizations were equal, we find that there wasno significant difference in the amount placed in the private account between the DS and IStreatments ([private]DSequal=[private]ISequal, F[1,3831]=0.89, p=0.344). Conversely, when theMPCR of the global and local organizations were unequal, we find there was a significantdifference between the DS and IS treatments ([private]DSunequal=[private]ISunequal,F[1,3831]=12.88, p<0.001). That is, the DS treatment showed significantly less endowmentplaced in the private account than the IS treatment when the MPCR was unequal. Thus, weobserved significantly less crowding out in the DS treatment than the IS treatment when theMPCR was unequal.
Although we found no significant differences between the DS and IS coefficients whenMPCR was equal, we did find significant differences between the treatment coefficients in theregressions of the global and local organizations as the dependent variable. The increase in theglobal organization’s account is significantly greater under the DS treatment than under the IStreatment ([global]DSequal=[global]ISequal, F[1,3831]=3.85, p<0.05), but the opposite is true forthe local organization’s account. The local organization’s account was significantly greater in theIS treatment than that of the DS treatment ([local]DSequal=[local]ISequal, F[1,3831]=14.61,p<0.001). This suggests that, although there was no significant difference between totalcontributions to all public goods, participants favored the local organization by shifting theircontributions from the global organization to the local organizations when they were able in theIS treatment.
Similarly, when the MPCR was unequal, there was a significantly greater increase of theglobal organization’s account in the DS treatment than that of IS treatment([global]DSunequal=[global]ISunequal, F[1,3831]=43.45, p<0.001). The same was not true for thelocal organization’s account. There was no significant difference between the coefficients for DSand IS treatments ([local]DSunequal=[local]ISunequal, F[1,3831]=0.53, p=0.468). This suggested thatthe difference between the crowding out of the two subsidies, when the MPCR was unequal, waslargely from a muted increase in voluntary contributions to the local organization despite thegreater MPCR.
Hypothesis 1 did not hold for all levels of global MPCR. When the global MPCR wasless than that of the local organization, the increase in total contributions during the DS treatmentwere significantly larger than during the IS treatment. When the global MPCR was equal to the

local MPCR, the increase in total contributions was not significantly different between the DSand IS treatment.
We could not prove hypothesis 2, but we were able to determine that hypothesis 3 wastrue. Local contributions when the global MPCR was 0.2 increased significantly more than localcontributions when the global MPCR was 0.4 under the IS treatment([local]ISunequal=[local]ISequal, F[1,3831]=13.06, p<0.001). The same was not true for the DStreatment. There was no significant difference of the local contributions under the DS treatmentbetween the different MPCR treatments ([local]DSunequal=[local]DSequal, F[1,3831]=2.29,p=0.130).
Section 5: Conclusion
This study uses an economic laboratory experiment to test the behavioral effects of directand indirect subsidies to organizations that produce public goods. In particular, we examine theextent of crowding out, an income effect, and the change in donor choice, a substitution effect,caused by a revenue neutral subsidy. As other studies have found, the results of our experimentshow that crowding out is not complete for either the direct or the indirect subsidy. Participantsin our study only reduced their voluntary contributions by half of the taxed amount. It appearsthat direct subsidies elicited significantly less crowding out than indirect subsidies when therewas a difference in the marginal per capita return (MPCR) of the public goods. When the MPCRof the two public goods were the same, we found no significant difference in crowding outbetween indirect and direct subsidies.
Overall, the subsidies increased the provisioning of both public goods. When the MPCRwas the same for both goods, the direct subsidies increase both public goods by relatively thesame amount, although the tax revenue only went to the global public good. This suggests thatparticipants reduced voluntary contributions to the global public good and increased contributionto the local public good when there was a direct subsidy. This supports the hypothesis that if thesubsidy is only given to one public goods, donors substitute away from the receiving public goodto another public good, but this substitution effect may not be complete. When given the choiceunder the indirect subsidy, participants preferred allocating the tax revenue to the local publicgood. This suggests that, similar to the crowding out hypothesis, substitution effects betweenpublic goods may be muted and individuals are not able to adjust their contributions to reflect theindividual’s optimal bundle of public goods.
When the MPCR of the global good was less than the MPCR of the local good, we foundan unexpected change in behavior. Implementing either subsidy increased the amountcontributed to the local public good by roughly the same amount. The type of subsidy did changethat amount of the global good. Direct subsidies increase the amount of the global goodsignificantly more than the indirect subsidies. It seems that the observed crowding outdifferences during this MPCR treatment largely was at the expense of the global good. That is,both subsidies caused similar increase in the local public good, which suggests that the optimalincrease in the local public good is not hindered by an incomplete substitution effect. Thus, whenindirect subsidies were used, rather than allocating more of the endowment to both public goods,

participants chose to reduce their contributions all together, which is reflected in the crowdingout analysis.
This study has two implications. First, there may be a tradeoff between possible crowdingout and substitution effects between these two types of subsidies. Direct subsidies distort theoptimal bundle of public goods for an individual, but the direct subsidy seems to be more robustagainst crowding out. Alternatively, indirect subsidies distort the optimal bundle less then directsubsidies but may be more prone to crowding out behavior. If this is the case, there is a tradeoffbetween donors’ choice of public goods and extent of crowding out.
Second, if we observed only the global public good, then we would conclude that thedirect subsidy has far less crowding out than the indirect subsidy. Similar to income andsubstitution effects in consumption behavior, the observed reduction in contributions to theglobal public good is a combination of both crowding out and substitution effects. As such,empirical studies on particular public goods or class of organizations could be reporting donorssubstituting away from where the data was gathered rather than reducing overall contributions.Although these substitution effects are not complete, they may be latent explanations for thechange in donor behavior.
The design of any tax systems must consider the tradeoffs between the first and thesecond welfare theorem. Similarly, the type of subsidy for public goods may pose tradeoffsbetween overall provision of the sector and individual donors’ preferred bundle of public goods.As such, the viability of each type of subsidy may largely depend on the preferences of the taxpayers. The extent to which donor preference is an essential signal in the market for privatelyproduced public goods has not been thoroughly investigated. The effect of donor choice on thehonesty of organizations’ management and the direction of innovation may have a larger impacton the health of the voluntary sector than the effects of crowding out. Parsing the effects of donorchoice and crowding out is required before the extent of the tradeoff can be estimated.

Bibliography
Abrams, B.A. & Schitz, M.D., 1978. The "Crowding-Out" Effect of Governmental Transfers onPrivate Charitable Contributions. Public Choice, 33(1), pp.29–39.
Andreoni, J., 1993. An Experimental Test of the Public-Goods Crowding-Out Hypothesis. TheAmerican Economic Review, 83(5), pp.1317–1327.
Andreoni, J., 1989. Giving with Impure Altruism: Applications to Charity and RicardianEquivalence. Journal of Political Economy, 97(6), pp.1447–1458.
Andreoni, J. & Payne, A.A., 2011. Is crowding out due entirely to fundraising? Evidence from apanel of charities. Journal of Public Economics, 95(5–6), pp.334–343.
Bergstrom, T., Blume, L. & Varian, H., 1986. On the private provision of public goods. Journalof Public Economics, 29(1), pp.25–49.
Blackwell C. & McKee M., 2003. Only for my own neighborhood? - Preferences and voluntaryprovision of local and global public goods. Journal of Economic Behavior andOrganization, 52(1), pp.115–131.
Brooks, A.C., 2004. In Search of True Public Arts Support. Public Budgeting & Finance, 24(2),pp.88–100.
Brooks, A.C., 2000. Public subsidies and charitable giving: Crowding out, crowding in, or both?Journal of Policy Analysis and Management, 19(3), pp.451–464.
Brooks, A.C., 2003. Taxes, Subsidies, and Listeners Like You: Public Policy and Contributionsto Public Radio. Public Administration Review, 63(5), pp.554–561.
Chan, K.S. et al., 2002. Crowding-out voluntary contributions to public goods. Journal ofEconomic Behavior & Organization, 48(3), pp.305–317.
Chetty, R., Looney, A. & Kroft, K., 2007. Salience and Taxation: Theory and Evidence, NationalBureau of Economic Research. Available at: http://www.nber.org/papers/w13330[Accessed January 13, 2014].
Clotfelter, C.T., 1985. Federal tax policy and charitable giving, University of Chicago Press.
Drevs, F. et al., 2014. Crowding-in or crowding out: An empirical analysis on the effect ofsubsidies on individual willingness-to-pay for public transportation. TransportationResearch Part A: Policy and Practice, 59, pp.250–261.
Eckel, C.C., Grossman, P.J. & Johnston, R.M., 2005. An experimental test of the crowding outhypothesis. Journal of Public Economics, 89(8), pp.1543–1560.

Gerald E. Auten, Holger Sieg & Charles T. Clotfelter, 2002. Charitable Giving, Income, andTaxes: An Analysis of Panel Data. American Economic Review, 92(1), pp.371–382.
Gronberg, T.J. et al., 2012. Are tax-financed contributions to a public good completely crowded-out? Experimental evidence. Journal of Public Economics, 96(7–8), pp.596–603.
Heutel, G., 2009. Crowding Out and Crowding In of Private Donations and Government Grants,National Bureau of Economic Research. Available at:http://www.nber.org/papers/w15004 [Accessed January 13, 2014].
Holt, C.A. & Laury, S.K., 2008. Chapter 90 Theoretical Explanations of Treatment Effects inVoluntary Contributions Experiments. In Charles R. Plott and Vernon L. Smith, ed.Handbook of Experimental Economics Results. Elsevier, pp. 846–855.
Hungerman, D.M., 2009. Crowd-out and diversity. Journal of Public Economics, 93(5–6),pp.729–740.
Isaac, R.M. & Walker, J.M., 1998. Nash as an organizing principle in the voluntary provision ofpublic goods: Experimental evidence. Experimental Economics, 1(3), pp.191–206.
Keser, C., 1996. Voluntary contributions to a public good when partial contribution is adominant strategy. Economics Letters, 50(3), pp.359–366.
Kingma, B.R., 1989. An Accurate Measurement of the Crowd-out Effect, Income Effect, andPrice Effect for Charitable Contributions. Journal of Political Economy, 97(5), pp.1197–1207.
Manzoor, S.H. & Straub, J.D., 2005. The robustness of Kingma’s crowd-out estimate: Evidencefrom new data on contributions to public radio. Public Choice, 123(3-4), pp.463–476.
Roberts, R.D., 1984. A Positive Model of Private Charity and Public Transfers. Journal ofPolitical Economy, 92(1), pp.136–148.
Sefton, M. & Steinberg, R., 1996. Reward structures in public good experiments. Journal ofPublic Economics, 61(2), pp.263–287.
Torok, M., 2004. Percentage Laws: Transition to Philanthropy. Trust for Civil Society in Centraland Eastern Europe. Available at: http://www.ceetrust.org/article/148/ [Accessed March7, 2014].
Weisbrod, B.A. & Dominguez, N.D., 1986. Demand for collective goods in private nonprofitmarkets: Can fundraising expenditures help overcome free-rider behavior? Journal ofPublic Economics, 30(1), pp.83–96.
Wolfson, D.J., 1990. Towards a theory of subsidisation. De Economist, 138(2), pp.107–122.
Yetman, M.H. & Yetman, R.J., 2003. The Effect of Nonprofits’ Taxable Activities on the Supplyof Private Donations. National Tax Journal, 56(1), pp.243–58.

Table 1: Benefit to Participant by GroupMembers Private Org. A Org. 1 Org. 2
Benefit/e$ Benefit/e$ Benefit/e$ Benefit/e$
Group 1 4 1 0.4 0.4 0
Group 2 4 1 0.4 0 0.4Table of benefits to participants based on the group in which they were assigned. Note that only group 1 members benefitfrom Org. 1 contributions and only group 2 members benefit from Org. 2 contributions.
Table 2: Experiment Parameters
Treatment Name Participants Replications GroupsEndowment
(e$)
TaxRate(e$)
AmountTaxed(e$) Type MPCR APCR
Global Local Global Local
1 NT x H 8 2 2 20 0 0 NT 0.4 0.4 0.4 0.2
2 NT x L 8 2 2 20 0 0 NT 0.2 0.4 0.2 0.2
3 DS x H 8 3 2 20 20 4 DS 0.4 0.4 0.4 0.2
4 DS x L 8 3 2 20 20 4 DS 0.2 0.4 0.2 0.2
5 IS x H 8 3 2 20 20 4 IS 0.4 0.4 0.4 0.2
6 IS x L 8 3 2 20 20 4 IS 0.2 0.4 0.2 0.2Table reports parameters by treatment. “DS” represents direct subsidy, “IS” represents indirect subsidy, and “NT” represents no tax or subsidy. “H” represents a high globalmarginal per capita return and “L” represents a low global per capita return. Both MPCR and APCR are in e$.
Table 3: Summary Statistics
Treatment MPCRPrivate
AccountGlobal
ContributionsLocal
ContributionsAll
ContributionsVoluntary
Contributions
NT
0.214.89 1.54 3.52 5.06 5.06(4.31) (2.01) (3.30) (4.26) (4.26)
0.415.18 3.99 0.83 4.82 4.82(4.87) (4.59) (1.64) (4.87) (4.87)
GG
0.29.40 6.20 4.30 10.51 6.51
(5.48) (3.22) (4.72) (5.48) (5.48)
0.411.02 7.32 1.52 8.84 4.84
(5.25) (4.67) (2.74) (5.23) (5.23)
TC
0.212.54 2.49 4.77 7.26 3.26
(4.10) (2.63) (3.39) (4.16) (4.16)
0.411.27 5.83 2.65 8.48 4.48
(5.68) (5.50) (4.12) (5.84) (5.84)Table reports mean and standard deviation for each variable. “All Contributions” is the sum of both the local and the global accounts beforeaveraging. “Voluntary Contributions” is the sum of both accounts minus the compulsory contributions from the subsidy before averaging.

Table 4:Regression Coefficients(1) (2) (3)
Dependent VariablesPrivate
AccountGlobal
AccountLocal
AccountRegressors
DSequal -2.246*** 1.358*** 1.341***(0.334) (0.288) (0.364)
ISequal -2.514*** 0.881*** 2.468***(0.325) (0.282) (0.348)
DSunequal -2.618*** 2.434*** 0.656*(0.355) (0.317) (0.344)
ISunequal -1.513*** 0.662** 0.872***(0.312) (0.289) (0.293)
Global 3.673** 5.336*** -15.32***MPCR (1.865) (1.668) (1.907)
Globalt-1 -0.089*** 0.110*** -0.022***(0.005) (0.004) (0.005)
Localt-1 -0.141*** -0.0174* 0.194***(0.011) (0.009) (0.010)
Round 0.090*** -0.056*** -0.064***(0.010) (0.009) (0.010)
Lost -1.390*** -0.587*** -0.455***(0.310) (0.128) (0.111)
Constant 16.38*** -1.491*** 4.524***(0.625) (0.566) (0.607)
sigma 5.123*** 4.414*** 4.767***(0.065) (0.060) (0.075)
Observations 3,840 3,840 3,840Censored (<=0) 295 736 1477Censored (>=20) 200 117 29Table reports the result of a cencored Tobit for each of the accounts. Treatment regressors aredummy variable representing only one treatment each. The non-subsidized treatments wereutilized as a baseline for the regression.

Figure 1:Screen shot of user interface for experiment software

Figure 2:Round-by-Round Contributions by Treatment