The effects of a low-fat/high-fiber diet on sex hormone levels and menstrual cycling in...
10
The Effects of a Low-Fat/High-Fiber Diet on Sex Hormone Levels and Menstrual Cycling in Premenopausal Women A 12-Month Randomized Trial (the Diet and Hormone Study) Peter H. Gann, M.D., Sc.D. 1,2 Robert T. Chatterton, Ph.D. 2,3 Susan M. Gapstur, M.P.H., Ph.D. 1,2 Kiang Liu, Ph.D. 1 Daniel Garside, B.S. 1 Sue Giovanazzi 1 Kim Thedford 1 Linda Van Horn, Ph.D. 1 1 Department of Preventive Medicine, the Feinberg School of Medicine, Northwestern University, Chi- cago, Illinois. 2 Robert H. Lurie Comprehensive Cancer Center, the Feinberg School of Medicine, Northwestern University, Chicago, Illinois. 3 Department of Obstetrics-Gynecology, the Fein- berg School of Medicine, Northwestern University, Chicago, Illinois. See editorial on pages 1782–5, this issue. Presented in part at the 93rd Annual Meeting of the American Association for Cancer Research (Abstract 1669), San Francisco, California, April 6 –10, 2002. Supported by Public Health Service Grants KO7 CA66185, RO1 CA66695, and RO1 CA66691 from the National Cancer Institute, National In- stitutes of Health, Department of Health and Human Services, and Grant DAMD 17-94-J- 4203 from the U.S. Army Medical Research and Materiel Command. The authors gratefully acknowledge the contri- bution of many individuals, without whom the Diet and Hormone Study could never have been completed: V. Craig Jordan, Lewis Kuller, Donna Baird, Vicki Persky, Carolyn Clifford, Julie Hauselman, Lisa Gorlewski, Gayle Wells, Ralph Kazer, Joseph Shayka, Erin Anderson, Laura Studee, Kat Brangan, Dachao Liu, Cheryl West- brook, Allison Ellman, Amy Klein, Debra Davis, Niki Gernhofer, Eileen Vincent, Xiao-Yen Xie, Ryan Deaton, and the entire group of patient and dedicated study participants. Address for reprints: Peter H. Gann, M.D., Sc.D., Department of Preventive Medicine, 680 N. Lake Shore Drive, Suite 1102, Chicago, IL 60611; Fax: (312) 908-9588; E-mail: [email protected] Received February 24, 2003; revision received June 11, 2003; accepted June 18, 2003. BACKGROUND. Reduction of cumulative exposure to endogenous ovarian steroid hormones is a postulated method for reducing the risk of carcinoma of the breast and other malignancies. Although there are data from trials evaluating the effect of low-fat and high-fiber diets on sex hormone levels in premenopausal women, to the authors’ knowledge none of these trials has combined a relatively large number of participants, follow-up of 2–3 months, parallel controls receiving a usual diet, and careful timing of blood sampling within the menstrual cycle. METHODS. A total of 213 healthy women, ages 20 – 40 years, were randomly as- signed to follow their usual diet or to adopt an isocaloric diet with goals of 20% calories as fat, total fiber of 25 g/day, and at least 8 fruit or vegetable servings per day. Serum levels of total estradiol (E2), sex hormone-binding globulin (SHBG), non-SHBG-bound estradiol (NSBE2), SHBG, and progesterone were eval- uated during a menstrual cycle at baseline, and at 4 cycles (C4) and 12 cycles (C12) after the start of the intervention. Serum was collected during each test cycle 7–9 days after the detection of an luteinizing hormone peak in the urine. One hundred eighty-nine women provided serum at C4 and 176 women at C12. RESULTS. Serum E2 decreased by an average of 7.5% or 7.8 pg/mL (95% confidence interval [95% CI], -16.0 – 0.04) at C12 in the intervention group, versus a decrease of 0.9% or 0.9 pg/mL (95% CI, -9.5–7.7) in the control group (the P value for the difference between the treatment groups was 0.25). Results for NSBE2 were very similar to those for total estradiol. There were no material effects found to result from intervention with regard to SHBG or progesterone. The results did not differ by baseline age, body mass index, or baseline hormone level above or below the median, and were not likely to be affected by weight change, which amounted to a mean loss of only 0.23 kg in the diet group versus a gain of 0.17 kg in the control group. The decrease in serum E2 associated with intervention was not greater when subjects were stratified by self-reported adherence to the dietary goals. CONCLUSIONS. The results of the current study suggest that the effects of this isocaloric low-fat, high-fiber diet pattern on circulating ovarian steroids were modest or nonexistent. However, the observed 7.5% reduction in estradiol could have biologic significance if it persisted over many years. Moreover, underestima- tion of the true dietary effect could have occurred because of incomplete adher- ence to assigned diets. Weight loss and weight control through midlife could be a 1870 © 2003 American Cancer Society DOI 10.1002/cncr.11735
Transcript of The effects of a low-fat/high-fiber diet on sex hormone levels and menstrual cycling in...
The Effects of a Low-Fat/High-Fiber Diet on SexHormone Levels and Menstrual Cycling inPremenopausal WomenA 12-Month Randomized Trial (the Diet and Hormone Study)
Peter H. Gann, M.D., Sc.D.1,2
Robert T. Chatterton, Ph.D.2,3
Susan M. Gapstur, M.P.H., Ph.D.1,2
Kiang Liu, Ph.D.1
Daniel Garside, B.S.1
Sue Giovanazzi1
Kim Thedford1
Linda Van Horn, Ph.D.1
1 Department of Preventive Medicine, the FeinbergSchool of Medicine, Northwestern University, Chi-cago, Illinois.
2 Robert H. Lurie Comprehensive Cancer Center,the Feinberg School of Medicine, NorthwesternUniversity, Chicago, Illinois.
3 Department of Obstetrics-Gynecology, the Fein-berg School of Medicine, Northwestern University,Chicago, Illinois.
See editorial on pages 1782–5, this issue.
Presented in part at the 93rd Annual Meeting ofthe American Association for Cancer Research(Abstract 1669), San Francisco, California, April6–10, 2002.
Supported by Public Health Service Grants KO7CA66185, RO1 CA66695, and RO1 CA66691from the National Cancer Institute, National In-stitutes of Health, Department of Health andHuman Services, and Grant DAMD 17-94-J-4203 from the U.S. Army Medical Research andMateriel Command.
The authors gratefully acknowledge the contri-bution of many individuals, without whom theDiet and Hormone Study could never have beencompleted: V. Craig Jordan, Lewis Kuller, DonnaBaird, Vicki Persky, Carolyn Clifford, JulieHauselman, Lisa Gorlewski, Gayle Wells, RalphKazer, Joseph Shayka, Erin Anderson, LauraStudee, Kat Brangan, Dachao Liu, Cheryl West-brook, Allison Ellman, Amy Klein, Debra Davis,Niki Gernhofer, Eileen Vincent, Xiao-Yen Xie,
Ryan Deaton, and the entire group of patient anddedicated study participants.
Address for reprints: Peter H. Gann, M.D., Sc.D.,Department of Preventive Medicine, 680 N. Lake
Shore Drive, Suite 1102, Chicago, IL 60611; Fax:(312) 908-9588; E-mail: [email protected]
Received February 24, 2003; revision receivedJune 11, 2003; accepted June 18, 2003.
BACKGROUND. Reduction of cumulative exposure to endogenous ovarian steroid
hormones is a postulated method for reducing the risk of carcinoma of the breast
and other malignancies. Although there are data from trials evaluating the effect of
low-fat and high-fiber diets on sex hormone levels in premenopausal women, to
the authors’ knowledge none of these trials has combined a relatively large number
of participants, follow-up of � 2–3 months, parallel controls receiving a usual diet,
and careful timing of blood sampling within the menstrual cycle.
METHODS. A total of 213 healthy women, ages 20 – 40 years, were randomly as-
signed to follow their usual diet or to adopt an isocaloric diet with goals of 20%
calories as fat, total fiber of 25 g/day, and at least 8 fruit or vegetable servings per
day. Serum levels of total estradiol (E2), sex hormone-binding globulin
(SHBG), non-SHBG-bound estradiol (NSBE2), SHBG, and progesterone were eval-
uated during a menstrual cycle at baseline, and at 4 cycles (C4) and 12 cycles (C12)
after the start of the intervention. Serum was collected during each test cycle 7–9
days after the detection of an luteinizing hormone peak in the urine. One hundred
eighty-nine women provided serum at C4 and 176 women at C12.
RESULTS. Serum E2 decreased by an average of 7.5% or 7.8 pg/mL (95% confidence
interval [95% CI], -16.0 – 0.04) at C12 in the intervention group, versus a decrease of
0.9% or 0.9 pg/mL (95% CI, -9.5–7.7) in the control group (the P value for the
difference between the treatment groups was 0.25). Results for NSBE2 were very
similar to those for total estradiol. There were no material effects found to result
from intervention with regard to SHBG or progesterone. The results did not differ
by baseline age, body mass index, or baseline hormone level above or below the
median, and were not likely to be affected by weight change, which amounted to
a mean loss of only 0.23 kg in the diet group versus a gain of 0.17 kg in the control
group. The decrease in serum E2 associated with intervention was not greater
when subjects were stratified by self-reported adherence to the dietary goals.
CONCLUSIONS. The results of the current study suggest that the effects of this
isocaloric low-fat, high-fiber diet pattern on circulating ovarian steroids were
modest or nonexistent. However, the observed 7.5% reduction in estradiol could
have biologic significance if it persisted over many years. Moreover, underestima-
tion of the true dietary effect could have occurred because of incomplete adher-
ence to assigned diets. Weight loss and weight control through midlife could be a
1870
© 2003 American Cancer SocietyDOI 10.1002/cncr.11735
more effective and feasible approach to dietary intervention in reducing the risk of
breast carcinoma. Cancer 2003;98:1870 –9. © 2003 American Cancer Society.
KEYWORDS: diet, fat, fiber, breast neoplasms, sex steroids, estradiol, progesterone.
The hypothesis that excess cumulative exposure toestradiol and progesterone in premenopausal
women increases the risk of developing breast carci-noma offers a unifying explanation for diverse epide-miologic and laboratory findings. These findings in-clude the consistent observation of an increased riskin women with earlier menarche, later menopause,nulliparity, or delayed childbirth, and the observationof lower steroid hormone levels in populations with alow incidence of breast carcinoma.1
Diet also is likely to play a major role in the etiol-ogy of breast carcinoma, but the limitations of dietaryassessment methodology in observational studies andthe absence of definitive biomarkers of dietary expo-sure have complicated attempts to establish causal-ity.2 Moreover, the mechanisms underlying the poten-tial effects of diet on breast carcinoma risk are to ourknowledge unknown. There are plausible mecha-nisms, however, by which fat, fiber, and fruit/vegeta-ble consumption could reduce the risk of breast car-cinoma by lowering cumulative exposure toendogenous ovarian steroids, independent of anychange in energy intake and adiposity.3
Previous intervention studies of low-fat/high-fiber(LFHF) diets in premenopausal women to our knowl-edge typically have involved relatively few study sub-jects, food provided by investigators, and a short fol-low-up.4 In addition, extreme variability in estrogenand progesterone levels during the menstrual cyclehas been a major barrier to estimating the effect ofdiet on circulating hormone levels. Timing of samplesis most difficult during the mid-luteal phase, whenbreast epithelial cell division is highest and thereforepotentially more relevant to risk.5
The Diet and Hormone Study (DHS) was designedto extend previous research by enrolling a larger sam-ple of women into a diet intervention for a total periodof approximately 15 months, by incorporating a com-parison group randomly assigned to maintain theirusual diet, and by developing measurements to assesshormone levels at a consistent point during the men-strual cycle without the need for frequent venipunc-ture. In this analysis we examined the effect of a1-year, isocaloric dietary intervention aimed at reduc-ing fat (� 20% kcal) and increasing fruit/vegetableintake (� 8 serving per day) and fiber (25–30 g per day)intake on hormonal responses among healthy, nor-mally menstruating, premenopausal women.
MATERIALS AND METHODSEnrollment of Study PopulationVolunteers were recruited through advertising and di-rect mail in the downtown Chicago area. Healthywomen ages 20 – 40 years were recruited to participate.We excluded potential participants based on the fol-lowing criteria: 1) currently consuming a low-fat dietor other prescription diet, 2) irregular menstrual peri-ods (defined as greater than one missed period or twounusually short or long periods during the precedingyear), 3) current or recent use of oral contraceptives orother hormone-influencing medication, 4) pregnantor planning pregnancy within the trial period, and 5)significant chronic illness affecting work or daily func-tioning. Women interested in weight loss and unwill-ing to postpone it until after the trial were counseledagainst participating because the isocaloric study dietwas designed to maintain weight. Potentially eligibleparticipants based on preliminary data from a tele-phone-administered screening questionnaire were in-vited to attend a clinic visit for a final eligibility deter-mination. At this visit, the goals were to evaluate theparticipant’s understanding of the project and willing-ness to comply, to obtain written consent, and toexplain procedures for sample collection during thebaseline cycle. Subjects who had difficulty complyingwith the sample collection procedures during thebaseline cycle were excluded from randomization. Atotal of 3179 women completed the screening ques-tionnaire, 864 had clinic visits for eligibility determi-nation, 265 started baseline cycle data collection, and213 were eligible for randomization. We obtained writ-ten informed consent from all trial participants. TheNorthwestern University Institutional Review Board,under assurances filed with the U.S. Department ofHealth and Human Services, approved the entirestudy protocol.
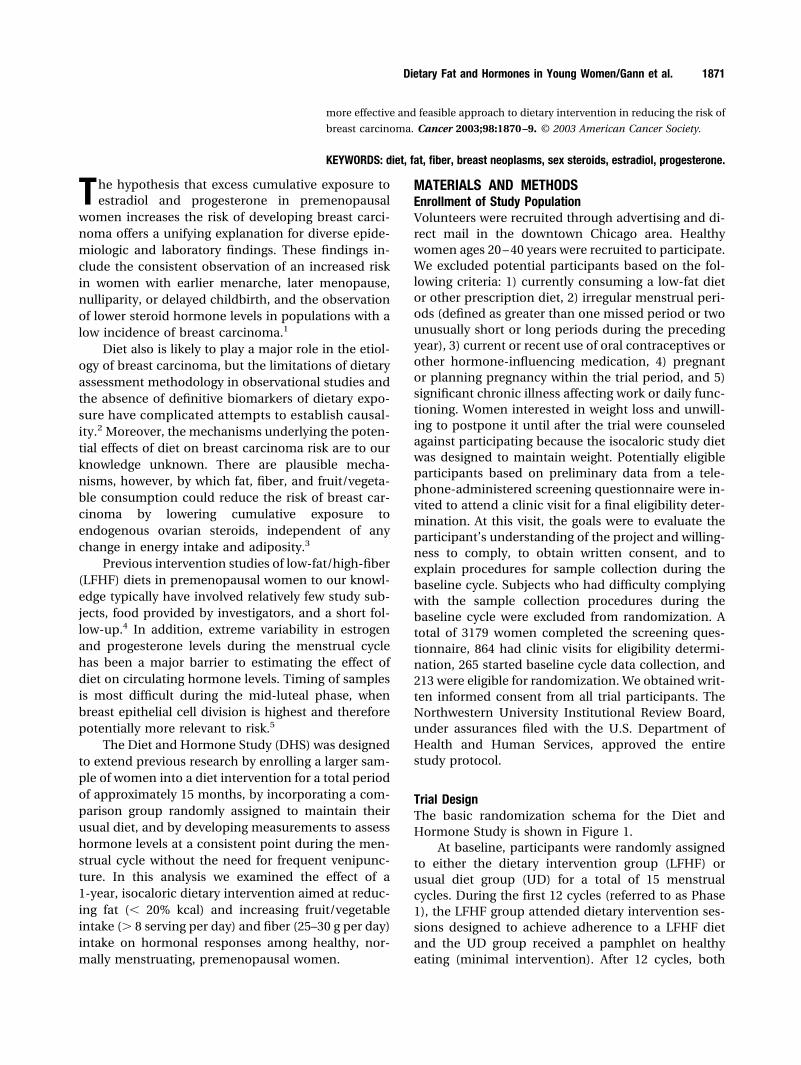
Trial DesignThe basic randomization schema for the Diet andHormone Study is shown in Figure 1.
At baseline, participants were randomly assignedto either the dietary intervention group (LFHF) orusual diet group (UD) for a total of 15 menstrualcycles. During the first 12 cycles (referred to as Phase1), the LFHF group attended dietary intervention ses-sions designed to achieve adherence to a LFHF dietand the UD group received a pamphlet on healthyeating (minimal intervention). After 12 cycles, both
Dietary Fat and Hormones in Young Women/Gann et al. 1871
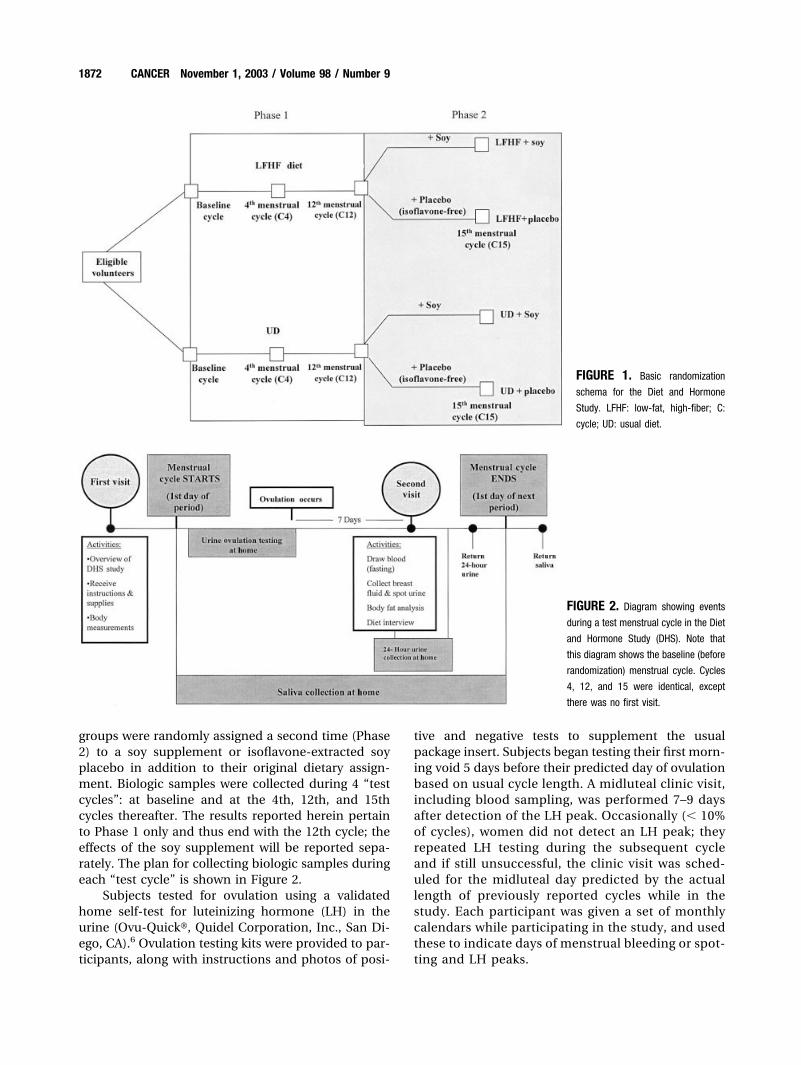
groups were randomly assigned a second time (Phase2) to a soy supplement or isoflavone-extracted soyplacebo in addition to their original dietary assign-ment. Biologic samples were collected during 4 “testcycles”: at baseline and at the 4th, 12th, and 15thcycles thereafter. The results reported herein pertainto Phase 1 only and thus end with the 12th cycle; theeffects of the soy supplement will be reported sepa-rately. The plan for collecting biologic samples duringeach “test cycle” is shown in Figure 2.
Subjects tested for ovulation using a validatedhome self-test for luteinizing hormone (LH) in theurine (Ovu-Quick�, Quidel Corporation, Inc., San Di-ego, CA).6 Ovulation testing kits were provided to par-ticipants, along with instructions and photos of posi-
tive and negative tests to supplement the usualpackage insert. Subjects began testing their first morn-ing void 5 days before their predicted day of ovulationbased on usual cycle length. A midluteal clinic visit,including blood sampling, was performed 7–9 daysafter detection of the LH peak. Occasionally (� 10%of cycles), women did not detect an LH peak; theyrepeated LH testing during the subsequent cycleand if still unsuccessful, the clinic visit was sched-uled for the midluteal day predicted by the actuallength of previously reported cycles while in thestudy. Each participant was given a set of monthlycalendars while participating in the study, and usedthese to indicate days of menstrual bleeding or spot-ting and LH peaks.
FIGURE 1. Basic randomization
schema for the Diet and Hormone
Study. LFHF: low-fat, high-fiber; C:
cycle; UD: usual diet.
FIGURE 2. Diagram showing events
during a test menstrual cycle in the Diet
and Hormone Study (DHS). Note that
this diagram shows the baseline (before
randomization) menstrual cycle. Cycles
4, 12, and 15 were identical, except
there was no first visit.
1872 CANCER November 1, 2003 / Volume 98 / Number 9
Randomization and InterventionEligible participants were randomly assigned to eitherthe LFHF or UD group by reference to a randomnumber table. The LFHF goals were 1) total fat intakeof � 20% kcal, 2) total fiber intake of 25–30 g/day, 3)fruit/vegetable intake of � 8 servings/day, and 4) car-bohydrate intake of 60 – 65% kcal per day (with em-phasis on complex carbohydrates) and protein intakeof 15–20% kcal per day. Participants were not encour-aged to reduce total caloric intake and weight wasmonitored to maintain within 2 kg of baseline weight.Diet modification involved 18 group classes and 2individual meetings in 12 months. At the conclusion ofthe study, women who were randomized to the UDgroup were sent the same materials given to thewomen in the intervention group.
The intervention combined classroom nutritioneducation plus individual counseling to providewomen with both the knowledge and behavioral skillsnecessary to make a permanent lifestyle change andadopt a LFHF eating pattern. To maximize the impactof the intervention, we prepared and served appropri-ate foods and meals at intervention sessions to rein-force new eating behaviors and demonstrate the easeof preparation. Sessions included discussion andpractice of shopping, label reading, and meal prepa-ration techniques to improve self-confidence and en-thusiasm for implementing these behaviors at home.In addition, eating out and convenience foods werediscussed to assist the women in making appropriateselections without isolating themselves from theirpeers.
Dietary AssessmentAt baseline and during each test cycle, participantscompleted 3 24-hour diet recalls, which were admin-istered over the telephone by a trained nutritionist on2 random weekdays and 1 random weekend day. Nu-trient composition from each 24-hour recall was cal-culated using Versions 27 and 28 of the Nutrient DataSystem (NDS) software, developed by the NutritionCoordinating Center at the University of Minnesota.The three recalls were averaged to estimate the meandietary intake during the test cycle. At baseline andagain at Cycle 12, participants completed a validatedBlock food frequency questionnaire, which was re-viewed in person with a study nutritionist. The base-line food frequency questionnaire was used to deter-mine ineligibility due to a very low fat or other unusualdietary pattern.
Serum AssaysSerum hormone concentrations were measured in theImmunoassay Core Facility of the Robert H. Lurie
Comprehensive Cancer Center and supervised by oneof the authors (R. T. C.). Estradiol and SHBG weremeasured using radioimmunoassay (RIA) kits pro-vided by DSL, Inc. (Webster, TX). Progesterone wasmeasured with the RIA kit using antibodies producedby the Core Facility. The percentage of estradiolbound to SHBG was measured using the concanavilinA-sepaharose method described by Bonfrer et al.,7 andthe non-SHBG-bound estradiol (E2) concentration(bioavailable E2) was estimated as the complement ofthis percentage multiplied by the total E2 concentra-tion.7 All samples from individual participants wereassayed in the same run, and unidentifiable samplesfrom quality control pools were inserted into each run.Intrarun and interrun coefficient of variations (CVs) allwere � 12%.
Data AnalysisWe initially examined univariate distributions for theserum hormone values by treatment group and cycleto evaluate deviation from normality. For some sub-groups, distributions were more normal after logtransformation. However, the difference in the trialresults with regard to untransformed versus trans-formed data or nonparametric analyses were minimal;therefore, the results are presented without transfor-mation. After comparing treatment and controlgroups for selected baseline characteristics as a checkon randomization, we performed a similar compari-son of participant groups according to their level ofcompletion of the protocol. This analysis indicated noimportant differences in baseline traits between thosecompleting all cycle visits and those completing onlyone or none of the follow-up visits.
We used multiple linear regression to model treat-ment effect with adjustment for several other baselinecovariates, including education, parity, oral contra-ceptive use, smoking, physical activity, and baselinehormone level. Because we observed no real con-founding, we computed the mean changes in hor-mone level and their 95% confidence intervals (95%CI) for participants in the treatment and controlgroups from baseline to Cycle 4 and from baseline toCycle 12, and calculated the P value based on thetwo-sided Student t test. We used generalized estimat-ing equations, with and without baseline covariates, toestimate treatment effects allowing for variation in theactual interval in days from baseline to Cycle 4 orCycle 12 blood draws.8 The duration of exposure be-tween blood samples varied not only because it de-pended on the length of an individual’s menstrualcycles, but because some women were not able to besampled precisely at Cycle 4 or Cycle 12 and thus mayhave postponed their visit for an additional cycle or
Dietary Fat and Hormones in Young Women/Gann et al. 1873
two. We evaluated potential effect modification byincluding multiplicative interaction terms in regres-sion models and by evaluating hormonal responseswithin strata defined by baseline variables. Baselinevariables tested for effect modification in subgroupanalyses included age, race, body mass index, baselinehormone level, baseline fat and fiber intake, and par-ity.
Data concerning the length of each menstrual cy-cle was abstracted from monthly calendars kept byeach participant. Each cycle was divided into follicularand luteal phases according to the day of the LH peak,which was available for � 90% of the test cycles. Total,follicular, and luteal cycle length was compared be-tween treatment groups by dividing the follow-up pe-riod into thirds and computing means, 95% CI, andStudent t tests for the follow-up segments Cycles 1– 4,Cycles 5– 8, and Cycles 9 –12.
All the analyses presented herein, with one excep-tion, followed the intention-to-treat principle. Theonly postrandomization variable considered in thecurrent study was adherence to the assigned change indietary fat and fiber intake. To explore whether sug-gestive changes in the main analysis were supportedby considering adherence, we cross-classified the UDcontrols and the LFHF intervention subjects intostrata according to whether they had a reduction in fatintake of � 5% and/or an increase in fiber intake of� 4 g, comparing baseline with Cycle 12. The meanhormone and menstrual cycle length changes andtheir 95% CIs were computed within these strata.
RESULTSTable 1 shows selected sociodemographic and medi-cal characteristics of the women in each treatmentgroup at baseline. The comparison groups were verysimilar as a result of the random assignment. Thestudy population was well educated and physicallyactive, with relatively few current smokers. A total of213 women were randomly assigned to the LFHF (n� 107) or UD (n � 106) diets. One hundred ninety-onewomen completed Cycle 4 (94 in the LFHF group and97 in the UD group), and 177 completed Cycle 12 (81in the LFHF group and 96 in the UD group).
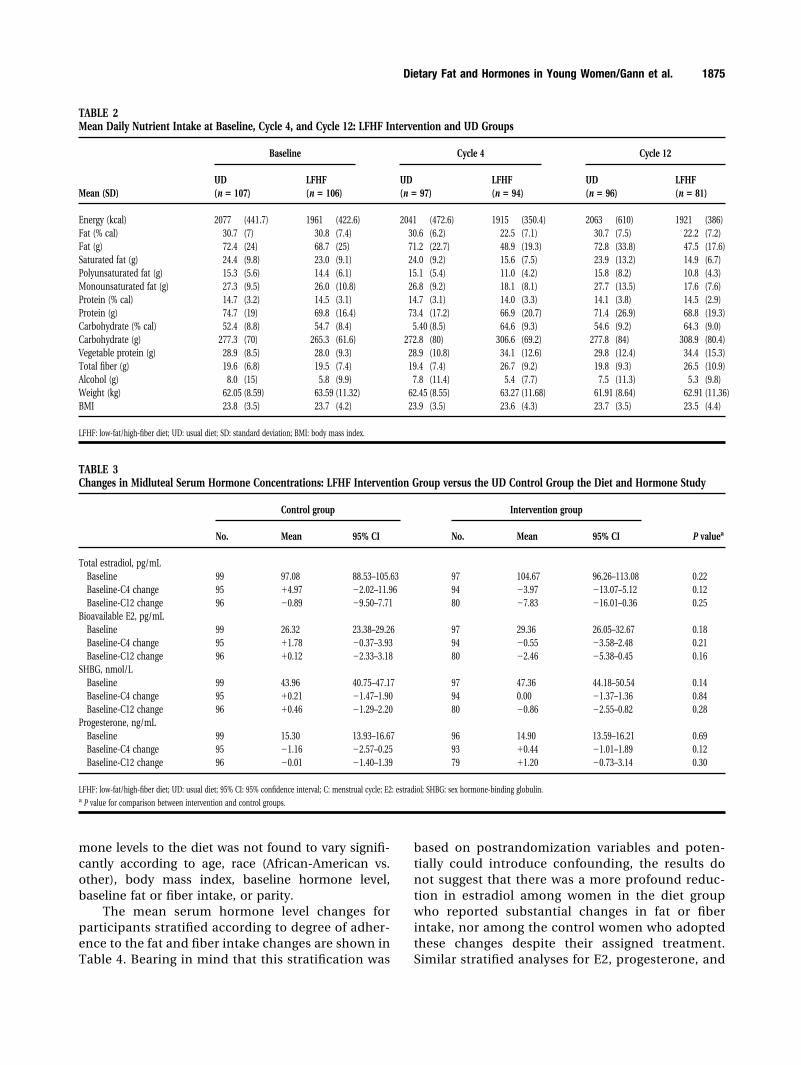
Table 2 presents the changes in nutrient intakeover time in the randomized groups, as well as thechanges in weight and body mass index. Nutrient andanthropometric variables were distributed evenlyacross treatment groups at baseline. By Cycle 12, thedietary intervention group had reduced their total in-take of fat as calories by 8.6% and grams of fat by 31%.Total energy intake was found to have changed verylittle (-2.0%), as was protein intake (0%). The reduc-tion in fat calories was offset by an increase in the
carbohydrate calorie intake from 54.7% to 64.3%. Theswitch to a plant-based diet was evidenced by in-creases in vegetable protein (23%), fiber (7 g or 36%),folate (43%), and �-carotene (39%). All the changes inthe diet intervention group were fully apparent ornearly so by the fourth menstrual cycle. In contrast,the UD group appeared to experience no meaningfulchanges in any of these nutrient intake variables, ex-cept for �-carotene, which had dropped by 17% atCycle 12. The study achieved its goal of maintainingbody weight in both dietary groups. Detailed informa-tion regarding the impact of the diet on intake andassociated biomarkers will be reported elsewhere.
The mean midluteal serum hormone levels ateach measurement point and the changes in theselevels over time are shown in Table 3. Total estradioldecreased by 7.83 pg/mL (95% CI, 16.01– 0.36) frombaseline to Cycle 12 in the LFHF group; however,differences in change between the LFHF and UDgroups were not found to be statistically significant.Bioavailable (or non-SHBG-bound) estradiol declinedby an average of 2.46 pg/mL or 8.3% in the LFHFgroup, but this result was relatively consistent withchance (P � 0.16) when compared with the change inthe UD group. SHBG and progesterone did not appearto change significantly in either group. The resultsessentially were the same after adjustment for otherbaseline variables such as past oral contraceptive use,parity, and smoking history. The response of the hor-
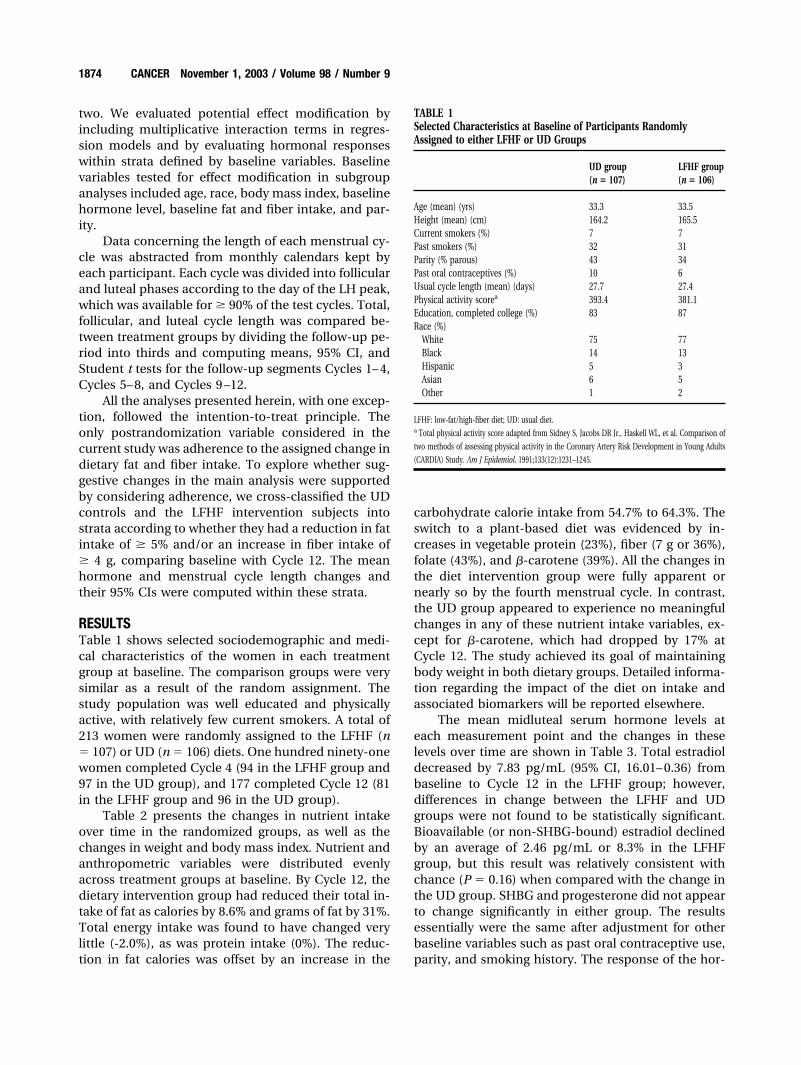
TABLE 1Selected Characteristics at Baseline of Participants RandomlyAssigned to either LFHF or UD Groups
UD group(n � 107)
LFHF group(n � 106)
Age (mean) (yrs) 33.3 33.5Height (mean) (cm) 164.2 165.5Current smokers (%) 7 7Past smokers (%) 32 31Parity (% parous) 43 34Past oral contraceptives (%) 10 6Usual cycle length (mean) (days) 27.7 27.4Physical activity scorea 393.4 381.1Education, completed college (%) 83 87Race (%)
White 75 77Black 14 13Hispanic 5 3Asian 6 5Other 1 2
LFHF: low-fat/high-fiber diet; UD: usual diet.a Total physical activity score adapted from Sidney S, Jacobs DR Jr., Haskell WL, et al. Comparison of
two methods of assessing physical activity in the Coronary Artery Risk Development in Young Adults
(CARDIA) Study. Am J Epidemiol. 1991;133(12):1231–1245.
1874 CANCER November 1, 2003 / Volume 98 / Number 9
mone levels to the diet was not found to vary signifi-cantly according to age, race (African-American vs.other), body mass index, baseline hormone level,baseline fat or fiber intake, or parity.
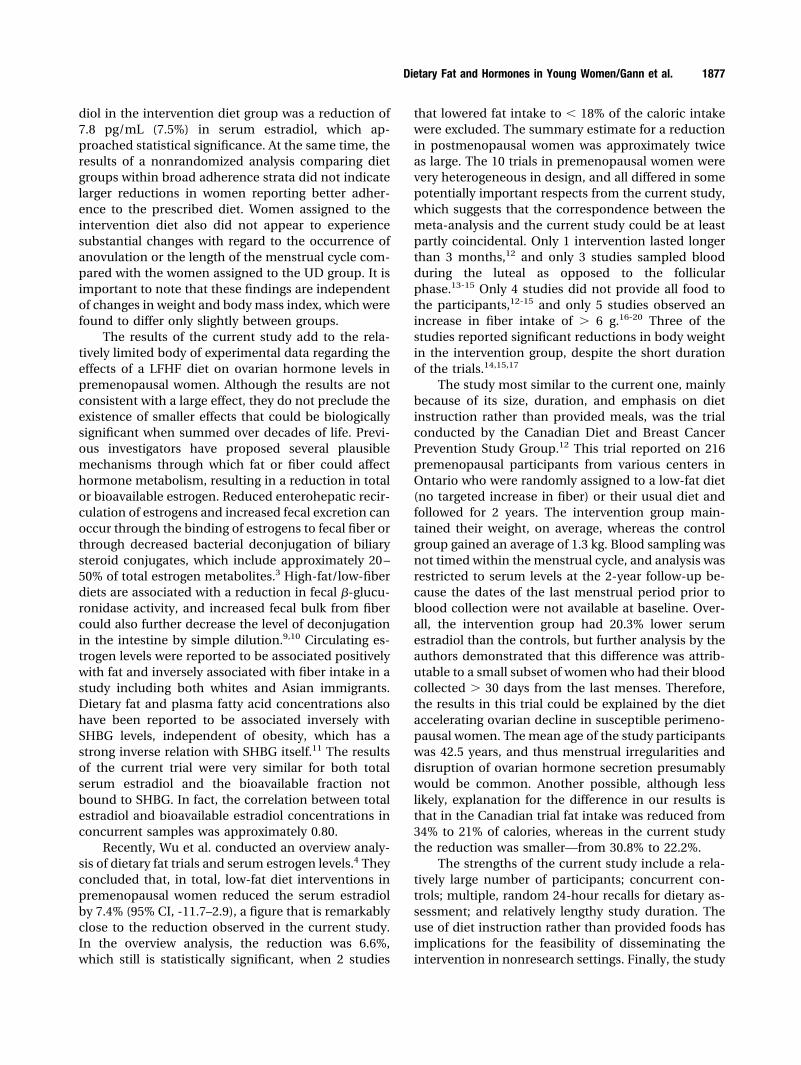
The mean serum hormone level changes forparticipants stratified according to degree of adher-ence to the fat and fiber intake changes are shown inTable 4. Bearing in mind that this stratification was
based on postrandomization variables and poten-tially could introduce confounding, the results donot suggest that there was a more profound reduc-tion in estradiol among women in the diet groupwho reported substantial changes in fat or fiberintake, nor among the control women who adoptedthese changes despite their assigned treatment.Similar stratified analyses for E2, progesterone, and
TABLE 2Mean Daily Nutrient Intake at Baseline, Cycle 4, and Cycle 12: LFHF Intervention and UD Groups
Mean (SD)
Baseline Cycle 4 Cycle 12
UD(n � 107)
LFHF(n � 106)
UD(n � 97)
LFHF(n � 94)
UD(n � 96)
LFHF(n � 81)
Energy (kcal) 2077 (441.7) 1961 (422.6) 2041 (472.6) 1915 (350.4) 2063 (610) 1921 (386)Fat (% cal) 30.7 (7) 30.8 (7.4) 30.6 (6.2) 22.5 (7.1) 30.7 (7.5) 22.2 (7.2)Fat (g) 72.4 (24) 68.7 (25) 71.2 (22.7) 48.9 (19.3) 72.8 (33.8) 47.5 (17.6)Saturated fat (g) 24.4 (9.8) 23.0 (9.1) 24.0 (9.2) 15.6 (7.5) 23.9 (13.2) 14.9 (6.7)Polyunsaturated fat (g) 15.3 (5.6) 14.4 (6.1) 15.1 (5.4) 11.0 (4.2) 15.8 (8.2) 10.8 (4.3)Monounsaturated fat (g) 27.3 (9.5) 26.0 (10.8) 26.8 (9.2) 18.1 (8.1) 27.7 (13.5) 17.6 (7.6)Protein (% cal) 14.7 (3.2) 14.5 (3.1) 14.7 (3.1) 14.0 (3.3) 14.1 (3.8) 14.5 (2.9)Protein (g) 74.7 (19) 69.8 (16.4) 73.4 (17.2) 66.9 (20.7) 71.4 (26.9) 68.8 (19.3)Carbohydrate (% cal) 52.4 (8.8) 54.7 (8.4) 5.40 (8.5) 64.6 (9.3) 54.6 (9.2) 64.3 (9.0)Carbohydrate (g) 277.3 (70) 265.3 (61.6) 272.8 (80) 306.6 (69.2) 277.8 (84) 308.9 (80.4)Vegetable protein (g) 28.9 (8.5) 28.0 (9.3) 28.9 (10.8) 34.1 (12.6) 29.8 (12.4) 34.4 (15.3)Total fiber (g) 19.6 (6.8) 19.5 (7.4) 19.4 (7.4) 26.7 (9.2) 19.8 (9.3) 26.5 (10.9)Alcohol (g) 8.0 (15) 5.8 (9.9) 7.8 (11.4) 5.4 (7.7) 7.5 (11.3) 5.3 (9.8)Weight (kg) 62.05 (8.59) 63.59 (11.32) 62.45 (8.55) 63.27 (11.68) 61.91 (8.64) 62.91 (11.36)BMI 23.8 (3.5) 23.7 (4.2) 23.9 (3.5) 23.6 (4.3) 23.7 (3.5) 23.5 (4.4)
LFHF: low-fat/high-fiber diet; UD: usual diet; SD: standard deviation; BMI: body mass index.
TABLE 3Changes in Midluteal Serum Hormone Concentrations: LFHF Intervention Group versus the UD Control Group the Diet and Hormone Study
Control group Intervention group
P valueaNo. Mean 95% CI No. Mean 95% CI
Total estradiol, pg/mLBaseline 99 97.08 88.53–105.63 97 104.67 96.26–113.08 0.22Baseline-C4 change 95 �4.97 �2.02–11.96 94 �3.97 �13.07–5.12 0.12Baseline-C12 change 96 �0.89 �9.50–7.71 80 �7.83 �16.01–0.36 0.25
Bioavailable E2, pg/mLBaseline 99 26.32 23.38–29.26 97 29.36 26.05–32.67 0.18Baseline-C4 change 95 �1.78 �0.37–3.93 94 �0.55 �3.58–2.48 0.21Baseline-C12 change 96 �0.12 �2.33–3.18 80 �2.46 �5.38–0.45 0.16
SHBG, nmol/LBaseline 99 43.96 40.75–47.17 97 47.36 44.18–50.54 0.14Baseline-C4 change 95 �0.21 �1.47–1.90 94 0.00 �1.37–1.36 0.84Baseline-C12 change 96 �0.46 �1.29–2.20 80 �0.86 �2.55–0.82 0.28
Progesterone, ng/mLBaseline 99 15.30 13.93–16.67 96 14.90 13.59–16.21 0.69Baseline-C4 change 95 �1.16 �2.57–0.25 93 �0.44 �1.01–1.89 0.12Baseline-C12 change 96 �0.01 �1.40–1.39 79 �1.20 �0.73–3.14 0.30
LFHF: low-fat/high-fiber diet; UD: usual diet; 95% CI: 95% confidence interval; C: menstrual cycle; E2: estradiol; SHBG: sex hormone-binding globulin.a P value for comparison between intervention and control groups.
Dietary Fat and Hormones in Young Women/Gann et al. 1875
SHBG also failed to demonstrate a stronger effectamong those women who adhered more closely totheir assigned diet.
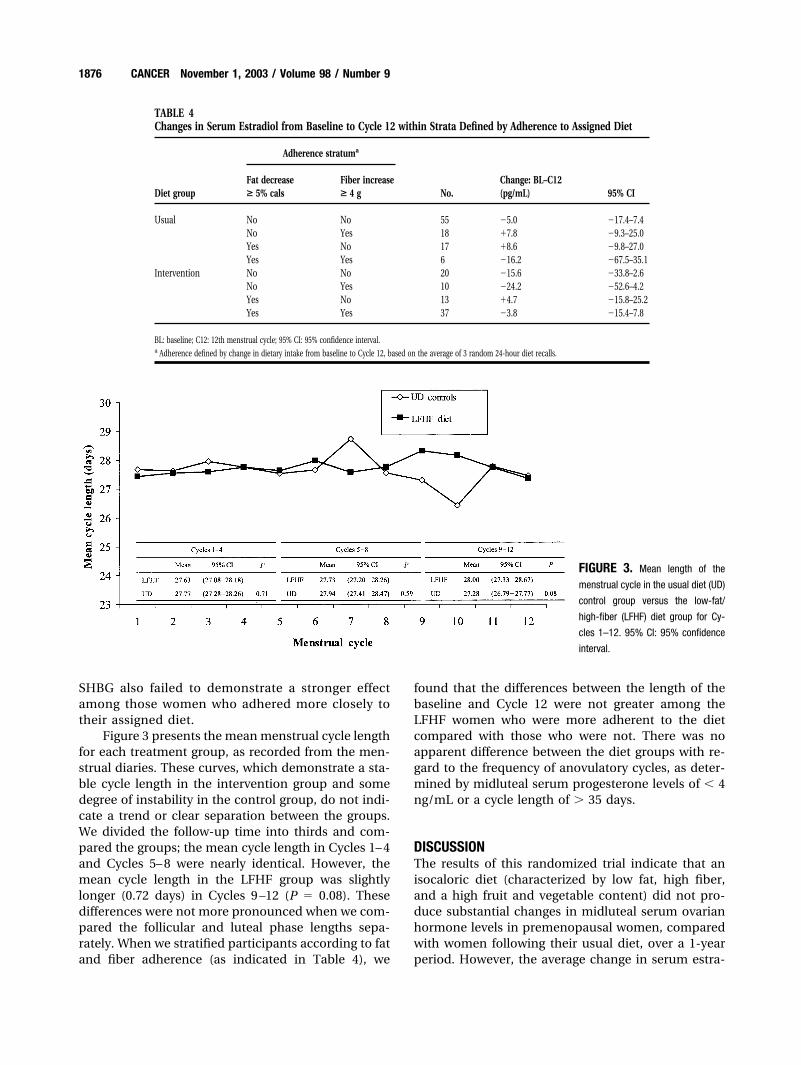
Figure 3 presents the mean menstrual cycle lengthfor each treatment group, as recorded from the men-strual diaries. These curves, which demonstrate a sta-ble cycle length in the intervention group and somedegree of instability in the control group, do not indi-cate a trend or clear separation between the groups.We divided the follow-up time into thirds and com-pared the groups; the mean cycle length in Cycles 1– 4and Cycles 5– 8 were nearly identical. However, themean cycle length in the LFHF group was slightlylonger (0.72 days) in Cycles 9 –12 (P � 0.08). Thesedifferences were not more pronounced when we com-pared the follicular and luteal phase lengths sepa-rately. When we stratified participants according to fatand fiber adherence (as indicated in Table 4), we
found that the differences between the length of thebaseline and Cycle 12 were not greater among theLFHF women who were more adherent to the dietcompared with those who were not. There was noapparent difference between the diet groups with re-gard to the frequency of anovulatory cycles, as deter-mined by midluteal serum progesterone levels of � 4ng/mL or a cycle length of � 35 days.
DISCUSSIONThe results of this randomized trial indicate that anisocaloric diet (characterized by low fat, high fiber,and a high fruit and vegetable content) did not pro-duce substantial changes in midluteal serum ovarianhormone levels in premenopausal women, comparedwith women following their usual diet, over a 1-yearperiod. However, the average change in serum estra-
TABLE 4Changes in Serum Estradiol from Baseline to Cycle 12 within Strata Defined by Adherence to Assigned Diet
Diet group
Adherence stratuma
No.Change: BL–C12(pg/mL) 95% CI
Fat decrease> 5% cals
Fiber increase> 4 g
Usual No No 55 �5.0 �17.4–7.4No Yes 18 �7.8 �9.3–25.0Yes No 17 �8.6 �9.8–27.0Yes Yes 6 �16.2 �67.5–35.1
Intervention No No 20 �15.6 �33.8–2.6No Yes 10 �24.2 �52.6–4.2Yes No 13 �4.7 �15.8–25.2Yes Yes 37 �3.8 �15.4–7.8
BL: baseline; C12: 12th menstrual cycle; 95% CI: 95% confidence interval.a Adherence defined by change in dietary intake from baseline to Cycle 12, based on the average of 3 random 24-hour diet recalls.
FIGURE 3. Mean length of the
menstrual cycle in the usual diet (UD)
control group versus the low-fat/
high-fiber (LFHF) diet group for Cy-
cles 1–12. 95% CI: 95% confidence
interval.
1876 CANCER November 1, 2003 / Volume 98 / Number 9
diol in the intervention diet group was a reduction of7.8 pg/mL (7.5%) in serum estradiol, which ap-proached statistical significance. At the same time, theresults of a nonrandomized analysis comparing dietgroups within broad adherence strata did not indicatelarger reductions in women reporting better adher-ence to the prescribed diet. Women assigned to theintervention diet also did not appear to experiencesubstantial changes with regard to the occurrence ofanovulation or the length of the menstrual cycle com-pared with the women assigned to the UD group. It isimportant to note that these findings are independentof changes in weight and body mass index, which werefound to differ only slightly between groups.
The results of the current study add to the rela-tively limited body of experimental data regarding theeffects of a LFHF diet on ovarian hormone levels inpremenopausal women. Although the results are notconsistent with a large effect, they do not preclude theexistence of smaller effects that could be biologicallysignificant when summed over decades of life. Previ-ous investigators have proposed several plausiblemechanisms through which fat or fiber could affecthormone metabolism, resulting in a reduction in totalor bioavailable estrogen. Reduced enterohepatic recir-culation of estrogens and increased fecal excretion canoccur through the binding of estrogens to fecal fiber orthrough decreased bacterial deconjugation of biliarysteroid conjugates, which include approximately 20 –50% of total estrogen metabolites.3 High-fat/low-fiberdiets are associated with a reduction in fecal �-glucu-ronidase activity, and increased fecal bulk from fibercould also further decrease the level of deconjugationin the intestine by simple dilution.9,10 Circulating es-trogen levels were reported to be associated positivelywith fat and inversely associated with fiber intake in astudy including both whites and Asian immigrants.Dietary fat and plasma fatty acid concentrations alsohave been reported to be associated inversely withSHBG levels, independent of obesity, which has astrong inverse relation with SHBG itself.11 The resultsof the current trial were very similar for both totalserum estradiol and the bioavailable fraction notbound to SHBG. In fact, the correlation between totalestradiol and bioavailable estradiol concentrations inconcurrent samples was approximately 0.80.
Recently, Wu et al. conducted an overview analy-sis of dietary fat trials and serum estrogen levels.4 Theyconcluded that, in total, low-fat diet interventions inpremenopausal women reduced the serum estradiolby 7.4% (95% CI, -11.7–2.9), a figure that is remarkablyclose to the reduction observed in the current study.In the overview analysis, the reduction was 6.6%,which still is statistically significant, when 2 studies
that lowered fat intake to � 18% of the caloric intakewere excluded. The summary estimate for a reductionin postmenopausal women was approximately twiceas large. The 10 trials in premenopausal women werevery heterogeneous in design, and all differed in somepotentially important respects from the current study,which suggests that the correspondence between themeta-analysis and the current study could be at leastpartly coincidental. Only 1 intervention lasted longerthan 3 months,12 and only 3 studies sampled bloodduring the luteal as opposed to the follicularphase.13-15 Only 4 studies did not provide all food tothe participants,12-15 and only 5 studies observed anincrease in fiber intake of � 6 g.16-20 Three of thestudies reported significant reductions in body weightin the intervention group, despite the short durationof the trials.14,15,17
The study most similar to the current one, mainlybecause of its size, duration, and emphasis on dietinstruction rather than provided meals, was the trialconducted by the Canadian Diet and Breast CancerPrevention Study Group.12 This trial reported on 216premenopausal participants from various centers inOntario who were randomly assigned to a low-fat diet(no targeted increase in fiber) or their usual diet andfollowed for 2 years. The intervention group main-tained their weight, on average, whereas the controlgroup gained an average of 1.3 kg. Blood sampling wasnot timed within the menstrual cycle, and analysis wasrestricted to serum levels at the 2-year follow-up be-cause the dates of the last menstrual period prior toblood collection were not available at baseline. Over-all, the intervention group had 20.3% lower serumestradiol than the controls, but further analysis by theauthors demonstrated that this difference was attrib-utable to a small subset of women who had their bloodcollected � 30 days from the last menses. Therefore,the results in this trial could be explained by the dietaccelerating ovarian decline in susceptible perimeno-pausal women. The mean age of the study participantswas 42.5 years, and thus menstrual irregularities anddisruption of ovarian hormone secretion presumablywould be common. Another possible, although lesslikely, explanation for the difference in our results isthat in the Canadian trial fat intake was reduced from34% to 21% of calories, whereas in the current studythe reduction was smaller—from 30.8% to 22.2%.
The strengths of the current study include a rela-tively large number of participants; concurrent con-trols; multiple, random 24-hour recalls for dietary as-sessment; and relatively lengthy study duration. Theuse of diet instruction rather than provided foods hasimplications for the feasibility of disseminating theintervention in nonresearch settings. Finally, the study
Dietary Fat and Hormones in Young Women/Gann et al. 1877
design included individualized timing of midlutealblood draws using daily testing for urinary LH. Themidluteal phase is more difficult to predict based onusual cycle length than follicular phases, yet it is po-tentially more relevant to breast carcinoma because itis associated with the peak in combined levels of es-tradiol and progesterone, and higher levels of breastcell proliferation.5
The trial also has a number of limitations. Thedesign does not allow for separation of the effects ofthe fat, fiber, and fruit/vegetable components of theintervention diet. We currently are conducting non-randomized analyses to estimate these separate ef-fects, but this effort can potentially introduce con-founding. Nonrandomized analyses also will evaluateassociations between hormone levels and changes inbody weight or physical activity while the patient isparticipating in the study. The participants in the cur-rent trial already were consuming a relatively low-fatdiet, and therefore the change that was achieved wasnot as drastic as might be achieved in a less selectedpopulation. Indeed, the study participants tended tohave other evidence of healthy lifestyle patterns, in-cluding low prevalence of smoking, relatively high in-take of fiber and vegetables, and high rates of physicalactivity. Although stronger effects from the diet mighthave been observed in a more representative popula-tion, adherence to the prescribed diet also could havebeen lower. In the current analysis, adherence is basedon detailed self-report; ongoing analyses will explorewhether diet change can be measured more accuratelywith consideration of biomarkers in blood.
Future research could evaluate more drasticchanges in diet; however, this must be balanced by theneed to keep interventions within the bounds of sus-tainable public health recommendations. The re-quired sample sizes and thus efficiency of future stud-ies could be improved by developing betterbiomarkers for assessing levels of estrogen in pre-menopausal women. Although we attempted in thecurrent analysis to reduce within-subject variance byusing LH tests to time a blood draw within each cycle,we most likely obtained only a limited improvement instudy precision. We have collected daily saliva sam-ples during each test cycle from participants in thistrial, and currently are assaying those for estradiol andprogesterone to determine whether this time-inte-grated biomarker of hormone exposure yields differ-ent results from those presented herein. We previouslydemonstrated that consideration of daily saliva mea-surements for estradiol from a 15-day midcycle seg-ment provided greater within-subject reproducibilitybetween cycles than a single LH-timed blood draw.21
Women at even younger ages might be more re-
sponsive to these types of dietary changes and, even ifthey were not, earlier intervention would have thebenefit of a larger cumulative effect on endogenoushormone exposure during the peak-incidence yearsfor breast carcinoma. Recent evidence suggests thatdietary fat reduction in adolescent girls might reducetheir circulating estrogen levels.22 Although the cur-rent study did not aim to produce weight loss, therealso is mounting evidence to suggest that eating pat-terns that lead to sustained weight loss or weightmaintenance still could have a favorable impact onbreast carcinoma risk, particularly in postmenopausalwomen. According to 1 recent estimate, approxi-mately 33% of postmenopausal breast carcinomacases are preventable through the achievement of op-timal body weight in middle and older age, and thisproportion is likely to increase if current trends in theprevalence of obesity are not reversed.23 The epidemi-ologic data demonstrating a correlation between cir-culating estrogen levels and postmenopausal breastcarcinoma risk are now quite convincing, as are thedata correlating weight loss with a reduction in serumestradiol and an increase in SHBG. For example, theDIANA trial investigators recently reported a decreaseof 18% in estradiol and an increase of 25% in SHBGamong women ages 50 – 65 years who adopted a Med-iterranean-type diet that led to an average weight lossof 4 kg.24 The results of the current study, which reflectthe effect of changes in dietary composition ratherthan caloric intake, must be viewed in this context.
REFERENCES1. Pike MC, Spicer DV, Dahmoush L, Press MF. Estrogens,
progestogens, normal breast cell proliferation, and breastcancer risk. Epidemiol Rev. 1993;15:17–35.
2. Hunter DJ, Willett WC. Nutrition and breast cancer. CancerCauses Control. 1996;7:56 – 68.
3. Adlercreutz H. Western diet and Western diseases: somehormonal and biochemical mechanisms and associations.Scand J Clin Lab Invest Suppl 1990;201:3–23.
4. Wu AH, Pike MC, Stram DO. Meta-analysis: dietary fat in-take, serum estrogen levels, and the risk of breast cancer.J Natl Cancer Inst. 1999;91:529 –534.
5. Ferguson DJ, Anderson TJ. Morphological evaluation of cellturnover in relation to the menstrual cycle in the “resting”human breast. Br J Cancer. 1981;44:177–181.
6. Chiu TT, Tam PP, Mao KR. Evaluation of a semiquantitativeurinary LH assay for ovulation detection. Int J Fertil. 1990;35:120 –124.
7. Bonfrer JM, Bruning PF, Nooljen WJ. A simple method forthe measurement of the steroid fraction bound to sex hor-mone binding globulin. J Steroid Biochem. 1989;33:227–231.
8. Zeger SL, Liang KY. Longitudinal data analysis for discreteand continuous outcomes. Biometrics. 1986;42:121–130.
9. Goldin BR, Adlercreutz H, Grobach SL, et al. Estrogen ex-cretion patterns and plasma levels in vegetarian and omniv-orous women. N Engl J Med. 1982;307:1542–1547.
1878 CANCER November 1, 2003 / Volume 98 / Number 9
10. Goldin BR, Gorbach SL. Effect of diet on the plasma levels,metabolism, and excretion of estrogens. Am J Clin Nutr.1988;48:787–790.
11. Bruning PF, Bonfrer JM. Free fatty acid concentrations cor-related with the available fraction of estradiol in humanplasma. Cancer Res. 1986;46:2606 –2609.
12. Boyd NF, Lockwood GA, Greenberg CV, Martin LJ, TritchlerDL. Effects of a low-fat high-carbohydrate diet on plasmasex hormones in premenopausal women: results from arandomized controlled trial. Canadian Diet and Breast Can-cer Prevention Study Group. Br J Cancer. 1997;76:127–135.
13. Ingram DM, Bennett FC, Willcox D, de Klerk N. Effect oflow-fat diet on female sex hormone levels. J Natl CancerInst. 1987;79:1225–1229.
14. Williams CM, Maunder K, Theale D. The effect of a low-fatdiet on luteal-phase prolactin and oestradiol concentrationsand erythrocyte phospholipids in normal premenopausalwomen. Br J Nutr. 1989;61:651– 661.
15. Rose DP, Boyar AP, Cohen C, Strong LE. Effect of a low-fatdiet on hormone levels in women with cystic breast disease.I. Serum steroids and gonadotropins. J Natl Cancer Inst.1987;78:623– 626.
16. Woods MN, Gorbach SL, Longcope C, Goldin BR, Dwyer JT,Morrill-LaBrode A. Low-fat, high-fiber diet and serum es-trone sulfate in premenopausal women. Am J Clin Nutr.1989;49:1179 –1183.
17. Bagga D, Ashley JM, Geffrey SP, et al. Effects of a very low fat,high fiber diet on serum hormones and menstrual function.
Implications for breast cancer prevention. Cancer. 1995;76:2491–2496.
18. Schaefer EJ, Lamon-Fava S, Spiegelman D, et al. Changes inplasma lipoprotein concentrations and composition in re-sponse to a low-fat, high-fiber diet are associated withchanges in serum estrogen concentrations in premeno-pausal women. Metabolism. 1995;44:749 –756.
19. Goldin BR, Woods MN, Spiegelman DL, et al. The effect ofdietary fat and fiber on serum estrogen concentrations inpremenopausal women under controlled dietary condi-tions. Cancer. 1994;74:1125–1131.
20. Woods MN, Barnett JB, Spiegelman D, et al. Hormone levelsduring dietary changes in premenopausal African-Americanwomen. J Natl Cancer Inst. 1996;88:1369 –1374.
21. Gann PH, Giovanazzi S, Van Horn L, Branning A, ChattertonRT Jr. Saliva as a medium for investigating intra- and interin-dividual differences in sex hormone levels in premenopausalwomen. Cancer Epidemiol Biomarkers Prev. 2001;10:59–64.
22. Dorgan JF, Hunsberger SA, McMahon RP, et al. Diet and sexhormones in girls: findings from a randomized controlledclinical trial. J Natl Cancer Inst. 2003;95:132–141.
23. Huang Z, Hankinson SE, Colditz GA, et al. Dual effects ofweight and weight gain on breast cancer risk. JAMA. 1997;278:1407–1411.
24. Berrino F, Bellati C, Secreto G, et al. Reducing bioavailablesex hormones through a comprehensive change in diet: thediet and androgens (DIANA) randomized trial. Cancer Epi-demiol Biomarkers Prev. 2001;10:25–33.
Dietary Fat and Hormones in Young Women/Gann et al. 1879