the effectiveness of using guided questions in teaching
133
THE EFFECTIVENESS OF USING GUIDED QUESTIONS IN TEACHING WRITING OF ANALYTICAL EXPOSITION TEXT TO ELEVENTH GRADE STUDENTS OF SMAN 8 PURWOREJO IN ACADEMIC YEAR 2013 / 2014 A THESIS Submitted in Partial Fulfillment of the Requirements to Acquire Sarjana Pendidikan Degree in English Education Program of Teacher Training and Education Faculty Muhammadiyah University of Purworejo Rosialina Septiani 10.212.0097 ENGLISH EDUCATION PROGRAM TEACHER TRAINING AND EDUCATION FACULTY MUHAMMADIYAH UNIVERSITY OF PURWOREJO 2014
-
Upload
khangminh22 -
Category
Documents
-
view
0 -
download
0
Transcript of the effectiveness of using guided questions in teaching
THE EFFECTIVENESS OF USING GUIDED QUESTIONS IN TEACHING
WRITING OF ANALYTICAL EXPOSITION TEXT TO ELEVENTH
GRADE STUDENTS OF SMAN 8 PURWOREJO
IN ACADEMIC YEAR 2013 / 2014
A THESIS
Submitted in Partial Fulfillment of the Requirements
to Acquire Sarjana Pendidikan Degree in English Education Program
of Teacher Training and Education Faculty
Muhammadiyah University of Purworejo
Rosialina Septiani
10.212.0097
ENGLISH EDUCATION PROGRAM
TEACHER TRAINING AND EDUCATION FACULTY
MUHAMMADIYAH UNIVERSITY OF PURWOREJO
2014
MOTTO
- Nothing great was ever achieved without enthusiasm. (Emerson)
- Allah will not change the good condition of a people as long as they do not
change themselves. (QS. Ar – Ra’du : 11)
- Achieving something is not realized without prayer. What is your wish, let’s
pray, try, and realize it. (The researcher)
- Don’t look at a problem in one side but look it in other side. (The researcher)
DEDICATIONS
With graduate and love, this thesis is dedicated to :
- My beloved parents, Parmin, Aris Minawati, Hamid Kanuni, S.H and Sri
Lestari for their prayer, love, support, patience, advice, and everything that
were they given to me.
- My beloved husband, Riza Pratama Rivai, who gives me support and
motivation. Who never tired gives me love, advice and faithfulness.
- My beloved sister, Yeni Puspitasari, keep fight in her own business. Thanks
for your motivation and support.
- My beloved friends Hayu, Izmi, Yunita, Kusnadi, Edwin, Anang, Adam,
Widi, Galuh.
- Lecturers in English Department of Muhammmadiyah University of
Purworejo.
- All of my friends in Archie Linguistics Class C and English Education
Program.
- All of my friends in PPL and KKN.
- And all who helps me finishing this thesis.
ACKNOWLEDGEMENT
Alhamdulillah all praises to Allah the Almighty, The Merciful and The
most Beneficial. Without His blessing, the researcher would never been able to
finish this thesis entitled The Effectiveness of Using Guided Questions in
Teaching Writing of Analytical Exposition Text to Eleventh Grade Students of
SMA N 8 Purworejo.
This thesis has been greatly improved by many comments, information
and ideas of many people, so that the researcher’s gratitude and deep appreciation
go to :
1. Drs. H. Supriyono, M.Pd, as the Rector of Muhammadiyah University of
Purworejo.
2. Drs. H. Hartono, M.M, as the Dean of Teacher Training an Education
Faculty.
3. Semi Sukarni, M.Pd, as the Head of English Education Department.
4. Juita Triana, M.Pd, her consultant, thanks for her guidance, corrections,
encouragement, and suggestion to complete my thesis.
5. The lecturers of English Education Department of Muhammadiyah
University of Purworejo.
6. Drs. Suhartono, M.M, the Head Master of SMA N 8 Purworejo, who gave
the researcher permission to conduct the research.
7. Hardjanto, S.Pd, the teacher of SMA N 8 Purworejo . Thanks for your help
and nice cooperation.

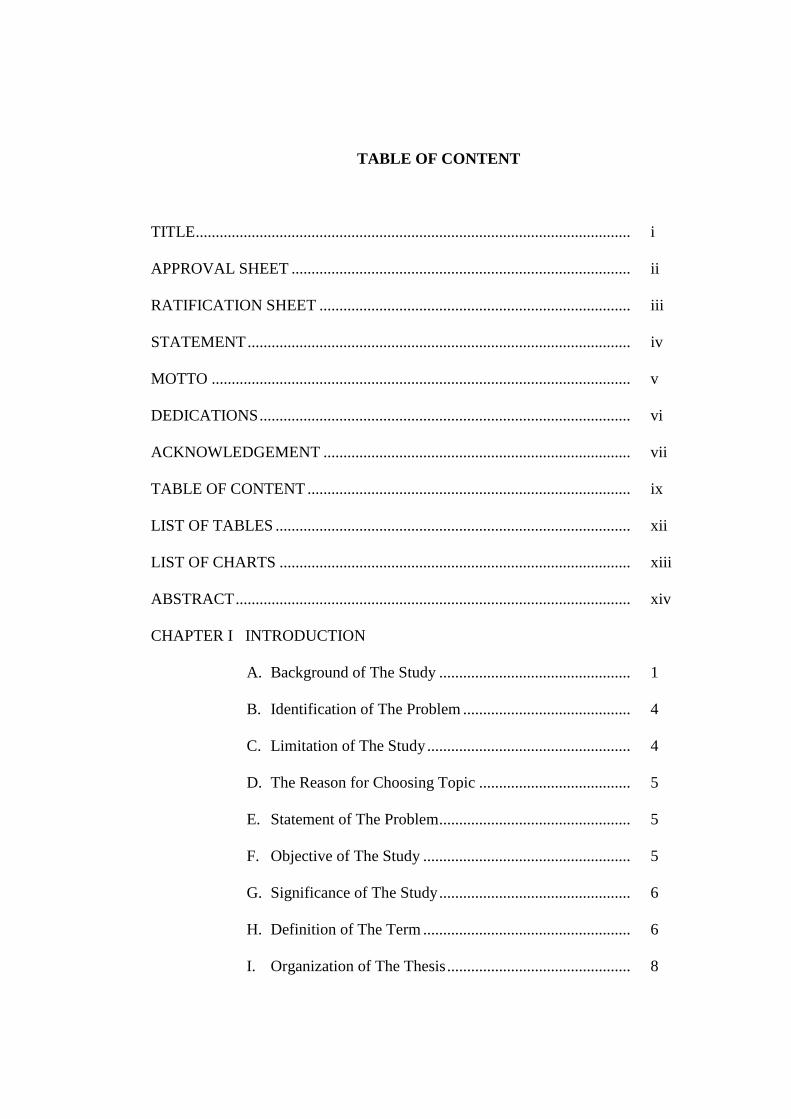
TABLE OF CONTENT
TITLE ............................................................................................................. i
APPROVAL SHEET ..................................................................................... ii
RATIFICATION SHEET .............................................................................. iii
STATEMENT ................................................................................................ iv
MOTTO ......................................................................................................... v
DEDICATIONS ............................................................................................. vi
ACKNOWLEDGEMENT ............................................................................. vii
TABLE OF CONTENT ................................................................................. ix
LIST OF TABLES ......................................................................................... xii
LIST OF CHARTS ........................................................................................ xiii
ABSTRACT ................................................................................................... xiv
CHAPTER I INTRODUCTION
A. Background of The Study ................................................ 1
B. Identification of The Problem .......................................... 4
C. Limitation of The Study ................................................... 4
D. The Reason for Choosing Topic ...................................... 5
E. Statement of The Problem ................................................ 5
F. Objective of The Study .................................................... 5
G. Significance of The Study ................................................ 6
H. Definition of The Term .................................................... 6
I. Organization of The Thesis .............................................. 8
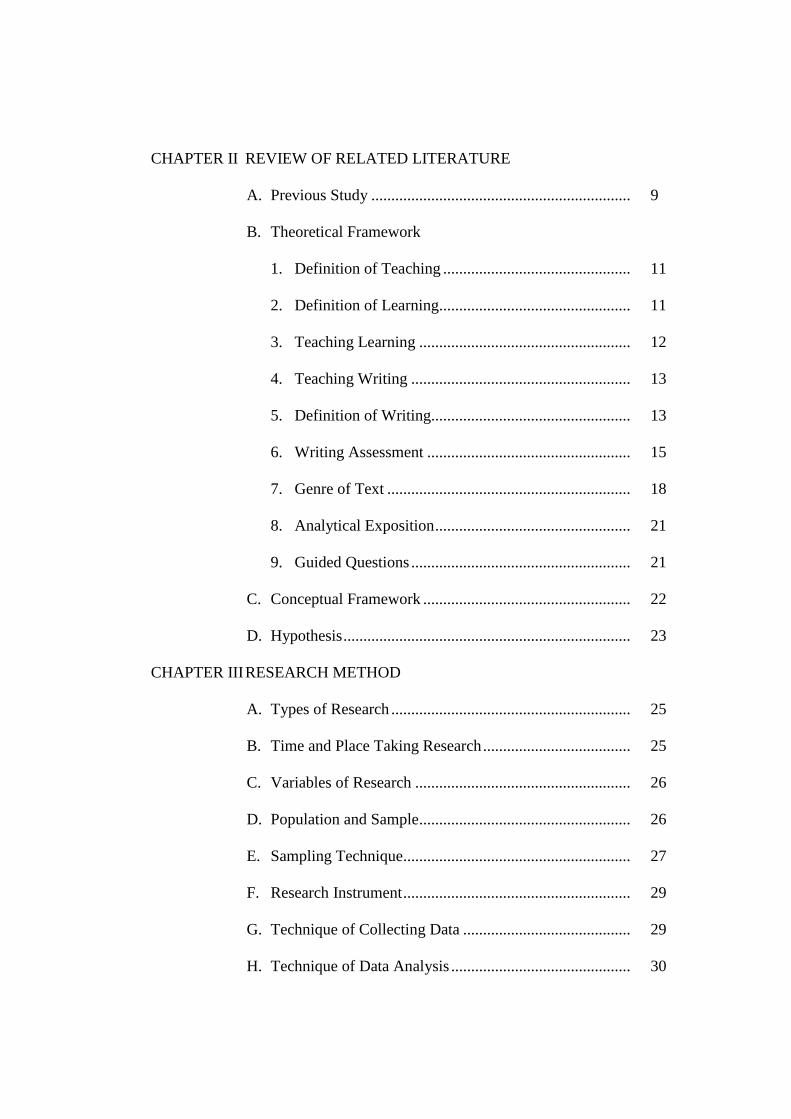
CHAPTER II REVIEW OF RELATED LITERATURE
A. Previous Study ................................................................. 9
B. Theoretical Framework
1. Definition of Teaching ............................................... 11
2. Definition of Learning................................................ 11
3. Teaching Learning ..................................................... 12
4. Teaching Writing ....................................................... 13
5. Definition of Writing.................................................. 13
6. Writing Assessment ................................................... 15
7. Genre of Text ............................................................. 18
8. Analytical Exposition ................................................. 21
9. Guided Questions ....................................................... 21
C. Conceptual Framework .................................................... 22
D. Hypothesis ........................................................................ 23
CHAPTER III RESEARCH METHOD
A. Types of Research ............................................................ 25
B. Time and Place Taking Research ..................................... 25
C. Variables of Research ...................................................... 26
D. Population and Sample ..................................................... 26
E. Sampling Technique......................................................... 27
F. Research Instrument ......................................................... 29
G. Technique of Collecting Data .......................................... 29
H. Technique of Data Analysis ............................................. 30
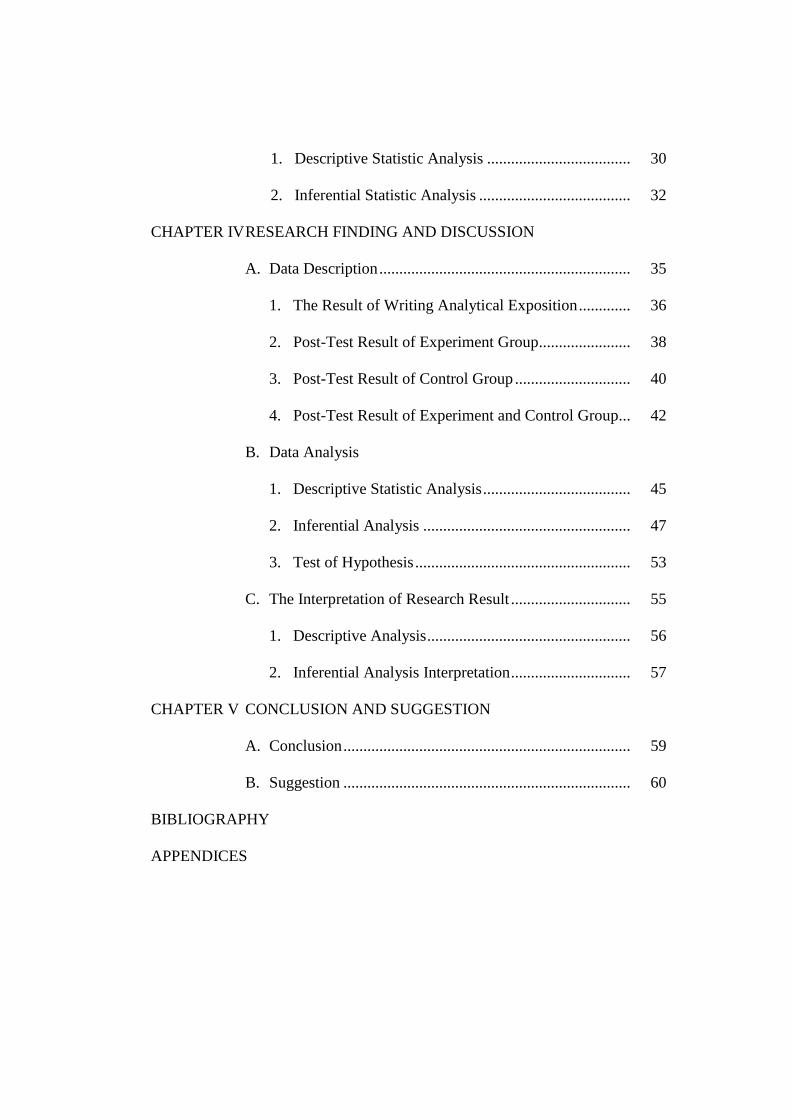
1. Descriptive Statistic Analysis .................................... 30
2. Inferential Statistic Analysis ...................................... 32
CHAPTER IV RESEARCH FINDING AND DISCUSSION
A. Data Description ............................................................... 35
1. The Result of Writing Analytical Exposition ............. 36
2. Post-Test Result of Experiment Group....................... 38
3. Post-Test Result of Control Group ............................. 40
4. Post-Test Result of Experiment and Control Group... 42
B. Data Analysis
1. Descriptive Statistic Analysis ..................................... 45
2. Inferential Analysis .................................................... 47
3. Test of Hypothesis ...................................................... 53
C. The Interpretation of Research Result .............................. 55
1. Descriptive Analysis ................................................... 56
2. Inferential Analysis Interpretation .............................. 57
CHAPTER V CONCLUSION AND SUGGESTION
A. Conclusion ........................................................................ 59
B. Suggestion ........................................................................ 60
BIBLIOGRAPHY
APPENDICES
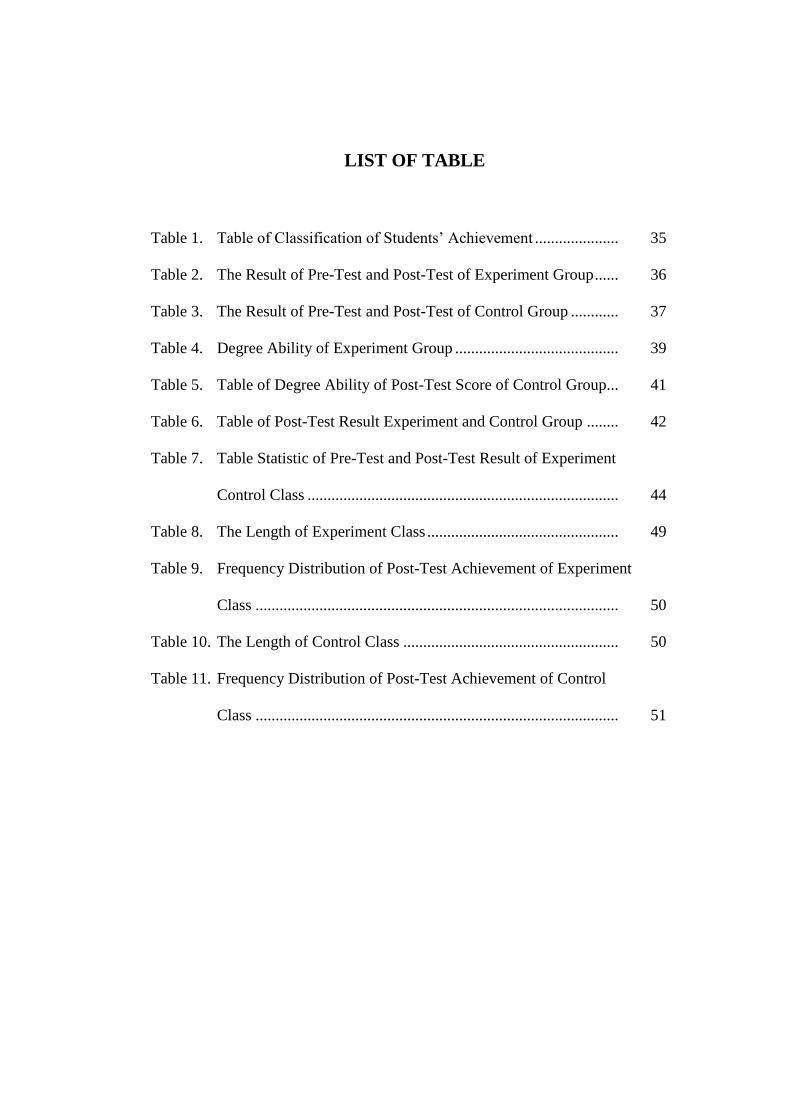
LIST OF TABLE
Table 1. Table of Classification of Students’ Achievement ..................... 35
Table 2. The Result of Pre-Test and Post-Test of Experiment Group ...... 36
Table 3. The Result of Pre-Test and Post-Test of Control Group ............ 37
Table 4. Degree Ability of Experiment Group ......................................... 39
Table 5. Table of Degree Ability of Post-Test Score of Control Group... 41
Table 6. Table of Post-Test Result Experiment and Control Group ........ 42
Table 7. Table Statistic of Pre-Test and Post-Test Result of Experiment
Control Class .............................................................................. 44
Table 8. The Length of Experiment Class ................................................ 49
Table 9. Frequency Distribution of Post-Test Achievement of Experiment
Class ........................................................................................... 50
Table 10. The Length of Control Class ...................................................... 50
Table 11. Frequency Distribution of Post-Test Achievement of Control
Class ........................................................................................... 51
LIST OF CHART
Chart 1. The Chart of Percentage Range of Writing Ability Result of
Experiment Group ...................................................................... 40
Chart 2. The Chart of Percentage Range of Writing Ability Result of
Control Group ............................................................................. 42
Chart 3. The Chart of Frequency Range of Writing Ability Result of
Experiment Group and Control Group ....................................... 43
ABSTRACT
Septiani, Rosialina (102120097) 2014. A thesis, THE EFFECTIVENESS OF
USING GUIDED QUESTIONS IN TEACHING WRITING OF ANALYTICAL
EXPOSITION TEXT TO ELEVENTH GRADE STUDENTS OF SMAN 8
PURWOREJO IN ACADEMIC YEAR 2013/2014.English Department Faculty of
Teacher Training and Educational Science, Muhammadiyah University of
Purworejo. Consultant: Juita Triana, M.Pd.
Writing is one of big problems for the students in this teaching learning
process. Moreover, there is analytical exposition text as one of materials to
achieve. This study was carried out to investigate the effectiveness of using
guided questions in teaching writing to eleventh grade students of SMAN 8
Purworejo, and how are the students’ skill in writing analytical exposition text of
eleventh grade of SMAN 8 Purworejo.
This research was done at SMAN 8 Purworejo on May 2014. It is
experimental research that takes two classes to compare between the result of
using and not using guided questions in teaching writing of analytical exposition
text. Here, the researcher takes the samples from eleventh grade of XI IPS 1 as
experimental group and XI IPS 4 as control group. The researcher makes some
steps in collecting data: first is giving pre-test to both experimental and control
class; second is applying the treatment to the experimental class by using guided
questions in teaching writing analytical exposition text and giving material to the
control group without using guided questions technique; and the last is giving
post-test to both experimental and control group. To analyze the data, the
researcher applies descriptive and inferential analyze using t-test.
The result of the research leads to the conclusion that the average score of
the students who are taught writing analytical exposition text by using guided
questions which is as experimental group is 76. That result is a good categorize
while the average score of the students who are taught writing analytical
exposition text without using guided questions is 70. In other word, the use of
guided questions is effective in teaching writing of analytical exposition text.
Looking at the result of t-test, the t-test of level significant 0.05 shows t-obtained
value is 4.559 and t-table value is 2.00, it means that t-value is higher than t-table.
It means that Ha is accepted, so it can be concluded that using guided questions in
teaching writing of analytical exposition text to eleventh grade students of SMAN
8 Purworejo in academic year 2013/2014 is effective.
Key Words: Effectiveness, Teaching Writing, Guided Questions, Analytical
Exposition Text.
CHAPTER I
INTRODUCTION
In this chapter, the researcher would like to present some points that will
be explained, as follows: background of study, identification of the problem,
limitation of the study, the reason for choosing topic, statement of the problem,
objective of the study, significance of the study, definition of the term, and
organization of the thesis.
A. Background of the Study
Language is used to communicate and merge among people in the
world. Using language facilitates them due to It is a tool communication that
having a form of spoken language and written language. The goal of
communication is delivering message from someone to another. A
communication happenswhen the participants can understand to one another
what they convey. In this case, language is very needed and important thing.
English is one of languages in the world.
Nowadays, English has become popular language due to English is an
international language that used to connect people in the world. People are
interested to learn English. English has ruled the world. It can be conceived
that every corner reads English. English is fun, but most of people are still
confused in learning English.In Indonesia, learning English is an important
subject to the students. There are a few basic skills that the students should
1
learn: speaking, writing, reading, and listening. Ideally, the students should
have good competence in every skill.
Writing is one of skills in learning English including in productive
skill. Mastering writing is an important thing for the students. It has a goal to
help the students to be able to write their own ideas in writing. In fact, the
students are still confused how to write a good paragraph. Based on the
researcher’s experience, writing is a difficult subject. We have to masterthe
vocabularies and grammar to our interesting text.Writing without variety
vocabularies makes monotonous. Incorrect grammar leads the reader
misunderstanding with the content. Those are important points in writing.
Moreover, difficulty in finding ideas is a big trouble. It will make
writing unattractive. It needs to think hard to find the appropriate ideas to
write. This is the condition that the teacher should have creativity to make the
students easier to express their idea in writing. It will be a method or
technique to make the students easier to write.Using method or technique in
learning English especially writing is an effective way to help the students in
their work when they write something.
Analytical exposition is one of genres of text that taught at Eleventh
Grade of Senior High School. Analytical exposition text is a kind of texts that
presents arguments to support the opinion and persuade the readers in the
case. The students are expected telling something with easier technique. The
students should write something easily in their grade. There are a lot of cases
on the students’ difficulties when they write something to report in English

writing. Based on that problem, the researcher uses the technique of guided
questions to help the students write something easier.
Guided questions are some questions that help the students to write
something easier. There are 5W and 1H questions. These questions will entice
the students’ idea about what will be informed. It is hoped the students can
express what they think and it is their own idea in writing analytical
exposition text. Guided questions are penetration to the students in a
beginning step to start writing. It is used to what should the students do and
how to begin their writing.
The researcher is interested to find the effectiveness of using guided
questions in teaching of analytical exposition to the students of SMA N 8
Purworejo. Eleventh grade of SMA 8 Purworejo students should work hard in
learning writing to increase their skill.
There are two previous studies that researcher took. The first is
Improving Students’ Writing Skill of Descriptive Text through Guided
Questions by Nawawi (2011) and Developing The Students’ Ability in Writing
Recount Text Through Guiding Questions Technique at The Second Year
Students of SMPN 1 Terbanggi Besar Lampung Tengah by Iwan (2009). In
those researches, guided questions are appropriate technique to improve
students’ writing skill. The researcher is interested in another text, it is
analytical exposition.
B. Identification of the Problem
Based on the background above, Eleventh grade of Senior High
School students are confused to write something especially in analytical
exposition text. They still do not understand what should they write to inform
something or event. Moreover, they do not know what the appropriate ways to
make their text well.
Guided question isan appropriate technique to help the students in
leading their writing better. It will entice the students having concept easier to
write. The students will know what they should write based on the topic.
C. Limitation of the Study
In learning English, there are four basic skills that the students must
master such as speaking, listening, writing and reading and genre of text such
as procedure, narrative, recount, descriptive, analytical exposition, etc. In this
case, the researcher will focus on writing skill and analytical exposition text. It
is using guided questions in teaching writing of analytical exposition text at
eleventh grade of SMA N 8 Purworejo. The researcher tries by using guided
questions to help the students easier to write something and make appropriate
writing based on the topic. The limitation is absolute for the researcher to
make this thesis accurate and valid.
D. The Reason for Choosing Topic
The researcher chooses the topic for the following reasons:
1. Writing is one of skills in learning English. It is difficulty skills to learn
because the students must work hardly to master it.
2. A lot of students are still confused on how to write a good text and how to
begin writing.
3. It is an effective way to teach writing in teaching and learning English for
Senior High School students.
E. Statement of the Problem
The statement of the problem based on the background of study above
is: Is There Any Effectiveness of Using Guided Questions in Teaching
Writing of Analytical Exposition Text to Eleventh Grade Students of SMA 8
Purworejo in Academic Year 2013/2014?
F. Objective of the Study
The objective of the study of this thesis is basically to find out
whether there is effectiveness of using guided question in teaching writing of
analytical exposition text to eleventh grade students of SMA N 8 Purworejo in
Academic Year 2013/2014.
G. Significance of the Study
There are some advantages of this thesis, as follows:
For the students:
1. The students can work or make analytical text easier. Guided questions are
helpful to the students.
2. The students will begin thinking that writing is easy to do by new
technique and make them will not be bored.
3. Guided questions make the students more interesting and like in writing.
For the teachers:
1. It can help the teachers to teach the students as a reference teaching in
classroom. It is another alternative technique.
2. This method can increase quality of teaching and learning process in
classroom.
For the readers:
1. The readers can know that there is another technique which can uses in
teaching writing.
2. It will help the readers to learn and apply it to increase the skill.
H. Definition of the Term
To avoid misinterpreting the topic that discussed, the researcher would
like to explain the definition of some key words in the title of this thesis, as
follows:
1. Effectiveness
Effectiveness is producing the result that is wanted or intended. In
other word it is producing a successful result. (Hornby, 2000 : 422)
2. Guided questions
Guided questions are the test administrator poses a series of
questions that essentially serve as an outline of the emergent written text.
(Brown, 2004: 234)
3. Teaching
Teaching is guiding and facilitating learning in enabling the
learners to learnand sitting the conditions for learning. Teaching means
showing or helping someone to learn how to do something, providing with
knowledge, causing to know or understand. (Brown, 2007 : 7)
4. Writing
Writing is a language form that is distinguished from speech
because it can be permanent and it can be planned and changed before it
emerges. (Browne, 2007: 92)
5. Analytical Exposition
Analytical Exposition is a text which has a purpose to persuade the
reader or listener that something in the case. (Hartono, 2005: 6)
I. Organization of the Thesis
This thesis is divided into five chapters, as follows:
Chapter I contains of introduction. In this chapter, it deals about
background of the study, identification of the problem, limitation of the
problem, the reason for choosing topic, statement of the problem, objective of
the study, significance of the study, definition of the term, and organization of
the thesis.
Chapter II contains of review of related literature. This chapter discuss
about review of related literature which is included previous study, theoretical
framework, conceptual framework and hypothesis.
Chapter III contains of research methods. This chapter includes types
of research, variable of research, population and sample, sampling technique,
research instrument, technique and collecting data and data analysis, and time
and place taking research.
Chapter IV contains of research finding and discussion. This chapter
shows and explains that the research finding and discuss it as clearly as
possible.
Chapter V contains of conclusion and suggestion. This chapter gives
conclusion and suggestions of the research.
CHAPTER II
REVIEW OF RELATED LITERATURE
In this section, the researcher involves some basic theories related to this
research. There are four points to be presented by the researcher, as follows:
previous study, theoretical framework, conceptual framework, and hypothesis.
A. Previous Study
This research is entitled The Effectiveness of Using Guided Questions
in Teaching Writing of Hortatory Exposition Text to Eleventh Grade Students
of SMA N 8 Purworejo in Academic Year 2013/2014. For consideration, the
researcher took two previous studies. The first is Nawawi’s (2011) research
entitled “Improving Students’ Writing Skill of Descriptive Text Trough Guided
Questions”. The second is Iwan’s (2009) research entitled “Developing The
Students’ Ability in Writing Recount Text Through Guiding Questions
Technique at The Second Year Students of SMPN 1 Terbanggi Besar
Lampung Tengah”.
The result of Nawawi’s research is there are some progressions of the
students’ score of pre-test and post-test. In the pre-test, there are two (4,6%)
students who passed of minimal comprehensiveness criterion and the mean
score of pre-test are 45,46. Then in the result of post-test in cycle 1 is 6
(13,95%) students in the class who passed of minimal comprehensiveness
criterion considering that their mean score of the test gained 61,16. In the
9
result of post-test in cycle 2 is 29 (67,44%) students who passed of minimal
comprehensiveness criterion in which their mean score of writing test derived
are 69,76. The result of last post-test is 43 (100%) students who passed of
minimal comprehensiveness criterion consider their mean score are 81,86.
It means that guided questions makes students easier and exploring
their idea in making descriptive paragraph. Based on Nawawi’s research, this
technique can improve students’ achievement significantly in writing skill of
descriptive paragraph.
Based on Iwan’s research, guided writing in the form of guiding
questions can develop the students’ recount text writing ability. There was
such a significant increase toward the students’ recount text writing ability
after they were given the treatments.
The result of his research is enhancement of students’ average score in
the pre-test and post-test. In the pre-test, there are 6 students (20%) whose
scores are higher than 60 and there are 24 students (80%) whose sores are
lower than 60. In the post-test, there are 27 students (90%) whose scores are
higher than 60 and there are only 3 students (10%) whose scores are lower
than 60.
In Nawawi’s research, he took descriptive text and Iwan’s research
took recount text; while in this research, the researcher takes different text.
The researcher tries to analyze the use of guided questions technique in
teaching writing of analytical exposition text.
B. Theoretical Framework
1. Definition of Teaching
Teaching is doing something to help another people to develop
their skills, ability or science through giving lesson to the learner so they
can learn it well. Crawford, Saul, Mathews and Makinster (2005: 10) state
that teaching is more than a set of methods that is developing students’
skills and strategies for learning, at the same time they learn content of
curriculum. While Fry, Ketterridge and Marshall note that (2003: 26)
teaching involves helping students to know something not known before it
constitutes a process of change.
The researcher concludes, based on the definition above, that
teaching is a process to make someone more know and develop his skills
so it can be used in their life. Teaching can help the students more clever
and creative in developing their skills.
2. Definition of Learning
Learning according to Pritchard (2009:1) is something of which we
all have an understanding and in which we have all participated. This
participation has been in a very wide range of settings, both formal and
informal, ranging from the relative confines of a school classroom, to the
wide open space of the countryside or a quiet corner where a chance
conversation led to deeper understanding of some topic or another.
Meanwhile Brown (2007:7) states that learning is human activity which is
done since they were doing until they die.
Brown (2007:8) proposes a composite definition of learning, in the
followings:
1) Learning is acquisition or getting.
2) Learning is retention of information or skill.
3) Retention implies storage system, memory and cognitive organization.
4) Learning involves active, conscious focus on acting upon events
outside or inside the organism.
5) Learning is relatively permanent but subject.
6) Learning involves some of practice, perhaps reinforced practice.
7) Learning is a change in behavior.
According those definitions above, learning can change someone in
his behavior, he will know what he had learnt in his school or every where
he learn. It will help him in his life to make better.
3. Teaching Learning
According to Fry, Ketterridge and Marshall (2003: 26), organizing
teaching is really about designing learning. Designing learning is one of
the most fundamental activities. Often due to pressures of time, preparing
to teach is given less time and consideration than implementing and
evaluating the teaching or learning process.
Teaching and learning are totally different in its activity but both of
them are very important process to the students in developing their skill.
4. Teaching Writing
Carrol and Wilson (1993:12) have their own argument that writing
as a process means giving students time to pre-write, write, post-write,
proofread, and edit their papers. It means teaching writing not just
assigning it. It means teaching the various forms of writing so students
think through their meaning, their purpose, and the needs of their audience
to determine the most appropriate genre.
From the explanations above, teaching writing is a process to make
a draft, edit, and write the students’ work in writing which is adjusted the
purpose of writing. The students should know basis of writing until they
can produce their writing.
5. Definition of Writing
Browne (2007:92) gives her notion that writing is a language form
that is distinguished from speech because it can be permanent and it can be
planned and changed before it emerges. Pursuant to Patel and Jain
(2008:125) writing is a kind of linguistic behavior; a picture is not. It
presents the sounds of language through visual symbols.
Browne (2007: 92-93) states that writing can be used to entertain,
persuade, express feelings, inform, request, instruct, record and express
opinions and ideas. The writers have to do at least three things to produce
a piece of writing. They have to compose, transcribe and review (Browne,
2007: 82-84).
Based on those definitions, writing is a process in thinking
something through the writer express feeling to make the reader be
amused, get information from the writer, or ideas from the writer.
Some characteristics of written language from the writer’s view
according to Brown (2003: 341-342) are as follows:
1) Permanence
Once something is written down and delivered in its intended
audience, the writer abdicates a certain power: the power to emend, to
clarify, and to withdraw.
2) Production time
The writer can become a good writer by developing efficient processes
for achieving the final product.
3) Distance
The distance factor requires what might be termed cognitive empathy,
in that good writers can read their own writing from the perspective of
the mind of the targeted audiences.
4) Orthography
Everything from simple greeting to extremely complex idea is
captured through the manipulation of a few dozen letters and other
written symbols.
5) Complexity
Writers must learn how to remove redundancy (which may not jibe
with their first language rhetorical tradition), how to combine
sentences, how to make references to other elements in a text, how to
create syntactic and lexical variety and much more.
6) Vocabulary
Written language places a heavier demand on vocabulary use than does
speaking. Good writers will learn to take advantage of the richness of
English vocabulary.
7) Formality
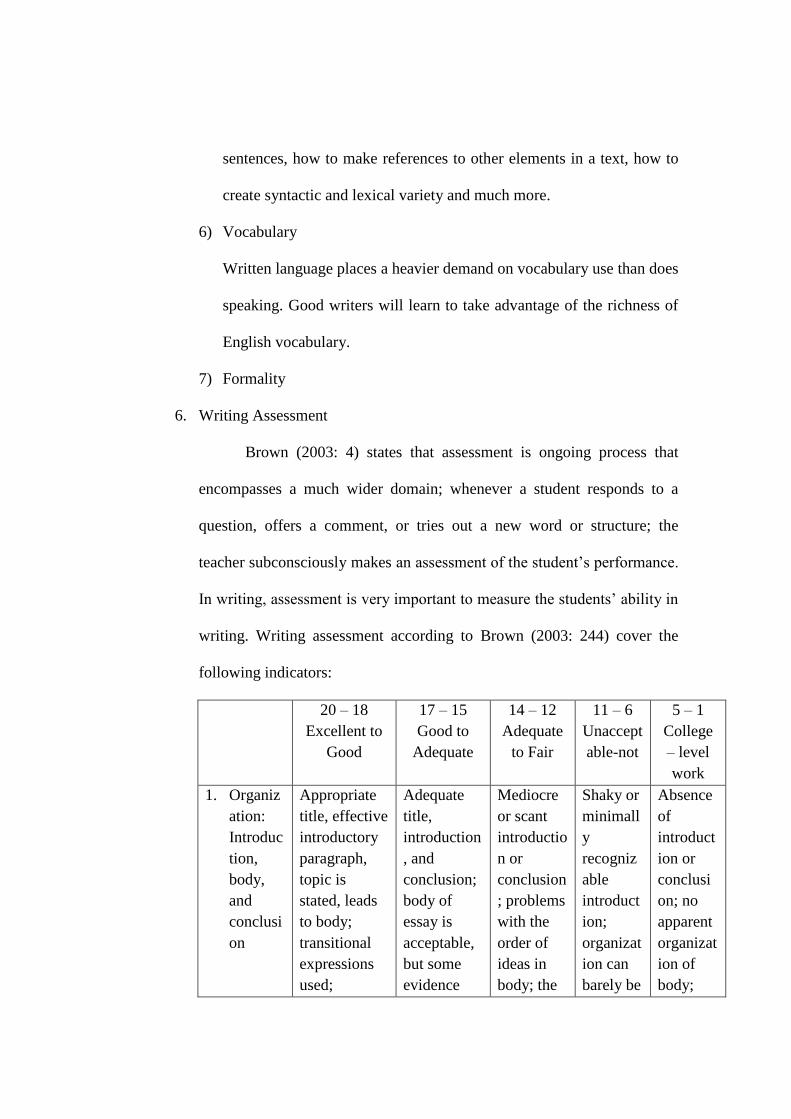
6. Writing Assessment
Brown (2003: 4) states that assessment is ongoing process that
encompasses a much wider domain; whenever a student responds to a
question, offers a comment, or tries out a new word or structure; the
teacher subconsciously makes an assessment of the student’s performance.
In writing, assessment is very important to measure the students’ ability in
writing. Writing assessment according to Brown (2003: 244) cover the
following indicators:
20 – 18
Excellent to
Good
17 – 15
Good to
Adequate
14 – 12
Adequate
to Fair
11 – 6
Unaccept
able-not
5 – 1
College
– level
work
1. Organiz
ation:
Introduc
tion,
body,
and
conclusi
on
Appropriate
title, effective
introductory
paragraph,
topic is
stated, leads
to body;
transitional
expressions
used;
Adequate
title,
introduction
, and
conclusion;
body of
essay is
acceptable,
but some
evidence
Mediocre
or scant
introductio
n or
conclusion
; problems
with the
order of
ideas in
body; the
Shaky or
minimall
y
recogniz
able
introduct
ion;
organizat
ion can
barely be
Absence
of
introduct
ion or
conclusi
on; no
apparent
organizat
ion of
body;
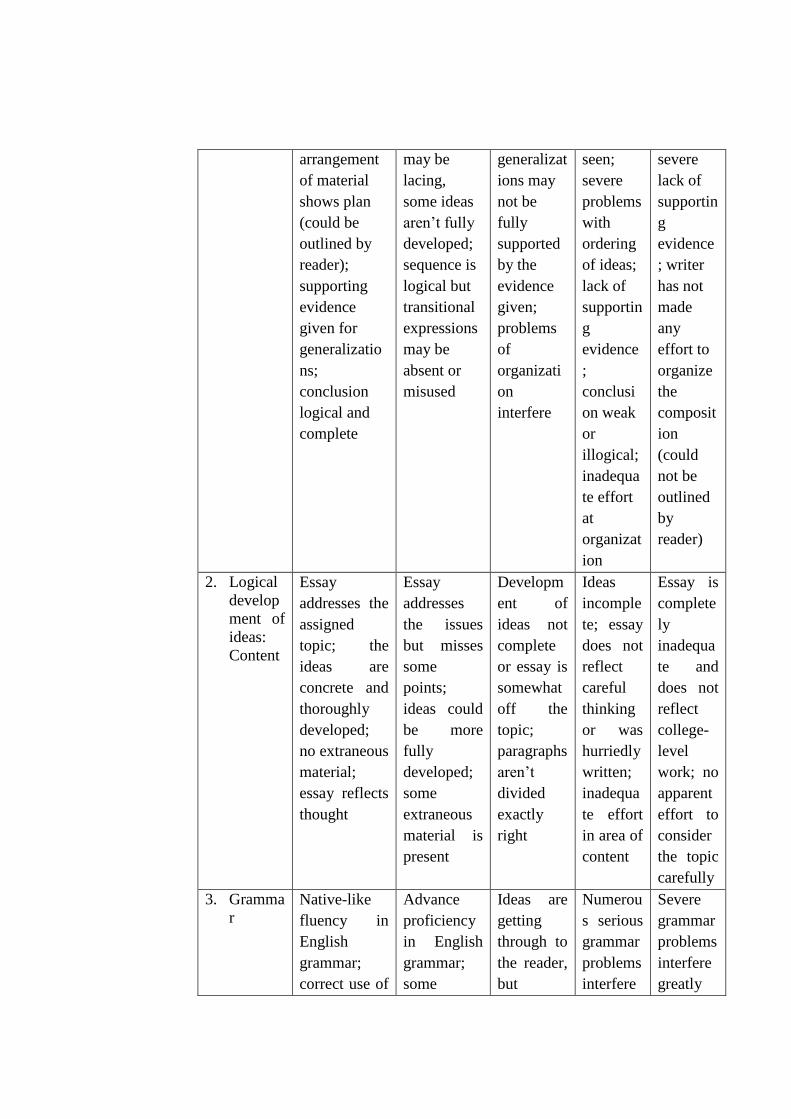
arrangement
of material
shows plan
(could be
outlined by
reader);
supporting
evidence
given for
generalizatio
ns;
conclusion
logical and
complete
may be
lacing,
some ideas
aren’t fully
developed;
sequence is
logical but
transitional
expressions
may be
absent or
misused
generalizat
ions may
not be
fully
supported
by the
evidence
given;
problems
of
organizati
on
interfere
seen;
severe
problems
with
ordering
of ideas;
lack of
supportin
g
evidence
;
conclusi
on weak
or
illogical;
inadequa
te effort
at
organizat
ion
severe
lack of
supportin
g
evidence
; writer
has not
made
any
effort to
organize
the
composit
ion
(could
not be
outlined
by
reader)
2. Logical
develop
ment of
ideas:
Content
Essay
addresses the
assigned
topic; the
ideas are
concrete and
thoroughly
developed;
no extraneous
material;
essay reflects
thought
Essay
addresses
the issues
but misses
some
points;
ideas could
be more
fully
developed;
some
extraneous
material is
present
Developm
ent of
ideas not
complete
or essay is
somewhat
off the
topic;
paragraphs
aren’t
divided
exactly
right
Ideas
incomple
te; essay
does not
reflect
careful
thinking
or was
hurriedly
written;
inadequa
te effort
in area of
content
Essay is
complete
ly
inadequa
te and
does not
reflect
college-
level
work; no
apparent
effort to
consider
the topic
carefully
3. Gramma
r
Native-like
fluency in
English
grammar;
correct use of
Advance
proficiency
in English
grammar;
some
Ideas are
getting
through to
the reader,
but
Numerou
s serious
grammar
problems
interfere
Severe
grammar
problems
interfere
greatly
relative
clauses,
prepositions,
modals,
articles, verb
forms, and
tense
sequencing;
no fragments
or run-on
sentences
grammar
problems
don’t
influence
communicat
ion,
although the
reader is
aware of
them; no
fragment or
run-on
sentences
grammar
problems
are
apparent
and have a
negative
effect on
communic
ation; run-
on
sentences
or
fragments
present
with
communi
cation of
the
writer’s
ideas;
grammar
review of
some
areas
clearly
needed;
difficult
to read
sentence
s
with the
message;
reader
can’t
understa
nd what
the
writer
was
trying to
say;
unintelli
gible
sentence
structure
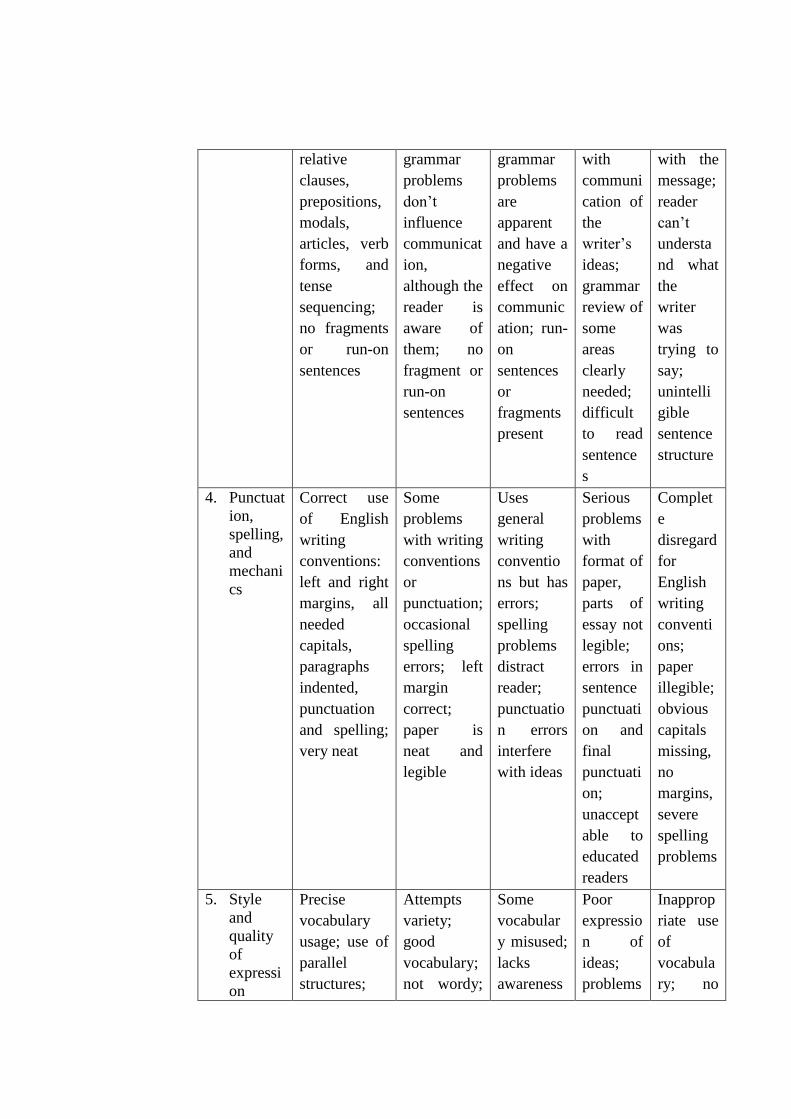
4. Punctuat
ion,
spelling,
and
mechani
cs
Correct use
of English
writing
conventions:
left and right
margins, all
needed
capitals,
paragraphs
indented,
punctuation
and spelling;
very neat
Some
problems
with writing
conventions
or
punctuation;
occasional
spelling
errors; left
margin
correct;
paper is
neat and
legible
Uses
general
writing
conventio
ns but has
errors;
spelling
problems
distract
reader;
punctuatio
n errors
interfere
with ideas
Serious
problems
with
format of
paper,
parts of
essay not
legible;
errors in
sentence
punctuati
on and
final
punctuati
on;
unaccept
able to
educated
readers
Complet
e
disregard
for
English
writing
conventi
ons;
paper
illegible;
obvious
capitals
missing,
no
margins,
severe
spelling
problems
5. Style
and
quality
of
expressi
on
Precise
vocabulary
usage; use of
parallel
structures;
Attempts
variety;
good
vocabulary;
not wordy;
Some
vocabular
y misused;
lacks
awareness
Poor
expressio
n of
ideas;
problems
Inapprop
riate use
of
vocabula
ry; no
concise;
register good
register OK;
style fairly
concise
of register;
may be
too wordy
in
vocabula
ry; lacks
variety
of
structure
concept
of
register
or
sentence
variety
7. Genre of Text
The term genre, based on Hartono (2005: 4), is used to refer to
particular text-types, not to traditional varieties of literature.
According to Hartono (2005:6) there are two main categories of
genre. There are story and factual genres.
a. Story genres
There are six main text types in this category: narrative, news
story/Items, exemplum, anecdote, recount and spoof. Media texts
such as films, videos, television shows and CDs can also fall in this
category.
1) Narrative
Narrative is a text which has a purpose to amuse, entertain, and
to deal with actual or various experience in different ways.
2) News Story/Items
News story/items is factual texts that inform the reader about
events of the day which are considered newsworthy or
important.
3) Exemplum
Exemplum is a text which has purpose to deal with incidents
that are in some respects out of the usual, point to some general
value in the cultural context.
4) Anecdote
Anecdote is a text which has function is to share with others an
account of an unusual or amusing incident.
5) Recount
Recount is kind of genre which has purpose to retell an event for
the purpose of informing or entertaining.
6) Spoof
Spoof is kind of genre which has purpose to retell an event whit
humorous twist.
b. Factual genres
There are nine main text types in this category. There are
procedure, explanation, report, analytical exposition, hortatory
exposition, discussion, description, review and commentary.
1) Procedure
Procedure is a text which has social function to describe how
something is accomplish through a sequence of action or steps.
2) Explanation
Explanation is a text which has social function to explain the
processes involved in the formatting or workings of natural or
social-cultural phenomena.
3) Report
Report is a kind of text which has a purpose to describe the way
things are, with reference to arrange or natural, man-made and
social phenomena in our environment.
4) Analytical Exposition
Analytical Exposition is a text which has a purpose to persuade
the reader or listener that something in the case.
5) Hortatory Exposition
Hortatory Exposition is a text which has social function to
persuade the reader or listener that something should or should
not be the case.
6) Discussion
Discussion is a text which has social function to present (at
least) two points of view about an issue.
7) Description
Description is a text which has social function to describe a
particular person, place or thing.
8) Review
Review is a text which has social function to critique an art
work or event for a public audience.
9) Commentary
Commentary is a text which has social function to explain the
processes involved in the formation (evolution) of a socio-
cultural phenomenon, as a though a natural phenomenon.
8. Analytical Exposition
Hartono (2005: 9) states that analytical exposition has language
features, they are: focus on generic human and non-human participants,
more use of modality, few temporal conjunctive relations, reasoning
expressed as verbs and nouns, and use material, relation and mental
process. He (2005: 14) also adds that it has schematic structure, including
thesis, arguments and reiteration.
9. Guided Questions
Mayberry and Hartle states (2003: 94) that an effective question
motivates students’ engagement by providing the right words and enough
response time for students to compose a response. Great questions are
crafted with attention to voice inflection, word emphasis, word choice,
timing, the audience’s (students’) prior knowledge and needed challenges,
the goals of a lesson, and the context in which the questions are raised.
Brown (2004: 234) states that guided questions are the test
administrator poses a series of questions that essentially serve as an outline
of the emergent written text. Strachan (2007: 8) adds that questions that
work have intention; they enable a group to get where it wants to go. They
are created deliberately to support achievement of the purpose and
objectives of a process and are situated within a process framework that
guides participants toward expected outcomes.
According to Traver (1998), a guiding question is the fundamental
query that directs the search for understanding. Guiding questions help
provide focus and coherence for units of study (taken from
http://academic.evergreen.edu/w/waltonsl/Gquestions.html).
The guided questions have characteristics (taken from
http://academic.evergreen.edu/w/waltonsl/Gquestions.html), there are:
a. Good guiding questions are open-ended yet focus inquiry on a specific topic.
b. Guiding questions are non-judgmental, but answering them requires high-
level cognitive work.
c. Good guiding questions contain emotive force and intellectual bite.
d. Guiding questions are succinct. They contain few words but demand a lot.
Based on that explanation above, guided questions are the planned
questions that can help the students easier in writing and it is the way to
start writing by the students.
C. Conceptual Framework
Writing is one of important skills that the students have to master. It is
productive skill that it needs skillfulness by the writer. The students have to
master writing skills. Guided question is a series of question that it can help
the writer to make easier in writing English especially. It is a technique which
is used to guide the students before they write. These questions will help the
students to write what they think easily.
In this research, guided questions are used in senior high school
students. There are some questions before the students write to guide the
students easier in writing analytical exposition text especially. The students
are given two tests, there are pre-test and post-test. The result of these test will
conclude whether this technique effective or not in senior high school
students.
D. Hypothesis
According to Arikunto (2010:110), hypothesis comes from two words
namely hypo and thesa. Hypo means under, even though thesa means the
truth. On its development, the word of hypo thesa moved to hypothesis.
Consequently, the meaning of hypothesis is temporary answer on the research
problem until it is proved through the collected data.
Based on the description above, the researcher would like to formulate
the hypothesis, as follows:
1. Hypothesis positive (Ha) : there is effective of using guided question in
teaching writing of analytical exposition text to eleventh grade students of
SMA N 8 Purworejo in academic year 2013/2014. The use of guided
question in teaching writing of analytical exposition text to eleventh grade
students of SMA N 8 Purworejo in academic year 2013/2014 is effective.
2. Hypothesis negative (Ho) : there is no effectiveness of using guided
question in teaching writing of analytical exposition text to eleventh grade
students of SMA N 8 Purworejo. The use of guided question in teaching
writing of analytical exposition text to eleventh grade students of SMA N
8 Purworejo in academic year 2013/2014 is not effective.
CHAPTER III
RESEARCH METHOD
In this chapter, the researcher would like to present the way to accomplish
the research. It was presented for the solving the problem easier, as follows: types
of research, variables of research, population and sample, sampling technique,
research instrument, technique of collecting data, technique of data analysis, and
time and place taking research.
A. Types of Research
Kothari (2004: 3) notes that the basic types of research are
quantitative and qualitative research. Quantitative research is based on the
measurement of quantity or amount. It is applicable to phenomena that can be
expressed in terms of quantity. On the other hand, qualitative research is
concerned with qualitative phenomenon relating to or involving quality or
kind.
This research is quantitative research due to there is measurement of
data amount to compare the result of pre-test and post-test. It is to determine
whether guided questions are effective or not.
B. Time and Place Taking Research
In this research, the place is taken in SMA N 8 Purworejo. It is located
in Grabag, Purworejo. This research has been done at 8th May 2014 until 22th
25
May 2014. The researcher took the eleventh grade students of SMA N 8
Purworejo in academic year 2013/2014. In this research, there are three
sections: pre-test, treatment, and post-test.
C. Variables of Research
According to Sugiyono (2010:2), variables are all kinds of thing that is
anything form decided by the researcher to be taught so that is got information
about it then attracted the conclusion.
There are two variables of this research:
a. Independent variable
Independent variable or free variable is the influence of variable or the
factor of transition (Sugiyono, 2010:4). In this research, independent
variable is guided questions.
b. Dependent variable
Dependent variable is variable which is influenced due to there is
independent variable (Sugiyono, 2010:4). In this research, dependent
variable is students’ writing skill on analytical exposition text.
D. Population and Sample
Arikunto (2010 : 173) states that population is a set (or a collection) of
all elements possessing one or more attributes of interest. Even though
Sugiyono (2010 : 61) argues that population is generalization area consisted of
object or subject which has specific quality and characteristic established by
the researcher to be taught and drawn its conclusion. Based on those
statements, the researcher concludes that population is all of subjects of the
research that have same characteristic or specific criterion such as person,
animals, or things which is established by the researcher as the subject of the
research. In this research, the population is the eleventh grade students of
SMA N 8 Purworejo in the academic year 2013/2014.
Sugiyono (2010 : 62) notions that sample is a part of the quantity and
characteristics population. Arikunto (2010: 174) adds that sample is a part of
population taken for the research; it is taken to find out about population.
Sample of this research is XI IPS 1 that consists of 30 students as
experimental group and XI IPS 4 that consists of 30 students as control group.
E. Sampling Technique
Arikunto (2010 : 177 – 185) argues that to draw a sample accurately
requires many sampling techniques that the researcher uses, as follows:
1. Random sampling
In this technique, the researcher shuffles the subject of population so all
subjects have a change to be chosen.
2. Stratified sampling
The researcher assumes the population is divided into stratification; the
sample is drawn fir the stratification.
3. Area sampling
It is sampling by drawing sample of every area in the population.
4. Purposive sampling
The drawing of sampling is based on specific purpose by considering the
time consumes and other factors.
5. Propositional sampling
This sample is to complete the area of probability sampling because
sometimes each area has different numbers, the drawing sample is in
propositional sampling. It is propositioned to the ordered areas.
6. Quota sampling
This sampling is based on the quota the researcher needs. The samples
draw random area and stratification.
7. Cluster sampling
The drawing of sample is based on cluster.
8. Double sampling
The researcher takes two samples. The number of the first sample is bigger
than the second sample. The second sample is useful to check the truth of
data of the first sample or to complete the number on the first sample.
Based on the kinds of sampling technique above, the researcher uses
purposive sampling. The reason of the researcher chooses this sampling is due
to the researcher based on the time which is needed in this research and other
factors. There are times to carry out pre-test, giving treatment and post-test. It
is to find out the result of this research in Eleventh Grade Students of SMAN
8 Purworejo.

F. Research Instrument
Instrument according to Arikunto (2010:203), is a kind of tool which
is used by the researcher to collect or to get the data. Basically, there are two
kinds of instruments, namely test and non-test. He (2010: 193-201) adds there
are some techniques of collecting data, as follows: test, questionnaires,
interview, observation, rating scale, and documentation. The researcher uses
test to obtain the data.
G. Technique of Collecting Data
The researcher take three activities of this research, there are giving
pre-test, treatment, and post-test.
a. Pre-test
Pre-test is the test which is held before learning has occurred. This section
measures the students’ ability in test naturally. It is held on 8th May 2014.
There are two classes, one is experimental class and another one is control
class. The students make an analytical exposition text.
b. Treatment
Treatment is teaching process and giving instruction about the students’
misunderstanding in the material. It is held on 16th and 17th May 2014. In
control class, there is no treatment. While in experimental class, there is
giving treatment with the guided questions technique.

c. Post-test
Post-test is giving after learning has occurred or supposed to have to
occur. It is held on 22th May 2014. In experimental class, there is giving
guided questions in their test. While in control class, there is no technique
in use.
H. Technique of Data Analysis
In this analysis, the researcher analyzes the data to the hypothesis.
This analysis is done to find out the effectiveness of using guided questions
technique to improve writing skill.
1. Descriptive statistic analysis
Descriptive statistic analysis is statistic that is used to analyze the
data by describing or illustrating on the observed object by the collected
data without doing analysis and making conclusion which obtains to the
general (Sugiyono, 2011:147).
The uses of statistics are mean analysis and standard deviation
analysis. Additionally, the mean, mode, median, standard deviation, the
lowest score, and the highest score are also used to analyze the data.
a. Finding the Mean
Sugiono (2010:49) states that mean is the average of the set
scores, obtained by adding the score together and dividing by the total
number of the students. According to Sugiyono (2010:49), the
researcher uses the following formula to determine the mean:
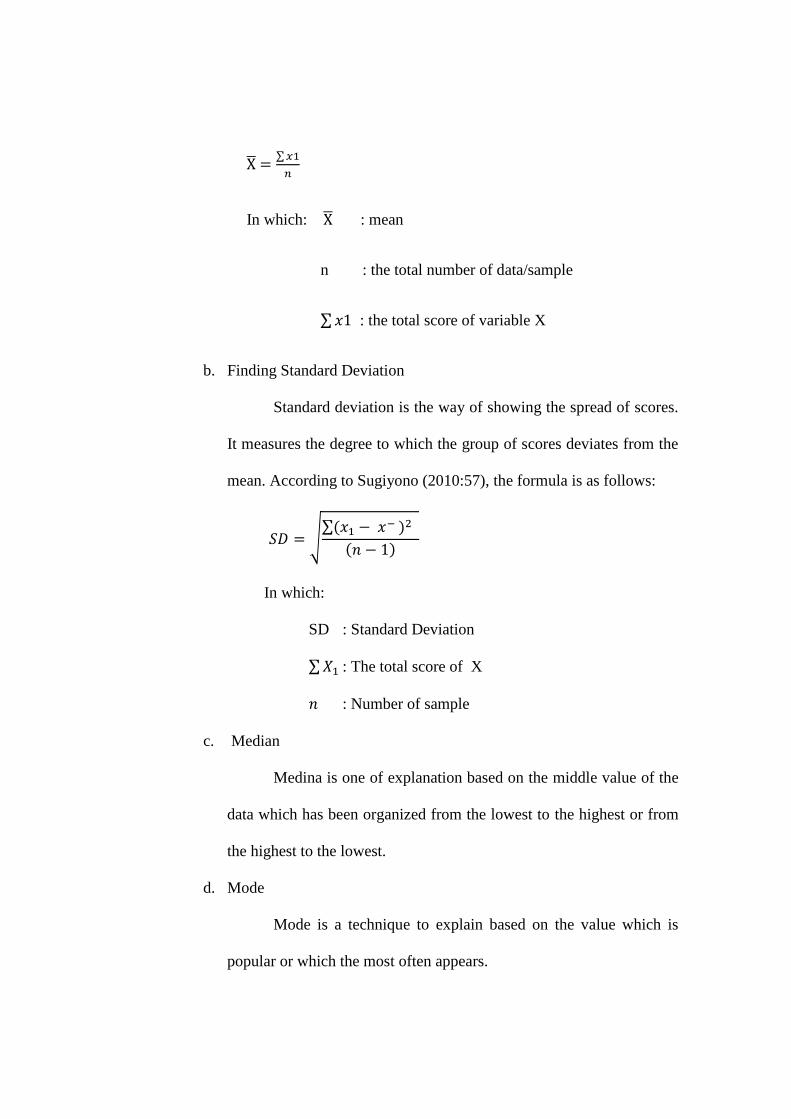
X̅ =∑ 𝑥1
𝑛
In which: X̅ : mean
n : the total number of data/sample
∑ 𝑥1 : the total score of variable X
b. Finding Standard Deviation
Standard deviation is the way of showing the spread of scores.
It measures the degree to which the group of scores deviates from the
mean. According to Sugiyono (2010:57), the formula is as follows:
𝑆𝐷 = √∑(𝑥1 − 𝑥− )2
(𝑛 − 1)
In which:
SD : Standard Deviation
∑ 𝑋1 : The total score of X
𝑛 : Number of sample
c. Median
Medina is one of explanation based on the middle value of the
data which has been organized from the lowest to the highest or from
the highest to the lowest.
d. Mode
Mode is a technique to explain based on the value which is
popular or which the most often appears.
e. Range
Range is a way to talk about the spread of distribution of
scores. According to Sugiyono (2010:55), the range formula is a
follows:
R= Xt –Xr
Where:
R : Range
Xt : The highest data on the group
Xr : The lowest data on the group.
2. Inferential statistic analysis
It is statistic technique which is used to analyze the data of sample and the
result is undertaken for population (Sugiyono, 2011:148).
a. Test of normality
This test is intended to determine the distribution of the
maximum and minimum values as well as the variability of research
data. Tests carry out by using the test for normality distribution with
the chi square (x2). In this research used for normality distribution of
initial abilities and accomplishments to learn English the subject of
analytical exposition text. As the formula to test the normality of the
data with Chi square (Sugiyono, 2011: 172) is as follows:
𝑥2 = (𝑓𝑜 − 𝑓ℎ)2
𝑓ℎ
X2 = the chi square value
Fo = the observed frequency
Fh = the expected frequency
The result of computation is consulted to the table. The data are
normal if obtained x2 value is lower than the critical value of x2 in the
table, and are not normal if it is higher than the critical value in the
table.
b. Test of Homogeneity
This test aims to determine whether the research is uniformly
drawn from the same population, given the research data drawn from
separate groups from one population. According to Sugiyono (2009:
276) to test the homogeneity of variance, we use F test.
F = 𝑡ℎ𝑒 ℎ𝑖𝑔ℎ𝑒𝑠𝑡 𝑣𝑎𝑟𝑖𝑎𝑛𝑐𝑒
𝑡ℎ𝑒 𝑙𝑜𝑤𝑒𝑠𝑡 𝑣𝑎𝑟𝑖𝑎𝑛𝑐𝑒
If the price F value < F table, it stated that variance of the two
groups are homogeneous.
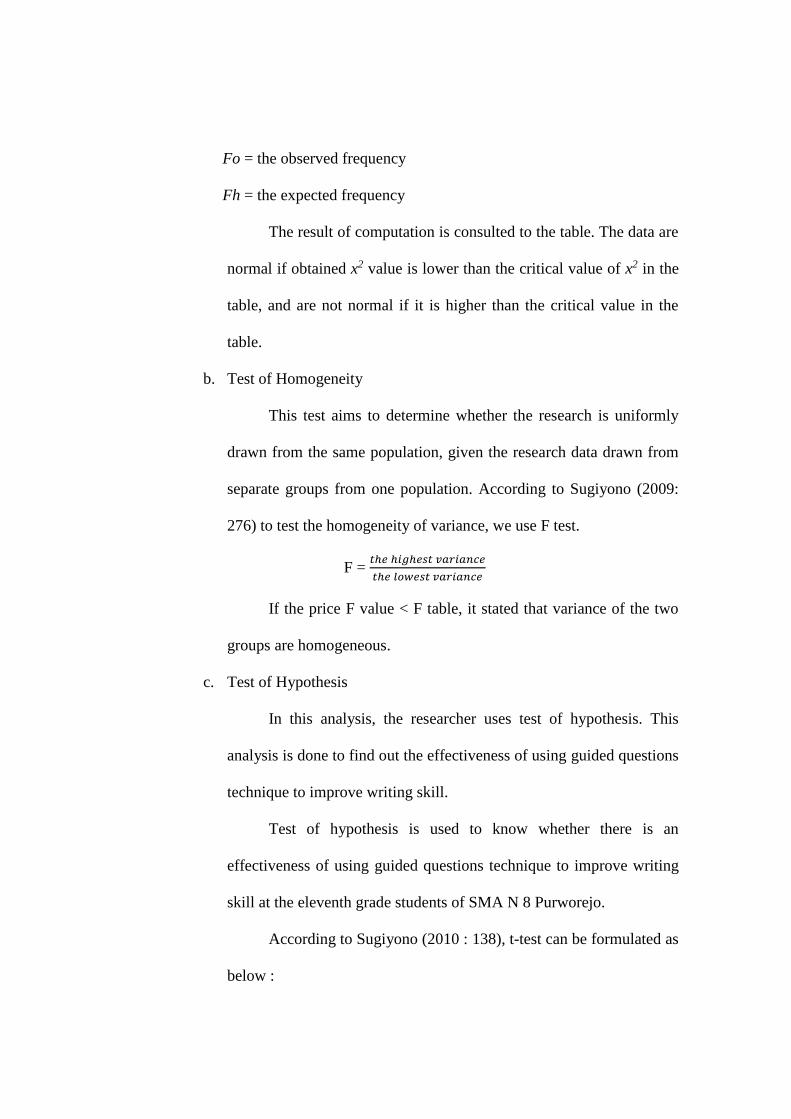
c. Test of Hypothesis
In this analysis, the researcher uses test of hypothesis. This
analysis is done to find out the effectiveness of using guided questions
technique to improve writing skill.
Test of hypothesis is used to know whether there is an
effectiveness of using guided questions technique to improve writing
skill at the eleventh grade students of SMA N 8 Purworejo.
According to Sugiyono (2010 : 138), t-test can be formulated as
below :
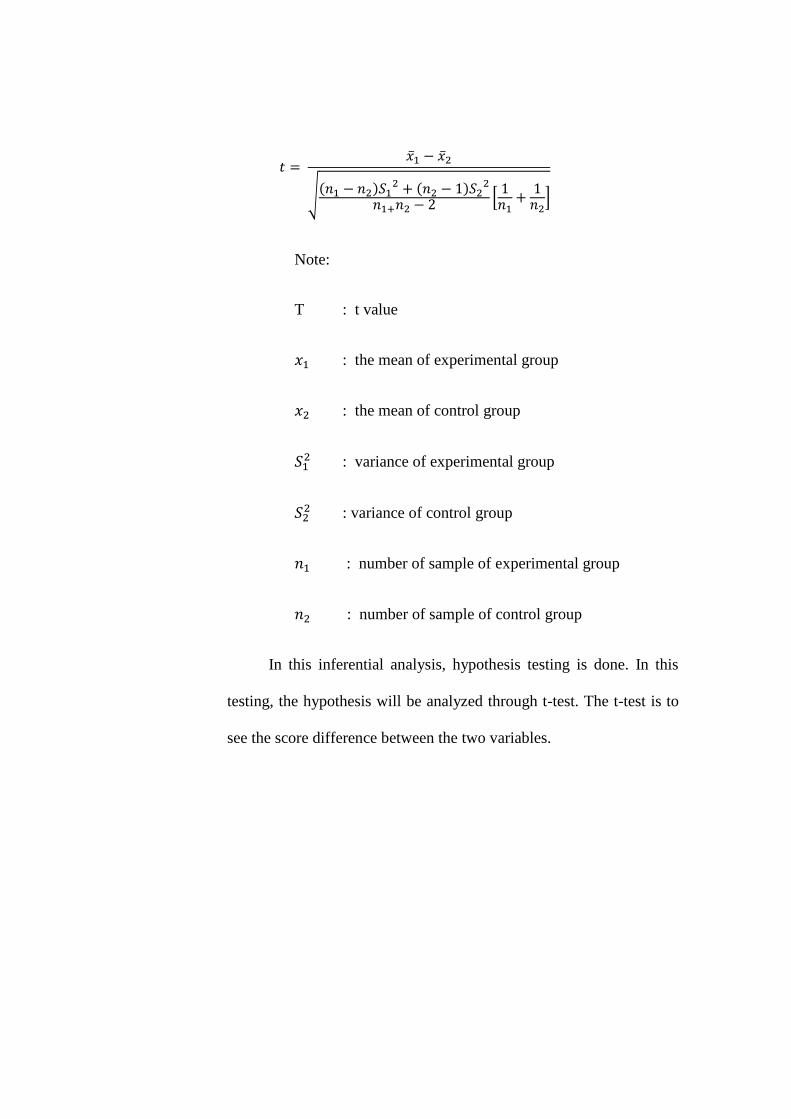
𝑡 = �̅�1 − �̅�2
√(𝑛1 − 𝑛2)𝑆12 + (𝑛2 − 1)𝑆2
2
𝑛1+𝑛2 − 2 [1
𝑛1+
1𝑛2
]
Note:
T : t value
𝑥1 : the mean of experimental group
𝑥2 : the mean of control group
𝑆12 : variance of experimental group
𝑆22 : variance of control group
𝑛1 : number of sample of experimental group
𝑛2 : number of sample of control group
In this inferential analysis, hypothesis testing is done. In this
testing, the hypothesis will be analyzed through t-test. The t-test is to
see the score difference between the two variables.
CHAPTER IV
RESEARCH FINDING AND DISCUSSION
In this chapter, the researcher would like to present the result of this
research. The data are collected from 60 students of the eleventh grade of SMA N
8 Purworejo in academic year 2013/2014. The researcher uses test as research
instrument. This result of test which is conducted in experimental and control
group will measure the effectiveness of using guided questions in teaching writing
of analytical text.
A. Data Description
This research is conducted at SMA N 8 Purworejo. It is located at
Grabag, Purworejo. The researcher took eleventh grade of SMA N 8
Purworejo in academic year 2013/2014. They are XI IPS 1 that consist of 30
students and XI IPS 4 that consist of 30 students. The number of this sample is
60 students from two classes. By using test, the researcher collected data of
the test result. According to Arikunto (2010:245), to compute the test result,
the score is based on scoring criteria in the following table :
Table 1. Table of classification of students’ achievement:
Value Grade Level of achievement
80-100 A Excellent
66-79 B Good
35
56-65 C Sufficient
40-55 D Fairly Sufficient
<39 E Poor
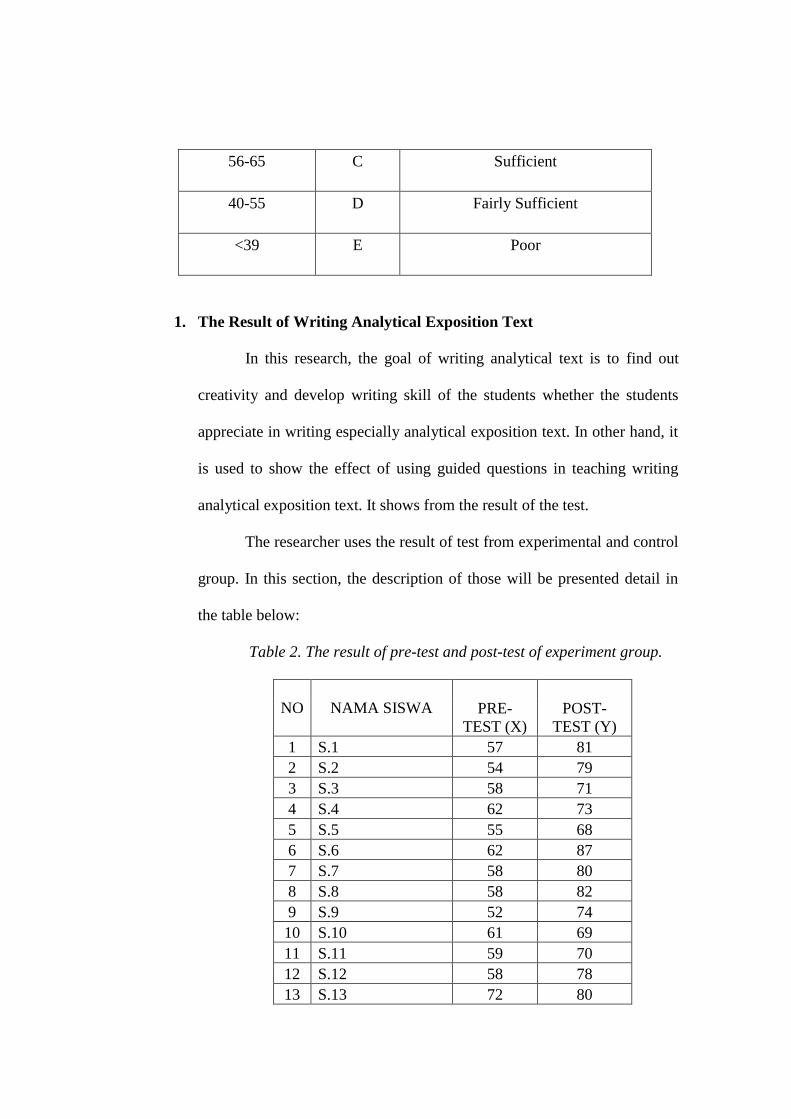
1. The Result of Writing Analytical Exposition Text
In this research, the goal of writing analytical text is to find out
creativity and develop writing skill of the students whether the students
appreciate in writing especially analytical exposition text. In other hand, it
is used to show the effect of using guided questions in teaching writing
analytical exposition text. It shows from the result of the test.
The researcher uses the result of test from experimental and control
group. In this section, the description of those will be presented detail in
the table below:
Table 2. The result of pre-test and post-test of experiment group.
NO NAMA SISWA PRE-
TEST (X)
POST-
TEST (Y)
1 S.1 57 81
2 S.2 54 79
3 S.3 58 71
4 S.4 62 73
5 S.5 55 68
6 S.6 62 87
7 S.7 58 80
8 S.8 58 82
9 S.9 52 74
10 S.10 61 69
11 S.11 59 70
12 S.12 58 78
13 S.13 72 80
14 S.14 61 83
15 S.15 58 70
16 S.16 59 75
17 S.17 59 73
18 S.18 49 65
19 S.19 52 69
20 S.20 56 80
21 S.21 54 81
22 S.22 49 60
23 S.23 60 84
24 S.24 63 77
25 S.25 55 68
26 S.26 62 80
27 S.27 76 91
28 S.28 58 87
29 S.29 61 71
30 S.30 72 74
∑ 1770 2280
Mean 59 76
The table above shows the score of pre-test and post-test of XI IPS-
1 students as experimental group of SMA N 8 Purworejo. The highest
score of pre-test is 76 and the lowest score is 49. While the highest score
of post-test is 91 and the lowest score is 60.
Table 3. The result of pre-test and post-test of control group.
NO STUDENTS PRE-
TEST
(X)
POST-
TEST
(Y)
1 S.1 58 78
2 S.2 54 63
3 S.3 53 69
4 S.4 50 70
5 S.5 64 83
6 S.6 52 71
7 S.7 56 65
8 S.8 53 75
9 S.9 52 77
10 S.10 50 74
11 S.11 48 59
12 S.12 56 66
13 S.13 66 85
14 S.14 51 78
15 S.15 53 75
16 S.16 54 74
17 S.17 48 56
18 S.18 57 72
19 S.19 49 63
20 S.20 52 70
21 S.21 60 77
22 S.22 56 69
23 S.23 48 63
24 S.24 49 65
25 S.25 52 70
26 S.26 52 65
27 S.27 57 68
28 S.28 53 63
29 S.29 55 73
30 S.30 54 74
∑ 1612 2110
Mean 53,733 70,333
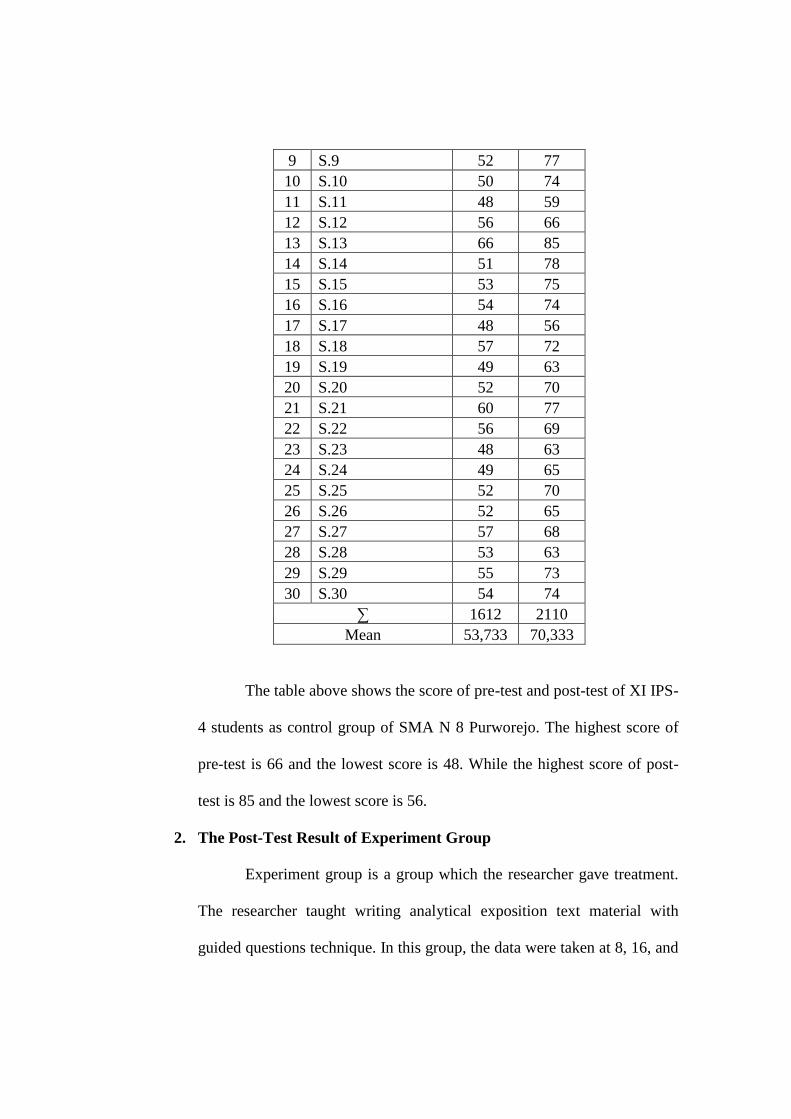
The table above shows the score of pre-test and post-test of XI IPS-
4 students as control group of SMA N 8 Purworejo. The highest score of
pre-test is 66 and the lowest score is 48. While the highest score of post-
test is 85 and the lowest score is 56.
2. The Post-Test Result of Experiment Group
Experiment group is a group which the researcher gave treatment.
The researcher taught writing analytical exposition text material with
guided questions technique. In this group, the data were taken at 8, 16, and
22 May 2014. The researcher calculated the post-test result of experiment
group.
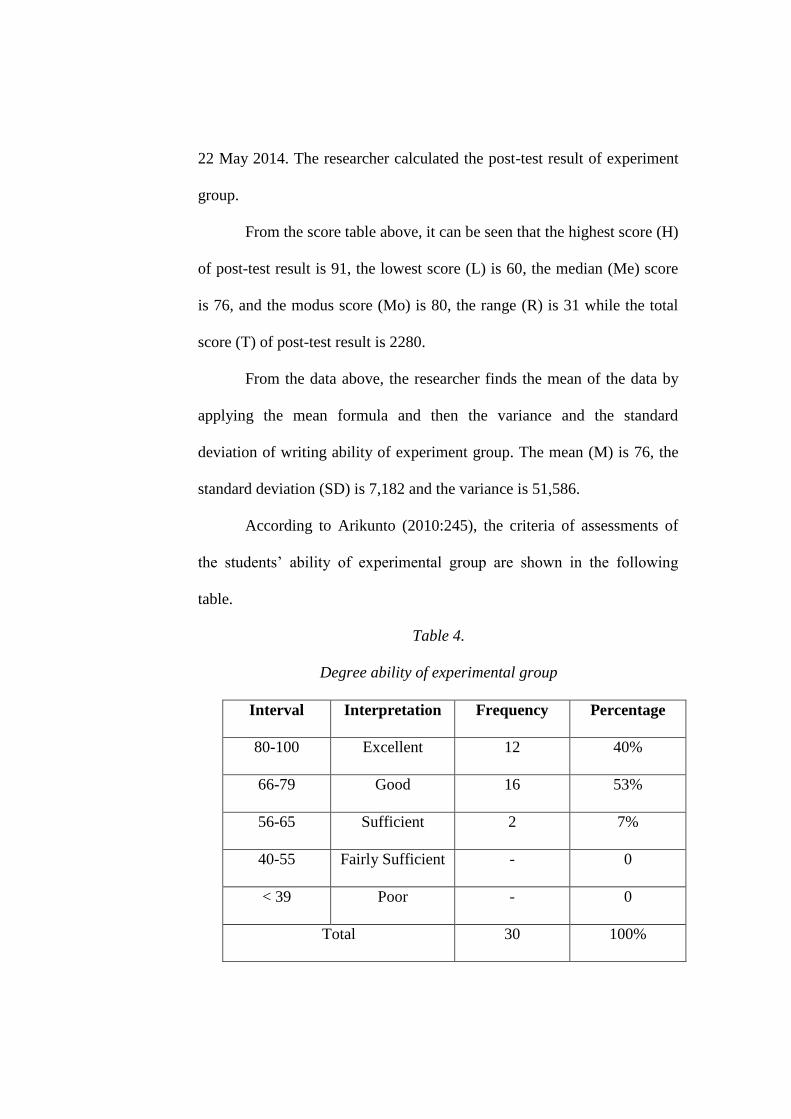
From the score table above, it can be seen that the highest score (H)
of post-test result is 91, the lowest score (L) is 60, the median (Me) score
is 76, and the modus score (Mo) is 80, the range (R) is 31 while the total
score (T) of post-test result is 2280.
From the data above, the researcher finds the mean of the data by
applying the mean formula and then the variance and the standard
deviation of writing ability of experiment group. The mean (M) is 76, the
standard deviation (SD) is 7,182 and the variance is 51,586.
According to Arikunto (2010:245), the criteria of assessments of
the students’ ability of experimental group are shown in the following
table.
Table 4.
Degree ability of experimental group
Interval Interpretation Frequency Percentage
80-100 Excellent 12 40%
66-79 Good 16 53%
56-65 Sufficient 2 7%
40-55 Fairly Sufficient - 0
< 39 Poor - 0
Total 30 100%
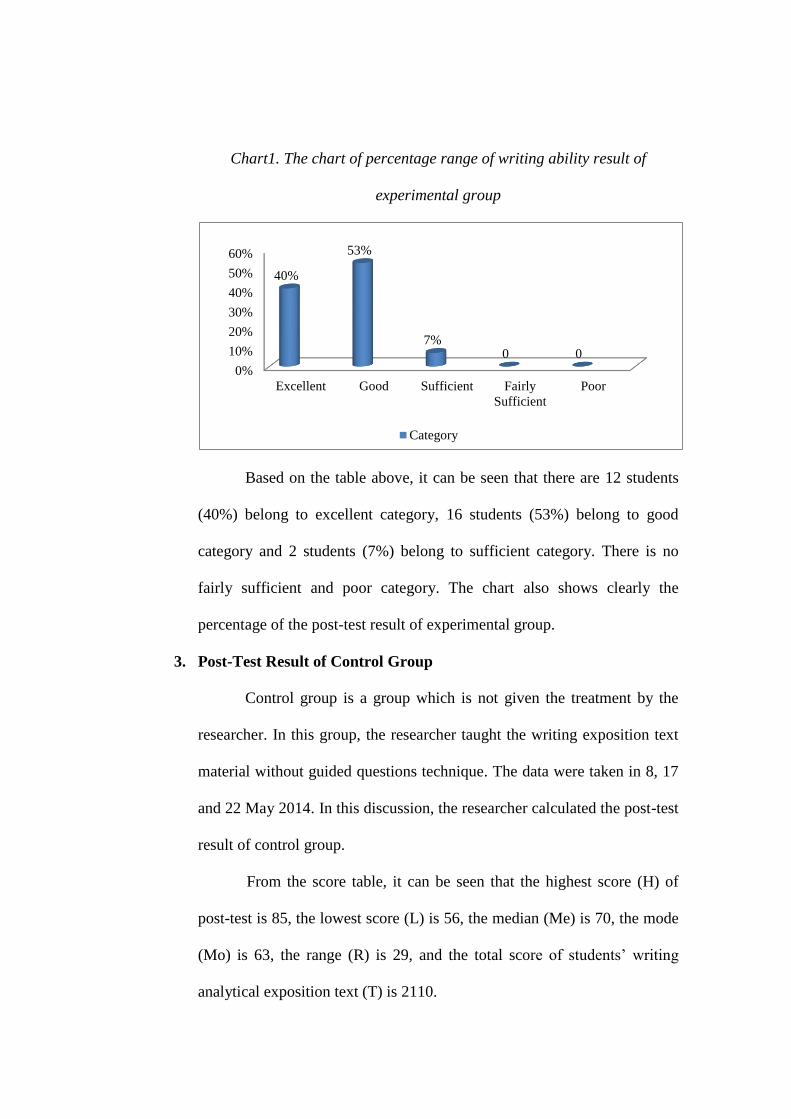
Chart1. The chart of percentage range of writing ability result of
experimental group
Based on the table above, it can be seen that there are 12 students
(40%) belong to excellent category, 16 students (53%) belong to good
category and 2 students (7%) belong to sufficient category. There is no
fairly sufficient and poor category. The chart also shows clearly the
percentage of the post-test result of experimental group.
3. Post-Test Result of Control Group
Control group is a group which is not given the treatment by the
researcher. In this group, the researcher taught the writing exposition text
material without guided questions technique. The data were taken in 8, 17
and 22 May 2014. In this discussion, the researcher calculated the post-test
result of control group.
From the score table, it can be seen that the highest score (H) of
post-test is 85, the lowest score (L) is 56, the median (Me) is 70, the mode
(Mo) is 63, the range (R) is 29, and the total score of students’ writing
analytical exposition text (T) is 2110.
0%
10%
20%
30%
40%
50%
60%
Excellent Good Sufficient Fairly
Sufficient
Poor
40%
53%
7%0 0
Category
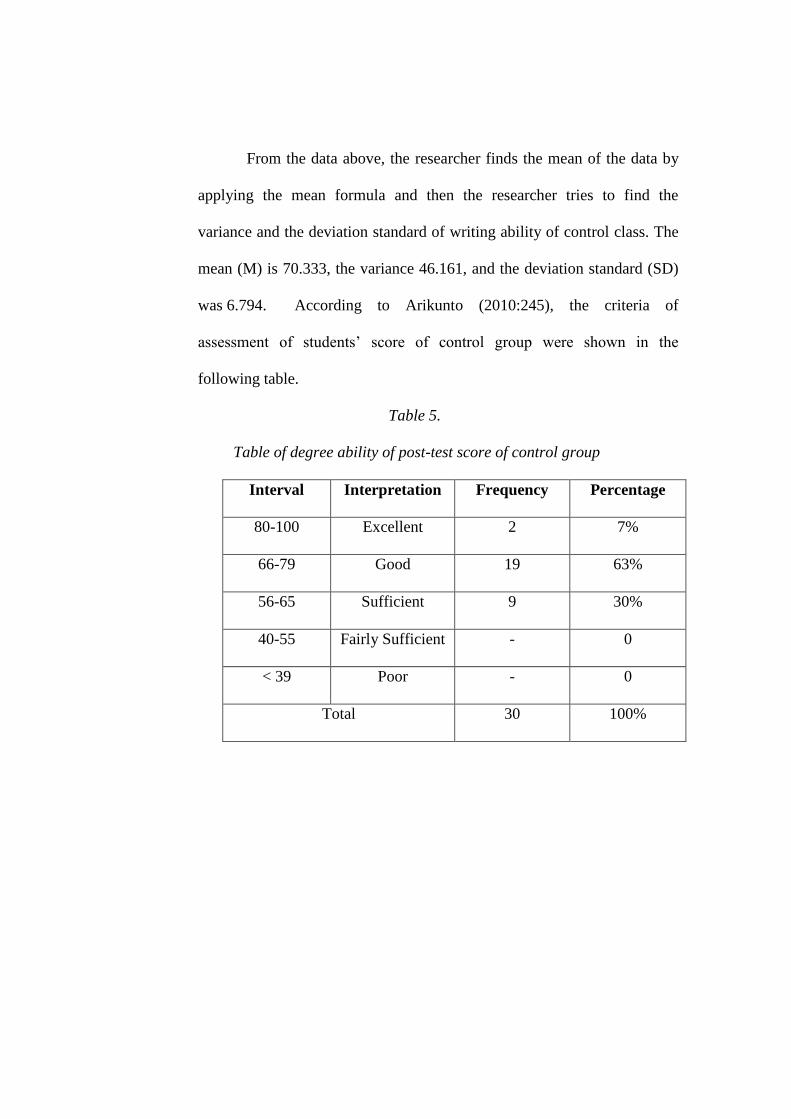
From the data above, the researcher finds the mean of the data by
applying the mean formula and then the researcher tries to find the
variance and the deviation standard of writing ability of control class. The
mean (M) is 70.333, the variance 46.161, and the deviation standard (SD)
was 6.794. According to Arikunto (2010:245), the criteria of
assessment of students’ score of control group were shown in the
following table.
Table 5.
Table of degree ability of post-test score of control group
Interval Interpretation Frequency Percentage
80-100 Excellent 2 7%
66-79 Good 19 63%
56-65 Sufficient 9 30%
40-55 Fairly Sufficient - 0
< 39 Poor - 0
Total 30 100%
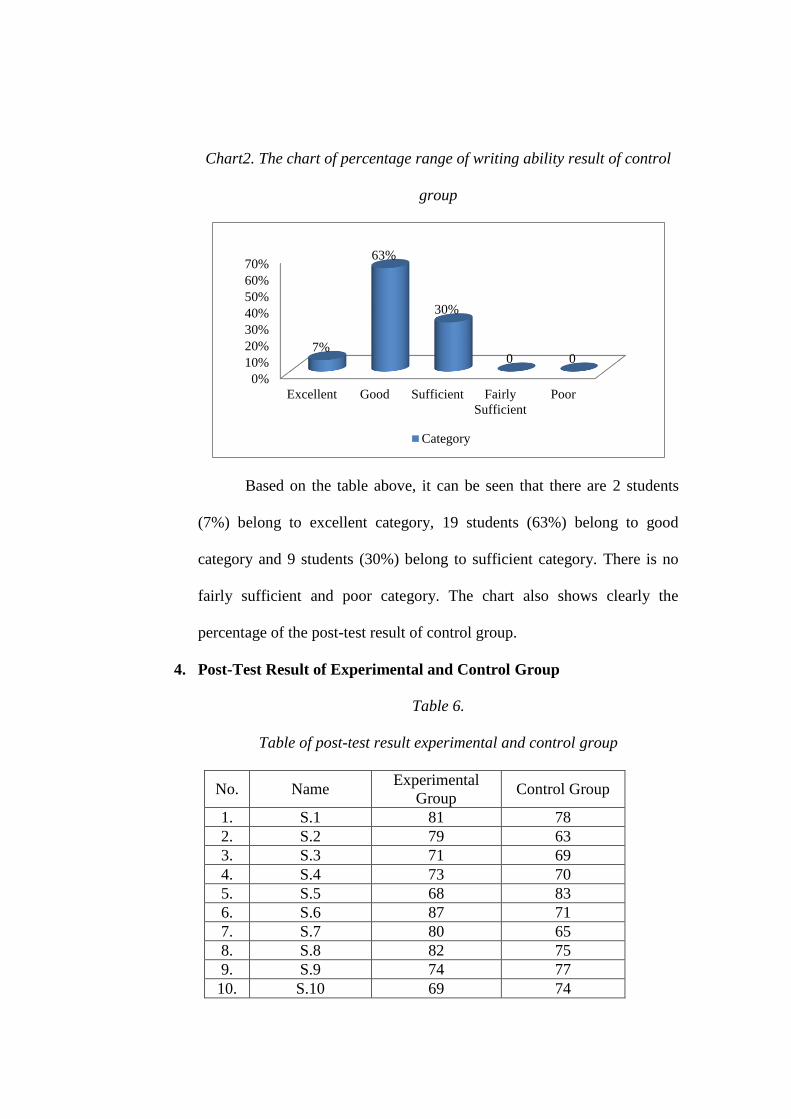
Chart2. The chart of percentage range of writing ability result of control
group
Based on the table above, it can be seen that there are 2 students
(7%) belong to excellent category, 19 students (63%) belong to good
category and 9 students (30%) belong to sufficient category. There is no
fairly sufficient and poor category. The chart also shows clearly the
percentage of the post-test result of control group.
4. Post-Test Result of Experimental and Control Group
Table 6.
Table of post-test result experimental and control group
No. Name Experimental
Group Control Group
1. S.1 81 78
2. S.2 79 63
3. S.3 71 69
4. S.4 73 70
5. S.5 68 83
6. S.6 87 71
7. S.7 80 65
8. S.8 82 75
9. S.9 74 77
10. S.10 69 74
0%
10%
20%
30%
40%
50%
60%
70%
Excellent Good Sufficient Fairly
Sufficient
Poor
7%
63%
30%
0 0
Category
11. S.11 70 59
12. S.12 78 66
13. S.13 80 85
14. S.14 83 78
15. S.15 70 75
16. S.16 75 74
17. S.17 73 56
18. S.18 65 72
19. S.19 69 63
20. S.20 80 70
21. S.21 81 77
22. S.22 60 69
23. S.23 84 63
24. S.24 77 65
25. S.25 68 70
26. S.26 80 65
27. S.27 91 68
28. S.28 87 63
29. S.29 71 73
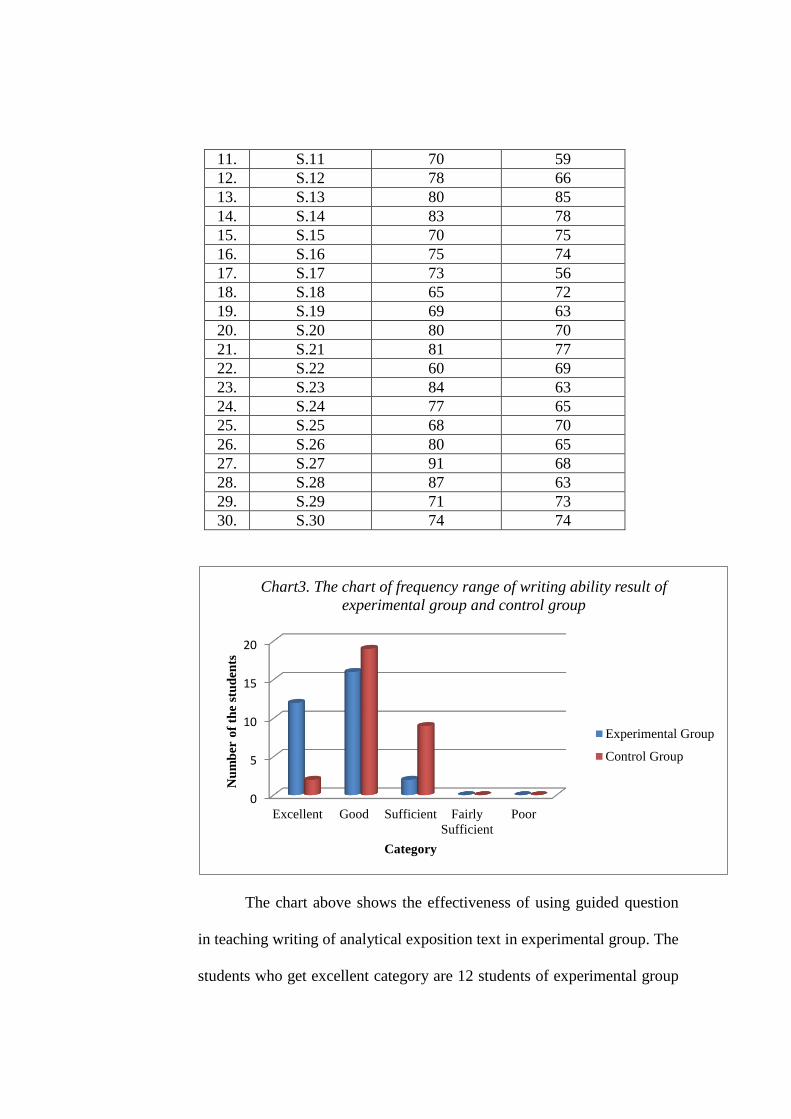
30. S.30 74 74
The chart above shows the effectiveness of using guided question
in teaching writing of analytical exposition text in experimental group. The
students who get excellent category are 12 students of experimental group
0
5
10
15
20
Excellent Good Sufficient Fairly
Sufficient
Poor
Nu
mb
er o
f th
e st
ud
ents
Category
Chart3. The chart of frequency range of writing ability result of
experimental group and control group
Experimental Group
Control Group
and there were 2 students of control group who belong to excellent
category. The students who get good category are 16 students of
experimental group. On the contrary, there are 19 students of control class
who belong to good category. Meanwhile in sufficient category there are 2
students of experimental group and there are 9 students who belong to
sufficient category. Another fact shows that the technique which is used by
the researcher effective is there is no students of experimental group who
belong to fairly sufficient and poor category.
The following table will show the analysis of students’ score in
pre-test and post-test. The analysis was done by taking the score of the pre-
test and post-test.
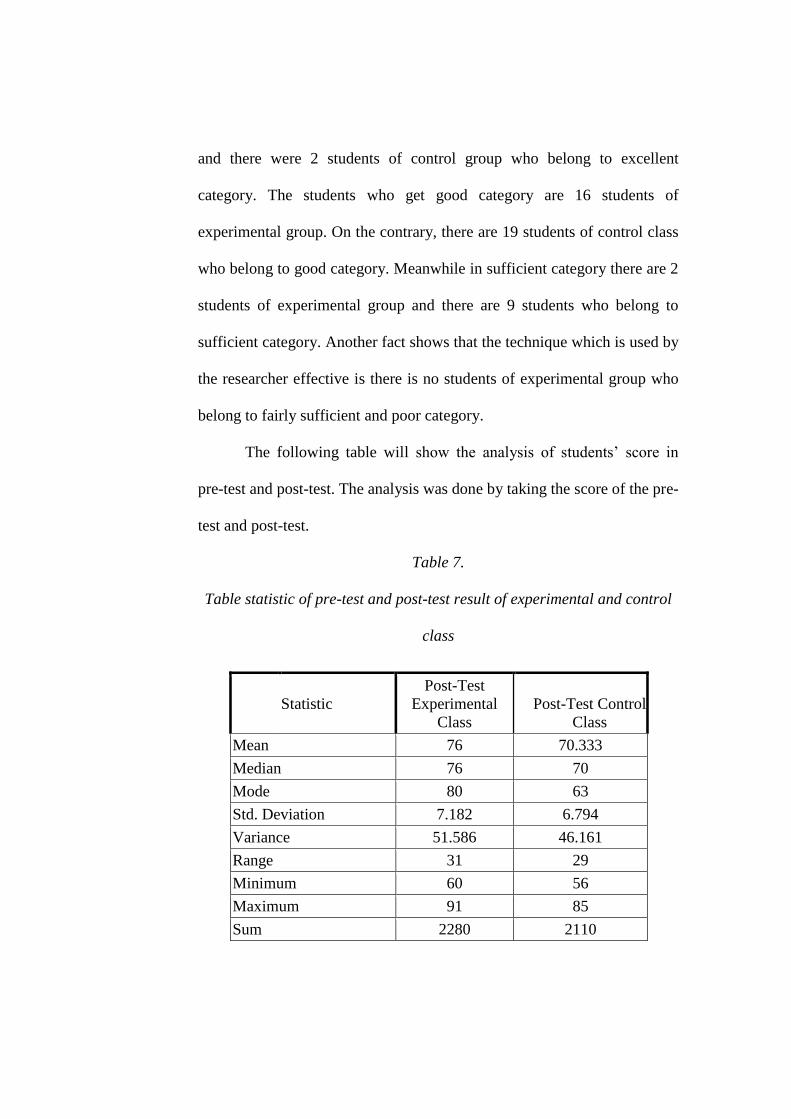
Table 7.
Table statistic of pre-test and post-test result of experimental and control
class
Statistic
Post-Test
Experimental
Class
Post-Test Control
Class
Mean 76 70.333
Median 76 70
Mode 80 63
Std. Deviation 7.182 6.794
Variance 51.586 46.161
Range 31 29
Minimum 60 56
Maximum 91 85
Sum 2280 2110
B. Data Analysis
1. Descriptive Statistic Analysis
a. The Means Scores of Post Test of Experimental and Control
Group
The computation of the mean scores of the experimental group and
control group are calculated as follows:
1) Experimental Group
1
11
_
n
xx
= 30
2280
= 76
The mean score of the experimental group is 76. It can be
categorized as good category.
2) Control Group
2
22
_
n
xx
=30
2110
= 70,333
The mean score of the control group is 70,333. It can be
categorized as good category.

b. Standard Deviation and Variable Experimental and Control
Group
1) Experimental Group
Standard deviation and variance of experimental group can
be seen in appendix. From the table, the computation of the
standard deviation and variance of the experimental group is as
follows:
SD1 = )1(
)x-(x
1
2
11
n
= 29
1496
= √51,586
= 7,182
s12 =
)1(
)x-(x
1
2
11
n
= 29
1496
= 51,586
The standard deviation is 7.182, and the variance was
51,586.
2) Control Group
Standard deviation and variance of control class can be
seen in appendix. From the table, the computation of the standard
deviation and variance of control class is as follows:

SD2 = )1(
)x-(x
2
2
22
n
= 29
1338.667
= √46,161
= 6,794
s22
= )1(
)x-(x
2
2
22
n
= 29
1338.667
= 46,161
The standard deviation was 6.794, and the variance was
46,161.
2. Inferential Analysis
a. Pre-requisite Analysis Text
Knowing that this research is to find out whether there is
significant effect of using guided questions in teaching writing
analytical exposition text of the eleventh grade students at SMA N 8
Purworejo in academic year 2013/2014, the researcher employs the
statistical analysis. In this case, t-test is used to analyze the data.
However, before employing the statistical analysis the researcher
mainly applied pre-requisite test analysis to test the homogeneity of
variance.
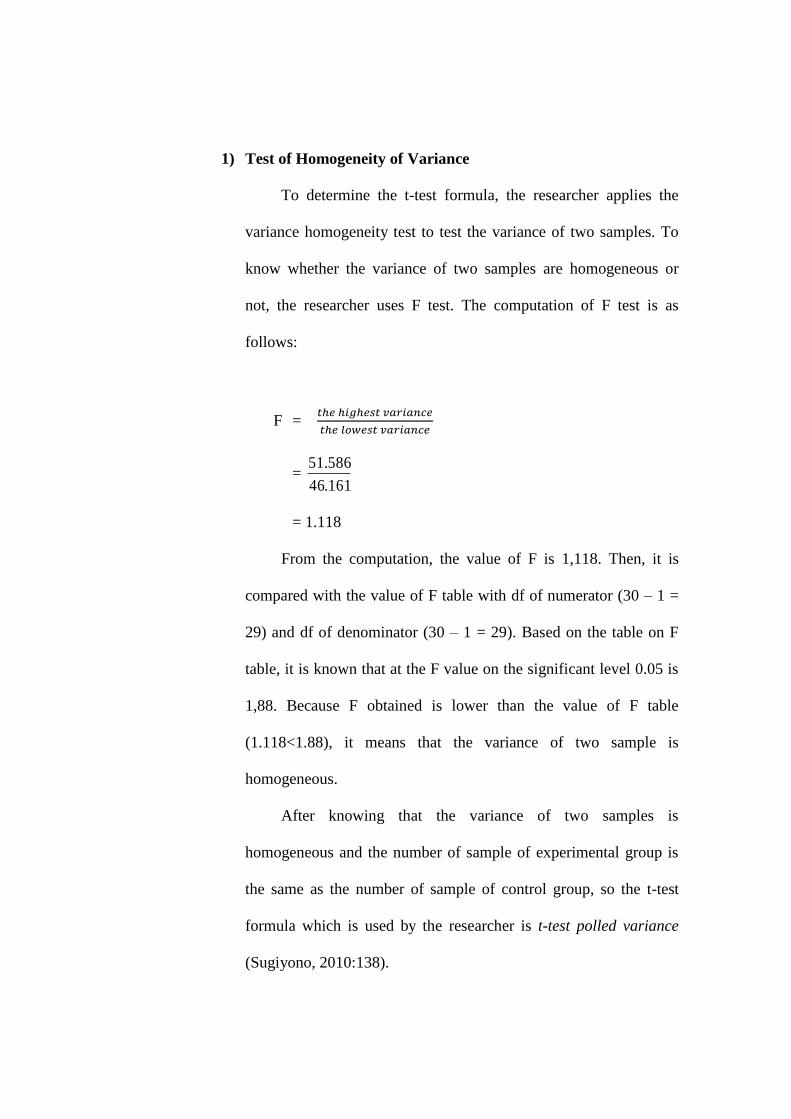
1) Test of Homogeneity of Variance
To determine the t-test formula, the researcher applies the
variance homogeneity test to test the variance of two samples. To
know whether the variance of two samples are homogeneous or
not, the researcher uses F test. The computation of F test is as
follows:
F = 𝑡ℎ𝑒 ℎ𝑖𝑔ℎ𝑒𝑠𝑡 𝑣𝑎𝑟𝑖𝑎𝑛𝑐𝑒
𝑡ℎ𝑒 𝑙𝑜𝑤𝑒𝑠𝑡 𝑣𝑎𝑟𝑖𝑎𝑛𝑐𝑒
= 161.46
51.586
= 1.118
From the computation, the value of F is 1,118. Then, it is
compared with the value of F table with df of numerator (30 – 1 =
29) and df of denominator (30 – 1 = 29). Based on the table on F
table, it is known that at the F value on the significant level 0.05 is
1,88. Because F obtained is lower than the value of F table
(1.118<1.88), it means that the variance of two sample is
homogeneous.
After knowing that the variance of two samples is
homogeneous and the number of sample of experimental group is
the same as the number of sample of control group, so the t-test
formula which is used by the researcher is t-test polled variance
(Sugiyono, 2010:138).
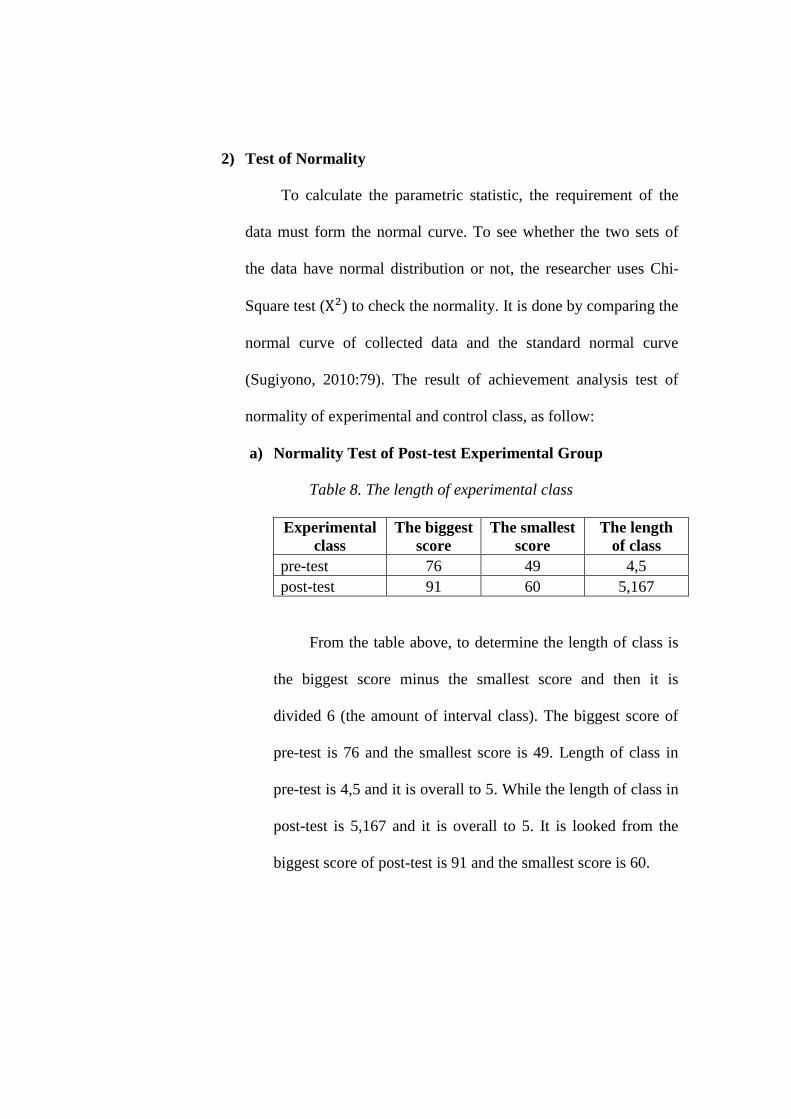
2) Test of Normality
To calculate the parametric statistic, the requirement of the
data must form the normal curve. To see whether the two sets of
the data have normal distribution or not, the researcher uses Chi-
Square test (X2) to check the normality. It is done by comparing the
normal curve of collected data and the standard normal curve
(Sugiyono, 2010:79). The result of achievement analysis test of
normality of experimental and control class, as follow:
a) Normality Test of Post-test Experimental Group
Table 8. The length of experimental class
Experimental
class
The biggest
score
The smallest
score
The length
of class
pre-test 76 49 4,5
post-test 91 60 5,167
From the table above, to determine the length of class is
the biggest score minus the smallest score and then it is
divided 6 (the amount of interval class). The biggest score of
pre-test is 76 and the smallest score is 49. Length of class in
pre-test is 4,5 and it is overall to 5. While the length of class in
post-test is 5,167 and it is overall to 5. It is looked from the
biggest score of post-test is 91 and the smallest score is 60.
Table 9. Frequency distribution of post-test achievement of
experiment class
NO INTERVAL fo fh fo - fh (fo -
fh)²
(fo -
fh)²/fh
1 60 - 65 2 1 1 1 1
2 66 - 71 8 4 4 16 4
3 72 - 77 6 10 -4 16 1,6
4 78 - 83 10 10 0 0 0
5 84 - 89 3 4 -1 1 0,25
6 90 - 95 1 1 0 0 0
∑ 30 30 0 34 6,85
From the computation the value of Chi- Square (X2) is
6,85. Based on the Chi- Square table with the df (degree of
freedom) 6-1 = 5, it is known that the value of Chi- Square
value on the significant level 0.05 is 11.070. Because Chi-
Square obtained of experimental class is lower than the value
of Chi- Square table (6.85<11.070), it can be said that the
distribution of experimental class is normal.
b) Normality Test of Post-test Result of Control Group
Table 10. The length of control class
Control
class
the biggest
score
the smallest
score
the length of
class
pre-test 66 48 3
post-test 85 56 4,833
According to the table above, it shows that the biggest
score of pre-test is 66 and the smallest score is 48. Length of
class in pre-test is 3 and it is overall to 3. While the length of
class in post-test is 4,833 and it is overall to 5. It is looked
from the biggest score of pre-test is 85 and the smallest score is
56.
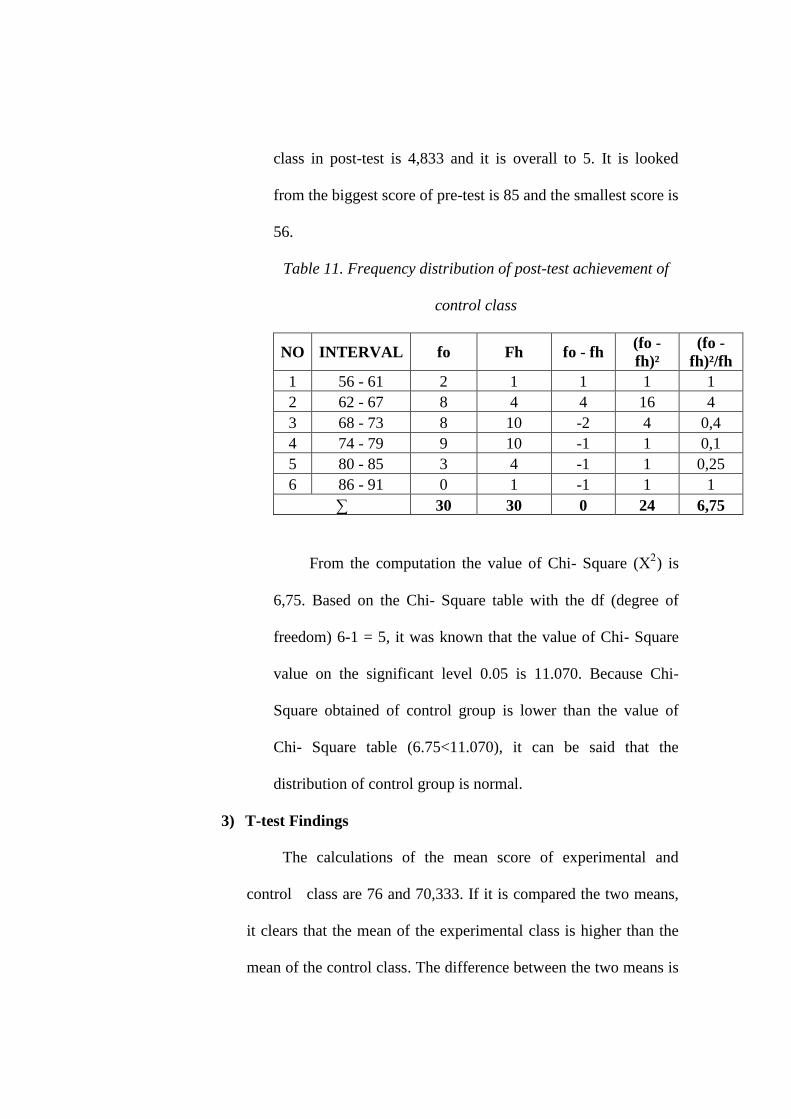
Table 11. Frequency distribution of post-test achievement of
control class
NO INTERVAL fo Fh fo - fh (fo -
fh)²
(fo -
fh)²/fh
1 56 - 61 2 1 1 1 1
2 62 - 67 8 4 4 16 4
3 68 - 73 8 10 -2 4 0,4
4 74 - 79 9 10 -1 1 0,1
5 80 - 85 3 4 -1 1 0,25
6 86 - 91 0 1 -1 1 1
∑ 30 30 0 24 6,75
From the computation the value of Chi- Square (X2) is
6,75. Based on the Chi- Square table with the df (degree of
freedom) 6-1 = 5, it was known that the value of Chi- Square
value on the significant level 0.05 is 11.070. Because Chi-
Square obtained of control group is lower than the value of
Chi- Square table (6.75<11.070), it can be said that the
distribution of control group is normal.
3) T-test Findings
The calculations of the mean score of experimental and
control class are 76 and 70,333. If it is compared the two means,
it clears that the mean of the experimental class is higher than the
mean of the control class. The difference between the two means is
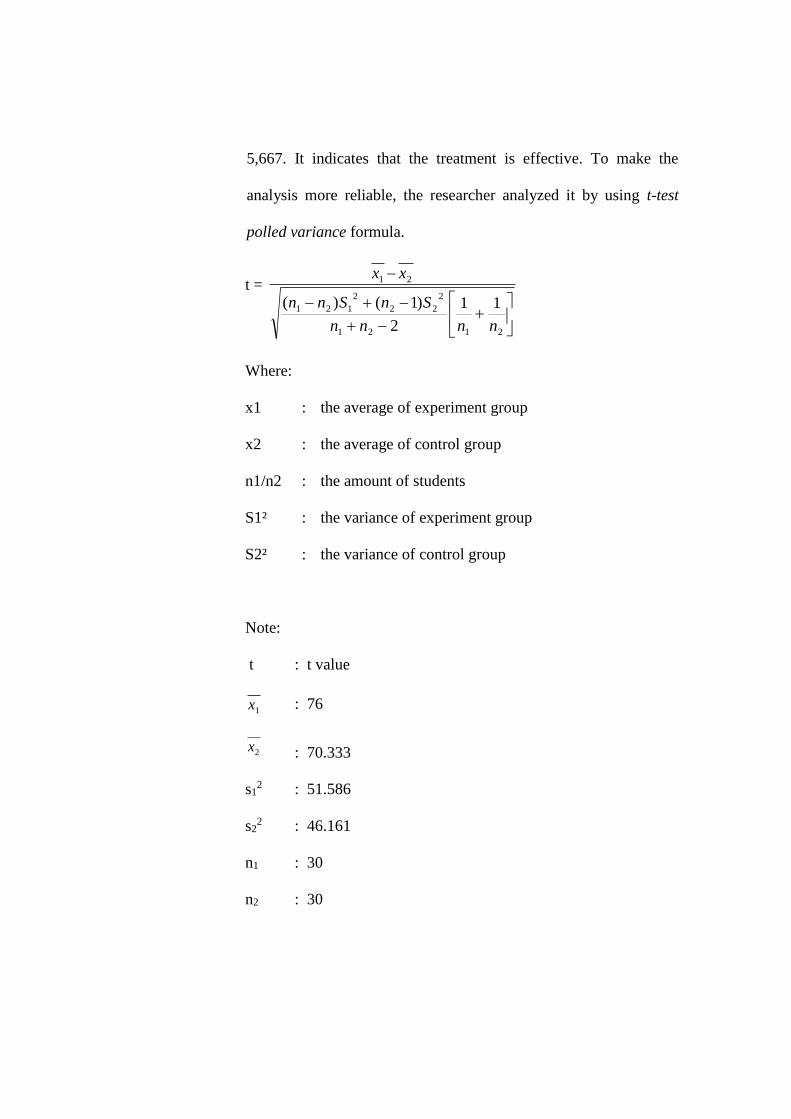
5,667. It indicates that the treatment is effective. To make the
analysis more reliable, the researcher analyzed it by using t-test
polled variance formula.
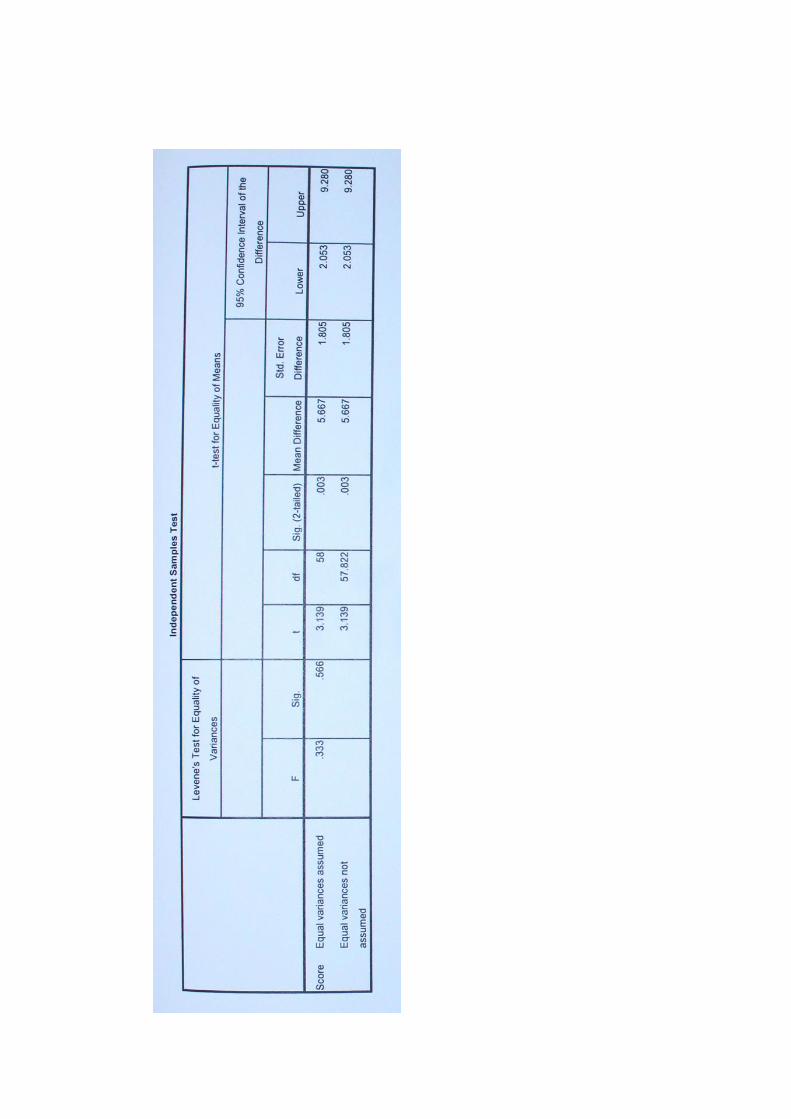
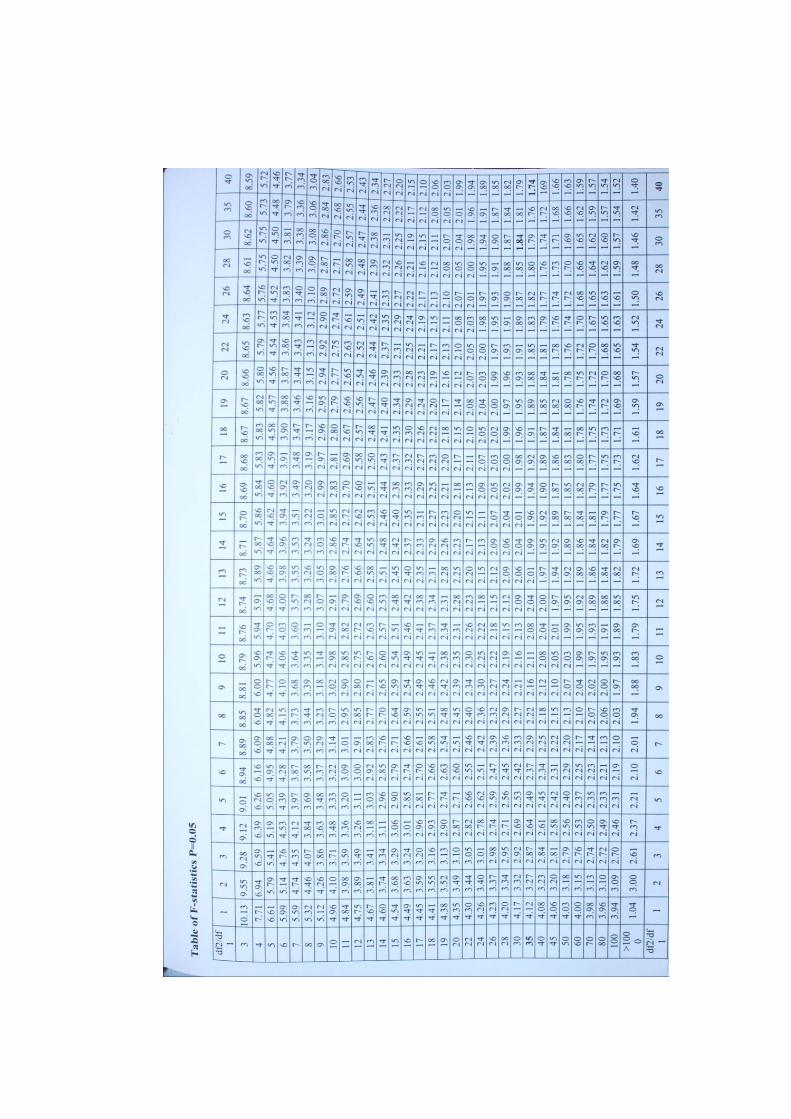
t =
2121
2
22
2
121
21
11
2
)1()(
nnnn
SnSnn
xx
Where:
x1 : the average of experiment group
x2 : the average of control group
n1/n2 : the amount of students
S1² : the variance of experiment group
S2² : the variance of control group
Note:
t : t value
1x : 76
2x : 70.333
s12 : 51.586
s22 : 46.161
n1 : 30
n2 : 30
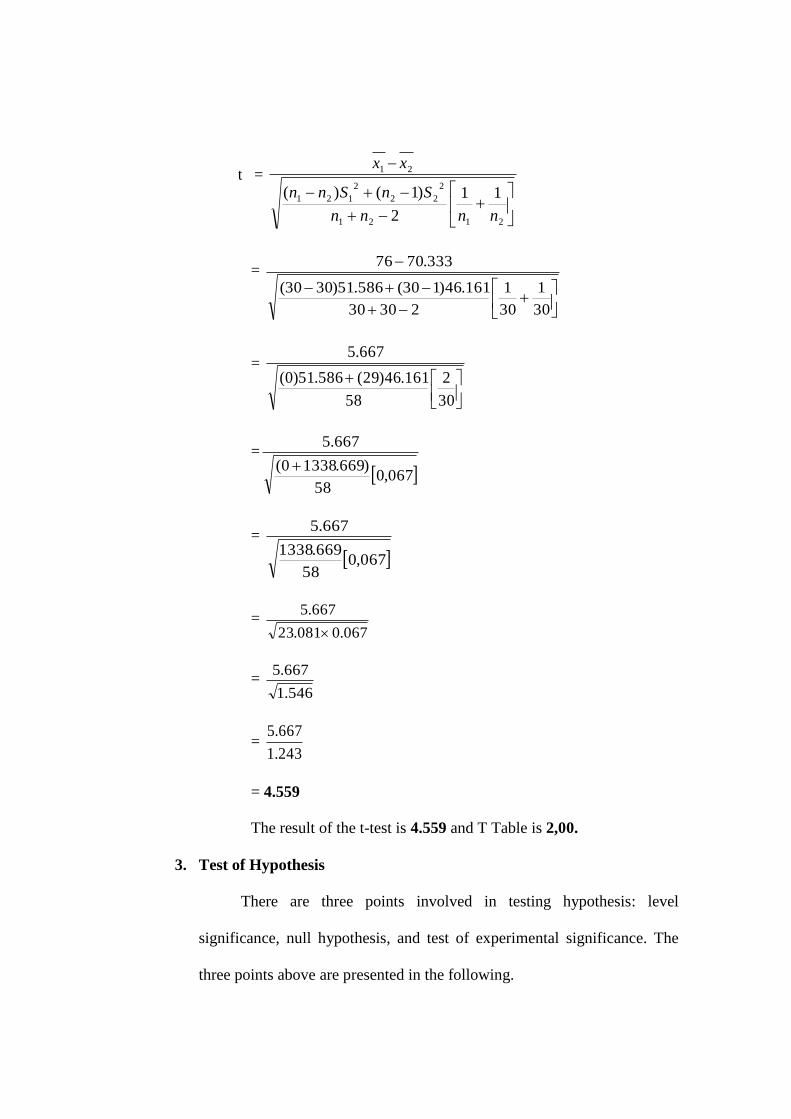
t =
2121
2
22
2
121
21
11
2
)1()(
nnnn
SnSnn
xx
=
30
1
30
1
23030
161.46)130(586.51)3030(
333.7076
=
30
2
58
161.46)29(586.51)0(
667.5
=
067,058
)669.13380(
667.5
=
067,058
669.1338
667.5
= 067.0081.23
667.5
= 546.1
667.5
= 243.1
667.5
= 4.559
The result of the t-test is 4.559 and T Table is 2,00.
3. Test of Hypothesis
There are three points involved in testing hypothesis: level
significance, null hypothesis, and test of experimental significance. The
three points above are presented in the following.

a. Level of Significance
In testing hypothesis, the researcher uses the level of significance
to minimize the false conclusion of the research. This was applied to
reject the hypothesis in order to gain the objective conclusion.
Generally, the level used in any research is the 5% or 1% level. By
using the level of significance of the 5% level, it means that the
falseness of conclusion is 5% and the truth of conclusion is 95%.
b. The Null Hypothesis
In testing hypothesis, the researcher commonly faced with the
null hypothesis. By using the null hypothesis, the hypothesis statement
will be easier to be proved. The hypothesis of this research (Ha) said
that “There is an effectiveness of using guided questions in teaching
writing of analytical exposition text at eleventh grade students of SMA
N 8 Purworejo in academic year 2013/2014”.
To prove whether the hypothesis are rejected or accepted, the
researcher changes the research hypothesis into the null hypothesis.
Therefore, the null hypothesis (Ho) said “There is no effectiveness of
using guided questions in teaching writing of analytical exposition
text at eleventh grade students of SMA N 8 Purworejo in academic
year 2013/2014”.
c. Test of Experimental Significance
After getting the t-value, the researcher consults the critical value
on the t-table to check whether the difference is significant or not.
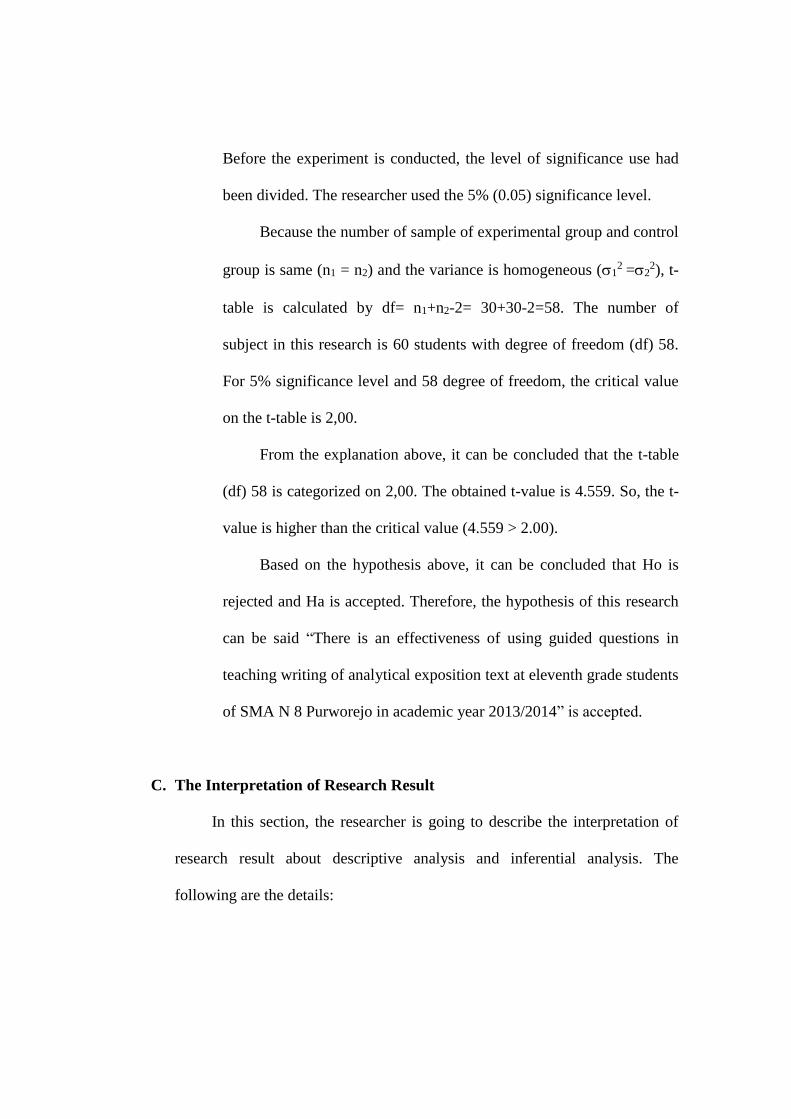
Before the experiment is conducted, the level of significance use had
been divided. The researcher used the 5% (0.05) significance level.
Because the number of sample of experimental group and control
group is same (n1 = n2) and the variance is homogeneous (12 =2
2), t-
table is calculated by df= n1+n2-2= 30+30-2=58. The number of
subject in this research is 60 students with degree of freedom (df) 58.
For 5% significance level and 58 degree of freedom, the critical value
on the t-table is 2,00.
From the explanation above, it can be concluded that the t-table
(df) 58 is categorized on 2,00. The obtained t-value is 4.559. So, the t-
value is higher than the critical value (4.559 > 2.00).
Based on the hypothesis above, it can be concluded that Ho is
rejected and Ha is accepted. Therefore, the hypothesis of this research
can be said “There is an effectiveness of using guided questions in
teaching writing of analytical exposition text at eleventh grade students
of SMA N 8 Purworejo in academic year 2013/2014” is accepted.
C. The Interpretation of Research Result
In this section, the researcher is going to describe the interpretation of
research result about descriptive analysis and inferential analysis. The
following are the details:
a. Descriptive Analysis
After describing the analysis in the previous section, the researcher
would discuss more about the interpretation of the writing analytical
exposition text result of experimental and control class.
1) The Writing Analytical Exposition Text Result of Experimental
Group
The highest score of the students of experimental group of the
eleventh grade students of SMA N 8 Purworejo is 91, and the lowest is
60. The mean of experimental class is 76, the standard deviation is
7.182, and the variance is 51,586. The mean is included in the interval
of 60 to 95. It means that the students of experimental class of the
eleventh grade students of SMA N 8 Purworejo have good result on
their writing ability. From 30 samples, there were 12 students (40%)
belong to excellent category, 16 students (53%) belong to good
category, and 2 students (7%) belong to sufficient category in writing
ability.
2) The Writing Analytical Exposition Text Result of Control Group
The highest score of the students of control group of the eleventh
grade students of SMA N 8 Purworejo is 85, and the lowest one was
56. The mean of control group is 70.333, the standard deviation of it is
6,794, and the variance is 46,161. The mean is included in the interval
56 to 91. It means that the students of control class of eleventh grade
students of SMA N 8 Purworejo have good result on their writing
ability. From 30 samples, there were 2 students (7%) belong to
excellent category, 19 students (63%) belong to good category and 9
students (30%) belong to sufficient category in writing ability.
b. Inferential analysis Interpretation
In this section, the researcher will interpret the hypothesis testing.
As mentioned above, the hypothesis of this research is “There is an
effectiveness of using guided questions in teaching writing of analytical
text at eleventh grade students of SMA N 8 Purworejo in academic year
2013/2014”.
From the previous analysis, it shows that the number of sample (n1
= 30 and n2 = 30) and the level of significance is 5%, the result of the
value of t-test is 4.559. The computation shows that t-value is higher than
t-table that is 4.559 > 2.00.
So, the hypothesis is accepted. It means that there is an
effectiveness of using guided questions in teaching writing analytical
exposition text at eleventh grade students of SMA N 8 Purworejo in
academic year 2013/2014. The value of t-test is 4.559.
The researcher has interposed the theories related to this research
entitled “The effectiveness of using guided questions in teaching writing
of analytical exposition text at eleventh grade students of SMA N 8
Purworejo in academic year 2013/2014”.
After computing t-test separated variance, and after knowing that
the hypothesis is accepted, the theory meets the fact in this case. Then,

from the computation in the previous section; the researcher concludes that
there is an effectiveness of using guided questions in teaching writing
analytical exposition text at eleventh grade students of SMA N 8
Purworejo in academic year 2013/2014.
CHAPTER V
CONCLUSION AND SUGGESTION
In this chapter, the researcher concludes this research and gives some
suggestions for related to this research for the students, the teachers and the
researcher.
A. Conclusion
After doing this research, the researcher can draw some conslucions
and suggestions. In teaching learning process, an appropriate technique is
useful to teach the students in class. Mainly, writing skill is one of important
skill to build English well. Using guided questions in teaching writing
becomes a good solution. It will help the students in writing analytical
exposition text.
From the finding, it is found that the average score of the students
who are taught writing analytical exposition text by using guided questions as
experimental group is 76. It is good categorized. It is different result when
they faced the pre-test. The average of pre-test is 56. While the average score
of the students who are taught writing analytical text without using guided
questions as control group are 70. It is clear that there is different result
between experimental group and control group. The experimental group gets
higher score than control group.
The t-test level significant 0.05 shows that t-test value is 3.133 and t-
table value is 2.00. T-test is higher than t-table (4.559 > 2.000). So, the
59
hypothesis is accepted. It means that using guided questions in teaching
writing of analytical exposition text at eleventh grade students of SMA N 8
Purworejo in academic year 2013/2014 is effective.
B. Suggestion
It is very helpful for the students to give a new method or technique
to increase their writing ability. Moreover, analytical exposition text is one of
text genres which is difficult to understand and make. From the conclusion
above, the researcher offers some suggestions, as follow:
1. For the teachers:
a. The teachers should be more creative in teaching writing especially.
Using guided questions is one of techniques in teaching to make the
students more interesting. It will have new color in teaching learning
process.
b. The teachers expected trying interesting technique. Guided questions
can be used in teaching writing analytical exposition text. It will help
the students easier to make that text.
c. The teachers give suitable teaching learning in writing analytical
exposition text to make the students more interesting with the material.
2. For the students
a. The students are more active in learning process to improve their
writing ability.
b. The students can improve their writing ability through guided
questions with their own idea.
c. The students are more creative and active in teaching learning process.
3. For the researcher.
This research is far for being perfect, it is hoped that other researchers will
complete the less of this thesis in order to be better. The researcher hopes
some correction and criticism from the other researchers to improve this
writing.
BIBLIOGRAPHY
Arikunto, Suharsimi. 2010. Procedure Penelitian: Suatu Pendekatan Praktik.
Jakarta: Bina Aksara.
Brown, H. Douglas. 2000. Teaching by Principles an Interactive Approach to
Language Pedagogy Second Edition. San Francisco: Longman.
_________________. 2003. Language Assessment Principles and Classroom
Practices. San Francisco: Longman.
_________________. 2007. Principles of Language Learning and Teaching Fifth
Edition. New York: Pearson Education.
Browne, Ann. 2007. Teaching and Learning Communication, Language and
Literacy. London: Paul Chapman Publishing.
Carrol, Joyce Amstrong and Wilson, Edward E. 1993. Acts of Teaching How to
Teach Writing. Englewood: Teacher Idea Press.
Crawford, Alan. Saul, E. Wendi. Mathews, Samuel. and Makinster, James. 2005.
Teaching and Learning Strategies for The Thinking Classroom. New
York: The International Debate Education Association.
Fry, Heather. Ketteridge, S. and Marshall, S. 2003. A Handbook for Teaching and
Learning in Higher Education Second Edition. London: Kogan Page.
Hartono, Rudi. 2005. Genre of Text. Semarang: unpublished.
Hornby, AS. 2000. Oxford Advanced Learner’s Dictionary. Oxford: Oxford
University Press.
Iwan. 2009. Developing The Students’ Ability in Writing Recount Text Through
Guiding Questions Technique at The Second Year Students of SMPN 1
Terbanggi Besar Lampung Tengah. Lampung: unpublished.
Kothari, C.R. 2004. Research Methodology Methods and Techniques (Second
Revised Edition). New Delhi: New Age International Ltd.
Mayberry, Sally C. and Hartle, Lynn. 2003. The Successful Teacher’s Guide to
Frequently Asked Questions. Lanham: The Scarecrow Press.
Nawawi, Muhammad Bagus. 2011. Improving Students’ Writing Skill of
Descriptive Text Through Guided Questions (A Classroom Action
Research at VIII-8 Class of SMP PGRI 1 Ciputat Kota Tangerang
Selatan). Jakarta: unpublished.
Patel, M.F. and Jain, Praveen M. 2008. English Language Teaching (Methods,
Tools and Techniques). Jaipur: Sunrise.
Pritchard, Alan. 2009. Ways of Learning (Learning Theories and Learning Styles
in the Classroom) Second Edition. Oxon: Routledge.
Strachan, Dorothy. 2007. Making Questions Work A Guide to What and How to
Ask for Facilitators, Consultants, Managers, Coaches, and Educators.
San Francisco: Jossey-Bass
Sugiyono. 2009. Metode Penelitian Pendidikan Pendekatan Kuantitatif,
Kualitatif, dan R&D. Bandung: Alfa Beta.
________. 2010. Statistika Untuk Penelitian. Bandung: Alfa Beta.
________. 2011. Metode Penelitian Kuantitatf, Kualitatif, dan R & D. Bandung:
Alfa Beta.
Traver, R. 1998. taken from
http://academic.evergreen.edu/w/waltonsl/Gquestions.html. on 2nd
March at 7.25 p.m.

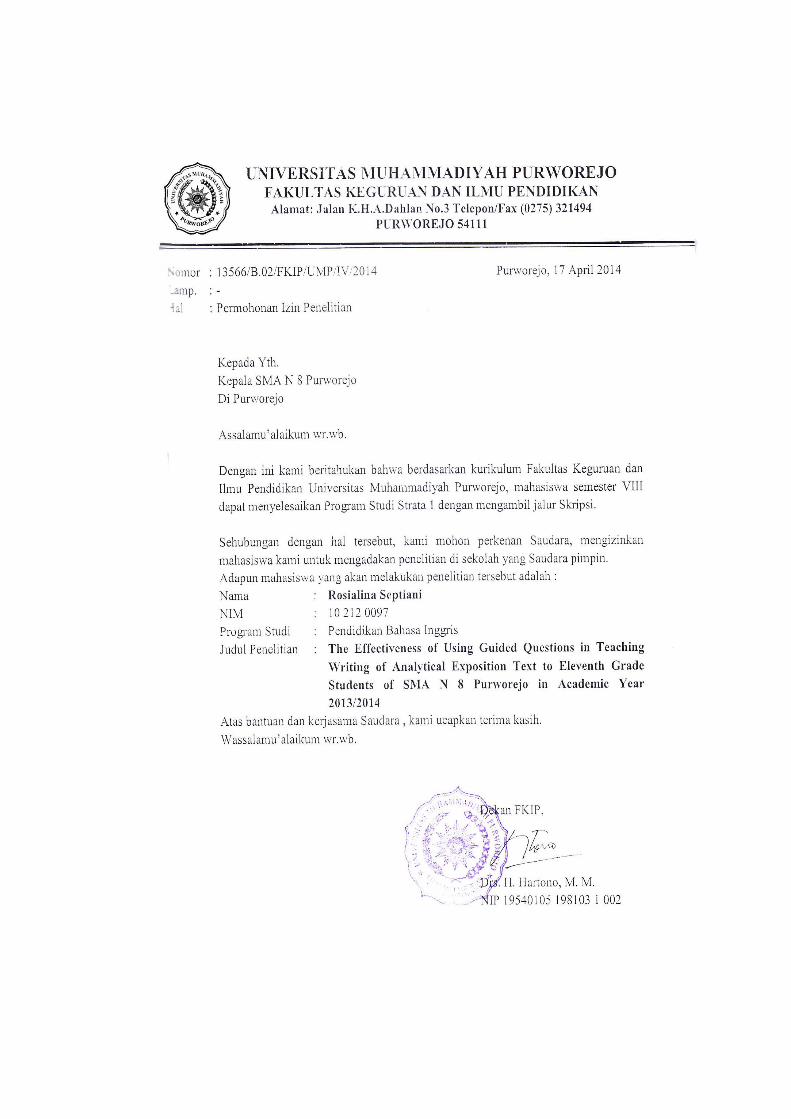
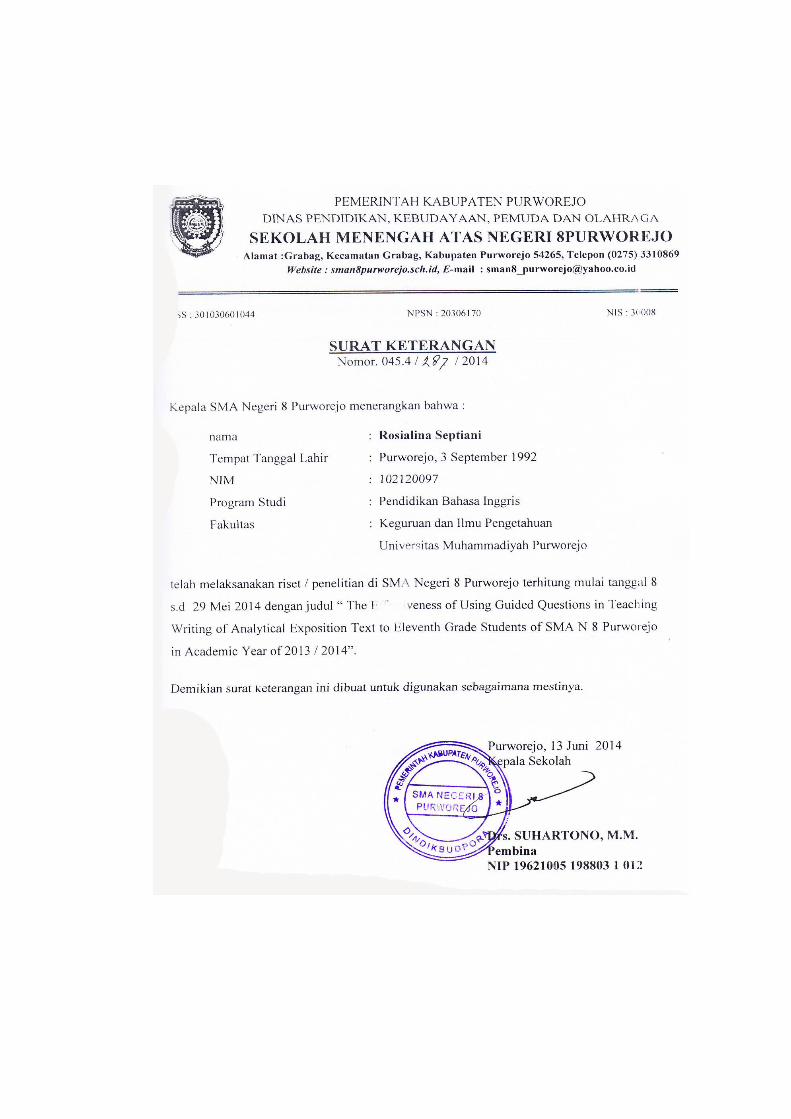
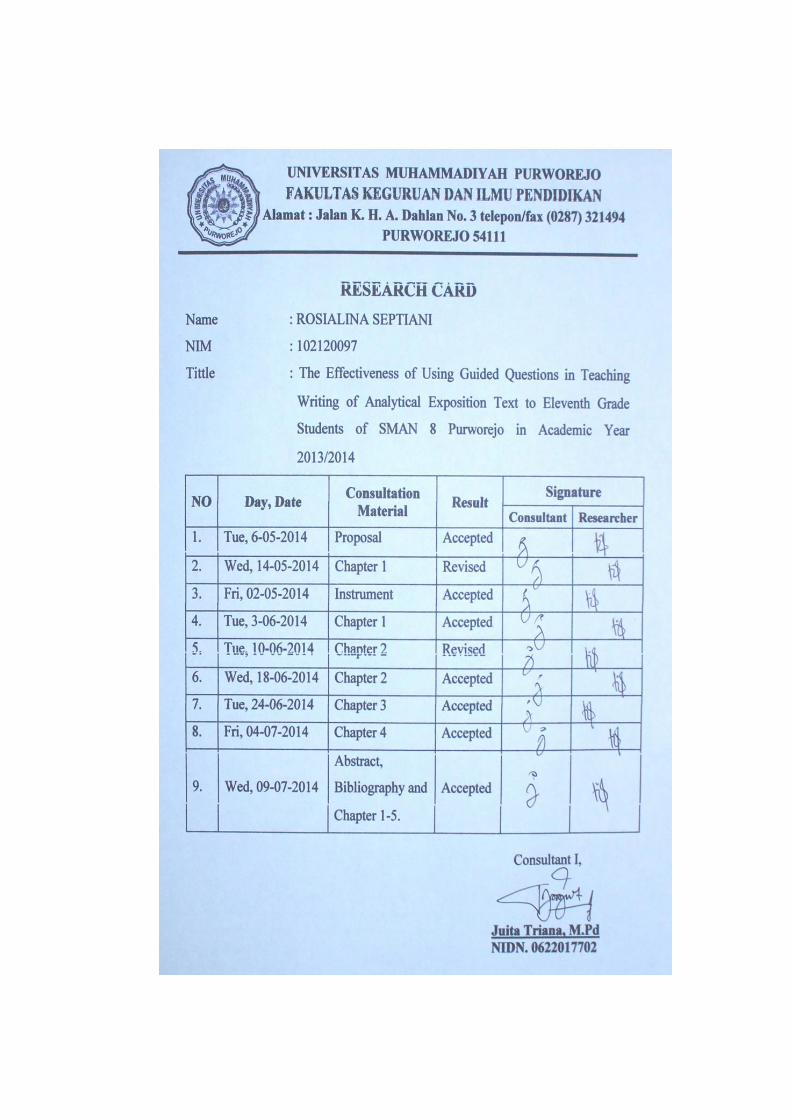
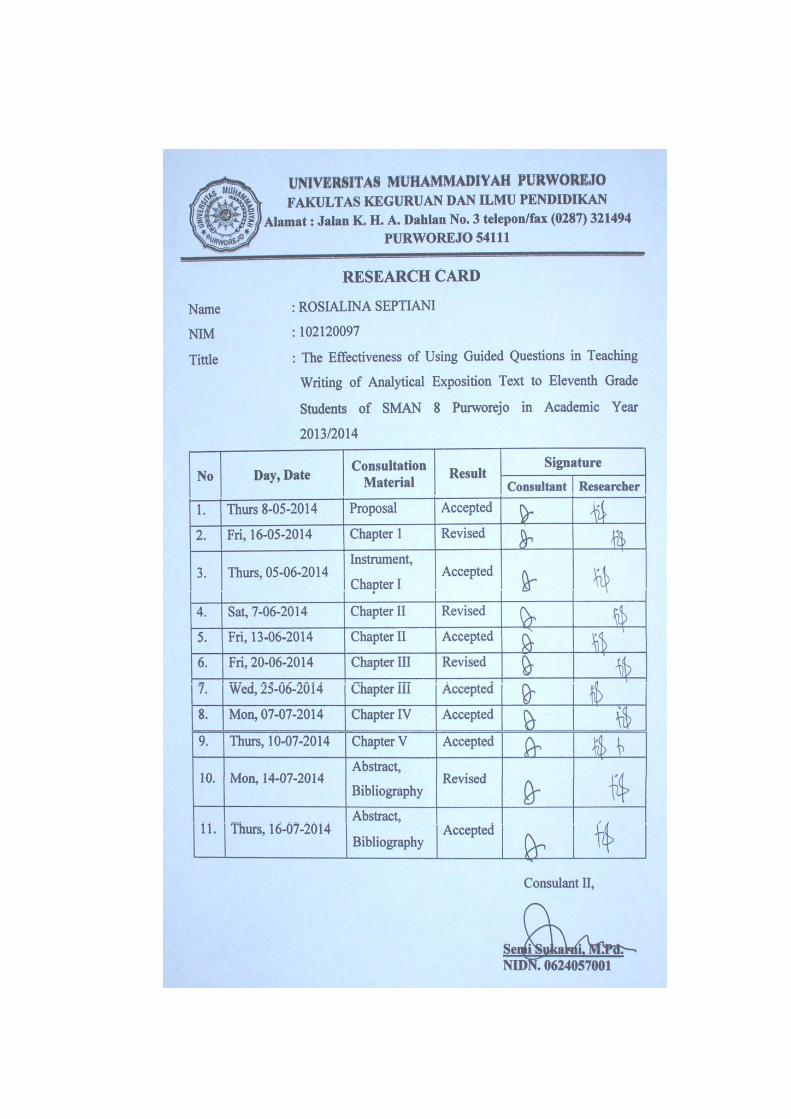

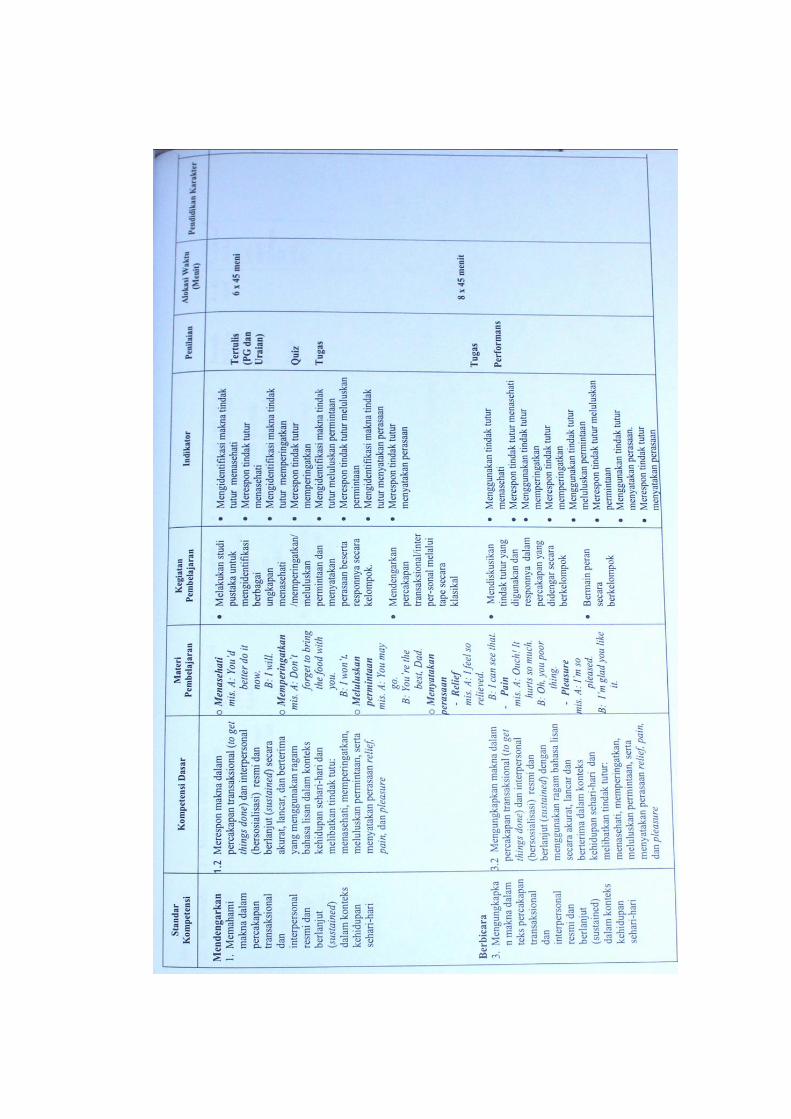
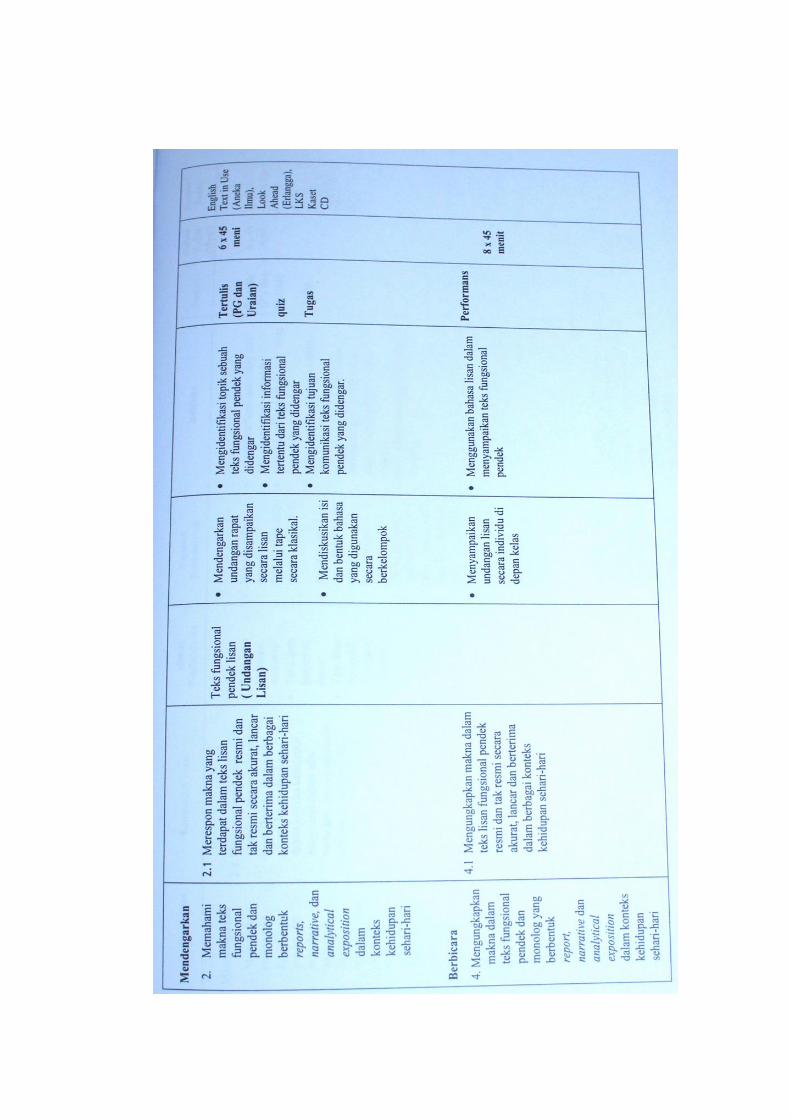
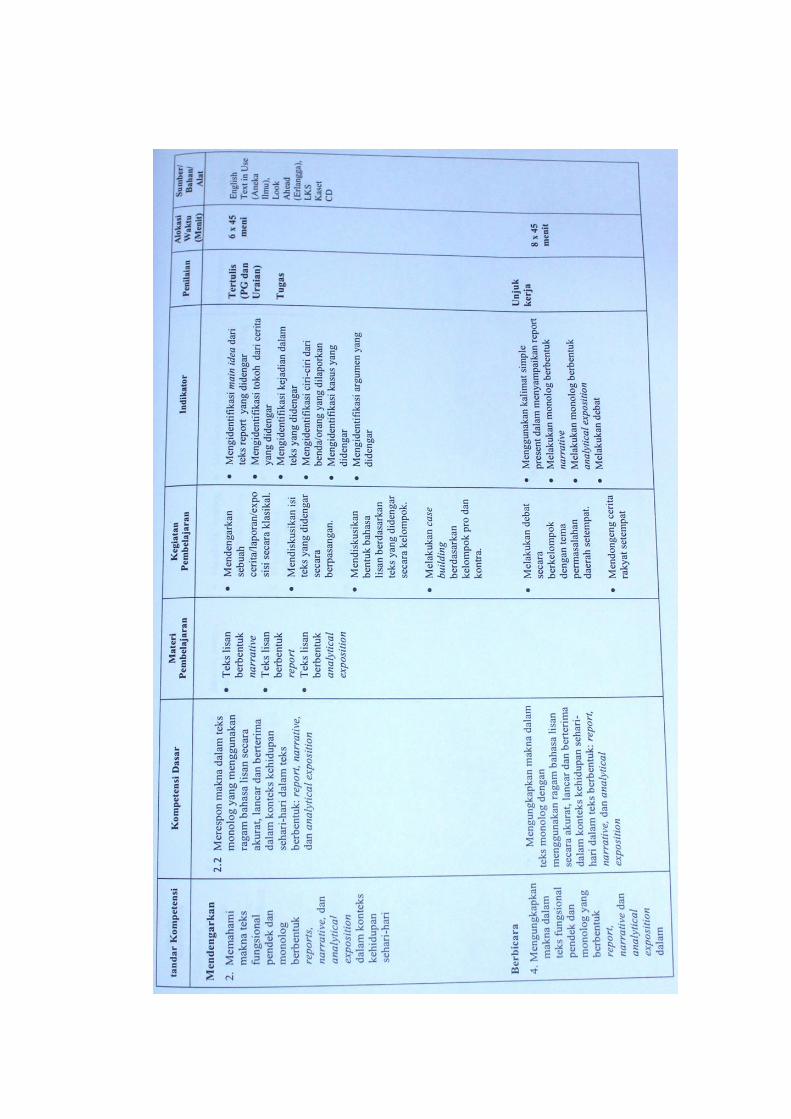
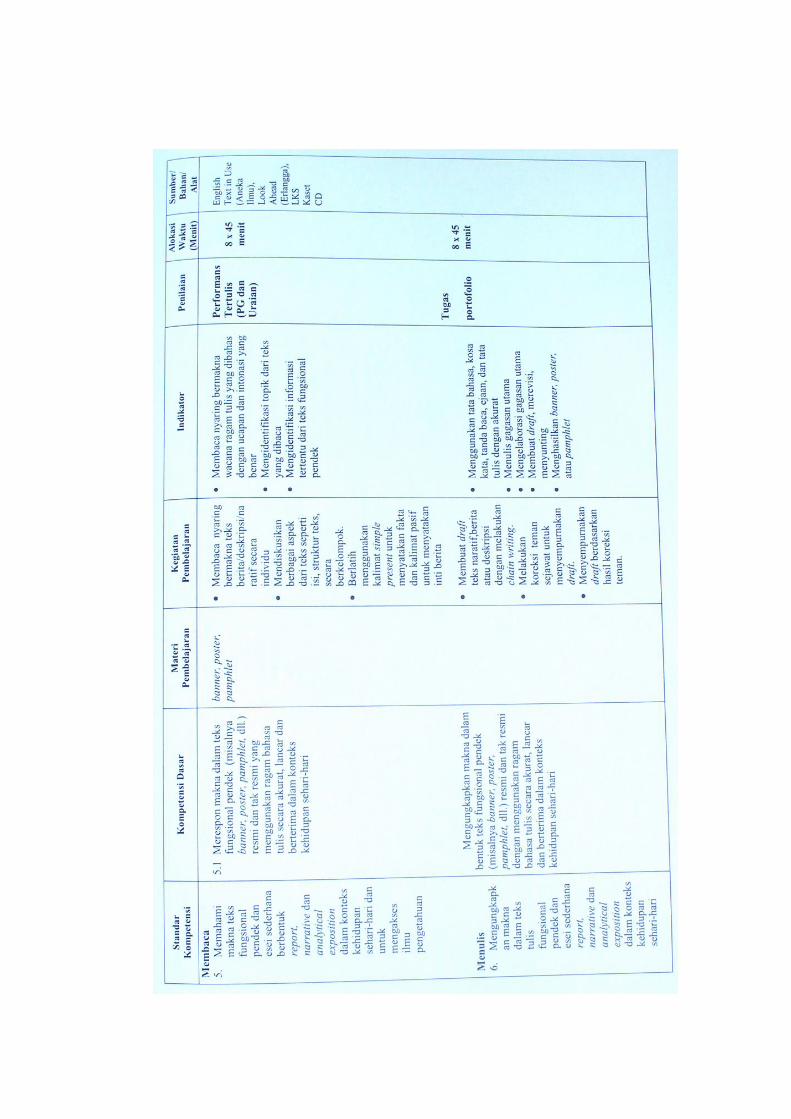
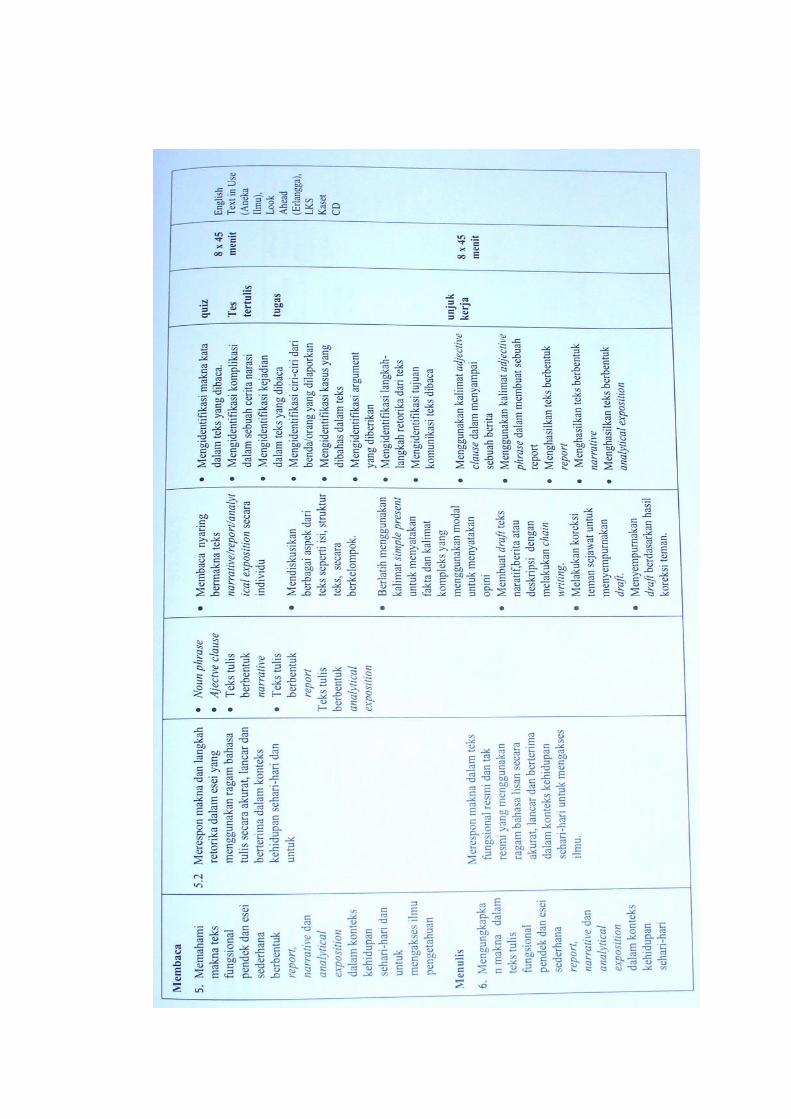
RENCANA PELAKSANAAN PEMBELAJARAN (RPP)
EXPERIMENT CLASS
Nama Sekolah : SMA NEGERI 8 PURWOREJO
Mata Pelajaran : Bahasa Inggris
Kelas/Semester : XI / I
Alokasi Waktu : 2x 45 menit ( 1x pertemuan )
Topik Pembelajaran : Analytical Exposition
Aspek/Skill : Menulis
A. Standar Kompetensi
Menulis
6. Mengungkapkan makna dalam teks tulis fungsional pendek dan esei
sederhana report, narrative dan analytical exposition dalam konteks
kehidupan sehari-hari.
B. Kompetensi Dasar
1. Merespon makna dalam teks fungsional resmi dan tak resmi yang
menggunakan ragam bahasa lisan secara akurat, lancar dan berterima
dalam konteks kehidupan sehari-hari untuk mengakses ilmu.
C. Indikator Pencapaian Kompetensi
Indikator Pencapaian
Kompetensi Nilai Kebangsaan
Menggunakan kalimat simple
present tense dalam
menyampaikan sebuah
peristiwa.
Menghasilkan teks berbentuk
analytical exposition.
Religious
Jujur
Toleransi
Demokratis
Rasa ingin tahu
Semangat kebangsaan
Menghargai prestasi
Bersahabat/Komunikatif
Cinta damai
Peduli lingkungan
Peduli sosial
Tanggung jawab
D. Tujuan Pembelajaran
Pada akhir pembelajaran siswa dapat :
Menggunakan kosa kata, tata bahasa dengan ejaan yang baik dalam
pembuatan teks analytical exposition
Membuat draf dan menyunting teks analytical exposition
Membuat teks analytical exposition dengan teknik guided questions
E. Materi Pokok
Analytical exposition is a text which has a purpose to persuade the reader or
listener that something in the case. Generic structures of analytical
exposition:
1. Thesis
Contain of thesis is introduction to the main idea of an effect or an event
that will be raised or discussed.
2. Arguments
It contains the opinions of the writer that support to the main idea.
3. Reiteration
It deals with a summary, paraphrase or conclusion of the thesis.
Language structure of analytical exposition:
Using simple present tense
S + Verb 1
Using emotive words (e.g.: alarmed, worried)
Using temporal connectives (e.g.: firstly, secondly, thirdly, etc.)
Using words that qualify statements (e.g.: casual, probably)
The example of analytical expostition:
Being Fat Matters
Thesis Do you know if you are too fat, you may have serious
problems with your health? A group of doctors wrote a
report about some of the effects of too much fat.
Arguments One important effect is on the heart. If you are fat, your
heart has to work harder. This may lead to a heart attack; or
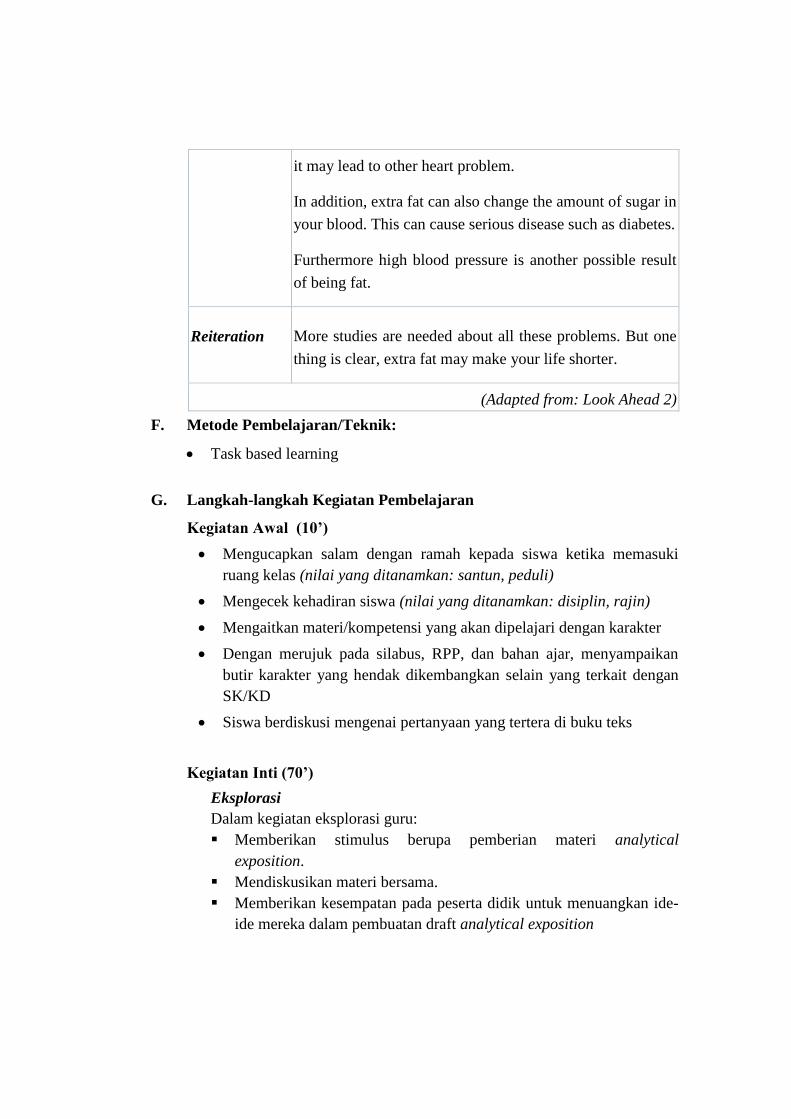
it may lead to other heart problem.
In addition, extra fat can also change the amount of sugar in
your blood. This can cause serious disease such as diabetes.
Furthermore high blood pressure is another possible result
of being fat.
Reiteration More studies are needed about all these problems. But one
thing is clear, extra fat may make your life shorter.
(Adapted from: Look Ahead 2)
F. Metode Pembelajaran/Teknik:
Task based learning
G. Langkah-langkah Kegiatan Pembelajaran
Kegiatan Awal (10’)
Mengucapkan salam dengan ramah kepada siswa ketika memasuki
ruang kelas (nilai yang ditanamkan: santun, peduli)
Mengecek kehadiran siswa (nilai yang ditanamkan: disiplin, rajin)
Mengaitkan materi/kompetensi yang akan dipelajari dengan karakter
Dengan merujuk pada silabus, RPP, dan bahan ajar, menyampaikan
butir karakter yang hendak dikembangkan selain yang terkait dengan
SK/KD
Siswa berdiskusi mengenai pertanyaan yang tertera di buku teks
Kegiatan Inti (70’)
Eksplorasi
Dalam kegiatan eksplorasi guru:
Memberikan stimulus berupa pemberian materi analytical
exposition.
Mendiskusikan materi bersama.
Memberikan kesempatan pada peserta didik untuk menuangkan ide-
ide mereka dalam pembuatan draft analytical exposition
Elaborasi
Dalam kegiatan elaborasi guru:
Siswa memahami tujuan teks analytical exposition.
Siswa memahami tujuan teknik guided questions.
Guru memberikan contoh pembuatan teks analytical exposition
menggunakan teknik guided questions.
Siswa berlatih membuat teks analytical exposition.
Konfirmasi
Dalam kegiatan konfirmasi guru:
Memberikan kesempatan bagi siswa untuk mempresentasikan hasil
pekerjaan mereka.
Memberi konfirmasi pada hasil pekerjaan yang sudah dikerjakan
oleh siswa.
Memfasilitasi siswa melakukan refleksi untuk memperoleh
pengalaman belajar yang sudah dilakukan.
Memberikan motivasi kepada siswa yang kurang dan belum bisa
mengikuti dalam materi mengenai analytical exposition.
Kegiatan Akhir (10’)
Siswa diminta membuat rangkuman dari materi analytical
exposition.
Siswa dan Guru melakukan refleksi terhadap kegiatan yang sudah
dilaksanakan.
Menyampaikan rencana pembelajaran pada pertemuan berikutnya.
H. Sumber/Bahan/Alat
1. Look Ahead 2
2. Internet
I. Penilaian
Indikator, Teknik, Bentuk, dan Contoh.
No. Indikator Teknik Bentuk Contoh
1. Menghasilkan
teks berbentuk
analytical
exposition.
Tes Tulis Essay
berstruktur
Write your own
words about
“The Weakness
of the Selection
RENCANA PELAKSANAAN PEMBELAJARAN (RPP)
CONTROL CLASS
Nama Sekolah : SMA NEGERI 8 PURWOREJO
Mata Pelajaran : Bahasa Inggris
Kelas/Semester : XI / I
Alokasi Waktu : 2x 45 menit ( 1x pertemuan )
Topik Pembelajaran : Analytical Exposition
Aspek/Skill : Menulis
A. Standar Kompetensi
Menulis
6. Mengungkapkan makna dalam teks tulis fungsional pendek dan esei
sederhana report, narrative dan analytical exposition dalam konteks
kehidupan sehari-hari.
B. Kompetensi Dasar
1. Merespon makna dalam teks fungsional resmi dan tak resmi yang
menggunakan ragam bahasa lisan secara akurat, lancar dan berterima
dalam konteks kehidupan sehari-hari untuk mengakses ilmu.
C. Indikator Pencapaian Kompetensi
Indikator Pencapaian
Kompetensi Nilai Kebangsaan
Menggunakan kalimat simple
present tense dalam
menyampaikan sebuah
peristiwa.
Menghasilkan teks berbentuk
analytical exposition.
Religious
Jujur
Toleransi
Demokratis
Rasa ingin tahu
Semangat kebangsaan
Menghargai prestasi
Bersahabat/Komunikatif
Cinta damai
Peduli lingkungan
Peduli sosial
Tanggung jawab
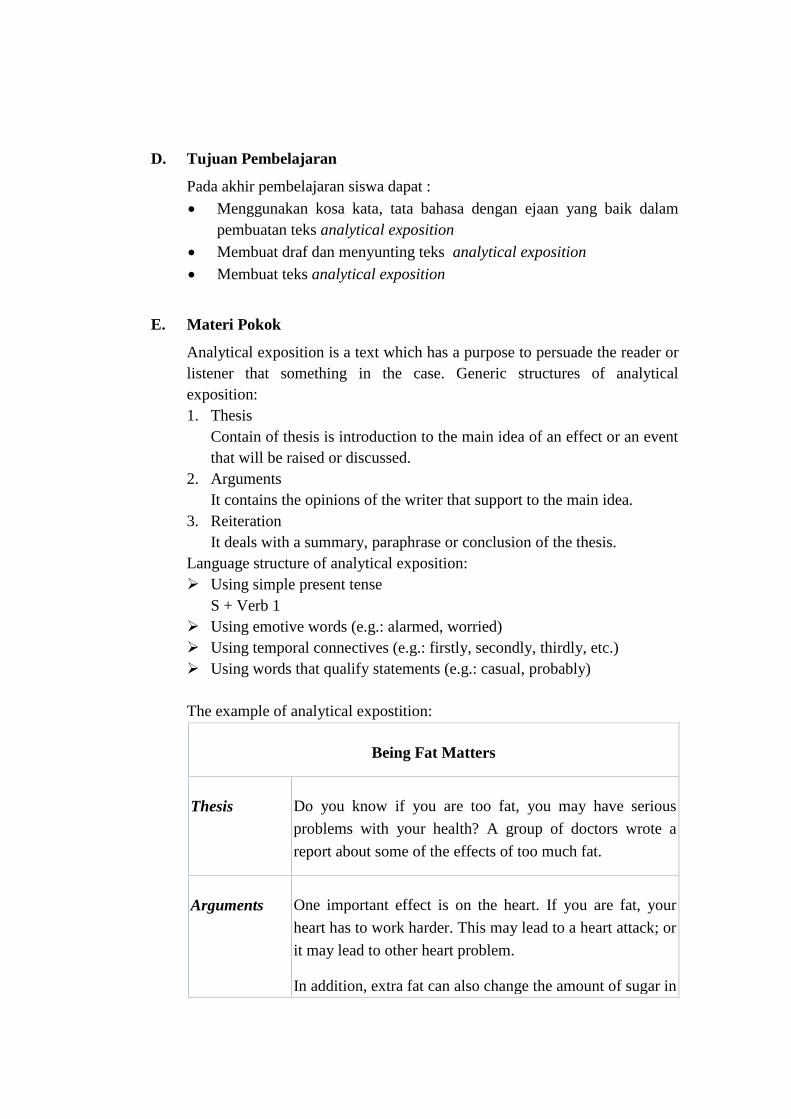
D. Tujuan Pembelajaran
Pada akhir pembelajaran siswa dapat :
Menggunakan kosa kata, tata bahasa dengan ejaan yang baik dalam
pembuatan teks analytical exposition
Membuat draf dan menyunting teks analytical exposition
Membuat teks analytical exposition
E. Materi Pokok
Analytical exposition is a text which has a purpose to persuade the reader or
listener that something in the case. Generic structures of analytical
exposition:
1. Thesis
Contain of thesis is introduction to the main idea of an effect or an event
that will be raised or discussed.
2. Arguments
It contains the opinions of the writer that support to the main idea.
3. Reiteration
It deals with a summary, paraphrase or conclusion of the thesis.
Language structure of analytical exposition:
Using simple present tense
S + Verb 1
Using emotive words (e.g.: alarmed, worried)
Using temporal connectives (e.g.: firstly, secondly, thirdly, etc.)
Using words that qualify statements (e.g.: casual, probably)
The example of analytical expostition:
Being Fat Matters
Thesis Do you know if you are too fat, you may have serious
problems with your health? A group of doctors wrote a
report about some of the effects of too much fat.
Arguments One important effect is on the heart. If you are fat, your
heart has to work harder. This may lead to a heart attack; or
it may lead to other heart problem.
In addition, extra fat can also change the amount of sugar in
your blood. This can cause serious disease such as diabetes.
Furthermore high blood pressure is another possible result
of being fat.
Reiteration More studies are needed about all these problems. But one
thing is clear, extra fat may make your life shorter.
(Adapted from: Look Ahead 2)
F. Metode Pembelajaran/Teknik:
Task based learning
G. Langkah-langkah Kegiatan Pembelajaran
Kegiatan Awal (10’)
Mengucapkan salam dengan ramah kepada siswa ketika memasuki
ruang kelas (nilai yang ditanamkan: santun, peduli)
Mengecek kehadiran siswa (nilai yang ditanamkan: disiplin, rajin)
Mengaitkan materi/kompetensi yang akan dipelajari dengan karakter
Dengan merujuk pada silabus, RPP, dan bahan ajar, menyampaikan
butir karakter yang hendak dikembangkan selain yang terkait dengan
SK/KD
Siswa berdiskusi mengenai pertanyaan yang tertera di buku teks
Kegiatan Inti (70’)
Eksplorasi
Dalam kegiatan eksplorasi guru:
Memberikan stimulus berupa pemberian materi analytical
exposition.
Mendiskusikan materi bersama.
Memberikan kesempatan pada peserta didik untuk menuangkan ide-
ide mereka dalam pembuatan draft analytical exposition
Elaborasi
Dalam kegiatan elaborasi guru:
Siswa memahami tujuan teks analytical exposition.
Guru memberikan contoh pembuatan teks analytical exposition
Siswa berlatih membuat teks analytical exposition.

Konfirmasi
Dalam kegiatan konfirmasi guru:
Memberikan kesempatan bagi siswa untuk mempresentasikan hasil
pekerjaan mereka.
Memberi konfirmasi pada hasil pekerjaan yang sudah dikerjakan
oleh siswa.
Memfasilitasi siswa melakukan refleksi untuk memperoleh
pengalaman belajar yang sudah dilakukan.
Memberikan motivasi kepada siswa yang kurang dan belum bisa
mengikuti dalam materi mengenai analytical exposition.
Kegiatan Akhir (10’)
Siswa diminta membuat rangkuman dari materi analytical
exposition.
Siswa dan Guru melakukan refleksi terhadap kegiatan yang sudah
dilaksanakan.
Menyampaikan rencana pembelajaran pada pertemuan berikutnya.
H. Sumber/Bahan/Alat
1. Look Ahead 2
2. Internet
I. Penilaian
I. Indikator, Teknik, Bentuk, dan Contoh.
No. Indikator Teknik Bentuk Contoh
1. Menghasilkan teks
berbentuk analytical
exposition.
Tes Tulis Essay
berstruktur
Write your
own words
about “The
Weakness of
the Selection
Indonesian
TV
Program”!
II. Instrumen Penilaian
Write your opinions as attractive as possible about “The Weakness of
the Selection Indonesian TV Program”.
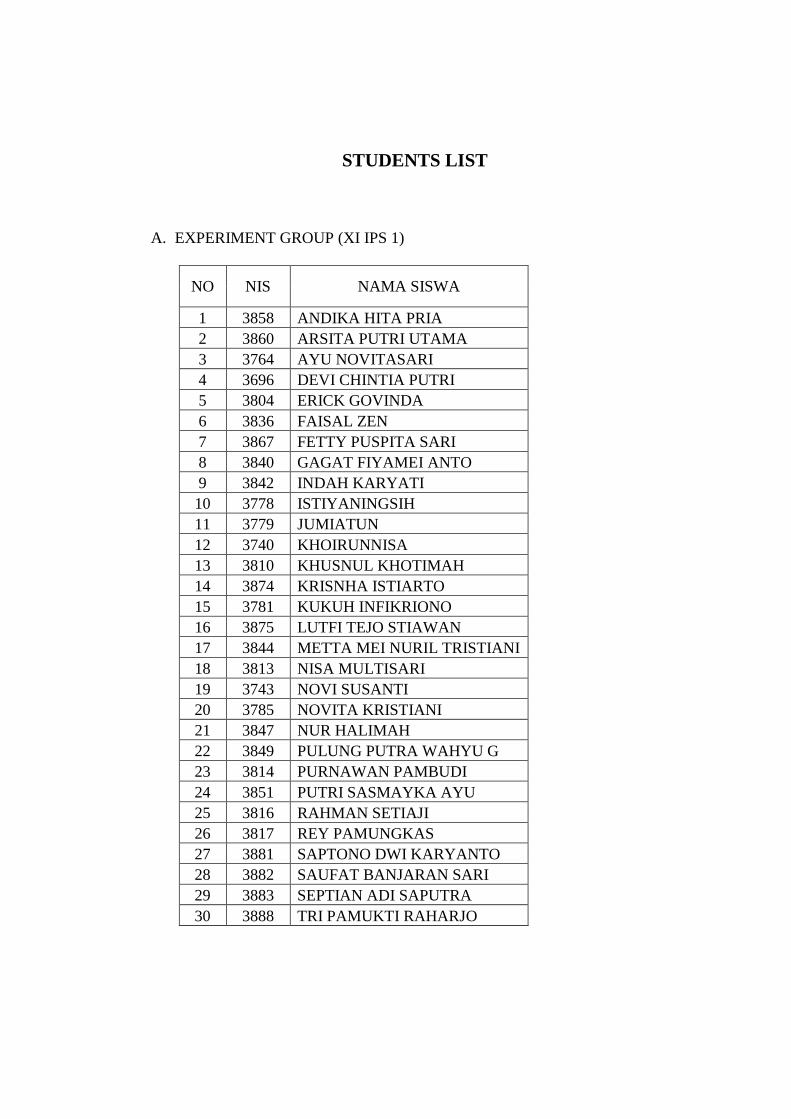
STUDENTS LIST
A. EXPERIMENT GROUP (XI IPS 1)
NO NIS NAMA SISWA
1 3858 ANDIKA HITA PRIA
2 3860 ARSITA PUTRI UTAMA
3 3764 AYU NOVITASARI
4 3696 DEVI CHINTIA PUTRI
5 3804 ERICK GOVINDA
6 3836 FAISAL ZEN
7 3867 FETTY PUSPITA SARI
8 3840 GAGAT FIYAMEI ANTO
9 3842 INDAH KARYATI
10 3778 ISTIYANINGSIH
11 3779 JUMIATUN
12 3740 KHOIRUNNISA
13 3810 KHUSNUL KHOTIMAH
14 3874 KRISNHA ISTIARTO
15 3781 KUKUH INFIKRIONO
16 3875 LUTFI TEJO STIAWAN
17 3844 METTA MEI NURIL TRISTIANI
18 3813 NISA MULTISARI
19 3743 NOVI SUSANTI
20 3785 NOVITA KRISTIANI
21 3847 NUR HALIMAH
22 3849 PULUNG PUTRA WAHYU G
23 3814 PURNAWAN PAMBUDI
24 3851 PUTRI SASMAYKA AYU
25 3816 RAHMAN SETIAJI
26 3817 REY PAMUNGKAS
27 3881 SAPTONO DWI KARYANTO
28 3882 SAUFAT BANJARAN SARI
29 3883 SEPTIAN ADI SAPUTRA
30 3888 TRI PAMUKTI RAHARJO
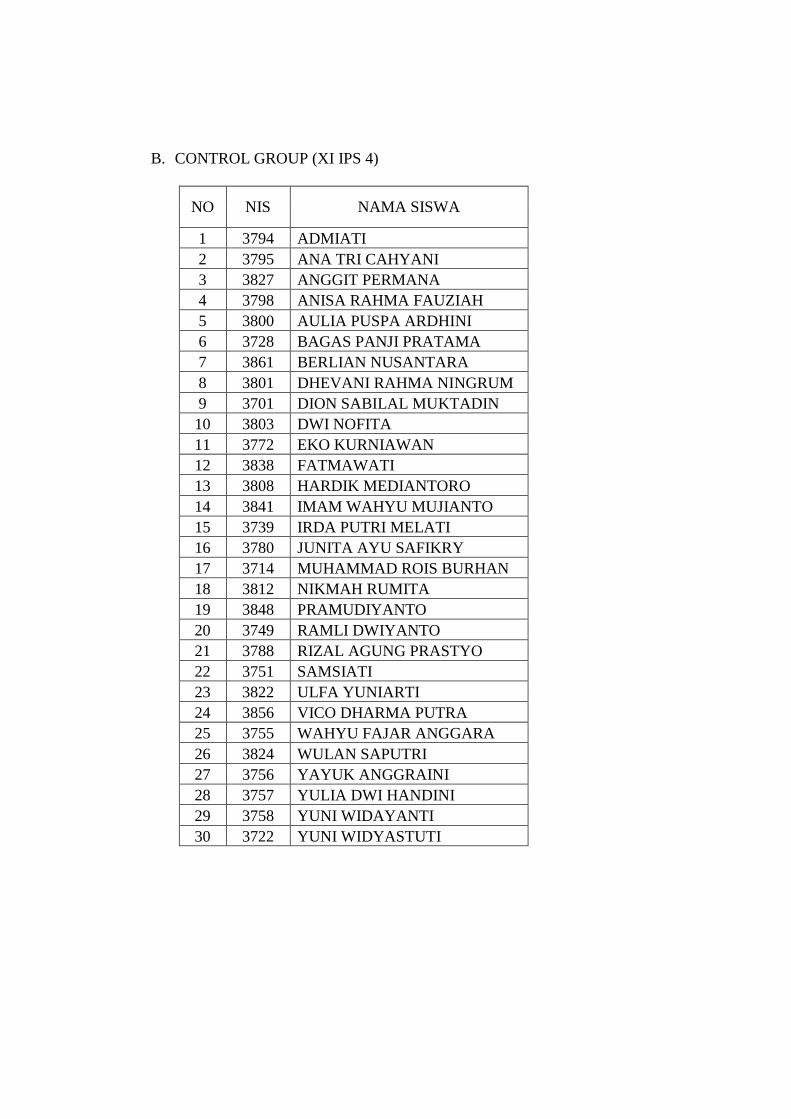
B. CONTROL GROUP (XI IPS 4)
NO NIS NAMA SISWA
1 3794 ADMIATI
2 3795 ANA TRI CAHYANI
3 3827 ANGGIT PERMANA
4 3798 ANISA RAHMA FAUZIAH
5 3800 AULIA PUSPA ARDHINI
6 3728 BAGAS PANJI PRATAMA
7 3861 BERLIAN NUSANTARA
8 3801 DHEVANI RAHMA NINGRUM
9 3701 DION SABILAL MUKTADIN
10 3803 DWI NOFITA
11 3772 EKO KURNIAWAN
12 3838 FATMAWATI
13 3808 HARDIK MEDIANTORO
14 3841 IMAM WAHYU MUJIANTO
15 3739 IRDA PUTRI MELATI
16 3780 JUNITA AYU SAFIKRY
17 3714 MUHAMMAD ROIS BURHAN
18 3812 NIKMAH RUMITA
19 3848 PRAMUDIYANTO
20 3749 RAMLI DWIYANTO
21 3788 RIZAL AGUNG PRASTYO
22 3751 SAMSIATI
23 3822 ULFA YUNIARTI
24 3856 VICO DHARMA PUTRA
25 3755 WAHYU FAJAR ANGGARA
26 3824 WULAN SAPUTRI
27 3756 YAYUK ANGGRAINI
28 3757 YULIA DWI HANDINI
29 3758 YUNI WIDAYANTI
30 3722 YUNI WIDYASTUTI
Name : ___________________
Class : ___________________
PRE-TEST
Make an analytical exposition in some paragraphs. The topic is “The Absence of
Women Career to Their Children’s Growth”. Give your own opinions and write it
as attractive as possible.
The Absence of Women Career to Their Children’s Growth
___________________________________________________________
__________________________________________________________________
__________________________________________________________________
__________________________________________________________________
__________________________________________________________________
__________________________________________________________________
__________________________________________________________________
_______________________________________________________________
___________________________________________________________
__________________________________________________________________
__________________________________________________________________
__________________________________________________________________
__________________________________________________________________
__________________________________________________________________
______________________________________________________
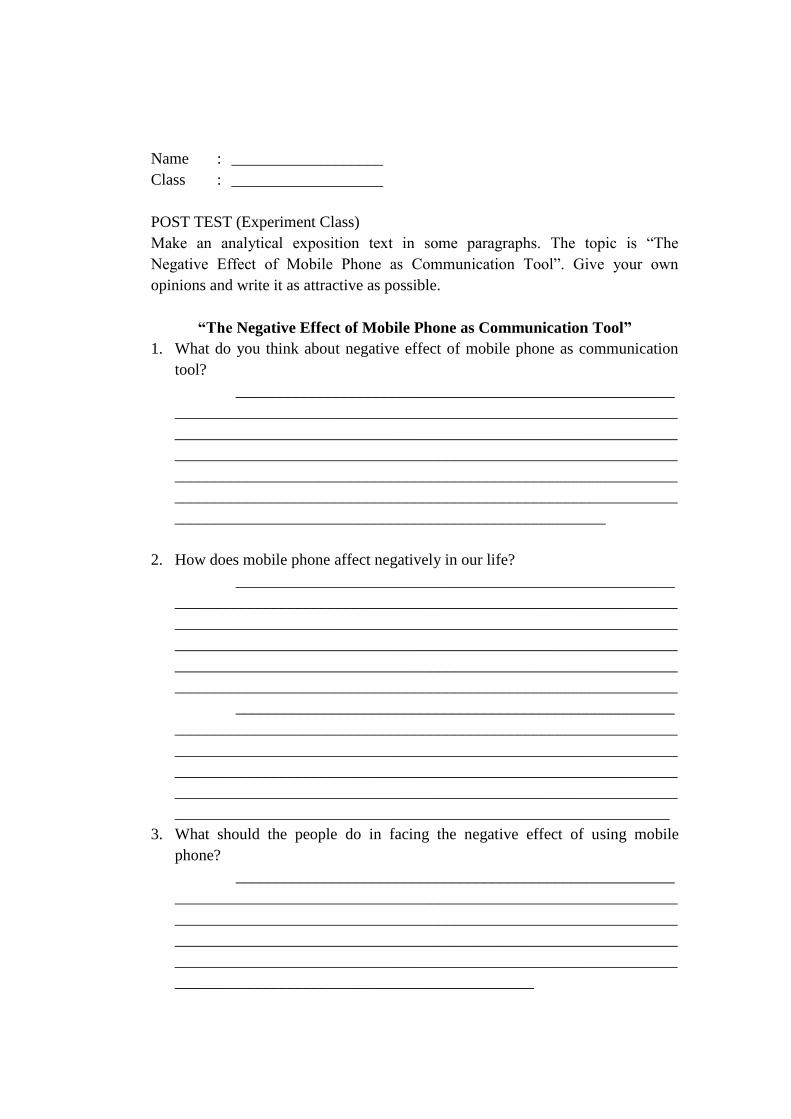
Name : ___________________
Class : ___________________
POST TEST (Experiment Class)
Make an analytical exposition text in some paragraphs. The topic is “The
Negative Effect of Mobile Phone as Communication Tool”. Give your own
opinions and write it as attractive as possible.
“The Negative Effect of Mobile Phone as Communication Tool”
1. What do you think about negative effect of mobile phone as communication
tool?
_______________________________________________________
_______________________________________________________________
_______________________________________________________________
_______________________________________________________________
_______________________________________________________________
_______________________________________________________________
______________________________________________________
2. How does mobile phone affect negatively in our life?
_______________________________________________________
_______________________________________________________________
_______________________________________________________________
_______________________________________________________________
_______________________________________________________________
_______________________________________________________________
_______________________________________________________
_______________________________________________________________
_______________________________________________________________
_______________________________________________________________
_______________________________________________________________
______________________________________________________________
3. What should the people do in facing the negative effect of using mobile
phone?
_______________________________________________________
_______________________________________________________________
_______________________________________________________________
_______________________________________________________________
_______________________________________________________________
_____________________________________________

Name : ___________________
Class : ___________________
POST TEST (Control Class)
Make an analytical exposition text in some paragraphs. The topic is “The
Negative Effect of Mobile Phone as Communication Tool”. Give your own
opinions and write it as attractive as possible.
“The Negative Effect of Mobile Phone as Communication Tool”
___________________________________________________________
__________________________________________________________________
__________________________________________________________________
__________________________________________________________________
__________________________________________________________________
__________________________________________________________________
__________________________________________________________________
_______________________________________________________________
___________________________________________________________
__________________________________________________________________
__________________________________________________________________
__________________________________________________________________
__________________________________________________________________
__________________________________________________________________
______________________________________________________
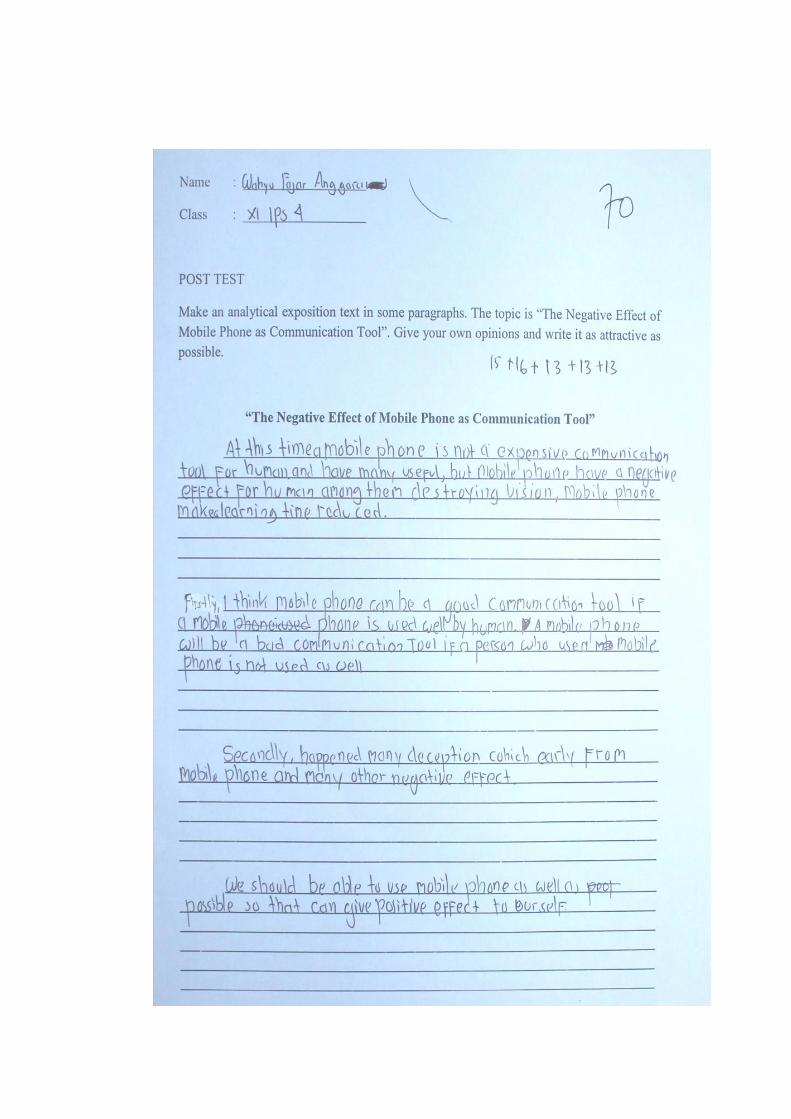

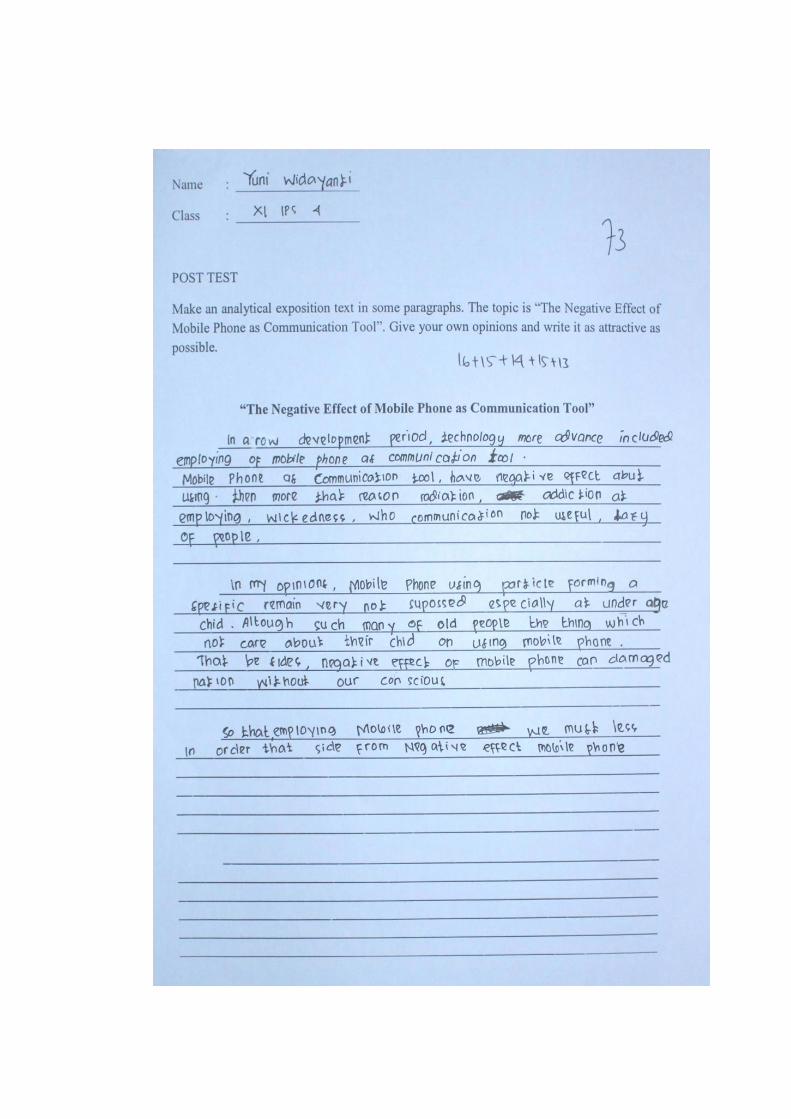
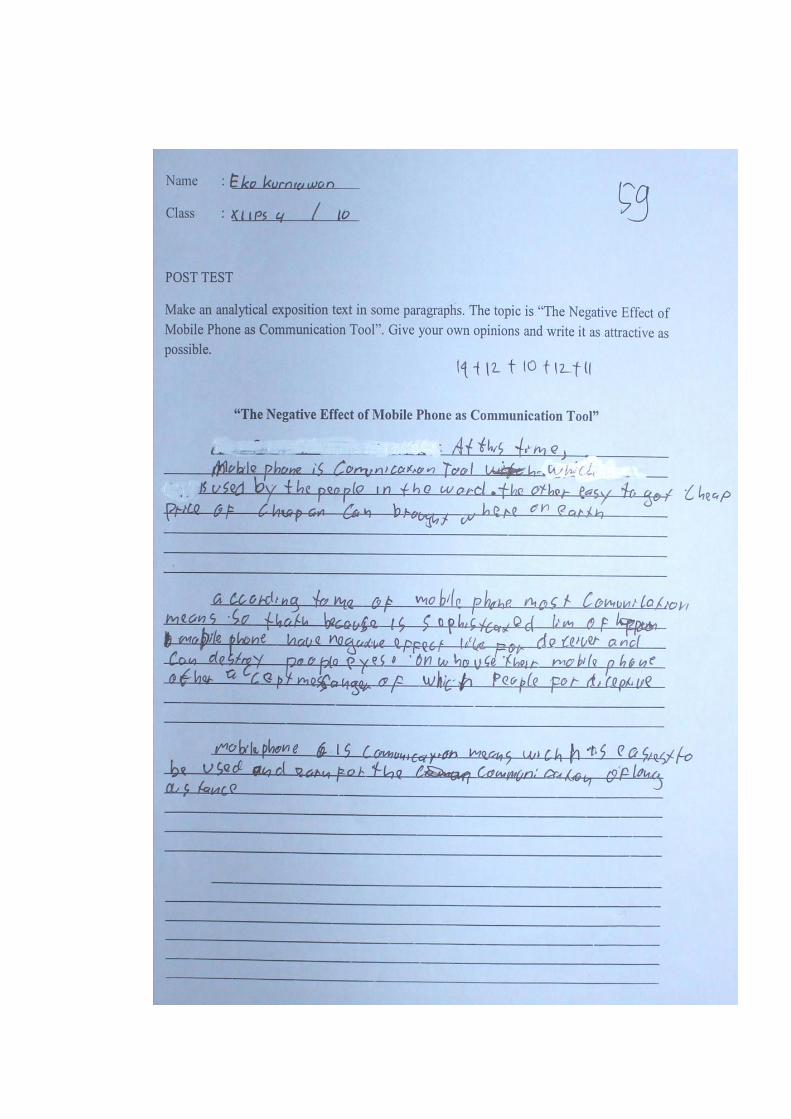

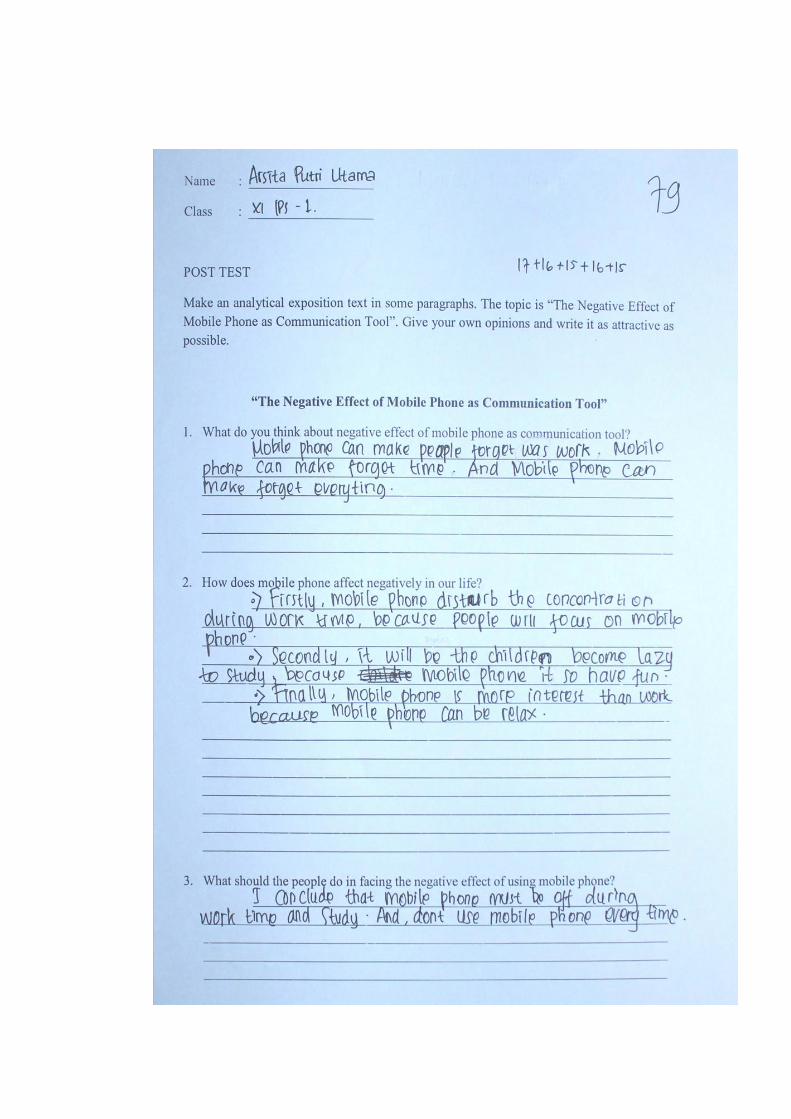
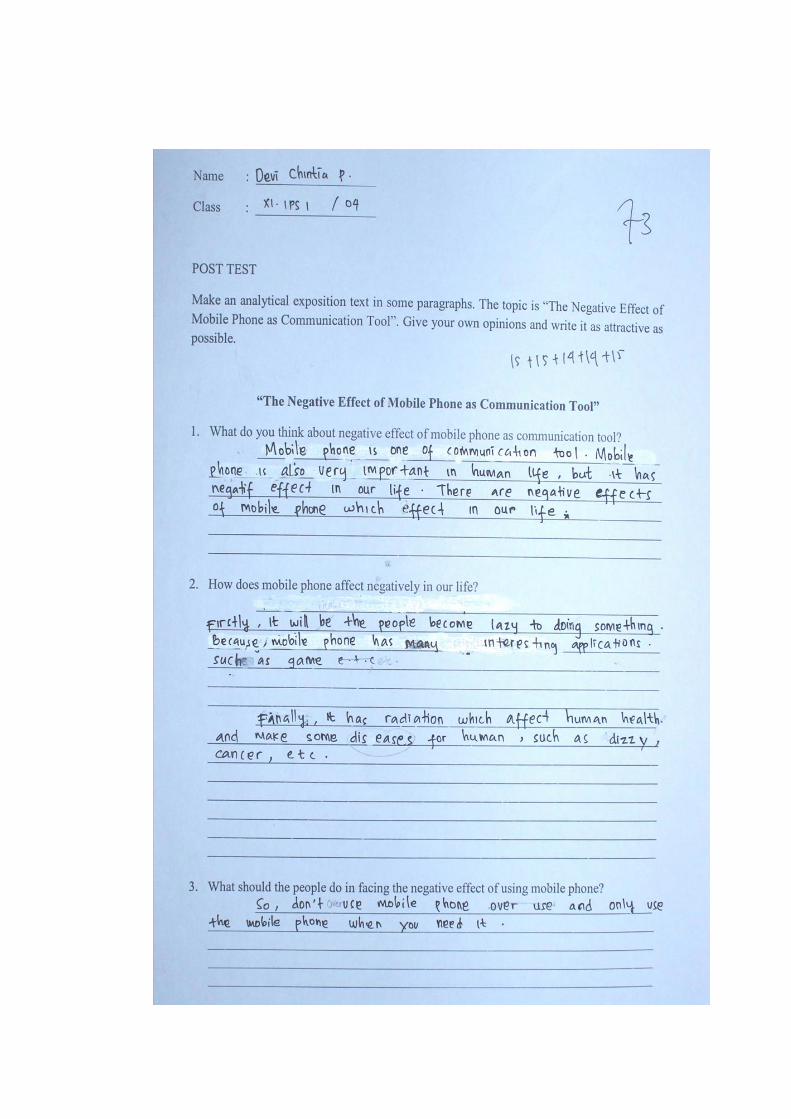
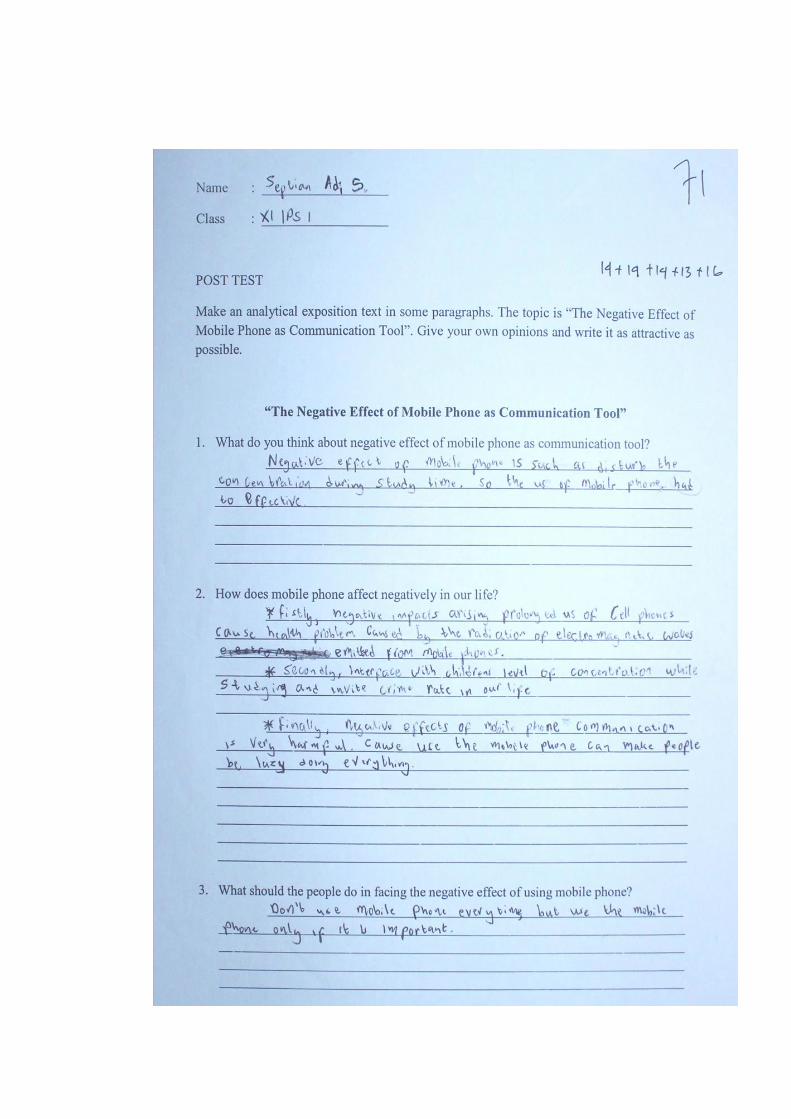

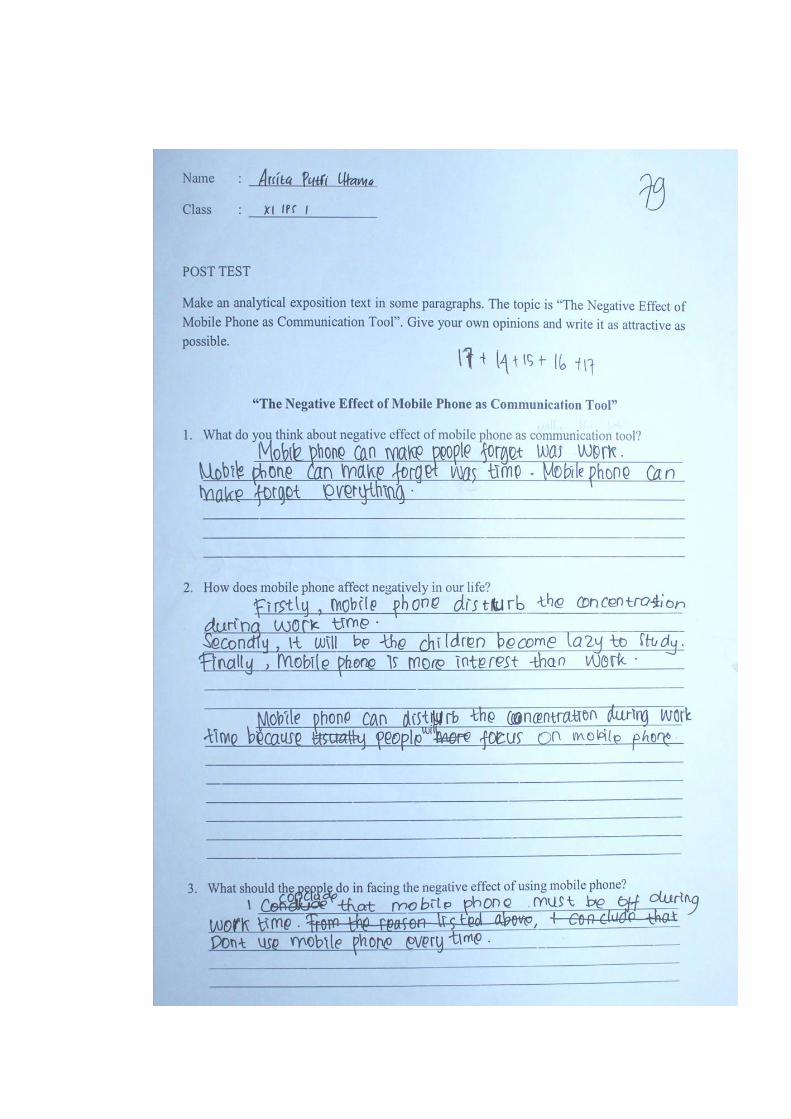
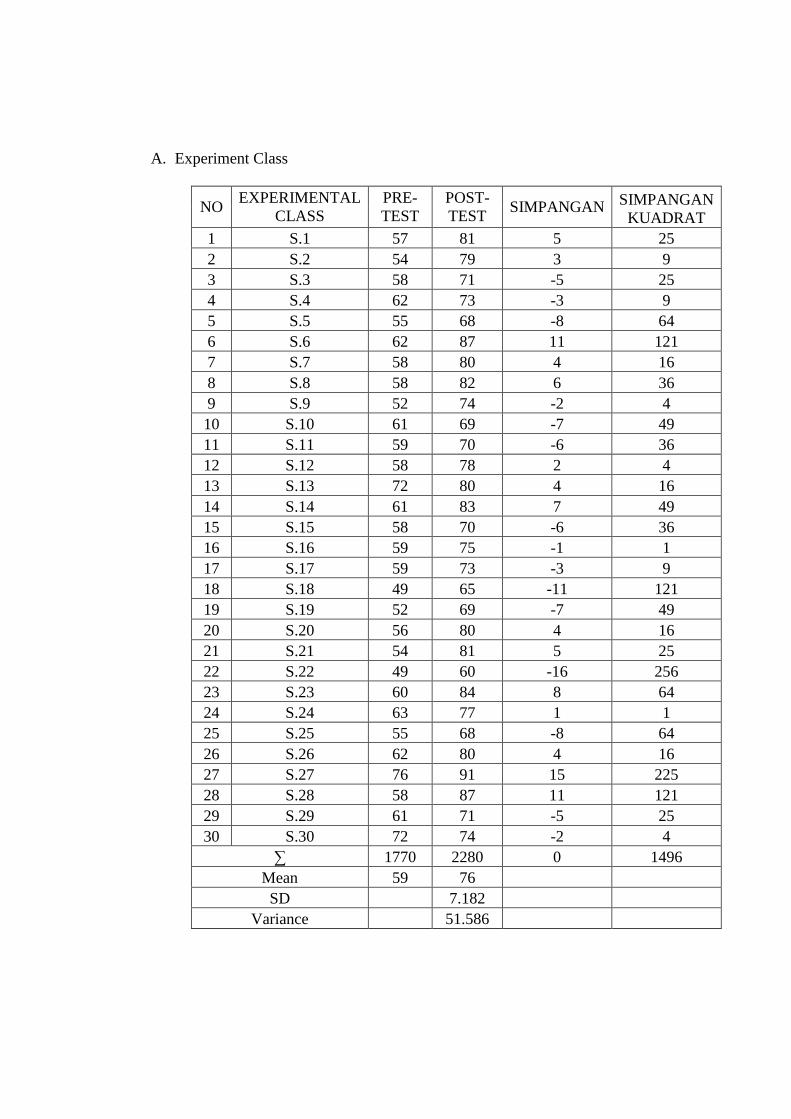
A. Experiment Class
NO EXPERIMENTAL
CLASS
PRE-
TEST
POST-
TEST SIMPANGAN
SIMPANGAN
KUADRAT
1 S.1 57 81 5 25
2 S.2 54 79 3 9
3 S.3 58 71 -5 25
4 S.4 62 73 -3 9
5 S.5 55 68 -8 64
6 S.6 62 87 11 121
7 S.7 58 80 4 16
8 S.8 58 82 6 36
9 S.9 52 74 -2 4
10 S.10 61 69 -7 49
11 S.11 59 70 -6 36
12 S.12 58 78 2 4
13 S.13 72 80 4 16
14 S.14 61 83 7 49
15 S.15 58 70 -6 36
16 S.16 59 75 -1 1
17 S.17 59 73 -3 9
18 S.18 49 65 -11 121
19 S.19 52 69 -7 49
20 S.20 56 80 4 16
21 S.21 54 81 5 25
22 S.22 49 60 -16 256
23 S.23 60 84 8 64
24 S.24 63 77 1 1
25 S.25 55 68 -8 64
26 S.26 62 80 4 16
27 S.27 76 91 15 225
28 S.28 58 87 11 121
29 S.29 61 71 -5 25
30 S.30 72 74 -2 4
∑ 1770 2280 0 1496
Mean 59 76
SD 7.182
Variance 51.586

B. Control Class
NO CONTROL
CLASS PRE-TEST
POST-TEST
SIMPANGAN SIMPANGAN KUADRAT
1 S.1 58 78 7.667 58.778
2 S.2 54 63 -7.333 53.778
3 S.3 53 69 -1.333 1.778
4 S.4 50 70 -0.333 0.111
5 S.5 64 83 12.667 160.444
6 S.6 52 71 0.667 0.444
7 S.7 56 65 -5.333 28.444
8 S.8 53 75 4.667 21.778
9 S.9 52 77 6.667 44.444
10 S.10 50 74 3.667 13.444
11 S.11 48 59 -11.333 128.444
12 S.12 56 66 -4.333 18.778
13 S.13 66 85 14.667 215.111
14 S.14 51 78 7.667 58.778
15 S.15 53 75 4.667 21.778
16 S.16 54 74 3.667 13.444
17 S.17 48 56 -14.333 205.444
18 S.18 57 72 1.667 2.778
19 S.19 49 63 -7.333 53.778
20 S.20 52 70 -0.333 0.111
21 S.21 60 77 6.667 44.444
22 S.22 56 69 -1.333 1.778
23 S.23 48 63 -7.333 53.778
24 S.24 49 65 -5.333 28.444
25 S.25 52 70 -0.333 0.111
26 S.26 52 65 -5.333 28.444
27 S.27 57 68 -2.333 5.444
28 S.28 53 63 -7.333 53.778
29 S.29 55 73 2.667 7.111
30 S.30 54 74 3.667 13.444
∑ 1612 2110 0.000 1338.667
Mean 53.733 70.333
SD 6.794
Variance 46.161
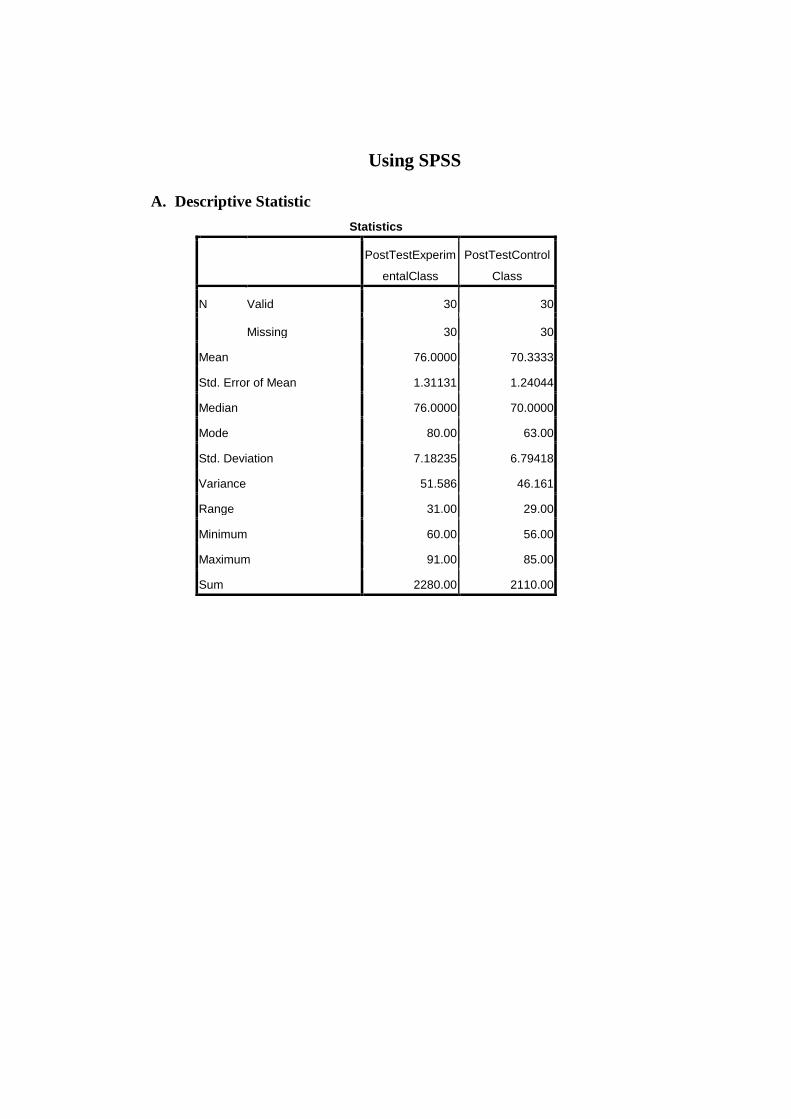
Using SPSS
A. Descriptive Statistic
Statistics
PostTestExperim
entalClass
PostTestControl
Class
N Valid 30 30
Missing 30 30
Mean 76.0000 70.3333
Std. Error of Mean 1.31131 1.24044
Median 76.0000 70.0000
Mode 80.00 63.00
Std. Deviation 7.18235 6.79418
Variance 51.586 46.161
Range 31.00 29.00
Minimum 60.00 56.00
Maximum 91.00 85.00
Sum 2280.00 2110.00
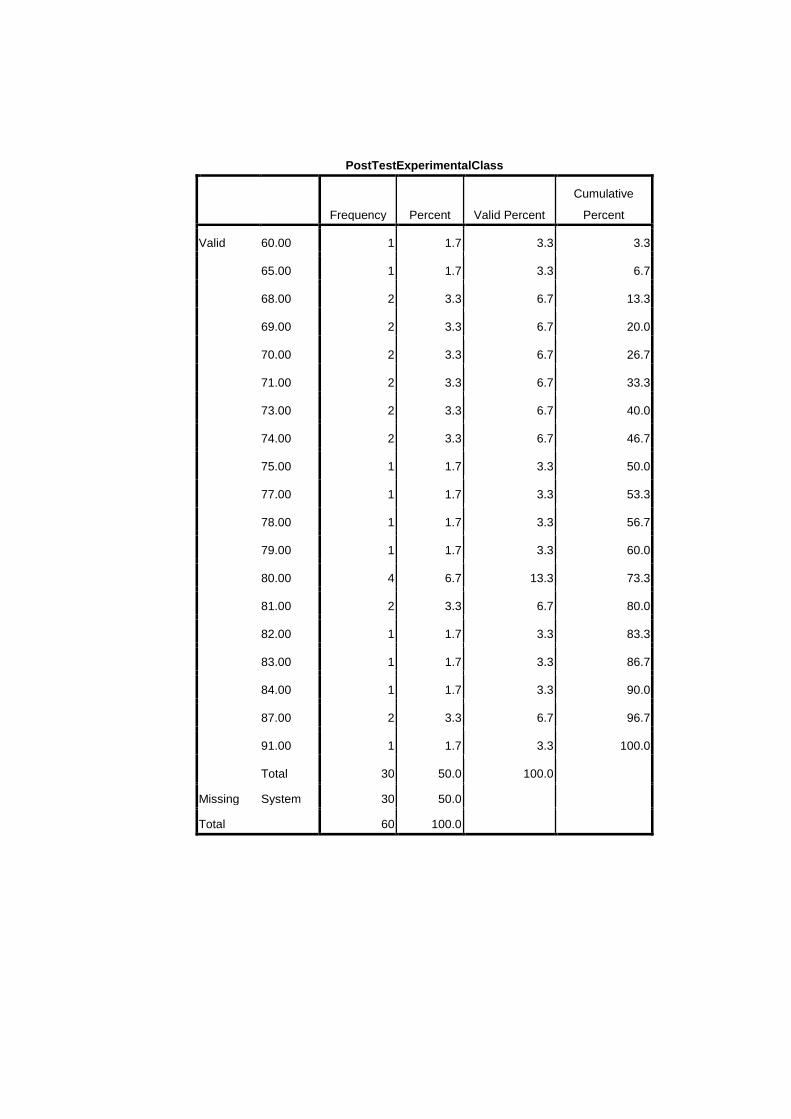
PostTestExperimentalClass
Frequency Percent Valid Percent
Cumulative
Percent
Valid 60.00 1 1.7 3.3 3.3
65.00 1 1.7 3.3 6.7
68.00 2 3.3 6.7 13.3
69.00 2 3.3 6.7 20.0
70.00 2 3.3 6.7 26.7
71.00 2 3.3 6.7 33.3
73.00 2 3.3 6.7 40.0
74.00 2 3.3 6.7 46.7
75.00 1 1.7 3.3 50.0
77.00 1 1.7 3.3 53.3
78.00 1 1.7 3.3 56.7
79.00 1 1.7 3.3 60.0
80.00 4 6.7 13.3 73.3
81.00 2 3.3 6.7 80.0
82.00 1 1.7 3.3 83.3
83.00 1 1.7 3.3 86.7
84.00 1 1.7 3.3 90.0
87.00 2 3.3 6.7 96.7
91.00 1 1.7 3.3 100.0
Total 30 50.0 100.0
Missing System 30 50.0
Total 60 100.0
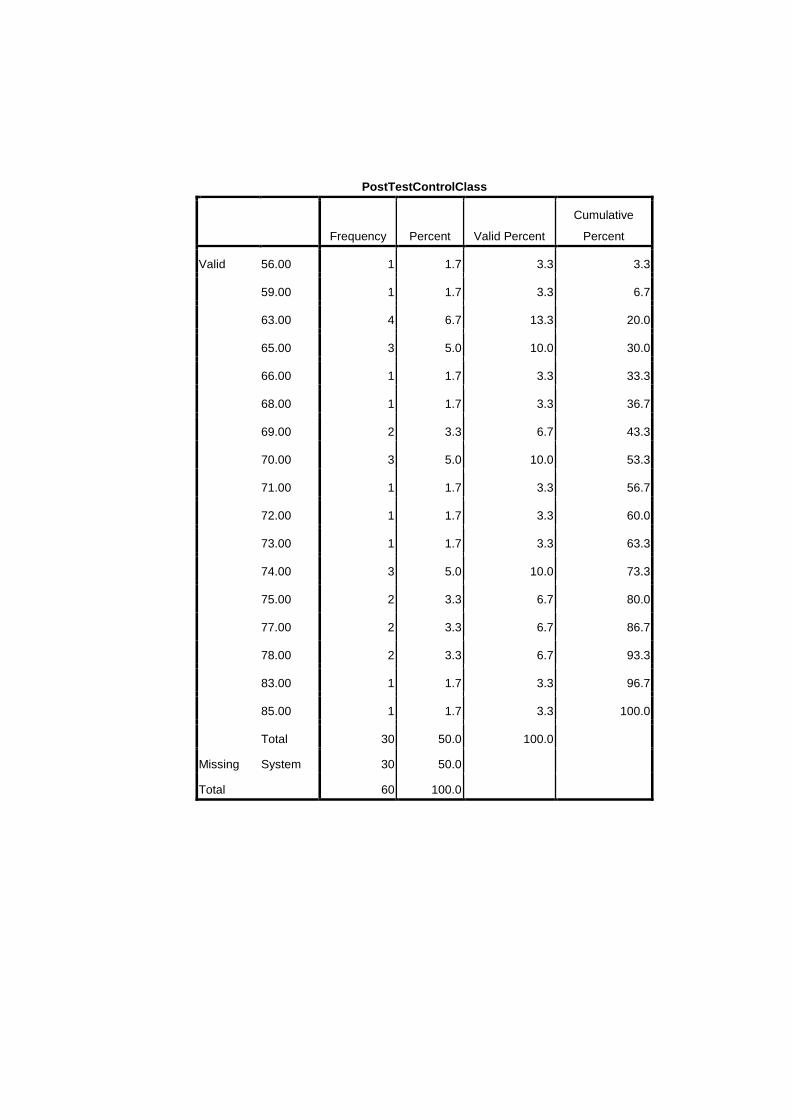
PostTestControlClass
Frequency Percent Valid Percent
Cumulative
Percent
Valid 56.00 1 1.7 3.3 3.3
59.00 1 1.7 3.3 6.7
63.00 4 6.7 13.3 20.0
65.00 3 5.0 10.0 30.0
66.00 1 1.7 3.3 33.3
68.00 1 1.7 3.3 36.7
69.00 2 3.3 6.7 43.3
70.00 3 5.0 10.0 53.3
71.00 1 1.7 3.3 56.7
72.00 1 1.7 3.3 60.0
73.00 1 1.7 3.3 63.3
74.00 3 5.0 10.0 73.3
75.00 2 3.3 6.7 80.0
77.00 2 3.3 6.7 86.7
78.00 2 3.3 6.7 93.3
83.00 1 1.7 3.3 96.7
85.00 1 1.7 3.3 100.0
Total 30 50.0 100.0
Missing System 30 50.0
Total 60 100.0
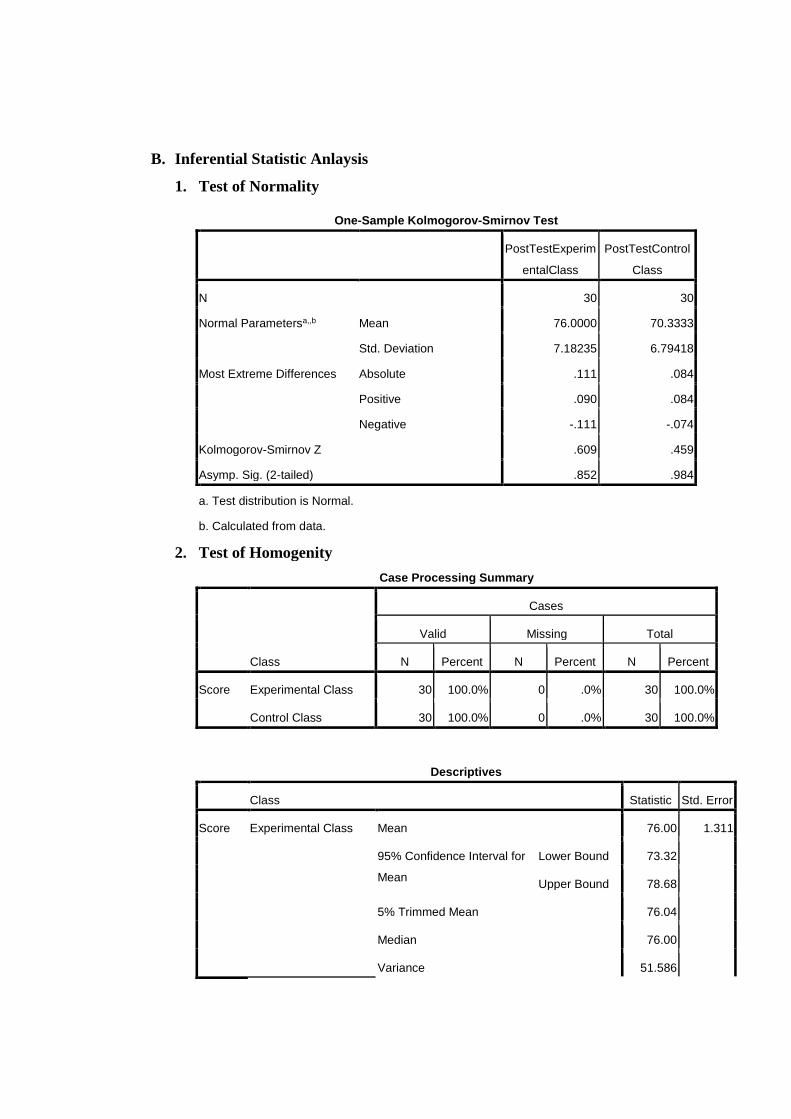
B. Inferential Statistic Anlaysis
1. Test of Normality
One-Sample Kolmogorov-Smirnov Test
PostTestExperim
entalClass
PostTestControl
Class
N 30 30
Normal Parametersa,,b Mean 76.0000 70.3333
Std. Deviation 7.18235 6.79418
Most Extreme Differences Absolute .111 .084
Positive .090 .084
Negative -.111 -.074
Kolmogorov-Smirnov Z .609 .459
Asymp. Sig. (2-tailed) .852 .984
a. Test distribution is Normal.
b. Calculated from data.
2. Test of Homogenity
Case Processing Summary
Class
Cases
Valid Missing Total
N Percent N Percent N Percent
Score Experimental Class 30 100.0% 0 .0% 30 100.0%
Control Class 30 100.0% 0 .0% 30 100.0%
Descriptives
Class Statistic Std. Error
Score Experimental Class Mean 76.00 1.311
95% Confidence Interval for
Mean
Lower Bound 73.32
Upper Bound 78.68
5% Trimmed Mean 76.04
Median 76.00
Variance 51.586

Std. Deviation 7.182
Minimum 60
Maximum 91
Range 31
Interquartile Range 11
Skewness -.024 .427
Kurtosis -.352 .833
Control Class Mean 70.33 1.240
95% Confidence Interval for
Mean
Lower Bound 67.80
Upper Bound 72.87
5% Trimmed Mean 70.30
Median 70.00
Variance 46.161
Std. Deviation 6.794
Minimum 56
Maximum 85
Range 29
Interquartile Range 10
Skewness .062 .427
Kurtosis -.202 .833
Tests of Normality
Class
Kolmogorov-Smirnova Shapiro-Wilk
Statistic df Sig. Statistic df Sig.
Score Experimental Class .111 30 .200* .983 30 .894
Control Class .084 30 .200* .985 30 .935
a. Lilliefors Significance Correction
*. This is a lower bound of the true significance.
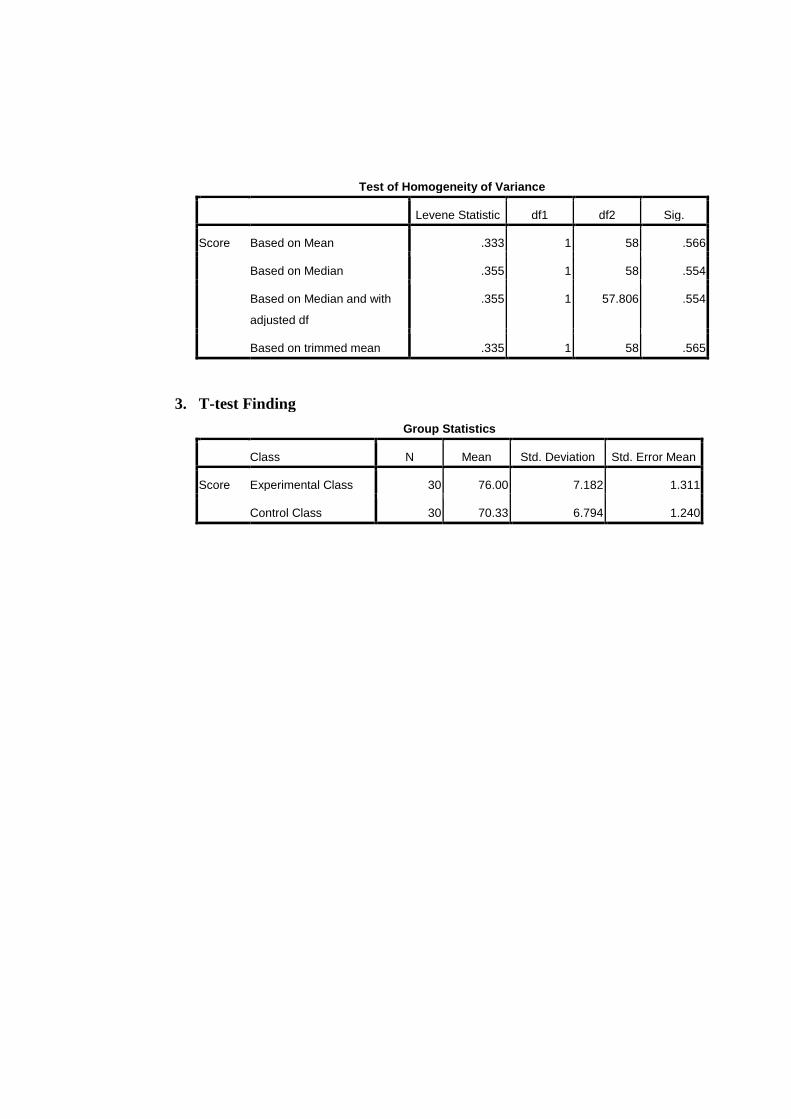
Test of Homogeneity of Variance
Levene Statistic df1 df2 Sig.
Score Based on Mean .333 1 58 .566
Based on Median .355 1 58 .554
Based on Median and with
adjusted df
.355 1 57.806 .554
Based on trimmed mean .335 1 58 .565
3. T-test Finding
Group Statistics
Class N Mean Std. Deviation Std. Error Mean
Score Experimental Class 30 76.00 7.182 1.311
Control Class 30 70.33 6.794 1.240