The Effectiveness of ABC Cross Analysis on Products ...
20
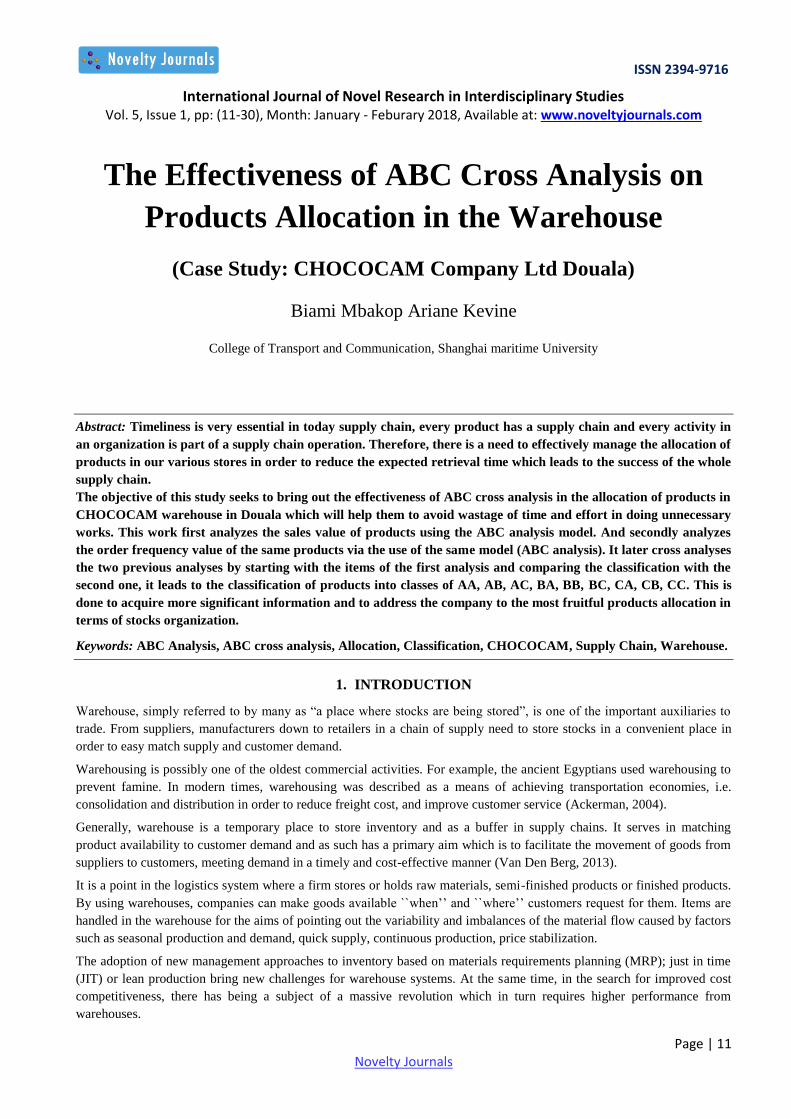
ISSN 2394-9716 International Journal of Novel Research in Interdisciplinary Studies Vol. 5, Issue 1, pp: (11-30), Month: January - Feburary 2018, Available at: www.noveltyjournals.com Page | 11 Novelty Journals The Effectiveness of ABC Cross Analysis on Products Allocation in the Warehouse (Case Study: CHOCOCAM Company Ltd Douala) Biami Mbakop Ariane Kevine College of Transport and Communication, Shanghai maritime University Abstract: Timeliness is very essential in today supply chain, every product has a supply chain and every activity in an organization is part of a supply chain operation. Therefore, there is a need to effectively manage the allocation of products in our various stores in order to reduce the expected retrieval time which leads to the success of the whole supply chain. The objective of this study seeks to bring out the effectiveness of ABC cross analysis in the allocation of products in CHOCOCAM warehouse in Douala which will help them to avoid wastage of time and effort in doing unnecessary works. This work first analyzes the sales value of products using the ABC analysis model. And secondly analyzes the order frequency value of the same products via the use of the same model (ABC analysis). It later cross analyses the two previous analyses by starting with the items of the first analysis and comparing the classification with the second one, it leads to the classification of products into classes of AA, AB, AC, BA, BB, BC, CA, CB, CC. This is done to acquire more significant information and to address the company to the most fruitful products allocation in terms of stocks organization. Keywords: ABC Analysis, ABC cross analysis, Allocation, Classification, CHOCOCAM, Supply Chain, Warehouse. 1. INTRODUCTION Warehouse, simply referred to by many as “a place where stocks are being stored”, is one of the important auxiliaries to trade. From suppliers, manufacturers down to retailers in a chain of supply need to store stocks in a convenient place in order to easy match supply and customer demand. Warehousing is possibly one of the oldest commercial activities. For example, the ancient Egyptians used warehousing to prevent famine. In modern times, warehousing was described as a means of achieving transportation economies, i.e. consolidation and distribution in order to reduce freight cost, and improve customer service (Ackerman, 2004). Generally, warehouse is a temporary place to store inventory and as a buffer in supply chains. It serves in matching product availability to customer demand and as such has a primary aim which is to facilitate the movement of goods from suppliers to customers, meeting demand in a timely and cost-effective manner (Van Den Berg, 2013). It is a point in the logistics system where a firm stores or holds raw materials, semi-finished products or finished products. By using warehouses, companies can make goods available ``when‟‟ and ``where‟‟ customers request for them. Items are handled in the warehouse for the aims of pointing out the variability and imbalances of the material flow caused by factors such as seasonal production and demand, quick supply, continuous production, price stabilization. The adoption of new management approaches to inventory based on materials requirements planning (MRP); just in time (JIT) or lean production bring new challenges for warehouse systems. At the same time, in the search for improved cost competitiveness, there has being a subject of a massive revolution which in turn requires higher performance from warehouses.
-
Upload
khangminh22 -
Category
Documents
-
view
0 -
download
0
Transcript of The Effectiveness of ABC Cross Analysis on Products ...
ISSN 2394-9716
International Journal of Novel Research in Interdisciplinary Studies Vol. 5, Issue 1, pp: (11-30), Month: January - Feburary 2018, Available at: www.noveltyjournals.com
Page | 11 Novelty Journals
The Effectiveness of ABC Cross Analysis on
Products Allocation in the Warehouse
(Case Study: CHOCOCAM Company Ltd Douala)
Biami Mbakop Ariane Kevine
College of Transport and Communication, Shanghai maritime University
Abstract: Timeliness is very essential in today supply chain, every product has a supply chain and every activity in
an organization is part of a supply chain operation. Therefore, there is a need to effectively manage the allocation of
products in our various stores in order to reduce the expected retrieval time which leads to the success of the whole
supply chain.
The objective of this study seeks to bring out the effectiveness of ABC cross analysis in the allocation of products in
CHOCOCAM warehouse in Douala which will help them to avoid wastage of time and effort in doing unnecessary
works. This work first analyzes the sales value of products using the ABC analysis model. And secondly analyzes
the order frequency value of the same products via the use of the same model (ABC analysis). It later cross analyses
the two previous analyses by starting with the items of the first analysis and comparing the classification with the
second one, it leads to the classification of products into classes of AA, AB, AC, BA, BB, BC, CA, CB, CC. This is
done to acquire more significant information and to address the company to the most fruitful products allocation in
terms of stocks organization.
Keywords: ABC Analysis, ABC cross analysis, Allocation, Classification, CHOCOCAM, Supply Chain, Warehouse.
1. INTRODUCTION
Warehouse, simply referred to by many as “a place where stocks are being stored”, is one of the important auxiliaries to
trade. From suppliers, manufacturers down to retailers in a chain of supply need to store stocks in a convenient place in
order to easy match supply and customer demand.
Warehousing is possibly one of the oldest commercial activities. For example, the ancient Egyptians used warehousing to
prevent famine. In modern times, warehousing was described as a means of achieving transportation economies, i.e.
consolidation and distribution in order to reduce freight cost, and improve customer service (Ackerman, 2004).
Generally, warehouse is a temporary place to store inventory and as a buffer in supply chains. It serves in matching
product availability to customer demand and as such has a primary aim which is to facilitate the movement of goods from
suppliers to customers, meeting demand in a timely and cost-effective manner (Van Den Berg, 2013).
It is a point in the logistics system where a firm stores or holds raw materials, semi-finished products or finished products.
By using warehouses, companies can make goods available ``when‟‟ and ``where‟‟ customers request for them. Items are
handled in the warehouse for the aims of pointing out the variability and imbalances of the material flow caused by factors
such as seasonal production and demand, quick supply, continuous production, price stabilization.
The adoption of new management approaches to inventory based on materials requirements planning (MRP); just in time
(JIT) or lean production bring new challenges for warehouse systems. At the same time, in the search for improved cost
competitiveness, there has being a subject of a massive revolution which in turn requires higher performance from
warehouses.

ISSN 2394-9716
International Journal of Novel Research in Interdisciplinary Studies Vol. 5, Issue 1, pp: (11-30), Month: January - Feburary 2018, Available at: www.noveltyjournals.com
Page | 12 Novelty Journals
Warehouse plays a major role in supply chain management by ensuring that the right products are delivered in the right
quantity by picking and dispatching them in an accurate way. Delivering to the right customer at the right place, on time,
requires the product to be labeled correctly and loaded onto the right vehicle with sufficient time to meet the delivery
deadline. The warehouse manager also ensures that product leaves the warehouse clean and not damage. Finally, at the
right price requires a cost-efficient operation that delivers value for money.
Warehouse is therefore one of the important aspect of any supply chain. The capital and operating costs of warehouses
represent about 20 – 25% of the logistics costs (Frazelle, 2002). Hence, a better planning, management and control of
warehousing products lead to a success of any supply chain.
ABC analysis is a business term used to define an inventory categorization technique often used in materials management.
It provides a mechanism for identifying items that will have a significant impact on overall inventory cost, while also
providing a mechanism for identifying different category of stock that will require different management and controls.
In order to ensure the smooth flow of products within a warehouse, the managerial aspect has to be conducted critically.
Hence, the need of arranging stocks based on the decision drawn from the ABC analysis will be very useful for the
warehouse manager. Therefore, products have to be classified according to their sales value, which means that: A items
will be designated as the highest selling items, B (medium products) and C as the lowest selling items. Then, they will also
be classified according to their frequency of sales. In this case; A items will rather be the products sold most frequently,
while B will be at the medium and C will be those which are sold less frequently. Then later, the ABC cross analysis will
integrate the information of the two previous analyses and will lead to items classification in more classes, so as to perform
a more detailed analysis. In particular, the items will be prearranged in a matrix that defines the following classes: AA,
AB, AC, BA, BB, BC, CC, CB, CA (Lean manufacturing). In this case, AA products will be those that generate the most
sales and are sold most frequently. Consequently, will be placed in a most convenient position in a warehouse.CC products
on the other hand will be referred to those that are sold the least and are moved less frequently. Therefore, they will have
different management and displacement. These therefore make it necessary, for organizations to process customer‟s orders
very quick and deliver them on time.
1.1 PROBLEM STATEMENT:
CHOCOCAM (Chocolate Confectionery Cameroon) is specialized in the manufacture of chocolate-based products and
various sweets from cocoa mass. To bridge the gap between production and consumption of products, they boast of many
warehouses such as raw material warehouse, semi- finished warehouse and finished products warehouse.
The focus here is in their finished products warehouse and the main issue being observed in their operation is of product‟s
allocation and importance. After reception of products in the warehouse, no appropriate techniques are being implemented
in order to store and retrieve them easily and efficiently. Products are stored randomly, simply by placing them (boxes and
all) wherever free space can be found. These bring out excess of movement and work when products are needed, leading
to a reduction in profit levels.
It is on this perspective that the researcher seeks to objectively use the ABC cross analysis as an effective strategy in the
management and allocation of products in a warehouse.
RESEARCH OBJECTIVES:
The main objective of the research is;
To illustrate the importance of ABC cross analysis in the effective allocation or management of products within the
warehouse,
Specific objectives
1. To study and classify products according to their sales value into classes of ABC.
2. To classify products according to their frequency of sales level into classes of ABC.
3. To cross categorize items according to both value and frequency of sales.
4. To propose measures of improvement of effective products allocation in the warehouse.

ISSN 2394-9716
International Journal of Novel Research in Interdisciplinary Studies Vol. 5, Issue 1, pp: (11-30), Month: January - Feburary 2018, Available at: www.noveltyjournals.com
Page | 13 Novelty Journals
2. LITERATURE REVIEW
2.1) SUPPLY CHAIN MANAGEMENT:
Warehousing plays an essential role in the supply chain management (SCM). In today industry, the demands and
expectations of customers are unpredictable; a critical focus on warehousing operation facilitates the balance between
supply and demand within the supply chain. To demonstrate how warehousing relates with the supply chain process, SCM
will be shortly described below.
The phrase SCM was first coined in the early 1980s to describe the range of activities coordinated by an organization to
produce and manage supplies (Burt & Starling, 2003).Supply chain management is a very broad field of study; it
incorporates a wide range of activities such as: supplier management, inventory & forecasting, transportation & logistics,
after sales support, reverse logistics etc. There is no universal definition of the term SCM; it has been defined in many
ways by different authors. But, we are only going to choose one definition among them which seems to clearly illustrate
the relationship between supply chain management and warehousing.
SCM is a term used to describe the management of the flow of materials, information, and funds across the entire supply
chain, from suppliers to components producers to final assemblers to distribution (warehouses and retailers), and
ultimately to the consumer (Johnson & Pyke, 2001). From this definition, we can deduct that every activity in an
organization included warehousing is part of a supply chain operation. Supply chain being wider; warehousing is just one
aspect of it. What is lacking in this previous definition is to establish the aim of integrating all these activities as suggested
by Hobson, (1997) „supply chain is about organizing the entire chain from purchasing the raw material through to the point
where the end product is used or consumed. It involves ensuring that the right product is available in the right quantity in
the right condition in the right place at the right time… in its widest sense it includes the disposal and possible recycling of
waste, and even extends to aftersales maintenance and the replacement of parts.‟‟ Therefore, SCM is not only seen as the
joint operation of business to satisfy customer needs, but also includes recycling and re-use.
Across the supply chain, warehouse is an important element of activities in the distribution of goods, from the raw
materials and work in progress through to finished products. It is integral part to the supply chain network within which it
operates and as such its roles and objectives should synchronize with the objectives of the supply chain.
According to (Larson & Poist, 2007), „„Logistics is often also used to refer to SCM. Whether logistics or SCM are the
same, is still heavily being discussed in literature as well.‟‟
Logistics is defined as „„the management of business operations, including the acquisition, storage, transportation, and
delivery of goods along the supply chain‟‟ (Murray, 2006). We can therefore observe that, logistics is not that broad as
supply chain is.
Warehouse is a part of the „„logistics branch‟‟. This is further supported by the current definition by the Council of Supply
Chain Management Professionals (2013) stated that, Logistics Management is the part of supply chain management that
plans, implements and control the efficient, effective forward and reverse flow and storage of goods, services and related
information between the point of origin and the point of consumption in order to meet customers‟ requirements. (Lambert
& Ellram, 1998) Argues „Warehousing has developed from a relatively minor facet of a firm‟s logistics system to one of
its most important functions.‟‟ Warehousing is just one aspect of Logistics which is also a part of SCM.
2.2) WHAT IS WAREHOUSE?
According to (Tompkins & Smith, 1998), warehouse is usually large plain buildings used for commercial purposes for
storage of goods. Exporters/manufacturers are using warehouses as a point of developing retail outlets in a particular
region or country. Warehousing concept is used as a sharp tool by manufacturers to reach directly to consumers by
avoiding or passing importers or other middle agencies.
(Coyle & Bardi, 1980) defined warehousing as the storage of stock prior to their use. (Muller, 2011) Added its view by
saying „„where stock is divided into raw materials, finished goods and work-in-progress‟‟.
Warehousing plays a vital role in the Supply Chain in providing a desired level of customer service at the lowest possible
total cost (Grant, 2006). Warehouses are expected to be more responsive to customer demands. It is integral part to the
supply chain network within which it operates and as such its roles and objectives should synchronize with the objectives
ISSN 2394-9716
International Journal of Novel Research in Interdisciplinary Studies Vol. 5, Issue 1, pp: (11-30), Month: January - Feburary 2018, Available at: www.noveltyjournals.com
Page | 14 Novelty Journals
of the supply chain, it is an important element of activities in the distribution of goods, from the raw materials and work in
progress through to finished products.
Warehouse is a point in the logistics system where a firm stores or holds raw materials, semi-finished goods, or finished
goods for varying periods of time (Coyle et al., 2003).Lambert and al (1998) argues„ „Warehousing has developed from a
relatively minor facet of a firm‟s logistics system to one of its most important functions.‟‟
Warehouses come in various shapes as well as various sizes. Any given warehouse size may be constructed in many
different length, width and height combinations. It is now assumed that the basic warehouse size has been established, and
the next question is, what is the best configuration for the warehouse? A distinction is made between warehouses that are
for general storage and those that are used as cross dock, or high throughput, facilities. (Ballou, 2004)
2.3) WAREHOUSE MANAGEMENT:
Warehouse management can be subdivided into tactical and operational decisions. First, tactical decisions address how to
efficiently plan materials and resources for the short- term period (a week to a few months), within the constraints of a
long term decisions. In the production operations management, tactical plans assess the expected overall demand which
the warehouse must meet in an aggregated manner (Slack et al., 2010). In other words, the expected order quantities are
checked against total capacity of space, labor and equipment, and are then translated into outputs. Tactical warehouse
plans include inventory replenishment, storage location assignment, workload planning, and transport planning (Ghiani et
al., 2004). Inventory replenishment and storage location assignment plans determine which products should arrive and
where these should be stored (Strack and Pochet, 2010). Workload and transport planning balance the expected workload
over the available resources (labor, equipment and transport).
Second, at the operational level, actual demand is assessed on a totally disaggregated basis (Ghiani et al., 2004; Slack et
al., 2010): resources such as space, equipment (e.g., storage systems, retrieval systems, and internal transport equipment),
storage units (e.g. pallets or boxes), labor, instructions and procedures are allocated among the warehouse working orders
(Alpan & al, 2011). At the operational level, many of the resources are given and it is difficult to make large-scale changes
in resourcing. The goal of operational decisions is to optimize shop floor activities by avoiding any inefficiency in
movement, storage and information transfer, so that operational costs are minimized while customer orders are delivered
in accordance with the expectations of recipient (Tsui & Chang, 1992).
From all the approaches mentioned above, it is clearly observed that, warehouse management is all about ensuring that all
the activities involved in warehouse are carried out efficiently and effectively by planning, organizing and controlling
them in an accurate way in order to run smoothly while avoiding waste and maximizing profit.
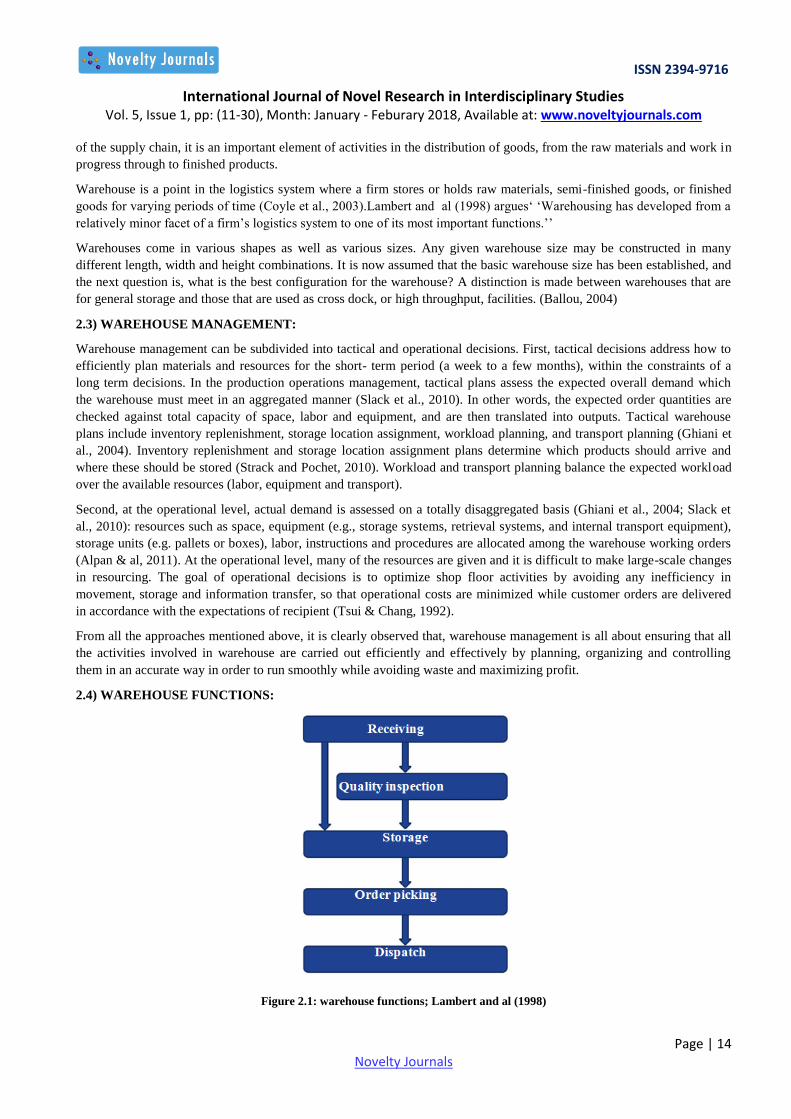
2.4) WAREHOUSE FUNCTIONS:
Figure 2.1: warehouse functions; Lambert and al (1998)

ISSN 2394-9716
International Journal of Novel Research in Interdisciplinary Studies Vol. 5, Issue 1, pp: (11-30), Month: January - Feburary 2018, Available at: www.noveltyjournals.com
Page | 15 Novelty Journals
According to Lambert and al (1998), warehousing can be divided into three basic functions: movement, storage and
information transfer. The authors further divide movement into activities such as a) receiving, b) transfer or put away, c)
order picking and d) shipping.
CII Institute of logistics divided the functions of warehouse into 10, which are:
1. Receiving: This includes the physical unloading of incoming transport, checking, recording of receipts, and deciding
where the received goods are to be put away in the warehouse. It can also include such activities as unpacking and
repackaging, quality control checks and temporary quarantine storage for goods awaiting clearance by quality control.
2. Inspection: quality and quantity check of the incoming goods for their required characteristics.
3. Repackaging: incoming lot may be having non-standard packaging which may not be stored as it is in the respective
location. In those cases, these materials have to be pre packed in unit loads/pallet loads suitable for storage.
4. Put-away: Binning and storing the goods in their respective locations including the temp location from the receiving
docking area
5. Storage: binning the approved material in their respective locations.
6. Order-picking/selection: goods are selected from order picking stock in the required quantities and at the required time
to meet customer orders. Picking often involves break bulk operations, when goods are received from suppliers in, say,
and whole pallet quantities but ordered by customers in less than pallet quantity. Order picking is important in achieving
high levels of customer service; it traditionally also takes a high proportion of the total warehouse staff complement and is
expensive. The good design and management of picking systems and operations are consequently vital to effective
warehouse performance.
7. Sortation: This enables goods coming into a warehouse to be sorted into specific customer orders immediately on
arrival. The goods then go directly to order collation.
8. Packing and shipping: picked goods as per the customer orders are consolidated and packed according to customer
orders requirements. It is shipped according to customer orders and respective destinations.
9. Cross-docking: move products directly from the receiving to the shipping dock- these products are not at all stored in
the specific location.
10. Replenishment: this is the movement of goods in larger order quantities, for example a whole pallet at a time, from
reserve storage to order picking to ensure that order picking location do not become empty.
Order picking is a costly activity and typically it accounts for 50% to 55% of the direct labor costs of a warehouse
(Tompkins & al, 2003). And it may be further broken like this:
Table 2.1 Percentage of Order picking Activities
Source: (Frazelle E. , 1996)
Travel is by far the activity that takes up most of the order-picking time. Moreover, a fifth of the time is spent on
searching.
2.5) TYPES OF WAREHOUSE:
Raw material and component warehouses: It holds raw materials and always in a position to induct raw materials
onto a manufacturing or assembly process.
ACTIVITIES % OF ORDER-PICKING TIME
Travelling 55%
Searching 15%
Extracting 10%
Paper work and other activities 20%

ISSN 2394-9716
International Journal of Novel Research in Interdisciplinary Studies Vol. 5, Issue 1, pp: (11-30), Month: January - Feburary 2018, Available at: www.noveltyjournals.com
Page | 16 Novelty Journals
Work-in-process warehouses: This warehouses hold partially completed products and assemblies at various points
along production line or an assembly line.
Finished goods warehouses: It holds inventory usually to balance the variation between production schedules and
demand. Normally these warehouses are situated near manufacturing plant, and it is characterized by the flow of full
pallets in and full pallets out.
Distribution warehouses and distribution centers: Distribution warehouse accumulate products from various
manufacturing points for combined shipment to the common customer.
Fulfillment warehouses/fulfillment centers: It receives, pick and ship small orders for individual consumers.
2.6) FORMS OF WAREHOUSE:
One of the warehouse decisions is choosing the type or combination of types to use. There are three basic types of
warehousing: private, public and contract (Bloomberg et al., 2002).
Private warehouse: The firm producing or owning the goods owns private warehouses. This type of warehouse is
main focus on storing the firm‟s own goods until there are delivered or sold (Bloomberg et al., 2002). Coyle et al. (2003)
also stated that stability of warehouse demand must be examined over multiple products and another advantage of using a
private warehouse is the ability to maintain the physical control over the facility.
Public warehouse: warehouses which are run to store goods of the general public. Anyone can store his goods in these
warehouses on payment of rent. The reasons for using public warehousing which are: (1) avoid the capital investment and
financial risks; (2) flexibility of public warehousing (Coyle et al., 2003).
Contract warehouse: contract warehousing is one specialized form of public warehousing. Some reasons for the
growth of the contract warehouses are: (1) product seasonality; (2) geographic coverage requirements; (3) flexibility in
testing new marketing; (4) management expertise and dedicated resources; (5) off-balance sheet financing; (6) reductions
in transportation costs (Bloomberg et al., 2002).
2.6) CROSS DOCKING:
Cross docking is a form of warehousing where the storage function is nearly eliminated. As a result, in comparison to a
traditional warehouse, in a cross docking warehouse products flow almost directly or within a short period of time, from
the supplier to the customer(s) without being stored, they are not recorded as inventory and there is no need to be relabeled
or repacked (Boysen & Scholl, 2010).
Reeves (2007, p. 456) states that „„a cross dock is simply an intermediate staging area for freight‟‟.
The main issues in cross-docking are material handling and product flow. Especially for large operations the sheer number
of SKUs in "transit" at the warehouse can be over-whelming, and the flow can be a determining factor for the success.
Cross docking is further illustrated below
Figure 2.2: Cross Docking illustrated

ISSN 2394-9716
International Journal of Novel Research in Interdisciplinary Studies Vol. 5, Issue 1, pp: (11-30), Month: January - Feburary 2018, Available at: www.noveltyjournals.com
Page | 17 Novelty Journals
Most of the costs in cross-docking operations are directly related to labor. Cross-docking is not much concerned with
location and retrieval issues, as the product ideally flows right through without any need for storage (Bartholdi and
Hackman 2014).Since cross-docking relies on moving incoming goods to outgoing transportation (almost) immediately, it
does require strong coordination and support from suppliers (Richards 2014) in order to facilitate this.
2.7) REASONS WHY WE NEED WAREHOUSE:
According to „„Institute of logistics, Chennai‟ ‟warehousing is necessary due to the following reasons:
Seasonal production: You know that the agricultural commodities are harvested during certain seasons, but their
consumption or use takes place throughout the year. Therefore there is a need for proper storage or warehousing for these
commodities, from where they can be supplied as and when required.
Seasonal demand: There are certain goods, which are demanded seasonally, like woolen garments in winter and
umbrella in rainy season. The production of these goods takes place throughout the year to meet the seasonal demand. So
there is a need to store these goods in a warehouse to make them available at the time of need.
Large-scale production: In case of manufactured goods, now-a-days production takes place to meet the existing as
well as future demand of the products. Manufacturers also produce goods in huge quantity to enjoy the benefit of large
scale production which is more economical. So the finished products, which are produced on a large scale, need to be
stored properly till they are cleared by sales.
Quick supply: Both industrial as well as agricultural goods are produced at some specific places but consumed
throughout the country. Therefore, it is essential to stock these goods near the place of consumption, so that without
making any delay these goods are made available to the consumers at the time of their need.
Continuous production: Continuous production of goods in factories requires adequate supply of raw materials. So
there is a need to keep sufficient quantity of stock of raw material in a warehouse to ensure continuous production.
Price stabilization: To maintain a reasonable level of price of goods in the market there is a need to keep sufficient
stocks in the warehouses. Scarcity in supply of goods may increase their price in the market. Again, excess production and
supply may also lead to fall in prices of the product by maintaining a balance of supply of goods, warehousing leads to
price stabilization.
2.8) WAREHOUSE DESIGN AND LAYOUT:
Warehouse layout is a smaller field concerned with the internal design of the warehouse (Berg & Zijm, 1999). The main
goal is to reduce the amount of work associated with order picking. This can be achieved through a suitable and efficient
design, balancing the trade-offs between speed, travel distances, space utilization, handling, access, safety, risk and cost
(Richards, 2014).
According to Bloomberg et al. (2002), the objectives of warehouse layout and design should be as following:
i. Warehouse capacity utilization must be optimized
ii. Whatever is stored must be protected
iii. The layout should consider space utilization and stock placement
iv. The warehouse should be mechanized and automated as possible
v. The warehouse layout should lead to high productivity in receiving, storing, picking, and shipping
vi. The warehouse design should be flexible and allow for improvement
From the above objectives one can conclude that the most important issue to consider in the management of warehouse
layout is the proper utilization of space. This begins with a good warehouse visibility.
According to Baudin (2004), the warehouse visibility includes: labels on the grid of columns which are supporting the
ceiling, dock numbers that remains visible when docks are open, three-sided overhead zone identification signs, and
aisle/column/level labels on each slot in a pallet rack.
ISSN 2394-9716
International Journal of Novel Research in Interdisciplinary Studies Vol. 5, Issue 1, pp: (11-30), Month: January - Feburary 2018, Available at: www.noveltyjournals.com
Page | 18 Novelty Journals
2.9) APPLICATION OF PARETO PRINCIPLE AND ABC ANALYSIS:
In the nineteenth century, as an Italian economist and sociologist, Vilfredo Pareto gave birth to Pareto‟s Law, which is also
known as the 80/20 rule. He described the situation of unequal distribution of income that existed in Italy: 80 percent of
the wealth is owned by 20 percent of the people, and he found the similar phenomenon in farming: 80 percent of the peas
are yielded by 20 percent of the peapods in his garden. The Pareto principle points out many kinds of outputs are
dominated by few vital factors (Lai, 2009). JOSEPH JURAN first gave the name Pareto Principle and addressed the
relationship between relatively few critical elements and largest portion of the outcome are not always strictly 20/80
(Juran, 1975). The Pareto Principle already applies in many fields other than wealth distribution. For example, (Anschuetz,
1997) used the Pareto Principle to explain how to get more profit for marketers: marketers should focus more on the few
vital brands which could bring large portion of total profit for company. (Kuprenas & Kenney, 1999) applied the Pareto
Principle in quality management: focusing on a few kinds of defects that bring more unqualified products.
Dickie (1951) first used the term „„ABC analysis‟‟. ABC analysis which is also known as ABC classification is expanded
by Pareto analysis (Viale, 1996). ABC analysis is an inventory classification technique in which the items in inventory are
classified according to the dollar volume (Value) generated in Annual sales (Fuerst, 1981). Inventory classification
systems help allocate time and money in inventory management and allow firms to deal with multiple product lines and
multitude of stock-keeping units (SKU) (Bloomberg, 2002) .
When ABC analysis is applied to an inventory situation, it determines the importance of items and the level of control
placed on the items. ABC analysis divides research items into A, B and C groups that present different levels of
importance. A group is the most important items (the most used the best sellers or the most urgent to obtain in case of
necessity), B group is for items less used or which have a secondary importance and C group for items which are nearly
irrelevant. Items in group A are small in number, but occupy a large proportion of total revenue, in contrast, items in group
C are much larger in number, but account for a relatively small percentage of total revenue (Onwubulu & Dube, 2006) .
Fuerst (1981) summarized the process to do ABC analysis:
First, calculating total value for each kind of product,
Second, ranking items by the total value in descending order,
Third, calculating the percentage of total value for each item,
Last and dividing products into three groups according to certain classification criteria.
ABC uses dollars usage, the product of demand volume and unit price, as its primary metric (Collier and Evans, 2010).
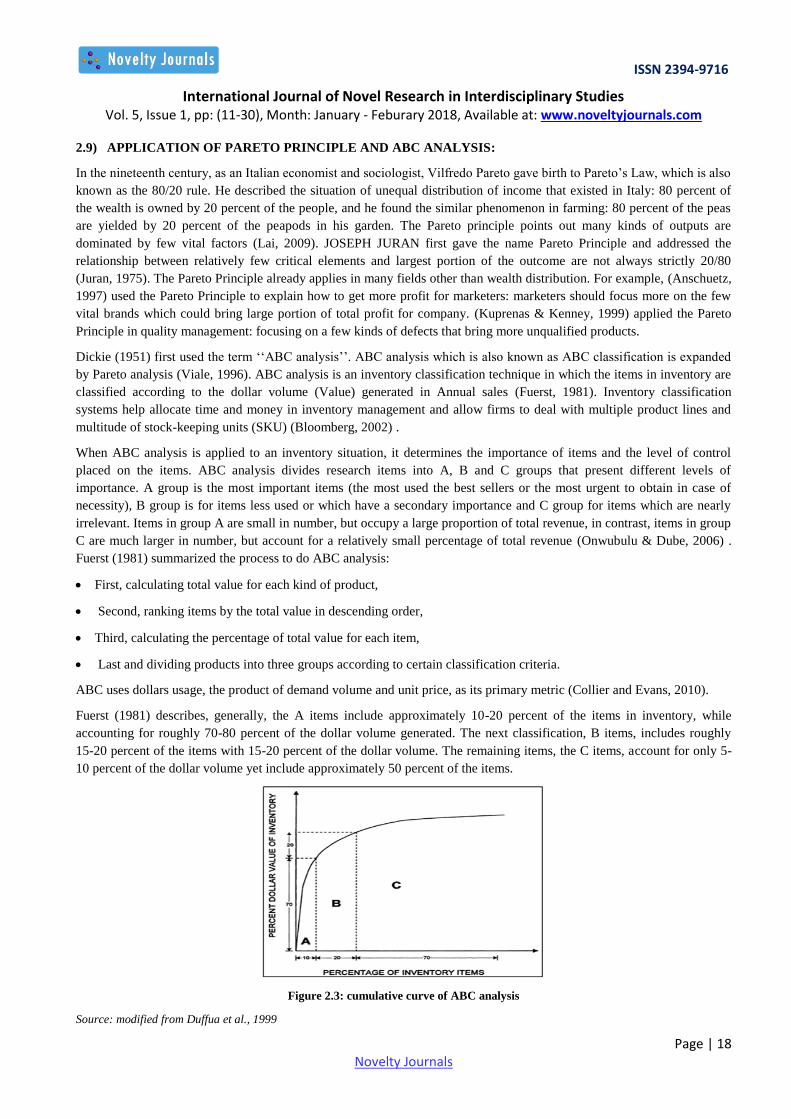
Fuerst (1981) describes, generally, the A items include approximately 10-20 percent of the items in inventory, while
accounting for roughly 70-80 percent of the dollar volume generated. The next classification, B items, includes roughly
15-20 percent of the items with 15-20 percent of the dollar volume. The remaining items, the C items, account for only 5-
10 percent of the dollar volume yet include approximately 50 percent of the items.
Figure 2.3: cumulative curve of ABC analysis
Source: modified from Duffua et al., 1999

ISSN 2394-9716
International Journal of Novel Research in Interdisciplinary Studies Vol. 5, Issue 1, pp: (11-30), Month: January - Feburary 2018, Available at: www.noveltyjournals.com
Page | 19 Novelty Journals
2.10) ABC ANALYSIS VARIANTS:
An equally critical analysis and management of all items will be very expensive for an organization and will have a
diffused effect regardless of priorities. Thus, there are some many products classification and categorization techniques
that exit to tackle important aspects more rigorously. Below are some of them,
2.11.1) FSN ANALYSIS:
FSN classification takes into account the pattern of issues from stores. The three letters stand for fast-moving, slow
moving and non-moving. This classification comes in very handy when we desire to control obsolescence. Items classified
as „S‟ and „N‟ require attention. There may be several reasons why an item has got into „N‟ category. There may have
been a change in technology or change in the specification or a particular spare part. When a FSN classification is made,
all such information stands out prominently, enabling managers to act it in the best interests of the organization.
FSN analysis ensures the following:
1. Periodic review of categorization under F.S.N.
2. Take appropriate action to increase number of orders (frequency) or quantity per order against fast moving items.
3. Close watch of slow moving items.
4. Find alternate use (substation) of slow moving items o that their usage rate can be increased.
5. Take appropriate actions, in time, to dispose of dead stock and prevent their stockpiling (Brindha, 2014)
2.11.2) HML ANALYSIS:
HML stands for High-Medium-Low. Here items are classified into three groups labelled as High, Medium and Low. The
HML analysis is very similar to the ABC analysis, the difference being instead of usage value, the price criterion is used.
In their classification, the items used by the company are arranged in descending orders of their unit price.
HML analysis must be carried out from any one of the following objectives or some of the objective as the case may be.
When it is desire that purchasing responsibility should be delegated to right level of people.
When it is desired to evolve purchasing policies then also HML analysis is carried out i.e. whether to purchase in exact
quantities as required or to purchase in EOQ or purchase only when absolutely necessary.
When the objective is to keep control over consumption at the department level then authorization to draw materials
from the stores will be given to high level H item, low level for L items and medium level for M item.
When it is desired to decide frequency of stock taking then very frequently H category, very rarely L category and
averagely M category.
When it is desired to arrange security arrangements for the items, then H item under lock and key, L items keep open
on the shop floor and under supervision for M items (Brindha, Inventory Management, 2014).
2.11.3) SDE ANALYSIS:
SDE (Scare-Difficult-Easy) analysis is an analysis carried out so as to take care of various purchasing problem that
normally come on day-to-day basis. Various purchasing problems that come on day- to- day basis are as follows:
(1) Non- availability.
(2) Scarcity.
(3) Longer lead-time.
(3) Geographically scattered.
(4) Unreliable sources or supply.
ISSN 2394-9716
International Journal of Novel Research in Interdisciplinary Studies Vol. 5, Issue 1, pp: (11-30), Month: January - Feburary 2018, Available at: www.noveltyjournals.com
Page | 20 Novelty Journals
Therefore, it would be better for manager to identify the materials posing the problems peculiar to them and then allot
these items for procurement purpose to those subordinates who can handle their judiciary.
And therefore from this angle point of view, the materials are classified into 3 categories namely: „„S‟‟-Scare materials are
those materials, which are hardly available.
„„D‟‟-Difficult materials are those materials, which are available with difficulty.
„„E‟‟-Easy materials are those materials, which are available easily.
Scarce materials: Are normally in short in supply. They can be imported material or have to be procuring through
government agencies or authorities. Therefore such materials have to be procuring in less number of purchases say once in
a year because it involves lots of efforts and expenditure every time when they are tried to be procured.
Difficult Materials -Are those materials which are not easy to procure but are available indigenously. These are those
materials, which have to come from far off distances, and for them reliable sources are good on existing. These items
require sufficient notice in advance for their procurement.
Easy Materials-Are those materials, which are readily available and are also standard materials and in their case there
supply or availability is much more than their demand in market. These are also available in local market.
Once S.D.E. analysis are carried out and items are identified then decisions can be made or which subordinate should
purchase which materials on regular analysis. S.D.E. analysis also helps to decide purchasing policies. For Scarce
materials forward purchasing policies can be adopted. For Difficult materials, schedule-purchasing policies can be adopted
and for Easy group of items, contract-purchasing policies can be adopted (Brindha, Inventory Management, 2014).
3. RESEARCH METHODOLOGY
3.1) RESEARCH APPROACH AND DESIGN:
The research design is the overall strategy chosen or adopted to undertake the research. During the research, the case study
research design was adopted.
A case study is an in-depth study of a particular research problem rather than a sweeping statistical survey which is often
used to narrow down a very broad field of research. For the purpose of this study, CHOCOCAM Ltd Douala is used as a
case study to narrow the research scope.
To achieve the research objectives, both qualitative and quantitative research methods will be used.
In order to bring out the effectiveness of the ABC cross analysis on products allocation, it is essential to quantify the data
and make accurate calculations. Otherwise, the solution suggested might be vague.
The quantitative method applied is the use of ABC analysis and ABC CROSS analysis. ABC analysis is used to:
Firstly classify items based on their sales value,
Secondly to classify items based on their order frequency value.
To have more significant information and efficiently allocate items in the warehouse, the couple of the two previous
analyses was implemented, that is the ABC cross analysis.
The qualitative method used in this research is observation and interview:
The observation was mainly done on the field; the observation was focused on how they (CHOCOCAM) store their
products in the warehouse. Products were being stored in a randomly manner which impeded their smooth flow.
Interview was very quick and brief; it was mainly focus on of what the researcher has been observed.
3.2) RESEARCH SAMPLES AND SAMPLING PROCEDURE:
To select people for this study, purposive sampling technique was selected. This is the most common sampling method
(Marshall, 1996). Using this tactic, the researcher selects the most suitable candidates for interview according to their

ISSN 2394-9716
International Journal of Novel Research in Interdisciplinary Studies Vol. 5, Issue 1, pp: (11-30), Month: January - Feburary 2018, Available at: www.noveltyjournals.com
Page | 21 Novelty Journals
position, experience etc. It was selective because, in order to clearly understand how products are being managed in the
warehouse the respondent has to be someone familiar in the field.
In this case, only two candidates were enough. This decision was made due to these reasons:
The questions are very concise; the main objective is to collect stocks data.
Among the employees of CHOCOCAM, the persons selected have the most credibility in this field.
The respondents managed to answer and provide all relevant information needed concerning the management of stocks
in the warehouse.
The respondents have years of experience within their profession.
The respondents selected for the study and who agreed to collaborate with the researcher are: the warehouse manager and
the manager of purchases of CHOCOCAM Ltd.
3.3) DATA COLLECTION METHOD:
Data collection refers to the whole process of preparing and collecting topic related information in order to serve as a basis
of analysis and help to make decisions about a specific topic.
To collect the data for this research, both secondary and primary source of information were used.
3.3.1) SECONDARY SOURCE:
Secondary source like theoretical background information was obtained from reviewed literature due to the various
techniques adopted during the research and also on related literature on warehouse management.
3.3.2) PRIMARY SOURCE:
Primary data was requested and obtained from CHOCOCAM‟s sales report. The relevant stock data obtained for analysis
includes;
Coded listed items
Unit cost
Annual usage
Order frequency
3.4) METHOD USED IN DATA ANALYSIS:
Data collected for this research was analyzed using ABC analysis and cross analysis.
Before cross analyzing the data, the researcher first analyzed them based on the rules drawn from the ABC analysis
Here, the ABC analysis was applied twice; the first analysis was based on usage value and the second one based on order
frequency value.
3.4.1) ABC ANALYSIS:
ABC Analysis is a simple way to classify items (products, files, folders or anything) used when we want to optimize the
layout of our inventory or warehouse according to their degree of importance. Its purpose is to organize the stock products
to reduce the time that workers are going to need to manage their product (the time to keep, search, obtain or move items
in the warehouse or shelves).
How are products classified?
Products are classified into 3 classes which are:
Class A: most important items (items that usually give to the company the most amount of profit).
Class B: items which have a secondary (moderate) importance.
ISSN 2394-9716
International Journal of Novel Research in Interdisciplinary Studies Vol. 5, Issue 1, pp: (11-30), Month: January - Feburary 2018, Available at: www.noveltyjournals.com
Page | 22 Novelty Journals
Class C: items of least importance
What are the rules applied?
Items are classified from A to C based on the following rules:
Class A items: 10% to 20% of the items represent 70% to 80% of the usage value
Class B items: 15% to 20% of the items represent 15% to 20% of the usage value.
Class C items: The remaining number of the items represents 5% to 10% of the usage value.
3.4.2.) ABC ANALYSIS PROCEDURAL STEPS:
ABC analysis procedural steps are as follow:
Step 1: determine the annual usage or demand for each item
Step 2: determine the annual usage value of each item following the formula below
Annual usage value = Annual demand x Unit price
Step 3: calculate the annual percentage value of each item
Step 4: Sort the items according to their annual Percentage Value in descending order.
Step 5: Calculate the Cumulative annual percentage value.
Step 6: Examine the annual percentage value distribution and group the items into three classes A, B and C.
Step 7: Draw a graph connecting Cumulative annual % and Cumulative % of items. The graph is divided approximately
into three segments, A, B and C.
3.4.3) ABC CROSS ANALYSIS:
Storing products in a warehouse using randomly manner, displaying them in a non-designated fixed location brings out
excess movement and work when products are requested.
There are some products that need to be stored in more convenient and known location and workers can learn the layout ,
all of which makes work more efficient.
ABC cross analysis integrates the information of the two previous analyzes (ABC analysis). It leads to items classification
in more classes, so as to perform a more detailed analysis. In particular the items are prearranged in a matrix that defines
the following classes: AA, AB, AC, BA, BB, BC, CA, CB, and CC. It is a way to have a very complete set of information
in order to prioritize the items to focus on and having good results in terms of allocating them in the warehouse.
Here, AA products are those that generate the most sales and are sold most frequently. Consequently, they are placed in a
most convenient position in a warehouse.CC products on the other hand referred to those that are sold the least and are
moved less frequently. Therefore, they have different management and displacement.
4. DATA ANALYSIS AND PRESENTATION OF FINDINGS
4.1) COMPANY PROFILE:
CHOCOCAM (Chocolate confectionery Cameroon) is one of the most leading companies dominating the cocoa industry
in Cameroon. It is located in Douala (Zone Bassa) and has a superficies of 12000m2. Chococam is specialized in the
manufacture of chocolate-based products and various sweets from cocoa mass. It manufactures a wide range of products;
more than 100 different items such as Boncar toffee, Bonbon TomTom, Mambo noire… the company uses a number of
products and testing standards to meet the needs of domestic and foreign market. To better manage the gap between
production and consumption, Chococam boasts of many warehouses. The company has a 30,500 sq. ft finished products
warehouse operated manually.
ISSN 2394-9716
International Journal of Novel Research in Interdisciplinary Studies Vol. 5, Issue 1, pp: (11-30), Month: January - Feburary 2018, Available at: www.noveltyjournals.com
Page | 23 Novelty Journals
However, determining the exact location of each different products being stored in Chococam warehouse, results in the
warehouse manager and workers putting in more time and effort to allocate each of them, this brings out extra time in
searching and moving products from their different location.
The researcher main focus was to classify those items into different classes using the ABC analysis model based on their
sales and order frequency value, and to later crossing them to get more complete information for a better products
allocation.
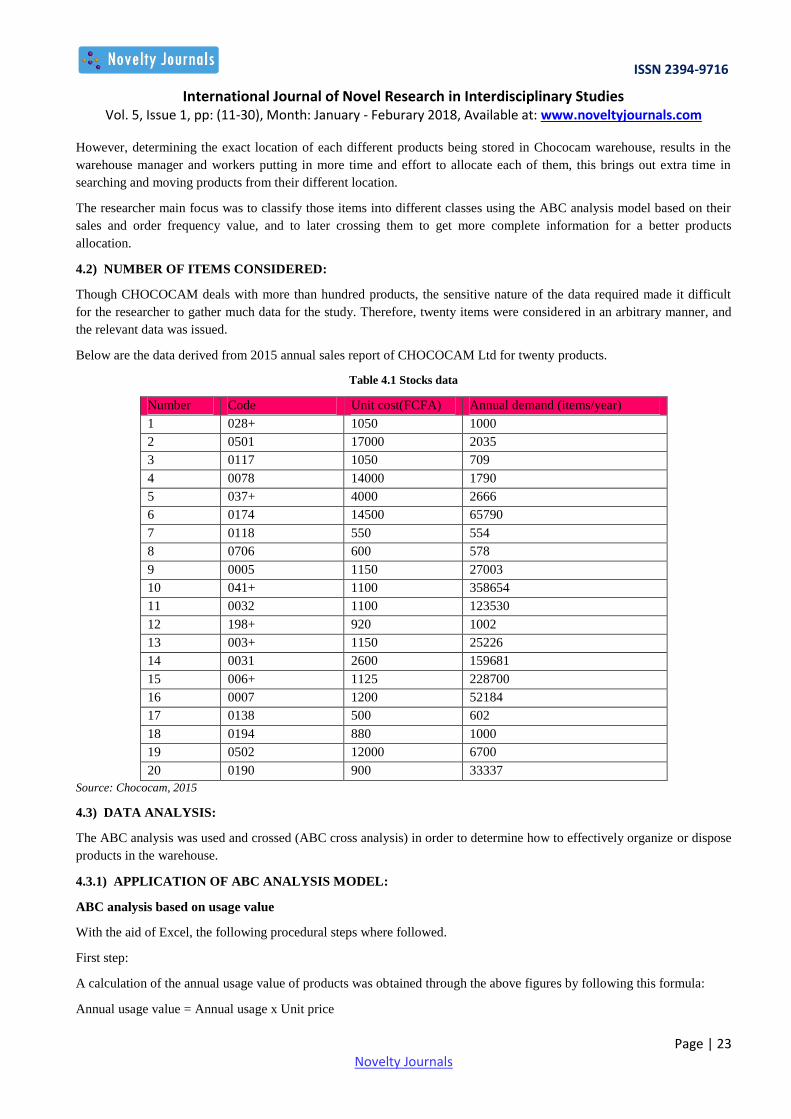
4.2) NUMBER OF ITEMS CONSIDERED:
Though CHOCOCAM deals with more than hundred products, the sensitive nature of the data required made it difficult
for the researcher to gather much data for the study. Therefore, twenty items were considered in an arbitrary manner, and
the relevant data was issued.
Below are the data derived from 2015 annual sales report of CHOCOCAM Ltd for twenty products.
Table 4.1 Stocks data
Number Code Unit cost(FCFA) Annual demand (items/year)
1 028+ 1050 1000
2 0501 17000 2035
3 0117 1050 709
4 0078 14000 1790
5 037+ 4000 2666
6 0174 14500 65790
7 0118 550 554
8 0706 600 578
9 0005 1150 27003
10 041+ 1100 358654
11 0032 1100 123530
12 198+ 920 1002
13 003+ 1150 25226
14 0031 2600 159681
15 006+ 1125 228700
16 0007 1200 52184
17 0138 500 602
18 0194 880 1000
19 0502 12000 6700
20 0190 900 33337
Source: Chococam, 2015
4.3) DATA ANALYSIS:
The ABC analysis was used and crossed (ABC cross analysis) in order to determine how to effectively organize or dispose
products in the warehouse.
4.3.1) APPLICATION OF ABC ANALYSIS MODEL:
ABC analysis based on usage value
With the aid of Excel, the following procedural steps where followed.
First step:
A calculation of the annual usage value of products was obtained through the above figures by following this formula:
Annual usage value = Annual usage x Unit price

ISSN 2394-9716
International Journal of Novel Research in Interdisciplinary Studies Vol. 5, Issue 1, pp: (11-30), Month: January - Feburary 2018, Available at: www.noveltyjournals.com
Page | 24 Novelty Journals
Table 4.2 Annual usage values (FCFA)
Codes Unit cost (FCFA) Annual usage Annual usage value (FCFA)
028+ 1050 1000 1050000
0501 17000 2035 34595000
0117 1050 709 744450
0078 14000 1790 25060000
037+ 4000 2666 10664000
0174 14500 65790 953955000
0118 550 554 304700
0706 600 578 346800
0005 1150 27003 31053450
041+ 1100 358654 394519400
0032 1100 123530 135883000
198+ 920 1002 921840
003+ 1150 25226 29009900
0031 2600 159681 415170600
006+ 1125 228700 257287500
0007 1200 52184 62620800
0138 500 602 301000
0194 880 1000 880000
0502 12000 6700 80400000
0190 900 33337 30003300
After the previous calculation, the items where then structured in a diminishing order through their annual usage value.
A calculation of the percentage of annual usage value and the cumulative percentage of this value where performed in
order to conclude the analysis.
Table 4.3 Percentage and cumulative percentage of annual usage value
Code Unit cost
(FCFA)
Annual
Usage
Annual Usage
value (FCFA)
% Annual Usage
value
Cumulative
% of AUV
% of items
0174 14500 65790 953,955,000 38.70% 38.70% 5%
0031 2600 159681 415,170,600 16.84% 55.54% 10%
041+ 1100 358654 394,519,400 16.01% 71.55% 15%
006+ 1125 228700 257,287,500 10.44% 81.99% 20%
0032 1100 123530 135,883,000 5.51% 87.50% 25%
0502 12000 6700 80400000 3.26% 90.76% 30%
0007 1200 52184 62620800 2.54% 93.30% 35%
0501 17000 2035 34595000 1.40% 94.71% 40%
0005 1150 27003 31053450 1.26% 95.97% 45%
0190 900 33337 30003300 1.22% 97.19% 50%
003+ 1150 25226 29009900 1.18% 98.36% 55%
0078 14000 1790 25060000 1.02% 99.38% 60%
037+ 4000 2666 10664000 0.43% 99.81% 65%
028+ 1050 1000 1050000 0.04% 99.85% 70%
198+ 920 1002 921840 0.04% 99.89% 75%
0194 880 1000 880000 0.04% 99.93% 80%
0117 1050 709 744450 0.03% 99.96% 85%
0706 600 578 346800 0.01% 99.97% 90%
0118 550 554 304700 0.01% 99.98% 95%
0138 500 602 301000 0.01% 100.00% 100%
TOTAL 2464770740 100%
ISSN 2394-9716
International Journal of Novel Research in Interdisciplinary Studies Vol. 5, Issue 1, pp: (11-30), Month: January - Feburary 2018, Available at: www.noveltyjournals.com
Page | 25 Novelty Journals
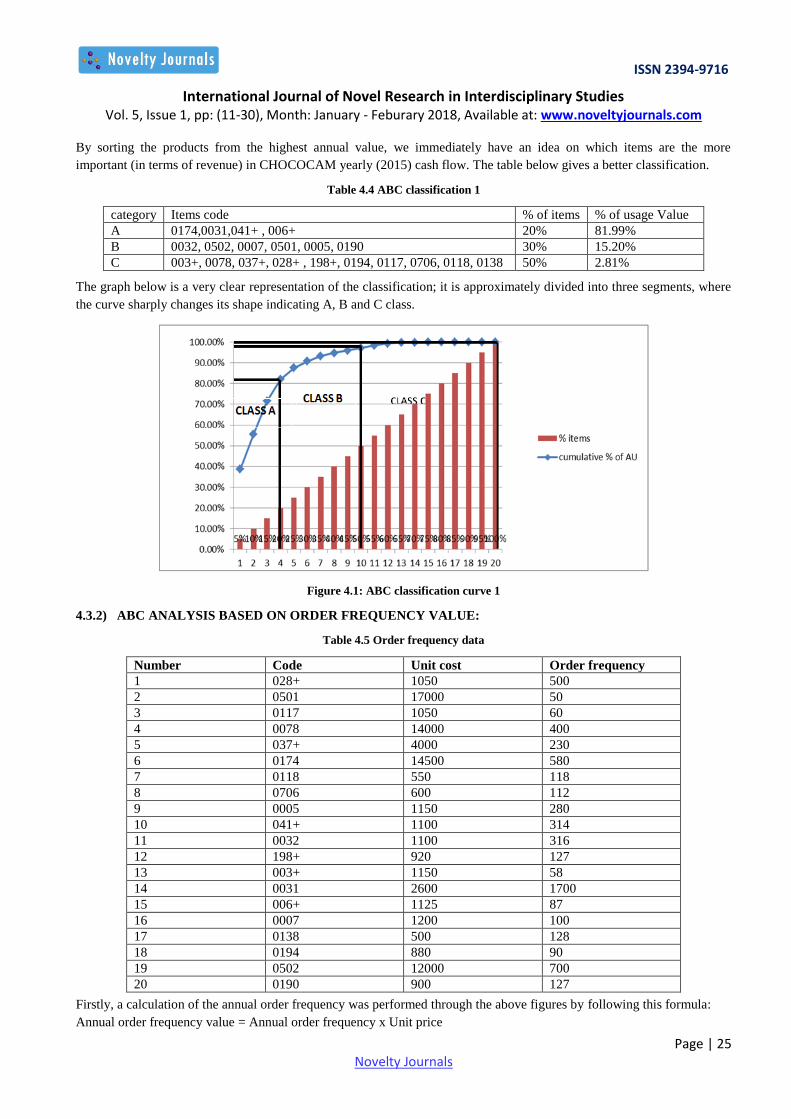
By sorting the products from the highest annual value, we immediately have an idea on which items are the more
important (in terms of revenue) in CHOCOCAM yearly (2015) cash flow. The table below gives a better classification.
Table 4.4 ABC classification 1
category Items code % of items % of usage Value
A 0174,0031,041+ , 006+ 20% 81.99%
B 0032, 0502, 0007, 0501, 0005, 0190 30% 15.20%
C 003+, 0078, 037+, 028+ , 198+, 0194, 0117, 0706, 0118, 0138 50% 2.81%
The graph below is a very clear representation of the classification; it is approximately divided into three segments, where
the curve sharply changes its shape indicating A, B and C class.
Figure 4.1: ABC classification curve 1
4.3.2) ABC ANALYSIS BASED ON ORDER FREQUENCY VALUE:
Table 4.5 Order frequency data
Number Code Unit cost Order frequency
1 028+ 1050 500
2 0501 17000 50
3 0117 1050 60
4 0078 14000 400
5 037+ 4000 230
6 0174 14500 580
7 0118 550 118
8 0706 600 112
9 0005 1150 280
10 041+ 1100 314
11 0032 1100 316
12 198+ 920 127
13 003+ 1150 58
14 0031 2600 1700
15 006+ 1125 87
16 0007 1200 100
17 0138 500 128
18 0194 880 90
19 0502 12000 700
20 0190 900 127
Firstly, a calculation of the annual order frequency was performed through the above figures by following this formula:
Annual order frequency value = Annual order frequency x Unit price
ISSN 2394-9716
International Journal of Novel Research in Interdisciplinary Studies Vol. 5, Issue 1, pp: (11-30), Month: January - Feburary 2018, Available at: www.noveltyjournals.com
Page | 26 Novelty Journals
Table 4.6 Order frequency value (FCFA)
Code Unit cost (FCFA) Order frequency Order frequency value (FCFA)
028+ 1,050 500 525,000
0501 17,000 50 850,000
0117 1,050 60 63,000
0078 14,000 400 5,600,000
037+ 4,000 230 920,000
0174 14,500 580 8,410,000
0118 550 118 64900
0706 600 112 67,200
0005 1,150 280 322,000
041+ 1100 314 345,400
0032 1,100 316 347,600
198+ 920 127 116,840
003+ 1150 58 66,700
0031 2,600 1700 4,420,000
006+ 1125 87 97,875
0007 1200 100 120000
0138 500 128 64,000
0194 880 90 79,200
0502 12000 700 8,400,000
0190 900 127 114,300
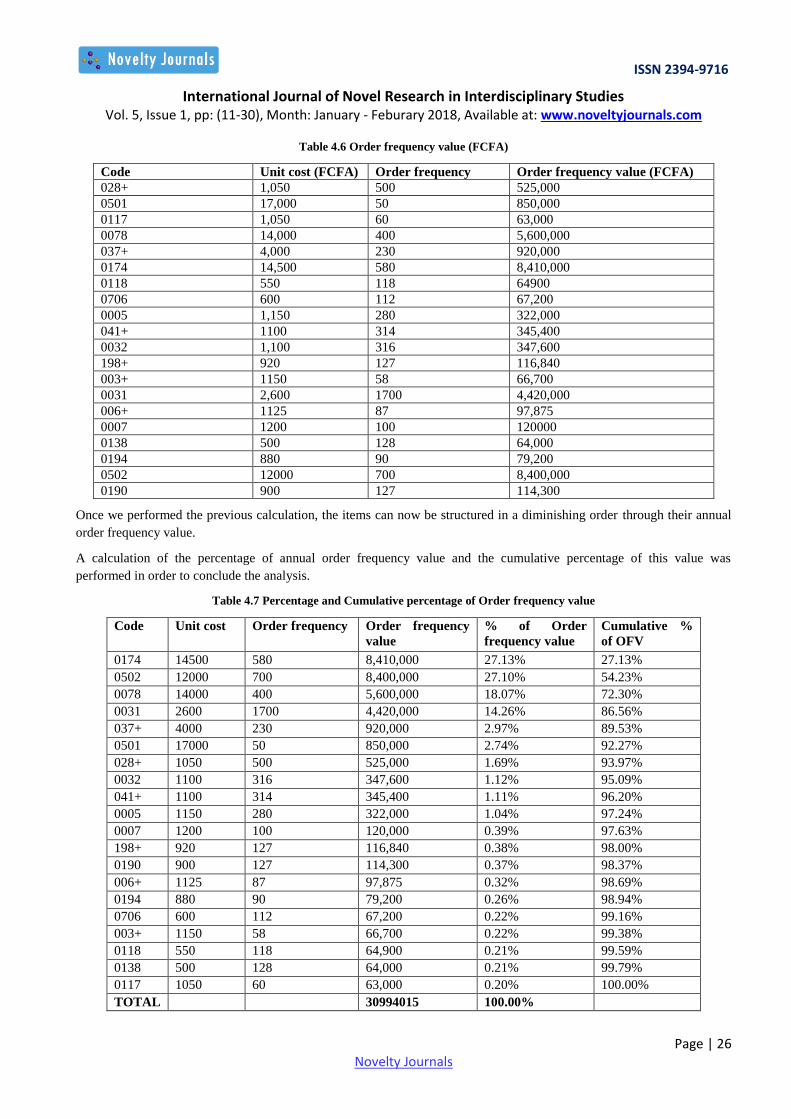
Once we performed the previous calculation, the items can now be structured in a diminishing order through their annual
order frequency value.
A calculation of the percentage of annual order frequency value and the cumulative percentage of this value was
performed in order to conclude the analysis.
Table 4.7 Percentage and Cumulative percentage of Order frequency value
Code Unit cost Order frequency Order frequency
value
% of Order
frequency value
Cumulative %
of OFV
0174 14500 580 8,410,000 27.13% 27.13%
0502 12000 700 8,400,000 27.10% 54.23%
0078 14000 400 5,600,000 18.07% 72.30%
0031 2600 1700 4,420,000 14.26% 86.56%
037+ 4000 230 920,000 2.97% 89.53%
0501 17000 50 850,000 2.74% 92.27%
028+ 1050 500 525,000 1.69% 93.97%
0032 1100 316 347,600 1.12% 95.09%
041+ 1100 314 345,400 1.11% 96.20%
0005 1150 280 322,000 1.04% 97.24%
0007 1200 100 120,000 0.39% 97.63%
198+ 920 127 116,840 0.38% 98.00%
0190 900 127 114,300 0.37% 98.37%
006+ 1125 87 97,875 0.32% 98.69%
0194 880 90 79,200 0.26% 98.94%
0706 600 112 67,200 0.22% 99.16%
003+ 1150 58 66,700 0.22% 99.38%
0118 550 118 64,900 0.21% 99.59%
0138 500 128 64,000 0.21% 99.79%
0117 1050 60 63,000 0.20% 100.00%
TOTAL 30994015 100.00%

ISSN 2394-9716
International Journal of Novel Research in Interdisciplinary Studies Vol. 5, Issue 1, pp: (11-30), Month: January - Feburary 2018, Available at: www.noveltyjournals.com
Page | 27 Novelty Journals
By sorting the products from the highest annual order frequency value, we immediately have an idea on which items are
the more important (in terms of revenue) in CHOCOCAM yearly (2015) cash flow. The table below gives a better
classification.
Table 4.8 ABC classification 2
Category Items Code % of Order Frequency Demand value cumulative % of items
CLASS A 0174, 0502, 0078, 0031 86.56% 20%
CLASS B O37+, 0501, 028+, 0032, 041+, 0005 10.68% 30%
CLASS C 0007, 198+, 0190, 006+, 0194, 0706,
003+ , 0118, 0138, 0117
2.76% 50%
The graph below is a very clear representation of the classification; it is approximately divided into three segments, where
the curve sharply changes its shape indicating A, B and C class.
Figure 4.2: ABC classification curve 2
4.4 ABC CROSS ANALYSIS:
Here, the cross analysis is a way to have a very complete set of information in order to prioritize on certain items and
having effective products organization structure in the warehouse. It integrates the information of the two previous
analyses and leads to items classification in more classes, so as to perform a more detailed analysis.
Table 4.9 ABC cross Analysis
ISSN 2394-9716
International Journal of Novel Research in Interdisciplinary Studies Vol. 5, Issue 1, pp: (11-30), Month: January - Feburary 2018, Available at: www.noveltyjournals.com
Page | 28 Novelty Journals
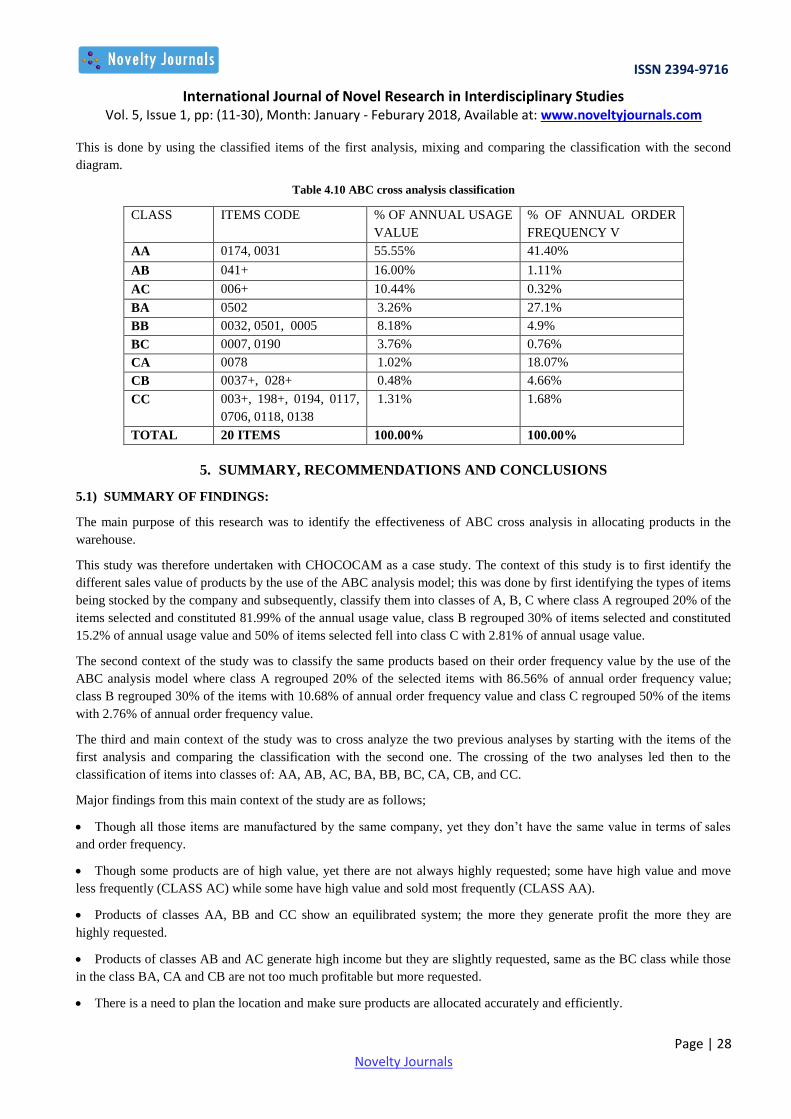
This is done by using the classified items of the first analysis, mixing and comparing the classification with the second
diagram.
Table 4.10 ABC cross analysis classification
CLASS ITEMS CODE % OF ANNUAL USAGE
VALUE
% OF ANNUAL ORDER
FREQUENCY V
AA 0174, 0031 55.55% 41.40%
AB 041+ 16.00% 1.11%
AC 006+ 10.44% 0.32%
BA 0502 3.26% 27.1%
BB 0032, 0501, 0005 8.18% 4.9%
BC 0007, 0190 3.76% 0.76%
CA 0078 1.02% 18.07%
CB 0037+, 028+ 0.48% 4.66%
CC 003+, 198+, 0194, 0117,
0706, 0118, 0138
1.31% 1.68%
TOTAL 20 ITEMS 100.00% 100.00%
5. SUMMARY, RECOMMENDATIONS AND CONCLUSIONS
5.1) SUMMARY OF FINDINGS:
The main purpose of this research was to identify the effectiveness of ABC cross analysis in allocating products in the
warehouse.
This study was therefore undertaken with CHOCOCAM as a case study. The context of this study is to first identify the
different sales value of products by the use of the ABC analysis model; this was done by first identifying the types of items
being stocked by the company and subsequently, classify them into classes of A, B, C where class A regrouped 20% of the
items selected and constituted 81.99% of the annual usage value, class B regrouped 30% of items selected and constituted
15.2% of annual usage value and 50% of items selected fell into class C with 2.81% of annual usage value.
The second context of the study was to classify the same products based on their order frequency value by the use of the
ABC analysis model where class A regrouped 20% of the selected items with 86.56% of annual order frequency value;
class B regrouped 30% of the items with 10.68% of annual order frequency value and class C regrouped 50% of the items
with 2.76% of annual order frequency value.
The third and main context of the study was to cross analyze the two previous analyses by starting with the items of the
first analysis and comparing the classification with the second one. The crossing of the two analyses led then to the
classification of items into classes of: AA, AB, AC, BA, BB, BC, CA, CB, and CC.
Major findings from this main context of the study are as follows;
Though all those items are manufactured by the same company, yet they don‟t have the same value in terms of sales
and order frequency.
Though some products are of high value, yet there are not always highly requested; some have high value and move
less frequently (CLASS AC) while some have high value and sold most frequently (CLASS AA).
Products of classes AA, BB and CC show an equilibrated system; the more they generate profit the more they are
highly requested.
Products of classes AB and AC generate high income but they are slightly requested, same as the BC class while those
in the class BA, CA and CB are not too much profitable but more requested.
There is a need to plan the location and make sure products are allocated accurately and efficiently.

ISSN 2394-9716
International Journal of Novel Research in Interdisciplinary Studies Vol. 5, Issue 1, pp: (11-30), Month: January - Feburary 2018, Available at: www.noveltyjournals.com
Page | 29 Novelty Journals
There are some products that need to be stored in a more convenient location while others can be subsequently store in
the less convenient place.
5.2) CONCLUSION:
The ABC cross analysis is relatively effective and efficient in terms of products allocation in the warehouse. It helps the
management to organize the stock products to reduce the time that the workers are going to need to manage all of them
(the time to keep, search, obtain or move items in the warehouse). After implementing it, different items are allocated in a
different location. For instance, the high-runner items (AA items) are placed at the easiest accessible and most secured
location, while low-demand items (CC items) are allocated farther because the need to dispose of them is less urgent, this
reduces the expected retrieval time.
5.3) RECOMMENDATIONS:
The recommendations generated based on the findings of the study which was piloted by the researcher on the topic “THE
EFFECTIVENESS OF ABC CROSS ANALYSIS ON ALLOCATION OF PRODUCTS IN THE WAREHOUSE” are as
follows;
There is a need for CHOCOCAM to efficiently manage their stocks; class A items which are the highest value items
encounter for 81.99% of the annual value but are just 20% while class C items are more (50%) than the profit (2.81%) they
bring. Therefore they need to focus their production and management on A items, a bit on B items and a little bit on C
items.
ABC cross analysis should be implemented at the company to enable them to identify the degree of importance of
items and classify them accordingly.
Furthermore products should be classified into classes of AA, AB, AC, BA, BB, BC, CA, CB and CC in a way that is
suitable and right for their warehouse.
Finally, workers should learn the products layout to efficiently and effectively utilize space in the warehouse and to avoid
unnecessary work and movement.
REFERENCES
[1] Ackerman. (2004). Auditing warehouse performance. KB Ackerman.
[2] Administration, L. o. (2015).
[3] Alpan, G., & al. (2011). Heuristic solutions for transshipment problems in a multiple door cross docking warehouse.
[4] Anschuetz, N. (1997). Profiting from the 80-20 rule of thumb. Advertising research , 37(6): 51-56.
[5] Auditing warehouse performance. (2004). KB Ackerman company.
[6] Berg, J. V., & Zijm. (1999). Models for warehouse management: Classification and examples”. Production
Economics 59, 519-528.
[7] Bloomberg, &. H. (2002). Logistics. Upper Saddle River: Prentice Hall.
[8] bodnar, p. (2013). Essays on Warehouse Operations. nungua: Members of the committee Prof.
[9] Boysen, N. M., & Scholl, A. (2010).
[10] Brindha, D. G. (2014). Inventory Management. International journal of innovative research in Science, Engineering
and Technology.
[11] Brindha, D. G. (2014). Inventory Management. international journal of innovative research in science, Engineering
and Technology.
[12] Brindha, D. G. (2014). Inventory Management.

ISSN 2394-9716
International Journal of Novel Research in Interdisciplinary Studies Vol. 5, Issue 1, pp: (11-30), Month: January - Feburary 2018, Available at: www.noveltyjournals.com
Page | 30 Novelty Journals
[13] Burt, D. D., & Starling. (2003). World Class Supply Management: The Key to Supply Chain Management. McGraw
Hill/Irwin. Mc Graw Hill/ Irwin.
[14] Coyle, J. J., & Bardi, j. (1980). The management of business Logistics. 2nd edition. West Publishing Company.
[15] Frazelle, E. (1996). World-class warehousing. Atlanta, GA: Logistics resources international.
[16] Frazelle, E. (2002). World-class warehousing and material handling. New York: Mc Graw-Hill.
[17] Fuerst, W. L. (1981). Small business get a new look at ABC analysis for inventory control. Journal of Small Business
Management (pre-1986) , 19.
[18] Grant. (2006).
[19] Johnson & Pyke, D. (2001). Supply chain Management: Integration and Globalization in the age of eBusiness. Tuck
school of business working paper.
[20] Juran, J. (1975). The non-Pareto Principle; mea culpa. Quality progress, 8-9.
[21] Kuprenas, J., & Kenney. (1999). A pareto analysis of spacecraft component manufacturing defects . project
management, 30(2).
[22] Lai, K.-h. a. (2009). Just-in-time logistics. Abingdon, Oxon,. Ashgate Publishing Group.
[23] Lambert, D. M., & Ellram, L. M. (1998). Fundamentals of Logistics Management. Boston, MA: Irwin/ Mc Graw-
Hill.
[24] Larson, P., & Poist, R. &. (2007). Perspective on Logistics , A survey of SCM professionals. Business Logistics,
28(1).
[25] Lean manufacturing. (n.d.). Retrieved from http://www.leanlab.name.
[26] Muller, M. (2011). Essentials of inventory Management. 2nd Edition. AMACON.
[27] Murray, M. (2006). Functionality and Technical configuration. Fort lee(N J), USA: Galileo Press-SAP Press.
[28] Onwubulu, G., & Dube, B. &. (2006). Implementing an Improved Inventory Control System in a Small Company: A
Case Study. Production Planning & Control. .
[29] Richards, G. (2014). Warehouse Management. 2nd ed. Kogan page.
[30] Tompkins, & Smith. (1998). Warehouse management hand book.
[31] Tompkins, J. A., & al, e. (2003). Facilities Planning. 3rd edition. John Wiley & Sons.
[32] Tsui, & Chang. (1992). An optimal solution to a dock door assignment problem.
[33] Van Den Berg. (2013). competitive warehouse management.
[34] Viale, J. (1996). Inventory management: From warehouse to distribution center. Menlo Park, CA, USA: Course
technology/Cengage learning.