THE EFFECT OF NONUNIFORM AXIAL HEAT FLUX ... - CORE
247
THE EFFECT OF NONUNIFORM AXIAL HEAT FLUX )ISTRIBUTION NEIL E. TODREAS WARREN M. ROHSENOW SEPTEMBER 20, 1965 CONTRACT NsG-496 REPORT NO. 9843-37 DEPARTMENT OF MECHANICAL ENGINEERING MASSACHUSETTS INSTITUTE OF TECHNOLOGY ENGINEERING PROJECTS LABORATORY NGINEERING PROJECTS LABORATOR' 'IGINEERING PROJECTS LABORATO' INEERING PROJECTS LABORAT' 'NEERING PROJECTS LABORA 'EERING PROJECTS LABOR 'ERING PROJECTS LABO' 'RING PROJECTS LAB' ING PROJECTS LA IG PROJECTS L i PROJECTS L PROJECTS ROJEC' ')JEr
-
Upload
khangminh22 -
Category
Documents
-
view
0 -
download
0
Transcript of THE EFFECT OF NONUNIFORM AXIAL HEAT FLUX ... - CORE

THE EFFECT OF NONUNIFORMAXIAL HEAT FLUX )ISTRIBUTION
NEIL E. TODREASWARREN M. ROHSENOW
SEPTEMBER 20, 1965
CONTRACT NsG-496REPORT NO. 9843-37DEPARTMENT OFMECHANICAL ENGINEERINGMASSACHUSETTS INSTITUTEOF TECHNOLOGY
ENGINEERING PROJECTS LABORATORYNGINEERING PROJECTS LABORATOR''IGINEERING PROJECTS LABORATO'
INEERING PROJECTS LABORAT''NEERING PROJECTS LABORA
'EERING PROJECTS LABOR'ERING PROJECTS LABO'
'RING PROJECTS LAB'ING PROJECTS LA
IG PROJECTS Li PROJECTS L
PROJECTSROJEC'
')JEr

TECHNICAL REPORTNO. 9843-37
THE EFFECT OF NONUNIFORM AXIAL HEAT FLUX DISTRIBUTION
ON THE CRITICAL HEAT FLUX
by
Neil E, Todreas
Warren M. Robsenow
Support extended by the
National Association for the Advancement of Science
under Contract NsG-496 with the
Center for Space Research
DSR Project No. 9843
September 20, 1965
Department of Mechanical Engineering
Massachusetts Institute of Technology
Cambridge 39, Massachusetts

ii
Abstract
A systematic experimental and analytic investigation ofthe effect of nonuniform axial heat flux distribution oncritical heat rilux was performed with water in the qualitycondition. Utilizing a model which ascribes the criticalcondition, to either a nucleation-induced disruption of theannular liquid film or annular film dryout, the experimentalresults taken at low pressures (50-200 psia) were confirmed.Application of this model to higher pressure conditions(500-2000 psia) indicated qualitative agreement with availabledata of other investigators.
Experimental data was obtained for flux distributionsrepresenting cosine, linear increasing and decreasing, inletand exit peaked, spike and uniform shapes. These flux distrib-utions were achieved by electrical resistance heating of testsections whose outside diameter had been machined to the re-quired dimensions.. In each case the critical location as wellas the total critical power was obtained by testing the tubesin vertical upflow to failure.
The analytic prediction of the results for all flux shapeshas been achieved by development of a model which considers theeffect of nucleation within the annular film. It is thown thatthe occurrence of the critical condition is related to the localdegree of nucleation (the ratio of the local flux to the fluxrequired to cause nucleation at the local conditions) and thelocal film flow rate. Both the experimental total critical powerand the critical location are confirmed by this model. Theresults indicate that the total critical power for the outletpeaked flux distributions tested (ratios of maximum to minimumflux of 2, 4, and 5.75 to 1) can be 15 to 30% lower than foruniform flux distributions at comparable hydrodynamic operatingconditions. In addition, from this model for given operatingconditions, a locus of critical conditions can be constructedfrom uniform flux distribution data which will enable predic-tion of the performance of nonuniform flux distributions atsimilar conditions of mass velocity, pressure and diameter.

iii
ACKNOWLEDGEMENT
Support for this study was extended to the Massachusetts
Institute of Technology by the National Aeronautics and Space
Administration under contract with the Center for Space Re-
search. In addition support to facilitate initiation of the
study.was provided by the Shell Companies Foundation. This
study was done in part at the Computation Center at the Mass-
achusetts Institute of Technology.
The permission granted by the Babcock and Wilcox Company
and the Atomic Energy Commission to include results from a
Babcock and Wilcox Company preliminary report is gratefully
acknowledged.
Professors P. Griffith, A. Bergles, H. Fenech and M. Suo
gave their time generously to discuss the program during the
course of the investigation.
Mr. F. Johnson and Mr. E. Hartell of the Heat Transfer
Laboratory were of great assistance in constructing the experi-
mental arrangement and keeping the facility operational.
Mr. A. Werthen of the Whitman Tool and Die Company and
Mr. P. Wassmouth were responsible for developing the techni-
ques for fabricating the required test sections to specified
tolerances. The machining of all test sections was performed
by the Whitman Tool and Die Company.

iv
TABLE OF CONTENTS
PAGE
Title Page
Abstract i
Acknowledgement iii
List of Figures vi
Nomenclature
Conversion of Units
CHAPTER I: INRODUCTION 1
1.1 Background of Problem 1
1.2 Scope of the Research 2
1.3 Literature Survey 3
CHAPTER II: TWO PHASE FLOW WITH HEAT ADDITION 18
2.1 Flow Regimes 18
2.2 Critical Heat Flux 22
CHAPTER III: EXPERIMENTAL PROGRAM 28
3.1 Description of Apparatus 28
3.1.1 Hydraulic System 28
3.1.2 Power Supply 30
3.1.3 Instrumentation 31
3.1.4 Test Section 33
3.2 Experimental Procedures and Experience 34
3.2.1 General Loop Operation 34
3.2.2 Loop Operation for Critical Heat 36Flux Data
3.2.3 Two Phase Heat Transfer Coefficient 38Measurements
3.2.4 Correction of Oscillatory Instabilities 39
3.2.5 Critical Flow Considerations 41

PAGE
CHAPTER IV: PRESETATION AND DISCUSSION OF RESULTS 43
4.1 Experimental Results 43
4.1.1 Total Critical Power 44
4.1.2 Critical Location 46
4.1,3 Reproducibility of the Data 48
4.2 Formulation of the Method of Analysis 50
4.3 Calculation Procedure for the Method of 54Analysis
4.4 Application of the Method of Analysis to 57Experimental Data
4.4,l Discussion of Results 60
4.4.1.1 Total Critical Power 61
4.4.1.2 Critical Location 61
4.4.2 Discussion of Results - Flux Spikes 66
4.5 Application to Higher Pressures 70
CHAPTER V: SUMMARY AND CONCLUSIONS 74
5.1 Summary 74
5.2 Conclusions 75
5.3 Design Procedure (50-200 psia) 76
APPENDIX A Error Analysis 78
APPENDIX B Test Section Analysis 82
APPENDIX C Test Section Design 110
APPENDIX D Data Reduction and Analysis 115
APPENDIX E Program for Data Reduction and Analysis 122
APPENDIX F Tabulation of Data 170
BIBLIOGRAPHY 177
FIGURES 181

vi
LIST OF FIGURES
FIGURE
1 Effect of Local Heat Flux Spike on Burnout
2 Prediction of Critical Condition by Local Con-dition Method of Janssen and Kervinen (Ref. 6)
3 Prediction of Critical Condition by EquivalentLength Method of Lee and Obertelli (Ref. 9)
4 Regimes of Two-Phase Flow
5 Flow Regime Map for Test Conditions
6 Comparison of Uniform Flux Data with Existing
Correlations, G = 0.5 x 10⁶ BTU/HR-FT2
7 Comparison of Uniform Flux Data with Existing
Correlations, G = 1.0 x 10⁶ U/HRi'r 2
8 Comparison of Uniform Flux Data with Existing
Correlations, G = 2.0 x 10⁶ 2U/HR-FT 2
9 Schematic Layout of Experimental Facility andTest Section Arrangement
10 Axial Flux Distributions Tested
11 Confirmation for Test Section 112 That theOverall Slope Goes to Zero at the Flow Rate
(G = 2.0 x 10 LBM/HR-FT2) where OscillationOccurred
12 Total Critical Power for Uniform and Cosine FluxDistributions at G = 0.5 x 10⁶ LBM/HR-F2
13 Total Critical Power for Linear and Peaked FluxDistributions at G = 0.5 x 10⁶ LBM/HR-r2
14 Critical Locations (Inches from Inlet) for theNonuniform Axial Distributions Investigated at
G = 0.5 x 10⁶ LM/m-T2
15 Total Critical Power for Uniform and Cosine FluxDistributions at G = 1.0 x 10⁶ M/HR-FT
16 Total Critical Power for Linear and Peaked FluxDistributions at G = 1.0 x 10⁶ LBM/HF 2

vii
FIGURE
17 Critical Locations (Inches from Inlet) for theNonuniform Axial Flux Distributions Investigated
at G = 1.0 x 10⁶ LBM/HR-FT 2
18 Total Critical Power for Uniform and Cosine Flux
Distributions at G = 2.0 x 10⁶ LB/HF 2
19 Total Critical Power for Linear and Peaked Flux
Distributions at G = 2.0 x 10⁶ LBM/HR-F'12
20 Critical Locations (inches from Inlet) for theNonuniform Axial Flux Distributions Investigated
at G = 2.0 x 10⁶ FT/R-2
21 Summary of Effect of Linear Increasing and De-creasing Flux Distributions on Total CriticalPower
22 Summary of Effect of Peak Inlet and Exit FluxDistributions on Total Critical Power
23 Total Critical Power for Data of Bertoletti etal (Ref. 11)
24 Total Critical Power for Data of Swenson (Ref. 5)
25 Total Critical Power for Data of Babcock andWilcox (Ref. 15)
26 Schematic Presentation of Method of Analysis
27 Bergles-Rohsenow Criteria (Ref. 35) for Incipient
Boiling (q/A) = 15.60 P10156(TWALL-TSAT)2.30/p0.0234
28 Variation of Two Phase Heat Transfer Coefficient(h) with Mass Flow Rate (G) and Quality (X)hTP per Dengler-Addoms Correlation (Ref. 38)
29 Typical Determination of Heat Flux Required forIncipient Boiling, (q/A)g, at the Critical Location
30 Heat Flux Conditions Along Test Section Length
31 Operating Lines for Test Section 1271 for QTOTEqual to and Less Than QCRIT
32 Critical Flux Results at G = 0.5 x 10⁶ LBM/HR-FT2
33 Critical Flux Results at G = 1.0 x 10 LBM/HR-FT

viii
FIGURE
34 Critical Flux Results at G = 2.0 x 10⁶ LBM/HR-W 2
35 Dimensionless Representation of Bergles-RohsenowNucleation Theory. The Effect of .imited MaximumCavity Sizes is Shown for P = 100 psia (Z w t-.l)Only
36 Uniform Flux Distribution Data of Hewitt et al(Ref. 41)
37 Operating Histories for Total Input Power up tothe Critical Power (Uniform and Linear Flux Dis-tributions)
38 Operating Histories for Total Input Power up tothe Critical Power (Cosine and Peaked Flux Dis-tributions)
39 Effect of Axial Flux Distribution on the CriticalLocation
40 The Effect of M Value (Ratio of Maximum to Mini-mum Flux) on the Critical Location
41 The Effect of Inlet Subcooling on the CriticalLocation (Peak Exit and Inlet Flux Distributions)
43 Comparison of Critical Flux Results for theRange of Mass Velocities Investigated
44 Effect of Length on the Critical Condition
45 Effect of Inlet Subcooling on the CriticalCondition
46 Effect of Flux Shape Length on the Critical
Condition for G = 1.0 x 10⁶ LBM/HR-T2
47 Effect of Flux Spike Length and M Value (Ratio ofMaximum to Minimum Flux) on the Critical
Condition for G = 1.0 x 10 LBM/HR-F2 and
AHIN = -100 BTU/LBM
48 Critical Flux Results at 1000 Psia from Babcockand Wilcox Data (Ref. 15)
49 Estimation of the Critical Re ion Width (in %Total Input Power) of Figure for 1000 psiaData (Ref. 15)

ix
FIGURE
50 Critical Flux Results at 2000 psia from Babcockand Wilcox Data (Ref. 5)
51 Estimation of the Critical Region Width (in %Total Input Power) of Figure 50 for 2000 psia Data(Ref. 5)
52 Effect of Inlet Subcooling on Critical Flux Resultsfor Cosine Flux Distribution with Flyx Spike (Ref.5)

x
NOMENCLATURE
Symbol
AF
A3
Ax
Di
Cp
Cl
C7
Do
E
g
G
h
H
I
k
L
L
Variable
Flow cross sectional area
Inside surface area
Wall cross sectional area
Inside diameter
Specific heat at constant pressure
Constant associated with peakedinlet and outlet flux distributionsdefined by Eq. B-53
Constant associated with spike(Cosine Shaped) flux distributiondefined by Eq. B-85
Outside diameter
Test section voltage drop
Acceleration due to gravity
Gravitational constant, 32.2
Mass velocity
Heat transfer coefficient
Enthalpy
Test section current
Thermal conductivity
Test section heated length
Length of cosine portion of testsection length or spike length(see Fig. 10)
Half-wavelength of cosine test sec-tion which is truncated to lengthQ,(see Fig. 10)
Half-wavelength of cosine portionof test section which is truncatedto length "' (see Fig..10)
Units
ft2
ft2
ft2
inches
btu/lbm0 F
inches
inches
inches
volts
ft/sec2
lbm ft-sec
lbm/hr-ft2
btu/hr ft F
btu/lbm
amperes
btu/hr ft0F
inches
inches
inches
inches

Symbol
LX=O
LS
M
P
P r
q/A, 0
Q
r
R
Re
T
X
Xttu,x,y,z
v
V
W
xi
Nomenclature (Continued)
Variable
Length of test section for peakedand spiked flux distributions de-fined in Fig. 10.
Location at which saturationcondition is reached
Length over which quality condi-tion exists
Ratio of maximum to minimum flux
Pressure
Prandlt number
Heat flux
Integrated power input
Maximum cavity size required fornucleation
Overall tube resistance
Reynolds number
Temperature
Quality
Martinelli-Nelson Parameter
Axial position indices (see Fig.10)
Specific volume
Velocity
Mass flow rate
Units
inches
inches
inches
dimensionless
psia
dimensionless
btuAr-ft 2
btu/br
ft
OHM
dimensionless
OF
lbm steamtotal lbm
dimensionless
inches
ft 3/lbm
ft/sec
ibm/hr

xii
ANN
C
CRIT
EXIT
f
fg
film
G
i
IN
INLET
L
MAX
MIN
OUT
p
S
SAT
SUB
TOT
TP
V
WALL
u,x,y, z
Subs ts
Tube length in annular flow condition
Critical location
Critical condition
Exit
Saturated liquid
Liquid to vapor
Film
Gas
Required to initiate nucleation
Inside, inlet
Inlet
Liquid
Maximum
Minimum
Outlet
Pump
Saturation location
Saturation condition
Subcooled
Total
Two Phase
Vapor
Wall
Axial position indices

p
a
2'
0 or q/A
xiii
Greek Letters
Specific resistivity
Constant associated with peakedflux distributions defined byEqs. B-51 and B-73
Surface tension
Shear stress
Viscosity
Kinematic viscosity
Heat flux
ohm/ft
dimensionless
lb /ft
lbf/ft2
lbm/hr ft
ft 2/hr
btu/hr ft2

xiv
CONVERS
ENGLISH TO MTRIC (MKS, CGS )
PRESSURE (P)
UNIT MASS FLOW RATE (G)
HEAT FLUX (0)
DENSITY (p)
KINEMATIC VISCOSITY (7)
VISCOSITY ( )
LENGTH (1)
METRIC TO ENGLISH
PRESSURE (P)
UNIT MASS FLOW RATE (G)
HEAT FLUX (0)
DENSITY (p)
KINEMATIC VISCOSITY (7)
VISCOSITY (4)
LENGTH (1)
ION OF UNITS
kg/cm2 = 0.0702Xpsia
kg/m2 sec = 1.361X10~ 3 Xb/hr ft2
g/cm2sec = 1.361X10~4X b/hr ft2
watts/cm2 = 3.15X1O4XBrU/hr ft2
kJ/m2sec =3.105X10-t3XBTU/ 2r f 2
gm/cm3 = 62.14Vxb/ft 3
cm2/sec = 3.88Xft2/hr
gm/cm sec = 243Xb(m)/br ft
mm = 25.4X in
psia = 14.25Xkg/cm2
nb/hr ft2 = 735Xkg/m 2sec
Ab/hr ft2 = 7350Xg/cm 2sec
BTU/hr ft2 = 317OXwatts/cm 2
= 322XkJ/m 2sec
Ab/ft 3 = o.o16Xgm/cm3
ft2/hr = 0.258Xcm 2/see
6(m)/hr ft = 0.00412Xgm/cm sec
in = 0.0394Xmm

-1-
CHAPTER I
INTRODUCTION
1.1 Background of the Problem
Forced convection boiling of water in axial flow is being
utilized in pressurized and boiling water reactors and has been
investigated as a means for cooling the nozzles of electro-
thermal engines, electric-arc wind tunnels and nublear rockets.
One of the most important limits in the thermal performance of
such systems is the so-called critical or burnout condition.
This condition is characterized by a sharp reduction in ability
to transfer heat from the heated surface. Much test data are
available for uniform heat flux distributions along the test
section and numerous-correlations of these data have been pro-
posed. However, in reactor systems as well as high temperature
flow nozzles mentioned above, 'the heat flux distributions are
inherently nonuniform and possess such large gradients that
the existing uniform flux burnout correlations are not appli-
cable. In addition, although interpretation of the limited
data available on nonuniform heat flux distributions varies
as discussed in the literature survey of section 1.3, the
overall conclusion is that certain non-uniform heat flux dis-
tributions can significantly lower the critical heat flux com-
pared to a uniform heat flux distribution under similar hydro-
dynamic operating conditions. Therefore, it is highly desir-
able for design purposes to have a satisfactory method for
predicting the effect on the critical condition of nonuniform
heat flux distributions which exist in practice.
In general three basic axial flux shapes egist:

-2-
(a) A reasonably symmetrical flux distribution with
central peak, approximated by a "chopped" cosine.
This corresponds to an end-of-core-life condition
where the flux is not significantly perturbed by
control rods or nonuniform burnup, or to a core
with chemical control
(b) A flux distribution markedly peaked near the inlet
of the channel, corresponding to a new, clean core
with control rods in the upper part of the core
(upflow); and
(c) A flux distribution markedly peaked near the exit
of the channel, corresponding to a maximum xenon
override condition where the control rods are
withdrawn but the upper part of the core has had
less burnup.
In addition to these macroscopic flux distributions, there may
be superimposed microscopic flux peaks which may occur at any
point along the channel. These flux peaks may be due to
nuclear effects (fuel peaks or water holes) or manufacturing
dimensional tolerances (fuel thickness or eccentricity) and
are of some short but undefined axial extent. It is the purpose
of this investigation to determine the effect of these types
of axial flux distributions on the critical heat flux in the
quality region by a systematic experimental and analytic
investigation. The two quantities of interest are (1) the
location of the critical condition and (2) the power input to
the reactor channel required to cause the critical condition,
1.2 Scope of the ResearchI
A comprehensive experimental program was undertaken to

-3-
investigate nonuniform axial flux distributions under bulk
boiling conditions. In addition to the flux shapes of direct
reactor interest, additional nonuniform as well as uniform
shapes were tested to permit more thorough analysis of the
fundamental nature of the critical condition. Also the flux
gradient was varied for several of the distributions tested as
tabulated below to bracket and extend data available in the
literature.
ApproximateRatio
Maximum FluxFlux Distribution Minimum Flux
Uniform 1.0Cosine 2.27, 4.03, 5.75Linear Increasing 2.27, 5.75Linear Decreasing 2.27, 5.75Peak Inlet 5.75Peak Outlet 5.75Flux Spike (Step) 4.1 to 5.1Flux Spike (Cosine) 2.27, 5.75, 7.00
The experimental program was run on the flow loop available in
the Heat Transfer Laboratory of the Mechanical Engineering
Department. Therefore the operating pressure was limited to
approximately 200 psia but the analytic results obtained from
this data were successfully applied qualitatively to the
higher pressure regions of practical interest. The ranges of
other operating and test section conditions are listed below.
TEST SECTION
Material - Aluminum Tubes
Inside Diameter - .214 Inches (.544 cm)
Heated Length - 30 and 48 Inches (76.2 and 122 cm)
Inlet Calming Length - 3.7 Inches (9.4 cm)
OPERATING CONDITIONS
Pressure - 60 to 200 psia (4.2 to 14 kg/cm2 abs)

-4-
Mass Flow Rate - .5, 1.5 and 2.0x10⁶ lbm2(680,2040,hr ft
and 2720 kg/m2sec)
Inlet Temperature - 60 to 2900 F
Power - Direct Current Resistance Heating
Burnout Detection - Tubes Tested to Failure
It should be noted that several definitions of the critical
condition are used throughout the literature. Generally the def-
inition selected by an experimenter is related to the burnout
detection mechanism used. In this work since each tube was tested
to failure, the critical condition is taken as the physical
destruction of the aluminum test section. Correspondingly the
critical location is defined as the location of the test section
failure.
1.3 Literature Survey
Review of the literature on the subject of axial heat flux
distribution reflects the developing interest in this area
manifested by expanding experimental programs and more sophis-
ticated analytic procedures. However, as this literature is
reviewed it should be noted that for all efforts except that of
Becker(16 ) and Tong , which are the most recent, workers
have attempted to characterise the results by intuitive judg-
ments based on uniform flux results. Since uniform flux data
indicates that the critical condition occurs at the exit where
enthalpy is a maximum but heat flux is equivalent to that
all along the tube, it is not possible to distinguish whether
the critical heat flux is governed by local or integrated
conditions. Hence, in the case of nonuniform flux distribu-
tions, we find some test results are interpreted to suggest
that the critical heat flux is a function of local conditions
along the nonuniformly heated test section, while other results

-5-
are interpreted to suggest that the total integrated heat
transfer or exit enthalpy determines the critical condition
which is therefore independent of the local conditions at
the critical location.
The seemingly perplexing part of this disagreement is
that reliable data supporting each interpretation has been
presented. In anticipation of the conclusions of this work
it can be stated that both the above interpretations can be
shown to be correct, if each is viewed witbin the framework
of a broader interpretation of the critical phenomenn. That is,
the critical condition is aphenomenon which, when represented
by the analytic model developed in this work, is dependent on
both local and integral conditions, the relative importance
of each, depending upon the existing thermal and hydrodynamic
conditions.
Among the earliest results were those of the Bettis
Plant reported in the summary report by DeBertoli et al(l)
which includes results of DeBortoli, Roarty and Weiss(2) and
Weiss(3). These results consisted of the two basic kinds of
nonuniform heat flux experiments (1) gradual variation of
axial heat flux in cosine or other shape distributions where
(d(q/A)/dx is small) and (2) axial step changes in heat flux
commonly called hot-patch or spike tests.
The cosine tests reported by DeBertoli were for a
rectangular test section (0.055 in. x 2.116 in. x 27 in. or
0.14 cm x 5.36 cm x 68.5 cm) with 2000 psia (136 atm) water
*Numbers in parentheses refer to references listed in theBibliography.

-6-for a center-peak-to-minimum heat flux of 4.0 and maximum-to-
average of 1.38. The critical condition always occurred between
the peak flux location and the channel exit. A plot of local heat
flux vs. local enthalpy at the critical condition resulted in
a downward sloping curve which was approximately 70% of the
critical heat flux calculated for a uniform flux distribution
at the same mass flow velocity and exit enthalpy by the
Bell(4 ) correlation. A surprising result was the observation
that with the central peak in the cosine distribution the
magnitude of average heat flux vs exit enthalpy when a criti-
cal condition exists somewhere along the tube length would lie
close (+15% to -25%) to a plot of critical heat flux vs exit
enthalpy for the uniform flux distribution data.
The hot-patch tests performed at Bettis utilized a rec-
tangular channel (0.097 in. x 1.0 in. x 27 in. or 0.25 cm x
68.5 cm) with water at 2000 psia (136 atm). The first 26 5/8
in. (67.5 cm) of the channel were at a uniform heat flux 01and the last 3/8 in. (0.95 cm) was operated at heat flux 02where 02/01 was maintained at 1.98 throughout the tests. The
results are shown in Fig. 1 where the upper curve is 02 at the
critical condition and the lower curve is the corresponding
magnitude of #1=02/1.98. Superimposed on this plot is the
curve for 031 the critical heat flux obtained for the same
exit enthalpy and flow rate when the channel is uniformly heated
along the entire 27 in. (68.5 em) length. At around 60 OF
(33 00) exit subcooling, 02=03, and at exit quality of around
50%, 3 1i. It is seen that the ratio
Ep =( -)

-7-
decreases from around unity well in the subcooled region to
near zero as quality increases. These results show that for
the subcooled exit region, where E p=1, the equivalent hot-patch
heat flux must be achieved in the uniformly heated case to
obtain burnout, hence suggesting the importance of local condi-
tions in the burnout phenomena. On the other hand, in the 50%
quality region, where E=O, burnout is achieved at the same
exit enthalpy even though the hot-patch heat flux is greater
than the uniformly heated tube flux. This suggests that the
integrated conditions are of prime importance in this region.
These initial results illustrated the existence of non-
uniform flux effects and indicated the need to allow for these
effects in design, particularly since these distributions could
lower the critical heat flux from that expected by extrapola-
tion of uniform flux distributions data. The next investiga-
tion in this area was an extensive program performed by
Swenson et al(5), with 2000 psia (136 atm) water for cosine
distributions with central peak, central peak with spikepeak
near inlet and peak near outlet in 0.411 to .446" dia. (1.04 to
1.17 cm) and 72 in. (183 cm) long tubes. The flux spike tests
were very limited but did indicate a decrease in effective-
ness, EP, as the exit quality increased in agreement with
the Bettis results. However, in this case the quality
range was limited to approximately 30% to 24%. For the,
central-peak flux distribution, the data at the critical
location was about one-half of the magnitude of (q/A)crit at
the same enthalpy in a tube with uniform flux distribution.

-8-
The data for both skewed coeine distributions were still
lower. The average heat flux vs exit quality (critical condi-
tion existing between the location of the peak flux and the
exit) agreed reasonably well with (q/A)crit vs.exit enthalpy
for uniform flux distribution for the central peak and the
peak-near-outlet data but the data for peak-near-inlet fell
much below this. These results indicate that when additional
flux distributions are considered, the apparent success ob-
tained with cosine and central peak distributions in comparing
the average critical heat flux to the critical heat flux for
uniform distributions cannot be generalized. This fact should
be borne in mind in the following discussion of other programs
which have achieved success in applying such techniques or their
variations to cosine shape distributions only. From a
practical point of view, these techniques of simple comparison
with, or extrapolation of, uniform heat flux data give reasonable
answers when applied to cosine distributions and can be used in
these cases. However, for the important cases of peaked inlet
and outlet distributions, these techniques fail dramatically
and thus indicate that these methods are not based on a correct
fundamental interpretation of the critical phenomena.
Reported programs in this group which deal exclusively
with the cosine flux distribution include that of Janssen and
Kervinen (6), Casterline and Matzner (7, Shaefer and Jack 8 ),
Lee and Obertelli(9 and Loee(lO). Janssen and Kervinen
carried out experiments for cosine, and truncated-
cosine heat flux distributionsfor an annulus (0.54 in. x
0.875 in. x 100 in. or 1.37 cm x 2.22 cm x 254 cm) with only

-9-the inner rod heating 1000 psia (68 atm) water. The ratios of
maximum flux to minimum flux, M, were 1.86, 3.25 and 3.5. In
all cases the inlet was subcooled and the operation was reported
to be stable without noticeable flow oscillations. The data
from these experiments was analysed by plotting local heat flux
versus local quality for all points on the cosine test section
at the critical power on the same curve with similar data for
uniform flux distributions as represented by a General Electric
correlation for such data (see Fig. 2). Assuming that the
critical condition depends only on local conditions, the point
of tangency between these curves will allow prediction of (1)
the burnout location and (2) the power level at burnout. Based
on this type of analysis, the cosine data was about 9 to 20%
lower than predicted. Considering that (1) the actual burnout
location was uncertain to at least +1 inches due to placement
of thermocouples whose temperature rise was monitered and (2)
that the uniform rod data upon which the correlation was based
had a deviation of the same order as above (9 to 20%), the
method predictsthe cosine distribution behavior well. However,
it should be noted that using the same uniform correlation and
the integrated burnout concept, the cosine average heat is also
within 20% of the uniform critical heat flux. Thus for cosine
data of reasonable steepness, predictions of comparable
accuracy can be obtained with the two basically divergent
views of the burnout phenomenon.
Similar results were obtained in the high mass flow range
(G 23.0xl06 lbm/hr ft2) by Casterline and Natzner(7) who carried
out cosine distribution experiments in a 192 in. long (487 cm)

-10-
.400 inch diameter (1.02 cm) tube with water at 1000 psia
(70.2 kg). However for lower mass flow rates, the cosine tubecm
supported higher heat fluxes for the same local conditions than
the uniform tubes. Thus for lower mass flow rates, analyses
based on both local and average conditions fail for this dis-
tribution with the rather extreme ratio of MAXIMUM FLUX/
MINIMUM FLUX = 34.8. However this discrepancy may be due to
the presence of reported severe pressure oscillations which
were probably due to the inherent compressibility existing in
the void fraction in the long tube since the inlet conditions
were in all cases subcooled.
Limited but interesting data applicable to nozzle cooling
applications was obtained by Schaefer and Jack(8 ) for central
peak shapes at very high heat fluxes. These experiments were
performed with tubes having heated lengths of 1.5 and 5.5 in.
(3.81 and 14.0 cm), .120 in. (.304 cm) diameters in 200 psia
(14.0 m2) water. The flux gradient was large since the heatedcm
length was short and M large (5.88). The experiments were run
at high mass velocity (G = 4.0x10⁷ lbm 2) and yielded highhr ft
local critical heat fluxes (q/A = 4.0x10⁷ -B 2)' Hence thishr ft
data which is outside the normal range of variables is avail-
able for comparison with new methods of analysis.
Extensive additional tests with cosine flux distributions
have been reported by Lee and Obertelli(9) and Lee(1()). These
experiments were performed with 60 to 144 in. (152 to 366 cm)
tubes of diameters .373 or .383 in. (.95 or .975 cm) in water
at pressures of 550 to 1600 psia (38.6 to 112 akg). The firstcm
report surveys the entire range of variables listed, while the

-11-
second report contains data from the 144 in. long tubes at 1000
psia only. These reports show that the average heat flux condi-
tion for estimating burnout is satisfactory. This condition
can be expressed as the equivalence of the average cosine heat
flux with the critical uniform heat flux under the same thermal
and hydrodynamic test conditions or simply as equivalence of
total input power to the test sections in each case. The
reports also introduce another prediction method based on the
integrated condition concept. In this case prediction of burn-
out power and location is obtained as the point of intersection
between cosine and uniform data on a local heat flux versus
length plot. However, the length used on this plot for the
uniform case is an equivalent length which is defined as
LE r 9 h OMZXcos( )dz
where O(Z) = heat flux on the cosine tube at a point distant
(Z) from the inlet. In this manner, for each location on the
cosine tube, an equivalent length of a uniform tube is defined
such that the local heat fluxes and integrated power inputs
are the same at that point (Z) for uniform and cosine heat
flux distributions (see Fig. 3). Using this refined method
good results for the critical power and location are achieved
for the range of cosine shapes tested (M=5.0).
Only three additional investigations have been completed
utilizing flux distributions other than the cosine shape.
Bertoletti et al(11) tested rods 25.4 in. long (64.5 cm) of
.318 in. diameter (.807 cm) in water at 1020 psia (71.5 kg/cm 2).
These sections represented linear increasing and linear decreas-

-12-
ing flux distributions in addition to cosine and uniform dis-
tributions. In all nonuniform distribution cases the maximum
flux to minimum flux ratio, M, was about 2.3. The data was
presented to show the equivalence of total power input for test
sections of all flux distributions for the same thermal and
hydrodynamic test conditions. Review of the data confirms this
equivalence for the cases of inlet quality above saturation.
However for subcooled inlet conditions, which are of direct
interest to many practical applications, divergence of total
power input of up to 10 to 20% between the various flux dis-
tributions is apparentwith the exit peaked distribution
exhibiting the lowest allowable total power. Additional CISE
data reported by Silvestri(12) further indicates that the total
power input is not independent of flux shape for subcooled
inlet conditions. In these experiments,heat was added uniformly
over only the first and last quarter of the tube with the
middle half being unheated. The data showed that for, subcooled
inlet conditions,the total power for the nonuniform flux dis-
tribution was also up to 10 to 15% below that for the uniform
flux. Such deviations, which were also previously pointed out
for exit peaked shapes in Swenson's data of reference (5), are
of direct consequence to reactor design for the control-rods-
withdraw configuration. In addition this deviation illustrates
that the total power input equivalence concept is not valid over
the complete range of nonuniform flux distributions of interest.
The experiments of Styrikovich et al(13) were performed in
6.3 in. (16.0 cm) long tubes of diameter .236 in. (.6 cm) in
water at 1470 and 2000 psia (103 and 140 2). The outsidecm

-13-
diameter of the test sections varied linearly (increasing and
decreasing) with length, hence the flux distribution varied as
the square of the external diameter. Results with subcooled
inlet conditions, which did not exhibit flow pulsations, indi-
cated that the local critical heat flux for both increasing
and decreasing flux shape was greater than the uniform critical
heat flux at the same iraet _ronditions. In addition for the
linearly decreasing flux, the onset of the critical condition
occurred near the inlet as contrasted to the CISE
tests where it was detected by wall thermocouples to set at the
tube exit in all cases. To explain these results, the proposal
is advanced by Styrikovich that the deviation of the upstream
heat flux distribution from uniform causes an attendent devia-
tion in vapor content in the boundary layer. Postulating that
the vapor content in the boundary layer is effective in aiding
or retarding the vapor film formation which causes the critical
condition, higher upstream heat flux is predicted to promote
achieving the critical condition while the reverse holds for
lower upstream heat flux levels. This qualitative explanation
has been modified and adopted in part in the analysis of the
data of the present investigation.
Duke(14 ) performed a series of critical heat flux and
film heat transfer coefficient measurements with an exponential
decreasing flux distribution (M=27.0) in 36 in. (91.5 cm) long
tubes of .187 in. (.476 cm) diameter in water at 535 to 1915
psia (37.5 to 134.5 kdi). The range of mass flow rates inves-cm 6
tigated was limited to the rather low values of .01 to .24x10
lb/hr ft2 (13.6 to 325.0 k ). The results for both criticalm 2sec

-14-
heat flux and heat transfer coefficient were correlated by
statistical techniques and hence application of these correla-
tions outside the limited range of variables investigated is
very questionable.
Additional investigations with varied nonuniform flux dis-
tributions are presently being carried out' in the USA and
Sweden. The U.S. work is being performed at Babcock and
Wilcox Co. on 72 in. (183 cm) long tubes of .446 in. (1.13 cm)
diameter in water at pressures of 1000, 1500, and 2000 psia
(70.2, 105 and 1140.14 -). The flux distributions include
cm(5)those of the previous Babcock and Wilcox work as well as
several of the same distributions tested in annular configura-
tions. The most recent progress report(15) tndicated that
the data agreed well with that of their previous program.
Preliminary Babcock and Wilcox review of this latest data indi-
cated that analysis based on local condition hypothesis was not
valid whereas analysis based on the integrated average critical
heat flux or the input power to the critical location looked
promising. Such an analysis is a variation of the total input
power equivalence but realistically considers only the power
input to the critical location.
The Swedish work(16 ) is being performed for linear increas-
ing and decreasing flux distributions in .236 in. and .394
in. (.6 cm and 1.0 cm) long tubes. The local burnout heat
flux data is apparently predicted by the correlation of
Becker(l7) when the nonuniform heat flux is accounted for in the
related heat balance equation. The basic correlation is a

-15-
simplification of the results of Isbin(lS) which assumes the
critical condition to occur at the axial position where the
annular liquid film disappears. Becker achieves simplification
of Isbin's model by assuming based on his own data for uniform
tubes that the critical condition is a function of local condi-
tions only. The success of this local condition hypothesis in
predicting the critical heat flux for linearly increasing flux
distributions is not surprisingsince in this case the local
flux and local enthalpy are both a maximum at the critical
location. However, this is not the case for linearly decreasing
flux where upstream burnout may occur and here the accurate
predictions obtained may be significant. However a significant
drawback of the entire procedure is that the critical location
is not predicted and in fact the calculation of critical heat
flux requires knowledge, presumably to be supplied from experi-
mental data, of the critical location. However since the
completed report is not yet available, comprehensive critical
review of this method of analysis is not yet possible.
The most recently published work is that of Tong et al(l9)
in which the hypothesis is forwarded that the critical condi-
tion occurs when the enthalpy of a superheated liquid layer
adjacent to the heated surface reaches a limiting value. The
superheated layer is presumably formed and maintained by a
bubble layer which isolates it from the core. The limiting
enthalpy value of nonuniform flux cases was taken equal to that for
a uniform flux. Using this approach a correction factor, F,
was defined to enable prediction of nonuniform behavior from
existing uniform data.

-16-it
q DNB, equivalent to uniform flux
q DNB, local in nonuniform flux
The analytic expression for F is a function of (1) local criti-
cal heat flux, (2) a constant C which was determined to be a
function of local conditions and (3) an integral of local heat
flux weighted by the factor eC(DNBz). Thus we see F
combines local (1 and 2) and integrated (3) effects in a manner
determined by the model chosen. This method is applied to
experimental data of many varied flux distributions yielding
predicted F values within + 25% of experimentally determined
values. While this agreement does not significantly improve
the accuracieb available from other schemes, the method
does yield the following significant result. In the subcooled
and low quality region, the factor C is large and thus the
product C (lDNB-z) is small. This reduces the weighting fac-
tor and results in local conditions primarily determining the
critical condition. Conversely for high qualities, C is
small and integrated conditions primarily determine the criti-
cal condition. Using a basically different model for the
critical condition, this same dependence of the critical
condition on local versus integrated conditions is obtained
in the present work.
From the foregoing review of the literature, we see that
most attempts to deal with nonuniform flux effects have been
based a priori on a concept that the critical condition is a
phenomenonrelated to either local or integrated conditions.
Significantly these attempts have satisfactorily predicted behavior
over only narrow parameter ranges. In addition their apparent

-17-
successful interpretations of similar data from diametrically
opposite viewpoints has lead to much confusion. The efforts of
Becker(16 ) and Tong 19 while not yet pointing the way to a
general satisfactory solution of the problem, have been based
on postulated models of the heat transfer and critical phenomenon.
In the case of Tong in particular, the application of the model
itself to the various nonuniform flux distributions determines
the relative importance of local versus integrated conditions.
Such an approach seems to be the most reasonable method of
analysis and it is along these lines that the subject investi-
gation has been directed. However, to fully comprehend the
formulation of the model which has been applied, it is necessary
to review what is known regarding the flow of water and steam
in heated tubes. In the next chapter,- therefore, the subject
of two phase flow in tubes with heat addition will be discussed
as it relates to the subject experiment.

-18-
CHAPTER II
TWO PHASE FLOW WITH HEAT ADDITION
To provide a sound basis for the developments presented in
Chapter IV, the present understanding of two phase flow in
tubes with heat addition will be reviewed.
2.1 Flow Regimes
Consider a cylindrical tube with vertical upflow of
water under forced convection being electrically resistance
heated. Adapting the, discussion of Milioti(20) let us review
with reference to Fig. 4 the dominant flow regimes and associa-
ted heat transfer mechanisms which will ideally exist along the tube.
Coolant water entering the bottom of the tube is below the
saturation temperature corresponding to its pressure. In Sec-
tion 1, where subcooled water exists forced-convection governs
the heating process.
As the water temperature approaches the saturation value,
the surface temperature reaches the saturation temperature. As
soon as the surface temperature exceeds the saturation tempera-
ture by a few degrees, the liquid immediately adjacent to the
heated surface becomes superheated. In this condition, if the
degree of superheat is sufficient, bubbles can form along the
surface at suitable nucleation sites. Under certain conditions
bubbles have been found to slide along the wall surface in the
direction of flow, As the bubbles grow larger, they detach
from the wall and enter the fluid stream where they collapse
because of the cooler bulk stream temperature. This Section, 2,
is the subcooled nucleate boiling region.

-19-
When the bulk stream temperature reaches saturation, the
bubbles can now be sustained in the turbulent flow of water.
This Section, 3, is the saturated nucleate boiling region char-
acterized by very high heat transfer rates. It is in
this region that the quality of the two-phase flow begins to
increase. The bubbles cause a very high turbulence in the
superheated liquid, as they grow and detach themselves from the
wall. This intense turbulence of the liquid upon the surface
accounts for the high heat transfer rates in this bubble flow
region. As more and more bubbles form at the wall and join the
bulk stream, they start to coalesce and form larger bubbles.
This tendency is expected, because a large bubble has less
surface area than the equivalent volume of small bubbles and
thus there is a tendency for bubbles to agglomerate. The flow
is now unstable under all conditions, and eventually slugs
of intermittent water and steam give the hydrodynamic pattern
called slug flow as shown in Section 4.
Downstream from Section 4, the steam slugs begin to pre-
dominate and the steam increases in proportion to the water to
the point where it can now be considered the continuous phase.
A thin film of slow moving superheated liquid forms on the wall,
while the steam flows in the central core. The liquid film
thickness is of the order of thousandths of an inch and has a
wave-like surface. The steam moves with a much higher velocity
than the liquid film, resulting in high heat transfer coeffic-
ients and an annular slip-type flow shown in Section 5. There
is usually also a spray of small droplets in the steam core,
hence, the name spray-annular flow region. Through Section 5,

-20-
the liquid film flow rate on the wall decreases due to net
entrainmept of liquid from the film and evaporation of the
film. Depending on the local heat flux and quality, nuclea-
tion can also occur within the thin liquid film. Heat transfer
can be though of primarily as conduction through the liquid
film with evaporation at the liquid-vapor surface.
When Section 6 is reached, the liquid film has disappeared,
the wall is dry, and one finds tiny droplets of water in the
steam. As soon as the liquid film is destroyed and the wall
dry, the evaporative cooling of the wall breaks down, causing
a very large decrease in the heat transfer coefficient with a
correspondignly large increase in wall temperature. In Sec-
tion 7, single-phase dry saturated or superheated steam is
present. Because only single-phase steam is present in this
region, it can be considered a film boiling region. However,
the heat fluxes which can be carried under this condition are
considerably lower than those which can be carried with non-
film boiling.
From this discussion, it is seen that the critical condi-
tion can be caused by at least two different mechanisms, (1)
in the subcooled or low quality region by a vapor blanketing
of the tube wall, or (2) in the high quality region by dryout
of the liquid film. In fact, the occurrence of the critical
condition can also be postulated to be caused by a nucleation
induced disruption of the liquid film or by the instability
characteristics of the slug region. Hence it is desirable

-21-
to quantitatively identify the existence of the various flow
regimes possible and the transitions between these flow regimes.
Flow maps exist for predicting this information for adiabatic
systems but since the effects of heating tend to distort the
regime boundaries, such maps are not an accurate representation
of conditions with heat addition. Generally speaking, heating
may be expected to promote the transitions between the regimes
shown in Fig. 4 so that for given pressure and mass flow rates
these transitions occur at lower qualities than in the adiabatic
case. In particular the bubbly flow region may be suppressed
and the flow may go directly from single phase to slug flow.
Similarly the slug-annular transition may occur at lower
quality. From limited results reported at high pressures by
Suo(21) and at low pressures by Lopina (22), such expectations
seem to be borne out.
With regard to the low pressure conditions of the subject
tests, the corrections to an adiabatic flow map due to heating
are small since the flow regime transitions occur at relatively
low qualities. Considering the test conditions and the dimen-
sions of the test sections, the relevant flow regime map for
these experiments is presented in Fig. 5. The transitions
pictured are limited to the transitions to annular from both
bubble and slug.
At high mass velocities the annular transition is taken
from the correlation of Baker. (24) For these conditions, the
slug regime is suppressed and the transition occurs directly
from bubbly to annular flow over the quality range of approxi-

-22-
maetly 6 to 10%. It should be recognized that at a given
mass flow rate this transition to annular flow is gradual and
intermediate flow regimes are probably encountered before
true annular flow is achieved. As Fig. 5 shows, this transi-
tion describes conditions in the region of the test condi-
tions investigated. Due to non-adiabatic conditions, addi-
tional uncertainties in the actual location of the flow
regime transition are introduced. Hence a mean value of 8%
was chosen to characterise the annular transition for all
three flow rates of the subject data.
For completeness, the annular transition at lower flow
rates is also illustrated on Fig. 5. At these low flow
rates, the transition is from slug to annular flow and was
calculated from the correlation of Haberstroh and Griffith. (23)
2.2 Critical Heat Flux
Prediction of the critical heat flux for uniform flux
distribution is necessary in this study for two reasons:
(a) a uniform flux distribution correlation is required to
evaluate published correlation methods for nonuniform flux
distributions such as that of Janssen et al(6) and Lee(lo).
(b) test runs with uniform distribution should be checked
against available correlations to insure that operating
procedures and the experimental rig are performing satis-
factorily.

-23-
Unfortunately there is no existing low pressure (14.7 to
200 psia) quality range correlation which is applicable over
a wide range of test conditions and geometries. In fact data
in this region is limited to that of Lowdermilk and Weiland(25),
Jens and Lottes (26), Lowdermilk, Lanzo and Siegel(2),
Becker (28), Becker and Persson (17) and Lopina(22). From this
datag four correlations are available which use certain of
this data as indicated below:
CORRELATION DATA SOURCE
Lowdermilk, Lanzo and Siegel(27) Lowdermilk, Lanzo and
#Siegel (7
Von Glahn(29) Lowdermilk, Lanzo andSiegel (27)
MacBeth(30) Lowdermilk and Weiland(25) 15Jens and Lottes(2 6) psiaBecker(2 8 ) 250
psia
Becker and Persson(l7) Becker(28 ) , Becker and
Persson(17)
The correlation of Lowdermilk, Lanzo and Siegel(27) is
based on their data obtained at inlet temperature of 759F
atmospheric exit pressure, and diameters from 0.051 inches
to .188 in. The correlation establishes two burnout regimes: a
high velocity, low-exit quality regime for G/(L/D)2 < 150 correlated
by (q/A)CRDO.2 (L/D)0 .15 = 1400 G0 .5
-24-
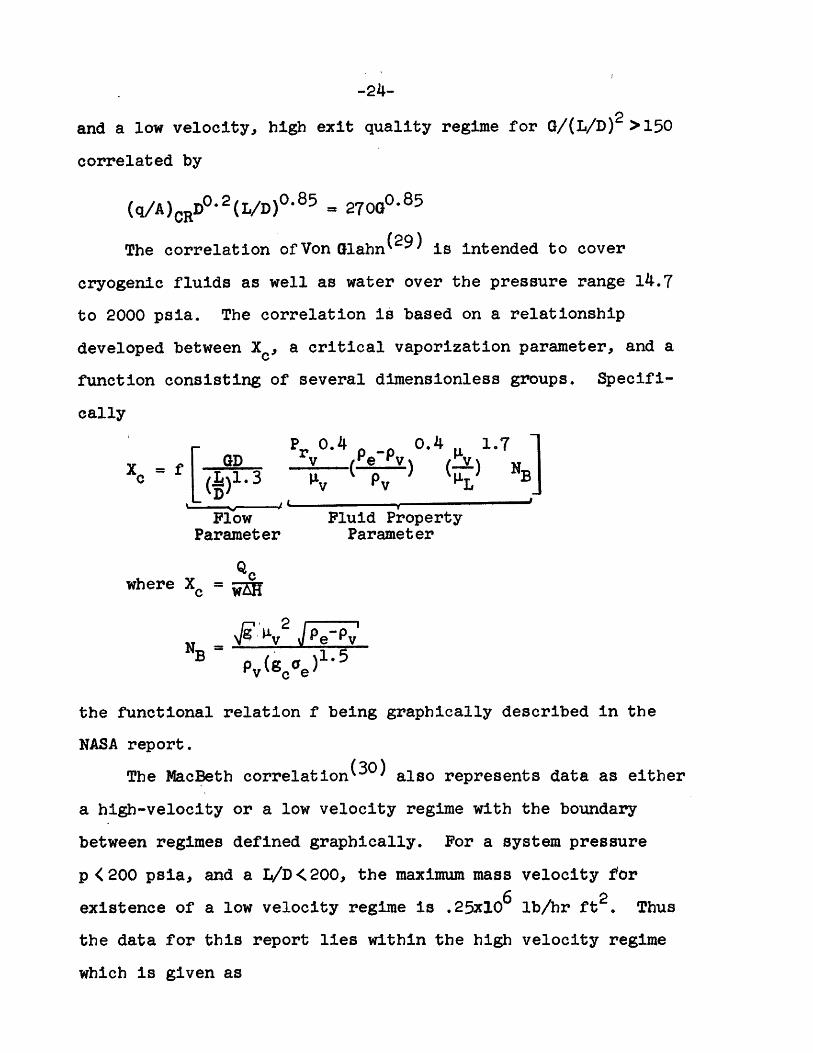
and a low velocity, high exit quality regime for G/(L/D)2 >150
correlated by
(q/A)CRD0.2(L/D).85 = 270G0.85
The correlation of Von Glahn(29) is intended to cover
cryogenic fluids as well as water over the pressure range 14.7
to 2000 psia. The correlation is based on a relationship
developed between Xc, a critical vaporization parameter, and a
function consisting of several dimensionless groups. Specifi-
cally
GD P r0.4 0.4 1.7X () NB
c 1.3 41 pv IL
Flow Fluid PropertyParameter Parameter
where X =
NBv = ~ 2 J PeP'NB g )1.5
the functional relation f being graphically described in the
NASA report.
The MacBeth correlation(30) also represents data as either
a high-velocity or a low velocity regime with the boundary
between regimes defined graphically. For a system pressure
p <200 psia, and a L/D K200, the maximum mass velocity for6 2
existence of a low velocity regime is .25x10 lb/hr ft2. Thus
the data for this report lies within the high velocity regime
which is given as

-25-
6 A + *CD(Gxl0-6Aq/Ax10 - 1+CL
where A=y0 D (Gx1062
J4 -6 75C y3D (GxlO )
D inches
The "y" coefficients obtained by MacBeth by computer
optimization of data at various pressures are
psia 250 psia
yO 1.12 1.77
yJ -0.211 -0.553
y2 0.324 -0.260
y3 0.001 o.o166
y4 -1.4 -1.4
y5 -1.05 -0.937
Finally the correlation of Becker(l7) as discussed in Chapter I
covers the pressure range 142.5 to 195.0 psia. The correlation,
which is based on extension of the flow model of Isbin(l8 ) is
presented as curves of
1 1/2 versus XCRITq/A( )
where XCRIT - the steam quality at the critical location
q/A =surface heat flux, 2
- mass velocity.*F m2m S
Each of thacorrelations together with the uniform flux
distributlon data of this report are plotted in Figs. 6, 7, and
8. The wide variation in predicted critical heat flux values

-26-
is obvious. In addition the dependence of critical heat flux
on pressure for the MacBeth correlation is opposite to that for
the Becker and Von Glahn correlations. In appraising these
figures the following conclusions can be drawn (the deviation
between stable and unstable points will be discussed in
Chapter III).
(1) The MacBeth correlation contains only the early and
limited data of Lowdermilk and Weiland(25), which is suspect to
flow instabilities as described in the later report by Lowder-
milk(27), and the data of Jens and Lottes (26) which was taken at
low flow rates (.01 to .04x10-6 lb/hr ft2) in large diameter
(.94 in) tubes. Hence this correlation would not be expected
to yield reasonable results for the subject test conditions.
(2) The Von Glahn and Lowdermilk correlations are based on
Lowdermilk(27) data which had limited diameters (up to .188
inches) and a single subcooling. Thus as discussed by Lopina 22)
for the test diameters of the subject test data, these correla-
tions are not applicable.
(3) The Becker correlation yields good agreement with
results at low flow rates (G = 0.5x10⁶ lb/br ft2). As flow
rate increases, the agreement becomes poorer.
(4) The 250 psia prediction of MacBeth's correlation
agrees well with the data. However the data is at generally
lower pressures than the pressure for which the correlating line
was established.
These results indicate that the available low pressure corre-
lations do not appear to be based on the correct fundamental vari-
ables. Hence although each is satisfactory over the range of data from

-27-
which it was derived, none can be safely extrapolated to the
desired region of the subject test conditions. Therefore,
the best empirical procedure for representing the present
data appears to be use of a simple equation of the form,
q R= C1 + AM where the constants can be deter-
mined from the data of Figures 6, 7 and 8.

-28-
CHAPTER III
EXPERIMENTAL PROGRAM
3.1 Description of Apparatus
The following section contains a description of the experi-
mental facility and test sections which was used in this inves-
tigation. This was divided into four categories: the hydraulic
system, the power supply, the associated instrumentation and the
test sections. Although detailed descriptions of the apparatus
are available in other reports,(31) they are repeated here for
the convenience of the reader. The basic apparatus had been
designed and constructed in a previous study by Bergles.( 32 )
3.1.1 Hydraulic System
A schematic of the flow loop is shown in Fig. 9. The
pipings and fittings, all of brass and stainless steel for corro-
sion resistance, are erected around a test bench constructed of
Dexion slotted angles and plywood. Rayon reinforced rubber hose
was used where flexible connections were required. Flow circu-
lation is provided by a Fairbanks Morse two-stage regenerative
pump (260 psi at 3.6 gal/min) driven through a flexible coupling
by a 3 HP Allis Chalmers induction motor. To avoid contamina-
tion of the system water, the pump was fitted with special
seals of teflon-impregnated asbestos. A relief valve set for
300 psi protected the pump casing from overpressure.
The main flow loop contains a Jamesbury ball
valve to control the overall pressure drop. The test section
line, installed in parallel with the main loop can be isolated
by means of two more Jamesbury ball valves. To limit coolant

-29-
loss upon test section failure,upstream and downstream check
valves-were built into the test section connector pieces. The
upstream valve contains a spring sized to hold the valve open
during normal operation with system pressure on either side of
the valve but closed at test section failure with system
pressure upstream and ambient pressure downstream. The down-
stream valve is simply held open by system pressure during
normal operation but closed at test section failure by the
pressure difference between the back system pressure and the
ambient test section pressure. The test section flow rate is
controlled by means of Jenkins needle valves set just upstream
and downstream of the test section itself. The valve down-
stream is particularly useful in adjusting test section
pressure. The test section line also contains two basic
Fischer-Porter flowmeters with the appropriate isolating valves.
Four Chromalox heaters of approximately 6 kw. each are also
provided to control the test section inlet temperature. Three
of these are controlled simply with "off-on" switches while the
fourth can provide a continuous range from 0 to 6 kw. by means
of a bank of two variacs mounted on the test bench. Pressure
fluctuations at the outlet of the pump are damped out by means
of a 2.5 gallon Greer accumulator charged with nitrogen to an
initial pressure of 40 psi. This accumulator contains a
flexible bladder-type separator which prevents the nitrogen
from being absorbed by the system water. A Jamesbury ball valve
isolates the accumulator from the loop at shut-down.
Since the system is closed loop, the heat added to the
system water is rejected to a shell-and-tube heat exchanger

-30-
connected to a city water line. Due to seasonal temperature
variations, the minimum operating temperature varies from
approximately 500F in the winter to 750F for summer operation.
Continuous deionization and deoxygenation is provided in a
parallel loop containing four resin beds, two of which provide
deionization and the other two, deoxygenation. The conductivity
of the loop water may be maintained at 1.5 x 10⁶ ohm-cm as read
on a Barnstead meter. In order to insure a minimum of dissolved
air in the system, a 5 gallon degassing tank was provided with
five electrical heaters (3-220 VAC and 2-110 VAC), This tank
was also used to provide makeup water to the system. A storage
tank for filling the system and degassing tank was mounted
above the degassing tank and could be filled with distilled
water from standard 5 gallon bottles with a small fypro pump.
Both the storage tank and the degassing tank were equipped
with glass sight gages so that the proper levels could be
maintained.
3.1.2 Power Supply
Power was supplied to the test section by means of two 36
kw. Chandrysson externally excited generators, each capable of
delivering 3000 amperes at 12 volts. The generators are
driven by 440 volt-3 phase-600 rpm synchronous motors.
The power could be regulated from zero to maximum power
as desired through a portable control console. The generator
outputs were connected in series and the output from one was
added to or subtracted from the output of the other. Water-
cooled shunts, installed in parallel with the test section, selim-
inated the shock of a sudden open circuit caused by a test section

-31-
burnout.
An existing buss-bar system was used, with the addition of
air cooled copper braided cables just at the test section. The
use of these flexible cables permitted flexibility in the size
of the test section which could be accomodated. At the up-
stream end of the test section, the cable assembly is clamped
to an aluminum plate to which a rigid aluminum test section
holder is attached. At the downstream side, the connection to
the test section holder is accomplished by a flexible braided
conductor. This entire connection to the test section was put
in tension by a spring arrangement to assure adequate allowance
for thermal expansion of the test section. The test section
holders were made of aluminum plate in two segments which, when
bolted together, clamped to a bushing surrounding the test
section. The downstream end of the test section was connected
to the piping with rubber hose to provide electrical insulation
and increased flexibility.
3.1.3 Instrumentation
Instrumentation was provided to monitor the steady-state
and transient conditions throughout the system. Pressure gages
on the main loop, as indicated in Fig. 9, aid in adjusting the
pressure level in the test section and in determining system
stability. A thermocouple was installed in the degassing tank
to monitor the water temperature during degassing operations.
Another at the discharge of the pump insured that the water
temperatures in the deionizing beds never exceeded 1400F. A
variety of metering tubes and floats which could be installed
interchangeably in the basic Fischer-Porter flowmeter housing

-32-
provided measurement of the test section flows from 1.5 to
4000 lbm/hr. The results were calibrated at installation and
checked periodically against the initial calibration.
The test section itself was instrumented with thermocouples
to record inlet and outlet water temperatures. In both cases,
the thermocouples were located at positions where the flow was
well-mixed. At the downstream end, the thermocouple was
located far enough from the exit of the heated section so that
it could be safely assumed that the vapor fraction is completely
condensed.
Thermocouples were constructed from Leeds and Northrup
24-gage duplex copper-constantan wire. Calibrations were per-
formed and deviations from N.B.S. standard tables were found to be
slight so that no corrections were necessary. All of the
thermocouples were connected to a common ice junction through
a twelve position Leeds and Northrup thermocouple switch. The
output could be read on either a potentiometer or a recorded.
The recorder is a pen-type, single channel instrument manufac-
tured by Minneapolis-Honeywell Brown. There are five manually
selected ranges for o-6, 5-11, 10-16, 15-21, and 20-26 milli-
volts. Occasional calibration against the potentiometer
insured the accuracy of the recorder to within .01 millivolts,
Test section pressures, both upstream and downstream were
monitored on 4 1/2 inch U.S. gage supergages with 0-200 psi
range. Each gage was checked on a dead weight tester and cali-
brated to an accuracy of approximately .5 psi over the entire
range. They were checked against one another periodically at
various static pressure levels under zero flow conditions.

-33-
Porous-plug snubbers were provided to protect the geges from
severe pressure fluctuations.
The heat input to the test section was computed from
measurements of the voltage drop across the heated length and
the current to the section. The voltage drop was read on a
Weston, multirange d.c. voltmeter with a specified accuracy of
±1/2% of full scale. The current was inferred from the
voltage drop across an air-cooled N.B.S. shunt with a calibra-
ted conductance of 60.17 amps/m.v.
3.1.4 Test Section
The required flux shapes were obtained by machining the
tube outside diameter to obtain the desired variation in wall
cross-sectional area since electrical power generation is
directly proportional to resistance. The design was made
within the limits imposed by (a) available power and hydraulic
supply (b) test conditions and geometries desired for investi-
gation and (c) materials having adequate resistivity and
machinability. A discussion of the interplay between these
variables and the final test section designs is presented in
Appendix C. Confirmation of the shape of the experimental
flux distribution was obtained on a sampling basis by room
temperature incremental resistance measurements and by 100%
inspection of resultant outside diameter dimensions. Details
of the results of these procedures and discussion of other
factors affecting the shape of the experimental flux distrib-
ution are included in Appendix A. See Figure 10 for schematic
presentation of the various test sections used in the inves-
tigation.

3.2 Experimental Procedures and Experience
3.2.1 General Loop Operation
Many aspects of the experimental procedure, particularly
the installation of test sections and final preparation of the
loop for operationwere common to all types of runs. Distilled
water was pumped into the storage tank from the standard five
gallon bottles. The system and degassing tank were filled by
gravity. Vents on the flowmeter, preheaters, test section,
exit plenum, and the deionization tank were opened to allow the
displaced air to escape. The degassing tank vent was open at
all times. The other vents were closed when no further bubbles
were seen. The pump was then turned on and all valves opened
and closed several times to dislodge any remaining air pockets,
The vents were then opened and closed again in turn until air-
free water was obtained at each vent. Visual observation of
the flow through the glass flowmeter tube aided in determining
when the system was free of air.
At this point, all the degassing tank heaters were turned
on, and water was circulated through the system. The tempera-
ture of the degassing tank water was monitored on the recorder,
and all but one of the heaters turned off as the boiling point
was approached. If this was not done, the degassing tank was
found to boil too vigorously with the result that considerable
overpressure built up in the tank and a large amount of water
was forced out through the vent. When boiling occurred,
water from the loop was bypassed into the degassing tank. The
amount of flow was regulated so that a small but continuous

-35-
flow of steam issued from the vent hose. The system water was
effectively degassed by being dumped into the boiling water at
the top of the degassing tank. This was continued until the
temperature in the loop rose to approximately 180 0F. Care was
taken to shut off flow to the deionization tank before the
loop temperature exceeded 1400F. The entire procedure took
about 30 minutes. A standard Winkler analysis, described in
Reference (32), indicated that this method of degassing reduced
the air content to less than .1 cc air/liter. Upon completion
of the process, the remaining tank heaters were shut off, and
the heat exchanger turned on. The flow of system water to the
degassing tank was turned off as soon as steam stopped coming
out the vent. The system was then ready for operation. This
process was repeated at the beginning of each day of operation,
where the degassing take was refilled, or when air bubbles were
visible in the flowmeter. The daily degassing was necessary
since the degassing tank is vented to the atmosphere, and the
water in the tank would eventually become saturated with air
( 18 cc/liter).
The system was then operated for at least 15 minutes at
zero power before taking measurements. At the end of this
time the system water was completely cool and had been
thoroughly circulated through the deionizers. This time was
also used toallow the generators to warm up. If the genera-
tors were used immediately after starting, fluctuations in the
power level were much larger and harder to control. If a
particularly low resistance test section was in place, it was
necessary to disconnet one of the power leads until the
generators had come up to speed. If this was not done, high

-36-
voltage drops could result from the fact that the two genera-
tors did not speed up in unison and on occasion could lead to
unwanted burnouts.
At shutdown, it was necessary to isolate the accumulator
from the loop. Otherwise, the water would be forced out of
the accumulator, into the loop, and eventually out through the
degassing tank vent. The pump and generator were connected
together electrically so that the generators would be shut
off if the pump should be turned off accidentally or due to a
power failure. However, the generators could be shut off
independently by means of a switch on the control console.
Turning off the generators or the pump also interrupted the
power to the preheaters. This was a safety precaution to
prevent burning out the heater elements should they be left on
with no flow.
3.2.2 Loop Operation for Critical Heat Flux Data
At the beginning of each test run, the bypass flow was
reduced to maximize the pressure drop taken across the needle
valve upstream of test section. A large upstream restriction
pressure drop was desired to minimize the occurence of flow
oscillations. These oscillations did occur early in the test
program and steps taken to analyse and eliminate them will be
discussed in Section 3.2.4. For low mass flow rates (G=0.5xlO 6
a 3/8" exit line was used and desired exit pressure maintained
throughout the entire test run by adjusting the needle valve in
the line. For higher mass flow rates (G=1.0 and 2.Ox106) a 1"
exit line was used but in this case since valve manipulation
-37-
did not allow adequate adjustment of exit pressure, the exit
pressure was not directly set but allowed to vary within the
desired range with the power level and inlet subcooling.
With the mass flow rate and test pressures established,
the generators were turned on and power applied to the test
section. After a heat balance was taken, power level was
gradually increased simultaneously with adjustment of inlet
temperature by operation of the loop preheaters. This adjust-
ment was complete before the test section power achieved
approximately 50% of the anticipated burnout power. In the
final approach to burnout, mass flow rate and inlet temperature
were maintained constant as power was increased in small steps.
Test section inlet and exit pressures were maintained approxi-
mately constant at low flow rates but increased at high flow
rates as power increased. At each step in power level, values
of all these variables were recorded manually. Since only
inlet temperature was automatically recorded, only values of
inlet temperature and test section voltage (meter was contin-
ually viewed) were noted at burnout. The values of all other
parameters at burnout were obtained by extrapolating data
recorded at previous power steps.
When burnout did occur, the generators, preheaters and
pump were turned off and the test section line isolated from
the main loop. When a new test section was inserted, a small
volume of undegassed water was necessarily allowed into the
system from the fill tank because the test section line was
above the level of the degassing tank. Care was taken to
bleed the system under such circumstances to minimize the

-38-
amount of air entrapped in the system. When the pump was
restarted, the flow meter was observed to ensure that air
bubbles were not present. This departure from the initial
thoroughly degassed conditions for certain test runs was con-
sidered acceptable since critical test results should not be
effected by slight differences in the degassed condition of
the loop water.
3.2.3 Two Phase Heat Transfer Coefficient Measurements
In addition to burnout measurements, an attempt was made
to measure two phase heat transfer coefficients. As discussed
in Chapter IV, such data is necessary for the critical heat flux
model presented. For these measurements, a test section with
two independent power supplies attached was used. The inlet
portion was heated with the generators described in Section
3.1.2, while a 1.5 inch portion at the exit was heated by a motor
generator set capable of delivering about 17 volts at 700
amperes. The power to the inlet section was adjusted to yield
a desired quality condition in the exit portion. The exit sec-
tion or nucleation section was designed to minimize the heat
input to the fluid (and hence the quality change) but maximize
the available heat flux which could be achieved. By measuring
temperature differences, TWALLT SATURATIONI at pre-established
values of pressure, mass flow and quality, determination of heat
transfer coefficients for these conditions was attempted.
The experimental difficulties encountered for the test con-
ditions explored i.e. steam-water mixtures at X=.10 to .60,
P=100 psia, G=0.5 to 2.0 x 10⁶ lbm/hr ft2 and D=,214 inches, were
a) The mechanical strength of the nucleation portion
of the test section was poor due to the thin wall

-39-
required to achieve high heat fluxes by resistance
heating with the available power supply. The wall
thickness could be increased by decreasing D, or by
heating the test section indirectly by conduction
from a resistance coil wound around the test sec-
tion.
b) The exit pressure could not be maintained constant
for flows in the quality region thus causing
TSATURATION to vary. This may be able to be
corrected by installation of a pressure regulating
valve, although it appears that the configuration
- and hydraulic characteristics of the existing loop
prevent adequate correction of this problem.
c) Accurate measurement of low temperature differences,
.5 to 30F, was not possible due to (b) above as well
as inherent difficulties in accurately measuring the
wall temperatureeven with a guard heater arrangement.
Although some data was obtained it was generally not internally
consistent, particularly in the low temperature difference
regions of interest. Hence, the heat transfer coefficients
obtained were not considered accurate and therefore not used
further in this work.
3.2.4 Correction of Oscillatory Instabilities
Certain of the data obtained during the loop checkout
with uniform heat flux distribution exhibited critical heat
flux values (see Figs. 8 and 9) significantly lower than the
bulk of other data. In addition during certain of these experi-
mental runs, the flow rate was observed to oscillate as the

critical condition was approached.
Although no compressibility was deliberately inserted in the
system between the control valve and the heated section, it was
felt that enough compressibility was present upstream of the
control valve in the form of preheaters and accumulators to
initiate an instability if other conditions were also present.
These conditions reduce per the theory of Maulbetsch(31) to
the requirement that the slope of the overall pressure drop vs
flow rate curve goes to zero. Overall pressure drop here in-
cludes both the control valve and vhe heated section. Check of
the suspect points by this method confirmed that the instabili-
ties resulted from this cause. A sample graphical comparison is
given on Fig. 11 of the heated section versus control valve
pressure drop which shows that the overall slope does go to
zero at the flow rate where oscillation and the critical condi-
tion occurred. Similar calculations along with some experimen-
tal measurements were made on the points which were believed to
be valid and the overall slope was established as positive.
To eliminate this oscillatory instability based on this
theory, an increase in the slope of the control valve character-
istic or a decrease in the slope of the test section characteris-
tic is necessary. Since the test section characteristic is
determined by the desired test conditions, only modification of
the control valve characteristic is possible. For the loop
available, the pump delivery pressure and the heat exchanger
condensing pressure (15 psia) limit the overall pressure drop
available which is distributed between the control valve, test
section, and other line losses. Hence, to increase the control

-41-
valve pressure drop, extraneous line losses were reduced by
increasing the exit line diameter from 3/8" to 1". With this
modification, stable data at the higher flow rates was obtained.
However for conditions of low inlet subcooling, instabilities
were encountered for certain test sections exhibiting rapid
axial variation in heat flux and data under these conditions
could not be obtained. Apparentlyin these cases the test
section pressure drop vs flow rate characteristic became equal
to the control valve characteristic thus causing the slope of
the overall pressure drop characteristic to go to zero. It
should be noted that this problem could probably have been
corrected and data for these cases obtained by installation of
a higher head pump which would permit increased pressure drop
to be taken across the control valve.
3.2.5 Critical Flow Considerations
Since the sonic velocity can be quite low in a two phase flow,
it is desirable to check whether or not a choked flow condition
existed. Such a condition could lead to erroneous results re-
garding critical heat flux levels for various operating condi-
tions. Using the slip equilibrium model of Fauske(33), from Fauske's
Fig. 4, we see that the minimum critical velocity is achieved at
minimum pressure and maximum quality. Calculating this minimum
critical velocity for composite worst case test conditions, we
obtain the results shown below. Basing the calculation on
a hypothetical composite case which would yield a higher predic-
ted critical velocity than any real case assures that the
results obtained are conservative estimates. Since the actual

-42-
Composite Worst Case
Actual Mass TubeVelocity Num.
lb556'see ft2 2554
278 1502
139 514
MinimumObservedPressure
72
57
85
TubeNum.
1256
508
1552
MaximumObservedQuality
.35
.52
.80
PredictedCriticalVelocity
lb
620 sec ft2320
300
Actual is%of
PredictedCriticalVelocity
90%
87%
45%
velocities are in all cases less than the predicted critical
velocities, it is reasonable to conclude that the critical vel-
ocities were not achieved during the experimental program.
Direct confirmation of this conclusion by varying the test
section exit pressure to achieve a critical velocity was not
possible due to the operating limitations of the test loop.

-43-
CHAPTER IV
PRESFMEATION AND DISCUSSION OF RESULTS
4.1 Experimental Results
The complete range of variables investigated was presented
in Chapter I. Basically for each axial flux distribution, criti-
cal heat flux tests were conducted at three mass velocities,
G = 0.5, 1.0 and 2.ix06 lbm/hr ft2 and a range of inlet sub-
cooling conditions. The total number of tests, each carried to
physical failure of the test section was approximately 144. A
complete listing of the experimental data is presented in Appendix F.
The basic experimental results are presented as:
1) the total power applied to a channel to attain a criti-
cal condition (defined in this investigation as physi-
cal destruction of the aluminum test section). This
parameter is of particular interest since maximization
of Qcrit is a prime objective in engineering design.
2) the physical location of the critical condition (de-
fined in this investigation as the failure location in
the aluminum test section).
The test results for each of the three mass velocities are
presented in terms of Qcrit and critical location in Figures
12 through 22. It should be noted that in all cases the
inlet condition was subcooled and the total critical power,
Qcrit, in these figures is presented as a function of the
independent variable, inlet subcooling AHin'4.1.1 Total Critical Power
Considering the uniform flux results as a basis for ref-
erence, the following observations of Q crit are apparent from

Figures 12, 15, and 17 which present cosine flux distribution
behavior and Figures 21 and 22 which summarize behavior of the
remaining flux shapes.
Qcrit - Cosine and Other Flux Distributions with Maximum Flux
Near or at the Test Section Inlet
The value of Qcrit for these distributions is general 10%
larger than Qcrit for uniform flux data. However, for the inlet
flux peak distribution, the value of Qcrit did drop to 10%
less than Qcrit for uniform flux data as the mass flow velocity
increased to G = 2.0 x 10⁶ lbm/br ft As the inlet condition
approaches saturation, Qcrit for these nonuniform flux distrib-
utions decreases in the same manner as the uniform flux data.
There is no apparent dependence of Qcrit between distributions
of the same shape with different M values (ratio of maximum to
minimum flux)0 For cosine flux distributions in particular, no
apparent stratification exists between the results for M =
2.27, 4.0 and 5.75. These results indicate that the total crit-
ical power, Qcrit cannot be significantly increased by tailoring
of the flux distribution to an optimum shape.
Qcrit - Flux Distributions with Maximum Flux Near or at the
Test Section Exit
The value of Qcrit for these distributions can be signifi-
cantly less than Qcrit for uniform flux distributions at the
same operating conditions. The deviation depends on the degree
of inlet subcooling, AHin, the mass velocity, G, the flux shape,
and its associated M ratio. For the maximum inlet subcooling
investigated, about -300 btu/lbm, Table IV-A below summarizes
the maximum decreases observed in total critical power.

-45-
Flux Distribution MASS VELOCITY, G, LBM/HR-FT2
0.5 x 10⁶ .X 106 2.O x 106
Linear increasing -20% -5% -5%(M=2.27)
Linear increasing -35% -15% -30%(M=5.75)
Peak exit -15% -15% -30%(M=5.75)
Table IV-A
MAXIMUM DECREASE IN QCRIT COMPARED TO UNIFORM FLUX
DISTRIBUTION RESULTS
-As the inlet condition approaches saturation, the devia-
tions of Table IV-A decrease, resulting in approximately
equal values of Qcrit for uniform and nonuniform flux distribu-
tions at low inlet subcooling levels.
The increased deviations with increased M for a given
flux shape are clearly apparent in the table above. This
dependence is observed for results in the annular regime and
several results which were obtained in the subcooled region.
In fact the test data show (Fig. 21 and 22) that if the flux
distribution is severely peaked, the flux level can be high
enough to cause a critical condition at a location where sub-
cooled conditions prevail. Thus the actual flux distribution
can cause both (1) decreased Qcrit compared to uniform flux
data when both data are in the annular regime and (2) severely
decreased Qcrit due to a subcooled critical condition which
occurs at a high flux location of the nonuniform distribution.
Similar results have also been obtained by other experi-
menters at -higher pressures. Portions of the-data of Bertoletti
(11), Swenson (5). and the most recent Babcock and Wilcox inves-

-46-
tigation (15), are presented in Figures 23, 24 and 25 which con-
firm the principal observations of this study, namely
1) For cosine and other distributions with the maximum
flux near or at the test section inlet, Qcrit is
within +10% of uniform flux data and decreases as
AHin approaches the saturated inlet condition.
2) For distributions with the maximum flux near or at
the test section exit, Qcrit can be up to 30% less
than the uniform flux data at large inlet subcoolings.
This deviation approaches zero as AHin approaches
the saturated inlet condition.
4.1.2 Critical Location
The location of the critical phenomenon for each test sec-
tion was also determined experimentally and is presented in
Figures 14, 17, and 20. The tabulation of Appendix F in some
cases indicated two critical locations. In these cases, before
effective corrective action was taken, the test sections were
somewhat bowed during testing and upon attaining the critical
condition, both a thermal failure and mechanical failure occurred.
The thermal failure was characterized by melting of approximately
an 1/81 wide by 1" long (axial) rectangular portion of the test
section. In Appendix F, the actual critical location is repor-
ted as the midpoint of the thermal failure with its axial extent
listed as the + value. The mechanical failure was a complete cir-
cumferential shearing of the test section characterized by a
jagged unfused cleavage. In certain cases, which are noted, a
double thermal failure did occur. In all other cases, the first

listed location, is the thermal failure location and this is
used in subsequent analysis. These results can be summarized
as follows.
CRITICAL LOCATION - UNIFORM FLUX
The critical location occurred within 1% of the test sec-
tion exit, the slight deviation probably being attributable to
axial conduction effects.
CRITICAL LOCATION - MONOTONICALLY INCREASING FLUX (i.e. LINEAR
INCREASING)
The critical location occurred within 1% of the test sec-
tion outlet except for one case. In this case, test section
1204 which was tested at G m 1.0 x 10⁶ and.AH = -160 BTU/LBM,
the critical location was slightly upstream from the exit
(.7 ± .5 inches from exit of the 30 inch test section).
CRITICAL LOCATION - FLUX PEAK ALONG TEST SECTION AT ANY LOCA-
TION EXCLUDING EXIT (i.e. COSINE, PEAK NEAR INLET, PEAK NEAR
EXIT, LINEAR DECREASING)
The critical location for these flux distributions always
occurred between the flux peak and the test section exit or at
the test section exit. The critical location is dependent on
inlet subcooling, AHinpand moves upstream from the tube exit
with increased Subcooling. In addition, for a given flux
shape, the critical location appears also dependent on M. For
example for cosine distributions the critical location is
further upstream for M values of 2.27 and 5.75 versus 4.03. For
linear decreasing flux shape, increased M value (5.75 versus
2.27) results in upstream movement of the critical location.

-48-
The data of other investigators generally confirm these results
particularly the upstream movement of the critical location for
the peak inlet flux distribution with increased inlet subcool-
ing. However precise determination of the critical location
was not generally obtained due to the burnout detection systems
used. The CISE investigators (11) on the other hand, indicated
that in all cases the onset of the critical condition occurred
at the test section exit.
The possibility that the onset of the critical condition
occurred at the exit but moved, causing a physical failure up-
stream, was considered and investigated in this work. Differen-
tial thermocouples were used with the point of interest and an
unheated exit portion of the test section as the two opposing
inputs. A series of thermocouples were simultaneously used to
monitor several locations between the tube exit and the expec-
ted burnout location. The output from these thermocouples was
recorded on a multichannel recording oscillograph by galvano-
meters with natural frequencies ranging from 50 to 300 cycles
per second. However, these traces did not show movement of a
wall temperature excursion from the tube exit to the critical
location. Thus it appeared that the critical condition
occurred initially and only at the location of tube failure.
4.1.3 Reproducibility of the Data
Several runs were made at almost identical inlet and
mass velocity conditions to establish the reproducibility of
the data. These results, tabulated below in Table IV-B, indi-
cate that differences exist in total critical power, Qcrit, up
to + 10% and in critical location up to 4.0 inches. Note that

Test Section Date Flux Shape
GM LBM
HR FT
AHinlet
BrU
Qcrit
x10-59UxlO
CriticalLocation
Diff Inches(FromInlet'
TABLE IV-B REPRODUCIBILITY OF RESULTS
InchesDiff.
142 10/21 2. 0x106 -271.2 2.029 10% 29.8+0UNIFORM 1.0 6
135 9/25 1.99x10 -270.8 2.232 29.6 O .2
310 9/3 6 -246.5 1.435 24.0+0 3.2COSINE 4.03 1.Oxl0 7.2% to
333 9/23 -246.9 1.538 27.6+.4 4.0
511 10/14 6 -159.2 7.404 24.3±.2 1.3COSINE 5.75 O.5x10 8.3% to
512 10/14 -154.4 6.837 22.6+.2 2.1
1271 11/12 LINEAR 6 -249.9 7.572 26.4+1.4 02.27 1.0x10 5.5% to
1252 11/19 ECREASING -247.5 7.988 25.5+1.0 3.3

-50-
the error analysis of reference A indicates a probable variation
of +3.4% in total critical power. Thus Qcrit has been determined
in this work to at least within + 10%. The observed variation
in the critical location is quite large. However, from the
analysis to be presented, such variations are shown to be proba-
ble and still consistent with the more accurate determination of
Qcrit*
4.2 Formulation of the Method of Analysis
With the experimental results presented, a method of analy-
sis is desired which predicts the salient features of these re-
sults and permits interpolation and some extrapolation of these
data to other conditions of interest. The most convenient
approach initially appeared to be extension of the models of
Becker (16) and Isbin (18) to the nonuniform distribution case.
This model, applicable to the annular regime, identifies proc-
esses which increase and deplete the film flow rate and estab-
lishes dryout of the annular film as the mechanism causing the
critical condition. Dryout in this model and throughout this
discussion refers to the decrease of the annular film flow rate
to a low value sufficient to cause the annular film to break up
and expose dry patches of the heating surface. However, since
the annular film flow rate calculated in this manner is gener-
ally always a minimum at the tube exit, such a model apparently
cannot predict the observed occurrence of the critical condition
upstream of the test section exit for certain nonuniform flux
distributions. Consequently, while the decrease of film flow
rate to some low value has been demonstrated by Harwell
researchers (34) to be responsible for the critical phenomenon

-51-
in some cases, an additional mechanism probably is responsible
for the occurrence of upstream critical conditions. This mechan-
ism must cause a severe local decrease in the heat transfer
coefficient sufficient to initiate the critical phenomenon at an
axial location where the nominal film flow rate may not necess-
arily go to zero. Mechanisms for promoting local disruption
of an annular film have been proposed by other investigators.
In particular, the occurrence of bubble nucleation on the tube
wall within the annular film has often been cited as a possible
mechanism. Since the initiation of nucleation is principally
dependent on local heat flux, the occurrence of nucleation is
particularly dependent on the flux shape and its M (ratio of
maximum to minimum flux) value. Hence results from a variety
of axial heat flux distributions offer a particularly appro-
priate means to evaluate the nucleation effect as a second
mechanism responsible for the occurrence of the critical pheno-
menon in addition to the dryout effect.
The definitions used in formulation of a model which in-
cludes this nucleation-induced disruption of the annular film
are presented in Figure 26. At every point along the test
section, in the quality region, the ratio of flux required to
initiate nucleation to the actual flux can be obtained as indi-
cated in Figures 26a, b, c, and d. If this ratio is at or
above one, nucleation is presumed to occur, the intensity of
nucleation being directly proportional to the value of the
ratio. Approximation of the local film flow rate is also re-
quired since intuition leads one to conclude that the magnitude
of film flow rate affects the intensity of nucleation required

-52-
to locally disrupt the annular film sufficiently to cause the
critical condition.
The principal factors governing the magnitude of the film
flow rate are (a) evaporation from the film surface (b) entrain-
ment from the film and (c) re-entrainment of water droplets
from the vapor core into the film. Two major simplifying assump-
tions were made (1) for each test section the annular film is
formed at the slug-annular transition with the same initial film
flow rate, and (2) the effect of (b) and (c) was assumed approx-
imately equal for all tubes. Since the test sections investiga-
ted were all 30 inches long (except for three test sections of
48 inches length) and the quality change per unit length did not
vary greatly with flux distribution, the decrease film flow rate
was assumed proportional to the evaporation effect only. Con-
sequently the local film flow rate was taken inversely propor-
tional to the enthalpy addition from the slug-annular transition
point to the point of interest, AHann-x*In this manner the necessary parameters are established to
confirm the hypothesis that the critical condition is caused
by either
(a) a nucleation-induced disruption of the annular film
or if (a) does not occur, then ultimately by
(b) dryout resulting from decrease of the nominal film
flow rate to zero.
The parameters are evaluated at the critical location and
displayed as illustrated on Figure 26e as (q/A)c/(q/A), versus
AHann-c' Figure 26e also indicates the expected behavior of
the experimental data. For critical conditions occurring

-53-
where the flux ratio is above one, nucleation is occurring and
mechanism (a) should be operative. In this region, the nuclea-
tion intensity necessary to disrupt the annular film should
decrease with decreasing film flow rate. Hence the locus of
critical conditions should exhibit a negative slope as indica-
ted.
Where the flux ratio is below one, nucleation is suppressed
and hence mechanism (b) should be operative. Since the only
mechanism for depletion of the initial film flow rate is
assumed to be evaporation, the amount of evaporation required
by mechanism (b) to produce dryout should be equal for all
axial flux distributions. Hence below a flux ratio of one, the
locus of critical conditions should be a vertical line repre-
senting constant AHann-c. Since all critical conditions in
this region are presumably due to dryout, the critical location
of the data falling in this region should be only at the test
section exit.
Figure 26e according to this model, should be valid for
all axial flux distributions operated at given mass velocity
and pressure. While small variations in pressure are accounted
for in the calculation of the basic parameters, large varia-
tions (>100 psia for example) result in variation in nucleation
bubble size and thus may fundamentally affect the basic assumed
mechanism. The success of this postulated model can in part be
measured by the degree of scatter of test results about a mean
critical condition locus. While some distribution about a
mean locus is inevitable due to the simplifying assumptions
made concerning the film flow rate and experimental scatter, a

reasonable coalescence of data from all nonuniform axial flux
distributions on such a plot should be achieved if the postu-
lated model is valid.
Before presenting the experimental results, the exact
method of calculating parameters required by the assumed model
will be presented.
4.3 Calculation Procedure for the Method of Analysis
The presentation of data on an AHann-c versus (q/A)c
(q/A), requires determination of the following parameters.
1) QUALITY AT SLUG-ANNULAR TRANSITION - For the low
pressure data of this investigation, this quality is taken as
8% as discussed in Chapter II.
2) AHann-c, CHANGE IN ENTHALPY FROM THE SLUG-ANNULAR
TRANSITION LOCATION TO THE CRITICAL LOCATION - Establishing the
transition location at the location where quality equals 8% and
the critical location from experimental results, AHann-c can be
readily calculated by a heat balance as described in Appendix D.
3) (q/A) c, CRITICAL HEAT FLUX - The critical heat flux
can be obtained directly from experimental results as described
in Appendix D.
- 4) (q/A),, HEAT FLUX REQUIRED FOR INCIPIENT BOILING -
This heat flux must be calculated at the same conditions of
pressure, quality, and mass velocity as (q/A) c. The Bergles-
Robsenow result (35) is used to calculate the heat flux re-
quired for incipient boiling. Although this result was derived
for single phase flow, it should also be applicable to nuclea-
tion in a liquid film in contact with the heated surface. The

-55-
implicit assumption is that the temperature distribution within
the liquid film can be expressed by the Fourier conduction re-
lation with the conductivity evaluated at the wall surface
temperature. The details of the analysis are summarized in
the insert on Figure 27. The result, presented below, yields
(q/A), as a function of pressure and temperature difference,
TWALL - TSAT '
(q/A) = 15.60Pl.156 (TWAL - TSAT)2.30/Po.0234
From Figure 27 it is seen that this result requires that
a minimum cavity size in the heated surface be present to
serve as a nucleation site. Hence for applicability of this
result, it is essential that the existence of cavities of the
required minimum cavity size be confirmed. The dependence of
(q/A)i with pressure and temperature difference and the minimum
cavity size required are also shown in Figure 27. For compari-
son the limiting condition for incipient boiling, the approxi-
mate fully developed boiling curve, for 100 psia is also shown
in Figure 27. This curve was obtained by modifying the results
of Jens and Lottes (36) to reflect the results of Bernath and
Begell (37) which indicate that slightly larger superheats are
required for an aluminum surface compared to a nickel or stain-
less steel surface.
To use the Bergles-Rohsenow result for predicting perfor-
mance of a test system, the two phase heat transfer coefficient
at the critical location conditions must be established. For
the range of pressures and qualities investigated, the Dengler-
Addoms Correlation (38) is directly applicable

-56-
hTP hL(/Xtt)0 .5
A more general correlation which is also applicable to steam
water mixtures at higher pressures and other fluids has been
proposed by Chen (39), and is fully presented in Appendix D.
This result gives heat transfer coefficients about 15% lower
than the Dengler-Addoms correlation for the conditions of
interest. Since the Dengler-Addoms result is based on data
at similar conditions to those of this investigation, it is
used unless otherwise noted to calculate heat transfer coeffic-
ients. The dependence of hDengler-Addoms with mass velocity
and quality at a given pressure is shown in Figure 28. Com-
bining the results of Bergles and Rohsenow
(q/A)i = f(p) (TWALL - TSAT)f(p)
and Dengler-Addoms
q/A = hDengler-Addoms (TWALL - TSAT)
at the critical conditions, (Pc' Xc, and G), the heat flux re-
quired for inception of nucleation is obtained as the inter-
section of the two equations as illustrated in Figure 29.
With the required parameters determined, the critical
condition can be presented on a AHann-c versus (q/A)c/(q/A)i
plot. Similarly for every point along the test section at the
total critical power condition, the pressure, quality and
mass velocity can be calculated and (q/A), established.
Figure 30 illustrates the results for test section 1271. In
general, as Figure 30 shows, at low qualities (q/A)i is low
and hence the flux ratio (q/A) /(q/A)i is large.

-57-
In this manner conditions along the entire test section at
the total critical power can be represented as shown on Figure
31. For total input power levels less than the critical level,
operating conditions can be calculated for all points along the
test section by the methods described above. Figure 31 also
presents curves for power levels less than the critical level.
It should be noted that Figure 31 presents the behavior
of only the linearly decreasing flux shape. Representation
of other flux shapes on a plot of the same coordinates exhibit
different shapes since values of Hann-x, (q/A) and particu-
larly (q/A) are dependent on the axial flux distribution.
The analysis of the experimental data using the methods just
described will be presented next.
4.4 Application of the Method of Analysis to Experimental Data
The parameters AHann-c and (q/A) i/(q/A) were calculated
for all experimental data. Figures 32, 33 and 34 present the
experimental results at each of the three mass velocities in-
vestigated. In each casc the data can be bracketed to define
a critical condition region. This region should ideally
reduce to a single line which represents the locus of critical
conditions. However, in view of the assumptions made in repre-
senting the film flow rate, as well as experimental scatter of
the results themselves, the width of the data band is to be
expected.
The results of Figures 32, 33, and 34 depend on the exis-
tence in the aluminum surface of cavities of the size required
by the Bergles-Rohsenow nucleation theory. For the experimental
conditions of this investigation, the maximum radius size

-58-required is about 8 x 10⁻⁵ ft. Confirmation of the existence
of such cavity sizes was attempted by visual observation of
the boiling surface at high magnification (1000x). However,
the depth of field resolution was not sufficient to permit
identification of any surface features of depth less than about
3 x 10⁻⁶ ft. Thus while no hemispherical cavities of the
required dimension 8 x 10⁻⁵ ft could be observed, suitable
elliptical or other irregular shaped nucleating cavities of
minor radius less than 3 x 10⁻⁶ ft could not be detected by the
Zeis microscope used. However, as discussed by Brown in
reference (40), the surfaces were investigated by another
method which confirmed the existence of nucleation sites by
their active nucleation behavior in a superheated pool. This
method indicated that cavities of about 2.0 + 2.0 x 10⁻⁵ ft
equivalent radius were present in the test surface. Since
these cavity sizes were slightly less than those required by
the theory, in principle a modification should be made to the
theory as shown in the insert of Figure 35 to account for this
deviation. The remainder of Figure 35 presents a dimensionless
representation from Brown (40) of the Bergles-Rohsenow nuclea-
tion theory modified to account for surfaces having limited
cavity sizes. However, as Figure 35 shows, for the experimen-
tal conditions of this test, only slightly higher heat fluxes
are required because of the actual cavity sizes present. In
view of the small correction involved and the uncertainty in
actually assessing the cavity sizes present in the test alumin-
um surfaces, this small correction was not made in analysing
the data in this investigation.

-59-
As anticipated, the critical limits of Figures 32, 33,
and 34 are negatively sloping lines representing the decreased
nucleation intensity necessary to disrupt the annular film as
the film flow rate decreases. In addition, where the flux
ratio decreases below one, i.e., where nucleation ceases, the
critical limits become vertical suggesting that in this region,
dryout is the mechanism for causing the critical condition. As
previously mentioned, data falling in this dryout region should
exhibit a critical condition at the test section exit only.
Table IV-C below tabulates data in this dryout region from
Figure 33 (nonuniform heat flux data was obtained in the dryout
region for G = x 106 LBM2 only). In all but one case theHR FT
critical location occurred within 3% of the tube exit. In
this one case (No. 1555) and other cases having the critical
location between 1 and 3% from the exit, the flux profile
had a severe negative gradient with length near the exit. Thus
axial conduction effects probably account for the slight devia-
tions from predicted behavior of these test sections.
Clearer delineation of this dryout region was not possi-
ble since 48 inches was the maximum length of test sections
that could be fabricated and installed in the apparatus. How-
ever, Figure 36 presents additional low pressure data taken at
Harwell (41) on uniform tubes from 9 to 96 inches long. In
Figure 36 the dryout region is clearly apparent. In addition,
however, the dotted lines in this figure identify an additional
stratification within the critical region with tube length.
This stratification is probably due to entrainment and re-
entrainment contributions to the film flow rate which must be

-60-
expected to vary significantly with varying test section length.
Test FluxSection Shape
CriticalLocation AHann-c (q/A)C/(q/A)i
210
211
332
336
508
1254
1255
1554
1555
LINEAR1556 DECREASING 5.75
LINEAR
PEAK INLET 5.75
2.27129.6 + 1 inches
2.27 29.5 + 0
4.03 28.9 .2
4.03 29.5 .3
5.7529.0 + .3
2.27|29.8 + 0
COSINE
COSINE
COSINE
COSINE
COSINE
LINEAR
DECREASING
LINEAR
DECREASING
LINEAR
DECREASING
LINEAR
DECREASING
5.75 29.2 + .4
28.6
29.3 +
.5
.3
331.2
326.5
313.7
312.2.
350.6
333.1
343.3
339.4
326.7
324.9
334.4
1.2
1.09
1.01
.74
.69
1.10
1.13
.74
.86
.69
.71
TABLE IV-C CRITICAL LOCATIONS FOR TEST SECTIONS HAVING RATIO
(q/A) c/(q/A), APPROXIMATELY EQUAL TO OR LESS
THAN ONE. (G=l.0 x 106 LBM/HR-FT2)
4.4.1 Discussion of Results
From Figures 32, 33 and 34, it is seen that a critical
region can be established which represents both postulated
mechanisms for the critical condition. This critical region
is shown below to provide a reasonable criteria for predicting
both Qcrit and critical location for all axial flux distribu-
tions.
2.27129.8 + 0
5.75128.2 + .1
2506

-61-
4.4.1.1 Total Critical Power
Figure 31 previously showed the variation in test section
operating lines with total input power. Since the critical
condition can occur whenever any portion of the test section
operating line projects into the critical region, the power
change necessary for any point of an operating line to pass
through the critical region represents the maximum uncertainty
in predicting total critical power. As Figures 37 and 38
which represent various flux distributions show, it requires
about 20% variation in total power for any given test section
location to pass through the width of the critical region.
Taking the critical locus through the midpoint of the critical
region, prediction of Qcrit within + 10% can be made for any
flux distribution investigated once the critical region for
given mass velocity and pressure is experimentally established.
This region can be established by a combination of tests of uni-
form and nonuniform flux distributions as in this study or
with uniform data only as the Harwell data of Figure 36 indicates.
4.4.1.2 Critical Location
The critical location results presented in Figures 14, 17
and 20 exhibited some significant variations with flux distrib-
ution and inlet subcooling. These variations can be qualita-
tively explained in terms of the critical regions established
for each mass velocity on the (q/A)c/(q/A)i versus AHann-cplots. The basis of these qualitative arguments is that the
critical condition will occur at that test section location
of the operating line which first intersects the critical
region.

-62-
EFFECT OF FLUX DISTRIBUTION
The most striking experimental result is that for uniform
and linearly increasing flux distributions as opposed to the
others tested, the critical condition always occurs at the
tube exit. A clear explanation lies in the shape of the test
section operating lines for these flux distributions. As shown
in Figure 39, the operating lines are convex when viewed from
the origin. Thus the tube exit always intersects the critical
region first, causing the critical condition to occur at the
tube exit.
On the other hand for the flux distributions with a flux
peak along or at the exit of the test section, the operating
lines are concave when viewed from the origin as illustrated
in Figures 40, 41 and 42, This concave portion is always
bounded by the location of maximum flux and the tube exit.
Hence some location downstream of the maximum flux always will
intersect the critical region before the maximum flux location.
This characteristic appears to explain the observation that
the critical condition always occurs between the maximum flux
location and the tube exit for such flux distributions.
EFFECT OF M VALUE
The second experimental observation is that for test sec-
tions of the same flux shape at the same inlet subcooling, an
increase in M will cause the critical location to move up-
stream from the tube exit. This is shown in Figure 40 for
the linearly decreasing flux shape and for the cosine flux
shape. The increased concavity resulting from increased M
value causes upstream portions of the operating line to inter-

-63-
sect the critical region before the tube exit portions. However,
for the cosine shape M = 2.27 this result does not follow as
shown in Figure 40 because the M factor is so low that the oper-
ating line is a straight line almost parallel to the critical
region. Hence in this case, failure at any point past the
maximum flux location is generally equally probable.
EFFECT OF INLET SUBCOOLING
The significant effect on critical location due to inlet
subcooling can also be qualitatively explained. First, it should
be observed that the effect of decreased subcooling on the test
section operating line is to extend it to larger values of
H ann-x. This results from a net gain in total heat input over
the annular region owing to a larger decrease in heat input from
the inlet to the annular transition compared to the decrease in
total critical power. The effect of this change in operating
line length is to permit the exit portion of the operating line
to approach the dryout portion of the critical region where
the critical condition will occur if local conditions do not
cause its prior occurrence upstream from the tube exit. For
this reason, the critical location should move to the tube exit
as the inlet subcooling is decreased. This effect is shown in
Figure 41 for the inlet and the exit flux peak distributions,
and Figure 42 for the linearly decreasing flux distribution.
It should be recognized that due to the shapes of the operating
lines and critical regions, in some cases several locations are
equally probable as the critical location. Thus the locations
of the critical conditions have a fairly large experimental
spread (see Table IV-B) and consequently can be only qualitatively

-64-
confirmed by the model developed in this work.
The effect of experimental variables on the critical condi-
tion can be summarized as follows:
Mass velocity - The mass veloc'ity has been the key variable in
the presentation of Figures 32, 33 and 34. Figure 43 summar-
izes the results for the three mass velocity values selected.
This data exhibits the behavior predicted by Bell (4) that for
a given quality (AHann-x in this case) the critical heat flux
is inversely proportional to the mass velocity.
Length - The test data of Figures 32, 33, 34 and Figure 36
which presents the Harwell (41) data, illustrates that the loca-
tion of the critical condition approaches the dryout region as
the test length increases. Figure 44 shows that for the longer
tube lengths, the test section operating lines for uniform
flux are S shaped instead of simply convex as are the shorter
lengths. If a similar S shape can be shown to exist for long
uniform tubes at high pressures, it is possible that an upstream
portion of the test section operating line would first intersect
the critical region. This could offer a plausible explanation
for the upstream critical conditions which have been observed
by Waters et al (42).
Inlet Subcooling - As previously discussed, decreased inlet
subcooling tends to extend the test section operating line to
larger exit quality regions (larger AHannx ). Thus inlet sub-
cooling variations can cause the critical phenomenon mechanism
to change from nucleation-induced film disruption to dryout.
Figure 45 indicates the effect of the inlet subcooling on the

-65-
Harwell data. It should be noted that in Figure 45 for the
12" long section, the inlet subcooling does not cause the
AHann-c to increase at low values. On the Harwell presenta-
tions this effect shows as an unexplained decrease in critical
heat flux with low inlet subcoolings. Unfortunately, analysis
of the Harwell data by the method proposed in this report does
not explain this discrepancy.
Diameter - The effect of diameter has not been investigated in
this study. Prediction of the effect is difficult since a dia-
meter change results in conflicting increases and decrease of
the relevant parameters. For example at fixed 0, as the diameter
increases, the local flux q/A tends to be decreased but since
the local quality would also decrease, (q/A), would also tend to
decrease. The net result on the flux ratio cannot easily be
predicted although AHann-c would be expected to be decreased.
Thus as diameter increased, with G, P, A and AHINLET constant,
the operating curve may be elevated or lowered on the flux ratio
(vertical) axis, but would be displaced toward the origin of
the AHann-c axis.
D2 > D,
Operating line for D2 is predictedwithin this region
erating line for D,'
AHann-c

-66-
This prediction assumes that the basic mechanism is not funda-
mentally altered by a diameter change. This assumption may not
be valid since a diameter change will affect the ratio of surface
radius of curvature to bubble diameter, a parameter which could
be of importance in defining the critical condition mechanism.
4.4.2 Discussion of Results - Flux Spikes
In addition to the experimental results already presented,
eleven additional tests were performed with test sections
having a localized flux peak, i.e. a flux spike. These flux
spikes were superimposed on available test sections already
having uniform and cosine flux distributions by additional
local reduction in the tube outside diameters. The flux pro-
files investigated are illustrated in Fig. 10 and the test geom-
etry and results are tabulated in Appendix F.
The investigation of flux spike shapes is important for
the following two reasons which are discussed in detail below.
1) The flux peak offers a unique opportunity to investi-
gate the validity of the model already developed to describe
the occurrence of the critical condition.
2) The effect of such flux peaks on the critical condition
and the resultant total critical power is pertinent since flux
peaks are present in reactor systems.
APPLICATION OF MODEL TO FLUX PEAK DATA
Figures 46 and 47 present the test results on the appro-
priate coordinates for comparison with the predictions of the
model which has been developed. Note that Fig. 46 represents
cosine flux distributions with stepped spikes of length varying
from .085 to 1.5 inches. Figure 47 represents uniform flux

-67-
distributions with cosine spikes of length varying from 1.0 to
9.0 inches. Axial conduction effects have been investigated
and determined to be negligible since in the worst case
(shortest spike length), the applicable L/D ratio is about 15.
From the results of Figures 46 and 47, the following conclusions
can be drawn:
1) For short spike lengths, a larger value of the flux
ratio, (q/A)c(q/A)i, is necessary to cause a critical condition
than predicted by the model. However, for spike lengths
greater than about 1.5 inches, or as the flux peak distributions
approaches the shape of the other flux distributions investi-
gated, the critical condition can be predicted by the model.
This observation indicates that conditions prior to the flux
peak location play some additional role not included in the
model in defining the occurrence of the critical condition.
However, sufficient additional data for flux spikes was not ob-
tained to generalize the model to accurately predict behavior
of flux spikes of short length. Nevertheless, the model
developed can still be applied in practice to flux peaks of
short length since conservative predictions result.
2) The existance of two critical regions, one caused by
nucleation induced film disruption and the other by film dryout
is further confirmed. This confirmation is particularly
apparent from Fig. 47 where the flux peak M values (maximum
flux/minimum flux) were systematically altered. For the lowest
M values, the nucleation-induced film disruption mechanism is
operative since the flux peak reaches a critical condition
before the test section exit reaches the dryout region.

-68-
TOTAL CRITICAL POWER
Table IV-D below presents the results of the total critical
power for test sections with flux peaks. These results indi-
cate that the total critical power for flux peak distributions
up to an M value of 5.75 is slightly greater (0-15%) than that
for uniform flux distributions at the same inlet conditions.
The increase is inversely proportional to the M value, the test
sections with lower M values exhibiting the largest increases
in total critical power. For flux spikes of M = 7.0, the total
critical power becomes slightly less (0 to -4%) than that for
uniform flux distributions at the same inlet conditions. As
mentioned above, these results can be confirmed for spike
lengths 1.5 inches or greater by application of the model
developed. However, for flux peaks of shorter lengths, the
model yields conservative predictions and hence total critical
power values less than those for uniform flux distributions
would probably be predicted for these cases.

-69-
TABLE IV-D
TOTAL CRITICAL POWER RESULTS FOR TEST SECTIONS WITH FLUX PEAKS
Ratio of'
Test SpikeSection Length
inches
Maximumto
MinimumFlux
Inlet CriticalSubcooling Power
BTU/lbm BTU/hr
% increase intotal criticalpower above thatfor uniform fluxdistribution
0326
0345
0343
0344
7210
7510
7710
7250
7550
7750
.085 4.17
.50
.50
1.5
1.0
1.0
1.0
5.0
5.0
5.0
4.17
4.52
5.14to
4.54
2.27
5.75
7.0
2.27
5.75
7.0
7290 9.0 2.27
-67.4 1.09 x 10⁵
-119. 3 1. 255 x 105
-116.6 1. 205 x 105
-113.8 1.198 x 10⁵
-114.1 1.247 x 10⁵
-115.3 1.138 x 10⁵
-110.1 1.125 x 10⁵
-116.5 1.300 x 10⁵
-105.6 1.109 x 10⁵
-103.0 1.061 x 10⁵
-116.8 1.263 x 10⁵
+5.0%
+9.2%
+5.8%
+5.7%
+0.7%
+0.5%
+14.6%
+0.0%
-4.
+10.2%

-To-
4.5 Application to Higher Pressures
The success of the model in explaining behavior of low
pressure results suggests its application to higher pressure
data. In applying the model to existing high pressure data,
two difficulties are encountered.
1) Measurements or a correlation of the heat transfer
coefficient for annular flow at pressures above 550 psia are
not available. Consequently the Chen correlation (39) was
extrapolated from 550 psia to 2000 psia to yield required two
phase heat transfer coefficients.
2) The critical condition locations for available non-
uniform results at high pressures have a large uncertainty.
This results from the burnout detection systems used to
detect the location of the critical condition.
However, estimating heat transfer coefficients from the
Chen correlation and carrying the uncertainty in critical loca-
tion, the model has been applied to a limited amount of high
pressure data with the results illustrated in Figs. 48 and 50.
In these cases, the quality at the annular transition location
has been approximated as 6% and 14% respectively from the pre-
liminary results of Suo (21).
The shape of the critical locus in these figures is simi-
lar to that for low pressure data in that the flux ratio re-
quired to produce the critical condition decreases as the film
flow decreases. However, the magnitude of the flux ratio re-
quired to produce the critical condition is an order of magni-
tude higher than for low pressure conditions. This could
result from the uncertainty in the two phase heat transfer

-71-
coefficient value. A dryout region is not indicated in these
figures. Additional data at the test conditions represented
in these figures is necessary to fill in the regions of higher
AHann-c to establish the existence of a dryout region. Even
if the heat transfer coefficient is an error, such a region
should still be indicated although it may occur at a flux
ratio higher than 1.
Figure 48 represents Babcock and Wilcox data at 1000 psia
from reference 15. The limit bands indicated reflect the large
uncertainty in critical condition location which result in
very broad limits for the critical region. As illustrated in
Fig. 49, the width of the critical region including the maxi-
mum uncertainty limits is about + 40%. However even considering
the most probably critical locations, the width of the critical
region is still + 20%.
Figure 50 presents earlier Babcock and Wilcox data from
reference (5) taken at 2000 psia. The width of the critical
limits can be considerably reduced if the diameter difference
between test sections in this experiment is recognized. As
illustrated in Fig. 51, the minimum critical region in this
case is approximately i 15%. This latter Babcock and Wilcox
data also contains four results for test sections with flux
spikes superimposed on cosine flux distributions. These data
indicates a distinct movement of the critical condition from
the flux spike to the test section exit as the inlet subcooling
decreased.
In terms of the model, this effect can be qualitatively
explained. Recall that the effect of decreased inlet subcooling

-72-
as discussed in Section 4,,4.1.2 is to extend the test section
operating line to larger exit quality regions (larger AHann-c)'
Thus decreased inlet subcooling should cause the critical
phenomenon to shift from a nucleation-induced film disruption
at the flux peak location to film dryout at the test section
exit. The critical location will thus shift with decreased in-
let subcooling from the flux peak to the tube exit,
Figure 52 illustrates the operating lines of the flux
spike test sections. The critical location is seen to shift
to the test section exit which extends to larger values of
AHann-x with decreased subcooling. If a dryout region is
assumed to exist at high values of AHann-x as was shown for
the lower pressure results, these Babcock and Wilcox as well
as the Bettis flux spike results of reference (1) can be ex-
plained. In particular the behavior of the spike effectiveness
value, E , as introduced by Bettis (reference 1) and illus-p
trated in Fig. 1 is readily predictable. When the critical
condition is caused by nucleation-induced film disruption, 03will equal #2 (see Chapter 1 for definitions) and E willp
equal L For a dryout caused critical condition, 03 will equal
and E will equal 0. Hence the model predicts the observed
Bettis result that with decreased inlet subcooling E goesp
from 1 to 0 and the critical condition moves from the flux
peak location to the tube exit,
However,9 due to the uncertainties in heat transfer coeffic-
ient and critical location determination and limited data at
fixed conditions of flow, pressure and diameter, application of
the model to high pressure data as yet does not indicate the
existence of the dryout region and results in a broad predicted

-73-
critical region due to the film disruption mechanism. Neverthe-
less the model does yield the correct shape of the critical
locus in the nucleation-induced film disruption region as well
as a reasonable possible explanation for flux spike results.
These qualitative predictions indicate that successful extrapo-
lation of the model to the high pressure region may be accom-
plished when the heat transfer coefficient and critical location
are determined more accurately for test runs in this region.

CHAPTER V
SUMMARY AND CONCLUSIONS
5.1 Summary
An experimental and analytic investigation of the effect
of axial beat flux distribution on the critical flux has been
performed. Experimental determination of the total critical
power and critical location was accomplished for a wide variety
of flux distributions. An analytic model describing the
occurrence of'the critical condition was developed which
explains the behavior of the low pressure experimental results.
This model assumes that the critical condition is caused
by either
(a) a nucleation-induced disruption of the annular film
or if (a) does not occur, then ultimately by
(b) dryout resulting from decrease of the nominal film
flow rate to zero.
The basic assumptions in analytically formulating this model
are
(1) an annular film is established at the annular transi-
tion location predicted by Baker (24)
(2) the effects ofentrainment and re-entrainment on the
local annular film flowrate are approximately equal for tubes
of similar length. Hence the local film flow rate decrease
with test section length was assumed proportional to the evap-
oration effect only
(3) the heat flux required to initiate nucleation can be
predicted from the Bergles-Rohsenow correlation (35) using
heat transfer coefficients calculated from the Dengler-Addoms
correlation (38).

-75-
The resulting procedure does not allow prediction of critical
conditions from simply the specification of the relevant inde-
pendent variables but does provide a method by which limited
experimental data can be used to establish a locus of critical
conditions which is applicable to test sections with nonuniform
axial flux distributions. Specifically uniform test data
taken at fixed pressure, mass flow rate, and diameter can be
used to predict critical conditions for various flux distribu-
tions at the same pressure, mass flow rate and diameter but
with varying inlet subcooling and test section length.
5.2 Conclusions
The conclusions of this investigation can be summarized
as follows.
1) Total input power to achieve a critical condition:
(a) For the cosine and other flux distributions with
the maximum flux near or at the test section inlet, the total
critical power is within -10% (peak inlet) to +10% (others) of
that for uniform flux distribution.
(b) For flux distributions with the maximum flux near
or at the test section exit, the total critical power can be
up to 30% less than that for uniform flux distributions.
This deviation, however, approaches zero as the inlet condi-
tion approaches the saturated condition.
(c) For flux spikes of various lengths with theratio
of maximum to minimum flux up to about six, the total criti-
cal power is about 0 to 10% greater than that for uniform flux
distributions. For more severe flux spikes, the total critical
power becomes less than that for uniform flux distributions.

-76-
2) The Critical Location:
(a) For uniform and monotonically increasing flux
distributions, the critical location occurs very near to or at
the test section exit.
(b) For flux distributions with the flux peak at any
location except the test section exit, the critical condition
can occur upstream depending on the inlet subcooling and the
M walue (ratio of maximum to minimum flux). The critical con-
dition tends to move upstream as either the subcooling and M
value increases.
3) The analytical model proposed to describe the occu-
rrence of the critical condition successfully explains the
test data for all axial flux distributions except flux spikes
of short (A 1.5 inch) extent. For these short flux spikes,
the model predicts lower local critical heat flux and total
power values than were determined by experiment.
4) Application of the model to high pressure data gives
qualitative agreement with test results. More precise
experimental determination of the critical location and data
yielding two phase heat transfer coefficients are needed at
these higher pressures to effectively test the validity of the
model under higher pressure conditions.
5.3 Design Procedure (50-200 psia)
Based on the conclusions of this investigation, the
following design procedure can be used to establish safe opera-
ting limits for vertical up flow in tubes with nonuniform axial
flux distributions.
1) Establish locus of critical conditions - For the mass
velocity, pressure and tube diameter of interest, use existing

-77-
critical data to plot the critical conditions on coordinates
of (q/A)C/(q/A) versus AHann-c. Section 4.3 explains in
detail the method of calculating these parameters from experi-
mental data. This data may include uniform flux data or a
combination of uniform and nonuniform flux data from tubes
of all lengths.
2) Establish design conditions - Pick the axial flux
distribution and values of inlet subcooling and test section
length of interest. These values along with the previously
established values of mass velocity, pressure, and diameter
fully establish the design conditions.
3) Calculate the test section operating line for an ar-
bitrary value of total input power, QTOT - Select a value of
QTOT and calculate the test section operating line as described
in Section 4.3 Plot this operating line with the locus of
critical conditions determined per (2) above.
4) Establish Qcrit - For varying values of QTOT' plot
operating lines until the locus of critical conditions is
intercepted. The value of QTOT for this intersection is Qcrit
and the test section axial location at the intersection is the
location of the critical condition.
5) Optimize - Vary inlet subcooling, test section length
and axial flux distribution as allowed by design requirements
to maximize the parameters of design interest; generally the
total critical power (Qcrit *

-78-
APPENDIX A
ERROR ANALYSIS
It is imyortant to estimate the probable errors in the
two basic parameters of interest, the critical heat input to
the test section and the local heat flux.
The heat input is computed from measurements of the voltage
drop across the heated length and the current to the section.
Since the critical condition was generally reached while the
input power was being increased to a slightly higher level, the
error in the total critical power includes both an uncertainty
from this operational procedure and a measuring instrument uncer-
tainty.
For the voltage drop, this operational variation was about
.15 volts over the range 12 to 27 volts and the voltmeter
accuracy w~s + 1/2% of full scale. Hence in the worst case
(lowest power level) the uncertainty in the voltage at the crit-
ical condition was
r = 12 +.3 volts or + 2.5%
The current was inferred from the voltage drop across an
air-cooled N.B.S. shunt with a calibrated conductance of 60.17
amps/mo. The uncertainty from the operational procedure was .3
my over the range 23 to 52 my, and the voltmeter accuracy was
+ 1/2% of full scale. Hence in the worst case (lowest power
level) the uncertainty in the current at the critical condition
was
I = 60.17(23 ± .6) amps or 2.6%
Hence the most probably error in power for the lowest power
cases was
(2.5)2 + (2.6)2 ' 3.4%

-79-Note that the experimental reproducibility of total critical
power results as summarized in Table IV-B was 5 to 10%.
The local flux for electrically heated test sections is
obtained as
dA dA dA0(z) = --- - = -- E- 0dQ I 2 dR Ip
From these equations we see that perturbations in the local flux
are principally caused by variations in Ax(L), p(T), and dQ
(axial conduction effects). The variations in these parameters
will be separately estimated to arrive at the overall experimen-
tal error in the local flux.
A -Wall Cross-Section Area
Variations in Ax are due to (1) variations in test section
internal diameter and (2) variations in the outside diameter
due to machining. The machining errors were controlled by 100%
inspection of test section outside diameters for conformance with
allowed tolerances. The net actual variation in Ax was estab-
lished by measuring wall thicknesses on 32 sections taken from
seven tubes selected randomly to represent all the basic
designs. From these measurements the average variation from
design of wall thicknesses (4 at each section) was 3.5% with
a maximum variation of 7.5%.
p(T - Electrical Resistivity
Variations 'in resistivity result from wall temperature
differences due to axial changes in heat transfer coefficient.
The changes in heat transfer coefficient result from the axial
quality changes which can exist in a test section.

-80-
The variation in wall temperature along a test section can
be bounded as follows. The minimum (Tw-TSAT) can be taken from
the fully developed boiling curve at a heat flux of 3 x 10⁵
since heat fluxes of interest in this work were all above
3 x 10⁵ BTU/hr ft2 . From Fig. 29, (TW-TSAT )MIN is 400F. The
maximum (TW-TSAT) can be also taken from the fully developed
boiling curve at the maximum heat flux achieved in test i.e.
3 x 10⁶ BTU/hr ft2. From Fig. 29 (TW-TsAT)MAX equals TOOF.
Hence, the maximum wall temperature difference for the composite
worst case is 300F.
Now for the 2024-T3 alubminum used, the resistivity as a
function of temperature is
p(T) ohm-ft = .1765x0-6 L1+1.152xlO-3TOFi
in the range 200-5000F. Based on the nominal experimental
pressure of 100 psia, (32780F) the maximum variation in resis-
tivity along a test section would be 2.2%
dQ - Axial Conduction
Axial conduction effects can also be bounded by a worst
case analysis. The maximum axial heat transfer is given by
dQaxial = kA
where
k2 02 4T3 aluminum 8 80 hTUhr ft0F
Ax maximum = 248x10-6 ft2 (.3020.0 inch, .214 inch I.D.)
7T 50F ft 480F/ft (the maximum axialmaximum * temperature differ-
ence of 300F canoccur over a minimumdistance of 7.5 in.in the peak inlet andexit designs)

Hence dQAXIAL MAXIMUM 1 BTU/hr. The minimum radial heat
transfer, assuming the minimum heat flux is 1x10⁵ BTU/hr ft2,
is about 500 BTU/hr.
Hence in the worst composite case the axial heat flow is
less than .5% of the radial heat flux. This is primarily due
to the thin wall test section geometry which yields large
L(length)/D(wall thickness) ratios thus inhibiting axial
conduction. In the immediate regions of the test section inlet
and exit, the temperature gradients are probably more severe
and the local flux profiles in these extreme locations may be
somewhat effected by axial conduction effects.
Overall Variation
Combining the effects discussed above, and the estimate
of the most probable error in local heat flux is obtained as
S(3.5)2 + (2.2)2 + (.) 4.2%
48" Long Test Sections
These test sections were fabricated by coupling two
shorter length together with a 1 1/2" threaded thin walled
sleeve (TEST SECTION 114136) or a 1" soldered thin walled
sleeve (OTHERS). Hence, at the midsection of these test
sections over the sleeve length, the heat flux is slightly
lower than over the remainder of the test section.

-82-
APPENDIX B
TEST SECTION ANALYSIS
The analysis of the experimental data first requires
calculation of various parameters from the test section
data. These parameters, which are dependent on the flux
profile shape are derived on the following pages.
The governing heat balance expression relating heat
flux and electrical heat imput, applicable to a length
dx of tubing is
#(x)rD dx = I2dR = 12 f dx (B-1)
The assumptions inherent in this expression are
1. One dimensional (radial) heat flow
2. Adiabatic outside diameter tube wall
3. Constant radial temperature profile so that
J (T) is a constant
4. No asmuithal variation in tube wall thick-
ness so that the power is generated uniforml;
throughout the tube wall at any axial
location.
This expression can be assumed to be applicable over the
entire tube length with the additional assumption of
1. Constant tube temperature so that/ which

-83-
is temperature dependent is a constant over
the entire tube length.
These assumptions are shown, in Appendix A, to be met
for the data presented and analyzed in this work and
hence equation (1) serves as a valid point of reference
for the following derivations. In the following deriva-
tions consistency of units is assumed; hence for use in
actual computations numerical factors should be inserted
where appropriate to assure this consistency of units.
Also for the uniform and linear flux shapes, x is used
as the axial position variable, while for the cosine
and peaked flux shapes, z is used as the axial position
variable.

-84-
UNIFORM FLUX PROFILE
The flux shape in this case, figure 10,is simply
(x) = 0 (B-2)
From equation (1) we obtain
I2fA (x) = A =
and by the governing assumptions we find that Ax(x) = Aand hence D0 is also constant. However it is desirable
to obtain all relevant parameters in terms of experimnen-
tally determined quantities as is accomplished below
a. O(x) x
Q(x) =f 0' Di dx
QTOT = 0'D 191
QTOT (B-3)
b. D(X) =
From equation (1) we obtained Ax as a constant,
hence42Do = [4 Ax + D (B-4)
Now A is a function of the overall tube resistance R
which is established to make maximum use of the available
D.C. power supply. The maximum power supply available is
72 kilowatts at 24 volts and 300 amperes hence establish-
Ing the optimun tube resistance as 8.0 X 10~3 ohms.

-85-
Again from equation (1)
dR = dx
x
and substituting this into equation (4) we obtain
)+ D
c. Q(x) x
Now Q(x) =f0
g(x)7D dx in general. For (x) = 0
per equation (3) we obtain simply.
Q(x) =TOT -
(B-5)
(B-6)

-86-
COSINE FLUX PROFILE
The flux shape in this case as shown in figure10 is
O(z) = 9 cos for - - z L+ (B-7)AX L 2 (B-f2
Note that as defined in figure14 L represents one half
wavelength of a cosine wave which is truncated at z = + Q/2
to form a test section of physical length J2. Using this
flux shape, equation (7) and equation -(l), we derive the
relevant parameters in terms of experimental quantities
as follows:
a. O(z) z
Q(z) = O(z) v D dz
+ _/
QTOT MAX cos 7 D dz
- /2
Yields
0'MAX QTOT2D L sin
and
(z)= QTOT cos EE (B-8)
2DiL sin L
This expression however contains the quantity, L, which
can be expressed in terms of the physical length, A-,
and the quantity M which is defined below as the ratio of

-87-
the maximum flux to minimum flux.
M MAX (B-9)MIN
and thus is a crutial variable in selection of the flux
profile for experimentation.
Now from (1) we see that for Di, 1 2, and f constant,O(z) is inversely proportional to Ax (z). Hence at z = 0
where O(z) is maximum, A (z) is minimum and conversely at
z = U/2 where O(z) is minimum, Ax (z) is maximum. This
leads to the relations.A
0(z) = MA cos ; Ax(.z) = Mz (B-10a)
at z = +J2/2 0MIN MAXcos and A - AMIN (B-10b)cos
MIN MINA= OS
Hence cos MIN _ MIN = (B-10)MAX MAX
Thus we obtain
L = (B-11)cos 1/M
and using the identity, sin = - we obtain
sin 1, -cos 2 2(B-12)
Substituting these values into equation (8) we obtain the
desired result
O(z) QTOT Cos z$(z)j :- =. ,co L~~(-13)2DL M- 1(B
N 2

-88-
where L is retained for convenience and defined in
equation (11).
b. D0 (Z)
D (z)4= A (Z) + D 2Now
Again from equation (1) obtain
+ 2/2
R =/ 2
dR= fdz
912 A A (z)
Now substituting from equation (10) where Ax(z) is
defined, obtain
M cos dzA MINL
R =2f L sin -AMIN
2
or
A sin
A (z) AMIN z 2fL s zCos -- cos L
Substituting (15) into (14) we obtain the desired result
(8) f L sin 1D9(z) =J2 2z
R COS LT Z
2+ D
(4) AMIN 2-~_ Tz + D1W CosL
(B-14)
(B-15)
(B-16)
+ 2/2
-kJ/2

-89-
c. Q(z)
Now Q(z)z
rD i 6(z) dz
-z
Q~z) =
-k/2
+z
- /2
D cos !Z dz
D Mrz dzi Oj7MAXJ Jb L
for -k2/24z i O
for 0S z4+ Q/2
Carrying out the indicated operations and substituting for
QTOT
2D L sin2 Lper equation B-8
and
sin =
QTOTQ(z) = 2
Q(z) = TOT
M 2
Mper equation B-12
sin L1 ~ or - z s.O
M -21-jM2
sir -z1+ - L for 0 z :+ -/2
M-1 jwhere L is defined as equal to i 2 per equation (11).
cos- 1/m
OMAX
obtain
and
(B-17)
(B8-18)

-90-
LINEARLY INCREASING FLUX PROFILE
The flux shape in this case as shown in figure 10 is
(x) = IN + (OUT IN) for 0 4 x i (B-19)
Using this flux shape equation and equation (1) we
obtain
a. O(x)
QTOT OIN + (OOUT 0IN) rDINdx
Q rTD + B-0TOT 2 IN + 0UT (B-20)
Now M = OUT for a linearly increasing flux9IN
and hence-YD A l+M irD A
QTOT 2(144)OUT M 2 IN +Ml
0OUT ID [l+M (B-21)
OIN D T [1 (B-22)
Substituting these expressions for 0IN and 0OUT into
equation (19), we obtain the desired result
2(x) = (11) [1 + (M-l) (B-23)s

-91-
b. D0(x)
Now in general D0 (x) A (X) + D (B-24)
Proceeding as in the cosine tube case we obtain
from equation (1) the general expression for overall
tube resistance, R,
R= dR =
Now from equation (1) we also obtain an expression for
A (x) as follows:
O(x) A 2 f 1rDi I x
At x = 0
At x =
Henc e
IIN A2f 1I Di AIN
I2f 1OOUT irD i A OUT
OIN AOUT =
IN
(B-25)
(B-26)
(B-26a)
(B-26b)
(B-26c )
Substituting the above equations, 26a and b,
(1) we obtain
0(x) = rDi
into equation
[ A IN + AOUT A N(B-27)
Now equating the expressions for O(x) from equations(26 )
and (27) obtain
A x(x) = + (B-28)
AIN AOUT IN

-92-
or utilizing equation (20c)
AIN
1 + (M-1) T
Now substituting the expression for A (x),
into equation
equation
(25), we obtain
(l+(M-l)-)AIN
0
dx = I A2A N
(M+l)
AIN = R(M+1)
and from equation
Ax (x)
(29)
= IL (M+l)2R 1+(M-l)
Substituting equations (29) and (31)
1 (B-31)
into the general
expression for D (X), equation (24), we obtain the desired
results.
D (x) 12A (M+l)=vrR [l+(M-l) X1
+ D( 4 )AIN
Tr7 1+(M-l)D2
(B-32)
c . Q(x)
Now Q(x) (x)dx
Performing the indicated integration yields
(-l
A (x) (B-29)
(29),
Hence
(B-30)
(B-33)O(x) = 2QOTZ +

-93-
LINEARLY DECREASING FLUX PROFILE
The flux shape in this case is the mirror image
of the linearly decreasing profile and is shown in
figure 10. In this case the maximum flux occurs at the
test section inlet and hence is written as
O(x) = OIN -OUT) Xk for 0/x (B-34)
and M in this case is defined as the inverse of the
linearly increasing flux case and is written as
M= OINOUT
(B-35)
These basic expressions are different from corresponding
quantities of the linearly increasing flux profile and
hence yield different expressions for the desired parameters
as shown below.
a. O(x)
STOT -IN I~ OUT idxo
TOT 2 IN+ #0UT
However since M = IN , we obtain
D A
QTOT 2 IN
D k
2 0IN 1+M]
(B-36)
(B-37)
- IN

and OIN'TOT
#0UT = 2QTOT
Substituting these expressions
equation
for OIN and OOUT into
(34), we obtain the desired result
2Q TOT0'() =A
S( MI (1 (B -40)v) -)
b. D0 (x)
Now in general
From equation
9,R =f d
0
Now from equation(
A (x) as follows
I(x)f
At x = 0
D(x) = A (X) + D 20 IN xi
(1) obtain
R fdxf 77
1),9 we also obtain an expression
1
OIN =rDi
Atx I i2fAOUT vD.
Hence
1
IN
1AOUT
(B-41)
(B-42)
for
(B-43)
(B-43a)
(B-43b)
(B-43c)= AOUT
MAIN
I(Mv l+MJ
(i-+-)
(B-38)
(B-39)

-95-
Substituting the above equations, (43a) and (43b), into
equation (1) we obtain
O(x) = 2 + ) (B-44)uD AIN OUT AIN)
Now equating the expressions for O(x) from equations
(43) and (44) obtain
A (x) = A N ( - (B-45)
A + A OT A jt
or utilizing equation (43c)
A (x) = MIN (B-46)x 1-M x
1+ M 1
Now substituting equation (46) into equation (42)
R (l+ ) dx M (B-47)J I IN
0
Hence
A M+) (B-48)IN 2R M/
and from equation (46)
FZ(MlA (x) ' M x (B-49)
2R l1 +(l M)
Substituting equations (46) and (49) into the general
expression for Do(x), equation (41), we obtain the
desired results

-96-
2 fI{ MlD (x + D2 4 A IN 2D TR 1+(IIJ I +(- lN 2 D
(B-50)
c. Q(x)x
Now Q(x) f vD O(x) dx0
where per equation (40)
O(x) = TOT ( F -MI) )Performing the indicated integration yields
Q(x) = 2QTOT M ( M - ) ) (B-51)

-97-
PEAKED COSINE PROFILE
To simulate an inlet or outlet flux peaking, a
flux profile consisting of cosine shaped portion and
an exponential portion was chosen as shown in figure
10. For the inlet flux peaked tubes, the cosine por-
tion was established by fixing the maximum position 7.5
inches from the inlet. The exponential portion was
blended into the cosine profile at 12 inches from the
inlet by a suitable choice (1.33) of the constant jwhich occurs in the exponential expression for the flux.
The outlet flux peaked tubes are mirror images of the
inlet peaked tubes. Hence the expressions for the flux
profile in the inlet peaked geometry are:
7rz fr- z& B5a0(z) = MAX cos for 2 - 0 (B-51a)
0( z ) - 0 cos for O zf- ( A-(- . 5')(B-51b)
0(u) = Ou.n exp (-
= OMAX cos L'' exp( ) for OS-u' .
(B-51c)
For this specific design, the break point between the
cosine and exponential portions of the flux profile was

-98-
taken at 12 inches from the tube inlet and hence for
the tubes under consideration:
M = 5.75
1-= 30 inches
1$= Q - 12 = 18 inches
15 inches
L'=2cos
= 16.88 inches
1.33 (dimensionless)
However, the derivations of relevant parameters will
be carried out without the insertion of these specific
numerical values to obtain more general defining equations.
a. O(z and u)z
Now Q(z) = f(z) rDi dz
-Q/2
QTOT MA[ cos Y dz +
TO(T -O-5L' ) A
cos exp -t0MA
cos dz +
du
L( - 5IQTOT = wD iMAX L sin +- --_ /2
cos
exp (B-52)

-99-
Hence MTOT (B-53)
where C, (sin ,(.-t-.5')+ sin +
Cos Tr( -*-5' {ep
4L(in 5 ) Lk)
cos ( - -I C1-exp (-) (B-54)
Substituting the expressions for # back into equations
(51 a,b, and c) we obtain the desired result:
#(z) = ccos Cos for - - z.O (B-55a)
V( z=# o cos fori (B-55b)
3- exp (#(u) -.. X # os L- .5 '
#(u) cos exp for 0! u C
(B-55c)
In the above expressions the quantities L', JLV, and M
are derived and defined in the same manner as in the
cosine flux case. Hence we obtain
cos 'MIN AMIN (B-57)2 L' QMAX A MAX M
and
L 7r L/2 (B-58)arcos(1/M)

-100-
where MIN and MAX refer to values on the cosine
portion of the profile.
b.- D,(z and u)
Now in general Do(z or u) = A(z or u) +D (B-59)
From equation (1) we obtain
dR= f d z or u)A (z oru) (B-60)
Now over the region - .'/2! z 5 --- 5JL', A (z) can
be expressed as
AMIA (Z) MINz
co ,(B-61)
whereas over the region 04 u i , A (u) can be expressed
A (u) =
Hence _ -- 5R
- 1'/2
A cos , (.--J--5s2')MI L ' s
exp (- )
cos dzAMIN L
(B-62)
2+ f'cos7,(k-,--.5')0 A-o0 MIN
exp ( - . u) du
Integrating we obtain R in terms of AMIN as
R=A - ( Sin + sin ,(9 --51'AMIN
1 - exp (
Cos 5 '
(B-64)
(B-63)
R =

-101-
fC,or R =A
fc,Thus AMIN R
Hence in the range
where C, is defined by equation (54)
(B-65)
- Q'/2 4 z? ; - .-- 5 -I
A (z) = AMINTZ
Cos LT
where AMIN is defined by equation (65)
(B-66)
and in the range
A (u)
where AMIN
AMIN
cos f-ie -5 exp (5)
is defined by equation (65).
Hence the desired result for D0 (z) can be obtained
by substituting equation (61) into equation (59) obtaining
(B-68)D(z) =4 AMIN + D2Cos
where AMIN is expressible as a function of tube parameters
only (i.e. R,..Q , Q', and 5 ) per equation (65).
The desired result for D.(u) can be obtained by sub-
stituting equation (62) into equation (59), obtaining
2+ D2
(B-69)
D U) 4 A MIN0ou) (c LIOs ,( -4 -5.2'1)exp(- )
where AMIN is also expressed per equation (65).
(B-67)

-102-
c. Q (z and u)x
Now Q(x) = . (x) ir Di dx where O(x) as a
INLET
function of position and total power was previously
derived in equation (55). Substituting this expression
for 0 and performing the indicated integrations, we
obtain the desired results in the range - Q'/2 6z 0.
z
Q(z)
i- 11/2
QTOT iT DYD D C I cos dz
Li'
_ TOTC 1r
sin + sine]2 sin 2. I
Q(z) = ;' M -sin W IIn the range 0 ' ze-- -.5Q2
z
Q(z) = rQ(z)
QTOTirD cos dz
TOT M 1-C i -n- + sin Fri
M 2J
In the range 0 S u i
-)-.5 '
Q(z) = (z
- '/2
u
) iD dz + I0(u)
-o
vD. du
Q(z) = F sin(- -5.') + sin +
I2LLTT Cos , 5 1-exp
C,.L
(B-70)
(B-71)
(B-72)

-103-
OUTLET PEAK
This flux profile is shown in figure10. The
analytic expression for the flux profile is as follows:
0(u) = MAX cos -+ --. 5 ') expco u )
= QACOs 5 exp ((u- )) for o u= MXc L'
(B-73a)
O(z) = # cos for - (Q -J -- 5 ' zco f -(B-73b)
(z) = # cos for O -z S + Q'/2 (B-73c)
a. O(z)
Now QTOT is expressable by equation (52) for the
inlet peak case since the flux profile are mirror images.
Hence
= O were C, is also given by equation (54).
(B-74)
Substituting equation (74) into equations (73 a, b, and c)
we obtain
T(u)cos - wD exp((uJ) for 0'-
(B-75)
= TOT z(z) = cos for - - 5kt)'5 z/ O
(B-75b)
#z = TOT cos for O ' z' + _'/2 (B-75c)rDiCI L

-104-
b. D (z and u)
The desired relations for tube outside diameter,
D (z and u), are obtained in the same manner as the
inlet peak case. Since the two cases are mirror images
of each other
R C,
AMINwhere C, is defined by equation (54) (B-76)
Ic,and AMIN R (B-77)
This result may easily be seen by direct integration. Now
in this case, the wall cross sectional areas are given
A (u) =AMIN
for 0 U4:- -- 50' exp u-cos (11
A (z) = MIN for -/2Cos 7-. I
Hence the desired results are
14 A MIN 2D (z)- AMI + D
Cos Lg
where AMIN is expressible as a function of tube parameters
only (i.e. R, -, .', , and 5) by equations (74 and 54).
(B-7b)
(B-79)
(B- 8 0)
A2A MIN (O i + D2
Cos ,( - -. 51' ) exp(- (u-(B-81)
where AMIN is also expressed by equations (77 and 54).
and D (u) 4

-105-
c. Q.(z and u)
x
Now Q(x) = O(x) rDi dx where
INLET
O(x) as a function of position and total power was
previously derived in equation (75). substituting
this expression for 0 and performing the indicated
integrations we obtain the desired results.
In the range 0 -4 u
Q(u) = TT cos -(u-)-exp(-
(B-82a)
In the range -(jL-J--5Q') z: 0, where z is inherently
negative
Q(z) cos L -) (1 - exp (-E) +
'(sin siL - i " (B-82b)
In the range 0 z 4+D'/2, where z is positive
Q(z) -Q1 cos L ') ( - exp (-R) +
L sin -5L') + sin -z (B-82c)IL' L'I)

FLUX SPIKE (COSINE SHAPED)
This flux profile is shown in Fig. 10. The analytic express-
ion for the flux profile is as follows:
Sor - + ' z -/2 (B-83a)
0cos9 for - Z + . /2 (B-83b)L
MIN for + " /2 z o o- (B-83c)
a. O(z)
o('- /2Now Q(z) = O(z)rDidz
-( A-f +A -- /2 )
- 2/2+ £/2 *Hence QTT =' + MINidz + - LXcos'D idz
-( f+ -y)- L22L
+ , 2 OMIN ridz+ /2
'0' = DIN - + #MAX12DiLsin~TT 7OiMIN Ji?'2ej L
0MAXSince M
We obtain Q T ADi X + 2LinE2 J (B-84)
Let7 M +
o r & + 2 L (E B1or M + -- (per Eq. B-12) (B-85)m r M2e

-107-
Hence we obtain
MNAX rD C7
gN = OTOMIN MrD 0C7
(B-86a)
(B-86b)
Substituting these expressions for 0#A and #MIN into Eq. (B-83)
we obtain
O(z) MTrDOC for -(2- f+ )s z < (B-87a)
O(z) 0TT Cos r0() JDi C7 Ll
O(z) -MTT for0(z) i C 7
ffor - z
2 - 2
b. D (z)
The relation for the tube outside diameter, D0, is obtained
as follows. The wall cross sectional areas are given as
A (z) AMIN MINx7. '"MIN
Cos2 L
for -(V- + )d z i - s'/2
+ L/2 (B-88a)
-g z +2 2A (z) (B-88b)=AMIN
cos-L
Now since R = dR= o dz
TOT Ax
(B-87b)
(B-87c)
- .
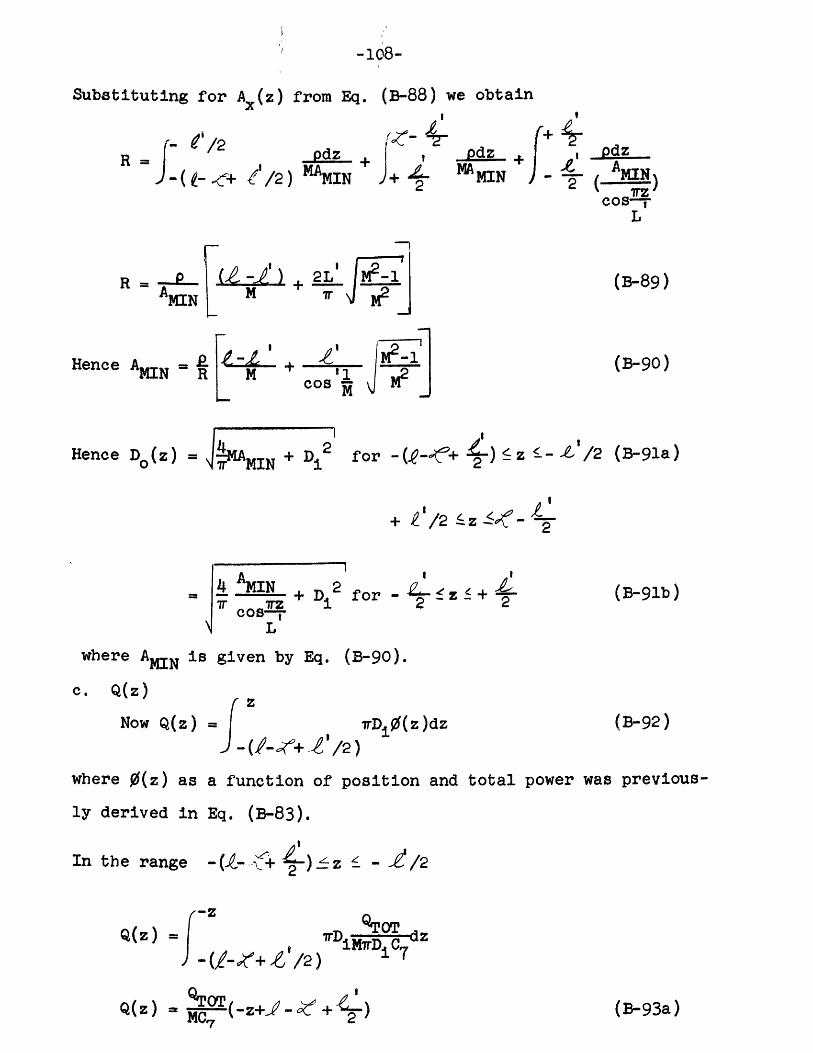
-108-
Substituting for A (z) from Eq. (B-88) we obtain
/2R =
r .+
Pdz +
/2 ) MAMIN
R = -AMIN
Hence AMN R£
+ 2L
f ,
2
dz -MAMIN
0dz
cosL
(B-89)
(B-90)+Cos
Hence D0 (z) = MIN + Di 2 for -(-.+4)z <-6"-/2 (B-91a)
+ /2 1z - 2
4 A MIN + Di 2 forT iTz i
Cos-I-
where AMIN is given by Eq. (B-90).
c. Q(z)
Now Q(z)z
rDi(z)dz
where O(z) as a function of position and total power was previous-
ly derived in Eq. (B-83).
In the range
Q(z)
-(2 -) z - /2
z r~D dzTOT
(1-+4'/2) oC7d
Q(z ) = (-z+1 - C' + )C72
- z +
2 - 2(B-91b)
(B-92)
(B-93a)

-109-
In the range z
.L/2 QO
Q(z) -I Di C7r dz
-( -/+ /2)
( r)+ MIn te rr
In the range 0 z 2
Q(z) = ("C7
0
+
-z
-(/2
rDj rD 7 L
D _o irzrD ;08 L dz
+ irDD C7 Losz
Q(z) - - ) +I7 C
In thbe range+ z
L + sin i-LL ~ Biflj
(z)=(MC7
Q 2 /M2-+ CT I
C7r \P+ rDi Q1- C-dzJf + ', ri C7
M7 C7 ?
(B-93b)
(B-93c)
(B-93d)

-110-
APPENDIX C
TEST SECTION DESIGN
The initial factor to be considered in the design
of the test sections is the characteristics of the
available power supply. With the 24 volt, 3000 ampere
supply available, Ohms Law indicates that an overall
tube resistance of 8.0 X l0~0 ohms is necessary to
achieve full power of 72 kw without exceeding either the
generator voltage or current limitations.
Secondly the range of mass velocity (G) to be
investigated is fixed. In this investigation values
of .5 X 10 6 1.0 X 10 and 2.0 X 10⁶ were chosen to
cover the range reported by previous investigators
and/or selected in reactor design application. Now
the dimensions, Di and I , are established by consider-
ation of the limiting operating condition requiring
the maximum heat input (and flux) to achieve the critical
condition. Thus we take the limiting case as that of
G MAX(2.0 X 1 0 0), and X in-MIN(about -.28 for 80 psia)
which utilizing the critical heat flux correlation of
Macbeth (reference 30 ) defines a critical heat flux
#as 1 -6-6 A + T CDj(G . 10 ) AHSUB-IN
0 . 10 1 + CJ21 (C-1)
where A and C both represent expressions which are
functions of DjG, and P.

-111-
A second equation defining the limits of tube geometry
results from the identity c TOT . SubstitutingS
for A we obtain5
CD. = -TOT (C-2)
However, additional factors also limit the selection
of individual values of) and D -
a) To simulate reactor conditions and also to avoid
effects on critical heat flux resulting from very
short test lengths, it is desirable thatj be as
large as possible, at least 20 inches or greater.
b) It is desirable to work within the limits of
existing uniform flux data to provide a reference
point for the nonuniform flux data obtained. This
existing data can then be used as a check of uniform
data obtained during this study and to provide the
basis for a uniform flux correlation useful to
analytic work. Hence the following restrictions
on L/D ratio are in order
50 - '/D 4 250
c) As reported by Bergles (reference 32 ) for the
subcooled burnout case, small tube data deviates
from the data obtained for large tubes. This pro-
bably is a consequence of the existence of considerable
nonequilibrium vapor volume as thehydraulic diameter

-112-
becomes comparable to bubble dimensions. Although
this study is concerned primarily with burnout
in the quality region, nucleation can occur within
the annular film. This nucleation and the present
lack of definition of the mechanics of the burnout
process in this case make it prudent to restrict
the test section diameters to relatively large
values, .150 inches or greater, to eliminate any
extraneous diameter effect on the results.
d) Finally a limitation on maximum tube inside
diameter is imposed by the desire to achieve
maximum pump discharge pressure (270 psia) to assure
adequate flow control of the loop. From the pump
characteristic, the maximum flow rate allowed is
about 1800 lb/hr which corresponds to a pump dis-
charge of 260 psia. Since
G = A- = D 2 C-3)F r i
For GMAX= 2 .OX10-6 , the maximum inside diameter is
.410 inches.
Summarizing now we have two equations (1 and 2) and
three unknowns (.L, Di and Oc) with the following additional
restrictions from physical grounds listed above
.150 inches 5 D 4-.410 inches
A220 inches
50 4 2/D 6250

-113-
From the range of values which satisfy these conditions,
the following set of parameters was selected
D = .214 inches
= 30 inches
and hence 4/D =140 and 0c(MAX G and AHSUB-IN) = 1.8x10⁻⁶
BKU/hr ft2
Next the degree of steepness of the test flux shapes
was established. The M values (M = MAXIMUM FLUX/MINIMUM
FLUX) of this study were chosen to duplicate and bracket
those of other investigators.
With the conditions established above, the finished
tube dimensions for the flux shapes chosen can be calcu-
lated and the test section material selected.
The tube outside diameter for aluminum and hence the
required amount of wall material to be removed was less
than that for A nickel and stainless steel, due to the
lower value of resistivity for Aluminum 2024-T3. Since
the machinability of Aluminum 2024-T3 is also good, it
was selected as the working material.
The specification of the actual machined dimensions of
the test sections, the outside diameter as a function of
axial length, can be calculated from expressions in
Appendix B. Equation (B-16) typically illustrates alter-
nate expressions for DO(z) as a function of p, R and M
or AMIN and M. Either expression can be used for tube design.

-114-
Permissable dimensional tolerances were established by the
requirement that the local flux at any point should be
within 5% of the design. Since
dP = I dR = I2 dx
dP a A local
Hence for locations of small wall cross section area the
machining tolerance to hold ±5% power becomes tighter.
The tolerances specified for the first batches of machined
tubes reflected this fact and specified several tolerances,
each one applicable over a different axial location range.
However, as manufacturing techniques improved, the minimum
tolerance, applicable only to the area of minimum wall
thickness, was applied to the entire tube. Typically on
wall thicknesses ranging from .009 inches to .044 inches, a
tolenance of + .001 inches was met. This resulted in flux
shapes at any point within 2 - 5% of design.

-115-
APPENDIX D
DATA REDUCTION AND ANALYSIS
The reduction of the experimental data and the
computation of parameters relevant to the analytic
model developed are performed by the computer program
described in Appendix E. The computational methods and
equations upon which this program is based are presented
in this appendix in the following order
a) INITIAL DATA
b) PARAMETERS DERIVED FROM FIRST LAW (BASIC DATA
REDUCTION)
c) ANALYTIC MODEL
d) ANNULAR FI1M CHARACTERISTICS
a) INITIAL DATA
For each fabricated test section, the following
data is available:
Di,. -i, M
L, L (applicable only to test sections with a cosineshaped portion)
L, f, / (applicable only to peaked inlet, peakedoutlet, or spike-cosine shaped test sections)
The following additional data is obtained from
each experiment
TIN E Pp OUT
W I PIN
ROUT
From these data, AP=PINPOUT and HIN are directly
available.

-116-
b) PARAMETERS DERIVED FROM FIRST LAW
Using the above data, the desired parameters at
the test section inlet and along the test section are
calculated as follows
TUBE INLET XIN HIN-Hf-IN AHSUB-ININ Hfg-IN Hfg-IN
AXIALLY ALONG TUBE
(q/Ax), (q/A)c' Qx' % per equations in Appendix 3
HX = HIN + W
HI-Hf~XXH
XX = fg-x
In addition parameters associated with the saturation
location and the bubbly-annular transition point are cal-
culated as follows
SATURATION LOCATION
QX=0 = -AHSUB-INW
L==0 is length at which Q = XW.. This parameter is
obtained by solving the relevant Qx equation in
Appendix B for the position variable having first
made the substitution QX=0 = Q
Ls = I - %=0
QSAT = El 3.41 BrUAr/watt - QX=o = OT ~ X=o
BUBBLY- ANNULAR TRANSITION LOCATION
The value of x at the transition location is es-
tablished by repetition of calculations for increasing

-117-
distances beyond the zero quality length, 6- 0, until
the preset value of quality at the transition point is
attained. With x thus established at the transition
location, the additional parameters below are calculated
QANN = QTOT~4X
QANN-C = Q0~4X
CALCULATION OF P(X)
In all the above work, calculation of P is computed
by the empirical formulation below. This formulation
was established by calculating pressure drops using the
Martinelli-Nelson model (43) for tubes representing the
extreme ranges in pressure drop and mass flow experienced.
These results of pressure over tube length were then
fitted by two straight lines, the latter line which is
applicable over the higher quality regions having the
more negative slope to reflect the larger rate of
pressure drop in the higher quality region. The empir-
ical fitted results compared well with the calculated
results. While this method gives pressure results which
are only within + 10%, these values are used only to obtain
enthalpy, quality, and heat flux for incipient nucleation
which are relatively insensitive to small changes in
pressure. This procedure was adopted since the accuracy
obtained was acceptable and a more complicated program
for pressure calculation was therefore not needed.

For x S =0 x = PIN (neglects single phase pressure
drop)
For L= 0 < x 1.6 Lx-o
Px = PIN -. 750 P (
For x >1.6 LX=O)Ix-1.6 :-O)
Px * BK ~ K~ OUT '1.-1.6 X=0
where
PEK PIN -. 750 AP ( o.6L=O)
c) ANALYTIC MODEL
The model discussed in Chapter IV requires compu-
tation of the heat flux to initiate nucleate boiling at
given conditions of mass flow rate G, pressure P, quality
X and tube geometry, D,t. The correlations used in this
computation are
TWO PHASE HEAT TRANSFER COEFFICIENT. h
1) DENGLER-ADDOMS CORRELATION (38)
+0.5h 3.5 hL(/Xtt) for .25<Xtt (70
wherekL 0.8 0.4
hL .023(D/12.)(Re) (rL)
and/ 0.9 V 0.5 v 0.1
1tt X =
-118-

-119-
2) CHEN CORRELATION (39)
h hMAC + hMIC
k 0.8 0.4
MAC= .23(D/12.0)(ReL) rL)
where
Re G(1-X)ReL =i412.0
F = function of defined by Chen's Fig. 7.tt
and k O'7 9 c 0.45 0.24 0.25 0.24 0.75
hMIC = 0.00122 0.5 0.29 0.24 0.49 (AT) (AP)a IL Hg v
where
AT TWALL-TSAT
AP = difference in vapor pressure corresponding to
AT, lbf/ft2
S = function of ReL 1.25 defined by Chen's Fig. 8.
BEROLES-ROSENOW INCIPIENT HEAT FLUX FOR NUCLEATION,(q/Ai)1 (35)
1.156 2. 30/p 0. 0234
(q/A)i = 15. 6 0p (TWALLIuSAT)
The associated maximum cavity size required is obtained
as2apT
+ a + 2TWALL +ckT WALL + 4TWAL a+ 2
r =27y - as3
where

-120-
y = q/A/k = 0 /ft or 0 R/ft
h 778 lb fta = R = 0 R where R 85.8 lba -R
= a 144.0
d) ANNULAR FILM CHARACTERISTICS (44)
The GEAP report presents curves of as a func-b
tion of F ( ). The film thickness, b-a, is thus obtain-
ed from the quantities b (radius in ft) and F where
~dP ~ b 13-dzTOT-TP-- o 3600 p p -n
F ( ) :- dLGGGPL G PG g ( dz ITOT-TPwhere
n = o if (- ()r-TP L
n = -1/3 if (- )TO-TP gL
Computation of the film flow rate, G is accomplished by
the following series of equations
dP PLl_ a 2 bWALL L~dz TOT-TP -( 2
+ WALL4.17x10 pLy = y --
where
y -- b-a

-121-
Ofilm LI!(
where
F(y+) =3y+ + 2.5y+ iny+ - 64 for y+ 30
=12.5 - 8 .05Y + 5y+ny+ for 5 y+ < 30
+ 2 += 0.5y for y 5
The results of the GEAP report are applicable only to
adiabatic conditions and hence are not strictly appli-
cable to the conditions of the subject investigation.
However, the test results were analysed based on the
above equatiorsto explore the possibility of calculating
local film flow rates by this method. Since contradic-
tory answers were obtained, the extrapolation of the
equations to the test conditions was not considered
reliable and hence analysis by this means was not
pursued.

-122-
APPENDIX E
COMPUTER PROGRAM FOR DATA REDUCTIONAND ANALYSIS
The experimental data obtained was reduced in
accordance with the equations of Appendix D by a
program written in FORTRAN and run on the MIT
Computation Center IBM 7090 computer.
The program consists of a main program (AXIAL)
which identifies from the input the flux shape of each
tube (i.e. uniform, cosine, etc.) and transfers control
to one of seven subroutines, one for each flux shape,
where computations are initiated. These routines
(UNIFRM, COSINE, LININC, LINDEC, PKIN, PKOUT, SPKCOS)
together with the subroutines for calculating the satu-
rated liquid and evaporation enthalpy (LIQEN and EVAPEN
respectively) perform calculations of desired parameters
at theoritical location and over the entire length of
the test section. In addition these subroutines call
the subroutines (UNIANN, COSANN, LNIANN, LNDANN, PKIANN,
PKOANN, SPKANN, CSPIKE) which calculate the desired
parameters at the location of the bubbly-annular transi-
tion.
Calculation of the annular film thickness and
the film flow rate past the bubbly-annular transition
point is initiated by the subroutine FILMFR

-123-
which is also called by the seven basic subroutines
(UNIFRM, COSINE, etc.). The subroutine FILMFR
accomplishes this calculation by calling the sub-
routines listed below.
a) Local momentum pressure gradient based on the
homogeneous flow assumption (HOMNGD).
b) Overall momentum pressure drop divided by the
length yielding a linear momentum pressure
gradient (GRDMONM).
c) Fluid properties - specific volume of sat-
urated water (SPECVL), specific volume of
saturated water vapor (SPECVG), saturation
temperature (SATTMP), viscosity of saturated
liquid (VISCOS), saturated liquid enthalpy
(LIQEN) and evaporation liquid enthalpy (EVAPEN).
d) The Martinelli-Nelson friction pressure gradient
multiplier (MNPGRD).
e) The ratio of film thickness to tube radius for
given value of Levy's universal factor F
(UNIVER).
If it is desired to exclude calculation of the film thick-
ness and flow rate, it is sufficient to substitute dummy
subroutines in place of subroutines FILMFR and GRDMOM.
The program also computes the relevant variables for
the model by which the test results are analysed. These
variables are (1) the change in enthalpy from the bubbly-
annular transition location to the local point of interest

-124-
and (2) the ratio of the local flux to the flux re-
quired to initiate nucleation in the liquid film based
on both Chen's (39) and Dengler's (38) correlations.
The calculation is initiated from the subroutine FILMFR by
calling subroutines BONUCF and LONUCF which perform the
desired calculations respectively at the burnout loca-
tion and any local position of interest. The associated
subroutines used in this calculation are
(1) Chen's two phase heat transfer coefficient
(XHCHEN)
(2) Largest pit radius needed for nucleation per
the Bergles-Rohsenow theory (XRAD)
(3) Fluid properties (in addition to those listed
above under FIUIFR) - thermal conductivity of.
saturated water (XTHCON), specific heat at
constant pressure of saturated water (XCPLIQ),
steam-water surface tension (XSURFT), pressure
of saturated water (XSATP), saturated vapor
viscosity (XVISCG)
(4) Derived property dependent quantities - differ-
ence in vapor pressure corresponding to given
water temperature difference (XDELTV), Martinelli
parameter (XXTT), Chen's F factor (XFCHEN) and
Chen's factor (XSCHEN).
In addition provision is available thru subroutine NFLUX2
for a revised nucleation flux criteria in those cases
where the maximum available surface pit radius is less
than that required by the Bergles-Rohsenow criteria.
However, NFLUX2 presently exists as a dummy subroutine.

-125-
A complete listing of the fortran statements for
this program is included at the end of this appendix.
A listing of the variable names and the physical
parameters which they represent is presented in Tables
E-1, E-2, and E-3 where Table E-2 includes specifically
the variables associated with the calculation of annular
film thickness and flow rate (Subroutines FILMFR, GRDMOM
and other called subroutines) and Table E-3 pertains to
BONUCF and LONUCF and associated subroutines.
The procedure for inputing data to run this program
is as follows. Following the star data card which
follows the compiled program is the first data card on
which the number of individual cases to be run is punched.
This number is fixed point and should be punched, right
oriented, in the field 1-5. This card controls the
actual number of executions of the program which should
correspond to the number of cases to be reduced.
The remaining data cards directly pertain to the
data for individual tubes. For uniform, cosine and
linear flux shapes, five cards are required for each case.
For the peaked flux shapes a sixth card is required as
described below. For the cosine spike shape a seventh
card is required,
a) First card - A fixed point number, right oriented,
should be punched in the field 1-5. This number
identifies the flux shape according to the code;
1 - uniform, 2 - cosine, 3 - linear increasing,
4 - linear decreasing, 5 - peaked inlet,

-126-
6 - peaked exit and 7-spiked cosine.
b) Second Card - Seven floating point input vari'ables
should be punched in sequence in fields of ten
each. The variables, in sequence, are TUBE, RATIOM,
DIAINS, VOLTS, AMPS, ENTHIN, FLMASS. The physical
parameters and units represented by these variables
are listed in Table E-1. Since these variables
are all floating point, they should be punched
with a decimal point unless specific care is taken
to right orient them in their field and provide
sufficient digits'to accomodate the format state-
ments in the program. This comment applies
equally to cards 3, 4, 5 and 6.
c) Third Card - Six floating point input variables
should be punched in sequence in fields of ten
each. The variables in sequence are PRESP, PRESIN,
PRESOT, RESDP, TSDP, BOLOCA.
d) Fourth Card - Two floating point input variables
should be punched in sequence in field of ten each.
The variables in sequence are XLNGTH and SHUNTM.
e) Fifth Card - A fixed point variable JLOCAT is punched
right oriented in columns 1-5, and a floating
point variable QUALIA is punebed in columns 6-15.
f) Sixth Card - Three floating point input variables
should be punched in sequence in fields of ten each.

-127-
The variables in sequence are SCRPTL, ZETA and
PLNGTH and are applicable only to the peaked
inlet and exit flux shapes and with new defini-
tions to the spike cosine shape.
g) Seventh Card - The fixed point variable J,
should be punched in format 15. This card is
applicable only to spike cosine flux shape.
The following characteristics of the program should be
noted in particular.
1) PRESP and RESDP are input only to maintain a
complete record of the data for each tube. Since they
are not used in the subsequent calculation, they can
if desired be set equal to zero for convenience.
2) AMPS represents the tube amperage in millivolts
(shunt voltage drop) and is used in conjunction
with SHUNTM to calculate the tube current.
SHUNTM represents the number of amperes per
millivolt for the particular calibration shunt
installed in the heat transfer laboratory. Since
the product AMPS and SHUNTM represents tube current
in amperes, the arbitrary value 1.00 can be assigned
to SHUNTM if an experiment yields current directly
in amperes.
A group of punched input cards for the case of an inlet
peaked and a cosine spike tube are shown for illustra-
tion with the program listing.

-128-The basis for the formulations of the subroutines
for fluid properties and the subroutines MNPGRD and
UNIVER are discussed below. The polynomial fits of
data for subroutines below were taken from the work of
Trembley (45) unless otherwise noted.
a) Subroutine SPECVL - Specific Volume of Saturated
Liquid vs. Pressure
The specific volume of saturated liquid as function
of pressure was obtained by fitting the Keenan and
Keyes' values (46) on a power series to obtain for
P <400 psia,
9v (P) =L_
i=o
where
ao = 1.6401745 (10-2)
a1 = 2.3289060 (10-5)
a2 = -1.5364591 (10~7)
a3 = 7.4158910 (10l10)
a4 = -2.1694997 (10-12)
for P ' 400 psia,
4vV(P)= L b1i=0
where
bo = 1.7382154 (lo-2)
b = 5.5320054 (10-6 )b2 = -1.9348749 (lo9)
a5 = 3.8991151 (10-15)
a6 = -4.3187213 (10- 18)
a7 = 2.8681090 (10- 2 1 )
a 8 = -1.0458372 (10~ )
a9 = 1.6082445 (10-28 )
P1
b3 = 6.6669956 (lo-13)
b4 = -2.1537248 (1o17)
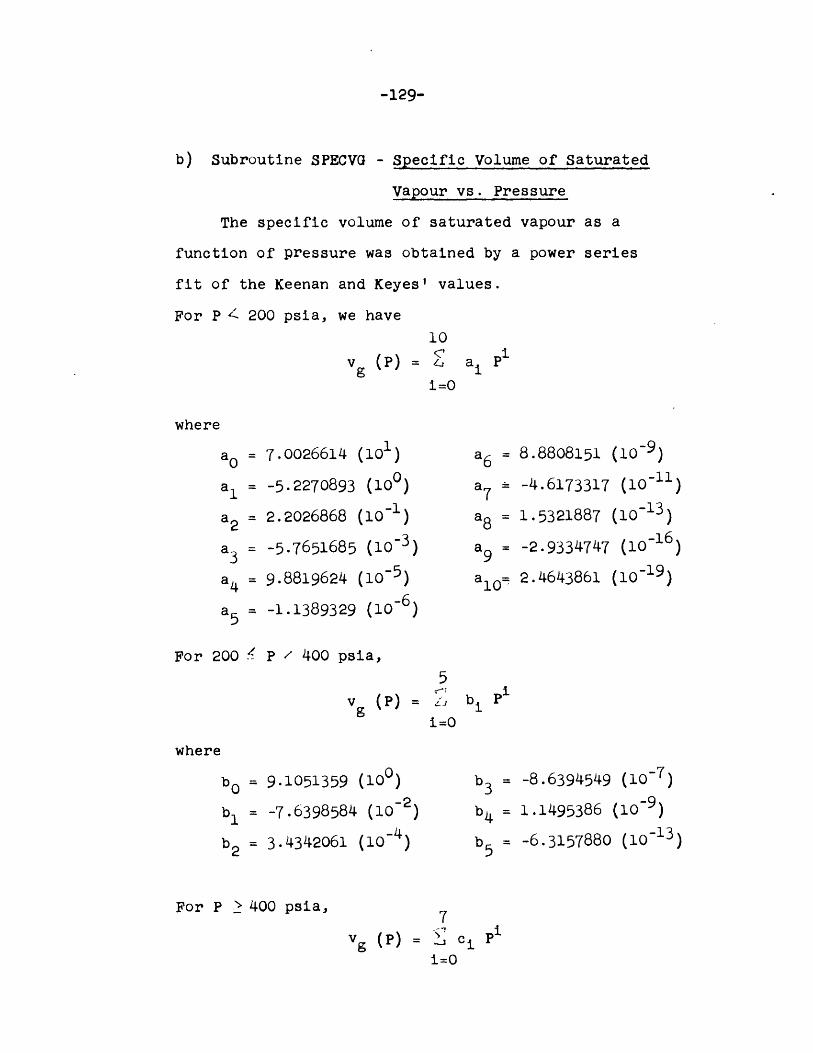
-129-
b) Subroutine SPECVG - Specific Volume of Saturated
Vapour vs. Pressure
The specific volume of saturated vapour as a
function of pressure was obtained by a power series
fit of the Keenan and Keyes' values.
For P 4 200 psia, we have10
v (P) = / a1 P
1=0
where
a = 7.0026614 (10 )a1 -5.2270893 (10)
a2 = 2.2026868 (10~)
a3 = -5.7651685 (10-3)
a4 = 9.8819624 (10-5)
a5 = -1.1389329 (10-6
For 200 P / 400 psia,
v (P) =
where
b0 = 9.1051359 (10)
b = -7.6398584 (10-2)
b2 = 3.4342061 (10~4 )
a6 = 8.8808151 (10~9)
a -4.6173317 (1011)
a8 = 1.5321887 (10-13)
a = -2.9334747 (10-16)
a - 2.4643861 (10-19)
5b, izo b1 P
1=0
b3 = -8.6394549 (10~7)
b= 1.1495386 (10~9)
b5 = -6.3157880 (10-13)
For P - 400 psia,7
y (P) = - c Pi=0

-130-
where
co = 4.2909747 (10 0
cl = -1.6646162 (10-2)
C2 = 3.5532997 (105)
c 3 = -4.5689872 (10 -8)
c) Subroutine LIQEN - Enthalpy
4 = 3.6138355 (1011 )
c5 = -1.7180116 (1o14)
c6 = 4.4959690 (10-18)
c 7 = -4.9699884 (10-22)
of Saturated Liquid
vs. Pressure
The enthalpy of saturated liquid as function of
pressure was obtained by a power series fit of the
Keenan and Keyes' values.
For P 4 200 psia,
h(P) = ' a Pi
i=0
where
a0 = 1.1222734 (10)
a = 6.3204790 (100)
a2 = -1.4742752 (10~)
a 3
a4 =
2.5403593 (10-3)
-2.8788220 (10-5)
For P 200 psia,
hf (P) 21i=0
where
b = 2.4510585 (10 2)
b = 7.1675962 (10-1)
b2 = -9.9955201 (10~)
a5 2.1239014 (10~ )
a6 = -1.0067598 (10~9)
a = 2.9480958 (102 )
a8 = -4.8430355 (10-15)
a = 3.4075972 (10 -18
b Pi
b = -6.8660980 (1010)
b5 =2.6573456 (10-13)
b6 = -5.5654666 (l0-17)

-131-
b3 = 1.0516702 (10 -6) b = 4.8594220 (10-21)
d) Subroutine EVAPEN - Latent Heat vs. Pressure
By definition the latent heat is simply the
enthalpy difference between that of the saturated
vapour and that of the saturated liquid (h fg= h -hf).
It was obtained by fitting the Keenan and Keyes'
values on a power series.
For P '. 400 psia, 9
h (P) = aP
i =o
where
a0
a1
a2
a3
a4
For P -
= 9.9704457 (102 )= -2.1762821 (100)
= 1.9558791 (10- 2
= -1.2610018 (10~)
= 5.0308804 (10~7)
400 psia,
hfg (P) =
a5
a6
a7
a8
a 9
4
i =0
where
b0 = 8.9642372 (102)
b = -3.3549732 (101)
b2 = 1.2678091 (10~4)
= -1.2499843 (10~9)
= 1.9322768 (1o-12)
= -1.8023251 (10-15)
= 9.2680092 (10-19)
= -2.0148643 (10-22)
b Pi
-4.3416487 (10-8)
= 4.8788247 (10-12
e) Subroutine SATTMP - Saturation Temperature vs. Pressure
The saturation temperature as function of pressure
was obtained from Steltz and al. (47).
b 3b 4

-132-
8T =j-
1=o
0.2 P<450 psia
ln(lo P)
3. 5157890 (101)
2.4592588 (101)
2.1182069 (1o)
-3. 4144740 (1o1)
1.5741642 (10~1)
-3.1329585 (10-2)
3.8658282 (10-3)
-2.4901784 (104)
6.8401559 (10-6 )
ag PLiiL
450 P<32o6 psia
in P = 0
1.1545164 (14 )-8.3860182 (103 )2.4777661 (10)
-3.6344271 (102)
2.6690978 (101)
-7.8073813 (10~)
0
0
0
f) Subroutine VISCOS - Viscosity of Saturated Liquid
and Vapour vs. Temperature
The viscosity of saturated liquid as function of
temperature to 6000F was obtained by a power series fit of
Wellman and Sibbitt's data. (48)
10
p. =i=0
a Ti
where
a0 = 8.0144599 (100) a6 = 8.4382483 (10-13)
a. = -1.6728317 (10~1) a 7 = -1.4493830 (10-15)
where
PL
ao
a1
a2
a3
a4
a5
a6
a7
a8

-133-
a2 = 2.0423535 (10-3) a8 = 1. 5963800 ( 1 0 -18)
a3 = -1.6324668 (10-5) a 9 = -1.0173273 (10-21)
a4 = 8.8555744 (10-8) alo = 2.8496174 (1o-25)
a5 = -3.3015965 (10~ 10 )
Above 6000F the viscosity was obtained by a series of
straight line fits of the Wellman and Sibbitt data.
g) Subroutine MNPGRD - Martinelli-Nelson's Friction
Pressure Gradient Ratio
Jones' polynomial fit (49) of Martinelli-Nelson
values was used, i.e.,
4 7 P0M-N = exp I F a - -
i=1 J=O
where
p = P/loo
X = ln (100 x +
a13
2. 5448316 (100)
-7.8896201 (100)
1.5575870 (101)
-1.7340906 (101)
1.0409842 (101)
-3.2044877 (10 0)
4.2484805 (10~1)
-1.0804871 (10-2)
1)
a2j
-5.1756752
1.9550200
-9.6886164
-4.6120079
8.4910340
-5.9583098
1.8989183
-2. 2867680
(1o1)
(100)
(10~ 1)
(100)
(100)
(100)
(100)
(10~1)
a3J
1.0193956
-3.7233785
-1.9025685
-2. 2654839
-3.4925414
2.3299085
-7.2534973
8.6169847
(io~ )
(10~ 1 )
(10 1)
(100)
(100)
(100)
(10~)
(10-2)

-134-
j a 41
0 -8.0606798 (10-3)
1 2.6160876 (10-2
2 6.0208725 (10-2)
3 -3.2426871 (10- )
4 4.6553847 (10~ )
5 -3.0333482 (10 )
6 9.3379834 (10 )
7 -1.1021915 (10- 2
Corrected Pressure Gradient Ratio
It was recognized that the Martinelli-Nelson
values of 0' correspond to a mass velocity of about
200 lbm/sec-ft2 and that the pressure gradient ratio
depends not only on quality and pressure but also
on the mass velocity. Jones (49) has derived a mass
velocity correction factor that is valid for G!5 103
2lbm/sec-ft . This factor is function of both
pressure and mass v@locity and is expressed in
polynomial form as
5(ai + b P) .G0
i=0
where
Go = ln (.0036 G + 0.2)

-135-
i a b
0 1.4012797 (100) -3.8229399 (10-5)
1 -6.8082318 (10-2) -4.5200014 (10~)
2 -8.3387593 (10-2) 1.2278415 (10~)
3 3.5640886 (10-2 ) 1.5165216 (1o)
4 2.1855741 (10-2) -3.4296260 (10-5)
5 -6.3676796 (10-3 ) -3.2820747 (10-5)
But, at G : 200 at any pressure Jones predicts
of value of = 1.4. Since the Martinelli-Nelson
pressure gradient ratios correspond to that mass
velocity, Jones' correction factor should therefore
be unity. Therefore, the suggested Jones factor was
normalized as
Q = Q - 0.4
It was found by Trembley ( 45) that the transition
across the G = 103 boundary yielded a serious discon-
tinuity. Hence
K = for G> 103 was assumed.=103
The two-phase to liquid-phase pressure gradient
ratio is therefore
=- SM-N
h) Subroutine UNIVER - The relevant curves of GEAP 4615
relating the ratio film thickness/tube radius to the
calculated factor F were fit by an MIT Computational

-136-
Center Share program (50). The form of the fit is
b I ai (F (b)i=0
i) Subroutine ITHCON - Thermal Conductivity of Saturated
Liquid Water vs Temperature
The thermal conductivity of saturated liquid water
was obtained by a series of straight line fits of the
data of Wellman and Sibbitt (48).
J) Subroutine XCPLIQ - Constant Pressure Specific Heat
of Saturated Iquid Water vs Temperature
The specific heat of saturated liquid water was
obtained by a series of straight line fits of the data
of Wellman and Sibbitt (48).
k) Subroutine ISURFT - Surface Tension of Saturated Water
The surface tension for saturated water as a func-
tion of pressure to 1000 psia was obtained by a power
series fit on Volyak's data. (51)
10a - Z a.P
i-o
where

-137.-
ao = 6.3225462 (101) a6 = 2.8461426 (10-13 )
al = -3.2677020 (10~1) a7 = -3.0063514 (10-16 )a2 = 2.8126518 (10-3) a8 = 1.9734415 (10~19)
a3 = -1.7494856 (10-5) ag = -7.3149007 (10-23)
a4 = 6.8880390 (10-8) a10 = 1.1689972 (10-26 )a5 = -1.7378005 (10 10)
Above 1000 psia (544.690F) the surface tension was obtained
by a series of straight line fits to data presented in
figure E.2 of Rohsenow and Choi (52)..
1) Subroutine XSATP - Saturation Pressure vs. Temperature
The saturation pressure corresponding to the temp-
erature was obtained from Steltz et al (47) as
P =Pc 10-XPwP h
where
Xt ( )X TKD
3 4NN= A + Bt + Ct3 + Et
DN= 1 + Dt
50 T <20C
3.2437814
5.86826 (1c
1.1702379 (2.1878462 (
0
PC = 3206.182
t =Te - TK
T = 647.27
T = 32 + 273.16
20O<T-,705
3.3463130
-3) 4.14113 (10-2)
10-8) 7.515484 (1o~9 )
10-3) 1.3794481 (10-2)
6.56444 (10~11)

-138-
m) Subroutine XVISCG - Viscosity of Saturated Vapour
For T 5000F, the viscosity of saturated vapour
was taken from Kestin's correlation (53)
g (PT) = 2.419 (1o~) L88.020 + 0.32827.Tc +
2.1350 (10~4)Tc2 - 1.6018 (10-2)(1858-5.90T)/v]
where
Tc = (T-32)/1.8
v (P,T) = (use subroutine SPECVQ)
For T->5000F, we used Keyes! correlation as given
by Quan (54)
-1
P'g(PIT) = 2.419 (10- 3 )L420 T1/2(1+2600 T~ - 10~0 )
+ 1.5 (100.0906/vg 1 )J

Intermediate Computed Variables
ARG are sin t (2X= (M2_MTABLE E-l
VARIABLE NAME
InputVariables
NTUBES
MSHAPE
TUBE
RATIOM
DIAINS
VOLTS
AMPS
ENTHIN
FLMASS
JLOCAT
PRESP
PRESIN
PRESOT
QUALIA
RESDP
TSDP
BOLOCA
XLNGTH
SHUNTM
SCRPTL
ZETA
PLNGTH
PHYSICAL PARAMETEROR DEFINING EQUATION
Number of tubes
Index representing tubeflux shape
Tube identification no.
M
DinV
a
hIN
Index indicating lengthover which calculation ofthermal and hydralic para-meters should be made.
Pump outlet pressure
PINPOUT
Quality at bubbly-annulartransition
Pressure drop acrossneedle value at testsection inlet
AP
UNITS
inches
volts
millivolt
BTU/lb m
lb m/hr
psia
psia
psia
wt % steam
psi
inches
inches
amperes/millivolt
inches
CONSTP
COSABK
COSLEN
EXTRAA
EXTRAB
EXTRAC
EXTRAD
EXTRAE
EXTRAF
EXTRAG
EXTRAH
EXTRAI
EXTRAJ
FACMIB,
FACPLB
FACTMI
FACTPL
inches
C, inches
Cos , (I -J-.5 v') -
L or L' inches
SINABK + ONEMSQ
(SCRPTL * COSABK)/ZETA inches
(POWERT * COSLEN)/ BTU/hr
(CONSTP * T)
C2
(POWERT * 14 4.0)/ BTU/hr ft2
(CONSTP * DIAINS * T)(POWERT * COSABK * SCRPTL)/ BTU/hr
(CONSTP * ZETA)Unused floating point variable
DVLSPL(see FILMFR) ft3/lb m
DVLSPG (see FILMFR) ft3/lb m
QUALOX (see FILMFR)
sin I c-1/2
1- 210--1) 1/2
M
sin- (- 2+(M L
M
sin z
(M -l/M
sin -l+ 2 2
M -l1M
wt Z steam

Intermediate Computed Variables (Cont.)
Position index
Position index
l/M
(M2-1 )1/2
M
BTU/hr
psia
sin (k - -5 ')
+(M 1)1/2 2Q= _
M TOT
1 - exp (- 5)
OAVG
O(x)0(y)Hf -cHfg-c
H xH fgx
ft 2
ft 2
BTU/hr ft 2
BTU/hr ft2
BTU/hr ft2
BTU/hr ft2
BTU/lb m
BTU/lb m
BTU/lb m
BTU/lb m
OutputVariables
ONEOVM
ONEMSQ
POWOQ
PBREAK
SINABK
SIGNZ
ULOCAT
DMEFYDMEFGY
ENFPX
ENFGPX
ENLOB
ENLOX
ENLOY
ENSIN
ENSLOB
ENSLOX
ENSLOY
P
PANBOL
POWERA
POWERB
POWERT
POWERX
POWERY
PSATL
PSLBOL
QUALOL
QUALO4
QUALIN
QUALOB
QUALOX
SATL
U
H fHfH
C
H
SkUB-IN4HSUB-C
4HSUB-XHSUB-YP
QANN-c
QANN
QCQTOTQ(x)Q(y)
QB
Qsc
c=016.0LXO
XINX
C
X(x)
Le
U
X
yz
OutputVariables
AREAFL
AREAIS
CFXAVG
CFXBO
CFXLOX
CFXLOY
DMEFB
DMEFGB
DMEFX
DMEFGX
BTU/lb m
BTU/lb m
BTU/lb m
BTU/lb m
BTU/lb m
BTU/lb m
BTU/lb m
BTU/lb m
BTU/lb m
BTU/lb m
BTU/lb m
psia
BTU/hr
BTU/hr
BTU/hr
BTU/hr
BTU/hr
BTU/hr
BTU/hr
BTU/hrinches
inches
wt % steam
wt % steam
wt % steam
inches
inches
inches
inches
inches

TABLE E-2
FILMFR, GRDMOM and called subroutines
VARIABLE NAME PHYSICAL PARAMETEROR DEFINING EQUATION
Intermediate Computed Variables
Distance from centerlineto film-core interface
Tube radius
b-a/b
Intermediate variables
in the subroutine MNPGRD
Hf-OUT
Hfg-OUT
P/lOOO
APTPF-MOM
log (100 X +1.0)
Linear momentum gradient
I
K + 1, L + 1
hOUT
AHOUTf/4.0
12.0(b-a)
g = 32.2
g0 = 32.2
W00 = 4.17 X 10+8
UNITS
Intermediate Computed Variables (cont.)
GRDMT
GSUBZ
GTOT
GTOTSC
inches
Inches
BTU/lb m
BTU/lb m
psia
lb f/ft2
lb f/ft 3
BTU/lb m
BTU/lb m
ft
ft/sec2
lbm ft
f sec2
lbm ft6fE shr 2
OMEGA
OMEGAP
PGMULT
PHIMN
PSUBL
QUALO
QUALO 4
SUMCOL
SUMO
SUM 1
SUM 2
SUM 3SUM 4
SUM 5TTERM 1
TERM 2
TERM 3
TERM 4
FISCL
VOLSPLVOLSPG
dP/dzTPF-MOM
log(.OO36 G/3600.0 + 0.2)G
G/3600.0
3 or 2; spacing betweencalculations along the tube
length.
_Q = 2'-.4
#M-Nlog (10.0p)
XOUT16.0 LxO
lb fIt 3
lbm/hr ft2
lbm
sec -ft
inches
- g--
inches
Intermediate variables
in the subroutine MNPGRD.
BMAOA
COLM 1)
COLM 2)
COLM 3)
COLM 4)
DENFO
DENFGO
DP
DPMOM
DX
DUMMY A
DUMMY B
DUMMY C
ENO
ENSO
FFACTP
FILMTK
GRAVAC
GRAVCS
GRAVCH
sec/ft
ft/sec
lbm/hrft 3 /lbft 3 /lb
(vg/vt)0 .334
3600./v gGG
(- 'TPF-TOT32.2b vP 1/2
0 ( -d~zTPF-TOT

Output Variables
DBMAOA
DPGMLT
DT
DVLSPG
DVLSPL
DVISCL
FACTUN
FFACT
FYPLUS
GFILM
GGAS
GLIQ
GLQENT
GRDFS
GRDFT
GRDMT
GRDTOT
PCLIQ
PCLENT
REYNUM
TAUWAL
TKINCH
VALUEN
VELOC
YPLUS
b-a
2M-NT
V
V1
F(y+)
GFILM
GL G
GL-ENT
dPaz)SP -FRICTION
dz)TPF-FRICTION
d)TPF-MOM
dz TPF-TOT
% LIQ
Tb-a
TABLE E-3
BONUCF, IDNUCF and called subroutines
VARIABLE NAME PHYSICAL PARAW1EROR DEFINIM EQUATION
INPT VARIABLE
IWREiAT
3 Fft3 /lb m
ft 3 /lb m
lbm/hr ft
lbmhr ft 2
lbm/hr ft2
lbm/hr ft2
lbm/hr ft
lb/hr ft2
lbm/ft3
lbf/ft3
lbf/ft3
lb /ft3
lbm liquid
lb total
lb liquid entrained/M lb liquid
lb /ft2
inches
ft/sec
fEWHT
BKAOA
CC
CPLIQ
DD
DEIIEN
DEILEN
DEMVP
DTCHEN
YTDENG
EE
FIIMflK
HCHEN
HDB
HDNC
HMAC
J/8 - spacing at whichcalculations are perform-ed over spiked portion oftest section (CSPIKE)
OUTPUT VARIABLES
.0234
1.0 .162. 30-p. 0234
(q/A)x/(q/A)i-CHEN
(q/A)x/(q/ALi-DENMLER
C1. 0/tt
Tw-TSAT
AP corresponding toTW-TSAT
(TW-TSAT CHEN
(TW-TSAT )DMGLERF 1 2 5 ReL
(1-Z-/).9
hDIPTUS-BOEMER
bDENGLER
hNAC(from CuE)
UNITS
HU/LM-0F
0OF
lbf/ft2
0 F
F
MU/HR FT0F
BrU/HR-FT- 0 F
BTU/HR FT0 F
BmU/HR FTOF
INTEPNEDIATE AND

SAMPLE INPUT DATAIntermediate and
HNIC
x
N
NFLUX
QACHEN
QADENG
QUALO4
PRNUMB
RADIUS
RADMAX
REYNLQ
SATP
SCHEN
SMALLT
SURmTL
TAUWAL
THCOND
VISCO
YPLUS
Output Variables (Cont.)
hMIC(from CHEN)
UNUSED FIXED POINTVARIABLE
FIXED POINT INDEX FROMCSPIKE
QUALO4
(q/A) i-CHEN
(q/A)i-DENLER
NPR
RIN
Maximim pit radiusavailable in test section
ReL
PSAT
3CHEN
Intermediate variable inXSATP
BTU/HR FT0 F
inches
B /HR FT2
inches
2503.
281.
30.00
31
18.0
5.75120.
60.17
0.0801.33
lb./in2
7210. 2.27
280. 128.
30.00 60.17
31 0.080
6.0 0.0
PEAK INLET FLUX DISTRIBUTION - #2503
.213 13.9 30.9 204.2
99. 161. 21. 28.1
123.75
15.0
UNIFORM FLUX DISTRIBUTION WITH COSINE SPIKE
#7210
.213 16.7 36.4 203.4
35. 152. 93. 29.8
250.0
MU/HR FToF
LUB/HR FT
Xtt
(vL/vo).5
----------

100
200
600
A00
1100
1400
1600
2000
-EM LIMzim
OATA OrDUCTION FnP NONUNIFORM AXIAL HEAT FLUX INPUTrn"MAN NTUPCS SHAPFTUBERAT IOMDIAINS*VOLTS AMPSENTHINFLMASS,
1 0D5SDDDFSIN!,DrESOTPFSDPTSDBOLOCAXLNGTHSHUNTMeP
7 0cFX ,NFDX,0McFrXrNGPXFNSINQUALIN ,PWFRTAREAFLAREAISf'UAL0LSATL,D'SATLDWPAODSLPOLErFXAVGCFXLXJLOCATIK,X,
4fDln=AK ,DNE3XMLoXEFNSLOXQUALOXDMFFY,0MEFGYPOWOO,0NFOVM,r rSL"Nen ""MSSTINZADGZFACMIRFACPLACFXBOLtY,A FACTveDOnWcDYCFXLOYENLOYFNSLoYOUALoYFACT0P7CnST),SCDDTLE/FTA,PLtNTHJUULCATCOSABKSINABKl,p FXTqAAOX rPARFXTRACFXTPADEXTRAFEEXTRAF.O0nAFZDM'er9 NLBENSLOBUALOBEXTRAGEXTRAHEXTRAEXTRAJ
CW/0N 'JALIA GLI0,TKINCH#lODX,CILlCoLM2,COLM3,COLM4,SUMCOLDHIMNGTOTSCGSURZSUMOSUMl,25UM2,SUM2, UM4,SUM5,OMFGAP,0MEGAPGMULTDSURLT,VISCLVOLSPLENO,
IVoLSDO ,0tJAL04,P0WEOADANB0LDENFC,DFNFGOENSO ,UALOOVSPLODVSPGO,4ATOT,ODM0M,GPODMTDVLSPL9OVLSDGTFRM1,TFRM2,TEPM3,TERM4GGASDTr')VTSrLeorYMUIJeFFACTDoFFACT,VrLOC,(GDI)PSeOGr)MLTtCGODFTof0RDMTgGRDTOT,6RGRAVAC,OPAVCSGCRAVCHVALUFNFACTUNBMAOADBMAOAAFILMTKYPLUS,7TAIJWALYDLUS,0FTL,'*eLOFNT,prLIQPCLFNTpUMMYADUMMYR5,UMMYC
COC""'0 NeueTHC0OI'eFCHENSCHFNVISCGCPLI0,SURFTL
1XTT,SAfrSMALLTDELTVPTWALLHCHENHMACHMICRFYNL0,NFLUX,2 ODJRe,0qGHTRHDDFMlGOADF0DTFNGDFLTT,0ACHEN,I 0TCHFNnADkMAXo0cLTrNRAIUSoCC'DDF
ASHADP VALUF INDICATFS THE TUBE FLUX SHAPEqMSHAPE=1 IS UNIFRM1MCHADF=7 IS'CnSINF, MSHAPE=3 IS LINFAR INCRFASING, AND MSHAPF=4 IS7FCPFASIM0 FLUXMSHAPE 5=PEAKED INLET* AND MSHAPE 6= PEAKED EXITDFAn AO,KITJPFqPrImT A0rMTUPFS
rO5 F-DMAT (TFIrl1) FfA13MAT ( TR)
512 FnOlAT (1w1TCI)n^ 21nm I=1,PTURrSPran r10,MSHAPPPRTNT 512,MSHAPrIF (ARSF(MSHAPF-1) 1 5, 100, 5I IF (ARSF(MSHADF-7) 1 10, 200, 10
1K TF(ARSF(MSHAPF-1)) 15.600,15r Tr(APSF(MSHAPF-4)) ?0,800,20
,0 TF(AnSF(MSHAP-A)) 3091100,30
mI IF(ARSc(MSHAPc-61) 1600,1400,1600r STATMVNTSPrINNING WITH 100 APE FOR UNIFORM FLUX, 200 COSINEC 1 600 LINFAD INCDFASTNG,800 LINrAR DECPEASING91100 PEAKEDC 2 INLFT, AND 1400 PEAKED EXIT
00010000200003000040000500006000070000800009000100001100012000130001400015000160001700018000190002000021000220002300024000250002600027000280002000o3000031000320003300034000350003600037000380003Q000400004100042000430
SURROUTINF UNIFRM 00010COMMON NTUBESMSHAPETUBEtRATIOMDIAINSVOLTS.AMPSENTHINFLMASS* 00020
1 PRFSDPRESINPRFSOTRESDPTSDPBOLOCAXLNGTHSHU4TM.P, 000302 DMFFXENFPXDMFFGXEFNFGPXENSINOUALINPOWER',AREAFLARFAIS, 000403 OUALOLSATLPSATLPOWERBPSLROLCFXAVGCFXLOXJLOCATK,X 000504PRPFAKPOWFRXFNLOXENSLOX.QUALOXDMEFYDMEFGYvPOWOONEOVM9 000605 COSLFN ONFMSOSIGNZ ARGZFACMIIRFACPLB.CFXBrLey, 000706 FACTMIPOWFYCFXLOYFNLOYPENSLOYOUALOYFACYPLv 000907CONSTPSCRPTLZFTAPLNGTHJUULOCATCOSABK.SINABKl 000008 FXTRAA EXTRARFXTRACFXTRADFXTRAF*PXTRAF 001009DMEFB.DMEFGRFNLOBENSLOBOUALOBEXTRAGEXTRAHFXTRAIFXTRAJ 00110COMMON OUALIA*GLIOTKINCH, 001201DPDXCOLM1,COLM2COLM3COLM4SUCOLPHIMNGTOTSCGSURZ,SUMOSSUMl 001302SUM2,SUM3,SUM4,SUM5,OMEGAPOMEGAPGMULTPSUBL,TVISCLVOLSPLFNO, 001403VOLSPGOUALO4,DOWERAPANBOLDENFODENFGO,FNSOOUALODVSPLODVSPGO* 001504GTOTDPMOMGRDMTDVLSPLDVLSPGTERM1,TERM2TERM3TFRM4GGASDT, 001605DVISCLeREYNUMFFACTPFFACT VFLOCGRDFSDPGMLTsGRDFTDGRDMTGRDTOT 001706BGRAVACGRAVCSGRAVCHVALUENFACTUNBMAOADBMAOAAFILMTKYPLUS, 001807TAUWALFYPLUSGFILMGLOENTePCLIOPCLENTDUMMYADUMMYREDUMMYC onion
515 FORMAT (r1.0.09F0.2sF10.4,4F10.1I) 0020520 FODMAT (5F10.01F10.7) 0020525 FORMAT (2F10.2) 0020530 FORMAT (T5,9FIO3) 00230540 FORMAT(24H INLET LIQUID ENTHALPY = F8.29 00240
1 25H INLET EVAP ENTHALPY =F8.29 22H INLET SUBCOOLXNG =F8.2) 00250543 FORMATI16H INLET QUALITY = F6.3) 00260545 FORMAT(12H FLOW AREA =3PE15.2925H INSIDE SURFACE AREA -OPE15.4) 00270550 FORMAT415H LENGTH WH=RE QUALITY EQUALS Z SPC =F1=.2F 00250
1 42H LENGTH OVER WHICH QUALITY ABOVE ZFRO =F15.2) 00290555 FORMAT(24H POWER OVER SAT LENGTH =1PE1O.3,17H POWER To 8o 00300
1 1PE10.3o26H POWER FPOM SAT TO 80 a IPE1O.3) '0010560 FORMAT(20H AVG CRITICAL FLUX =1PF10.3, 00370
1 ?SH CRITICAL FLUX AT 90 = IPF131 00330565 FPRMAT(FI1O.2) 00340570 FORMAT(FI10.1) 00575 FORMAT(2F20.2) 00360
READ 515,TUBERATIOMoDIAINSVOLTSAMPSENTHINFLMASS 00170READ 520,PRESPPRESINPRESOTPESDPTSDDBOLOCA 00380READ 525sXLNGTH9SHUNTM 0039tREAD 5309JLOCATeOUALIA 00400PRINT 515,TUBERATTOMOIAINSVOLTS*AMPSENTHINFLMASS 00410PRINT 520tPRESPvPRESINPPRES0T#RESDPTSDPBOL04 A 00420
CALL UNIFRM
GO TO 2000CALL COSINrGO TO 2000CALL LININCGO TO 7000CALL LTNOFCGM TO 7000CALL DKINGO TO 700"CALL PKOUTGO TO 2000CALL SPKCO5GO TO 2000CONTINUE -CALL rXITrND
004400045000460004700048)0O490050000510n0570
0053000840005500056000570005500059000600

PRINT 5?9,XLNGTHqSHUNTMPQINT"r,0 JLMCAT,' UALIA
100 P=POFPINCALL LIOFNDMFFX=ENFDXCALL FVADemIQMPFAX=FNFe0XFNSIN-cNTHTN-nurFX
UALIN=ENSIN/DMFFGXPOWFRT=V0LTS*AMOS*3.41*SHUNTMAPFAFL=(3.1416*OTAINS*OIAINS)/976.0APFAIS=(3.1416*XLNGTH*QIAINS)/144.0OUALOL=(-XLnTH*rNSN*CLMASS)/POWFPTSATL=XLNnTw-0UALnLPqATL=OoWrT*(SATL/XLNGTH)DOwroP=PoWrT*(P0L0CA/XLNGiTH)IF (POLOCA-OUALnL) 750,750,755
795 IF (80LOCA-(1.6*OUALOL)) 760,760,765
7r9 0=00SIN
no TO 770760 P=DOFSIN- (0.790*TSnp*(BOloCA-OUALOL)/(XLNGTH-OUALOL))
n0 TO 770
76r PnRPA=PPRSIN-(0.75O*TSDP*(0.60*OUALOL)/(XLNGTH-QUALOL))poPnPFAK-((nRP9AK-PDFSOT)*(R0L0CA-(1.60*OUALL))/(XLNGTH-
1 (1.6*0ALOL))771 CALL LIOrN
nQMcF=NInx
CALL PVADCNInrMMPFG=rNnPX
PNL0R=cNTHIN+PnWFRR/FLVASSFNSLOR=FNLA-QMFFRnlJALOR=FNSLOR/IIMFFGF
145 PSLROL =PSATL - (POWERT -DOWEOB )150 CFXAVG =POWFRT/ARFAIS
CFXBO=POWFPT/ARFAIS
PPINT 540,ODmFFXqnMFFGX9ENSINPRINT 543, OUALINPRINT945,ARPAFLARFAISPRINT r90,0UALOLSATLDPINT 995 9 PSATLs POWFRR, PSLROLDopIT 560,CFXAVrCFXPO
DDINT 77DnOMFFRnMFFOCRPPINT 7Tn, NL0R9,NLnR
PT1T 7,9,IJALmQ779 FP-MMAT(17H PRESSURE AT BO =F6.1,25H SAT LTO ENTH AT 80 =F8.2.
1 ??H FVAP FNTH AT 90 =F8.2)7An FOPMAT(13H FNTH AT RO =F8.2, 27H SURCOOLED ENTH AT B0 =F8.2)
7A6 PORMAT(16H OUALITY AT RO =F6.3)CALL IROMOPI
CALL UNIANNI
no 46M K=1JLOCAT,31r6 X=W-1
IF(X-MUALOL)160 .160 9157157 IF(X-(1.60*OUALOL) ) 162.162.16516n P=PRFSIN
nn TO 16716? P=PPFSIN-(O.750*TSQP*(X-OUALOL)/(XLNGTH-OUALOL))
00 TO 167
169 PBORAK=PRSIN-(0.750*TSDP*(0.60*OUALOL) /(XLNCTH-OUALOL))166 P=DBRFAK-((PROrAK-PRSnT)*(X-(1.60*0UALOL))/
1 (XLNGTH-(1.60*QUALOL)))
167 CALL LIQFNnMFFX=CNFPXCALL PVAPDNr)MFFGX=FNFrPX
0043000440004500046000470004800049000500005100052000530005400055000560005700058000590006000061000670006300064000650006600067000680006900070000710007200073000740007500076000770007800079000800009100082000830008400085000860008700088000890009000091000920009300094000950009600097000980009900100001010010200103001040010500106001070
PRINT 565 9XPRINT 570 ,PPRINT 575,oMFFX#DMFFGX
170 CFXLOX=POWFRT/ARFAIS175 PoWERX=POWERT*(X/XLNGTH)180 ENLOX=FNTHIN + POWERX/FLMASS
185 FNSLOX=FNLOX-DMFFX190 OUALOX=ENSLOX/nMFFGX
PRINT 700DOWERToPOWrPXtCFXLOXPRINT 7109FNLOXPRINT 7209FNSLOX#QUALOX
700 FORMAT(14H POWER TOTAL = E9.4/,1 28H POWFR INPUT TO POSITION X = F9.4/#2 18H LOCAL HEAT FLUX = E11.5)
710 FORMAT(31H LOCAL ENTHALPY AT POSITION X = F8.^)720 FORMAT(41H LOCAL SUBCOOLED ENTHALPY AT POSITIoN X = F8.2/v
130H LOCAL QUALITY AT POSITION X = F6.3)CALL FILMFR
460 CONTINUERFTURNFND
SUBROUTINE COSINECOMMON NTUBESMSHAPETUBEOATIOMDIAINSVOLTSAMPSENTHINFLMASS,1 PRES ,PRESINPRESOTRESDPTSDPBOLOCAXLNGTHSHUNTM,Po2DMEFXENFPXDMFFGXFNFGPXFNSINOUALIN,POWETAPEAFLAPFAIS,3 OUALQLSATLPSATL,0OWFP8,PSLRnL,CFXAVGCFXLOXJLOCATKeX.4PBOEAKDOWFRX.FNLOXENSLOXOUALOXDMEFYDMEFGYPOWOQONEOVM5 COSLEN ONEMSO.SIGNZAPG ,ZFACMIBFACPLP.CFXPOL.Y.6 FACTMIPOWKRYCFXLOYFNLOYENSLOYnUALOYFACTPL,7CONSTPSCRPTLZFTAPLNGTHJUULOCATCOSABKSINABK.l.8 EXTRAAEXTRABEXTRACEXTRADFXTRAFFXTRAF,9 DMEFRDMEFGBENLOBFNSLOBOUALOBEXTRAGEXTPAHEXTRAIEXTDAJCOMMON QUALIA#GLIOTKINCH,1DP.DXCOLM1,COLM2,COLM3,COLM4,SUMCOLPHIMN.GTOTSCGSUBZeSUMOiSUMl.2SUM2,SUM3,SUM4,SUM5,OMFGADoMrGAPGMULTPSURLTVISCLVOLSPLFNO,3VOLSPGOUAL04,POWEQAPANBOL DFNFODENFGOFNS09OUALOtDVSPLODVSPGO,4GTOTDPM0MGPDMT DVLSDLDVLSPGTFQM1,TFPM2,TFM3,TFRM4GGASDT9SDVISCLeREYNUMFFACTP.FFACTVFLOCGPDFSoPGMLT GODFTOQRMTGRTT96BGRAVACGPAVCSGRAVCHVALUENFACTUNBMAOADPMAOA,A.FILMTKYPLUS,7TAUWALFYDLUSGFILM.GLOENTPCLIOPCLFNT,OUMMYADUMMYBDUMMYC
515 FORMAT (F10.0,F1O.?,F10.4,4F10.1)520 FORMAT (5F10.0. 1F1O.2)
525 FORMAT (2F10.2)510 FORMAT(I5F1O.3)540 FORMAT(24H INLFT LIQUID ENTHALPY = F8.2,
I 2rH INLFT EVAP FNTHALPY =F8.29 ??H INLET SUBCOOLING =F8.2)543 FORMAT(16H INLrT QUALITY = F6.3)545 FORMAT(12H FLOW AREA =3PE15.2,25H INSIDE St'RFACE AREA =OPE15.4)550 FORMAT(35H LENGTH WHEPF QUALITY EOUALS ZFRO =1'15.29
1 42H LENGTH OVER WHICH OUALITY ABOVE ZEPO =F15.2)555 FOMAT(24H POWER OVER SAT LENGTH =IPE10.3,17H POWFR TO BO =
I 1PE10.3,26H POWER FROM SAT TO B0 = IPE10.-,)560 FORMAT(20H AVG CPITICAL FLUX =1PF10.3,
1 25H CRITICAL FLUX AT SO = 1PE10.3)565 FORMAT(F1O.2)570 FORMAT(F1O.1)575 FOPMAT(2F20.2)
READ 915,TUBERATIOMDIAINS.VOLTSAMPSENTHINFLMASSREAD 520,PRESPPRESINPRESOTQESDPTSDPeBOLOCA
0108001090011000111001120011300114001150011600117001180
0121001220012300124001250012600127001280
000100002000030100040!0005 r000600007o000080000900010000110001200013000140001500016000170001800019000200002100022000230002400025000260002700021000200003000031000320003300014000350003600037000380

''523"
23524"
240
25
?A-,2611
READ 525,XLNGTH,SPJNTMREAD 530,JLOCAToUALIApOINT 515,TUR0,OATIOM,0IAINSVOLTSAMPS,PNTHIN,FLMASS
POINT 520,PODSD,0DFSINPDFSOTOFSDD,TSDD,90LnCAPOINT 525,XLNOTH,SHUNTMPOINT 530
,JLOCATqUALIAD=DQFS T'
CALL LIOFNrYPFY=rNrDX
CALL rVADCMMAFGY=cNF0PX
FNIIN=rMTHI kl-WMY0UALIN=ISIN/"'ouFrY
P0WroT=VOLTS*AOS*3.41 *SHJNT"APrAFL=(3.1416*01AINS*IAINS)/(576.0)
A0cAIS=(3.1416*XL -nT-*nIAIN'S)/144.0
"eW'0= -rkSI'*FLASS
ONPOVM =1.9/PATI"vC0SLFN=(l.c70A*XLNGTH)/ACOSF(ONEOVM)rNPMcSn= SODTr( (OATICM**2 -1.0) / PATIOM**?IF (1.0-(2.0*P0WOO/POWTRT) ) 255, ?55, 245
5INZ =T N"S0* (1.0-(2.0*DOWOO/D0WPPT)00 TO 275SINZ= ONF"S0*( (2.0*POWOO/P0WEPT) - 1.0)
AO=ASINr(STONZ)Z =COSLFI*APG /3.1416
,77, ntULOL-= (XL'IrTH/ 2.0 +Z
00 TO 20"
'71 A34=ASTMFCT0NZ)"P' Z=COLPN*A')/3.141 A
"05 OUALOL=(XL!"TH/7.0")-Z22. ' ATL=XLN"TH-OUALML205 DCATL= D(dFOT -DW0O
Tr (POLO"A-(XLNGTH/7.00)) 125,32r,34P 0A r"I=( .- (SINF( (.1416*((XLNGTH/2.00)-R0LnCA) )/COSLPN)/
lr DOWc2O = (0)-WcT,FAr0MIP) /?70TP (IrLOCA-MUALL) 75C,750,705
7' IF (q0LOA-(1.6*^UALOL)) 760,760,765
00 TO '70"AA' D="FSI- (0.7N0*TS0'*(B0L0CA-QUALOL)/(XLNGTH-QUALOL))
rn TO 77"
76 PRrA=PPFINt-(0.7 *TSDP*(0.60*QUALOL)/(XLNGTH-QUALOL))P=PROAK-((PR2AK-DPc5OT)*(80LOCA-(1.60*OUALOL))/(XLNGTH-
S(1.60*U'JALOL)))77" CALL LIO"N
nM"FPR=PNPDXCALL PVAPcPIMcFP=PNPr-PX
0NLOP=rNTHIN+PoWP30/FL'ASSPN SLOrP=PNLOrP-nv PPQUALoP=FNSLOR/OMPFGl
305 CFXPr):144."*(D)OWPT/(?.0*DIAINS*CSLN*ONEMSC))*1CSF(3.1416*( (XLNrTH/?.0)-0OLCA) /COSLFN)
140 PSLROL =POWEOP -DOW0O0 TO 153
24A FACPLq=(1.C+(SINPF( (11416*(ROLOCA-(XLNGTH/?.0) ) h/COSLEN)1/ONPMSO ))
345 POWCOR =(POWPPT*FACDLA) /2.0IF (RLOCA-OUALOL) 850,850,855
85r IF (ROLOCA-(1.6*OUALOL)) 860,860,865851 P=OFSIN
00 TO q70RAO P=DOCSIN- (0.750*TSOD*(ROLOCA-QUALOL)/(XLNGTH-OUALOL))
00390004000041000420004300044000450004600047000480004900050000510005200053000540005500056000570005800050000600006100062000630006400065000660006700068000690007000071000720007300074000750
007600077000780007900080000810008200083000840008500086000870008800089000900009100092000930009400095000960009700098000990010000101001'02001030
0O TO A70
865 PROEAK=POFSIN-(0.750*TSDP*(0.60*0UALOL)/(XLNGTH-OUALOL))P=DRPEAK-((DB EAK-DOESOT)*(BOL0CA-fle60*0UAL0I))/(XLNGTH-
1 (1.60*QUALOL)))870 CALL LIOFN
DMFFP=FNFPXCALL EVAPFNDMFFG8=FNFOXFNLOB=ENTHIN+P0WFRB/cLMASSFNSLOR=ENLOB-DMEFBOUALOB=ENSLO8/DMEFGB
348 CFXBO=144.0*(POWERT/(2.0*DIAINS*COSLEN*NEMSO))*1COSF(3.1416*(BOLOCA-(XLNGTH/2.0) )/COSLEN
350 PSLROL =POWEPR -POWOO353 CFXAVG = POWERT / AREAIS
DPINT 54",0MPFY,0MPFYFNSINPOINT 543. OUALINPRINT 545, ARFACL ,AREAISPOINT 550 ,OUALOL, SATLPRINT 555 ,PSATL, POWFOB, PSLROL
PRINT 560,CFXAVGCFXROPRINT 775,PDMEFOMEFGB
POINT 780, LOR,FNSLO0RPRINT 785,0UALO9
775 FOPMAT(17H PRESSURE AT BO =F6.1.25H SAT LIO ENTH AT B0 =F8.2,1 22H EVAP PNTH AT RO =F8.2)
780 FORMAT(13H FNTH AT RO =F8.2, 27H SUBCOOLED ENTH AT BO =F8.2)785 PORMAT(16H OUALITY AT 90 =F6.3)
CALL GOrMOMCALL COSANN00 460 L=1,JLOCAT,3
360 Y=L-1IF (Y - CUALOL) 370, 370, 365
365 IF (Y -(1.6*0UALOL) ) 375, 375, 380370 P = DPSIN
GC. TO 300375 D=PPESIN-(0.750*TS)D*(Y-rUALL)/(XL TH-UALL)
0O TO 300380 DBOPAK=PPFSIN-(0.750*TSDP*(0.60*OUALOL)/(XLNG'H-QUALL)385 P=DROFAK-((PBPFAK-PDFS0T)*(Y-(1.60*OUALOL))/
1 (XLNGTH-(1.60*0UALOL)))390 CALL LIOFN
OMFFY=PMFDXCALL FVAPFNDMEFGY=ENFGPXPRINT 565,YPRINT 570, PPRINT 575,DMFFYOMFPrYIF (Y-(XLNGTH/?.0) )400,400,428
400 FACTMI=(1.0-(SINF( (3.1416*( (XLNGTH/2.0)-Y)1/COSLEN)) /ONEMSO)
410 POWFRY =(POWFRT*FACTMI) / 2.0412 CFXLOY=144.0*(POWEPT/(2.0*DIAINS*COSLPN*ONFMSO))*
1COSF(3.1416*( (XLNGTH/2.0)-Y)/COSLFN)415 FNLOY = FNTHIN + (POWEPT*FACTMI) / (7.0 *FLMASS)
420 FNSLOY=FNL0Y-DMFFY425 OUALOX=ENSLOY/DMPFnY
rO TO 45542A PACTPL=(1.0+(SINF( (3.1416*(Y-(XLNCTH/2.0) ) )
1/COSLEN) )/ONFMSO)430 POWFRY a (POWFPT*FACTPL) / 2.0
433 CFXLOY=144.0*(POWEPT/(?.0*DIAINS*COSLFN.ONEMSO) )*1COSF(I3.1416*(Y-(XLNGTH/2.0) /COSLFN)
435 ENLOY = ENTHIN + ( POWERT* FACTPL) / 1 2.0 * FLMASS)440 FNSLOY=ENLOY-DMFFY
0104001050010600107001080010900110001110011200113001140011500116001170011800119001200012100122001230012400125001260012700128001290013000131001320013300134001350013600137001380013900140001410014?0014300144001450
0146)0147001480014900150001510015200153001540015500156001570
0159001590016000161001620016300164001650016600167001680

450 OUALnX=FNSLY/)MPFFY455 CONTTNUF
PRINT 70OqDOWWTDOWPDYCFXLOYPONT 71'ecNLOYPRINT 720erNSLOYOUALOX
700 FOPMAT(14H POWFQ TOTIL = CO.4/o1 28H POWER INPUT TO POSITION X = E9.4/,2 1RH LOCAL HFAT FLUX = P11.5)
710 FORMAT(31H LOCAL ENTHALPY AT POSITION7X = F8.7)720 FORMAT(41H LOCAL SURCOOLED ENTHALPY AT POSITION X F@2/9
130H LOCAL QUALITY AT POSITION X = F6.3)CALL =ILMFP
461 CONTINUERFTURN
SURROUTINF LININCCOMMON NTUBFSMSHAPETUBE,RATIOMDIAINSVOLTSAMDSENTHINFLMASS,
1 PRFSPPQESIN.PPESOT ,ESDDOTSDP.BOLOCAXLNGTHSHUNTMP2 0MFFXENFPXOMEFGXFNFGPXFNSINQUALINPOWERTAREAFLAREAIS,I OUALOL,SATLDSATLDOOWERBPSLBOLCFXAVGCFXLOXJLOCATKX,4PRDEAKPOWFRXFNLOX.ENSLOXQUALOXDMEFYDMEFGY.POWOOONEOVMvR COSLENONFMSOSIGNZARGZ,FACMIBFACPLRCFXBOLY,6 FACTMIPOWERYCFXLOYENLOYENSLOYOUALOYFACTPL7CONSTPSCRPTL,ZETAPLNGTHJUULOCAT.COSABKSINAKEIA FXTDAAFXTQAR, XTRACFXTRAO,FXTPAFEXTRAF,00MFFB9rMEFC.RFNLOBeFNSLOBeUALO8EXTRAGEXTRAHEXTRAI.FXTRAJ
COMMON QUALIAGLIQTKINCH,10PDXCOLM1COLM2COLM3,COLM4,SUMCOLPHIMNGTOTSCGSUBZSUMO.SUM12SUM2,SUM1,SUM4,SUM5,OMEGAPOMFCAPGMULTPSUBL,TVISCLVOLSPLENO,IVOLSPCOUALO4,DOWEA.PANBOL DENFODENFGOENSOOUALODVSPLODVSPGO,4CTOToPMOuAGrDMTDVLSPLDVLSPGTEDM1 TERM2,TERM3,TEQM4,GGASDT.9DVISCLREYNUMFFACTPFFACTVELOCGRDFSDPGMLTGRDFT#DGRDMTGRDTOT,6PORAVAC GRAVCS GRAVCHVALUFNFACTUNRMAOADBMAOA,AFILMTKYPLUS,7TAUWALFYDLUSGFILMoGLOENTPCLIQ,PCLFNTDUMMYADUMMYROUMMYC
914 FODMAT (F10.0,F10.2,F10.4,4F10.1)R2' FORMAT (5F10.0,1F10.2)529 FORMAT (2F10.?)
Al' FORMAT(195910.l)543 FORMAT(24H INLrT LIQUID ENTHALPY = F8.2,
1 25H INLET FVAP ENTHALPY =F8.2. 22H INLET SUBCOOLING =F8.2)R41 FORMAT(16H INLFT QUALITY = F6.31549 FOOMAT(12H FLOW AREA =3PE1S.2925H INSIDE SlIRFACE AREA =OPE15.4)991 POOMAT(3H LFNGTH WHFRP QUALITY FOUALS ZPRO =F15.2,
1 47H LFNrTH ^VER WHICH QUALITY ABOVE ZFRO -F15.2)59 FnPMAT(24H POWER OVFR SAT LENGTH =1PEIO.3917H POWER TO BO =
1 1PF10.3.26H POWER FROM SAT TO 80 = 1PE1O.,)RAO FODMAT(?0H AVG rOITICAL FLUX =PF101.,
I 25H CPITICAL FLUX AT 80 = IPE10.3)965 FORMAT(F10.2)570 FORMAT(F1O.1)
79 POOMAT(?20.?)DEAD 91 5,TURERATI1MDIAINSVOLTSAMPSFNTHINFLMASSREAD S?0,PQFSDPOESINPRESOTRESDPTSDPBOLOCAOrAD 925,XLNGTH9SHUNTMRFAD 530,JLOCATOUALIAPOINT 515TUBERATI0MDIAINSVOLTSAMPSENTHIN,FLMASSPRINT 5?0',DESPPRESINDPESOTRESDPTSDPBOLOCADoImT 75,XLmGTHSHUmTMPRTNT 531,JLOCAT,QUALIA
0169001700017100172001730
0176001770017800179001800018100187001810
0129001300013100132001330013400135001360013700138001390014000141001420014300144001450014600147001480014900150001510015200153001540015500156001570015800159001600016100162001630016400165001660016700168001690017000171001720
100 P-DRFSINCALL LTOENDMFFX2FNFPXCALL FVAPENDMEFGX=ENFGPXFNSIN=FNTHIN-DMgFXOUALIN=ENSIN/DMEFGXDOWF9T=VOLTS*AMPS*1.41*SHUNTMAREAFL.(3.1416*DIAINS*DIAINS)/576.0AREAIS=(3.1416*XLNGTH*DIAINS)/144.0POWOQ=-(ENSIN*FLMASS)QUADA2(QATIOM-1.00)/(2.00*XLNGTH)OUADC=-(XLNGTH*(RATIOM+1.00)*POWOO)/(2.00*POWIRT)OUALOL.(-1.00+(ARSF(SORTF(1.00-4.00*OUADA*0UADCIl))/(2.00*OUADA)SATL=XLNGTH-QUALOLPSATL=POWFPT-POWOQPOWFRR=((POWrPT*2.00)/(RATIOM+1.OO))*(ROLOCA/XLNGTH)1 +(ROL0CA*OLOCA*(RATIM-1.00))/(XLNTH*XLNrTH*2.00))IF (POLOCA-OUALOL) 750750#755
755 IF (BOLOCA-(1.6*QUALOL)) 7609760,765750 P=DDESIN
GO TO 770760 P=PRFSIN- (0.750*TSOD*(BOLOCA-OUALOL)/(XLNGTH-OUALOL))
GO TO 770765 PBREAK=PRESIN-(0.750*TSDP*(0.60*QUALOL)/(XLNGTH-QUALOL))
P=P8REAK-((PBREAK-PESOT)*(BOLOCA-(1.60*OUALOL))/(XLNGTH-1 (1.60*OUALnL)))
770 CALL LIQENDMEFB=ENFPXCALL rVAPFNDMFFGR=ENF6PX
ENLOB=FNTHIN+DOWFRR/FLMASSENSLOB=ENLOB-DMEFBQUALOR=FNSL9/DrFrRCFXBO=U(2.0*DOWERT)/(ADEAIS*(1.00+RATIOM)1)
1 *(1.00+(POLOCA*(RATTOM-1.00))/XLNGTH)PSL80L*POWPRR-POWOQCFXAVG*POWFRT/AQEAISPRINT 540,DMEFXDMEFGXENSINPRINT 5439 QUALINPRINT545,AREAFLoAREAISPRINT 550*QUALOLSATLPRINT 555 9 DSATL, POWERB, PSLBOLPRINT 560,CFXAVGCFXBOPRINT 775,P,DMEF8DMEFGBPRINT 7809ENLORtENSLOBPRINT 785.OUALOR
775 FORMAT(17H PRESSURE AT BO =F6.1.25H SAT LIO ENTH AT BO xF8.2#I 22H EVAP FNTH AT RO =F8.2)
780 FORMAT113H E14TH AT 80 .F8.29 27H SURCOOLED ENTH AT 80 F8.2)785 FORMAT(16H OUALITY AT 80 =F6.3)
CALL GRO0M0MCALL LNIANN00 460 KalJLOCAT,1
156 XwK-1TF(X-OUALOL)160 9160 .157
157 TF(X-(1.60*QUALOL) ) 162,162.165160 P=PRFSYN
GO TO 167162 P.PRESIN-(0.7504TSDP*(X-QUALOL)/(XLNGTH-OUALOf I)
GOTO 167165 PBREAK=PRESIN-(0.750*TSDP*(0.60*0UALOLY /(XLNGTH-OUALOL))166 P=DOREAK-((PBRFAK-POFS0T)*(X-(1.60*UALOL))/
1 (XLNGTH-(1.60*QUALOL)))167 CALL LIQEN
0173001740017500176001770017800179001800018100182001830018400185001860018700188001890019000191001920010300194001950019600197001980019900200002010020200203002040020500206002070020800209002100021100212002130021400215002160021700218002190022000221002220022100224002250022600227002280022900210002310023200231002340023500236002370

OMFFX=CNFDX
CALL CVADFN
PRINT 565 ,XPPINT 570 ,n'
PRINT 575,OMcFXOMFrXCFXLX=((2.0*POWcDT)/(ADFATS*(PATIOA+1.00)))
1 *(1. 00+( (X*(OATIOM-1.00)) /XLNrTH) )POWPDX=((DrWFRT*7,.00)/(ATIOM+1.00))*(X/XLNGTH+((XX*(ATIOM-1.00)
1 )/(XLNGTH*XLNrTW*2.00)))10 FNLOX=PNITHIN + DOWFX/FLMASS
185 FNSLOX=FNLOX-OMFrX100 OUALOX=FNSL0X/OMFFOX
DPIMT 70O,DOWcrTDnWcPXrFXLrX
nPRMT 71oFvLnXPRINT 721,DMSLOX,0JALOX
7-1 FON6MAT(14H DOWrP TOTAL = P0.4/,I 2RH DOWFP INDUT TO DOSITION X = F.4/,
2 1RP LOCAL HFAT FLUX = '11.5)71^ Fn0AAT(I31H LOCAL ENTHALPY AT POSITION7X = F8.2)720 FORMAT(41H LOCAL SUBCOOLED FNTHALPY AT POSITION X = F8.2/,
13 -w LnrAL )UALITY AT POSITION X = F6.31
CALL rTLMFD46' CONTINUF
o PTI RNm
rNtn
SUDrnUTINc LINOFrC0MANI NTURS,MSHAPFTUBReATIOMOIAINSVOLTSAMPS,FNTHINFLMASS,
1 DOPSDPRESIN,DOFSOT,RcSOP,TSOPROLOCAXLNGTHSHUNTM,D,7 "MAFX,cMFOX,OM rX, NerDX,FNSIN,OUALINPOWCP',APAFL,AFAIS,
; OUALnLOATL,DSATLD0WFC2,DSL0L,CFXAV,CFXLO;.,JLOCATKX,40RcAK,DOWcDX,FNLOX,FNSLOXOUALOX,rMFFY,0MEFGYPOWOO0NCOVM,9 (O5L vImom",SIOG7,AOG,Z,ACMIPFArPLRCFXRCLY,5 FACTMA4,IroYCrXLYNLOY,FNSLY,OUALOY,FACiPL,7rNST,ScDDTL,ZTA,LNTHJUULCAT,COSA9KSINAKI,A CXTOAA , XTPAtaXTDAr ,XTOA, FXTRAccXTA,aoPp,O r)MP~r,cNLp,NSLOP,0UALOBFXTRA,FXTDAHEXTRAI ,cXTRAJ
roNr0,Q OUALIAGLIQTKINCH,100D,0XrolM,C (7A?,CnL"3,CO)LI4,SUMC"LDHIMNgTO)TSCGSUPZSU)MOSUM1,ISU"2,SMSUM95J-4,SU509EGAP,0klcGA,GMULTPSUBLTVISCLVOLSPLPEN,2V1tSDO,OUAL04,DOWEDA,ANROL,DFMIFA,OFF0OG,PMS,UALO,VSDLO.DVSRQ0,4OT T,ON'',sO')MT ,OVLSOL,OVLSDO,TFoM1,TFRM2,TFOM3,TFRM4,QGAS,DT,5OVISrLRFYMUM,FFACTD,FFArT,VFLOr,Or0FS,0PMLTr0DFT,0DOMT,oRDTOT,65,GDAVACGCPAVCSPAVrH,VALUcNFATUI,RMAnADRMAA,A,FILMTK,YDLUS,7TAUWALFYDLUSoFIL"0LOENT,Dr( IOPCLFNTOUMMYADUMMYR,0IJMMYC
51% FORMAT (10.'vF10.2,10.4,4F10.1I)a ? ^ pnt"AaT ( c71I . I,1p1o.9) )q2A FrMAT (?F1
0.?)
52' FODMAT(15,F1O.3)4 FORmAT(24H INLTT LIOUID EMTHALPY = P8.2,
1 2-H INLET EVAP FNTHALPY =F8.2, 22H INLET SUBCOOLING =F8.2)
543 cOR"AT(16H INLET QUALITY = P6.3)r44 FDMAT(2IH rLOW APPA =3PE15.2,25H INSIDE SURFACE ARFA =0PE15.4)
567 ORlMAT(35H LNGTH WHFPc QUALITY FOUALS ZcRO =F15.2,
I 42H LFNGTH IVER WHICH QUALITY APOVE ZERO =F15.2)555 cORDkAT(?4H DOWER OVFrD SAT LPNGTH =10F10.1,17H POWER TO 80 =
1 1Drln.3,7AH DOWFR FROM SAT TO RO = 1OF10.3)
50 FofMAT(2mw AVS roITTCAL FLUX =101O.3,1 75H CRITICAL FLUX AT 8O = IPE10.1)
0238002300240002410024200243002440024500246002470024800249002500025100252002530
0256002570025800259002600026100262002630
02640026500266002670'0268002690027000271002720027300274002750027600277002780027900280002810028200283002840028500286002870028800289002900029100292002030029400295002960
565 rOPMAT(F1O.2)
570 FORMAT(m1l.1)575 PORMAT(2P20*2)
PrA0 r15,TURP,AT IOM90IAINSVOLTSAIODSENTH114,FLMASSPFAD 520ORFSDPRFSIN,PRFST,DESDPTSroePOLOCARFAD 525,XLNGTHSHUNTMPEAD 530,JL^CATQUALIADRINT 515, TUQFDATIOMDIAINSVOLTSAMPSFNTHtNFLMA-SSDDNT 520,DPESPDRFSPI,PPFSOTOESDP,TSDD,80LOCADPINT 525,XLNGTH.SHUNMTPRINT 530,JLOCAT,0UALIA
100 D=DF0SIN
CALL LIOFNDMEFX=FNFPXCALL PVADFNDMFFGiX=ENFrDX
ENSIN=ENTHIN-DMEFXQUALIN=FNSIN/DMFFGXPOWrRT=VOLTS*AMPS*3.41*SHUNTMAREArL=(3.1416*DIAINS*DIAINS)/576.0ARFAIS=(3.1416*XLNOTH*nIAINS)/144.0POWOO=-(ENSIN*FLMASS)OUADA=(RATIOM-1.00)/(2.00*XLNGTH*RATIoM)OUADC=(XLNCGTH*(RATIOM+1.00)*POWOO)/(?.00*POWERT*RATIM)OUALOL=(1.00-(AnSF(SePTF(1.00-4.00*UADA*OUADr))))
1 /(2.00*OUADA)SATL=XLNGTH-OUJALOLPSATL=DOWF0T-DmWOO
POWFRR=((DOWFRT*2.00*PATIOM)/(PATIOM+1.00))*1((BOLCA/XLNGTM)-(POLOCA*9nLOCA*(PATInM-1.00))/(XLN,TH2*XLNGTH*2.00*RATIOl))IF (ROLOCA-QUALOL) 750,750,755
755 IF (BOLOCA-(1.6*OUALOL)l 760,760t765750 P=PRESIN
SO TO 770760 P=DOFSIN- (0.750*TS0D*(BOLOCA-UALOL)/(XLNGTH-OUALOL))
GO TO 770765 PBRFAK=PRESIN-(0.750*TSDP*(0.60*OUALOL)/(XLNGTH-OUALtL))
P=PBREAK-(IDBREAK-PRESOT)*(BOLOCA-(1.60*OUALOL))/(XLNGTH-1 (1.60*OUALOL)))
770 CALL LIOPNDMFFB=ENFDXCALL FVAPFNOMFFOR= FNFzoDXFNLOR=rNTHIN+DOWPPR/FLMASSFNSLOR=FNLOR-DMrP8OUALOB=ENSLnR/DMFPGRCFXRO=((7.0*POWFRT*PATIOM)/(ARFAIS*(1.00+RATIrM)))*
1 (1.00-(BOLOCA*(PATIOm-1.00))/(XLNTH*RATIOM)PSLROL=POWFrR-DOWOOCFXAVG=POWERT/ARFAISPRINT 540,oDMEFXDMEFGX,ENSINPRINT 543, QUALINDPINT545,ARFAFLARFAIS
PRINT 550,0UALOLSATLPRINT 555 , DSATL, POWERB, PSLBOLPRINT 560tCFXAVGCFXPOPRINT 775,ODMEFBDMFFGBPRINT 780,FNLORFNSLORPRINT 785,OUALOR
775 FOPMAT(17H PRESSURE AT BO =F6.1,25H SAT LIO ENTH AT 50 =F8.2v1 22H EVAP ENTH AT RO =F8.2)
780 FOMAT(13H FNTH AT ,0 =F8.2, 27H SUBCOtED ENTH AT R0 =F8.2)785 FORMAT(16H QUALITY AT BO =F6.3)
CALL GRDMOM
02970( 298a0029"0030000301003020030300304003050030600307003090
03100031100312003130031400315003160)0317003180031900320003210032200323003240032500326003270032R0032000330003?10
0333003340
0 335 003360
03380033000340003410034200343003440034500'460034700348003490
0351003520035300354003550035600357003590035900360003610

CALL LNOANNDO 460 K=1,JLOCAT,3
156 X=K-1IF(X-OUALOL)16" 916n 9157
157 IF(X-(1.60*OUALOL) ) 162.16?.165160 P-DRFSIN
GO TO 16716? D=0DESIN-(0.7O*TSDD*(X-UALOL)/(XLNGTH-OUALOL))
GOTO 167169 DRDFAK=PPFSIN-(0.7sO*TSDP*(0.60*OUALOL) /(XLNCTH-OUALOL))166 D=DPRFAK-((PROFAK-PDFSOT)*(X-(1.60*OUALOL))/
1 (XLNGTH-(1.6n*OUALOL)))167 CALL LIOFN
nMFX=FNPDX
CALL FVAPFNOM4crFX=.NF oPRINT 565 ,XPRINT 570 ,o
PRINT 575,OMFFXOMFFgXCFXLOXe((2.C*POWFRT*DAT IOM)/(AOEAIS*(1.00+RATIOM)))*
1(1.00-(X*(DATIOM-1.OO))/(XLNGTH*RATIOM))DOWFRX.((DOWFRT*?.00*PATIOM)/(PATIOM+1.00))*((X/XLNTH1-(X*X*(RATIOM-1.I0))/(XLNrTH*XLNGTH*2.00*RATIOM))
18' FNLOX=FNTHIN + POWFQX/FLMASS15r FNSLOX=FNLOX-rMFFX100 OUALOX=FNSLOX/DMFFGX
PRINT 700,DOWF9T.DOWF0X#CFXLOX
PRINT 7109FNLOXPOINT 720,FNSLOX,0UALOX
7 O FOOMAT(14H DOWER TOTAL = E9.4/91 2PM POWCR INPUT TO POSITION X = F9.4/92 18H LOCAL HEAT FLUX = E11.5)
71' FOPMAT(31H LOCAL ENTHALPY AT POSITION7X = F8.2)72C FO9MAT(41H LOCAL SURCOOLED ENTHALPY AT POSITION X = F8.2/v
110H LOCAL nUALITY AT POSITION X = F6.3)
CALL FTLmR46C CONTINUE
OFTUON
SUPROUTINE PKIN
COMMON NTUBES.MSHAPETUBERATIOMDIAINS VOLTSAMPS.ENTHIN.FLMASS.
1 DPPSD,POFSINDPFSOTPFSODTSDPBOLOCAXLNGTHSHUNTM,P,
? OMFFXrNFDXOMrFGXFNPGPXFNSINOUALINPOWFRTAREAFLADEAIS#I OUALOLSATLPSATLPOWFRRPSLROLCFXAVGCFXLOXJLOCAT,K,X,4DROFAI(eDnWFX,FMLOXFMSLOX,OUALOXDMFYDlMFFCYDOWO.0NEOVM,
r COSLFNnNFMSO5,SIGZADGZFACMIO.FACOLRCFXBA.LY.
6 FACTMi POWFRYCXLOYENLOYFNSLOYQUALOYFACTDL,7tOV5TnoSCQDTLeZFTADLNGTHoJeUtULOCATeCOSABKeSINABKefeP FXTOAAFXTDAPXTDACFXTRADEXTRAFFXTRAFOOMFFg MFFGRFNLBFNSLOR,0UALO8,EXTRAGFXTRAHIEXTRAI FXTRAJ
Cr 1AMO0UALI AGLIOTKIMCH,
10OOXCOLM1,COLmU9COLv3,COLM4,SUMCmL,DHIMN.GTOTSCGSUBZSUMO.SUM1,7SUu?,5UM1,SUM45UM%N'FGAPOMEC,ADGMULTDSURL,TVISCLsVOLSPtENO #IVOLSDC,OUALO4,DOWFADANBOL ,DFNFO,0FNFGOENSOOUALODVSPLODVSDGO4GTT,DMOMGPDMT, DVLSPL.DVLSPG.TEPM1.TERM2,TE:M3,TERM4,GGASDT,
5nVISCL ,RCY UMFrACT0 FPACT ,VPLOCGrOFSOnD)GMLT *GROFT fGQrOMTGRDTOT,6R Q.rAVACG CAVCSGPAVCHVALUFNvFACT UNRMAOADfIAOAt AFILMTKvYPLUS,
7TAUWALFYDLUSGFILM,OLQENTPCLIODPCLFNTDUMRYADUMMYRDUMMYCr14 FnOMAT (F10.09F10.7,F10.4.4F10.1 I
0362003630036400365003660036700368003690037000371003720037100374001750017600377003780037900380003810038200381003840038500386003870038800389003900
039300394003950
0396003970039800399004000)
00010000200001300004000050000600007000080000900010000110001200013000140001500016000170001600019000210
520 FORMAT (SF10.0, 1F10.2)525 FORMAT (2F10.2)530 FO9MAT(I5,F10.3)540 FORMAT(24H INLET LIOUID ENTHALPY - F8.2.
1 25H INLET EVAP ENTHALPY =F8.2* 22H INLET SUBCOOLING =F8.2)543 FORMAT(16H INLET OUALITY x F6.1)545 FORMAT(12H FLOW AREA .3PE15.2,25H INSIDE SURFACE ARFA =OPE15.4)S50 FORMAT(ISH LENGTH WHFRE QUALITY EOUALS ZFRO =F15.29-
1 42H LENGTH OVER WHICH QUALITY ABOVE ZERO =F15.2)555 FORMAT(24H POWFQ OVFR SAT LENGTH =10E10.3,17H POWER TO BO
I 1PE10.326H POWER FROM SAT TO BO = IPE1O.3)560 FORMAT(20H AVG CRITICAL FLUX =1PE10.39
1 25H CRITICAL FLUX AT BO = 1PE10.3)565 FORMAT(FIO.2)570 FORMAT(F101)575 FORMAT(2F20.2)580 FORMAT (3F10.2)
READ 515,TUBF.RATIOMDIAINSVOLTS.AMPS.ENTHINFLMASSREAD 520.PRESPPRESINPRESOTRESDP.TSDP.BOLOCAREAD 525*XLNGTHeSHUNTMREAD 530*JLOCATQUALIAREAD 580,SCRPTLeZETAPLNGTHPRINT S15eTU8FQATIOM.DIAINSVOLTSAMPS.ENTHIN9FLMASSPRINT 520,PRESPPRESINPRESOTRESDPTSDPBOLOCAPRINT 525,XLNGTHSHUNTMPRINT 5309JLOCAT9QUALIAPRINT 580,SCRPTLZFTA*PLNGTHP=PRESINCALL LIOENDMvFY=FNFPXCALL FVAPFNDMFFGY=ENFGDXENSIN=ENTHIN-nMvFYQUALIN=ENSIN/DMEFGYPOWFRT=VOLTS*AMDS*3*41*SHUNTMAREAFL=(3.1416*OIAINS*DIAINS)/(576.0)AREAIS.(3.1416*XLNGTH*DIAINS)/144.0
225 POWOO= -ENSIN*FLMASS230 ONFOVM -1.0/RATIOM
COSLEN* (15708*PLNGTH) /ACOSFIONEOVMI240 ONFmSO. SORTF( (RATIOM**2 -1.0) / DATIOM**2 I
SINABK=SINF(3.1416*(XLNGTH-SCRPTL-(.500*PLNGTH))/COSLEN)COSABK=COSF(3.1416*(XLNGTH-SCRPTL-(.500*PLNGTH))/COSLEN)EXTRAA=SINABK+ONFMSOFXTRAR=(SCRPTL*COSARK)/ZFTACONSTD.((COSLFN*XTRAA)/3.1416)+(FXTRAR*(1.0 0F-XDF(-ZTA) 1 1EXTRAC.(POWFRT*COSLFN)/(1.1416*CONSTP)EXTRAD=1.0+(((COSLEN*EXTRAA/3.14161-(CONSTP*POWOO/POWERT))/EXTPAO)FXTRAEO(144,0*POWERT)/(CONSTP*DIAINS*3.,1416)IF (POWOO-(FXTRAC*ONEMSQ)) 245.245.255
245 SINZ=ONEMSO-(POWOQ/FXTRAC)ARG.ASINF(SINZ)Z=COSLFN*ARG/1.1416QUALOL=(PLNGTH/?.00)-ZGO TO 270
255 IF (POWOO-(FXTRAC*(ONFMSQ+SINA0K))I 760.2609265260 SINZm -fONEMSO-fPOWOO/FXTRAC))
ARGASTNF(SINZ)Z*COSLEN*ARG/3.1416QUALOL*(PLNGTH/2.00)+ZGO TO 270
265 Us(-SCRPTL/ZETA)*LOGF(EXTRAD)OUALOL=XLNGTM-SCRPTL+U
270 SATL=XLNGTH-OUALOL0SATLsPOWERT-POWOO
002200029b00240002500026000270002800029000100003100032000330003400035000360003700038000190004000041000420004100044000450004600047000480004000050000510005200053000540005500056000570005800059000600006100062000630006400065000660006700068000690007000071000720#073006740007500076000770
007800079000600008100082000R40008400885000860

IF (BOLOCA-(PLNGTH/?.00)) 275,275,280275 POWFDR=FXTRAC*(ONFmS0-SINF(3.1416*((PLNGTH/?.0O)-
IROLOCA)/COSLEN))IF (ROLOCA-OUALOL) 750,750,755
755 IF (BOLOCA-(1.6*OUALOL)) 7609760,765750 P=DRFSIN
GO TO 770760 D0.0SIN- (0.750*TSP*(BOLOCA-OUALOL)/(XLNGTH-OUALOL))
GO TO 770765 PR9FAI="P9SIN-(0.750*TSDPD*(0.60*0UALOL)/(XLNG)H-UALOL))
P=PRRFAV-((PR9FAK-PDFSnT)*(BOLOCA-(1.60*OUALOL))/(XLNGTH-1 (1.60*0UALOL)))
770 CALL LITONOMFFR=FPNFPXCALL FVADPNOMFFGB=FNFGPXENLOB=ENTHIN+POWERB/FLMASSFNSLOB=FNLOB-OMEFBOUALOR=FNSLOB/r)MEFGBCFX9O =FXTRAF*COSF(3.1416*((PLNGTH/2.00)-
1OLOCA)/COSLFN)GO TO 350
280 IF (ROLOCA-(XLNGTH-SCRPTL)) 285,285,790?r PnNWFPF=FXTOAC*(nNcMSO+SIMF(3.1416*
1ROLOCA-(PLNGTH/7.00))/COSLFN) )IF (POLOCA-OUALOL) A50,850,855
A55 IF (BOL0CA-(1.6*0UALOL)) 860,860,865990 p-PRCSIN
GO TO A70A6, D=DRESIN- (0.750*TSOP*(BOLOCA-OUALOL)/(XLNGTH-OUALOL))
r1 TO 970A65 DRPFAK=PPPSIN-(0.750*TSDP*(0.60*QUALOL)/(XLNGTH-QUALOL) I
D=PRPDAK-((PAREAK-PRFSOT)*(ROLOCA-(1.6O*OUALOL))/(XLNGTH-I (1.60*0UALOL)))
A70 CALL LIOcNnMFFR=PNFDX
CALL rVApqN'O4cFGp=ENFOPX=mLOR=NITHIN+POWcRS/FLMASSFNSLOR FNLOR-nMFF8OUALOR=FNSLOP/OMFFGRCFXBO =FXTRAE*COSF(3.1416*(
1POLOCA-(DLNGTH/2.00))/COSLFN)GO TO 350
203 POWFRR=(POWFRT/CONSTP)*((COSLEN*EXTRAA/3.1416l+EXTRAR*(1.00-1FXDF( (-ZETA)*(ROLOCA-(XLNGTH-SCRPTL))/SCRPTL)))IF (ROLOCA-OUALOL) 950,950,955
955 IF (ROLOCA-(1.6*OUALOL)) 960#960,965q50 P=PorSIN
Gm TO 07n06 D=0DDSIN- (C.750*TSDP*(BOLOCA-OUALOL)/(XLNGTH-QUALOL))
0" TO 97nnAN DFAr=DPSim-(0.750*TSDD*(0.60*OUALnL)/(XLNGTH-OUALOL))
=DPRDFAK-((DRP9AK-PDFSOT)*(90LOCA-(1.60*OUALOL))/(XLNGTH-
I (1.60*0UALOL)))970 CALL LIOFN
nMrFR=FNFPX
CALL FVAPrNDMFFOR=ENFOPXENLOBvFNTHIN+POWFRB/FLMASSrNSLOR=FNLO8-0MFFROUALOR=FNSLOR/flMFFCCFXRO =FXTPAf*COSABK* FXPF( (-ZETA)*(
1 ROLOCA-(XLNGTH-SCRDTLI)/SCRDTL)350 PSLROL =POWFRR -POWOO
0087000880008900090000910009200093000940009500096000970009800099001000010100102001030010400105001060010700108001090011000111001120011300114001150011600117001180011900120001210012200123001240012500126001270012800129001300013100132001330013400135001360013700138001390014000141001420014300144001450014600147001480014900150001510
353 CFXAVG a POWERT / AQFAISDRINT 540,DMEFYDMEFGYENSTNPRINT 543, QUALINPRINT 545, AREAFL ,AREAISPRINT 550 ,OUALOLP SATLDRINT 555 ,PSATL, POWFRB9 DSLBOLPRINT 560,CFXAVG.CFXBOPRINT 775#PtDMEF8,DMEFGBPRINT 780#FNLORFNSLOBPRINT 785,OUALOR
775 FORMAT(17H PRESSURE AT BO =F6.1#25H SAT LWO ENTH AT 80 of1 22H EVAP ENTH AT BO =F8.2)
780 FORMAT(13H ENTH AT BO =F8.29 27H SU8COOLED ENTH-AT 80 =F8785 FORMAT(16H QUALITY AT BO =F6.3)
CALL GRDMOMCALL PKIANNDO 460 L=1,JLOCAT92
360 Y=L-1IF (Y - QUALOL) 370, 370, 365
365 IF (Y -(1.6*OUALOL) ) 375, 375, 380370 P = PRFSIN
GO TO 390375 P=DRESIN-(0.750*TSDP*(Y-QUALOL)/(XLNGTH-OUA0LL )I
GO TO 390380 PBREAK=PRESIN-(0.750*TSDP*(0.60QUALOL/tXLNGTH-QUALOLI385 D=PRREAK-((PBRFAK-PRESOT)*(Y-(160*QUALOL))/
1 (XLNGTH-(I1.60*0UALOL)))390 CALL LIMEN
DMFFY=FNFPXCALL EVAPENDMEFGY=ENFGPXPRINT 5659YPRINT 570, PPRINT 5759DMEFYDMEFGYIF (Y-(PLNGTH/2.0)) 400,400,410
400 POWERY=EXTRAC*(ONEMSO-SINF(3.1416*((PLNGTH/2.001-lY )/COSLFN) )CFXLOY=EXTRAF*COSF(3.1416*((PLNGTH/2*00)-
lY )/COSLEN)GO TO 435
410 IF (Y-(XLNGTH-SCRPTL)) 415,415#425415 POWERY=EXTRAC*(ONEMSO+SINF(3.1416*
lY -(PLNGTH/2.00))/COSLEN) CFXLOY=EXTRAE*COSF(3.1416*(
1Y -(PLNGTH/7.00))/COSLcN)GO TO 435
425 POWERY=(POWERT/CONSTP)*((COSLEN*EXTRAA/3.1416)+EXTRAI*(1.001EXPF( (-ZETA)*(Y -(XLNGTH-SCRPTL))/SCRPTL)tlCFXLOY=EXTRAE*COSABK* FXPF( (-ZETA)*(
lY -(XLNGTH-SCRPTL))/SCRPTLV435 ENLOY=ENTHIN+(POWERY/FLMASS)
440 ENSLOY=ENLOY-DMEFY450 OUALOX=ENSLOY/DMEFGY455 CONTINUF
PRINT 700,POWERTsPOWERY*CFXLOYPRINT 710#FNLOYPRINT 720,FNSLOYOUALOX
700 FORMAT(14H POWFR TOTAL = E9.4/%1 28H POWER INPUT TO POSITION X E9.4/92 18H LOCAL HEAT FLUX = E11.5 .
710 FORMAT31H LOCAL ENTHALPY AT POIT10N7X F8.al720 FORMAT(41H LOCAL SUBCOOLED EMTMALPY AT POSITION X F8#2/1
130H LOCAL OUALTTY AT POSITION X a F6.3)CALL FILMFR
460 CONTINUE
8*2
.2)
0152001550015400155001560015700158001590IM166001410
* 016200163001640016500166001670016800169001700017100172001730017400175001760017700178001790018000181001820818300184001850018600187001880018900190001910019200193001944n01950019600107001980619900200002i11020200203002040020"00'Z6600207002060
021100212002130021400215002160

SfrT URN
SUS*OUTINF PKOUT
COMMON NTUBFSMSHAPFTUBERAT IOMOIAINSVOLTS.AMPSENTHIN.FLMASS#1 DGFS0P~STN,00FS0T ,PFSDTSDOLOCAXLNGTHSHUNTM,0,
2 O)MFFX ,FNFPXOMPFGX FNFGPX ,'NS INOUALIN ,POWFRTAPFAFLAOEA!S,I OUALml-.SATLDSATl - OoWFPFOSLSOLCFXAV0,gCFXLO)XJLOCATK ,X,4V00AX*DnWc13XFNjI OXrNSIXOUALOXO)MFFYOMFFCYPOWfOONFOVM#
1; Ce)SLF~~ ,0NMS0,STGNZAP0,9Z FACMIPFACPLSCFX5OL .Y.6 FArTMIPOWFPYOFXLOYgrNLOYFNSLOYOUALOYFACTPL,
7r0nhSTP,5(PDTL,?F'A,0)LN0,TH,JUULOCATC0SA53KSINA5K, Is5 FXTqAA ,FXTQAP, FXTPACFXTPAOPFXTPAFFXTRAF*
00MFFB,M--GPENL08,FNSL0SOUALOBEXTRAGEXTRAHFXTRA1,FXTRAJ
COMMON )UALIA*CLlItTKTNCH9I100,OXCOL)A1COLM2COLM3,COLM4,SUMCOLPHIMNGTOTSCGSUBZSUMOSUM1,
3V0L50,oU)'ALo4,POW1FOAPANSOnLOFNFOO)FNFGO,9FNSOOUALOOVSPLoOvspGO,4C,TT,0~vMlM,00olMTVLSPLVLSP0,TFPM1,TERM42,TF*M1,TF*M4%,GAS,0T,4OfVTSrL,0P YIUMFACTPFFACTVFLOC,0RrFSO)P0MLTg,GQOFT,00CRrOMTGRDT0T,AS,OPAVACOPAVC5S RAVCHVALUFNFACTUNBMAOAOSNAOAAFILMTK ,YPLUSq
7TAUJ'ALFYOLUS,0FILmo,OL0FNT,0CLIQPCLFNToUMmYA,0UMMY9,flUMMYC9Ni FORMAT IFl-r)o.,F1C.2*F10.4,4F10.I)
57 FeOmPAT (SF1100 IFlo2)
q2 POAT (F07
R4- FO)OMAT(24H INLFT LTOUTI) ENTHALPY = F8.29
1 25H TINLFT FVAP FNTHALPY =F8.29 22H INLI*T SUSCOOLING =F8.2)
r4l FOPIAAT(16H INLFT OUALITY = F6@3)54c FOOMAT(12H FLOW AREA =3PE15*2925H INSIDE SURFACE AREA =OPE15*4)
;q" FO*)PA(4I- LFN0-TH 14HEFV OUALITY EOUALS ZFRO -F15.29
I 47H LFNGTH OVER WHICH OUALITY ABOVE ZERO wF15.2)
%555r FnPMAT(24H POWER OVE SAT LFNGTH =1PE1O.3917H POWER To B0
I IDF10.1926H POWFR FROM SAT To B0 - 1DE1O.3)rF4 rr)OMT(7'H AVrO rtIT~rAL FLUX =1PFIO.19
1 29;H CRITICAL FLUJX AT PO = 1PF10.3)
r57', FrOM5AT(F1'.1)
5 7- FOPMAT?77.2)c; A FOOQMAT tl5F1*7)
OcAO 51 5,TUPFQATIOMDTAINSVO)LTSAMPSENTHINFLMASS
PFAD A70 ,PPFSP,DOFSIN ,DRESoT ,RFSDP ,TSDPSOLOCA
OcAO) c; li XLNr.THSHUMT'APPA0 5109JLOCAT90UALIAOFAM 550 ,rcOPT) ,ZFTA ,PLNrTH
D151T ' ,TURFPATIOMOfIAIMS ,VOLTSAMDSFNTHINFLMASS
POINT 57'),OOFSOOOFSITN,PRFSOT ,OESO)DTSOOR4oLnCAPPOINT 575,XLNrTH.SHUNT~vPLFTNT r,'')9,)) OCATOUALIAPINT RP',SCDPTLoZFTA*PLNrTH
0=00FSI NrALL LIOCN
r)McFY=cNFDXCALL FVAPFNO)MFF0Y= ONFOOXFN' IN.PNTHTN-nMPFY
OO)WOT-VnLTS*AMDS*1.41*SHUNTMAI7AFL=(i.141A *OIAINS*OITAINS)/(576.0)AOCATS=Ii.141Af*XLNGTH*OIAINS)/144.0
021700218n
0001000020000300004000050000600007000080000n00010000110001200013000140D01500160001700018000190002100022000230002400025000260002700028000290008000081000320008800034000850008600037000380)
0039000400004100042000430004400045n004600047000480004900,05000051000520005300054000550005000,570005500
225 POWOQ= -FNSIN*fLMASS230 ONFnVM =1.n/0*TInM
COSLEN- (1.S708*PLNGTH) /ACOSFIONEOVM)240 ONEN'SO= S)IRTF( (RATIOM**2 -160) / RATIOM**2
STNARI(=STNF(3.1416*(XLN0TH-SCQPTL-(.500*DLNGTH))/COSLFN)COSA5I(,COSF(3*146*(XLNGTHSCRPTL(.5000LNGT') )/COSLEN)FXTRAA=SINA8K+ONrmsOEXTPAB=( SCoOTL*CnSAqK )/ZETA0MNSTn=(CSF..XTAA)/.146)(XTQAtl.00FXF(-ZFTA)FXT0Ar=(144.O*PWFT)/(CNSTP*1ATMS*3.1416)JLn' AT= 1 .00-FXPF (-7 OT A)FXTrAF= IP0WFRT*COS ARK*SCRPTL 1 / ( CONSTP*ZpTA)IF (POWOo-(FXTPAF*UL0CAT)) 2459245#255
24r) U=SCRPTL+(S(-PoTL/ZFTA)*LnoF((OMW0O/PXTRAF),FXPF(-ZFTA)IOUALOL=Unn TM 770
?r5z IF (PnWO0-((POWFOT/C0NSTD)#((FXTARULCAT)tCSLFNISTJAPK/11.1416)))) 760,760,765
?60 STNZ= STMARK +((1.1416/CO(SLFN)IFXTQA4IJL(0CAT) - (COS4ST0*O5OWm"/100WPRT)))APr0-ASINF( SINZ)Z=COSLFN*ARrO/3.1416
OUAL0L=XLNr0TH-( PLNCTH/2.OO )-Z00M TO 270
265 SINZ=-SINABK -(3.1416/COSLEN)*((EXTRA8*ULOCATI (CONSTP*POWOO/10O)WFDT)) )A*C,=ASINF( SINZ)Z=COSLFN*APO,/3,1416(OUALoL=XLNOTH-( DLNGTH/2.OO).Z
770 SATL=XLNrTH-OUALOLP SATL=POWFPT-POWOOTV (RnLOCA-SC00TL) 7'75,275,250
275 DOWFPR=FXTRAF*(EXPF(ZFTA*l1(nLOCA-SCRPTL ,/SCR0TL)-EXPF(-ZETA))
IF (ROLOCA-MUALOL) 150,750,75575r) TV (RnLOrA-(1.6*O)UALOL)) 76097609765750 P=ORFSIN
G0 TO 770760 P=PRESIN- (O.750*TSOP*(BOLOCA-OUALOL)/(XLNGTH-QUALOL))
G0 TO 770
76r5 PFAK=PFSN(.750*TSP*(.6*UALL)/(XLNGTH-0UALL))P=PBREAK-( (PBREAK-POESOT)*(BOL0CA-(1.60*UALOI ))/(XLNGTH-
I (1.60*nUALOLf)770 CALL LIOFN
O)MFF5F-NFOXCALL FVAPFNrWVF0R.FMFr0XmNt 0P*FNTHINDOWFRP/FLMASSFNSLm=NLm5-rlMFOUALO5=FNSLOR/0)MrFr05rFXS0=FrXTRAF*COSABK ( FXPF( ZFTA*(IR0L0CA-S(RDTL)/srRPTU))00O TO 150
280) IF (ROLOfA-(XLNrTH-(0LNOTH/2.O00f) 28592AS*?QO0755; PnWPQA= (PoWEOT/COMST0)*((FXTRA5*ULnrAT) + (ICOSLFm/1.14I6)*(
ISTNAR-SNF((1141/COSLFN)*(XLNTH-(LNTH/200)-OLOCAI IIF (BMLOCA-OUALOL) 550,850,855
555 IF (AOLOCA-(1.6*OUALOL)) 86II.5605A5
850 DwORFSTNGOn TO 870
860 P=PRESIN- (O.750O*TSOP*(BOL0CA-QUALOL)/(XLNGTH-OUALOLIGO TO 570
965 PRPFAK=PRFSIN-(O.75O#TS0P*(0.6O*0UALOL)/(XLNGTH-OUALL-))P=P5RFAK-( (P5RFAK-DQESOT)*(50LOCA-~(1.60*0)UAL0L))1 / (XLmrTH- (1 .f0*0UAL0Lf)
00506060010061000620006s00064000650006600067000680006*0007000071000720007lt000)74000750o00760)0077000)750007a000800)0081000570)00830001t4000550008600087000550
0ng*1000*20
00* '500040m00050mLi0060
00070AonoQo0000001000
0101001070l0I 050'
01040m10500 106001070
01110011400115M001140i01150)(nI 140f01170
011f001200 1210

870 CALL LTOPN~mFFfNF0X
CALL FVAPFNnm9FF,Q= N~0X
FmLOA=F5mTH m4.0W=0R/FLk4ASSJNSLnRLRQ MF
nUALnR =FMS L0r /My rFrQCFXBO =FXTQAF-*C0(SF( I1.1416/COSLEN)*(XLNGTH-(PLNCTH/2.00)-P0LOCA))r0 TO IS-
PO PoWFPP= (DO)WFDT/CO. IST0))*((EXTDA8*UL(OCAT) + ((COSLEN/3*1416)*(1SINIAR+SNF((1.141/COSLN)*(OLoCA-(XLNTH-(LNTH/2.00) I117 1)IF (q0LnrA-0?J8Ln!) nccn;,-C
O-S Tv (RnLO(A-(1.6*0)U&LnL)) 960,960,965
rOO TO) 07n
'161 D=DDPSTN- ('.70#TSO*PrOLOCA-OUALOL)/(XLNGTH-QUALOL))rCO TO 07n
0-1,r DQOrAIK=P7FSIN-(0.7O*TSDP*(0.60*OUAIOL)/(XLNGN-OUALL)P=P*QFrA-( (PP0E4K-POFSoT)*(ROL0OCA-(l.60*0UAL0L1 )/(XLNGTH-1(1,60*OUALMLI))
I07' CALL LIO'fI
rALL FVAPFNl JkFrnP=MNFnDX
PKLnRPNTHIlI+0OWFQR/FLMASS
CFXRA' =FXTOAF*CeOSF( (1.1416/COSLEN)*(BOLOCA-(XLNGTH-(PLNGTH/2.00)
19' "~PL=0OJWl 0A -DOW0O),,i FXAVr = OnL'FRT / A~rAIS
D01yNT c54l,0mFFY,0MFFrYFNSTN
0'!TNT 545, APFAFL 9AREAISD" T"T 99') 91JAL0ILt SATL555N' ,Ori*SATL, PO)WFPBV PSLROL
DODNT ss', ,CrXAVr0,crXROPRINIT 770,0,0MEFFB,0lEFGBOTNT 7RlFNL(7JFNSLO9
P"ITNT 7R59,OUALOR775 FoDMAT(17H PROSSUOF AT 80 =F6.1925H SAT LIO ENTH AT 80 =F8.29
I 22H PVAP FNTH AT 90 =F8.2)751) r"DMAT(IH FMITH AT Rm =F8.29 27H SUBCOOLED ENTH AT 80 =F8.21705 PfOMAT(16H QUALITY AT 80 =F6.3)
rALL r.n'"rALL PKOANN
n46' L=lJLnCAT,2=A.P Y=L-1
TIV - NjA(t) 17n, 170, 169
l~0 = o'm
nn TO 10'
0=D0CSTI-(0.-I0OTS0D*(Y-OUALL)/(XL(,TH-0UAL0iI I,100n TO 10'
103' OriAICD7 FSTMI-(0.750*TSDP*IO.60*OUALOL)/(XLNGTH-0UALO)L)
(XLN0TH--( 1 An*OUALnL) ))07CALL LOFN
O)MrFV=FMPFP XrALL rVAPFNIrNAFFYcNc'00Xn*1ST g~qV
0011'IT r571, nPP9AT r17R5r)%FFY,r)MPFnY
01240012 500126001270)01280012*0011000111011370011300114001 150
0)11600137001380!0134170140001410014200141001440014500146001470014800144001500n011510)015200 15 .0t015400155001560011570015800 15rQ001A000 16 100162001610
4116400165001660)01670016800161*0017000171001720
0711710)C11740017500176001770
03178001790018000181001820018300184001850018600187001880
IF (Y-SCRPTLlJ 4009400,41n400 POWFPY=FXTQAF*(FXPF(ZETA*(
IV -SCRPTLI/SCRPTL)-EXPF(-ZFTA))CFXL0Y=FXTRAF*CO)SAK*( FXPF( ZFTA*(iy -SCROTLI/SCPPTL))r0 TO 415
410 TF (Y-(XLNrTH-(DI-NCTH/2.00))) 415941q,475415; POWERY= (POWERT/C0NSTrP)*U(EXT3#A8*ULOCATI + t(C0 SLEN/1.14161*11
1SINIRK-SINF((1141/COSLEN)*(XLNGTH-PL86THf2.00)-Y I) )CFXLIIY=FXT A F*C0MSF(( 1.1416/CSL#)*(XLNCTHPott4TH/20)$Yr00 To &Is
425 DOOWFPY= (P0WFPT/C0NSTP)*U4EXTRAS*ULOCAT) -4. *C0SLEN/lbl4l6)*t1SNA~l(+SIN4FU1.I416/r0SLFN,*(Y -(XLN(,TI4-tONO;TRf/2001 ) ) 1)7 1)rFXLOY=FXTOAF*COSF( (1.1416/COSLER)*(V1 11)
-fLPDTH-jPtNf'TH/2&00 )1
415 FNLOY=FNTHIN+(POWERV/FLMASS)440 9 SLnV-PNLnY-nM~rFY
450 OUALnX=FNSLOV/nMFFSV455 CONTINUE
IIPINT 700#DOWFRTDOWPPVCFXLOVPRINT 710,FNLOYPOINT 770*FNSLOYOUALOX
700 FORMAT(14H POWFR TOTAL = F9.4/91 28H DOWER INPUT TO POSITION X = E9.4/t2 185 LOCAL HEAT FLUX = E11*51
710 FOPMAT(II LOCAL ENTH-ALPY AT POSITIONTX = FBl.:)720 FORMAT(41H LOCAL SURCOOLED F5THALPV AT POSTTIiJS X =F8,2/*
110H LOCAL OUALITY AT POSITION X = F6.3YCALL FTLMFr
460 CONTINUEP FT UqNFNO
5UISPOUTINF SPKCOSCOMMON NTUPFSMSHAPE ,TUBERATX0MDJAIMS*V0L-TS.AMPS.ENTHINPFLMASS91 DQFSDPQESNDRESOTRFSPTSIPB1.JCAXAJAGTSSHUNTMD,2 DMEFXENFPXDMFFGXENFGPXENSN0UAL($=I)OWERT.AREA'LtAREAIS9I nUAL(OLSATL,0SATLPrOWFIR8,SL00LCrXAVC,.CFXL0 XJL0CATt ,X,4PAQ FA k 9PWFX rLnX 9FN 5LOX,0 U ALOX 0M0AYv )FPAY *0w00t) 6(Ovm t5 COSLFNONEMSOSIGNZARGZFACMfNFACDLOCPX50.#Lvy6 FACTM? ,POWFOVCFXLOYFNLOY.NMSLnYOUALOYFACTPL,7CONSTP ,SCRPTL ,ZFTAPLNCTHJUUIL0CATC0SAIKSINA89l*8 FXTRAAFXTPASFXTOACFXTRADEXTRAFFXTRAf,OMFF,0MFC,RFNLORFSLC,0UAL8,EXTQAGF"TRAHirXTRAI-oXTRAJCOMMON 0UALIAGLIOTKINCH,10PDXCOLM1 ,COLM2.COLM3COLM4SUMCOLPIIM,,TTSCC,SJAZ , UMOSUM1.2SUM2,SUM3,SUM4,SUM5 ,OMFGAP.QMFC,APOMJLT.PSIJLTVYSCLAVOLS
0L .FNO*
3VOLSOG 9 UAL04 #POWER A*PANSOL v ENFOF00MFG0.ENSO #0UAL0,0VSOpL(0,VSPG0 t4GnoOMo~)TnLPOV53C#FtITFt2TO3T.R4GAoT5OVISCLQFVSUMFFACTPFFACTVFOCo@OFSof,b TODFTOC,OO~mTTOT,~6BOPAVAC,0*AVCS ,GRAVCHVALUEN~fACTUN.BMAAflSMAOAAoFILMTKYPLUS,7TAUWALFYPLUSCFILMCLOENT ,PCLIOCIYNT ,0tPMYA,0UMMV5,0UmSVCCOMMON NMTHCONO,'CHFN.SCHFNVISCGCPL1OtSUOFTL,
I X TToSA TP *SMALLT , DEL TVP 9TWA.LLtHCHEftsHMACv.1~C REY4t.00t4VLUXo2 DRNUMB,8ERGHT ,HDBHDENG.0AOEN0,0T0EN0,f)ELTTs0AC5EN,-3 DTCIFNPAOMAXOFLTFNRADIUSCC,00PFF
515 FORMAT (F1O.OF1O*?,F~o.4,4F10*1)520 FORMAT (SF10.0, 1FIO.2?)
525 FORMAT (2F10.21
0189013190001910
010
01480
02000
02020
021140020500211160
02090O
0121 MIN02110
021400215m02 16002170M71AM
OII
012000
0004000n~vo0001,6000070(1071110000*00010000110001I2?001100)014000150m001600017n00180)0101 o000P0000210)0022000231100 24000253000260

sin rnQMAT(I5,F1'.I)sI5 FOMAT(Tq)540 FO)QVAT(74H Tmt-T LTOUTD FMTHALPY = .7
I 25H INLET FVAP PNTHALPY =F8.2. 22H INLcT SUBCOOLING =F8.2)941 PORMAT(16H INLET OUALITY = F6.3)545 FoRMAT(12H FLOW AREA =3PE15o2%25H INSIDE SURFACE ARVA =OPE15o4)S5I FOQMAT(1ISH LmNGTH WHFPF OUALITY FOUALS ZFRO =F15.2,
1 42H LENGTH OVER WHICH OUALITY APOVF ZERO =F15o2)955 POPMAT(24H4 POWrP oVc SAT LEN-TH =IPESO.1.17H POWER TO 80=
1 1Pr10.3,26H POWCP FROM SAT TO S0 = 1PE10.3)560 FOPMAT(72H AVCO COITTCAL FLUX =IPFIO.1,
1 P5H CRITTCAL FLUX AT 80 = 1PFIo.3)A s FnRAAT (F1 n. 7)r57 FORM~AT(F1X)or7r rnQmAT(?r7no7)530 r r~r('MAT )FO7
READ 51 5,TUSFQATIOMDIAINSVOLTSAMPSENTHINFL4ASSPFAD 570,OOFSPPQFSINORFSOTRFSDPTSPFOLOCAQPAO) A595XLNGTHSWUNTMPPAD 510,JLOCATOUALTAPFAD SA0,SCc,0TLqZETA,PLNGrH
00I1IT SI' ,TURFOAT!OUO)IAINSVOLTSAMOSENTHINFLMASSDINT 57n ,oF,'r~DFSIPrrSTEES00,TSDP,8OL0CADQIMT A ,S ,X L NrT L,9SHU mT m0 0 ?,'T r')1 LnCATOtJALIA00IT'T c5. SrtPTL,ZPTA,DLNrTHPOIT s535,J
CALL 110M~
S N'(FM =TH I 5-fOMFFYrN1)AL I =9K1IN/0mkPrOy
AOFATIS(2*1416*XLNO'TH*OIATNS)/144.Os, oD'Wroo -1rJIyN*FL"ASS
CoS;LFKI= (1.r708*PLNGTH) /AC0SC(ONFOVM)14 NT'cm5n= SOPTF(I RATIOM**2 -1.0) / RATIOM**2
rt,'0 4(XLMOrTH-DLNCTW)/OATTOM)+17.O*C0SLFNOONFM4SO/1 .14i6)FXTRAA=POW"'FPT/(OATIOM*C0NSTP I*XTQAR=o0WroT*C1SLPN/(CONSTP*3. 1416)IL0CAT=XLmr-TH-SCPPTL+( OLNOTH/2.0)IXTOAV.(144.(*OWFT)/(CONST0*nTATNS*% 14161TP*)M-PTA*XMT-CDL) 24592459255
'49 Z=ULnrAT-(Pf0Wf0o/rXT*AA)f'UALnL =ULOCAT-Znn Tm 77n
7)C5 1F(POW''O-( CFXTQAA*(XLN0TH-SC90TL))+(FXTRAB*ONFmSO)I ))) 76O,76M.765,
;6- SINZ.-C (D0WtO(rXTRAA*(XLNGTH-SCRPTL)))/FXTRA8)+NF4S0ARrOASINF( SINZ)Z=r()5LFN*A0G/!.14I6n1-JAL01L =ULOCA T-Zr00 TO 270
7(69 TF(0O)WO0-( (CXTQAA*(XLNCTH-SCOOTL) )+(FXT9A83*f)'IMSO1 *2.01)) 266,7A66,768
7AA STMZ=.((0mW00-(XTnAA*(XLN0TH-SCQPTL)))/FXT9AR)-ONFMS0
C1AL^L=ULmrAT+7
0027000780m002o000300003100032000310003400035000360003700038000190004000041 00042000430004400045n00460004700048000490005000051000520005310M054000550005600570)005800059000600006100062000614000640006500066000670006800069000700007100072000730007400075000760f00770007800079000800)00810008200083000840008500086000870080
00840m009000)0If
G0 TO 27026A Z=ULOCAT+( (POWOO-( FXTRAB*2.0*0SIEMSO) )/FXTRAA)
OUALOL'.ULOCAT+Z27C SATL=XLNGTH-OUALnL
0 SATL=PO WFPT-00 WOOIF (ROLOCA -(XLNnTH-SCPOTLfl 2759275.280
275 DOWFRR-FXTRAA*OJ)CAIF IROLOCA-OUALnL) 750,750,75
7s5 IF (ROLOCA-(1.6*OUALOL)) 760#760.765
60 TO 77076n PwDQFSTN- IO.78O*TSfP*IR0LOCA-OUAL0L)/(XLNGTH-0UAL0L)I
00 TO 770765 PRPFAK.PO9STN-(0.75O*TSDP*(0.6O*0UALOLI/(XLIGTW-QUALOL,)
P=PRRFAK-( (PFRFAK-PRFSOT)*(ROLOICA-(1.6O*QUALOI )/(XLt4(TW-1 (1.6O*OUALOLf))
770 CALL LIOFNnMFP(mENFPXCALL FVAP~mr1MPFGPFNFnPXENLOB-FNTHI N+POWERS/FLmASSFNSLOS=ENL-OmFF8OUALOR=ENSLOB/DMEFGSrFXBO-FX TRAF/ ATT IOMG0 TO 350
280 IF (BOLOCA-ULOCAT) 285928%t290285 P0WFRR= (FXTRAA*(XLMGTH-SCRVTL))+
1 IExTQA8*(ONFMSO-STNF(1.1416*(ULOCAT-SOLOCA)/COSLFN))IF (SOLOCA-OUALOL) 850,850,855
855 IF (ROLOCA-(l.6*0UALOL)) 860,860,865850 pa=prSIN
00 TO 870860 P=DRESIN- (O.750*TSDP*(8OLOCA-OUALOL)/(XLN0TH-OUALO)L))
00 TO R70865 PREA=PRSN(0.75*TSDP*(06OUALOL)/(XLNGTH-0UALL))
1 /(XLNGTH-( 1 60*OUALnL )870 CALL LIOEN
IMrFR-FNFPXCALL FVAPFN
FNLO8.ENTH IN+POWPRB/FLmASSFNSLOR=FNL09-DmFF8OUALOR-ENSLOR(/nMFFGSCFXBO =FXTPA*COSF(1.1416*tULOCAT-8OL0CA)/CO)SLEN)G0 TO 150
2q0 IF(8OL0CA-(ULOCAT+(PLNGTWI2.0))) 2q5,285,100295 POWERR- (FXTRAA*(XLNCTH-SCROTL) 1+
1(EXTRAR*(0NFMSOSTNF(3.1416*(ROLC-UL.CAT)/C0SLF) ))IF (ROLOCA-OUALOL) 95099500955
955 IF (9OL0CA-I1.6*O)UALOL)) 960,960,9q6t950 P-PRESIN
00 TO 970Q60 PuPRPSTN- (0.78O1*TS0Do*(BOLOCA-OUALL)/(XL40T44--OUAL(X )
00O TO 07nl965 PPQEAK=PRESIN-(0.750*TSOP*(0.A0*QUAL0L)/(XL40i7M-OUALOL))
PuP8REAK-( (P9REAK-PQFSOT)*(8O)LOCA-(l.A0*UAL5t))/(XLNGTH-I I1.6n*QUALOL)))
(70 CALL LI09NDM1EF*ENFPXCALL FVAPEND14FFv68.FRM0XFNLO8.ENTH INPOWFRB/FLMASSENSL08sENL08-OMF80UAL0BxENSLO8 /OMEFG8
00020009300094000950009406(009700040o"o01000
M1020010350010400105001-0600101001080010,00O1lt001110011200i11AS0114001150)01160)0117n0118001190
01200
01260
01780
01300
01 170013301114M01350)01160
01390
01400014100142001410014400145001460)0147001440t)14*0
01,510
015400155001560

CFXPO =FXTPAF*CSF(1.1416*(ROLOCA-ULOCAT)/COSLEN) 015700O TO 150 01580
100 POWEPq=FXTOAA*(RoLCA-DLNTH)+(FXTRAR*2.0*ONPMSO) 01590IF (ROCA-OUALL) 305,305,110 01600
110 Tr (POLOCA-(1.6*OUALOL)) 3151IS93?0 01610105 D=DRFSIN 01620
GO TO 125 01630l1r P=PDFSIN- (0.750*TSrD*(BCLOCA-0UALOL)/(XLNGTH-OUALOL)) 01640
GO TO 325 01650120 PRDWAK=PPFSIN-(0.7rn*TSOP*(0.60*OUALOL)/(XLNGTH-QUALOL)) 01660
P=rBPFAK-((DBPFAK-PQFSOT)*(BOLOCA-(1.60*OUALOL))/(XLNGTH- 01670I (1.60*0UALOL))) 01680
32c 'ALL LIOFN 01690rUFMrP=rMFDX 01700CALL CVAPFI 01710nMPFGR=vNFr.DX 01720PNLfR=FNTHIN+POWPDR/FLMASS 01730FNSLnR=cNLnR-MFrP 01740AUALOR=pMSLOR/DMPFGR 01750CFXRO=PXTRAF/RATIOM 01760
350 PSLROL =POWFPR -DOWoo 01770153 CFXAVG = POWFPT / AQFAIS' 01780
DRINT A40,OMFFYnM FrY,FNSIN 01790PRINT 541, OUALIN 01800PRINT 545o AOFAFL ,ARFAIS 01810PRINT 550 ,0UALOL, SATL 01820PRINT 555 ,DSATL, DOWERB, DSLBOL 01830PRINT 56 ' rFXAVrCFXBO 01840PRINT 775,PoDMFFPDMFFGB 01850OPINT 7P7,FNLOR#FNSLOB 01860DDINT 7ArtOUALOR 01870
77c FOPMAT(17H DDFSSURF AT B0 :F6.1,25H SAT LIO ENTH AT RO =F8.2* 018801 22H FVAP FNTH AT BO =F8.2) 01890
7A5 F0reAT(13H FNTH AT gO =F8.29 27H SUBCOOLED FNTH AT BO -F8.2) 0190075 FOQMAT(16H nUALITY AT RO =F6.3) 01910
rALL nOOMOM 01920CALL cDP<ANN 01910
n' 460 L=1,JLOCAT,3 01940,6, Y=L-1 01950
163 IF(Y-(XLNGTH-SCRPDTL)) 362,359,359 01960IF(N) IA4,A49161 01965
-A IF(Y-(XLNGTH-SCPTL+DLNIGTH)) 460,4609167 01970364 CALL CSPTKP 01980
00 TO 461 01985367 IF (Y-OLALOL) 170,170,165 01990
SAr Ir (Y -(1.6*OUALOL) ) 375, 175, 380 020001?1 o = Po=SIN 02010
( TO 301 02020275 P=PDFSIN-(0.790*TSOD*(Y-UALOL)/(XLNGTH-UALOL) 02030
00 TO 10n 02040n'0 ORQDAY=PFSIN-(O.75O*TSDP*(0.6*0UALOL)/(XLNGTH-OUALOL) ) 02050
15N D=DSOAK-((P5DEAK-PDFSOT)*(Y-(1.60*OUALOL))/ 020601 (XLNrTH-(1.60*OUALOL))) 02070
l40 0ALL LIOCN 02080
nMFFY=FNFPX 02090rALL PVAPrN 02100nMFFGY=FhNF DX 02110DOINT r6rY 02120OPTNT r70, 0 02130091D1,T 5759r'MFFY9OMFFGY 02140IF (Y -(XLNGTH-SCRPTL))400,400,410 02150
400 PnWcDY=FXTDAA*Y 02160CFXLnYFXTPAF/RAT1OM 02170GO TO 41A 02180
419 IF (Y -ULOCAT) 41rqA1q,4l 02190
415 POWFRY= (FXTRAA*(XLNGTH-SCRPTL))+I (FXTQAR*(ONFMSO-SINF(3.1416*(ULOCAT-Y )/COSLEN)UICFXLOY=FXTRAF*COSF(1,1416*(ULOCAT-Y)/COSLFN)GO TO 435
425 IF(Y -(ULOCAT+(DLNGTH/2.0)))430,4309433430 POWERY= (EXTRAA*(XLNGTH-SCRPTL))+
1 (FXTDAB*(ONFMSO+SINF(3.1416*(Y -ULOCAT)/CO$LFN)))CFXLOY=EXTRAE*COSF(1.1416*(Y -ULOCAT)/COSLEN)G0 TO 415
413 POWFRY=FXTRAA*(Y -PLNGTH)+(EXTRAA*2.0*0NEMSO)CFXLOY=FXTPAF/RATTOM
435 FNLOY=FNTHIN+(POWERY/FLMASS)440 ENSLOY=ENLOY-DMEFY
450 OUALOX=ENSLOY/DMFFGY455 CONTINUE
PRINT 7009POWFRT#POWFRYVCFXLOYPRINT 710,FNLOYPRINT 720eFNSLOYOUALOX
700 FODMAT(14H P0WFR TOTAL = EQ.4/vI ?PH POWER INPUT TO POSITION X EQ.4/92 18H LOCAL HEAT FLUX = E11.5)
710 FORMAT(31H LOCAL ENTHALPY AT POSITION7X F8.2)720 FORMAT(41H LOCAL SUBCOOLED ENTHALPY AT POSITION X FR.2/9
130H LOCAL QUALITY AT POSITION X = F6.3)
CALL FILMFR460 CONTINUE
N=0RFTURNFND
SUSROUTINF CSPIKECOMMON NTUBESMSHAPETUBERATIOMoDIAINSVOLTSAMPSENTNINFLMASS*
1 PQFSPPRFSTNPRFSOTRFSDPTSDPBOLOCAXLNGTSHUNTM5 P,2 DMFFXENFPXDMEFGXNFGPXENSINQUALINPOWFAPEAVLA'FAISvI OUALOLSATLPSATLPOWFRRSPSLBOLCFXAVGCFXLOA.JLOCATKeXe4PBRFAK,POWFQXFNLOXFNSLOXOUALOXOMFFY+fMEFYPOWO0.0N0VM5 COSLENONFMSOSIGNZARGZFACMIBFACPLB.CFXBOLY
6 FACTMIPOWFY,CFXLOYFNLOYFNSLOYoUALOYFACTPL7CONSTPSCRPTLZETA PLNGTHJUULOCATCOSA8K,SNABKelE8 EXTQAAEXTRARFXTPACFXTRADEXTRAFFXTRAF,R0MFFBDMEFG0SNLOBeFNSLOBeOUALOBSEXTRAGFXTQAHEXTRAIFXTRAJCOMMON QUALIAtGLIQTKINCH*
1DPDXCOLM1COLM2COLM3COLM4SUMCOLtPHIMNGTOTSCGSUBZSUMOSUM12SUM2,SUMISUM4,SUM5,OMEGADOMEGAPGUL.TPSURLTfVISCLVOLSPL.ENO,IVOLSPG,OUALO4,POWERAPANBOLDFNFODFNFGOFNSOOUALODVSPLODVSPGO4GTOTDPMOMGRDMTDVLSPLeVLSPGTE9MlTERM2,TERM3,TEQM4eGGASDT,50VISCLeREYNUMFFACTDFFACTVFLOCGROFSOPGMLT.GPDFTtDGRDMTGRDTOT,6BGRAVACGRAVCSGRAVCHeVALUENFACTUNBMAOADSMAOAAFILMTKYPLUS,7TAUWALFYPLUSGFILMGLOENTPCLIOsPCLFTUMdYA.DUMMYR UMMYCCOMMON NoMTHCONDeFCHENSCHENVISCGCPLIOSURFTL,
1XTTSATPSMALLTDELTVPTWALLHCHFNHMACoHM1CiOFYNLONFLUXv2 PRNUMBBERGHT HDBHDENGOADENGODTDENG,0ELTT QACHEN,I DTCHENRADMAXDELTENRADIUSCCDDFE
164 OUALO4=R.0*(XLNGTH -SCQPTL+PLNGTH)NFLUX=0UALO4K=8.0*(XLNGTH-SCRPTL)00 459 N=K*NFLUXoJZFTA"NY=ZFTA/8.0
362 IF (Y-OUALOL) 170,3709365
02200022100222002-?002240022500226002270022800229002300025100232002330023400235002360023700234002190024000241002470024300244002450
0246002470
0001000020000300040
00050000600007000080000900010000110001209l013000140001500016000170001800019000700002100022000230002400025000260002700027500280000290

361 IF (Y -(1.A*MUALL) ) 37S, 178, Apn370 P = DDCSIM
rO TO 00
275 P=PPCSIN-(0.70*TSDD*(Y-QUALOL)/(XLNTH-OUALOLI ICO TO 3D0
380 PRDFAK=PPFSIN-(0.750*TSDP*(0.60*UALOL)/(XLG7H-fOUALOL)3AR P=PAPRAK-((PR9FAK-PFSOT*(Y-(1.60*QUALOL))/
1 (XLNrTH-(1.60*OUALOL)))340 CALL LTON
DWCFY=FNFPXCALL CVAPCK
0MWY=4N~tDXPOINT S65YPIIM9FYOMFFrY
8f8 rmOmT(4r?O.)1
Ir (Y -(XLNrTH-S(POTL))400,400,410410 DOWFOY=cXTOAA*Y
CrXLOY=cXTOAc/RATIOM00 TO 43
41" T- (Y -ULOrAT) 415.418,4?5418 'OnWY= (rXTPAA*(XLN0TH-SCPDTL))+
I (rXTDAR*(DNrMSO-SINF(3.1416*(ULOCAT-Y )/COSLEN)))(FXLOY=PXTPA *COSc(3.1416*(ULOCAT-Y )/COSLFN)n') To 43
4?8 Tc(Y -(ULO(AT+(PLNTH/2.01))430,430,43142' DOWD=y (rXToAA*(XLprTH-SCDDTL) )+
I (FXTOAR*(ONEMSO+STNF(3.1416*(Y-ULOCAT 1/COSLEN)))(9XLOY=FXTPAF*rjSF(1.1416*fy -ULOCAT)/COSLEN)'It3 Tn 41A
412 OnW;7PY=PXTPAA*(Y -DLNGTH)+(EXTQA5*2.0*ONmMSO)CFXLOY=FXTRAP/RATIOM
428 PkLOY=cNTHN+(DOWmDY/FLMASS)44' cNSLOY=cNLOY-OMrrY&9) 0UALOX=PNSLY/nMFFGY488 ONlTINUr
DOTNT 700DeOWFPTPOWFPYCFXLOYPDTT 710,rNLOYDOIMT
72'qNSLOY,OUALOX
7'n PORMAT(14H POWFP TOTAL = F9*4/,1 2AH DOWFP INPUT TO OOSITI0N X = E9.4/.7 14H LOCAL H-AT FLUX = E11.8)
71' FnDMAT(31H LO(AL FNTHALPY AT POSITION7X = FS.?)72 FOOMAT(41H LOCAL SURCMOLFD FNTHALPY AT POSITION X * F8.2/9
134H LOCAL OUALITY AT POSITION X = F6.3)CALL OTLMFD
4r0 rnITTNicP TUMN
CIPQOn0TTmN URIIANNCOMMON NTUBF5SMSHAPFTUBEPATIOMvDIAINSVOLTSAMPSENTHIN.FLMASS,
1 DOcS~PPFSI NDQFST ,PFSDDTSODPPOLoCAXLNGTHSHUNTMP,? D&PFX ,FNIFPX*OVMFGXFNFGDX ENSINOUALINP0OWEPTARFAFLAREAIS,2 OUALOI-,SATLDSATLDOW )RIPSLBrrLCFXAVGCFXLOXJLOCATK,X,4PRO9:A<9DOWLPX9KNLOX, tSLOXOUALOXOMFFYDMEFGYPOWOOONEOVM,a C ,SL0Neerr"S0oSIGZAODZFACMIeFACDLRPCFXROLY,
6 FACTMAIDOWOPYCFXLVYeNLOYFNSLOYOUAL0YFACTPL7CONST2,S0onTLZFTAPLNGTHJUULOCATCOSA9KSINABKIt,8 EXTqAAFXTAPFXTPACeXT3A~oEXTRAcFXTRAFDOMFFPnrMEFGRFNLOPENSLOBeOUALOBEXTRAGFXTQAHEXTRAI.EXTRAJ
(OMMAN OUALTA9GLIOeTKINCH.
0010000310003700033000340001800036000370
0038000300
0040000410004200041000440004500046000470004800040000500005100052000510005400055000560
0058000590006000061000620006300064000650006600067000680006Q0
00700007100072000710007400075000760
10DDDX#COLM19COLM29COLM3eCOLM4eSUNmCOLePHIMNPGTOTSCvGSU82eSUM0#SUMle
2SUM2,SUM3eSUM4,SUMNSOMEGAPeMEGAPGMULTePSURiLe T9VISCLVOLSPLENO.IVOLSPG,0UALO4.POWERAPANBOLDENFODENFGOENSOeUALODVSPLSO0VSPGO94GTOT DPMOMGRDMTDVLSPLeDVLSPGTERMITEPM2,TEM4eTERM4eGGASeDT950VISCLREYNUMFFACTPeFFACTVELOCGRDFSODPGM4LTGROFT.OGRDMTGRDTOT6RGRAVACGRAVCSGRAVCHVALUFNFACTUN8MAA&BMAOA.A.PILMTKeYPLUS*7TAUWAL.FYPLUSGWILMGLOFNT PCLIOPCLWNTOUMMYADUMMY5,0UMMYCOUALO4=16.0*OUALOLI=OUALO4D0 451 KaI.1000091DUMMYC=K+1X=nUMMYC/16.0IF(X-OUALOL)160 *160 9157
157 IFIX-(1.60*OUALOL) ) 162.162.165160 P=PRESIN
rO TO 16716? P=DPESIN-(0.780*TSDP*(X-OUALOL)/(XLNGTH-OUALL))
nO TO 167168 PRRWAK=PRFSN-(0.750*TSDD*(0.60*OUALOL) /(XLNGTH-OUALOL))166 P=PRDWAK-((PBPFAK-POQSOT)*(X-(1.60*OUALOL)I/
1 (XLNGTH-(1.60*OUALOL)))167 CALL LIQEN
DMPFX=PNFPXCALL PVAPFNDMFFGX=ENFGDPX
170 CFXLOX=POWrDT/ARFAIS175 POWVRX=POWMQT*(X/XLNGTH)180 FNLOX=FNTHTN + DOWFQX/FLMASS
185 FNSLOX=FNLOX-OMrFX190 1UALOX=ENSLnX/nkMrFGX455 Ir(0UALOX-OUALIA) 481,4'3,453451 CONTINUP453 POWF9A=DOWFOT-PWFPX
PANROL=POWFRR-POWFRXPRINT 7219XvPPRINT 72?.rMrFXtDMFFAXPRINT 723,POWERAPANBOLPOINT 7009POWERTtPOWERX*CFXLOXPOINT 710,ENLOXPRINT 7209FNSLOxeOUALOX
700 FORMAT(14H POWFR TOTAL = EQ.4/.1 28H POWER INPUT TO POSITION X = E9.4/,2 18H LOCAL HEAT FLUX = E11.5)
710 FOPMAT(S1H LOCAL ENTHALPY AT POSITION7X = FA.2)720 FOQMAT(41H LOCAL SUBCOOLED ENTHALDY AT POSITION X F8.?/
110H LOCAL DUALITY AT POSITION X a F6.3)721 FORMAT(51H CONDITIONS AT SLUG ANNULAR TRANSITION POSITION =FR.19
I 14H PRFSSURP =F8.1)722 FORMAT(18H LIQUID ENTHALPY =F8.2.19H EVAP ENTHALPY =FS.2)723 FORMAT(28H POWER OVER ANNULAR REGION =1PE10.3.
1 45H POWFR FROM SLUG ANNULAR TRANSITION TO !0 alPEI0.31)PFTURNFND
000100002000030000400005000060000700008000090001000011000120
SUBROUTINE COSANNCOMMON NTUBESMSHAPETUBERATIOMDIAINS.VOLTSAMPSeENTHINFLASS,
1 P8FSPPQESIMPePSOTRESDPTSDPoOLOCAXLNGTHeSHUNTMs,, '
2 DMFFXENFPXDMFFGXFNFGPXENSINOUALINPOWFP',AREAFLAEAIS3 OUALOLSATLPSATLPOWEPBPSLBOLCFXAVGCFXLOAJLOCATeK.X4DRQMAKtPOWFRX99NLOXoFNSLOX#OUALOXtDMFFYtDMEFGYgPOJWO()PnNFOVM#
00130001400015000160001700018000190002000021000220.
00240002500026000270002800020001000031000170003100031400n340m0600040000410004740043000440 s00540
0085000580005800060000610006?000610
0066000670006800069000700007100072000710007410071000760
0001000020000300004000n0500060

5 COSI.ENONFMSO0SIGNZAGZFACMIPFACDLRCFX0,L Y,6 FACTMIPOWFOYCFXLYFNLOYNSLY,UALYFACTOL,7CONSTPSCDTLZETADLNGTHJUULOCATCOSABK.SINABK,3,8 FXT9AAFXTRARFXTRACFXTRAIEXTRAFXTRAF,90MFFRoMEFrRoNLerCNSLo,0UALnFXTAGFXTAHeXTRATFXTRAJCrIMMON OUALIAGLI0,TKI9CH9
1DPDX,rOLm1,COLM,,rOLM3COLM4,SUMCOLPHTMNGTOTSCGSURZSUMOSUM12SUM2,SUM3,SUM4,SUM5OMEGAPOMEGAPGMULTIDSUBL,TVISCLVOLSPLENOIVOLSPG,0UALe4,POWEPADANBOLDFNFO'rENEG00FNS09QUALO.DVSPLODVSDGO,4GTOTDPMOM,GOMTDVLSDLDVLSDGTFPM1,TFPM2.TFRM3,TFRM4,GGASDT*5FVISCLFYNUMFFACTPOFFACT VFLOCGDOFS.e0GMLT ,eRDFT.OOROMTGRDTOT,6 ,RAVACGPAVCSGRAVCHVALUEN.FACTUN,9MAOADBMAOAA FTLMTKYPLUS,7TAUWALFYPLUSGFILMeGLOFNTDCLI0,PCLFNTDUMMYADUMMYR,0UMMYCOUALO4=16.0*nUALOLI =nUAL0400 451 L=I,10O
00lnUMMYC=L+1Y=OUMMYC/16.
0
I- (Y - OUALOL) 370s 370, 3651A IF fY -(I1.A*OUAL0L) 1 375, 375, 3An370 P = POESIN
An To 39n317c P=DPFSN-(0.750*TSDD*(Y-UALOL)/(XLNGTH-OUALOL) )
nO TO 301330 PRFAK=PPFSIN-(0.750*TSDP*(0.60*OUALOL)/(XLN0TH-QUALOL) I
D=DRPFAK-((DBPFAK-DOFSOT)*(Y-(1.60*0UALOL))/1 (XLNTH-(1.6*OJALOL)))
Aor CALL 1 IOFNnMFFYrcNFDXCALL FVAPFNnMFFrY=ENFrPXTF (Y-(XLNnTH/2.0) )400,4009428
400 FACTMT=(1.n-(Smre (3.1416*( (XLNGTH/2.0)-YI1/CoSLFN)) /WFMSO)
410 DOWFPY u(POWFPT*FArTMI) / 7.0411 rFXL0Y.144.f*(onWcDT/(I7.O*IAINS*CSLN*0NMS))*
lroSF(3141A*( (XLNOTH/?.01-Y)/COSLrN)415 FmLOY = FNTHIN + (DOWERT*FACTMI) / (7.0 *FLMASS)
47" "NSLv=FNl mY-OMFFY4?r mUALnX=FNSLOY/MFFGrY
rh TO 49;4?A FACTDL=(1.0+(SINF( (3.141A*(Y-4XLNGTH/2.0) ) I
1/COSLcN) )/ONrMSO)410 DOWPPY = (DOWrRT*FACTPL) / 2.0
4-4 CFXLOYe144.0*(D0WERT/(2.0*OIAINS*COSLEN*ONEMSO))*1(OSF(1.1&16*(Y-(XLNGTH/2.0) )/COSLFN)
411 ENLOY = ENTHIN + ( POWERT* FACTPL) / 1 2.0 * FLMASS)44" FMSLmY=FNLOY-nMFFY4s0 nUALOX=9NStI Y/0McFGY45c IF(OUALnX-mUALIA) 451,453,453451 CONTINUF453 OfWFRA=DOWFRT-POWFRY
PAN8L=POWEQR-DOWERYPPINT 721*YtPPPINT 7?2nMEFYenMFFGYORINT 723#POWFRA*PANROLPRINT 700,POWFRTPOWFRY,CFXLOYPRINT 711,FNLOYPRINT 720ePNSLOY9OUALOX
700 FORMAT(14H POWFR TOTAL = EO.4/,1 2AH DOWrR INDUT TO POSITION X = E9.4/,2 18H LOCAL HEAT FLUX = E11.5)
710 FORMAT(31H LOCAL FNTHALPY AT POSITION7X = F8.2)720 FORMAT(41H LOCAL SURCOOLED ENTHALPY AT POSITION X = F8.2/,
1310H LOCAL OUALITY AT POSITION X = F6.3)
000700008000090001000011000120001300014000150001600017000180001900020000?10
00220
00240002500026000270002A000200030000310003200033000340003500036000370003"00039000400004100042000430004400045000460004700048000490005000051000520005300054000550005600057000580005900060000610006200063000640
00670006800069000700
721 FORMAT(51H CONDITIONS AT SLUG ANNULAR TRANSITION POSITION =F8.1,1 14H PRFSSURF =F86l)
722 FORMAT(18H LIQUID ENTHALPY =F8.2,19H EVAP rNTHALPY ~=F82)723 FORMAT(28H POWER OVER ANNULAR REGION =1PE10.3,
1 45H POWFR FROM SLUG ANNULAR TRANSITION TO 80 lPE1O.3)RETUONEND
SURROUTINE LNIANNCOMMON NTURFSvMSHAPETUBERAT IOMODIAIMSVOLTS#AMPSefNT14INFLMASS 9
1 PRESPPRESINPRFSOTDESDP.TSDPSOLOCAXLGTHSMUNTPq2 DMEFXENFPXDMEFGXENFGPXENSINGUALINPOWERT.AREAPtA#EAIS3 OUALOLSATLPSATL*POWERBPSL80LCFXAVG.CFXL0X.JLOGAT3teX4PBREAK ,POWFPXENLOXvENSLOX.0UALOXvDMEFY#DMEFGY 90,WO0 NEOVM s5 COSLENONEMSOSIGNZARGZFACMIBFACPRBeCFX8OLYe6 FACTMIPOWPYCFXLOYENLOYFNSLOYOUALOYFACTPL7CONSTPSCRDTLeZPTAPLNGTH.JUULOCATCOSABKSNABKIe'8 EXTRAAEXT9APFXTRACFXTRADFXTRAFerXTRAF#90MEFBDMEFGBENLOBFNSLO,QUALO.EXTRAGEXTRAHEXTRAI EXTRAJCOMMON QUALIAvGLIO*TKINCH91DPDXCOLM1.COLM2COLM1COLM4SUMCot ,DMIMNGTOTSCGSUBZ.SUMOSUM1,2SUM2,SUM3.SUM4,SUM5OMEGAPOMEGAPGMULT.PSUBLTVISCLeVOLSPLtENO.3VOLSPG.OUALO4.POWERAPAN8OL*DENFOoDENFGO.ES0.0tUAL*O0VSPL0eDVSPGO.4GTOT.DPMOM.GRDMTDVLSPLDVLSPG.TERM1,TERM2TERM3,TEM4GGASDT5DVISCL.REYNUMeFFACTPFFACTVFLOCGPDFS.DPMLTG#0FTDGRDMTGRDTOT68GRAVAC.GRAVCSGRAVCHVALUENFACTUNBMAOA08fMAOAoAFTLMTKYPLUS,7TAUWAL FYPLUSGFILMGLENTDCLIOCLNTenUftNMYADUMY.0DUMMYCQUALO4=16.0*QUALOLI=OUALO4DO 451 K=10000,01DUMMYC=K+1X=DUMMYC/16.0IF(X-OUALOL)160 9160 9157
157 IF(X-(1.60*OUALOL) ) 162.162*165160 P=PRESIN
GO TO 167162 P=PRFSIN-(O.750*TSOP*(X-OUALOL)/(XLNGTH-QUALOL))
GOTO 167165 POFAK=PRESIN-(0.750*TSDP*(0.60*OUALOL) /(XLNCTH-OUALL))166 P=PBREAK-((PRRFAK-PDFSOT)*(X-(1.60*QUALOL))/
1 (XLNGTH-(1.60*OUAL0L)))167 CALL LIOrN
O)MFFX=c'NFPX
CALL EVAPENDMEFGX=ENFGPXCFXLOX=((2.0*PnWFRT)/(APEAIS*(PATIOM+1.00)))
1 *(1.00+((X*(RATIOM-1.00))/XLNGTH))POWFPRX=((PWFRT*2.00)/(RATI0M+1.00))*(X/XLNGTH+((X*X*(RATIOM-1.0o)
1 )/(XLNGTH*XLNGTH*.00)))180 ENLOX=ENTHIN + POWEOX/FLMASS
185 ENSLOX=ENLOX-DMFFX190 OUALOX=ENSLOX/OMgFGX455 IF(OUALOX-OUALIA) 451,453,453451 CONTINUE453 POWF9A=DOWF0T-PmW#9X
PANROL=POWFRA-POWFPXPRINT 7219X9PPRINT 722,DMEFXDMEFGXPRINT 723#POWERAPANBOLPRINT 700,POWEqT*DOWERXCFXLOXPRINT 710,ENLOXPRINT 7209ENSLOX#OUALOX
00710007200073000740007500076000770
014400145001460014700148001490015000151001520015300154001550015600-157001580015900160001610016E0016308"0164001650
01670016800169001700017100172001730017400175001760017700178001700013000131001920013700184001A5001360018 70013800159001900019100192001910019400145001960
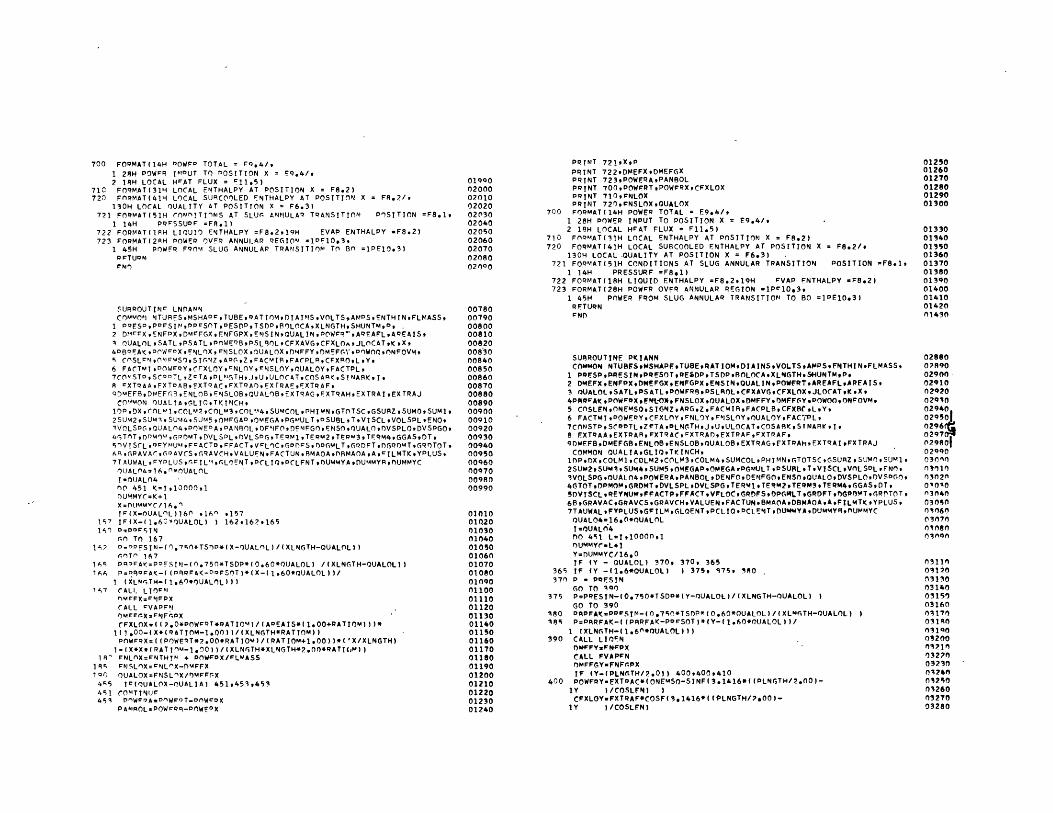
700 FOOMAT(14H DOWFP TOTAL = FQ.4/91 28H POWPR ITNUT TO DOSITION X = Sq.4/92 1H LOCAL HrAT FLUX = E11.5)
710 FORMAT(31H LOCAL ENTHALPY AT POSITION X = F8.2)720 FORMAT(41H LOCAL SURCOOLED ENTHALPY AT POSITION X = FA.2/,
130H LOCAL OUALITY AT POSITION X = F6.3)721 FOPMAT(51H CONOITIONS AT SLUG ANNULAR TRANSITION POSITION =F8.1,
1 14H PRFSSUDF =F9.1)722 FORMAT(IAH LIOUID ENTHALPY =F8.2.19H EVAP ENTHALPY =F8.2)723 FORMAT(2AH POWER OVFR ANNULAR REGION =1PE10.3,
1 45H POWFR FROM SLUG ANNULAP TRANSITION TO BO =1PE1O.3)* rTUoN
SUAROUTINP LNDANNCOMMON NTURES.MSHAPrTUBEgRATIOMgDIAINSVOLTSAMDSENTHINFLMASS1 DPESD,POPSIp0PDSOTDESDPTSDPBOLOCAXLNGTHSHUNTM,D, .2 DNFFX ,NFPXDMFFGX#FNFGPXENSINQUALINDOWFRtARFAFLAEAIS3 OUALOLSATLPSATLPOWERB,PSLROL,CFXAVGCFXLOAJLOCAT,KX,4DBPAKE DPOW cX ,FNLOX, NSLOX ,OUALOX ,D04FFY ,DMEFG%'*DOWOOONFOVMN CGSLFNONIFMSOSIGNZ ,APOZFACMIRFACPLRCFXRO,L,Y,6 FACTMIeDOWERYCFXLOYerNLOYCNSLOYOUALOYFACTPL,7CONISTPSCODTL,ZCTAoPLNGTHJUULOCAT9COSARK9SINABK,I,8 CXTRAAEXTDABFXTRACFXTRADOEXrRAEFxTRAF,ODMEFBD!EFGS3ENLOBFNSLOB,0UALOBEXTRAGoFXTRAHEXTRAIEXTRAJCOAMON OUALTA9GLIQ,TKINCH,
10DoDX,COLM1,COL'A2,COLM3COLM4,SUMCOL,PHIMN,GT0TSCGSURZSUM0,SUM 12SUM2,SUM3,SUM4,SUM5,OMFGAD0OMEGAoPGMULTPSUBLTVISCLVOLSPL*ENO$IVOLSPG,0UALO4,DOWEDAANlOL,DFNFOFNFGOENSOOUALO0VSPL0,DVSPGO,4GTOTDDMOeGPDMTDVLSPLOVLSDG,TERM1,TERM2TEFR3,TFRM4*GGASDT,5OVISCLREYNU4,FCACTD,FFACTVELOCGOOSOPGMLTGRDFTeOGROMTGR0TOT,ARC,PAVAC,OPAVCSGRAVCHVALUFNFACTUN.BMAOAnBMAOAAcILMTKYPLUS,7TAUWALFYOLUStrFFILMoLOENTPCLIOPCLFNT OUMMYADUMMYR,0UMMYCOUIALO4=16. *OUALOLT=OUALO40O 451 K=191000091DUMMYC=K+1X=OUMMVC/16.0IF(X-0UALnL)16O 916' .157
157 IF(X-(1.6*OUALOL) ) 162.162*165160 DPDDSTN
n0 TO 1671? D=OPFSIN-(0.7NO*TSOD*(X-OUAL0L)/(XLNGTH-OUALOL))
nOTO 16716S PRDAK=POESIN-(0.750*TSDP*(0.60*OUALOL) /(XLNGTH-OUALOL))16A P=DRAK-((PRRAK-DQFSOT)*(X-(1.60*OUALOL))/
I (XLNOTH-(1.60*OUALOL)))167 CALL LIOPM
OMWFXC=NjFPXCALL CVAPFKIOMrt:XsFNFGDXCFXLOX=((7.0*DOWrRT*RATIOM)/(ADEAIS*(1.00+RATIOM)))*
1(1.00-(X*(RATIOM-1.OO))/(XLNGTH*RATIOM))POWFRX=((POWERT*2.00*RATIOM)/(RATIOM+1.00))*('X/XLNGTH)
1-(X*X*(RATinM-1.00))/(XLNGTH*XLNGTH*2.00*RATM))18' FNLOX=rNTHTN + DOW,0X/rLMASS
18% PNSLOIX=cNLnX-D4FFX100 OUALOX=FNSLnX/OMFFCX415 IC(OUALOX-OUALIA) 451,453,453451 CONTTNUr4513 POWvDA=DOWFQT-DOWPcX
PANqOLvPOWrRR-DOWEPX
0190002000020100202002030020400205002060020700208002000
00780007900080000810008200083000840008500086000870008800089000900009100092000930009400095000960009700098000990
010100102001030010400105001060010700108001090011000111001120011300114001150011600117001180011900120001210012200123001240
PRINT 721,XPPRINT 722,DMEFXDMEFGXPRINT 7239POWERAPAN8OLPRINT 700,POWFRTPOWFRXCFXLOXPRINT 710,FNLOXPRINT 720,FNSLOXGUALOX
700 FORMAT(14H POWER TOTAL = E9.4/9I 28H POWER INPUT TO POSITION X = E9.4/-2 18H LOCAL HFAT FLUX = F11.5)
710 FOPMAT(31H LOCAL ENTHALPY AT POSITION X = F8.2)720 FORMAT(41H LOCAL SUBCOOLED ENTHALPY AT POSITION X = F8.2/*
130H LOCAL -QUALITY AT POSITION X = F6.3) .721 FORMAT(51H CONDITIONS AT SLUG ANNULAR TRANSITION POSITION =F8.1,
1 14H PRESSURF =F81)722 FORMAT(18H LIQUID ENTHALPY =F8.2*19H rVAP FNTHALPY uF8.2)723 FORMAT(28H POWFR OVFR ANNULAR REGION =1PC10.3,
1 45H POWER FROM SLUG ANNULAR TRANSITION TO BO =1PE10.3)RETURNF MO
SURROUTINF PKIANNCOMMON NTUBFSMSAPFTUSE.RATIOMoDIAINSVOLTSAMPS.FNTHINFLMASS*
1 POESP,.RFSIN9PRFSOTPESDPTSDPBOLOCAXLNGTHSHUNTMPe2 DMEFXENFPX.DMEFGXENFGPXENSINQUALIN,POWFRT.AREAFLAPEAISq3 OUALOLSATLPSATLDOWFRR.PSLROLCFXAVGCFXLOXJLOCATKX,4PAQVAJ(9POWF0XFMt-OX9FNSLOXOUALOXDMFFY,DMFC-YPOWOON OVM
5 COSLENONEMSOSIGNZARG,ZFACMIRFACPLBCFXBC LY%6 FACTMI.POWERYCFXLOYFNLOYFNSLOYOUALOYFACTPL,7C0NSTPSCRDTLZFTADLNCTHJUULOCAT.COSARKSTNARKI8 EXTRAAEXTRARFXTRACPXTRADEXTRAFFXTPAF*9DMEFBDMEFG8,ENLO8,ENSLOBOUALOB.EXTRAGFXTRAHEXTRAI FXTRAJCOMMON OUALIAGLIOTKINCH,1OPDXCOLM1,COLM2,COLM3,COLM4,SUMCOLPHIMN0TOTSCGSURZSUMOSUM12SUM2SUM3,SUM49 SUM5,OMEGAP#OMEGAPGMULTPDSUBLT9VISCL*VOLSOLFNo3VOLSPG,0UALO4,POWERAPANBOLDENFODENFGOENSOQUALODVSPLODVSDGO,4GTOTDPMOMGRDMTDVLSPLDVLSPG,TERMI TERM2,TEQMIeTERM4,GGASDT,5DVISCLREYNUMFFACTPFFACTeVFLOdeGRDFSDPCGLTGRDFTerPOMTtGR0TOT,68GRAVAC.GRAVCSGRAVCHVALUENFACTUNBMAOADBMAOAAFILMTKOYPLUSo7TAUWALFYPLUSGFILMGLOENTPCLIOPCLENTDUMMYADUMMYRenUMMYCOUALO4=16.0*OUALOLIuOUALO4DO 451 L=I,10000,1OUMMYC=L+1Y=DUMMYC/16.0IF (Y - QUALOL) 370, 370, 365
365 IF (Y -(1.6*OUALOL) ) 375, 375 380370 P = PFSIN
GO TO 100375 P=PRESIN-(0.750*TSDP*(Y-OUALOL)/(XLNGTH-OUALOL) I
GO TO 390380 DRPFAK=PQCSTN-(0.750*TSDP*(0.60*UALOL)/(XLNGTH-OUALOL)385 P=PRRFAK-((PRRFAK-POrSOT)*(Y-(1.60*OUALOL))/
I (XLNGTH-( 1.60*0UALOL)1)390 CALL LIOFN
0MFFY=FN9PXCALL FVAPFNOMFFCY=FNFOPXIF (Y-(PLNGTH/2.01) 400,400,410
400 POWFRY=EXTQAC*(ONEMSO-SINF(3.1416*((PLNGTH/2.00)-lY )/COSLEN) )CFXLOYaFXTRAF*COSF{3.1416*((OLNGTH/?.00)-
lY )/COSLEN)
012500126001270012800129001300
0133001340013500136001370013800139001400014100142001430
0286002890029000291002920029300294002950102960 29750298ol029900300003*010030200103003040
030500306003070030800in
03110091200313003140031511)03160
031R003100032000321003270092300324001250032600327003280

60 TO 435410 IF (Y-(XLNrTH-SCQPTL)) 415,415,425415 DOWFOY=EXTAC*(ONFMASO+SINFI3.1416*(
lY -(PLNGTH/?.o0))/COSLFN) )CPXLOY=FXT0Ar*COSF(I3.1416*(
lY -(DLNGTH/?.00))/COSLEN)GO TO 435
429 POWFPY=(POWFDT/CONSTP)*((COSLPN*CXTRAA/3.1416)+FXTRAP*Il.OO-1EXPF( (-ZcTA)*(Y -(XLNGTH-SCRPTL))/SCRPTL)))CFXLOY=FXTRAF*COSA9K* FXPF( (-ZETA)*(ly -(XLNGTH-SCRPTL))/SCRPTL)
43 ENLOY=FNTHIN+(POWERY/FLMASS)440 ENSLnY=ENLOY-DMEFY480 OUALOX=rNSL"Y/OMFrY455 IF(OUALOX-OUALIA) 451,4539453451 CONTIMU451 POWFPA=POWFPT-POWFOY
PANROL=POWFRR-DOWERYPTT 7219YvPPRINT 722,DMFFYDMEFGYPRINT 723,9POWFRA#PANROLPRINT 700,DOWERT*POWFRYtCFXLOYPRINT 710ePNLOYPRINT 7?70FNSLOYOUALOX
7- PORMAT(14H DOWCP TOTAL = FQ*4/tI 2AH POWER INPUT TO POSITION X = E9.4/92 18H LOCAL HEAT FLUX = E11.5)
71~ FOOMAT(31H LOCAL FNTHALPY AT POSITION7X = F8.2)721 FORMAT(41H LOCAL SURCOOLED ENTHALPY AT POSITION X F8.2/9
130H LOCAL OUALITY AT POSITION X = F6.3)7?1 FOOMAT(51H CONDITIONS AT SLUG ANNULAR TRANSITION POSITION =F8.1*
I 14H POcSSURF =FP.1172? FOQMAT(1SH LIQUID ENTHALPY =F8.2919H EVAD ENTHALPY =F8.2)771 FORMAT(28H POWFP OVFP ANNULAR REGION =1PE10.39
1 49H POWER FROM SLUG ANNULAR TRANSITION TO B0 =1PF1O.3)Dc7TUDN l
SUR7AUTyIN PKOANNCnMMON NTUBESMSHAPETUBERATIOMDIAINSVOLTSAMPSENTHINFLMASS,
I PDESDPRFSINDPFSOT DESDtD,TSDPROLOCAXLNGTHSHUNTMP? OMFXeccDXMrFX,rNFGPX NSINOUALINPOWFPeARFAFLAPEAIS,I OUALOLSATLPSATLOOWERB#DSLROLCFXAVGCFXLOAJLOCATKX,4P9EAK,DOWFPXFNLOX,FNSLOXOUALOXDMEFVYDMEFG.',POWOOONEOVM,8 COSLFNONEMS0S IGNZARGZFACMIRFACPLBCFXBOLY,6 FACTMI ,DOWFQYCFXLOYrNLOYENSLOYOUALOYFACTPL,7C0ASTDoSCDDTLZFTAOLNGTHJUULOCATCOSABKSINAreIs
8 rXTOAA ,XTARFXTOACFXTPAOFXTRAFFXTRAF#OnFFR,0MFGPNLBFNSLOB,0UALOB8FXTRAGeXTRAHFXTRAIEXTRAJ
COMMON OUALIA9GLI0,TKINCH,1OPDXCOLM1,COLM2,COLM3,COLM4,SUMCOLPHIMNGTOTSCGSUBZSUMOSUMIl2SUM2,SUMISUM4,SUM5,OMEGAPOMEGAPGMULTDSUBLTVISCLVOLSPLENOIVOLSPGO oUALO4,POWEPADANBOL DENFODFNFGOENS09OUALODVSPL(7,DVSPGO,4GT0TOPMOveGDDMTDVLSDLDVLSPGTERM1,TERM2.TERM3,TERM4,GGASDTAOVISCL ,RY1U'AFrACTPFFACTOVFLOCGROCSDPGMLTGPDFTenGRDMTGRDTOTv6POAVACeoAVrS,RAVCHVALUCNFACTUNBMAOABMAOAAFILMTKYPLU,7TAUWALeFYPLUSGFILGLOENT
0CLIOPCLFNTDUMMYADUMMYSDUMMYC
OJAL04=16.O*OUALOLI=OUALn400 481 L=,1
0000,1l
DUMMYC=L+1Y=OUMMYC/16.c
032900330003310033200333003340033500336003370033800339003400034100342003430034400345003460034700348003490035000351003520
035500356003570035800359003600036100362C0363003640
02100021100212002130021400215002160021700218002190022000221002220022300224002250022600227002280022900230002310
IF (Y v OUALOL) 370, 370, 365
365 IF (Y -(1.6*OUALOL) 1 375. 375, 380370 P = PRESIN
GO TO 390375 P=DRFSIN-(0.750*TSDD*(Y-OUALOL)/(XLNGTH-OUALOL)
GO TO 390380 PrQAKPRFSIN-4O.750*TSDP*(0.60*OUALAL)/(XLNSTH-OUALOL)-385 P=PB9FAK-((PIPFAK-PRESOT)*(Y-(1.60*OUALOL)I/
1 (XLNGTH-(1.60*0UALOL)))390 CALL LTON
DMFFY=ENFPXCALL FVAPENDMEFGY=ENFGPXIF (Y-SCRPTL) 400,400,410
400 POWERY=EXTRAF*(FXPF(ZETA*(lY -SCRPTL)/SCRDTL)-EXPF(-ZETA))CFXLOY=EXTRAE*COSAS1*(FXPF(ZFTA*(
1Y -SCROTL)/SCRPTL))GO TO 435
410 IF (Y-(XLNGTH-(PLNGTH/2.00))) 415,41%,429415 POWERY= (POWERT/CONSTP)*((EXTRAB*ULOCAT) + i(COSLEN/3.1416)*(
15INABK-SiNF(43.1416/COSLEN)*(XLNGTH-(PLNGTH/2.00)-Y ) ) ,J )CFXLOY=EXTQAE*COSF((3.1416/COSLEN)*(XLNGTR-tPLNGTH/2001-Y )GO TO 435
425 POWERY (POWERT/CONSTP)*((EXTRAB*ULOCAT) + ((COSLEN/3.1416)*(1SINABK+SINF((3.1416/COSLEN)*IY -(XLNGTH-lPLNeT({/2w0O) )2 ))CFXLOY=FXTOAF*COSF(t3.1416/COSLEN)*(Y -(XLN6TH-(PLNGTN/2,00)
1 ) )435 ENLOY=aNTHIN+(DOWERY/FLMASS)
440 FNSLOY=ENLOY-OMvFY450 OUALOX=ENSLOY/DMEFGY455 IF(OUALOX-OUALIA) 451,453.453451 CONTINUE453 POWERA=POWERT-POWERY
PANROL=POWFOR-POWEPYPRINT 721,YsPPRINT 7229DMErY*DMEFGYPRINT 7239POWERAtPANBOLPRINT 700,POWERT*POWERYCFXLOYPRINT 710#ENLOYPRINT 720#FNSLOYOUALOX
700 FORMAT(14H POWER TOTAL = E9.4/91 28H POWER INPUT TO POSITION X = E9.4/v2 18H LOCAL HEAT FLUX = E11.5)
710 FORMAT(31H LOCAL ENTHALPY AT POSITION7X = F8.2)720 FORMAT(41H LOCAL SUPCOOLED ENTHALPY AT DOSITION X = F8.2/9
130H LOCAL QUALITY AT POSITION X = F6*3)721 FORMAT(51H CONDITIONS AT SLUG ANNULAR TRANSITION POSITION =F8.l,
1 14H PRESSURE =F8.1)722 FORMAT(18H LIQUID ENTHALPY =P8.2.19H EVAP rNTHALPY =F8.2)723 FORMAT(28H POWER OVER ANNULAR REGION =IPE1O.39
1 45H POWER FROM SLUG ANNULAR TRANSITION TO BO =1PE10.3)RETURNEND
SUBROUTINF SPKANNCOMMON NTUBESMSHAPETUBERATIOMoDIAINSVOLTSAMPSENTHINFLMASS,
1 PRESPPRESINPRESOTRESDPTSDoBOLOCAXLNGTHSHUNTIAP,2 DMEFXENFPXDMFFGXFNFGPXFNSIN,0UALIN=DOWERTAREAFLAREAIS3 OUALOLSATLPSATLPOWERBPSLBOLCFXAVGCFXLOXJLOCATKX,4PBREAKPOWERXENLOXENSLOXOUALOXDMEFYDMFFGYPOWOO.ONEOVM
02330023400235002160023700238002390024000241002420024100244002450024600247002480024900250002510025700253002540025500256002570025800259002600026100262002630102649W0263026600267002680026000270002710027200273002740
02770027800279002800028100-282002830028400285002860
02870
000100002000030000400005000060

3 C0SLFNoNEASOS IGNZ AOC-,Z ,FACMIP ,FACPLRCFXROL ,Y,A FACTMIPOWF YCXLOYFNLOYFNSLy,'UALoYACTDLI7CONSTD01TLZTAtOLNGTHJUULOCATCOSAKSINA3Kt,8 FXTDAA ,FXTPAP, rITRACFXTRAO,*FXTPAFCXTPAF,ODMFFBDMEFC,OPNL03,9FNSLOBQUALOBEXTRAGFXTRAHEXTRAIEXTRAJ
COMMON OUALIAtGLI09,INCH 'IlOPOXCOLY1,COLM2,C0Lm3,CO)LM4,SUMCOLPHIP4NGTO)TSCGiSURZSUM0,SUMI,?SUkM2,SUM3,SIJIA4,SUM5,OM"FGAD0YC,At,0ULT,0SUPLTVISCLV0LSPLFN0,3VO)LSPC,,0UJALC'4.POWF'-A ,OANN)L,"PNFO,PNFGO,FNSO ,O'ALOOVSPLOo)VSPO,
4GTOT,OPDM0mOTO1mTOVLSPLoVLSPGT~PM1TR2TM3TcM4,GASDT,5OVISCL , rY3UMFFACTP ,FFACT ,VrL0C ,GROFSOOOMLT,OPOFT e,OMTGPDTOT,
6R ,OAVACCDAVCS, -AVCHVALUFNFACTUI,3MAAnoSMAeAAFLTKo YPLUSv7TAUWAL ,FYPLU5S,FILVC~rLOFNTPCLIOePCLITOnUMMAYAOUMJkMYR,O)UMMYC
eC?)hM0nk MVTHrCIOt,FCHFMSCHCNV!SCO,0PDLTOSUPTL,
1XTTSATP,~lALLTorFLTVPTWALL ,HCH3NHMACNMITCOrYNLO,NFLUX,2 PPNU'lA,3cTGHT ,H ,HD N0,OAOEMOOtT0FPNO,0ELTT ,OACHEN,3 GTCHFN ,RAOMAX ,OFLTFNRAO)IUSCC,ODFF(tJAL4=1."*O)UALrOL-T =OIJALj40n 451 L=191(
0^191
nUMIAYr-L,1Y=OUMMYC/IA, nTF (Y - OUALOL) 370, 370, 165
'AS 1P (Y -I1*6*OUALnL) )1375, 173), 330
00 Tm 300127A 0=D0FSTN-(O.730*TS0P*(Y-COUAL0L)/(XLCTH-OUALMII I
r?0 TO 30ml3'n OP AI=PQrSTN-(O.750*TSO)P*(0.6*OUALOL)/(XLNG TH-0UAL0L) I
1 IXLNrTH-( 1 .6n0IALOLI II3~CALL L10
33!l
CALL rVAPF'0)VrFCY=FNFr0PXIF (y -(XLNr-TH-SCQPTL))400940()*41O
4- PV'0VFTDA A*YrXLl0Y=rXTRP/clATIOM
r-0l TO 43341- IF IV -lJLO0AT) 413,419,475413 (c''?=IXTDAA*IXLRN0TH-ScqDTL)l+
1 trT~*nl'S-TII*46(~)A- I/CnSLFNII)CFXLOY=CXT~a3*r0OF(3,141,#(ULOCAT-Y )/COSLFN)r0n TO 435
423; IFIY -(ULO)CAT+(PLNGTH/2.0)))4309410943341- DnWPPY (FXTOAA*(XLNrTH-SCOPTL) [4
I (cTA*^c!!Sm(.46(-~)A )/CnSLENI)))CFXLO0Y=3XT0AP*CO)5r( 31416*(Y -ULOCAT)/COSLFN)r0( TO 435
431 0MWcDY=cXT0AA*(Y -DLMGTH).(FXTQAR*2.O*0ONFmSO)rFXL0Yv=XTPAr/0ATIOM
41r FNILOY=FTITHI+(P0tWFOY/rLMASS)
49' OLALnX=FNSLmy/nMPFr0Y4ci 1F(OUALf0X-f0UALIA) 4519453,453431l C0'T I MUF4931 0WEAmn'0T-DWl~o
0AvBOL =POW q9-~0mWEPY
PRINT 777 9 'AFY 9 IM~rry'TYNT 723,P0lWFQA9PANROL
POINT 7(O fl0nWrT9PfWFV'VCFXLnYPRINT 710 9 NLOYPOPI"T 72
0,PSL()Yv0UAL0X
7 r PMQMAT(14H DPOWPP TO)TAL = F0&4/ 9
0007000080000900010000110001200013000140001500016000170001800019000200002100022000230002400025000260002700028000290003000031000342000330o00340)003500036000370003800039000400004100042000430004400045000461000470004800049000500005100052000530005400055000560005700058000590006000061000620006300064000650006600067000660006900070000710
I 29H PnWER INPUT To POSITION X = E9.4/9
2 1AW- LOCAL HrAT PLUX = EileS)71n FOPMAT(3iM LOCAL FNTHALPY AT DOSITTON7X = FO.P)720 POPMAT(41H LOCAL SURCOOLED FMTHALDY AT P(NSITIfiN X -=8*/
130H LOCAL OUALITY AT POSITION X -F6*3)721 FORMAT(51H CONDITIONS AT SLUG ANNULAR TDANSITION POSITION =FS.1.
1 14H PRESSURF =F9.1)722 FOPMAT(18H LIQUID ENTHALPY =F8*2919H IFVAP ENTHALPY zF892)723 FORMAT(28H POWER OVER ANNULAR REGION =1PE1O*3#
1 45H POWFR FPOM SLUG ANNULAR TRANSITION TO 8O =IPFA0,3)PFTURNF NO
SUBROUTINE BONUCFCOMMON NTUBESMSHAPETUBEQATIOMOIAINS ,VOLTSAMPSENTHINFLMASS,1 PQPSP,
05PSN' PQFSOT ,PSDPTSDPSOL0CAXLNGTHSHUNTMP,
2 DMFFXENFPXOm0FXFNFGPXENSNOUALINPWC0TAFAFLAQFATS,I OUALO)LSATLPSATLPOWFRR,0PSLI3OLCFXAVGCFXLOXJLO"CATKX,4RFAI( POWFOX ,NL0X ,FNSLOX ,OUALOX ,DMFFY ,O4EFC,YPOWnOOONFOVM,5 COSLENONEMSOSIGNZARGZFACMIBFACDLRCFXROtLY,6 FACTM1,DOWFP~YCFXLOYENLOYFNSLOY,0UAL"YFACTPL7CONSTPSCRPTL ,ZFTAPLNGTHJU ,ULOCAT eCOS ASK eSNARK I.8 EXTRAAEXTRA3,VXTRAC,9XTPAOFXTRAFrXTRAF,9DMEFBDMEFG3,EMLOBPNISLOBO)UAL0BFXTPA0,FXTPAHEXTRAl ,FXTRAJCOM~MON OUALIA*GLIOT(INCH,lDPOXCOLMlC0LM4?,COLm3,COLM4,SUMCOLDHIMNGTOTSCGSUBZSUM0,SUM1,2SUM2,9SU43,SUM4, SUMS,9OMFGA0 qOMFGA tPGMULTP0SUBL. ,TvVISCL,#VnLSPL,*ENO#3VOLSPGOUALO4,P0WEPAPANSOL ,DENFOOFNF0~7,ENSO,0UALnOVSPLODVSPOO,4GT0ToPMOMGQDMTDVLSLDVLSPGTERM1 TEQM2,TFOM3,TFQM4,GGASDT,5OVTSCLRFYNUmFFACTP ,FFACT ,VFLOCGQOFSOPMLTC.DDFT ,rOQMT~r-POTOT96BGq*VACGRAVCSCRAVCHVALUONFACTUNRMA0AD8MAOAA ,FILMTKYPLUS,7TAUWALFYPLUSGFILMGLENTPCL10,PCLFTDUMMY,,DU4,Y1,OUNMYCCOMMON NmTHCONOFCHEMSCHENVISCGCPLIO ,suprTL,1XTTSATPSMALLTDELTVPTWALLHCHFNH4MACHMICRFYNLONFLUX,2 PRNUMBBFRGH~TH08,1-)FNGOADFNGDTDFNGO)ELTT,0ACHEN,3 DTCHENQADMAXOELTrA4,RADIUSCCODFIF(eOLOCA-OUALOL) 750,750,755
755 IF(9OLOCA-(1,6*OUALOL)) 760,760,761i750 P-PRESIN
GO TO 770760 P=PRFSIN-(O.730475DP*(POLOCA-OUALOL)/(XLMGTH-G UALOL))
GO TO 770765 POREAK=PRFSIN-fO.75O#TSDP*I0.6O*0UAL0L)/IXLNGTH-OUALOL))
P=PBREAK-( (PRREAK-~PQFSfT)*(ROLOCA-(1,6O*O)UALnL)) IXLNCGTH-1 (1*60OUALOLI))
770 OUALOX-OUALORIF(OUALOX) 780,780,775
775 CALL XXTTCALL SATTMPCALL VISCOSCALL XTHCONCALL XCPLIqCALL XSURFTCALL EVAPENCALL SPFCVGCALL SPFCVLPRNUM5. CPLIOOVISCL/THCO'nOA =(P*0214)SUM1-A/ (?.30-A)BERGHT.( (1.O/(15.6*(P**1.156) )**SUMI)REYNUM&(GT0T*0IAINS)/( 12.0*VTSCL)HDB.0.023*THCOO*( 12.0/DIAINS)*(REYNUM**0.8)*(PRNUN'8#*0.4)
00720007300074000750007600077000780007900080000810030821)00830
00010000200003000040000500006000070000890000"000100001100012000 1300014t)0115000160100171)1;0018
00210)0022000230fl0240002500076.000270002800024f00010000310I00f)320f00330)
00150se00360003711030380)00m300t10400)0041000420041500044000450004600047000480

HDFNG=3o5*HDP/(XTT**C.5)R=(?e'VI/(?eV1-A))fADENG=(EoCHT*(HDFmG** B)))TDFN=0 ADFNG/HO NGPRINT 100,HDFNG0ADWNGDTOFNG
100 FODMAT(9H H DFNG =E15.5,25H NUCL FLUX OENG-REqGLES = 15.591 ?4H TWALL MINUS TSAT DFN, =c15.5)
rDr'LTT=rOT0FGCALL XHCHPNc0 TO 1M
s CALL XHCHrN1- 0ACHcN=(PFDrHT*(HCHfN** 0))
OTCHEN=0ACHPN/HC,HEM
DDINT ?0%0,TCHFoD'LTTHCHCN,0ACHEN7Y0 C^DMAT(1H nT CHrN =10.5,14H OT PDFVIOUS =r1c.5*
1 QH H CHEN =F10.qo 2H NUC FLUX CHFN-BFRGLES=t10.5)Ic(ARSF(nTrHFN-0CLTT)-0.05) 40,40,20
20 nFLTT=DTCH NG3 TO 5
4 A MAX=40n00r7%CALL XPADIP (PADIUS-PADMAX) 50,50,60
6h CALL NFLUX2S0 CO'!TINUF
P""AA=rFXP' /)ACHPNCC=CFXAO/OADFNGDELTFN={POWRP-(POWPRT-DOWFDA))/FLMASS
1 4DOTKT 'AfmenrlcLTrN9RMAnACC2 FADMAT(40H nPLTA rNTHALPY ANNULAR TPANS TO LOCAL =F9.2,
1 37H LOCAL FLUX CVED FLUX FOR NUCLFATION=F8o2,2 13H PATIO DENG =F8.2)CONTINUFOETUON
SUrnOUTINF LONUCFCeO"ON NTURFS MCHADcTUBE,0ATInMD1AINSVOLTSAMDSENTHNFLMASSs1 DOFSD,flFSINPPFSOTPFSDP,TSDDP0LOCAXLNGTHSHUNTMPo2 OMrFXFNFDXDMcFCXFNFPXFNSIN,0UALINPOWFRTARFAFLeAREAIS,I 0UALOLSATLPSATLDOnWERRDSLROLCFXAVGCFXLOXeJLOCATtKX,4DFAqDOWRXFNLOXFNSLOXUALOXMFFYDMEFG,POWO0,ONEOVMr CSLPN ,0NFMS0,SIGNZAPGZFACMIBFACDLRCFXBOst Y,A FACTVIPOWcDYCFXLOYENLOYFNSLOY,0UALOYFACTDL7COrNSTDSCqDTL9ZFTAPLNGTHJUULOCATCOSABK#SINABKeIt
A rXTPAA, XT9ARFXTPACFXTRAO, rXTRAFFXTPAF,40M-F5OFMEcRPFNLABNSL0,0UALO8,EXTRAGEXTRAHEXTRAIFXTRAJ
C04snN 0UALIAsC.LT0,TKINCH,1D,oX,rL"1( L"?Cf'LM3,COLM4,SUMCOLPHIYNTCTSCGSURZSUMOSUMI,7SUc2,S7LJ,1SUM4,SUrNOMEGAD,0MGAPGMULTPSUOL*TVISCLsVOLSPL*ENO'VnLSnGehUALn49eOEAtDANBoLDENFODFNFG~eENS0eOUALOe0VSDL09DVSPGOv4GTToDMOMO3GRMTDVLSPLDVLSPG,TERM1,TERM2,TEr.M3,TERM4,GGASDT5nVTSCL,PrYMUJ)AFRACTDFFACTVFLOC,GDOFSDPGMLTGPDFTDGROMTGRDTOT,6R ,OAVAC,'TAVCSC,PAVCHVALUENFACTUNBMAOADBHAOAArILMTKYPLUS,7TAUWALFYPLUSGFIL,GLOENTDCLIQ,PCLFNTDUMMYADUMMY,UMMYC
CON"InNl NouTHCONfDFCHENtSCHEN.1VISCGoC(PLIeOSURFTL,
1XTT,SATo,5MALLTOFLTVDTWALLHCHF&NHMACHMMICeQYMLONFLUX,? PONUMRBFPGHT ,HDFHDFNGOADFNGDTnFNC,,OELTTOACHENIOTCHFNRA0MAXenflLTFN,PAOUSCC,0D0FFCALL XXTTCALL SATTMDCALL VISCO'CALL XTHCOM
004900050000510005200053000540170550005600057000580005000060000610006200063000640006500066000670006800069000700007100072n00730007400075000760007700078000790
0081000820
.000100002000030000400005000060000700008000090001000011000120001300014000150001600017000180001900020000210002200023000240002500026000270
CALL XCPLIOCALL XSURFTCALL FVAPFNCALL SDFCVGCALL SPECVLPRNUMA= CPLIQ*VISCL/THCONDA =(P***0234)51W=A/(2.30-A)BERGHT*((1.0/(15.6*(P**1.156)))**SUM1)REYNUM=(GTnT*DIAINS)/(12.0*VISCL)HDB=0 .023*THCOND*(12*0/DIAINS)*(REYNUM**0.8)*(PRNUMB**0.4)HDFNG=365*HDP/(XTT**0.5)R=(2o30/(2.30-A))OADEN6=(BERGHT*(HDENG** B))DTDENG*QADFNG/HOCNGPRINT 100,HDENGOAOFNGDTDFNG
100 FORMAT(9H H DFNG =E15.5,25H NUCL FLUX DENG-IERGLES =F15.5,1 24H TWALL MINUS TSAT DENG =E15.5)DELTT=DTDENGCALL XHCHFNGO TO 10
5 CALL XHCHFN10 OACHFN=(RERGHT*(HCHFN** R))
DTCHEN=OACHPN/HCHENPRINT 200,DTCHENDELTTHCHEN*OACHFN
200 FORMAT(10H DT CHFN =eFO.5,14H DT PPFVIOUS xF10.59,1 qH H CHEN =E1O.5, 23H NUC FLUX CHEN-8FRGLES=r10.5)IF(ABSFtDTCHFN-DcLTT)-0.05) 40,40,20
?0 DELTT=DTCHFNSO TO 5
40 RADMAX=0000575CALL XRADIF (RADIUS-RAIMAX) 50,50,60
60 CALL NFLUX250 CONTINUE
IF(ABSF(MSHAPF-1)) 900,905,900900 IF(ABSF(MSHAPE-2)) 010,P15,010910 IF(ABSF(MSHAPF-3)) 920,905,920920 IF(ABSF(MSHAPF-4)) 925,905,925925 IF(ABSF(MSHAPF-5)) 930,915,930930 IF(ABSF(MSHAPF-6)) Q409915,940940 IF(ABSF(MSHADC-7)) 915,915,915
905 BMAOA=CFXLOX/OACHENCC=CFXLOX/OADENGDELTEN=(POWERX-(POWFOT-POWERA))/FLMASSGO TO 1000
015 BMA0A=CFXLOY/OACHENCC=CFXLOY/nADFNGDELTENO(POWEPY-(POWFDT-POWFDA))/FLMASS
1000 PRINT 3000ODFLTFNRMAOAtCC3000 FORMAT(40H DELTA ENTHALPY ANNULAR TRANS TO LOCAL =F9.2,
1 37H LOCAL FLUX OVEP FLUX FOR NUCLFATION=FS.2,2 13H RATIO DFNG =FA62)RFTURNFN)
SURPOUTINF XRADCOMMON NTUBESMSHAPE TUBERATIOMDIAINSVOLTSAMPSENTHINFLMASS
1 DRESPPRESINPQESOT RESDPTSDPB0LOCAXLNGTNSHUNTM.De2 DMFFXENF0XDMEFGXFNFGDXENSINOUALINPOWFo',AEAFLA9FAIS3 OUALOLSATLPSATLPOWERBPSLBOLCFXAVGCFXLO;.,JLOCATKX,4PBREAKPOWFRX FNLOXENSLOXOQUALOX ,Oe&MFYDMFFGYePOWOOONFOVM,
00210002900030000310003200033000340
0036000370003800039000400004100042000430004400045000460004700048000490005000051000520005300054000550005600057000580*059f0006000061000620I0063000640006500066000670006900069000700007100072000730007400074n0076000770007A000700oAPO
0081000R7n
00010000200000000400005000060
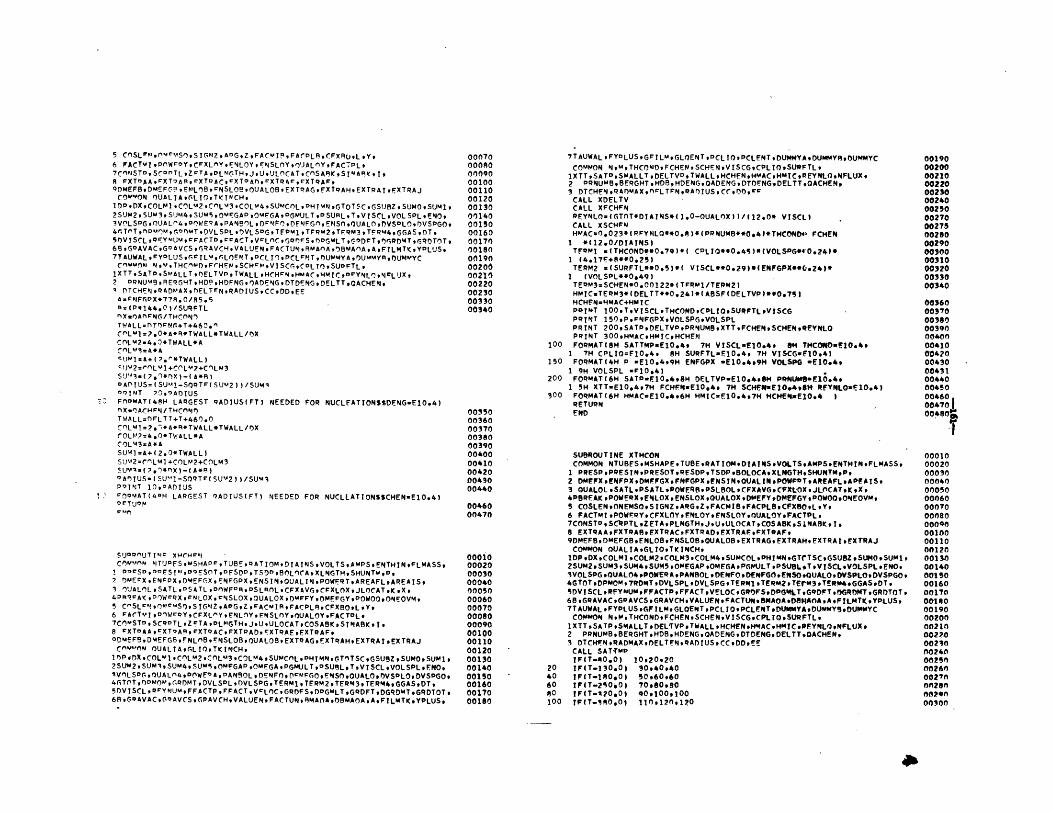
5 CnSt I, 4MSI)STCZAGZFACkI9,FArPLP~rFXRUL .V.6, FACTYI n YCXMPFL~rSO9)J~)tA7L
9 PXT"AArXT"AP, TA#XT~*XP~*XQg
COM"ON 0UALIAOLCTI(IN'CH,I DPDXCOLM1 9CO)LM2 #CnLm3,COLm4tSUMCMLO14IMNqG TOT 5CGSURZ ,SUMO, SUM 1,2S
1JM2,SUM 3951JM4, SUM59OMFGAP 90M EGAQ0GMULT vPSURtL TvV IS CL PVOLSPL# ENO9
I VCLSDG ,OJAL('4,D0eWEP A ,PANBL9DrONFGOE0MS~roO~nUALOVSDLOr)VSOGO,
6B 5AVACtGP AVCS IR A VCHV ALUEN 9FACTURMA)A 9r35MA(nA9A PFTLMTK ,VVLUS,7TAUWAL *FYOLUS gr I LmILFFT 90CL 10* PCLrNT 9LMMY A qUMMYR,0UMMYC
CnmMOlnI NM4,T14CMD,FrH4FPSCHMVISCOCDLT(OSUoFTL,I XTT#SA TO. SMALLT 9 EL TVoTWALL NCHFN,MAC,4!C'flPyNLONMLUX2 DPNUM5,RERGL4THD9,HDFNGs,0ADENGDTDFNGDELTT0AC4ENI OTCHENRADMAXorFLTFNRArIUSCCDDEEA=FNFt,DX*77A.0/85. 5Q (P*1j44,fl I/SURFTL
T WAL L=M0T rNS+ T+46 0.CLM1=2.0*A*R*TWALL*TWALL/r)X
CoLM2w4,o)*TWALL*A
84. 1 &+( '*T WALL), tJv2P0Lm I 4rCLM2,?C)LM3SU'J I-( 2.'*rX)-(A* R)OAr' IUS=(SU AI-.S0RTr(SUm2 I)/SUMI
7ZFMOMAT(4SH LARGEST qADIUSIFTI NEEDED FOR NUCLFATIONSSDENG.E1Oo4)nX=OAC4rN / THCnf)TWALL=nFlLTT+T.460.0CnLmI=2$!*h*R*TWALL*TWALL/O)XC OLN? =4* 0 * TW ALL * ACOLM3=A*ASUM01=A.( 2.0*TWALLlstum2=rO)LMI +COLM2e.COLM3
UYOlv( 7o1*nX)-C A *R)P An US= (SU'll-SOQTP( SUV2 ))/SUM3
clQMAT(40H LARGEST PADIUS(FT) NEEDED FOR NUCLLATIONSSC4EN.E1O*4)OrTUO M
S5U'~UTI~lc Xwrckl~Cl~wkAf~m NTUQFS ,MSHAP~,TUBE,0ATIOMDIAINS ,VOLTSAMPSENTHINFLMASSv
1 D?3sD ,flDFSIM ,ESOTIFSDTS)DoLCAXLNGTHSHUNTMo,2 O)MFPXENI0xDMEFGXPNFGPXENSIN,0UALINP0WF1TAREAFLAREAIS,I 0UIALO)LSATLDSATL,~nWFORDSLROLCFXAVG,(FXLnXJL0CATKX,4DRAcA ,WXoL0XFNSNSL,0UAL0XDmFFYsMEFGYogp0W0,0N0V
6 PACTYIlowroVCFXLf'YENLOYFNSLnY,0UAL0.YFACToL 17COmSTOSCROTLZeTADLMIGTHjUUL(CAT,CSA,K,SINABKI,
8 PXTOAA~rXT.,ARFXTQACFXTPADvrXTRAEEXTRAF IQ0MEF5,DMEFGBFNLelBFNSL08,OUAL0BEXTQAGEXTRAHEXTRA ,EXTRAJ
Cf2mMN OUALIAtrLIOTKINC4,InP ADXCOLMCO)Lm2,CnLM*3,COLm4,SUMCOLDHIMN,TMTSCGSUZSUMOSUM,2SUPM2,SUM~,SUM4,SUmI,~mFGAPOmFGAPGMUJLTDSUILTVISCLVOLSPLFNO#3VOILSD,OUAL(I490(WF1A ,DAN9OL ,DENF0,tAFYCl,FNES0,0UALO,0)VSDL0,DVSDGO*4OTOTODMOMo,rDMTDVLSPLD)VLSPGTERM1 ,TERM2,TERM3,TERM4,GGASDT,5Dv ISCLR OY MUM vFFACTP oFFACT oVcL()C GRDFSo DO6MLT *GQDFT tDGRDMT oGRDT0T 96R9C.RAVACCZPAVCSC,PAVCHVALUENFACTUNFMA0A,0)BMAOAAFILMTK.YPLUSo
00070OOORO00)090001000011000120001300114000150001600017f)00180061900020600211300220002300033000340
00350003600037000380003900040000410004200043000440
0046000470
000100002000030000400005000060000700005000090001000011000120001300014000150001600017000180
COMMON MmTHCOND, FC14EN.SCHEN ,VISCGCPLIO.SUQETL,1XTTSATOSNALLT ,DELTVOTWALLHCHFNHMAC.HMICPEYNLO.MFLUX2 0RNUMBBERGHT,140B.HDENGOADENGDTOFNGOETTOAC4EN93 DTC1ENRAnMAXnLTFNQAlIUSCCI)OCCALL XDELTVCALL XFC14FNPEYNLO.(GTOT*DIAINS*(1.0-0UALOX)lhh12.0* VISCI)CALL XSC14FNHMAC.O.023*EPFYNLQ**0.R)*(PPNUMB**04)*TCND- FCHEN1 *(12*0/DIAINS)TFQM1 *tTHCOND*0o791*( C0LIQ**0o45)*(VOLSPGf09241#1 (4o17F+A**0*25)TERM2 u(SURFTL#*095I*( VISCL**0.29)*(ENFGPX**0*24)*1 (VOLSPL**0*49)TEQM3=SCNEFN*0.00122,( TFRYI/TERM2IHMIC.TERM3*(DELTT**0.24)*(ADSF(DELTVP)**0975114CHFN=HMAC+4M ICPOINT 100,TVISCLTHCOND.CbLI0,SURFTLVySCGPRINT 150#PtFNFGPXgV0LSPGoV0LSPLPRINT 209A~DLV9RU~X~FH~SHR4YtPRINT 300,14MACoHMICHCHEN
100 FOQMAT18H SATTftPmE1O.4, 714 VISCL*EIO*4, 9" T14COOO06O491 7H4 CPLIO=F1O.4, SH SURFTL-EIO.4v 714 VISCGwE1O*41
150 FORMAT(4 P wE1O.499H ENFGPX =E1O.4.99M VOLSPG *E10*491 914 VOLSPL .F1O*4)
200 FORMATION SATP-FIO.49BH DELTVP=ElO&4S14 PRMUM~mFlO.491 514 XTT.ElO,474 FCH4FNaEl004* 7H4 SC14ENwElO.40BH RfYMgLO*ElOo4)
300 FORMAT(ON HMACcElO.4964 1MIC=EIOo4s74 "C14EIO4RETURNFWD
SUSAOUITINE XTHCONCOMMON NTUBFSP4SHAPETUBERAT 1M0MDAINSVOLTS.ANPSENTMINFLMASS,1 PRESPPRESINPRESOTRSDPTSDPBOLOCAXLMGTfi4S4UNTM#P,2 DMEFX.ENFPX.DMFFGXFNFGPX .ENSIN,0UALlN,-POVPRT,-AREAFLAPFAIS3 OUALOLSATL.PSATLROWER5PSLBOLCFXAVG.CI(LXsJLCAT*,I(4PSREAK .POWERX .ENLOX *ENSLOX ,OUALOX .D9EFY .D*EFGY .POWOO.ONEOVM,S C0SLENONEMSO.SIGNZARGZFACM18,FACPL8.CFXBOLy,6 FACTMI ,POWFRYCFXLOYFNL0YFNSLOYOJALOY.FACTPL,7CONSTOSCltPTLvZ ETA* PLNGTHtJUtULflCAT* COS ASK #S INASK*It8 EXTQAAFXTRAREXTRACFXTRA~OEXTRAFFXTRAP,9DMEFODMEFGB.ENLOBfNSLOBOUALBEXTRAGEXTRA4,EXTRAIEXTRAJCOMMION OUALIAGLIOTKIMCH,10PDXCOLMI .COLM2,COILM3,COLM4,SUMCOLPHMNGTTSCGSUZS240.SU1,2SUM2,SUM3,SUM4,SUM5,OMEGAP ,OMEGA.PGMbULT ,PSIBL.TVISCLVOLSPL.ENO,IV0LSRG.0UAL04pO)WERAPAMR0OL ,ENFO.DEN#FGO.ENSO.OUALO.OVSRLODVSPGO#4GTOT.DPMOM,7ROMTDVLSPLDVLSPG.TERMI ,TERmZ.TEFM3,TE#M4.#GGASOT,SDVJSCL.RFYNUMoFACTPFFACTVLOCGFSDGLT,6qDFT.00R0NT.GROTTo68,GRAVACGRAVCSGRAVCNVALUENFACTUNBAAD,4A0AAFI~TKXYp1US,7TAUWAL ,FYPLUS.GiFILM.GLOENTPCLI0,PCLEMT.DUMqYA.0UMAY5.0UPOMYCCOMMON NMTHCONDFCHENSC14ENVISCGCPLIO.SURFTL,IXTTSATPSMALLTDELTVP.TWALL14C1EN.NNAC.14NICsRFYNLOMFLUX#2 PRNUM8,BERGHT ,HDBNDENGOADENGDTDENGOELTTOACHEN,I DTC1FNRADMAX.OELTFNRAnIUSCC,0DPEE
CALL SAT~mPIFIT-90.0) 10920920
20 IFIT-130,01 50,4094040 IF(T-IRO0I0 509609060 IFIT-2%O00 70.00m0 IF(T-170*OI 90.100,100100 IF(T-IM0.01 110,120,120
0019000200002100022000230002400025000270002750020002900030000310003200033000340
8036000370003800039000"0o00410004200043000431004400045000460004701I004s0lI
00010000200003000040000500006000070000800009000100O001100012000130n00140601 s000160001700014000190002000021000220002310ft024000250)0"26100027000t2800029m00300

TF(T-SSO#01 11091209120
TF(T-f)QO*O$ 11091409140TF(T-610*0 1409WPI60
TF(T-6SOs0) 1709170#190CPLIO =1.000
DFTU9N -
('PLTO =(l.r5F-4*T)+,Q76OFTUON
('PLIO =(7.SP'F-4*T)+.(341QVTUQN
COLTO =(6.61F-4*T)+*823Q-FTUPN
CPLTO -(Iq.GF-4*T)+.516QFTURNCPLIO =(?4sAF-4*T)-*056RETURN
CPLTO =(406nF-4*T)-,S90OFTURN
COLTn =(66.67F-4*T)-7.rO01rTUONCOLIn -(lQ0.0F-4*T)-70,24RPTUPN
(7PLIf) =2.0 QRPTURNrNn
jF4T-c;1(),0) l2n91409140
TF(T-rqMO) 1AM91A09160
TF(T-6(ln*O) 17091AMlptoTF(T-6rn.0) 100970r)0200
jr(T-6qO.Ol 7109210020THCONr)-(o70nE-l*T)+.302QlrTU0PlTHCnN-n=(*4P6F-l*T)+.115QFTUQNTHCOND=(.266F-3*T)+.3426
QFTUN
THCnNf)=(onPl4F-I*T)+.376DFTUqNTH mNn-,iQAO
PFTUQNTHCe)Nf)=(-.lS09F-l*T)+.447fZFTUPNTH('nMD-(-.!18E-I*T)+.504RETURNTHCnND=(-.4q6F-3*T)+.5974017TUONTHCnNr)=(-.64sF-i*T)+.6849
RCTORNTHrr)Nn=(-.01jF-!*T)+.8S04PuTUQNTHre)Mn=(-I.SP-l*T)+1.2?Dv!TUQP-jTHCONf)=.1854
DrTUQNFNn
0031000320no3io003400035t)0036001n31n003800039000400n04100047-n004100044000450004600047000480004qO0050000510ODS200051000540005500056000570"5800059000600
0001000020noolit)000400005000060000700008000090001000011000120oolso001400015000160nol7o00180001900020000210002200023000240002so00260002700028000290
00320"S"00,340.onsso-00960003""I"
0042f)004,400044000405fl00460004""48P
M144hOolqnn(InSinm" 74100,5100054f)ftoS>nmmq6n
nnninooonjn o 0,3 ow00040000006f)onoTnW)"Mofifoy)n4)lf)nOftin001 2p001,50n0140001150001600017000180nnlQn002"002100022000230002400025004.760
"27000PRO,f)02qoMinn010 13 1 a"32f)003"00IJ4000351)00160
SUPqOUTINF XSUPPTCOMMON NTUBFStMSHAPF*TUBEtRATIOMsDIAINS#VOLTS#At4PSgENTMIN*fLMASS9
I PRESP*PRESIN#PPESOT*PESDPtTSDP*BOLOCAsXLNGTHgSHUNTMiPt2 DMEFXtENFPXtDMEFGXoFNFGPX*FNSTN90UAtINPPOWER-OAREAFL*AREAISvI OUALOL#SATL*PSATL#POWFRB#PSLBOL*CFXAVG#CFXLO;.*JtOCATPKvXt
4PSRrAKgPOWFPXtENLOXtENSLOXPOLJAL( X#DMEFY#D*EFGY#P4lWnOtONFOVM#5 COSLENtONEMSO#SIGN-ZtAPGtZtFACM189FACPLBPCFXB(,*L#Yt6 FACTM19POWFRYoCFXLOYtENLOYgENSLOY#f)UALOY*FA'CtPL*7CONSTPgSCRPTLOZFTA#PLNGTHoJoUgULOCATOCC)SAB*v4lNA9K*tt
8 FXTRAA#FXTRABPFXTRACtFXTRA09FXTRAFtFXTRAF#qDMFFB*DMFFGA*FNL089FNSLOB*OUALOB*E-XTPAG*PXTitAH#EXTRAI*FXTRAJCOMMON 0UALTAtGLIQ9TKINCH#
I D P 9 DX 9 C 0 L M I # C 0 L M 2 9 C OL m 19 CO L M 4 v SUMCOL *ON T014 &.G TM T SC 0 GSW wSUROv S U?41 92SUM2#SUM39SUM4#SUMS94IMEGAPtOMFGA*PGM(JLT#PSUSL#TtVTSCLeVnLSOLvENOt
IVOLSPGoOLIAL049POWERAPPANBOL*DFNFO*DENFGfltf-MS09,QU4LOPDVSPLOeDVS*60946TOToDPMOM*GRDMTgDVLSPLtDVLSPG*TERMI*TERM29TE*M3*TEPIM4*GGASobT%snVTSCL*REYNUM*PFACTP*FFACTtVELOCvGRDFS*DDG14Lt#GRt)FT906RDMT*GIRDTOT96R9GRAVACtGRAVCS*GRAVCHtVALUEN*FACTUNtSMAOA*r)BMAOAtAtFTLMTKPYPLUSt7TAUWALgFYPLUSoGFILM#GLOENT*PCLTOiPCLENT*f)U"YA#DIJM"YA*n'UMMYC
COMMON NoMoTHCONDPFCHEMoSCHEN#VISCC,*CPLIO#SiJRFTtt1XTT*SATPtSMALLTPnFLTVP#TWALL#HCHFN*HMAC;HMTC*PFYNLO#NFLUX#2 ORNUMBoSERGHTtHDB#HDENG#GADENG*DTDENGtDJELTTvGAC41EN93 nTCHFN*RADMAXoDELTFNtRADIUS*CCPDD*EE
IF(D-1000.01 S95*105 CONTINUE
SUml=+6.12254629+1-1.2677020IF-I*P+2.8126518F-S*(P*P)I -Io74Q4A56F-S*(P*P*P) +6o88R0190F-8*(P*P*P*P)2 -1,717R005F-10*(P**S) +2.8461426F-I3*4P**6)I -3*0063SI4F-I6*(P**7) +1o9734415E-I9*(P**S)4 -7.314<)007E-71*(P**Q) +1.168qQ72E-?6*(P**10)SURFTL=SUMl*2*?4F-6*2o54*1?sOPFTURN
10 CALL SATTMPIF(T-610*0) 1591SP20
15 SUMl-33e8-(6o4S*LOGF(T)SUPFTL-FXPF(SUMI)
SURROUTINE XCPLIO
LTMTTS ON THIS SUARnUTTNP ARF 12 nFG F (CPLTO =1.000)ANn 6so nFr. F ICPLTO =P.OQI nATA FROM WFLLMAN THFSIS
CnVk4nN NTUPPStMSHAPFtTUBEvRATTOMgDTATNS*VOLTS*AMPS*ENTHTN*FLMASStI POF509PRFSTM90MPSnT*PFSDD*TSDPtBnLnCA*XLNGTHgSHUNTMtPg7 nmFFXorNF?)XtnMFP6X9PMF6PX*PNSTNtOUALINgpnWFRT*ARFAFLgARFATS9
I nUALnL*SATL905ATL*OOWFRBPPSLSOLtCFXAVGtCFXLOXPJLOCATtKgXt409PPAK90t'Wc'OXgFMLOX*PNSLOX90UALnXgDMFFYtOMEF6Y9POWOO9ONFOVM9
9 CnSLPNtmmrmSO9')IG 'ZtAPGtZtFACulRoFACPLR*CFXBOtLtyg6 FArTmy.POWPRYtCFXLOYgENLOYtENSLOY90UALOYoFACTPL
I7COflISTDtSrRPTLgZFTAgOLNGTHtJtUtULOCATgCOSASKPSINASK#Tt
R FXTOAAgFXTDAPvrXTqACoPXTRADtFXTRAr*F-XTRAFtQOYrFRor)MrFrPFNLoE'tPNSLOBtOUALOB*FXTPAG*FXTRAHPEXTRATtEXTRAJ
Cnm*A0lll MUALTAqGLIllvTv INCH*IDPoDXgCOLM-ltCC'Lm29COLm39COLm4oSUMCOLoPHIMN*GTOTSCgGSUBZtSUMOtSUM19ISU"?*SUMI*SU44vSUM59IMFGAP90mc'GA*PGMULTtPSUBLPT*VTSCLoVOLSPL*ENOtIVnLSDG90UALn4onnWEOAPPANBnLoDFMFntDFNFGn#ENSntOUALn#nVSPL09DVSPGOP4r.TMT*nDmn'PronmTsDVLSPL*DVLSPS*TrPml#TrO"29TFOM39TPPM4*GGASgDT9g;nVTSC'LR rYfklt!%AtFPACT09FFACTtVFLOC*SPnFSoDPGwLT*GRDFT*r)GRDMToGRDTOT*6FkPCRAVACoriRAVCS*rRAVCHtVALUFN#FACTUNgBMAOA*DIMAOAtAoFILMTKtYPLUSt7TAUWALtFYPLUStGFILMgGLOENT*PrLTOoPCL NT#DUMMYAtDUMMYRoDUMMYC
Cn"MON NoMoTHrONDtFCHFNtSCHFNtVTSCGPCPLI09SURWTLP1XTTgSATPoSMALLTonFLTVPgTWALLoHCHENgHMACPHMIcorFYNLO*NFLUX9
2 DOVUMS#PFPGHtgHDBoHDFNGtnADENGgOTnFNGoDELTTPOACHFN*I nTCHFNtPAnMAXPDrLTPI'tQAnTUS#CConDgcc
rALL SAT-Tmo
TF(T-140*n) 1'00971)
70 TF(T-740,-) 1094"940
41 TF(T-170,n) re) A n 960An TP(T-4Snonl 7nonqn
01) fc(T-Annnj om$innjnn

2SUM2#SUM3#SUM49SUMS904EGAP*OMFtAtPOMULTePSI)OLT*VTSCLoVOLSPL*LrftOo
3VOLSPG POUAL04 9 POWER A 9PANBOL #DENFO*Dw$tfO*FRSO*GfJAL090VSPLC $DVSPGOO
46TOTonPmOmgGRDMT.DVLSPL#DVLSDGPTEPMI#Yf"?oT"PloTE*t44*GGAS*DTt50VTSCL*RCYNUVgFFACT09CFACT#VWLOC#GOTWSvDPttOt'T*Cl*DFT#M**Mt*GRDTOTo69 v GO AVAC 9 GO AVCS 9GRAVCHoVALUEReFACTLIN#BMAOAo8St4A*A *A#? tLMTK*YPtUS9
7TAUWAL#FYDLUStnFTLM*-LOFNT90CLT09PCLFNT*DLPW A*OUVW15vWWWVCCnv"nM N9moTHC0M0qFCHFM9SCHEN , VISCG#CPLT0vSU0rTL9
IXTToSATD#SMALLTonFLTVPvTWALL*HCMENt-4"At*M$41C*IwIFYI#LCI**FLUX9
2 DPNUM09BEOGHToHD99HDENG*OADENG*DTDENG*DELTTP(IAC""*3 OTCHVN#QADMAXtnF!LTFM90ADTUSgCCtDD#FFCALL SATTMOGSURZx(T-32*O)/1o8CALL SPFCVAIF (T-SOOsOl ItAtIO
5 COLMI =2.I?1 OF-4*(GSU8Z*GSUi Z)rOLM? -lIRAftoO-(KoQO*GSU8Zl)/VOLSP9rMLY1 saft*07n+(o%2827*GsU8Z)VISCn-2o4IQF-4*(COLmS +COLMIPCTURN
Ili SUVI= 4.70*SnPTF(TITFQMIw-30,0/TSUMI wI0oO**TlFPMl
SUM2 =100+ f7fi0O.0/T)*SUMlTrQm2=s0Q06/VOLSPf,SUM5-((I0.OO**TFOm2) -loOlSUM4 vI.5*SUM5VISCGx2.4IOF-l*(( SUMI/SUM?)+lSUR4)RETURNF4D
SUqPOUTT4F XnFLTVCOMMON ?#TUBF3910SMAPF*TUSE*RATtO"*DIAIMS*VOLTSAMPS*EMTHINeFLMASS-9I PqFSP*DRFSTN*OQESOToRESDP*tST)Po SOLOCA*XLXGTMpSMNTIAPO#2 DVEFXgERFPX96VEFGXtEIWGPXtf$tSIR#GUALTN#VGW"T#*REAFLoAREAIS9I OUALOL*SATLtPSATLvPOWEROrPSLBOLICIrXAV(',04CVXLOX#JtCCAT#I(ioXt4013ltFAltoPe WF*XtfNLOX*FNSLOX*OUALOX#"EPYOMWF6V#POWoO*OW-OVMO5 COSLENgnWFMSnoSTGNZtAOG*ZtFACMIBoFACPLR*CFXSO*L#yo6 CACTV It OOWrOY of VXL('kY 9 VNLOY 9 FNSLOY ofsUALIDY 0AC Tot#7CMNSTP*SCqPTLoZETA#DLN4GTHoitUoULOCAT*COSASKPSTNARK919-I EXTRA At FXTPAF 9 FXTRAC 9 FXTRAD9 FXTRAFtEXTOAF 9OnMFP9.nMFFgQoFNLMB*FMSLO99OUALng#EXTOAG*F'XTRAM*FXTRATtFXTRAJCnYMOM OUALTA#GLT09TKTNCH*
lr)P#DXtCOLM19COLM29COLM3#COLM49SUMCOL#PHIMM9(;TOTSCvGSUSZ*SIJM095UM192SUM29SUM3oSUM49sumstOMP-GAP90MOGAiPGMULTPSURLoTPVTSCLeVOLSPL#cNOtIVnLS069OUALO49PnWERA#DANSOL90FMFntDFNFG09ENSO*()t)ALOgnVSC)Logr)VSD(,no4GTnT*DPMOM*GDDMT*DVLSPLtDVLSPG*TEWMITECIA29TEON39TEQm4vGGASoDT9SnV I SCL *REY MUM* FFACTP 9 FFACT 9VFLOC 9GODFS'9!)PGI*L T oGRDFT 0641wT 9 GRI)TO To689GRAVACoGRAVCSgGRAVCHPVALUENtFACTUM984AOA*OBMAOAPAtFILMTKoYOLUSt7TAUWALPFYPLUS*GFIL"oCLOENT*PCLIGoPCLVMTtntn4wyAo-DU*4MYR913U'MMYCCnMmnN NvMtTHCI)NOPFCHFMPSCHEMPVISCGgCPLlnt$VPFTL*
ix TT -SATO *SMALLT 9 DELTVO9 TWALL vHCHENvH"AC wHmTCvrFYNL09RFLUX 92 ORNUM89SERGHT*HD9#HDENG90ADENGtDTDENG*DELTT90ACHENo3 nTCHFNoPAr)MAX#M LTFNtPAnTusocc9nooFFCALL SATTMDTWALL*nFLTT+TTxTWALLCALL XSATPCALL SATTMPOFLTVPw(SATP-P)*144mORETURNFRO
00140001900,0160M170"too00190002000021000220002so"240002se642600027000211000290"I""310101320103,40m"13,443MM144n
noisnn4115'sOnl6qnfl'371)
004"
0 10 110qf)m3nOan4n0010,30nnnfinOmn7r)Ot)nqnonne.100100nni IlOnl2t)mf) 136t)t) 14Mnol smon 16 r)00 17000181)nOIQ0On2ff)OM21000220WinM674mmfiltimnm?6nm 0 2 7 0)mo?"m0412"0030n(Mi 10
1037010,480
(101"0004on00410
00010000200003000040Oonso000600007000080,00090001000011000120001,30001400015000160001700010000190002000021000270002300024000250002604027"0"2800029000300M0,5100032000330003400035000360001170t)MIR190f)A'q a ft
1300100002000030000400003000060000700008000090001000011000120Oki I so
QFTUON
20 SUV1*61.6 -(!I.I*LnrF(T) I5'JOFTLwFXOc( SyJml ICPCTIJO44Eton
SURROUTINP XSATOCMMMnN MTUOES*MSHAPF*TUBE*QATIOMoDIATNSoVOLTStAMPS*FNTMTN99LMASS9
I C)Ocspgoocstsloof:prs')TtVSDPoTSr PtQnLOCAoXLNGTH*SHUMTk4,o,
7 nmrgXtEMFDXPI)MFPGX9P4Fr-PXvFMST 19OUALTM*POWCOTgAQFAFLoAlZEATS9
I nUALnLtSATL90SATL90^WrOQ90SL9mL#CFXAVSoCFXLI)X*JLOCATo-KoXt4PqPCAK 9 Pr)W POX 9 PNLOX 9 C l SL-_X 9 QUALOX 9 O',*rFY 9M*AFFGY 900'dOfl 9ONFOVm 99 Cn5LE49ONEVS19SIGP'ZtA*GgZoFAC*ql9tFACPLB*CFXBO*LoYt6 FACTultDOWFOYtC XLnytENILOY9,;7NSLf)ytO'JAL'IY*FACTPLo
7comSTo.SCOOTL#ZrTA90LIIGTHoitUoULnCAT*COSABK*STNASKPlo8 FXTOAAvFXTQAR#cXTOACvFXTPADtrXTQA=vPXTOAFs9mMcF@ 9 DMEFG9 wgNLOS 9 FMSLOR 9 OU ALn8 9 EX TOAG sf!XTRAH t EXTRA I vFXTRAJC11"MON 0UALIA9GLI()vTKTNCHvInDtDXC,)L','ItCf)LmtCe)L'A39COL'P4*SUMCnL*OHTIAN*GTO'rSCoGSUSZOSUMOOSUMIO? SJ%42 9SUM3 9 SUM4 9 SUM5 90"FGAP 90MEGA #PGMUL T 9PSUAL 9T 9V TSCL 9VOLSPL *ENO vIVOLSDG*OUALn49DOWEPAtPAPIBOLtDEMFO*DENFG09ENS09GUAL09DVSPL09DVSPGOt4f'T^T noun" nor)MT 9 DVL SOL 9DVL5PG 9 TFPmI 9 TFOM2 9TEOM3 9 TEQM49GGASoDT 9
9' VISCLooc-y"UAtFFACTC)gFt:ACTgVcLnC#G*nFS*nPGMLToGOOFToDGRDMT96RDTOTO6:49,--QAVAC9'04VCS9' RAVCHoVALUPN*FACTLN90MAOAtDBMAOA*AgFTLMTKtYPLUSt
7TAJWALgFYDLUStGrTL"tnLOFVTtPCL109PCtrMT#DUMMYAoDUMmyggnUmmYCP lomTHCMKIDPFC'HE'495r-HENtVISCr,,CPLI09SURFTLe
1 XTT #SATO* SvALLT 9 nELTVP9TWALLq#4CHENqHKAC 9"MlCqQFYNL(,)oNFLUX 97 DP4U"098 -PGHTtHD59HDFNG*OADFNG*DTDFNG#DELTT90ACHER9'A r)T'HF1,49OAr)'IAXor cLT N#qADJUS*CC*f)f)tCF
rnLml=647.27+?73.16
S"ALLT=C"LvI-CnL"?<11"4 vlnA.1plve (T-70nrl 159,5910<111AI =j.1)+(Sk4ALLT*2.I878462F-3SUM7 el,7417A14+ (SvALLT*5*86m?6F-3) +(SmALLT*SMALLT*
',mALLT*i - i7nll?ar-o)1^ Tm Is;
511,11 =1.-+(SmALLT*I.37Q448IE-Z)SU1,17 =1014611117 +(SMALLT*4.14113P-21*((SAAl_'_T**2)*7.5IS4R4E-4) +((SmALLT**4)*6o56444E-I1)
S'JQOllUTINr XVTSCrCnllwnN NTUBES*k'SHAPEtTUBE*RATIOMoDIAINStVOLTS9At4PStENTHIN*FLMASS9
I DOVSDDcrSlkloocSmTvOFSDOtTSnOtAnLMrA*XLmOTH*SHUNTMoPt
? nktrFxolrAtcoxnk4CFnXrflCrPXPNSTN*f)'JALTNtOnW$:9T9APFAFLoARFATSPI ')UALOLwSATLtPSATL*O()*ROR89PSLI I'L#CFXAVC*CFXLOXgJLOCATgKtxo40R*VAI *PmWrOXPCNLC'XtVNSLrxtO'JALOXtf)MFFYgf MPFGY*POWO(390W-OVMvA r StrMt"PIE"SmoSTG"ZgAQntZgFACOTRoPACPL99CFXROtLoYo6 FACTMT901WPnY*CPXLMY99NLOYtON5LOYtf)UALOYoFACTDL97Cn ,STDSCQOTL*ZFTA90LNCTH*j*U*ULnCAT*COSASK*STNABK*lo
q rXTOAAtrXTOAPtPXTOAr.cxTOADtrXTPAFtCXTQAFPar %4cc!j . n'lr7 9 FMLnB *FPISLO? 90UALOB 9 EXTQAG 9FXTRAM* EXTRA I 9EXTRAJ
('C""ICN ')JALIA9GL1Q9TKIMCH9InOvDXvCnLmltCmLml*CML'AltCf)LU49SUmCOL90HIAONtCTnTSCoGSUBZtSL)MOtSUM19

I XTT95ATPtSMALLTo DEL TVP*TWALL #HCHFN9HmACvHM I Ctf eYNLQPNPLUX 92 DRNUk'BPBERGHT#HDB*HDENGtOADENG#DTDENGPOELTT90ACHEN#3 r)TCHFNtRADMAXvDFLTFNPRAnTUSoCCPnD*FFCALL XXTTnn=l*O/XTT
TF(DO-610) 1092097,IFfDr)-,31) 10940941
TF(DD-lo5) 50960960IF(Dn-1000*0) 70970PAO
FCHFN-1#0RETURNFCHFN=2*17*(DD**.316)RETURNFCHEN.2*785*(DD**9561)
RFTURNFCHFN=2.511*(DD**.716)RFTURN
FHCHFN=344.0PRINT Q09FCHFN
FORMAT(48H OUALOX(J/XTT)TOO LARGE EXCEEDS ALLOWED LIMITS =EIO.4)RETURNEND
0023000240002500026000270002800OZ9000300
00320003300034000350003600037000380flO39O
0041000420
00010000700001000040000500006000070Oman06"00000100010 11000120T0013000140
"150OO16m00170001400019t)002on(m7 I n"220n0230
-0024000250002-6000770nOppmftoomf#&InnnO31 nno,57n"llkin#IM'q4nnn1vinInO36f)00370"6134m
SURPOUTTM- XXTTCnmme)N mTURrStm ,HADroTUBE#OATIr)MgDIAIM59VOLTS#AMPS*FNTHTNtFLMASS9I DPFSDoPPFSINoDPFSOTgPFSDOtTSDPPBOLnCAXLNGTH#SHUNTM90,
7 DMFFXgFNFDXsDMPFGXgrMFGDX*ENSTN*OUALINvDOWCRT*APEAfLoAPEATSP'A nuALnLSATLgPSATLgPOWPR99PSLPOL*CFXAVG*CFXLOX#JLOCATtKtXo
4P90FAKgPnWr':'XvFNLOX9 NSLOX*OtJALOXgDMEFYor)MFFGYgPOW0090NEOVM9
5 CnSLFN90NCMSOoSIG9Z9APGgZg:7ACMTP*rACPLBgCFXBO*Lgyt6 PArTmTtPOWrPY*CFXLOYtrNLOYgFNSLOY90UALOYtFACTPL97CnMSTPtSCPPTLtZPTAtPLNGTHoJoUtULOCATgCOSABK*SIMABKvTg8 FXTPAAtFXTPAPgFXTOACgFXTRADgFXTRAFgrXTPAFtOr)k4FFP9 k4rc'PtrmLnBtP ISLOrItnUALf)BoFXTOAGvPXTIAHgFXTPA19PXTRAJCO lv)M ' UALIAtGLI09TWINCHq
110 9 DX t re)Lt'l tCnLM2 tCf)Lm3 vCOLM4 9SUMCOL 9 PHI VN qGTnTSCqGSUFZ 9 S',JM0qSUMl 9,25(JM295UMItSUM49SUK59OMFGAPtOMFGAtOCmULTtPSURL*TgVTSCLgVOLSPLoFN09
lVf)LSDrgf)UAL049P()WEPA*DANSr)Lgf)FNIF')tD' IFC-O#FNSOte)UALOor)VSDL09r)VSPGOt4nTt)T#DDmr '19GOOkATtDVLSDL90VLSDGPTEPml9TEPm2tTEPM39TFPM49rGA59DT9
rDVISCLPPFYNUvg FACT09FFACTgVFLOCgGIPDFSODPGMLT*GRDFTof)GRI)MTtGPDTOT96RtrPAVACtGPAVC' 9GRAVCHoVALUENgFACTUNoRMAOA*I)BMAOAtAgFILMTKtYPLUSt7TALJWALoFY'3LU5*CFIL'49CLOENToPCLY090CLFPIT-gnUMMYAoDUMMYR*f)UMMYC
('n"MMki K, 9"oTHCC)klr)gFCHEt,195CHF 19VISC'CioCDLT09SURcTLoIXTTI-',AlDgS"ALLTgDFLTVDgTWALLtHCHFNgHIIACoHMICtOFYNLOoNFLUX92 nQNUMB#RFPr-HTtHDPoH')FNGtOAr)cNC39OTDcNGtr)ELTT*OACHFN9I DTrHPN90ADMAXgDCLTCNsPADIUSoCCgDDorE
rTt-VTI =(((JonnC-OUALoX)/OUALOX)***Q)rALL q0PCVn
rALL ,PFrVLY0LU5=((V()L50L/Vf'LSmG)**.9)rALL VTsr),;rALL XVTqrr
TAUlqAL=((VTS(7L/VTSCr)***l)D"TkIT 1")t')LIALt)XoFTLMTK*YPLU!;tTAUWAL
Fnr)MAT(OH n'JALr)X =r7lf".491')H OUAL RATIO **.() F10.4011OW rDVnl- DATTO **.S =rlC.4920H VTSCOS PATIO **.I =FIO#4)XTT=FTLMTW'AYPLU,*TAUWALr'rTI)r>Ilr rl r,
93UBPOUTINE XFCHFN
LT'*TTS ON TWIS SURPOUTINF ARP 1/XTT GRFATER THAN .1(FGQFrATFP THANI,!) Afk1r) (l.n/XTT) LESS THAN 100(F LESS THAN 70)CnmmnKl NTURFS91ASHAPFgTUBFgPATInMgf)IATN59VOLTStAt4PStENTHINtFLMASS9
I POCSnP3rSINIor31Zc'Sr)TpOcSD09T',r)D*BOLOCA#XLNGTH*SHUNTMoPq7 n'4PFXgFNFDXt)MPFGXorMC'C-PX91:NSINte)UALINwPOWERToAPFAFLoAPFAISsI ()IJALOLoSATLPPSATL9POWC"BgDSLROL*CFXAVG9('FXLr)X*JLOCAT*K*Xt
4PSRPAK#Pr)WFPX9PNLOXoFNSLOX*OUALOXPI)MCFYgDMEFr)YoPIOWOQ*ONFOVM9
S CISLr Ng)P!'kSO95IG'IZPAPG*ZgFACMIB*FACPL99CFXBO*LtYt6 FACTK$Ttor"4cPYtCFXLC)YgF ILOYoPNSLOY9')UALOYoFACTPL#7CONSTngSC'30TLPZETA90LNGTHoJoUgULOCAToCOSABK*STNABK#loA FXTOAAtcXTOAQ# XTRACtrXTRAntFXTRAFgFXTqAFtOn'ArFBoDmrFrRg' MLM99PNSLnIgOUAL')BoFXTOAG*FXTRAHPEXTqAT#FXTRAJCOMMON OUALTAtriL109TKI ICH9lr)PoDXgCOL',AIVC('LIA29Cr',L'iloCOLM49SUMCOLPPHI A.MoGTOTSCgGSUBZtSUMOPSUMls7S'J'129SU"39S-'J"49SUIA590k'EGAD90*,IEC-AgDG"ULT*PSUBL9T9Vl5CLoVOLSPLoENOPIV',ILSDCigOUALn49PC'WEI-'AtPANPOLtDENF09VENFG09ENS09OUALOtl)VSPLO#DVSPGO94(',TnTgnnkgl-lgnllf)MT*DVLSPLgnVLSDGPTCDVloTERI 429TEOV3*TERM4*CiGAS#DTP';I)VISCL#QFYIIU'lorFACTP*FrACT*VPLOCgGRDCSPDPGMLTgGRDFT*DGRDMT9GRDTOTo61 9GRAVACor, ,AVCStGRAVC'igVALUc'NoFACTUN98MAOA*DBMAOA*AOFILMTKgYPLUSt
7TAUWALvFyrLU59CFIL149CLOI !TgOCL109DCLrNT#nUM*AYAgDUP4'AYetf)UMMYC
C""MON NglAoTHCn'lntcCHC'k'95('HckltVTSCrorPLI09SURI-TL9
OomlO0002,0000300004000050000600007000109000090001000011000120OC11300014000150001600017000180001900020000210002200023000240002130002600027000280n029000300009100092000330OOS40"35000160
000100040200003f)0004000050000600007000080000900010000110001200013000140001500016000170001800029000200
0021000220
2n40
60
50
70
80
90
SUBROUTINE XSCHFNC LIMITS ON THIS SUBROUTINE ARE FF GREATER THAN 2F+& (So.90)
C AND FF LFSS THAN JF+6 (S-ol)COMMON NTUBES 9MSHAPE s TUBE s RAT TOM #D I AIMS *VOLTS sA*PS-9fMTMtJN *FLMASS 9I PRESPtPRESTNoPRFSOT*RESDP*TSDP#BGLOCA*XLNGT)49SMUNTIM#Pt2 DMEFXPENFPXgDMEfGXoENFGPXtENSTN*OUALINPPOWVRT4AREWLtAREATS#3 OUALOL*SATL#PSATL#POWER6905LBOLgCFXAVGgCFXL'OX*JLnCAT*K#Xv4PAPFAK*PnWFPXtFNLDXoFNSLnXtOUALOX#f)MFFY9f5?4FFlriYovfmmvcmroVm*5 COSLEN90MEMSOoSTGMZ#APGgZtFACMIRtFACPLB#CFXBM*L#Yv6 FACTM19POWFPY*CFXLOYoFNLOYtENSLOY90UALOY*FACTPLo7CONSTP95CQDTLtZETAtOLNGTHgJgUtULOCAT#COSABKPSTNABKPTv8 EXTRAAtFXTPARtFXTRACgFXTPAD*EXTRAE*FXTRAFtqDMEF89DMEFG89ENLOBoFNSLOBgMUALOB*EXTRAG*FXTRAMsEXTRATtEXTRAJCOMMON OUALIA*GLTQPTKINCH9,
IDPtDX#COLMI#COLM2#COLM39COLM4*SUMCC)L*PHIMN*GTfTSC96SUBZ*"09SLNIP2SUM29SUM39SUM49SUM5vf)MEGAD*OdE(;AO'PGMULT#PSUBL*TvVISCL*VMLSPLvENOt
3VOLSPG90UAL04*POWERA#PANSOLoDENFO*DPNFGG*FNSO*Oi)AL09DVSPL090VSPGOo4GTOTtDPMOMtGPDMT*DVLSPL*DVLSPGwTERMI*TERM?#TErmitTERM4vGGASPDTv
5DVTSCLtRE.YNUMoFFACTP9FFACToVELOC*GVDFS*DPCMLTfGRDFTnCRDMToGAnTOTo6BtGRAVACtGPAVCS*GRAVCH#VALUFN*FACTUN#RMAOA#F)Plt*AOAtAvclLMTK#YPLUSO7TAUWALPFYPLUS*GFTLM#GLoENTPPCLTO*PCLFMT*T)UMMYJ,*nUmt4Yiv-49f)ttMMYCCOMMON Nom*THCONDtFCHEM*SCHFNoVISCGtCPLY09SUR TLo
IXTTtSATPPSMALLTgDELTVP*TWALLtHCHEN*MMACgHMICPFYNLO*NFLUXP
2 PRNUMBgBFRGHT#HD59HDENG*OADENGtDTDENGot ELTTOACHEN#3 DTCHENtRAT)MAXof)ELTFNvRADIUSoCCgDDFFEE=IFCHEN**1.23)*REYNLO
IF(FF-20000,O) 10#20,2070 IF(FE-70000*01 10940940
40 TF(FF-450000,n) 5096096010 SCHEN-. 80
QFTURN30 SCHEN-6*I5/fEF**.204)
QFTURNso SCHFNw4800.0/(Pr**.A?5)
QFTURN60 SCMEN=.10
RETURN
FNn

00370t)n,4Rnnf)39()0040000410M147f)-0 () 4100044f)MM45MtIM46nnf)47n00480004-9000500n05IOWts2nmnrinOn'54(Tne) 1; 1; m0#1560nf)571)M-1 5 AMWon()(W)mM0610M062M0 0 614 0MM64n
nt)66na0067nM6 Ftnjmm6cevMn7Mf%nnllnMM77n0071M0074tl00713000160nM77MMM7AMMM7()n001ROOmnqin008 70mnqlmnMR4nnnqsinnnnfinqM97nr)nspnMnAqnr)oqnnmmqlnnmc)?mnnov)nm94nnn9rOOM06n00070onq'sof)moqf)
i CALL LnNUCF
4 rALL SPFC*VLnVLSPL=VCLSPLrALL PFrVGnVLSPG-VOLSPATPPtAj=((DVLSPG/nVLSPL)**.3ql)
GGAS=OUALOX*nTOT
SLIm=fl.01-nUALnX)*rTOTTrPAft7=1600,n/(mVL5Pn*rnAS)
CALL qATTMPCALL VTSCMS
nVTSCL=VTSrLI)T=TDEYNUM.(GTOT*nTATNS)/(DVISrL*12.0)TF(RrYNUM-2500.0)595910
5 FFACTP=16*0/RFYNUMGO TO 15
10 lrFACTD=0o046/(PVYNUM**0-7)Is F$:ACT=4*0*FFACTD
VFLnr=(GTOT*nVLSDL)/16nO.Oror)FS=(-FFArT*VPLOC*VELOC)/(7.0*'A2*2*(DTAINS/17.0)*nVLSPL)
CALL MNPrRDDPGMLT=A6SF(PGMULT)GQDFT.A0DFS*f)PGMLT
IF(FXTRAJ-Oor)) 21921#21
21 nrRnP4Tm-ASSc ( MtAMYA)nO TO 28
21 CALL HOMMrD
nGRnMT=-AAS9(GPDMT)28 TF(nnQnMT+0QT)0O.0) 26926927
26 On4nmT=0.02T CONTTNUP24 GPnTOT=rQnPT+nGRnMT
R=(DTATNS/I2*0)/2.0nPAVAr=32.pGQAVCS=32.ZPOINT 1009DDGMLToDGqDMT*GRDFToGRDTOT
PRINT 1Iq9AAAS#fLTOPRINT 1209DVLSPLtDVLSPGtDT*nVISCL
PRINT 1309PEYNUM#FFACToVELOCo-CPDFSoFFACTPTERM3wSORTF(ASSF((GPDTOT*B*37o2*nVLSPL)/2*0))TF(-GPDTOT-(GRAVAC/(GRAVCS*DVLSPL))) 25920#20
20 VALUFN-0*0-nO TO 10
?s VALUFN=-0.11110 TEOM4=((GRAVAC/(GRAVCS*DVLSPL*(-GPDTOT)))**VALUEN)
FACTUN=TFRMI*TFPm2*TFRm3*TFq"4PRINT I359TERMIvTERM2vTERMlTERM4
CALL UNTVr'RDRMAOA=RMAOAAzR*(1.00-A9SF(n9MAOA)
FlLmTK-BMAOA*RTKTNCH=12.0*FTL#ATKTAUWAL=(F;/700)*(-GPMTOT-(IoOO-((A*Al/(S*R)))*(r*AVAr/(nQAVrS*MVL15PL)))
YPLUSe((R-A)/(DVLSPL*DVISCL))*(SORTF(TAUWAL*nVLSPL*4ol7-+8)1TFfYPLUS-s*1)4nv4nql5
35 TF(Y0LUS-l0o0)45*4ci#5040 FYDLU5=Oo50*YPLUS*YPLUS
60 TO 55
45 FYOLUS-17.5-(1.09*YPLUS)+(5.0*YPLUS*LOGF(YPLUS))GO TO 55
vO FYDLUS-(IoO*YPLUS)+(P.S*YPLUS*LOGF(YPLUS))-64*0
S9 CFILMx(2oO*DVISrL*FYPLUS)/g
GLnFNT-GLTO-GFTLM
SUPRnUTINF NFLUX?CO"MON NTURFSoMSHAPF*TUBFgPATIOMgDIAINStVOLTSgAMPS#ENTHTNgFLMASS9
I PPPS09OPFSTNgPPFSnToDFSD"PT5DDvRnLe)CA*XLPlIC3THtSHLINT"goo7 F)IAFFXtrMPDX*r'MPFGXP NrrOXPPNSINgOUALTNPPC 'cPToARcAFL*ADFATS#
I OUALOLgSATL*PSATLgDOArrlpgDSLQr'LgCFXAVC39(7FXLoXoJLOCATYKtXt4D RQFAK 9 DOV. COX 9 FKIL(X 9 FNSLOX 90 UALOX 9 J)'AFFY s DMFFGY s OnW()O 9 OKIF OVM s
5 COSLEN,()NE'ASr)oSIG )ZtARGgZoFACMTBtFACPLBoCFXBOPL*Yt6 FACThToPn'IcOyg,-PXLAYgFNLCYtP ISLOY91)IJALOYoFACTPLP7('nNSTPtSCOl'TL97FTAtDLKIGTHtJPU'oULr'CATgCOSABK9')INABK#lg8 EXTQAAgPXTOAPYrXTOAC* XTRAY)tFXTRArPFXTPAFPODYFFB*D.'AFFrEt NL059FNSLOBPOUALI BgEXTRAGgFXTQAIIoFXTRAltrXTRAJ
CO""OM -lUALTA9(*Lll)vTKlNCHvInPtDxgr')L"IgrOL',12prr'LN'39COLk'49SUk'Cf)LgPHTAANPCTOTSCorsupzgsumotsumlo2 SUM? 9 YJAl 9 YJM4, r Uvr) #O#AFrAD 90yrCA 9 PGMULT PPSURL 9 T 9V T SCLtVnLSPL vFNOqIVOLSOnvOUALC49Pf)'tiE" IA#PANRILgDrNF09DFNFGOPFNIS(Dg I)IJALOgnVSPLOiDVSPGOt4rToTon0m()MnvnmTtDVLSPL9DVLSPG*TFOMIgTERM29TFqM39TFPM4sGGA5,DT9
9r)VISCL90FYNUMgFFACTPPFFACTtVFLCCtGQDFSP()Pf:MLTtr-ODFT91"lrlqnMTPGPDTOTO6E9CPAVACtGRAVC59C-RAVCHtVALUENgFACTUNtFMAOAPDBriAOAgAtFILMTKoYPLUSP7TAUWAL9FVDLIJ59GFIL'!tCLOENTPnCL109PCLFNTr)UIIMYADU AMYStf,)UMMYC
119119THCr)PInoFCHE 19SCHEN19VISCGgCPLI09SURFTLIIXTTgSAT095"ALLTgDFLTVDtTWALLtHCHENo.HMACgHMIC90FYNLQNFLUX9') PRNUMBgBERGHTgHDLloHDENGtOAD NGtDTDrNGDELTT90ACHEN*
I r)TCHPNtPAnYAXinPLTc'M*OADTIJSgCConn*cF11 c T U P NI
C M r)
qtJPDnLJTTNF ;7TLMPPrnmh4nk, NiTUPFStk4SHAPFgTUBFiDATIOMtr)IATNSPVOLTS*AMPSoENITHINFLMASS9DoreDIDOPSTKIDPFSOTPPSDP*TSDP990LOCA#XLNGTHgSHUP4TMoPy
I 011 'PXgFNcOXoDVFFGXtPNFGPXtFNSIN90UALINtPOWP-RToARFAFLtAPFAIStI nALnLtATLvPSATLgPnWEPBPPSL8()L#CFXAVG*CFXLnxJLOCATtKoXt
4OPP -AKtD')WFDXtEML(-)XtFNISLOXPOUALOXPDMEFYgDMEFGY*POW009(,INEOVM#
r^SLP"gr)'lc"Sr)gSTr-NZgAPGPZtFAC ITPPArPLRtCFX90*LgygA ;:A('TMTgr)!',-'rDYi.CFXLnygFNLnYorK4SLOYP(*iUALOYoFACTOL97rnK'STPSrPPTLgZcTAtPLNrTHvJtUgULOCAT*COSABKtSTNABK919q PXTOAAg XTOAngFXTOACgcXTOAD9 XTOAFgFXTqAFtr)r)MFFRn-PFr-ErNLOBP NSLOBtl)UALOBgFXTRAGgEXTRAHEXTRA19FXTRAJ
COW4r'N ClJALTA9GL10qTKjNCH9lr)Dv-')Xg(,'r'L'IloCrILM2#CnLt,439COL"4o5U"CCLtDHl"NoGTOTSCoGSU13Z#SUMOPSUMls7cUM29' U"19EIJ-'4,SU l',*nVPGAD901AF(.A9f3CiMULT90SU-RLOTgVISCLOVOLSOLtENOP
IVILSDrg()kJALn49D')'.%'F"AoPAM'30LPDFNFntDFkt Gf)9ENS09OUALr)tDVSDLOPDVSPGOt4rT'Tt')n ,*r "or-O'IlTtDVLSPLDVLSPGgTERM19TERY2#TEPM19TERM4*GGASODTOr -,VT -CL9'-"y 't,"'grrACTPgFFACTgVELOCgGPDF59DPGMLTtGPDFTer)CiRDMToGRDTOTtA *'PAVAC*r .IAVC59'7P VrH#VALUFN*;:ACTUNPBMA()A#DBMAOAtAgrlLMTKtYPLUS*7TA'J't,']kL*; y"[,US*C-rTL'19GLOFNIT90CLT(ItnCLrNT#r'UIYYA90UMMYStMUMMYC
I X T T v c A-Ovc'4ALLTtnFLTVDgT'."ALLgHCHFNPHMArtHMT('trPYNLO#MFLUX#
2 Dokl'J ,IR991 0CHT,4,)RH)FN'jt()ADENGtDTDrNCvnFLTT90ACHENOI DTCHPNtPAD IAXtf)FLT NtOADIIJSPCC*DDoEF
TC(AP F(Plc AOc-jj) 9019015,900
C),- TP(AQSP(MSYADc-7)) 01090159qlo01, Q2090099020
02' TF(AQ5P(lASHAP--4)) 9259905#925Q79; jF(A9,F(MSHAPr-S)) 01C.Q15*910
01' TF(ARSP(MSHADP-6)) Q4090IS904004- IF(ARSP(MSWAPF-7)) Q15,915015
015 TF(D()'4COY-l *m) 19197
TF(D0-lrPX-l% ') 1 91 9
rAt L mr)M(IrF
rm Tm lpn
TC(nU0iL)X-n'-)Al TA) Itool,-A
ono3oO004n000500006000070O00RO00090O0I()n0011000120001300014000150OM16000170001800019000195
nemin00020OM3000040000500006000070000900009000100001100012000130001400015000160001700018000190nn2mo00210002200021000240on2so00 2600027000280002,0000300on3if)0032000114mMt)33500340

0CLI10rLT/mTOTC(LrT=LOcNT/rOL If)
60 FXTQAJ.$)UALMX70 FYTOAT-=0VLSDG
FX TO AmH0VL LPOT41T 1409VALUFM9FACTUN1*ri8kAt)A001"T I19TAUWAL9YPLUS*FYDL1JSOOTNT 161,TX~INCH9GFILvvGLOPNTOPTNT 17 -'c(LI(0.vCLPNT
I~ rO'lATflH )PCmLT uF8.1910H fOGQDmT =FB.1*lOH GRO)FT =F8.19IIIH rPITOT =F9.1)
11~ FOOMATITH- rC065 =IPFIO.398H GLIO =lPFE10.3)12', FoDUAT(OH OVLSDL =FP.4,11H DVLSPG =FS.497H DT =F8.29
1I 1
H O)VISrL =PlP.1)1'2 F'
1'"AT 1
0H "FYNUMA =10178.291nH FFACT =OPF8SslOH VELOC =F8.29
11'H GQ'IFS =FP.7911H FPACTP =FS.8,)1 1 nONAT7(81 TFPMTl =F1O.499H Tr-RM2 =Fl0.699H TFRM3 =F10.39
I Ow TFPMq4 =9~1n.41114- FOOMAT(91- VALUPN =PS.3911H FACTUN =F8.4911H DBP4AOA =F8.4)
I 1 FrOMATIgH TAUWAL =F10.2901- YPLUS =IPEIO.3911H FYPLUS =1PE10.3)16' POY'AT(OH T'(INCH =F1O.6,GH GFILM =IPEI.Os.2,IH GL0O'NT =1PE1O.2)117, FOMAT(?,H PEPCFNT LIOUID OF TOTAL =F1O.29
I 4AH OFPCFmgT O)F LIOUID FLnW WHICH IS FNTRAINFD =F~o.2)
QIIDNIT 1c
r'OArN1 kTURFS5,USHAPFTUBEPATIOMDTINSVOLTSAMPSFNTHINFLMASSIP"CSPtPPFSINoDPPSOT ,RESOPTSOROLOCA.XLNGTHSHUNTMP,
I '"A-XFNFDX,0~m FGXFNIFGPXONSINOUALIN.POWFPTAPFAFLApEAIS9'
0JALOL ,5ATLDS&TL,DO)4F'8,OSLR(OLCFXAVGCFXLONJLOCATK ,X,
4nDA POW,'MLXF:IIXISLXUALOXtr)MFFY0.1FFV,'POWOOONFOVM*K rnSLc,)Nc45O,SION7,A'PGZFACMIgFACPL0.CFX8OLY,
A A(Tml,DO~kiQYCFXLYNLoYI1 ISLO)YOUALOYFACTPL,,7rO%"6TosrmDTt,ZcTAPL(,THjJILoCATCnSA8KS7NA8KPy,R EXTTAAFXTOAP, FXTPArFXT7AO,'7XT8AFFXTQAF,
~C'tMnik nUALIATLI'',TKINCH9
1I1~,X,OLM1,C0LM2.COLMA3,C0Ll4,SUV'COLPHIMANGTUjTSCGSU8ZSUM0,SUM1,";P,'g-JM,39Su*449,sJ1
4N,9OYFOA~1,OFAPGmULTPSUPtLTVISCLVOILSPLFN0,
lXvrM S'0 , 'L~-4!rt''~DAl"Ln~l*FCOE~tvUL9)SLoVP
A4rIAA ,0,kroPAVCHVALUcN,'ACTU9,oRMAOAoDMAOAAFILTK(YPLUS,
'ThN'-"&LFYDLU5,1 L,rLEITOCL10,PCLFNT1)UMVPYADUMM8UMYRumC(f'V'~nki kt, TH('n-, FCHcN1SCHNVSCG9COL 1oS5OFTL,
7 "'14IJ'4R9PtF'~rHT H =9i~krt~~e'-,rT)N o):T *AH~
rTnTFLMAS' /AmcArL
1 ( (fVLSDL*I1.OO-OUAL0)X.OUALOX*ID)VLSPri/DVLSPL)I)12-rrXT'AH*(1.l'-FXTQAJFXTqAJ*IFXTQAI/EXTRAH)) I
!F(MHAP-4) 8,610
r0 TO% 15
I' Tr IMSMADPT-)OTf 1191 ,11
14 ZrTA=J
f01000flIolO01020fl103nM1040101050)
07106001070011080010OQ00110001110011200)11300114001153001160
01117010118001190012000121001 220012210101240012530
0001000200003000040n0005000060n000700001110
01009000)1000011000120001300014000150001600017000160
*001 90002000021000220002,300024000250002600027000280002900030000310003200013010034000350
IUMMYSAZFTA/8*0
n0 TO 1816 O)UMMAYR=Y-IXLN0TH-SCODTL+PLNGTH11
00O TO IS11 1=2
OUMMYgk= I18 GRnMT.O)PmOm/(DU4MYB/12.O)
DO1MT ?0,O)UM%YRFXTDAJEXTQAIFXT9AH20 FOQMAT(QH nummyn =rf6.2927H O'JALOX COMTPOI. VOL INLFT -Ffi.2,
I )7H 0)VLSOr, CONTOOL VOL INLET =FR*4t227H OVLSPL rONTP(OL VOL INLICT -F8.4)8 TUR NFNrI
SUPPOUTImir ORImOmCOMMON NTUBWSMSHAPETU8ERATIOMOIAINSVOLTSA4PSENTMINFLMASS,1 PRFSPPPFSINPRFSOTRESDPTSDPBOLOCAXLNGTH.SH4UNTMP,2 0)MEFX ,ENFPXOMEFGX, FNFGPXENSINOUALINPOWE1TAREAFLtAAEAISvI OUALOLSATLDSATLPOWFRROSLROLCFXAVO,7CFXLtOXJLOCATt ,X.4PBFAKPOWFXFLOXFJSLOXOUALOXOF4PY?)EGYROWOOtW4FOVM8 COSLFN ,ONFMSOSIGNZ ,AOGZ FACMIIFACPLRCFXROLY,6 FACTMI ,POWFPYCFXLOYENLOYENSLOYOUALOYFACTPL,7COpNSTPSCRPTLZFTAPLNGTHjsUULOCATCOSABKSINA!KI,8 EXTPAAFXTRAREXTDACEXTRADgrXTRAFXT2AF,Q0M5FBDMEFC.8,ENLOBrNSL08,OUALOBEXTRAGFXTQAHEXTRAIFXTRAJCO"'MON OUALIAvGLIOoT(INCH9lDPDXCOLM1,COLM2,COLM3,COLM4,SUMCOLPHIM4NGTOTSCGSU0sZ,51M0,SUMl,2SUM2,SUM3,SUM4,SUM5.OMFGAPO0AF0APoMULTDSU8LTVISCL.VOLSPLFN0,SVOLSPOOUALAOOA'FTPAPAN8OL ,OFNFOOFNFGOFNSOOUJALOIIVSDLOO VSPGO.4GTOTOPMOMGROmTDVLSPLOVLSPGTFRM1,TFPM2,TFQM3,TFRM4SGGASoT,SOVTSCL ,QFYNUMFFACTPFFACT VL~GnSDPmTGO~DGQM#OTT68 .GRAVAC ,CPAVCS ,ORAVCHVALUENFACTUNBMAOA08'AOAAFILmTK.YPLUS,7TAUWALFYPLUS.GFILM.GLOENTPCLT0.PCFNTOUMMYADUMMqY~siUMMYCFNnxENTHIN+(PM1WFPT/FL"ASS)P-PPESOTCALL LIOENnFNFO=ENFPXCALL VVAPFMnrNFPOFPNFSPXENS0mIENO-DENFOOUALO=E NSO /ODFGOCALL SPFCVL
O V SRLOuVOL SPLCALL SPFCVGnVSPGO=VOL 50(C'TOT*FLMASS/APFAFLDPMOM.( ((TOT*(TOT*DVSPLOI/4.17-+8I*I 11.OO-OUALOl+(OUALO*(OVSPGO/OV
OLJMMYA= (-DPMOM ) IIX LNGTH/12.O IPRINT 17S#OUMMYA
175 FORMAT138H DGRmT BASED ON LINEAR MOM GRADIFfT -FlZ.1DRPT URN
SURROUTINF MNPGROC LIMITS ON TNlE APPLICATION OF THIS SUBROUTINE ARE 7OPERCENT OUAL!TY
C 1 AND 2500 PSIA PPESSURFCOMMON NTUBESMSHAPFTUBERATIOMOIAINS ,VOLTSAMP$.ENTHINFLMASS,
I PRESDPRESIN.P8!SOTRFSDPTSopBOLCAXLGTHSHJNT#p,
00358010360003,7001038000390M0400004100042017043)(1M0440
410450004610047A
0001000020000,30000)400005000060)0007000080000000010000110001200013000140001 5;1
0010000200002100022()00230001240)00?50002610MU27000280n02*000300)00110
f10110
M036M
00010000200"wi00004000050

5 CnSLENtONFMSO*STGPfZPAQGtZtFACk4T99FA(70LBoCl XFtUoLtYt
6 FACTmltPnWCPY*CFXLI)YgcNLOYoFNSLOY*OUALOYPFAC7PLO7CONSTP 9SCRPTL 9Z FTA #DLNGTH 9J 9U vULOCAT 9COS ASK vS INABK 1, To
8 FXTRAA*EXTRAStEXTRACtEXTRAD*EXTRAE#FXTRAFt9nMEFBoDMEFGB#ENLOBtENSLOBtOUALOBPEXTRAG#EXTRAH*EXTRATtEXTRAJCOMMON QUALtAtGLI09TKINCH9IDPtDXoCOLM19COLM20CMLM39COL"4*SU*ACOL#OHIIRN*GTOTSC#GSURZoSUMD#SUM192SUM29SUM39SUM49SUM59MMEGA09-mEGA*PGVULTtPSLML#TOVTSCLYVOLSPL*FNO%IVOLSDG*OUALn4#DnWEDA#PAMOnL#DF"Fm*nP*h C7f)vgt*snt()UALr)tf)VSDLO*I)VSPGtlt
4GTnT*DPMOMoGODMTtDVLSPL9DVLSDG*TrRmitTERk429TERM39TSRM49GGAStOToSDVTSCL*REYNUmoFFACTP#FFACTtVFLOC*,riRnFS*DPC,14LT9C7PDFT*DGRDMTtGRDTOTP6R9GRAVACgGRAVCStGRAVCH*VALUENgFACTVN*BMAI:)AP"MACAvAsFTL'ATK*YPLUS97TAUWAL#FYDLUSoGFILmoGLOENToDCLI(loPCLFAIT*I)tJf4mYA-*DU-YR*DU OIIYC
r POP N=O QFFFR TO FTGURC 6 GCAP4615
C FOR N=-06131 PFFFQ TO FTGUPP 7 AVAP 4,611
TF4FACTUN-o25O) ?910930
2 IF (VALUFN - OeO) 7097
7 IF (FACTUN-*046) 2500tlO9 IF(FACTUN-903nl 209595
5 RMAOA=+#942161079-1-6734404659*1*FACTAJR+.IR20*540F+I*fFACTUN**2)I -. 13413306F+4*(FACTUN**!) -. 559767*?E+3*(FA-CTijt4**4)
2 +*4Q52436jF+S*(FACTUN**S) -*IR569717F+6*(FACTUN**6)
3 -956878640F+' *(FACTUN**71 +*730454ftlS+7*tF*CTUN**6l
4 -*102364661F+P*(FACTUN**91 +*362f)510nr+9*(lFACTtW**I0)5 -*13312636E+q*(FACTUN**lli -*44616646E+9*4fACTUN**12)
6 +*682%6456F+10*tFACTUN**Il) -*192S9604E+11*fFAtTUN**I4)
7 +.127456OqE+11*(FACTUN**15)GO TO 35
10 PMAOAw09?oQ0137F-l -*I13RR2??F2*FACTVN +08794q9?F3*(FACTUN**2)
I -o487T6P5694*(FACTUN**3) +*I9313986E5*(FACTV%**4)
2 +.667QQArFA*(FACTUN**r) -*I?06724RV6*(WACTUN**6)
1 -#';11P74A7r7*(FACTUN**7) +.?041?94lrR*(FACTU%**R)
GO TO 15
20 PMAOA=.On22GO TO 15
25 PMAOA=00159GO TO 15
RMAOA-*75n35 RFTUPN
FND
SUPROUTINE SPFCVL
COVMON NTUBES#MSHAPToTUBE#RATTOMtDIATNStVOLTStAMPS*FNTHIN*FLMASS*
I DRESD*PPESIN*PPESOT99ESDP*TSDPOR')LnCAOXLNGTHtSHUNTMOPO2 DMFFXtF IFPXtnMFFGX* NFGPXt NSINVOUALINtPOWFPTOARFAFLoADEATS9
I OUALOL*SATL*PSATLODOWEROVPSLRnLtCFXAVG*CFXLnXPJLr)CATtKoXt4PBREAKiPOWEPX*F-NLOXtENSLOXi-QUALOXgDMEFY*DMEFGY*POWOO#ONEOVMI,5 Ct"ISLF149f)MFMSO*STGN79APGtZoFACMIBvFACnLRoCFXRO#LtYt
6 FACTMT*POWFQYoCFXLOY*FNLOYgFNSLOY*nUALtIY*FACTPL#
7CO !STP*SCPDTL*ZlrTAPPLMGTHtioUtULOCATtrOSARK*STNABKPtt8 FXTRAAtrXTQAPoFXTOAr*rXTRAOOPXTOArtcXTOAPP9DUFFB9D4EFGBOEMLMB#PMSLOB#OUALnBgFXTRAG#cXTOAHtFXTRAftrxTRAJ
COMMON 0UALIAvGLIO9TKT"CH9lDPPDX*COL*AlVCOLM2#CMLM39COLM49SUMCOttOMIAONeCvTnTSrC#GSURZ95UM09SIJMlt2SUM29SUM3*"4*SUM5*0'*EGAP*OVEGA#PGV(JLT*PSURL#T*VISCL*VOLSPLoENO*
IVOLSPG*OUAL049POWE9AsPAMBOLtDENFO*r)EMFG09ENSM*nUALO#n'/SDLOODVSPGM94G TOT 9 MPMOM oGQDmT 9 DVLStlt *f)VLSPG oTFRP*l 9 TFQ%*2 9 T'F*I*lt # TFQv4*fGAS *nT 1,
inVTSCL9Rl7YNUkl#FFACTP#FFACT#VFLMCVGQ')FS*I)PCifOLT#CODCT*F)fqnvttrPnTOTO6R#GRAVACgGRAVCSoGRAVCH*VALUFNoFACTUN#RMAOA#DSMAOA*A*FTLM TX*YPLUSv
7TAUWALPFYPLUSoGFILM*C)L()ENT*PCLIQ*PCLFNT*DUMMYA*DUIAMYqtlUMMYC
IF (0-400*0) 59 10#105 VOLSPL=166401745F-2 +2.328qO6OE-5*P -I65364501F-7*(P*Pj
000700008000090
00190
onm4f)0001in00060OOn7nWPMLinnqn
2 nmFFXVNCPXnMPFGXcNrr-PXgPMSYN*()UALTN900WFRTtADI:AFLtAPPATSs
I r)UALf)LtSATLoOSATL*DOWPPRPDSI.R')LtCFXAVG*CFXLnX*JLOCATgKtXt4PAOCAV90()W DX*rh'LnXFMSLOXtMIJALOX#r)MFFY*nMFFCYtOMWf%(i*MNFf)VM95 C(,)SLcN*r)Klr fSOtSTC,,.'7*ARCtZsFACM159FACPLPtCFXBOoLtYt6 FACT,4!tE)r)'-'Fr)YCFXLI Ytr'NLOY#FNSL')Y*OUALr'YtFACTPL97Cr)NSTOt';CPDTL*ZETA90L IGTHoJoUsULOCAT#COSABK*SINABK979
8 FXTOAA9:-XTPAPtCXTOAC, XTDAD*PXTqA'!#EXTRAFt
9DM'F5tD'!'FSEtENL()BtENbLOB90UAL099EXTRAG*EXTRAHtEXTRAI#FXTRAJ
C -1'10N rlljALIA9l3LIQ9TKTMCH%IDPtDXPCOL"19COLk429CmL A3,Cr)LM49SU4COLtPHTMNPGTOTSC*CiSUBZ95UM09SUM192FIJIItS'Jli"gSU"49S',JM590MFGAO*n'AFGAgPCik'ULTtPSUBL*TVVTSCLtVMLSPLOFMOOIVOLSPG90UAL 490014EOADA IeOLvt)F',IFC'oi)F IFGOtFMS090UAL09f)VSPLOPOVSPGOt
4riToTor)clmr"'tCl IDMTtDVLSr'LtDVLSPGPTEPk4loTEPm2tTECIM1,TERM49GGASODT9';nV15(*L9Or7Y"UM*FFACTDgFFACTtVFLnCtCiPnFSor)P(iMLTtGPDFT9nGRDMT#GPDTOTv6RtGQAVACtG* IAVCSPnRAVCHPVALU':NoFACTUN*BMAOAgDBMAOA*AoFILMTKVYPLUSO
7TAUWALFy' LUSoGrIL"*GLOENToPCLIOPOCLENTDURMYA*DUMMYS90UMMYCmo.0/1non.0 I
r0LMl=(DX)*(2.r44Rl16 -7.8896201*r)P +1.557SA70E+I*(f)0*DP)
I -i.714000fF+1*(DP*nP*DP) +l.04O9R47F+I*(DP*DP*DP*DP)
7 -1.7144A77*(DP*DP*nP*DP*DPJ +4.7484ROliE-I*(Dr*DP*DP*DP*DP*DP)I -IOA0497!P-P*(DP*nP*DP*DP*nP*DP*DP)(7()LMP -(nX*DX)*(-5qj756752F-l +1*9550200*DP -9*6886164F-l*fDP*DP)
I -4,617OC70*(nP*r)P*nD) +8.403014*( "*np*np*npi2 -5.QSA3OqP*(DP*DP*DP*DP*DP) +1*9989183*IDP*DII*DP*DP*DP*DP)
rml-ml =(nX*nX*nX)*(l.0lQ1956F-l -1.77117RSE-14,np
I -].ql2S68rc-I*(nP*np) +2*7654839*(DP*DP*DP)
2 -1.40?5A14*(nP*nP*r)P*nP) +7.12900RS*(DP*DP*DP*DP*DP)I -7,7SI497IC-]*(nP*DP*nP*DP*"*DP) +R.6j6qq47F-7*(np*np*DP*DP*OP
4 *nD*nD) Ir'NI%04=(mx*nx*nx*t)x)*(-R.060679SE-3 +(2.6160076E-2 *nP)
I +6.07A872SF-?*(0P*nP) -ls242687lF-I*fDP*DP*DP)2 +4.6551847F-I*(nP*r)P*nP*DP) -1.0311482E-I*(DP*DP*DP*nP*DD)1+0.117nRl4c-7*(nP*DP*DP*DP*DD*DP) -191021915F-2*(DP*DP*DP*DP*DP
4 *nP*nD)SUHrnL=CnLMl+COLM2+CnLm3+COLM4
PHTMN.CXPr(SUMCOL)rT"lTSr=rTnT/36n^.("TP(nTnTSr-1001.0) 595910r-SUPZ=Llr-r(Oo' M,6*STOTSC+n.2)rn Tm 15
15 SU'4n=1.4112797-1.82293q9E-5*P-4*5200014E-4*D)*(GSUBZ)+1.2278415F-4*Pl*fGSUBZ*GSUPZ)
c'l"'Am('A.r640QPAF-2 +I.rl6g;216r-4*P)*(Gsu9z*GSURZ*GSURZ)SUL4&=(2.lqAA741c-2 -1*42Q6?60E-5*P)*(GSUSZ*GSUBZ*GSUPZ*GSUBZ)
c;LJ'19=(-6*167671)6c-"-?*2820747F-5*P)1*(rsunz*nsunz*rsu! Z*MSURZ*nsupz)
nvPnAD=St)mn+SUMI+SLJM2+SUMI+SUM4+SUkf5
^-'rrA=n"crAP-1 *4Dr"ULT =n" GA*PH T.,Pl
MPT(Johl
5UrARnUTTNr UlIVcRCM&A-W IITU9rSklcHAPFTUBEDATIOMoDIAINSVOLTSpAmPStENTHINtFLMASS9
I Morsn9oogrslm*DOrSnTtPCSIO*TSDP990LOCAtXLNGTH*SHUNTMoPtly myrex0clr,)XonvFrrxt--P'rrnXtrmSlklo()UALINtPOWFP-oAQFAFL*APEAlSo
I nUALnl-#S TLoOSATL*l IWC'*oOSLPnLPCFXAVn*CFXLM:.tJLnCATtKtXt40ROWAKP^Wr'X*Pk'LnXerl'SLnXtIUALOXoDUFFY90MFFGY90OWoOtONFOVM9
0006000070()()Moo000000010000110001200013000140001500016000170001800019f)00200002100022000210002400025000260002700028000290003,0000,41000520003,30003400035000360003700038f)003000040000410M04200043000440004500046000470004sm0049000500005100052000530005400055000560M057000580nosgonf)fif)n
0002000030000400005000060

7fok'STOiSCODTL#ZFTA*DLNICTHtJg'JtULoCAT9"05ARK951 IARKwlg
8 FXTPAAocXTPAR*PXTPACoFXTPAr)oFXTPAFvcXTOAF*
9DMFFB9DMEFGF 9PNLr)Bt FNSLOE 9OUALOR #FXTPAG9 PXTRAH*rXTR A I 9FXTRAJ
COMMOIll 0UALIAqCLI09TVINCHs1DP 9DX 9 COLM I 9Cf)Lv2 9COLM3 9COLM49SUACOLt PHI IS% #,AT nTSCvGSUflZ*SUM0s SUM I*2SUM29SUk4lgSUM4#SUM590m GAP*OMFCAvPrMULT*PSLML#TiVISCLo VOLSOL*FNOa
IVOLSPS 90UAL04 *PnW ED A 9 PANA')Lv OFNFM or)FNIFGO PENS() *t)LfAL0q0vsvL04DV';PGn 94GTf)T on Pmovt GPIWT 9 DVLSPLtr)VLS Of, q TFRIA It TFPu2qTF0M4vTERV4vG GAS &OT s5nVTSCL#RrYNUM*FFACT09FFACT#VFLOCtGPDPS*r)PSMLT*CQDfT;t,$SpnfOTtGPI)TCT#6RtGRAVACsGRAVCS#GRAVCHtVALVEN#FACTUN91MAOAoDSMAOAvA#FTLMTK*YPLt)Sv
7TAUWAL oFYDLUS 9(,c TL"vrLO;:NT vPCL I OtPCLFMT vf)UM"Y At DUMklYR#nUMMYCIn TP (0-450,0) l5o2092'Irl DSURL=LOCF(J0.1*Oj
T=1.9197890E+l +2.41;Q2-88E+I*PSUSL +2ollft206Q*(OSUaL**2)
1 -1.4144740r-I*lPSUE%L**3) +1o5741647E-I*tPSU8L**41
2 +1.8658287F-l*tPSUi3t-**,6)3 +6.94OI5A0v-6*(PSU9L**8)QPTURN
2C PSUBL2=LoGF(P)T=+1.1545164P+4 -P.lP60IR7;r+l*PS USL7 +?.,477766jE+l*JPSUBL2**21
1 -1,614427IF+?*fOSUnL2**') +?.660OQ78r+I*(PSUrL2**4)'2 -7,A071PIlF-l*(PSUPL2-*5)
QPTURN
SUPROUTINP VISCOS
Cf)kAMr)N NTUOS o MSHAPP, TUBE9 RAT IOM9DI A INS 9 VOLTS*AMDS*ENTHIN 9FLMASS vI PQFSDvPPFST"90MFSnTQPSDDTSD09ROLPCAoXLNCiTHoSHUMTMopo
2 DMEFXoENFPXtDMFFC)XsF IFGPXoFNSIN90UALIN900WERTiAREAFLAREA159
I nUALt)LtSATLtDSATL9P()Wrr)RtDSLPOLtCFXAVCt('; XLr)XoJLO(7ATtKoXv
4PRPFAK*PnWFmXgFNILOXorK'SLOXPQUALOX#n"FFY#Dk4FFCYsPr"W')n*n ,IPOVM,5 CnSLFklo()NIF4SO95TC)t,)7oADGoZoFA(-MTFItFACPLRoCFXRf),PL*yt6 FACTMTsPoWFQYgrFXLnYoCNLf',YtFNISLrly*OUALOYPFACTI)-Lt7CONSTPtSCRPTLtZETAgPLNGTHoJoUgULOCATvCOSABK95TNABK*lg
8 FXTqAAoFXTRARoFXTRACtFXTRAntEXTRAF#FXTPAFtqDMPFBof)MFFMRgcNL')BtFNSLOS*OUAL009EXTPAG*PXTOAHcXTPAlgcXTqAj
COIAM()N 0UALTAvGLI0sTKINCHoIDPsDX*COLMloCOLM29COLM3sCOLm4oSUMCnLvPHTMNtTOTSCo4rSURZ*- ,tYmoos-,i 4192SUM29SUM39SUM49StJM5oOMFGAPgOMFGAoP<,1,4L)LTvPSUF'L*TvVlSC'LeVnLSPLoFNr.ltIVOLSP,*OUAL049DOWEPA#DANPOLtDENIFf)onFNI;7Gt' oFIISOoOUAL.!*I)VSDL()gnVrDCf)v4C-ToTtr)Dmom*Gof)MT9DVLSDL9r)VLSP(,oTFPMItTPOPA2*TFok4lvTFJ 'm49GGAS#DTv
5r)VISCLPPY IUM*FrACTooFrACTgVFLOCvrDf)95vf)vrk4LTtC,*nFTt;)(',01)','TsCPr'Tf)Tt69*CPAVACtGPAVCSor-PAVCHoVALUcNgFACTUN90YAnA*r)f3MA?)AsAtclL.YTV*YPLt,'St7TAUWALtFYDLUSgCPTLvgGLoEf,,Ttf3CLTOsP(-LF"'TtnUM14YA*DUk4l'YAtm )y'.4YCCALL SATTmo
TF(T-6noo) 5959109 CONTTNUF
VTSCL-R.0144599 -1.672P317F-J*T +2.0423515F-l-*tT-*T)
I -1*612466AF-r*(T*T*T) +RPSAr744F-A*(T*T*T*Tj2 -1.1ni5qAm9-In*(T*T*T*T*T) +'P.41A?4AlF-11*tT*T*T*T*T*T)I -1.44PlPl0r-15*(T*T*T*T*T*T*T) +lorQ6l9OnF-19*tT*T*T*T*T*T*T*T)
4 -lo0i'127'r-21*(T*T*T*T*T*T*T*T*T)r +2,P406114F-Pg*(T*T*T*T*T*T*T*T*T*T)RETURN
10 IF(T-642*5) 15920tO20 IF(T-675.0) 25910.1010 TF(T-6q0s0) lqol5s4m15 VISCLw&5100-.nP050*T
PFTUQN2s VISCLws6llC-&0006q*T
RETURN
35 VISCL=.qq8S-*00123*T
0on9o
o0ninnon2nm0min010040&onfvsn
nooqlmIT) I noOf') 11 non 121nn I -i () 14M10 15 1)nn160nm 1 7o)or ionon I anIn 2 .1 nrim 2m r'%n2n'IM21 n01172nnn2'Amn 0:7 41)On 75nnm7o nMn27r)00290f)f)?Of)"Illn1031f)10 3 7m
(1031M.0a3 4000150
1 +7.41rR'll 'c'-10*(P4P*P) -).' -
4 +1PrTUQN
1 VOLSPL=1.71921r4P- -l.Pl4874eF-9*(O*P)
+6.666q (F ll*(D*D*P) -2.I';17248P-17*(P*P*P*D)
PCTIJPNC7 No r)
rDrrV,
rn'Anki KIT lnr"; v'Ac;HAOc'q TUrc '.'AT I nMf r)T A INS 9VOLTS *AMPS 9 CNTHI N 9PLMASS.
I ' UALnL* ATLDSATL9DnWFQR$05LRnLtCFXAVCPCFXLOXtJLoCATKtXo/ 0=tf3;:AI(901)W--')XgPktl-OXtFNSLC'XPOUALCXoDm FYoDMEFG'YoDI)Wn(,'oOMcOVkit
) CoSLFNtr'NP' 5095IGNIZ*APGgZtFAr'AIPtFArOLBtCPXO')gLgyt6 PACTMTOP()',JPr'y$rPXLOYCNL()YtCMSL')YtOUALoYoCACTPLO7(,*')NISTDSCOPTL97CTAOPLNnTHtJvUPULnCATtCOSA KgSTNARKtTo
0 FXTOAAtPXTI IARtCXTRACcXTRAr).PXTRAPPXTPAPIODMFF119 DMPFrP, 9 NLOB 9 "'NSLOB9 ()UALr)B 9 FXTRAr* FXTPAH9 EXTRA 19 FXTRAJ
rl'vvnM QUALIA9rLT")qTKIN('H911"D o,)X 9 COL"I 9 COLM29 C(' L'03 s COLM49 SUMCOL9 PHIMN9 GT)TSCqGSUBZ 9 SUM09 SUM It
" : Ull') 9 rU'1'A 9 SUM4 9 SUA9 9 r)"FGAP 9OMr(.A 9 DG'l'JLT 9P SURL 9 T 9 V I SCL $VOL SOL 9ENOtIVnLSDronUA 4tDnWEr,)AC'A 'RoLlr)rNFODFNFGO,eNSnQIJALr)t')VSDLODDVSPG()o4rTnTr)D'An",rnnmTtDVLSDLor)VLSPCPTPDMI*TFPV29TPQMITrRNt49r. CASoDTs
r'VT-rLt*'Y'l i,49;7cACTP,;7c'ArT9VCLnCtrr)r)C'SI)DrMLTtCDf)CTonrPI)MTOCqr)ToT.69or-PAVAC*C-PAVC59'- RAVCHPVALIJFN*FAI-TUNI, IMAOA9,'),9kAOAOAgFILMTK*YPLUS,7TA1,14AL ;7yDLU5 9rF IL-, rL0E lT9PCL 109 PCLFNIT 9 r)UMK'YAtDUklk4YRtl)UMlAYC
TF (P-7"*^)V'LSPr=7s-'?76614F+I -5.2?-'nRQI*P +2.2026R68F-l*(P*P)
2 +8.880815jF-9*(P*P*P*P*P*P)I -4.61711i7c-II*(P*P*P*P*P*P*D) +165?21807E-ll*(P*P*P*P*P*P*P*P)4 +2.4643AAI9-I9*(P*P*P*P*P*P*c n*n*0*Oj
?nq2-7,63"9r84F-?*P +3.4342061F-4*(P*P)
1 -qA114 4nr-7*(D*P4,D) +1.I4Pr!96P-0*(P*P*P*PW
+4.40c0AQ09-IA*(r*n*D-*n*D)
'.' TUDNW'
,Un ^IJT I 'r SAT T"P
LT-IT' nl TH9' A'PLICATI')K' nc THIS SU90OUTINF ARE ABOVE .2PSIA
I A"-) q-LfW l2n6,7 O IA
(7,--^,f4 ,,TocSo'4SHA-'P*TU 3--o)ATII)M#-,)TAINSoVntTS*ANIPS*FNTHIN*FLMASS9
I nPPSPP .' STI ooocS"TtOFSDOoTSDOtDnL(ICAoXLNGTHgSHIJNT.MP,
7 r kIrFxtcNI,7"xt klrcnXrNPC PXPN!STNOIUALIN90r'W=DTPAOFAFLtA' PAISP
" Ol'AL)t-*,rLTLgncATL,-)nWcrror),cLR)LtC XAV(-,*(-"=XLOXPJLOCATtvoXo
&Dm"rAK 90' q X o =NIL^X , rN ;LOX# q!-JALoX gr)k4=FYtDMFF(-Ytp,)Wnnt,)N OVMV
r, rmSLr l"%'c SI-STr,"'ZoA--C tZtFACN'lPoFACPL9#CFXBO*Loyt
6 PArTkAToiWcoygrrXLOY#c'lLnYt N;LrYt')',IAL)Y#FACTPLP
OM020onn3n0004nOonso0006000070onn8o()00§0
00020oooln00041-00050000600007000()Rn

Q FTUR N/All VTI-rL=049
q r T UO Mrhim
00360n01371on3goe)03qn
nonio000200003000040onnst)"0600007000080nnngo(101000011000120co 1311Onl4O0 1) 1 SO0116000 1 7nMol SO00 1 Q0
002000021000220no2lin00240
SUBOnUTIMP LIOEMCOYMnN NTUBES#MSHAPE*TIJBEtRATIOMtDTAIN59VOLTS*AMPS#ENTHINtFLMASS9
2 DMEFXtEl!rDXtr)"CrGXoFNFGDXtCNETNtOIJALIN#*nWERT*ARFFLPAOCATSYI OLIALnLoSATLoOSATLtPOWF4090SLAnL*CFXAVry*rFXLOX#JLOCAT*K#X94DRDEAKgP^WFPX#FmLnXFNSL^XtIUALnX*n"PFYgnmFPMY90OW009MNFOVM9
6 FACTv I 9001plrvY 9CPXL"Y 99NLOY t PNSU'y of)UALny 9FACTOL7CmKiSTn.SCPoTLtZCTAODLNi-THojollo'!L^CATtCf)SABK*STNA;KgTt8 FXTOAA99XTOAQ*CXTRACt XTOAr)tgXTQAPorxTRAF9
9DMPFB 9 D'4FF' q #F M)B 9 FNSLOB POUALOB 9 EXTRAG 9 EXTQAH *EXTRA To FXTRAJCr)'I"n" nJALTA.rLInsTKIt,,CHf
I not DX 9 COL" 19 COLV7 9 Ce)LM3 vC')Lk44v SUMC' L *PHI MN OGTnTSC9,GSUBZ 95040s SUMI tZSUM?*SUM!tSUm4tSUm5tOk4EGA090MEGA*PGMULT*PSUBLOTOVISCLoVOL-SPL#ERO#IVOLSPrgOUALn4#DOWEPAsPANSOLof)Fk'Ff)gf FMFG09FNSO*f)UAL09I)VSDL090VSPGOs4riToTsDOMOIAtGRDmT*DVLSPLDVLSPGgTFRmitTERm2vTERM39TERM4*GGASoDT9SDVISCL*97YNU%19FFACTOPFFACTgV"'LOCVC-Q()F59DOr-MLToriODFTtDGRWTVGPDTOTO6S9GRAVACtC-DAVCStC-RbVCH*VALUrMPFACTUMtRuAf)A*DRMAnAtAoFTLMTKeYPLUS97TAUWALtFYPLUS*SrILMorLOENTPO'LI09PCL9'NTPDUVMYAoDUMMYSvDUMVYC
Cn"MON Mt"tTHCnNr)t'CHFf IPSCH9'NtVISCro('DLle)gS'JOFTLOIXTTOSATOYSt'ALLT*r" LTVPITWALL94CHFNtHMAC94MTC90 YNLO#NFLUX9? PRNU%',S*BERGHT*HDBoHDENGtCAD'MGgDTnENGoDELTTonACHENsi nTCHF !,DADMAXt FLT9'MPQADIUStCC*DDocc
I= So r, Ini FNFOX = 1.jl77'A4Fl + 6*27047QO*P -I.474?7 57F-I*(P**7)
-?.97RR?20F-S*(P**4) +7.1230014P-7*(P**S)+2,Q4S0Q9SP-j1*(D**7)
+1.407AQ72F-I8*(P**9)aFTU*M
11 FNFPX =2.4910SAgE? +7.167qQ6?F-I*P -9.QQ5570IF-4*(O**2)-6.A6AOQAOF-10*(D**4)
2 -9,96r54666lP-17*(O**6) +4,SSQ4?209-?I*(O**7)VIrTLMMrNf)
MM114
TOTAL nt)14*
1020
40506070go00
I Oft110120130140
1 Isn160170ISOIQO
16M17nlAnion7mm71n
SUnOlUTTMP rVAOPMCOk*VnN NTU MrStVSHAPEtTUBEoPATIOM*DIAINS*VCLT59AMPStENTHTNtFLMASS9
I Dqcsngo"rrsT '90'3cSr'To ESD719TSDDOB('LrCAoXLNC-TH95HUMTk4#D97 r)"PFXPMFDXr'K$P'F-X,97t"F(-PXc",ISIN90UALI'4,PMWCOTAqc!AFLAc'rAT.S,* "IIJALML95ATLoOSATLtD()WPOR90SLOnLoCFXAVngrFXLOXtJLn(ATtKtXv
40"OVAY , DnW POX 9 rNLOX v rl\'SL)X ol)UAL)X o')'4rFY or)%'F;r(Y 9 DOW019 r,,N;rrV'49g; rnSLCNI^ IPA'SnSlri'IZ*ADGtZtFArk4lItFA(-DLQOCCXPMVLPYO6 PArTmTtDl'v'PPYtCFXLOY*FNLOY#r'NSLnyof'UALOY*CACTOLs
7e,"STD , Srol't. Z PTA loL iC.THJ L[,'JLe)CAT 9CI)S ARK 9ST NARK *It2 CXTnAAtCXTPAQocXTDartPXTOArl*FXTDA;rFXTPAr,o') Icc'P,-)'-rFrqo -'NL')BtF ISLC9tr4JALnBgEXTOAGvFXTRAHgFXTPAIPCXTOAJ
' UALIAq(-Mr'9TvIMCHql')"9 )X*C')L"IoCe'L'429 7rNL"39COL' *495UVCnLoOHImNloCTF)TSCgGSURZ95,,JmOOSUMIO
'V^LSOr,I'J4L^49D,""e,'FoAsOANOOL#r)ENF(191)c' IFC-MoFNSrlt(),,)AL()Or)VSPLO*DVSPCntLrT^T,,)-'I' "ti -'rVTtnVLSt3L9r)VLSDrTcOPA1,Tg7ok-2tTrtml*TP'O',A49rCAStDT9rr'VTSrLo' Y"U"occACTt)gFCACTtVrL')'O ;C)r)rSg'PrVLTrODFT*"-01"-4T9CO"TOTPAP, OAVAcc.DAvrsg' QAVCHoVAL'JrNtPA-TUKIPvAnAt')9 AAe)AgAgrIL'ITKgYOLUSe7TA(j-IALgFyol-',JSgr7FIL"tC-Lr'FNIT.DrL!')ODCL 41,,Ttr)U AAAYAgDU'AP'YPof)Ll"tAYC
N't"oTHC^I!DtFCHE JiSCHENtVISCrjtCPLI('*SUQFTL9IXTT95AT095"ALLT9"IrLTVPgT ,IALLgHCHcN*HYACgHk'tr94'YNLovNrLUXP
sor.,10rNPGPX=Q.070449;7E2 -2.1762921*p +I,95597O1E-7r(P**2)-1.26l00lQP-4*(D**l) +5.020AR04F-7*fP**4) -1&2499S43F-Q*(D**5)
-?.0149A4'F-77*(D**Q)
?cTljllk.

APPDiDIX F
TABULATION OF THE DATA
1 109.0
1 137.0
4),0.-
1034
100
29.5
1 136.0 1.0029.6
1 116.0 1.0029.5
1 138.0 1.0029.9
1 115.0 1.0029.5
'4
-.
T40
1
A
0
0
A4
4F
4
04)
04)'4
a0.
0214
do 4
N v
Iup
.214 30.0 121.0 130.0 105.0 25.0 104.2 -214.5.1 105.6 .568 .616E 06 .8628E 05 .582 417.4 5.4
.211 30.0 121.5 127.0 110.0 17.0 59.8 -257.1.2 110.5 .537 .645E 06 .8905E 05 .652 393.9 6.2
.211 30.0 122.0 120.0 100.0 20.0 149.1 -163.3.1 100.4 .557 .516E 06 .7973E 05 .568 412.0 4.6
.212 30.0 125.0 135.0 117.0 18.0 177.3 -144.50. 117.4 .593 .6C0E 06 .8328E 05 .606 441k.4 5.0
.2110.
30.0 122.0 110.0 88.0 22.0 205.0 -ICO.788.1 .597 .547E 06 .7570E 05 .599 447.8 3.2
.211 30.0 124.0 127.0 107.0 20.0 223.1.2 107.4 .555 .522E 06 .7207E 05 .566 408'.1
-93.84.4
1 117.0 1.00 .210 30.0 12C.C 132.0 112.0 20.0 2521.4 -17.629.7 .1 112.3 .603 .518E 06 .7124E 05 '.611 449.4 4.1
2 205.0 2.2719.6
2 206.0 2.2723.5
2 208.0 2.2726.9
2 207.0 2.2729.5
.214 30.0 125.C 115.0 105.0 10.0 68.4 -240.7.6 112.1 .183 .6C8E 06 .7283E 05 .394 89'.2 25.4
.214 30.0 125.0 119.0 106.0 19.0 14919 -161.9.3 110.0 .363 .514E 06 .7188E 05 .477 245.3 9.3
.214 30.0 125.0 103.0 85.0 18.0 203.4 -97.3.6 87.5 .512 .410E 06 .7300E 05 .558 376.7 3.3
.214.1
30.0 125.6 118.0 98.0 20.0 247.2 -63.998.4 .632 .327E C6 .7764E 05 .639 477.9 2.C
0
a0
.0
'4
N
0
Na.
0.a4)0
0P
0
0M
'4 4
'+I
11.7 CL 0.
13.0 C. C.
9.8 C. 0.
11.9 06 C.
7.3 Cu C.
9.5 C. C'.
9.8 04 C.
40.4 0 C.
15.3 Cw C.
6.2 0. 0O.
4.9 a 0.

337.0
313.0
339.0
314.0
340.0
324.0
325.0
510.0
511.0
512.0
513.0
514.0
515.0
1202.0
1208.0
1209.0
1210.0
1260.0
1259.0
1258.0
4 1257.0 2.27 .214 30.0 125.0 120.0 98.0 22.0 257.6 -54.8
4.0329.4
4.0329.5
4.0327.2
4.0329.3
4.0328.9
4.0328.9
4.0329.1
5.7519.9
5.7524.3
5.7522.6
5.7520.1
5*7523.2
5.7526.1
2.2729.7
2*2729.7
2.2729.9
2.2729.7
2.2729.6
2.2729.5
2.27
.211 30.C 121.5.2 92.7 .602
.211 30.0 121.5.2 94.6 .614
.213 30.C 124.4.2 92.2 .553
.210 30.0 12C.0.2 92.7 .631
.213 30.C 123.80. 95.9 .624
.211 30.0 122.0.2 96.0 .618
.211 30.0 121.5.3 93.8 .629
.214 30.0 125.6.2 97.2 .304
.214 30.0 125.6.2 104.8 .417
.215 30.0 126.3.2 100.5 .337
.214 30.0 125.01.1 104.2 .425
.214 30.0 125.6.4 91.4 .460
.214 30.0 125.6.2 98.2 .601
.214 30.0 125.0.1 111.2 .336
.214 30.C 125.0.1 97.2 .419
.215 30.0 126.30. 100.1 .523
.214 30.0 125.0.2 95.2 .583
.214 30.0 125.0.2 97.3 .615
.214 30.0 125.0.2 97.5 .619
.214 30.0 125.00. 103.3 .61
111.0.216E 06
116.0.259E 06
111.0.387E 06
112.0.254E 06
113.0.211E 06
115.0.2!9E 06
114.0.236E 06
104.0.715E 06
115.0.4E7E 06
108.0.526E C6
115.0.5S7E 06
105.0.542E 06
115.0.4C1E 06
117.0.613E 06
107.0.6!OE 06
115.0.6S9E 06
113.0.6S9E 06
116.0.430E 06
118.0.355E 06
125.0.3E5E 06
92*0.9355E 05
94.0.9019E 05
89.0.8254E 05
92.0.8233E 05
95.0.8138E 05
95.0.7709E 05
93. *.7384E 05
86.0.8549E 05
100.0.7404E 05
95.0.6837E 05
95.0.1152E 05
85.0.739"E 05
95.0.7748E 05
111.0.6829E 05
97.0.6593E 05
100.0.7095E 05
95.0.7091E 05
97.0.9693E 05
97.0.8834E 05
103.0.8714E 05
19.0.609
22.06620
22.0.590
20.0.639
18.01.636
20.0.629
21.0'.637
18.0522
15O0.496
13.0.445
20.0.626
20.0563
20.0.647
6.0.345
10.0.428
15.0.526
18.o0*.592
19.01.622
21.0.629
22.0.676
65.8453.1
104.2462.5
153.8409.5
176.9478.5
203.5473.8
223. S466.3
254"0476.6
74.3194.3
149.9292.6
149.9223.8
20064298.2
202.3330.5
254.6453.1
64.1221,.7
149.5295.4
203.5383.7
254.7437 *S
74.4463-.9
149.1467.1
202.7510.1
-240.61.7
-205.61.6
-152.62.8
-130.21.4
-1C4.31.6
-85 *61.64
-54.41.3
-221.115.1
-159.26.8
-154.49.3
-108 .79.9
-99.85.5
-54.52.71
13.7
-154.*18.1
-105.*66.3
-53.14.8
-235.42.7
-162.02.4
-112.92.1
3.9
3.7
5.9
3.5
4.0
3.8
3.3
23.4
11.7
14.9
17.2
9.7
4.2
12.2
13.9
12. *
10.6
6.5
5.9
6.0
Oh C.
26.5 0.
C. 0.
27.9 .4
06 0.
27).4 .I
16 0,
20L4'C.
06 0.
06 C6
is 0.
0 C.
C'. C
0L 0.
a. 0.
0L C.
C. C.
al. O u
Oa 0.
06 0.29.7

3 1501.0
3 1503.0
3 1504.0
3 1505.0
4 1560.0
4 1550.0
4 1551.0
4 1552.0
5 2502.0
5 2503.0
6 2552.0
6 2553.0
1 132.0
1 129.0
1 139.0
1 140.0
1 111.0
2 201.0
2 209.0
2 210.0
2 211.0
2 310.0
29.7
5.7529.6
5.7529.8
5.7529.8
5.7529.5
5.7517.0
5.7528.3
5.7528.8
5.7528.3
5.759.8
5.7528.1
5.7525.1
5.7528.0
1. JO79.8
1.0029.5
1.0029.8
1.0b29.H
1.0029.5
2.2722.4
2.7?24.1
2.?779.6
2.7729.5
4.0424.0
2 334.0 4.0127.6
0.
.213.3
.2140.
.214.1
.215.4
.215.5
.213.4
.214.5
.214.3
.215.2
.213.5
.214.3
.214.3
.213.2
.2130.
.210.1
.2100.
.2100.
.213.3
.214.11
.214.1
.2140.
.2110.
9a.2
30.C96.4
30.C101.2
30.093.2
30.0103.4
30.C107.3
30.C96.4
30.C103.C
30. C103.4
30. C108.5
30. C100.6
30.0103.9
30.095.0
30.C70.0
30.C68.8
30.0.64.9
bo.c63.6
10.C6P. 3
30.C98.1
30.097.6
40.010.3
30.068.5
.668 .3!3E C6 .7973E 05 .673
123.8 100.0 95.0 5.0.27C .714E C6 .5905E 05 .202
125.0 110.0 101.0 9.0.398 .713E 06 .6386E 05 .405
125.0 109.0 93.0 16.0.56'3 .9CI 06 .7451f 05 .571
126.3 117.C 103.0 14.0.490 .749f C6 .6284E 05 .508
126.3 116.0 96.0 20.0.372 .617E 06 .9574f 05 .601
123.8 116.0 95.0 21.0.A29 .240E C6 .8893E 05 .645
125.C 124.0 102.0 22.0.675 .221E 06 .8775E 05 .685
1254C 124.0 102.0 22.0.675 .223E 06 .8245E 05 .691
126.3 110.0 91.0 19.0.122 .110E C6 .9059E 05 .560
123.8 120.0 99.0 21.0.6i? .242E 06 .8813E 05 .696
125.0 109.0 98.0 11.0.310 .916E 0~6 .7705E 05 .435
125.C 112.0 93.0 19.0.602 .512 06 .8179E 05 .635
248.8 127.0 60.0 58.0.4Ce .1C3E 07 .1475E 06 .414
247.5 123.0 67.0 56.C.374 .9C1E C6 .1257k 06 .385
241.5 129.0 64.0 65.0.433 ,SC4E C6 .1245E 06 .439
241.5 128.0 63.) 65.0.429 .71E C6 .1099E 06 .43A
241.5 132.0 67.0- 65.0.456 .78E C6 .1044f 06 .465
241.5 -12i.0 61.0 60.0.237 .IC6f 07 .1,85E 06 .49t
25C.C 132.0 77.0 55.0.35C .1CIE C7 .1392E 06 .474
25C.C 131.0 69.0 66.0.492 .530E C6 .1297E 06 .497
508.4 1.8
69.2 -219.3166'.2 15.9
147.9 -151.8277.5 11.0
206.5 -98.5421.4 - 6.5
253'.2 -57.3356.4 7.9
72.3 -237.5252.1 10.4
151.0 -158.6476.1 1.4
206.1 -1C8.9513.8 1.2
253'.2 -81.6515.5 1.2
73.9 -231.836.5 67.1
204.2 -1C8.2517.8 1.3
67.6 -237.4200.5 18.9
205.4 -101.7454.8 3.1
70.6 -246.3260.8 3.1
112.0 -202.4231.6 3.C
150.7 -167.4279.4 - 2.3
205.7 -11.8275.6 ?.C
260.6 -59.4300.7 1.9
68.4 -246.C128.1 9.6
10.7 -169.3221.0 5.6
?04.? -Ill.t331.2 1.2
f50.0 135.0 67.0 68.0 252.6 -69.2.. 987 .4tqE 06 .1162E 06 .493 326.5 1.1
30.0 244.C 128.0 67.d 61.093.1 .322 .992E 06 .1435E 06 .428
71.0 -246.5196.0 5.8
.210 30.0 , 241.5 131.0 65.0 66.0 72.5 -246.9.4 76.0 .45C .6t4E C6 .1538E 06 .485 299.0 2.c
5.1 C. C.
24.2 Oh C.
1s. ! . C.
13.1 Ci C.
15.0 C. I.
17.3 C* 0.
3.5 C. 0.
3.4 0. C.
3.4 C. C.
112.4 C6 Cu
3.# C6 C6
29.8 04 0.
8.9 C. C.
4.9 29.526.56*
4.4 C. 0.
3.6 C. C.
3.2 0. C.
3-.1 C. C.
14.7 . C.
9.C C. C.
2.1 C. C.
1.9 C. C^.
9.1 C. 8.
3.3 C. C.

2
2
2
2
2
2
2
2
2
3
3
3
4
4
4
4
4
3
3
3
308.0
331.0
311.0
332.0
336.0
309.0
501.0
507.0
504.0
508.0
1204.0
1205.0
1207.0
1271.0
1252.0
1253.0
1254.0
1255.0
1502.0
1507.0
1508.0
4.0325.8
4.0326.0
4.0328.0
4.0328.9
4.0329.5
4.0328.0
5.7522.6
5.7522.1
5.7522.4
5.7520.0
2.2729.3
2.2729.8
2.2729.9
2.2726.4
2.2725.5
2.2729.9
2.2729.8
2.2729.8
5.7529.5
5.7529.8
5.75
.211.2
.211.2
.2100.
.213.2
.213.3
.212.1
.212.6
.214.7
.214.2
.214.3
.213.5
.214.1
.2141.4
.2141.4
.2141.0
.2140.
.2140.
.2140.
.213
.214.1
.214
30.085.3
30.082.3
30.076.4
30.070.9
30.C68.5
30.071.9
30.097.0
30.096.4
30.095.3
30.071.1
30.064.9
30.C75.6
30.065.3
30.076.6
30.C81.7
30.C65.3
30.C63.8
30.070.5
30.070.0
30.059.4
30.C
243.C.405
243.0.435
24C.0.476
241.5.473
248.8.472
246.3.45C
24i.0.290
251.3.335
251.3.381
250.0.515
248.8.382
25C.0.410
25C.C.461
250.0.38C
25C.C.379
25C.0.447
25C.C.501
25C.C.5C8
246.8.285
25C.0.326
25C.C
133.0.837E 06
137.0.7f9E 06
137.0.540E 06
136.0.415E C6
135.0.315E 06
134.0.432E 06
125.0.110E 07
132.0.IC9E 07
135.0.1C2E 07
138.0.328E 06
120.0.111E 07
125.0.111E C7
132.0.1C8E 07
130.0.757E 06
131.0.7S9E 06
135.0.576E 06
138.0.516E 06
140.0.530E 06
1C2.0.141E 07
105.0.126E 07
123.0
67.0.1451E 06
66.0.1375E 06
69.0.1317E 06
67.0.1247E 06
67.0.1112E 06
66.0.1065E 06
64.0.1418E 06
65.0.1373E 06
70.0.1311E 06
6R.0.1226E 06
62.0.1189E 06
75.0.1122E 06
69.0.1090E 06
66.0.1505E 06
66.0.1536E 06
65.0.1313E 06
63.0.1306E 06
70.0.1203E 06
57.0.1179E 06
53.0.1040E 06
64.0
66.0.472
71.0.494
68.0.500
69.0.484
68.0.476
68.0.469
61.0.424
66.0.472
65.0.500
70.0.523
58.0.402
50.0.415
67.0.464
64.0.442
65.0.459
70.0
.449
75.0.505
70.0.510
45.0.302
47.0.334
59.0
101.3261.8
151.8285.4
176.5319.7
205.5313.7
255.4312.2
262.5296.1
73.9172.1
150.7207.3
204.6245.9
255.1350.6
153.0?39.5
203.9267.6
253.9304.4
68.9238.8
71.9238.7
151.0287.9
203.5333.1
254.3343.3
71.8166.3
149.8193.5
206.5
-219.33.2
-171.22.5
-146.51.4
-116.91.0
-66.4.7
-58.71.2
-241.77.7
-189.36.4
-117.24.9
-68.5.7
-159.43.5
-111.73.6
-e6.12.5
-249.82.9
-247.53.2
-170.81.4
-120.11.1
-70.51.1
-228.26.8
-152.34.2
-1C7.9
5.3
4.3
2.5
1.7
1.3
1.9
12.0
10.1
8.1
1.3
5.4
5.8
4.1
4.6
5.1
2.3
2.C
2.1
9.9
6.1
C'.
C.
0.
C.
0.
27.5
0.
C.
0.
C.
0.
C.
C.
C.
C.
C.
C.
C.
0.
C.
0.
C.
0.
C.
C.
C.
C.
C.
C.
0.
C.
C.
0.
C.
C.
Oc
0.
0.

3
4
4
4
4
5
5
6
6
1
2
2
2
2
2
1509.0
1553.0
1554.0
1555.0
1556.0
2504.0
2506.0
2551.0
2556.0
142.0
135.0
130.0
141.0
133.0
213.0
212.0
202.0
203.0
329.0
330.0 4.0322.0
29.7
5.7529.7
5.7511.8
5.7529.2
5.7528.2
5.7528.6
5.7511.8
5.7529.3
5.7524.2
5.7524.4
1.0029.8
1.0029.6
1.0029.5
1.0029.8
1.0029.4
2.2721.6
2.2726.9
2.2727.9
2.2723.1
4.0325.9
0.
.213.1
.2141.6
.214.4
.213.1
.213.5
.215.5
.213.3
.215.3
.213.3
.2090.
.2100.
.212.5
.2100.
.213.4
.214.5
.214.4
.212.9
.213.1
.212.4
65.2
30.C64.0
30.C121.4
30.069.5
30.073.3
30.C70.8
30.0115.6
30.070.2
30.0146.3
30.C88.6
30.0128.3
3U.C112.3
30.0115.9
30.0111.8
30.C123.1
30.0166.6
30.0146.3
30.C130.1
30.0153.7
30.0150.6
.,425
246.8.420
25C.C.C96
25C.C.5C6
240.8.489
248.8.48
252.5.C66
247.5.5Cc
252.5.139
247.5.342
478.0.21C
480.C64
4S2.5.268
483.C.316
455.0.320
SCC.0.C87
5Cc.0.233
450.0.320
4S5.0.242
49C.0
.221
.125E 07
125.0.121E 07
129.0.119E 07
140.0.349E 06
140.0.359E 06
140.0.3C?E C6
120.0.124E 07
14C.0.325E 06
153.0.12E C7
127.0.158E 01
192.0.148E 07
193.C.162E 07
195.0.142E 07
217.0.134E 07
217.0.124E 07
185.0.168E 07
215.0.116E 07
223.0.1C4E 07
217.0.128E 07
197.0.122E 07
.1141E 06
63.0.1005E 06
64.0.1450E 06
67.0.1453E 06
68.0.1311E 06
67.0.1166E 06
62.0.1320E 06
68.0.1292E 06
131.0.1198E 06
65.0.1241E 06
105.0.2029E 06
106.0.2232E 06
112.0.1981E 06
110.0.1848E 06
120.0.1724E 06
108.0.2150E 06
115.0.2065E 06
115.0.2017E 06
113.0.1751E 06
108.0.2344E 06
.435
62.0.428
65.0.423
73.0.513
72.0.505
73.0.500
58.0.359
72.0.506
22.0.268
62.0.480
87.0.215
87.0.275
83.0.278
107.0.321
97.0.329
77.0.240
10C.0.284
108.0.349
104.0.339
89.0.288
277.1
252.0270.4
71.912.4
150.3339.4
202.4326.7
255.1324.9
69.3-12.4
208.7334.4
81.747.9
203.4214.8
80.592.9
81.4128.5
149.9132.4
206.3164.2
253.4172.2
86.44.5
146.1108.5
205.2171.6
253.2117.9
80.5105.7
3.6
-63.63.2
-246.236.2
-174.5.7
-122.4.9
-69.7.7
-243.150.1
-116.1.7
-250.540.8
-113.58.0
-271.27.3
-270.85.2
-203.24.7
-156.63.4
-1C9.53.5
-262.128.6
-216.06.0
-160.13.2
-1C9.76.8
-213.57.5
5.7
5.0
61.5
1.3
1.5
1.2
84.0
1.3
72.4
12.6
11.9
8.3
7.5
5.6
5.8
50.1
10.1
5.3
11.5
12.8
.212 30.0 453.5 207.0 114.0 93.0 149.3 -209.5.1 173.4 .181 .112E 07 .2154E 06 .315 77.4 14.7 26.0 25. .6
C
C.
0.
0.
C'.
0.C.
C.
0.
0.
0.0*.
515.0
C.
C.
0.
C.

2
2
2
2
2
2
2
3
3
3
3
4
4
4
3
3
3
3
4
327.0
328.0
506.0
516.0
505.0
502.0
503.0
1211.0
1212.0
1213.0
1200.0
1250.0
1251.0
1256.0
1500.0
1510.0
1511.0
1512.0
1557.0
4.0325.1
4.0323.9
5.7516.3
5.7522.5
5.7521.8
5.7523.3
5.7522.0
2.2729.8
2.2729.8
2.2729.9
2.2729.8
2.2728.9
2.2729.7
2.2729.5
5.7529.9
5.7529.9
5.7529.8
5.7529.9
5.7522.4
.213.4
.212.3
.215.1
.214.4
.2141.2
.2120.
.213.0
.214.1
.214.1
.2140.
.214.1
.214.8
.215.1
.214.3
.2140.
.2140.
.214.1
.2130.
.214.8
30.0148.6
30.0153.8
30.0155.C
30.C156.1
30.C174.6
30.0163.6
30.0161.6
30.0117.8
30.0114.8
30.0102.0
30.0116.7
30.C120.6
30.0118.2
30.0123.1
30.C83.C
30.0120.8
30.0115.9
30.0113.8
30.C161.7
495.0.277
490.0.274
5C5.0-. C595C2.5
.117
5CC.C.172
490.0.242
495.0.239
5CC.C.187
5C2.5.252
5C0.0.293
5C0.0.316
5CC.C.259
5C5.0.311
5C0.0.342
5C0.0.C86
5CC.C.218
5CC.c.281
495.0.298
5C0.0.216
215.0.124E 07
225.0.124E 07
155.0.I99E 07
178.0.186E 07
207.0.114E 07
219.0.143E 07
215.0.146E 07
158.0.2C6E 07
185.0.IC9E 07
2C0.0.176E 07
215.0.167E 07
2C0.0.LC9E 07
215.0.976E 00
227.0.930E 00
110.0.168E 07
170.0.217E 07
192.0.215E 07
203.0.193E 07
21C.0.116E 07
115.0.2013E 06
115.0.1778E 06
95.0.1984E 06
105.0.2150E 06
113.0.2123E 06
114.0.1956E 06
113.0.1811E 06
103.0.2C91E 06
109.0.1932E 06
101.0.1775E 06
115.0.1694E 06
112.0.2378E 06
116.0.2214E 06
120.0.2081E 06
73.0.1552E 06
104.0.1786E 06
113.0.1775E 06
113.0.1584E 06
118.0.2489E 06
100.0.341
110.0.351
60.0.170
73.0.233
94.0.305
105.0.335
102.0.346
55.0.192
76.0.260
99.0.295
100.0.322
88.0.276
99.060.316
107.060.349
37.0.089
66.0.220
79.0.287
90.0.300
92.0.309
202.8144.5
255.5141.4
62.50.
80.927.8
151.669.7
203.6119.3
247.0118.0
60.780.7
150.0123.4
206.2146.5
253.6168.5
75.1124.1
149.7162.6
202.9186.0
53.73.7
148.4104.2
205.8145.4
252.2155.8
84.8100.5
5 2505.0 5.75 .213 30.0 495.0 225.0 121.0 104.0 205.219.9 .4 173.4 .241 .IC3E 07 .2042E 06 .347 118.8
-159.35.3
-110.65.6
-270.80.
-264.219.5
-207.215.8
-160.18.2
-115.18.4
-274.210.4
-198.56.7
-149.14.4
-1CP.54.5
-200.23.9
-212.42.7
-164.02.4
-252.013.4
-192.89.5
-145.96.7
-1C4.95.5
-275.37.5
9.1
9.6
0.
36.6
28.3
14.2
14.4
17 .C
10.6
7.0
7.4
6.3
4.5
4.1
23.5
15.4
IC.7
8.8
12.e
C0. C.
0. 0.
c6 0.
Cf C.
C~ C.
0. C.
0. 0.
21.* a .
0. C.
Ch C.
0 & 0.
ca 0.
C. C.
Ch C.C. C.
Cl 0.
Ci C.Ch C.
0. 0.
C. C.
-160.96.4 11.1 Ci C.

5 2501.0 5.75 .214 30.0 5C0.0 155.0 93.0 62.0 77.8 -255.410.9 .1 155.0 -.068 .201E 07 .1855E 06 .175 0. 0. 0. C. C.
6 2555.0 5.75 .214 30.0 5C0.0 187.0 110.0 77.0 203.2 -14L.227.0 .2 143.9 .221 .154E 07 .1716E 06 .273 107.3 8.3 14.C C. 0.
6 2554.0 5.75 .214 30.C 5CC.0 1C5.0 72.0 33.0 49.3 -?5.22.3 .1 105.0 -. 054 .210E 07 .1562E 06 .088 0. 0. C. C. 0.
8 0326.0 4.03 .214 30.0 249.8 133.0 62.0 51.0 253.2 - 67.4 4.17 .085 20.028.4 .1 67.3 .450 .405E 06 .1090E 06 .465 297.7 1.0 1.7 0 0
8 0345.0 4.03 .214 30.0 250.0 140.0 90.0 50.0 205.5 -119.3 4.17 .50 20.020.4 .0 112.2 .281 .430E 07 .1255E 06 .466 192.8 37.5 60.0
8 0313.0 1.03 .215 30.0 252.5 137.0 70.0 60.0 204.0 -116.6 4.52 .50 27.027.2 .1 76.8 .408 .235E 07 .1205E 06 .450 276.1 7.9 12.7
8 0344.0 4.03 .2117 30.0 244.0 135.0 60.0 75.0 202.5 -113.8 5* 1.5 27.028.1 .1 61.0 .400 .156E 07 .1198E 06 .471 297.0 4.7 7.3
7 7210.0 1.00 .2130 30.0 250.0 128.0 35.0 93.0 203.4 -114.1 2.27 1.0 24.029.8 .0 35.9 .500 .871E 06 .1247E 06 .505 318.7 .88 1.4
7 7510.0 1.00 .214 30.0 250.0 122.0 36.0 86.0 198.4 -115.3 5.75 1.0 24.024.6 .2 59.1 .332 .408E 07 .1138E 06 .451 188.9 13.1 19.2
7 7710.0 1.00 .213 30.0 250.0 120.0 36.0 85.0 202.3 -110.1 7.0 1.0 24.024.6 .2 58.4 .330 .181E 07 .1125E 06 .450 188.5 15.4 21.9
7 7250.0 1.00 .2125 30.0 250.0 132.0 37.0 95.0 203.5 -116.5 2.27 5.0 22.029.7 .2 38.4 .518 .821E 06 .1300E 06 .525 336.5 .83 1.4
7 7550.0 1.00 .212 30.0 250.0 115.0 36.0 79.0 203.5 -105.6 5.75 5.0 22.025.7 .2 55.9 .352 .239E 07 .1109E 06 .445 213.4 6.6 9.4
7 7750.0 1.00 .211 30.0 250.0 115.0 37.0 78.0 206.1 -103.0 7.0 5.0 22.025.9 .0 57.7 .345 .228E 0 .1061E 06 .426 210.3 6.6 9.5
7 7290.0 1.00 .211 30.0 250.0 135.0 38.0 97.0 205.0 -116.8 2.27 9.0 20.029.8 .0 39.0 .506 .733E 06 .1283E 06 .510 324.6 .77 1.2
48" LONG TUBES
1 114136 1.00 .212 48.0 250.0 140.0 38.0 102.0 254.2 - 70.647.6 .1 39.0 .484 .4915E 06 .1091E 06 .489 300.4 .56 .87
1 139135 1.00 .210 48.0 240.0 138.0 38.0 100.0 206.1 -117.547.8 .1 38.7 .494 .5382E 06 .1184E 06 .498 310.1 .61 .95
1 128110 1.00 .212 48. 0 125.0 117.0 . 2.0 25.0 251.3 - 59.247.8 .2 92.1 .637 .34533 06 .76 7E 05 .641 181.6 1.8 4.5 47.5
DATA TAKEN WITH OSCILLATORY INSTABILITY PRESENT
1 107.0 1.00 .213 30.0 250.0 95.0 95.0 0 71.8 -222 7 17.027.0 0.0 95.0 .427E 06 .595E 05 .017
1 108.0 1.00 .214 30.0 250.0 170.0 155.0 15.0 88.8 -252.328.3 .7 .834E 06 .1168E06 .245
1 120.0 1.00 .2115 30.0 244.0 209.0 181.0 28.0 90.8 -268.729.9 .1 181.2 .374 .1014E 07 .1404E 06 .376 25.0 12.8
1 128.0 1.00 .211 30.0 243.0 193.0 170.0 23.0 124.3 -228.229.8 .0 .86203 06 .1190E 06 .321
1 111.0 1.00 .213 30.0 250.0 175.0 117.0 28.0 162.7 -180.929.6 .1 .725E 06 .1010E 06 .345
1 119.0 1.00 .2135 30.0 249.0 225.0 195.0 30.0 175.8 -190.329.6 .1 .9900E 06 .13803 06 .425
1 118.0 1.00 .2135 30.0 249.o 218.0 190.0 29.0 238.7 -124.729.6 .2 190.5 .1A .83623 06 .11.68 06 .422
1 112.0 1.00 .2135 30.0 500.0 187.0 169.0 18.o 99.4 -250.028.1 1.6 .1110E 07 .1550E 06 .118
1 122.0 1.00 .2105 30.0 483.0 211.0 187.0 24.0 104.8 -255.329.8 .0 .1125E O .1560E 06 .086 4.9
1 113.0 1.00 .212 30.0 500.0 209.0 191.0 18.0 144.1 -215.625.8 3.7 .97603 06 .1355E 06 .063
1 128.0 1.00 .211 30.o 486.o 210.0 181.o 29.0 114.6 -245.2.1262E 07 .1745 06 .18
FAST TRANSIENT TEST
2 513.0 5.75 .214 30.0 125.0 115.0 95.0 20.0 200.4 -108.720.1 1.1 101.2 .425 .7339E 06 .81523 05 .626 298.2 9.9 17.2
*Axial Flux Distribution1 - Uniform 5 - Peak Inlet2 - Conine 6 - Peak Erit
3 - Linear Increasing 7 - Uniform with Cosine Spike4-Linear Decreasing 8 - Conine with Stopped Spike
**Second Thermal Failure***5.14 to 4.54

-177-
BIBLIOGRAPHY
1. DeBortoli, R.A., S.J. Green, B.W. LeTourneau, M. Troy andA. Weiss, "Forced-Convection Heat Transfer Burnout Studiesfor Water in Rectangular Channels and Round Tubes atPressure Above 500 psi " Report WAPD-188, Bettis AtomicPower Laboratory (1958).
2. DeBortoli, R.A., J.D. Roarty, and A. Weiss, "AdditionalBurnout Data for a Rectangular Channel Having a CosineAxial Heat Flux," WAPD-TH-227, August 23, 1956.
3. Weiss, A., "Hot Patch Burnout Tests in a 0.097 in. x 1 in.x 27 in. long Rectangular Channel at 2000 Psia," WAPD-TH-338, August 7, 1957.
4. Bell, D.W.f "Correlation of Burnout Heat-Flux Data at2000 Psia,' NSE, 7, 245-251 (1960).
5. Swenson, H.S., J.R. Carver and R. Kakarala, "The Influenceof Axial Heat Flux Distribution on the Departure from Nu-cleate Boiling in a Water Cooled Tube," ASME Paper 62-WA-297,Nov. 1962.
6. Janssen, E., J.A. Kervinen, "Burnout Conditions for Non-uniformly Heated Rod in Annular Geometry Water at 1000Psia," GEAP-3755, APED, General Electric Co., San Jose,Calif., June 1963.
7. Casterline, J. and B. Matzner, "Burnout in Long VerticalTubes with Uniform and Cosine Heating Using Water at 1000Psia," Columbia Univ., Eng. Res. Labs., Topical Report,
1, Task XVI of Contract AT(30-3)-187, July 27, 1964. Seealso AEC Report TID-21031.
8. Schaefer, J.W. and J.R. Jack, "Investigation of Forced-Convection Nucleate Boiling of Water for Nozzle Cooling atVery High Heat Fluxes," NASA TND-1214, May 1962.
9. Lee, D.H. and J.D. Obertelli, "An Experimental Investiga-tion of Forced Convection Burnout in High Pressure Water:Part II, Preliminary Results for Round Tubes with Non-Uniform Axial Heat Flux Distribution," AEEW-R309, November1963.
10. Lee, D.H., "An Experimental Investigation of Forced Con-vection Burnout in High Pressure Water: Part III, LongTubes with Uniform and Non-Uniform Axial Heating, " AEEW-R355,March 1965.
11. Bertoletti, S., G. Gaspari, C. Lombardi and R. Zavattarelli,"Critical Heat Flux Data for Fully Developed Flow of SteamWater Mixtures in Round Vertical Tubes with Non-UniformAxial Power Distribution," CISE-R74, April 1963.

-178-
12. Silvestri, M., "Two Phase Flow Problems," Report EUR 352.e,EURATOM, Brussels, Belgium, 1963.
13. Styrikovich, M.A., Z.L. Miropolsky and Shen Chzhao-Yuan,"The Effect of Non-Uniformity of Heating Along a Length ofPipe on the Magnitude of Critical Heat Fluxes," (Doklady)of the Academy of Sciences, USSR, No. 4, 859-862, 132(1961). See AEC-TR-4961.
14. Duke, E., "Burnout and Heat Transfer Correlations for Once.Through Superheat at Low Flow with an Exponential Source, "ANS Meeting, June 1964, Paper AED-CONF. 1964-081-8.
15. Non-Uniform Heat Generation Experimental Program, QuarterlyProgress Report No. 7, BAW-3238-7, January-March 1965.
16. Becker, K. et al., "The Influence of Non-Uniform Axial HeatFlux Distribution on the Burnout Conditions in Round Ducts,"Report in Progress, AB Atomenergi, Sweden.
17. Becker, K. and P. Persson, "An Analysis of Burnout Condi-tions for Flow of Boiling Water in Vertical Round Ducts,"ASME Trans. Series C, 86 3, 393-407 63-HT-25, August 1964.
18. Isbin, H.S. et al., "A Model for Correlating Two Phase,Steam-Water Burnout Heat Transfer Fluxes," Jour. of HeatTransfer, Trans. ASME, Series C, 211 149 May 1961.
19. Tong, L., H. Currin, P. Larsen and 0. Smith, "Influenceof Axial Non-Uniform Heat Flux on DNB," WCAP-2767, April1965. See also AICHE paper, No. 17, Eighth National HeatTransfer Conf., LosAngeles, August 1965.
20. Milioti, S., "A Survey of Burnout Correlations as Appliedto Water-Cooled Nuclear Reactors," SM Thesis, Dept. ofNuc. Eng., Penn. State Univ., September 1964.
21. Suo, M. et al., "Investigation of Boiling Flow Regimesand Critical Heat Flux," Dynatech Report No. 517, NYO-3304-3, March 1965.
22. Lopina, R.F., "Two-Phase Critical Heat Flux to Low PressureWater Flowing in Small Diameter Tubes," SM Thesis, Dept.of Mech. Eng., MIT, June 1965.
23. Haberstroh, R. and P. Griffith, "The Transition from theAnnular to the Slug Flow Regime in Two-Phase Flow,"Contract No. AT(30-1)-3301, Technical Report 5003-28, Dept.of Mech. Eng., MIT, June 1964.
24. Baker, 0., "Simultaneous Flow of Oil and Gas," Oil and GasJour., 5%, 185 (1954).
25. Lowdermilk, W.H. and W.F. Weiland, "Some Measurements ofBoiling Burnout," NACA-RM-E54 Kl1, (1955).

-179-
26. Jens, W.H. and P.A. Lottes, "Two-Phase Pressure Drop andBurnout Using Water Flowing in Round and RectangularChannels," ANL-4915, October 1952.
27. 'Lowdermilk, W.H., C.D. Lanzo and B.L. Siegel, "Investi-gation of Boiling Burnout and Flow Stability for WaterFlowing in Tubes," NACA-TN 4382, September 1958.
28. Becker, K.M., "Measurements of Burnout Conditions forFlow of Boiling Water in Vertical Round Ducts," AE-87(1962).
29. VonGlahn, U., "An Empirical Correlation of CriticalBoiling Heat Flux in Forced Flow Upward Through UniformlyHeated Tubes", NASA TMD-1285, September 1962.
30. MacBeth, R.V., "Burnout Analysis, Part 4: Application ofa Local Condition Ryopthesis to World Data for UniformlyHeated Round Tubes and Rectangular Channels," AEEW-R267,August 1963.
31. Maulbetsch, J.S., "A Study of System-Induced Instabilitiesin Forced-Convection Flows with Subcooled Boiling," Con-tract AF 49(638)-1468, Report No. 5382-35, Dept. of Mech.Eng., MIT, April 15, 1965.
32. Bergles, A.E. and W.M. Rohsenow, "Forced Convection Sur-face Boiling Heat Transfer and Burnout in Tubes of SmallDiameter," Contract AF 19(604)-7344, Report No. 8767-21,Dept. of Mech. Eng., MIT, May 25, 1962.
33. Fauske, H.K., "Two-Phase Critical Flow," Notes from Spec-ial Summer Program on Two-Phase Gas-Liquid Flow, MIT,July 1964.
34. Hewitt, G. et al., "Burnout and Nucleation in ClimbingFilm Flow," AERE-R4374, August 1963.
35. Bergles, A.E. and Rohsenow, W.M., "The Determination ofForced Convection Surface-Boiling Heat Transfer," Jour.of Heat Transfer, 86, Series C, No. 3, 365-372 (Paper 63-HT-22) August 1964.
36. Jens, W.H. and P.A. Lottes, ANL-4627, May 1951.
37. Bernathy L. and Begell, W., "Forced Convection, LocalBoiling Heat Transfer in Narrow Annuli," Chem. Eng.Prog. 52 Symposium Series, No. 29, 59-65 (1959).
38. Dengler, C.E. and J.N. Addoms, Chem. Eng. Prog. Symp.Series 52, 18, 95-103 (1956).
39. Chen, J.C., "A Correlation for Boiling Heat Transfer toSaturated Fluids in Convective Flow," ASME Paper No.63-HT-34, ASME-AIChE Heat Transfer Conf., Boston, August1963.

40. Brown, W., MechE Thesis, Dept. of Mech. Eng., MIT (inprogress - to be completed February 1966).
41. Hewitt, G. et al., "Burnout and Film Flow in the Evapora-tion of Water in Tubes,: AERE-R 4864, March 1965.
42. Waters, E. et al., "Experimental Observations of UpstreamBoiling Burnout," AIChE Paper No. 7, ASME-AIChE HeatTransfer Conf., Boston, August 1963.
43. Martinelli, R.C. and Nelson, D.B., "Prediction of PressureDrop During Forced-Circulation Boiling of Water", Trans.ASME, 70, August 1948.
44. Levy, S., "Prediction of Two-Phase Annular Flow with LiquidEntrainment", APED-4615, May 1964.
45. Trembley, P., Priv. Comm., MIT, Nuc. Eng. Dept. (1965).
46. Keenan, J.H. and F.G. Keyes, "Thermodynamic Properties ofSteam", Wiley (1962 ed).
47. Steltz, W.G., "The Formulation of Steam Properties forDigital Computer Application," Trans. ASME, Paper No. 57-A-109 (1958).
48. Wellman and Sibbitt, "Heat Transfer Properties of Water",Combustion, April 1955.
49. Jones, A.B. and D.G. Di§ht, "Hydrodynamic Stability of aBoiling Channel, Part 2 , KAPL-2208, Knolls Atomic PowerLaboratory (1962).
50. Kadakia, P. L., "SI PYFT-TO FIT POLYNOMIAL OF DEGREE 15(MAX)," MIT Share Program No. 1421, January 3, 1962.
51. Volyak, L.D., "Temperature Dependence of the SurfaceTension of Water, " Doklady Akad. Nauk. S.S.S.R. y4,. 307-10(1950).
52. Robsenow, W. and H. Choi, Heat Mass and Momentum TransferPrentice-Hall Inc. (1961).
53. Kestin, J. and P.D. Richardson, "The Viscosity of Super-heated Steam up to 275 0 C. A Refined Determination," Trgns.ASME, Paper No. 62-WA-172 (1963).
54. Quan, D., "Properties of Superheated Steam" Nuclear-13,Orenda Engines Limited, Malton, Ont., December 1959.
-180-

-181-
4.0 - - --
Results of WAPD 188 ( Ref. I)
3.0-
* 2.0- RECTANGULARCHANNELS
Xx 0H 1.5-
02X
1.0 - -
0.9- X0.8- .0 Ox 3
0.7 _ Xx30.6- X
0.5< X
0.4 - -X
0z I0.3 -
m cn X
0. - X UNIFORM FLUX DATA (FOR 27'TUBE-WITHOUT SPIKE)
O NORMAL FLUX (FIRST 25 1/4"LENGTH)
0 "HOT PATCH," PEAK FLUX (1 3/8"LENGTH, 3/8" FROM EXIT)
0 .1 1 1 10.2 0.3 0.4 0.5 06 0.7 0.8 0.9 1.0 1.5ENTHALPY AT BURNOUT, HBO , BTU/LB x 10-3
FIGURE I. EFFECT OF LOCAL HEAT FLUX SPIKE ON
BURNOUT

UNIFORM HEAT FLUXCORRELATION
c.O'
EXPERIMENTALFLUXDISTRIBUTION
I-
w
LENGTH
FIGURE 2. PREDICTIONMETHOD OF
PREDICTEDCRITICALLOCATION
OR LOCAL QUALITY
OF CRITICAL CONDITION BY LOCAL CONDITIONJANSSEN AND KERVINEN (REF.6)

DEFINITION OFEQUIVALENT LENGTH
F
G L
LE
Le- fOMAX
z No
x-
LL
mU
cos dz
LENGTH, Z
ie AREA ABCD =AREA ABEFG
FIGURE 3. PREDICTION OF CRITICAL CONDITION BY EQUIVALENT LENGTH METHOD OFLEE AND OBERTELLI (REF 9)

7
POSSIBLE .HIGHQUALITY CRITICAL 6POINT
CORE (DISPERSED -
LIQUID OR "FOG") 5
LIQUID FILM(DISPERSED VAPOR)
4
3
POSSIBLE SUBCOOLEDVOR LOW QUALITY 2CRITICAL REGION
INCEPTION OF-BOILING
TUBE EXIT
. O
TTUBE INLET
SINGLEPHASESTEAM
4CONVECTIVEHEAT TRANSFERTO SINGLE-PHASE STEAM
LIQUIDDEFICIENT REGION
SPRAYANNULARFLOW
SLUG BULKFLOW NUCLEATE
BOILING
BUBBLEFLOW
COLLAPSING SUBCOOLEDBUBBLE NUCLEATE
~ ~1NG
SINGLE FORCEDPHASE CONVECTIONWATER TO LIQUID
FLOW ASSOCIATEDREGIONS HEAT TRANSFER
MECHAN ISMS
FIGURE 4. REGIMES OF TWO -PHASE FLOW

-185-
III I I I I I2
B
I x 106
i 5
l'-
uI-
co.
..
2-5J
I x0
C 10
(I)
5
I x 104,0
UBREGI-E ~~ ~ ~ - ~
ANNULAR OR DISPREGIME
SLUGREGIME
------
FLOW REGIME BOUND
T ESTCONDITIONSINVESTIGATED
ERSED
ARIES AT lOOpsiaFROM CORRELATIONS OFBAKER (REF 24) AND
HABERSTROH AND GRIFFITH (REF 23)
ANNULARREG IME
0.1 0.2 0.3 0.4 0.5 0.6QUALITY, X
0.7 0.8 0.9 1.0
FIGURE 5. FLOW REGIME MAP FOR TEST CONDITIONS
3 x 10⁶

-280 -240 -200 -160 -120 -80INLET SUBCOOLING, AHin, BTU/LBM
FIGURE 6. COMPARISON OF UNIFORM FLUX DATA WITHEXISTING CORRELATIONS, G = 0.5 x 10⁶ LBM/HR-FT 2
1.0
0.9.
0.8
0.7
0.6
0.5
0.4
0.3
0.2
N
u-
cr
x
]
~
0.1
-40

-187-
2.0
O STABLE DATAEI UNSTABLE DATA
M 1.8- TEST CONDITIONS... G =1.0 x 10⁶ LBM/HR -FT2
I PINLET =0 132 to 123 psiaE1 218 to 95 psia
.6 - PEXIT =O 69 to 63psiaZ 195 to 95psia
VON GL ANN (ReF D = .214 INCH ES
-4 MACBETH (RE F 30 15psia Sic
LOWDERMILK (REF 27) 15-115 psia'C
120 132>1.0- E104 ci 0VN GLA4HN (RE.D-10% 1192)I i
L- 0129 39 i18 (E
S0. 8 - 1 0140 se-d 108 128 0 131
BECKER ( R (REpt 2rpi
0.6 - s~io
0*
0.4 - -TEST SECTION
-ji
NUMBER 107
0.2
0 -1 N1 BE 107111 5
-280 -240 -200 -160 -120 -80 -40 0INLET SUBCOOLING, AHin, BTU/LBM
FIGURE 7. COMPARISON OF UNIFORM FLUX DATA WITHEXISTING CORRELATIONS, G =1.0 x 10⁶ LBM/HR -FT 2

-188-
-280 -240 -200 -160INLET SUBCOOLING
-120 -80AHinj, BTU/LBM
FIGURE 8. COMPARISON OF UNIFORM FLUX DATA WITH EXISTINGCORRELATIONS, G =2.0 x10 6 LBM/ HR-FT 2
2.2
2.0
1.8
<o-
D
CT
x
(0
-J
LL
1.6
1.4
1.2
1.0
0.8
0.6
0.4
0.2
0-40

WATER PUMP
PREHEATER c iU
WATER
HEAT EXCHANGER ACCUMULATOR
L--- - - - - - - - - - -- -+DRAIN
FIGURE 9. SCHEMATIC LAYOUT OF EXPERIMENTAL FACILITY AND TEST SECTION

COSINE LINEARLY INCREASING
q /A
/d
X X
PEAK INLET PEAK OUTLET COSINE WITHSTEPPED SPIKE
'.00
UNIFORM WITHCOSINE SPIKE
~ZZZ2Z~zr VZZ72~ZZ~~zzzzz~z~
q/A /A q/A
L
FIGURE 10. AXIAL FLUX DISTRIBUTIONS TESTED
q/A q /A
q /A
- U -
Z-.
v 7 7
V//////7i
LINEARLY DECREASINGUNI FOR M

2.0
VELOCITY,
I iTEST SECTION 112D = 0.214"; L/D = 140TIN= 131*F; pEx I
(q/A) CRIT = 1.1 xlO6
00 psiaBTU
hr-ft 2
3.0 4.0
GxIO , LBM/HR-FT2
FIGURE I I : CONFIRMATION FOR TEST SECTION 112 THAT THEOVERALL SLOPE GOES TO ZERO AT THE FLOWRATE (G=2.OX106 LBM/HR-FT 2 ) WHEREOSCILLATION OCCURED
-191-
32.0
28.0
24.0
20.0
A P TS
(psi )
16.0
12.0
8.0
4.0
0
II
I
1.0MASS
5.0
0 HEATED SECTION -
PRESSURE DROP(CALCULATED)
---- SLOPE OF VALVE-CHARACTER ISTIC(PLOTTED
NEGATIVE)

AXIAL FLUX DISTRIBUTIONM=2.27 4.0 5.75
UNIFORM (M=I) 01COSINE 0 O
TEST CONDITIONSG=0.5 x 10⁶ LBM/HR-FT 2
PINLET= 135 to 100psiaPEXIT = 115 to 85 psiaD = 2 A I NlC
mLc)"
0
x
0
u0
0
0
< 0Hz(-
HLUJ-
-200INLET SUBCOOLING,
-I50AHin, BTU/LBM
-100 -50
FIGURE 12. TOTAL CRITICAL POWER FOR UNIFORM AND COSINE FLUX DISTRIBUTIONS
LBM/HR-FT 2
1.10
1.00 F-
0.90
0.80k-
0.7 O-
L = 30 INCHES
+10% 0N0+10% UX DISTrR/BU! O
M = 2.27 4
0.6 0 1-
0.5 0-250
AT
I
G = 0.5 x 10 Or

AXIAL FLUX DM= 2.27
NEAR INC VLINEARPEAKPEAK
DEC ZI
ISTRIBUTION4.0 5.75
- V
- A
INLETEXIT
TEST CONDITIONSG=0.5x10 6 LBM/HR-FT 2
PINLET =I 35 to 100 psiaPEX IT =115 to 85 psiaD = .214 INCHESL = 30 INCHES
PEA
+10%
D-m
IfO
I0
Ir-
0
Ul'-
0
V
-200INLET SUBCOOLING,
- 150 -100BTU/LBM
FIGURE 13, TOTAL CRIT ICAL POWER FOR LINEAR AND PEAKED FLUX DISTRIBUTIONSG =0.5 x 10⁶ LBM/HR -FT 2
1.10
00 - LI
0.90
0.80 H--10%
0.70 |-
0.6 0-
0.50-250
zy0
H0~0
-50
AT
NLET- L oA

29.4±.2
20.9 19.917.O±.5 9.8±.2
TEST CONDITIONS
200k-29.5±.2
24.3±.2
23.5±.3150-2. 22.6 .2
27.21.1 -
29.3±.1
m
D
0C
z--
000
wz
-T28.9t.
26.9±.6
28.9±.2
Th23.2.4
D = .214INCHESL = 30 INCHES
BETWEEN 29.5UNLESS OTHERWISE
~8.1±.5 28.O±.3
5029259 . .
29.1±.3 26.1±.2 28.3 ±.4
o M=2.27 VM=4.O 0 M=5.75 VM=2.27v M=5.75 a M=2.27 A M=5.75 $M=5.75 0 M=5.75COSINE LINEAR INCREASING LINEAR DECREASING PEAK INLET PEAK EXIT
FIGURE 14. CRITICAL LOCATIONS (INCHES FROM INLET) FOR THE NONUNIFORMAXIAL FLUX DISTRIBUTIONS INVESTIGATED AT G =0.5 x10⁶LBM/HR-FT 2
- 25C~I.
19.6±.6 25.1I3
100
G =0.5 x 10⁶ LBM/HR - FT 2
PINLET= 135 to 100 psiaPEXIT ='1 5 to 85 psiaCRITICAL LDCATION OCCUREDAND 30.0 INCHES FROM INLETNOTED
28.31.4
2

AXIAL FLUX DISTRIBUTIONM=2.27 4.0 5.75
UNIFORM (M=I) 0COSINE 0 O 0
TEST CONDITIONSG= 1.0 x 10⁶ LBM/HR-FT 2
PINLET= 153 to 105 psiaPEXIT = 131 to 58 psia
D=.214 INCHESL = 30 INCHES
0
+10%
-10%
C 00
0 0
z./ofv
0
I --c.n - c *~-250
FIGURE 15. TOTAL CRITICALG = 1.0 x
-200 -150 -100
I
0
0
IN LET SUBCOOL IN G, A Hin, BTU /LBM
POWER FOR UNIFORM AND COSINE FLUX DISTRIBUTIONS AT106 LBM/HR-FT 2
-50
1.6
1. 5 F-
1.4[--
1.3
.2 "-
w z
m-
1.1
1.0|-
0.90

AXIAL FLUX DISTRIBUTIONM=
LINEAR INC
A LINEAR DECPEAK INLETPEAK EXIT
2.27 4.0 5.75V - V
S- 4
-10%
I.-
m
0
Lrw
0a-
IJ
0
TEST CONDITIONSG=1.0 x 10⁶ LBM/HR-FT 2
R =ET 153 to 105psia -
PEXIT = 131 to 58 psiaD = .214 INCHESL = 30 INCHES
z0
I-0
A
7 w-j
z0
I.-.
-250 - 200- 200U
INLE T SUBCOOLING ,-150
A Hin, BTU/ LBM
FIGURE 16. TOTAL CRITICAL POWER FOR LINEAR AND PEAKED FLUX DISTRIBUTIONS ATG=1.0 x 10⁶ LBM/HR-FT 2
1.6
+10%A
1.5
1.4k-
1.3k-
1.2-k-PEAK EXIT
1.1
0 1-
0.90-100 -50- 250

24.0±0
22.±.3 276±+.4 22.6±.6
14
- I
25.8±2
200+
23.3±.2 26.0±2
50
28.0±
TEST CONDITIONS
G = 10 x 10 6 LBM/HR -FT 2
PINLET= 153 to 105 psiaPEXIT = 13 1 to 58 psia
CRITICAL LOCATION OCCURED
D = .214 INCHESL = 30 INCHESBETWEEN 29.5
AND 30.0 INCHES FROM INLET UNLESS OTHERWISENOTED
.522.1±.7
29.3t
28.9±.2 22.4t.2
100-
50
m-j
m
0
z0J00
I
z
29.2 ± .4
2. 29.3±.3
28.6±.5
o M=2.27 VM=4.0 *M=5.75 V M=2.27 Y M=5.75 AM= 2.27 A M=5.75 # M=5.75-wM=5.75COSINE LINEAR INCREASING LINEAR DECREASING PEAK INLET PEAK EXIT
FIGURE 17. CRITICAL LOCATIONS (INCHES FROM INLET) FOR THENONUNIFORM AX IAL FLUX DISTRIBUTIONS INVESTIGATEDAT G = 1.0 x 10⁶ LBM/HR-FT 2
-250
11.7524.2±.3
28.0 ± .3
.1 41

AXIAL FLUX DISTRIBUTIONM=227 4.0 5.75
UNIFORM (M=I) 0COSINE 0 * 0
TEST CONDITIONSG=2.Ox 106 LBM/HR-FT 2
PINLET = 22
pEXIT = 12
D =.214
7 to 110 psia0 to 72 psia
INCHESL = 30 INCHES
0
m
0CL
c-
0
-
0
044 40
-200INLET SUBCOOLING, BTU/ LBM
FIGURE 18. TOTAL CRITICAL
AT G= 2.0 x 10⁶
POWER FOR UNIFORM
LBM/HR- FT 2
AND COSINE FLUX DISTRIBUTIONS
2.6
2.4 k-
2.2 1-
2.0k-
81-
+10%
-10%
00(XCRIT= -6/%)
61-
1.4
-300 -250
c,)
-150 -100

2.6
A EU - r-% A IJ " LJIVI 1 I 1
PEAK INLET - - PINLET - 227 to 110 psia2.4- PEAK EXIT - - 4 PEXT = 120 to 72 psia
m D = .214 INCHESto L = 30 INCHES
- 2.2-xUi
i~r z
2.0- -+ D
-10% \00
-0 (
-1.8 w-- 7.) V - -
(XCRIT - %z~T=-%
1 .6 44
- 300 - 250 - 200 - 150 -0
INE SUCOLIG 70 /,o)ULB
G~~~~~ ~1 psiax1 6LM/R-F
z
V
-10
H A~ j CINLT SBOLNAH T/B
FIGURE 19. TOTAL CRITICAL POWER FOR LINEAR AND PEAKED FLUX DISTRIBUTIONS AT
G = 2.0 x 10⁶ LBM/HR -FT 2

(XCRIT= 6%)
. 16.3±.
25.9±.4.,
22.5±. 4
26.9±.4
22.0' 21.8±1.2
_ 27.9t.9 251t4 23.3±0
21.8 22.0_ 23.I±. 23.9t3
TEST CONDITIONSG =2.0 x 10⁶ LBM/HR -FT 2PINLET = 2 2 7 to 110 psiaPEXIT = 120 to 72 psiaD =.214 INCHESL = 30 INCHES
I) CRITICAL LOCATION OCCUREDBETWEEN 29.5 AND 30.0 INCHESFROM INLET UNLESS OTHERWISENOTED
2) XCRIT>O% UNLESS OTHERWISENOTED
19.9±.4
270±.2
0 M=2.27 OM=4.0 OM =5.75 V M=2.27 y M=5.75 a M=2.27 A M=5.75 M = 5.75 M =5.75COSINE LINEAR INCREASING LINEAR DECREASING PEAK INLET PEAK EXIT
FIGURE 20. CRITICAL LOCATIONS (INCHES FROM INLET) FOR THE NONUNIFORMAXIAL FLUX DISTRIBUTIONS INVESTIGATED AT G=2.OxlO6 LBM/HR-FT 2
-300
- 25 0
28.9±.822.4t
109 ±.I 22.3XCRIT=-7%) (XMT=-5%)
200
150
-100

D=.214 INCHESL 30 INCHES
AXIAL FLUX DISTRIBUTIONM = 2.27 4.0 5.75
LINEAR INC VLINEAR DEC A
- A
- A
I)DATA NOT REPRESENTED BYLINES ARE INDIVIDUALLY -PRESEN TED
2) XCRITO UNLESS OTHERWISENOTED
G = 2.Ox 106
1500 (XCRIT: -6%)
1.0 x 106
x 106LINEAR INC M = 2.27
LINEAR INC M =5.75
-300 -200INLET SUBCOOLING, AH In ,
-100 -OBTU/LBM
FIGURE 21. SUMMARY OFDECREASING
EFFECT OF LINEARFLUX DISTRIBUTIO1
INCREASING ANDNS ON TOTAL
CRITICAL
2.5
-201-
- 2.O
O0x
0a-
0+10%-10 %
POWER

-202-
+ 10*/%
-10 */o- - 10/
D = .214 INCHESL = 30 INCHES
PEAK INLET (M=5.75) *PEAK EXIT (M =5.75) W
XCRIT>O UNLESS OTHERWISENOTED
G =2.0 x10 6 LBM T 2
2501
+10%
10% PEAK INLET
G =1.0x 10⁶
PEAK EXIT
in
bx
0:
'C
0cy
0
_j
C-)
0
-300 -200
z0
0
z0-
cU
-100INLET SUBCOOLING, AHin,BTU/LBM
FIGURE 22. SUMMARY OF EFFECT OF PEAK INLET AND EXIT FLUXDISTRIBUTIONS ON TOTAL CRITICAL POWER
2.5
2.0
1.51
0UN/FORM PEAK INLET
+10% uy1wG =0.5 x 10⁶
-10% PEAK EXIT

INLET SUBCOOLING, A HINLET, BTU/ LBM
FIGURE 23. TOTAL CRITICAL POWER FOR DATA OF BERTOLETTI ET AL.
1.8
0
c-
C)
0a_
0
1.7
1.6
1.4
1.3
1.2
1.1
(REE 11)

TEST SECTIONG =I.Ox 106 LBM/HR --F T 2
P = 2000 psiaD =.422 INCHESL = 72 INCHES
+10%
- 10 %
AXIAL FLUX DISTRIBUTION
UNIFORM 0CENTRAL MAX IMUM CPEAK INLETPEAK EXIT 0CENTRAL MAXIMUMWITH STEPPED SPIKE
I4 0
M= 1.0M= 3.57M= 5.0M = 5.0M=5.0
-150 -100INLET SUBCOOLING,
-50AHINiLT, BTU/LBM
FIGURE 24. TOTAL CRITICAL POWER FOR DATA OF SWENSON (REF. 5)
2.6
2.4 1-
2.2 k-
2.0 V-
81 -
61-
1.4
2 -
-200
z0
0
w
I-
cn
0

-205-
6.0- TEST CONDITIONSG = 2.5 x 10⁶ LBM/HR -FT 2
P = 1000 psiawg D = .446 INCHES
L = 72 INCHESD0
to +10 %
- 5.0--~x
C35-1-10%
0 0%
0Q0
() z
AXIAL FLUX DISTRIBUTION
0 UNIFORM M =.O 0 z
COSINE M= 5.0 *3.0- PEAK INLET M=5.0 $
PEAK EXIT M=5.0 <
-150 -100 -50INLET SUBCOOLING, A HINLET, BTU / LBM
FIGURE 25 TOTAL CRITICAL POWER FOR DATA OF BABCOCK ANDWILCOX (REF 15)

A~.
PC -+ EXIT
CRITICALLOCATION
I IIXINLET X-O XAT BUBBLY XC
ANNULARTRANSITION
FIGURE 26a. LINEARDECREASING HEAT FLUX
01.0er
-J (q/A) AT CRITICIL
CONDITIONS
w
WALL SUPERHEAT, TWALLTSAT
FIGURE 26b. (q/A)i AT CRITICALCONDITIONS
TEST CONDITIONSFIXED G,P, D,L
cr
1.0
cr'-7 QC,
(q /A\c : ON'4 7-,
(q /A) i A001(/)k
-o* HEAT FLUX REQUIREDFOR NUCLEATION, (q/A)I
i IX= 0 Xc
LOCAL QUALITY,X
FIGURE 26c. HEAT FLUXCONDITIONS ALONGENTIRE TEST SECTION
TEST CONDITIONSFIXED G, F D,
\,*,CRITICAL CONDITION DUE TONUCLEATION-INDUCED
FILM DISRUPTION
- CRITICAL CONDITION DUE TOrANNULAR FILM DRYOUTI
AHANN-xFIGURE 26d. OPERATING LINES FOR TEST
SECTION FOR QTOT EQUALAND LESS THAN QCRIT
AHANN-cFIGURE 26e EXPECTED LOCUS OF CRITICAL
CONDITIONS
-J
w
00j
zcr 1., 7 7 z '/ 7777-7
--

-207-
MAXIMUM CAVITY RADIUS (FT) REQUIRED FOR VARIOUS PRESSURES
P=2000psia 4 .2 .1 06 .04 .02 .01 .006XIO-5FT
.1 .2 4 .6 .8 LO 2 4 6 810 20 40 60 100WALL SUPERHEAT, TWALL-TSAT, *F
FIGURE 27 BERGLES-ROHSENOW CRITERIA (REF 35) FORINCIPIENT BOILING (q/A)i=15.60 Pl1 56
(TWALL-TSAT) 2 30/p 0 .0 2 34
IX 107
IX10 6
IX10 5
IX104

I x 10686
4
2
1 x10 5
86
4
2
1 x 10⁴ 1 I I I I1 2 4 6 8 10 20 40 1 2 4 6 810 20 40
WALL SUPERHEAT, TWALL-TSAT ,F
FIGURE 28. VARIATION OF TWO PHASE HEAT TRANSFER COEFFICIENT (h)WITH MASS FLOW RATE (G)hTP PER
hTp = 3 .5hL
)ENGLER-ADDOMS
(I/Xtt) 0 5 where hL
AND QUALITYCORRELATION
-0.023 L
(X)(REF 38)
GD) 08Pr 0.4
MLL (PL
J_ = ( .)-.9(Vv_ Mv )0-Xtt i-X VL ML
I-
I
m
-
I.-

-209-
I I 1 1I I ITEST CONDITIONSG=I.0 xO 6 BTU/HR-FT 2
P = 78psiaX .38D = .214 INCHESL = 30 INCHES
DATA REPRESENTS CRITICALCONDITIONS OF TEST SECTIONNO. 1271
/A)i AT CRITICAL LOCATION61 x 105 BTU/HR-FT 2
TWALC TSAr AT(q/A) i = 9.5*F
1.0I I I I
WALL SUPERHEAT,10
TWALL TSAT I 0F
FIGURE 29. TYPICALFOR INCIPILOCATION
DETERMINATION OF HEAT FLUX REQUIREDENT BOILING, (q/A); , AT THE CRITICAL
4 L2 -
/
(q2.
ti~
x-j
wX
I x 1068
6
4
2
Ix 1058
6
4 k
2
1 x 10⁴
4-
/t/ I
I I V
100.

-210-
TEST SECTION NO. 1271LINEARLY DECREASING HEAT FLUXG =1.0 x 10⁶ BTU/HR -FT 2
PIN = 130 psia D = .214 INCIPoy= 66 psia L = 30 INC
AHin= - 249. 8
M = 2.27
HESHES
BTU/LBMLOOCA
EXCESS FLUXOVER THAT REQUIREDFOR INCIPIENT BOILING
ASSUMED INITIATIONANNULAR FLOW
-.20 0 .20LOCAL QUALITY, X
OF
.40
FIGURE 30. HEAT FLUX CONDITIONS ALONG TEST SECTIONLENGTH
2 F-
I x 106
8
6
4
I.-
m
0
-ju-
wm
2 F-
I x 105
8
6
4
2 L-. 40 .60

-211-
60.0
40.0
x
'c
'20. 0z0
w10.0.z 8.0
o 6.0
.40
4.20
a
wcE
~2.0-
0
>< 1.0
u-~ .80
.600-Ju- .4000
rr .20
ENTHALPY200
INCREASE, ANN300
ULAR TRAN400
SITION500
TOLOCAL POSITION, AHANN , BTU/LBM
FIGURE 31. OPERATING LINES FOR TEST SECTIONFOR QTOT EQUAL TO AND LESS THAN
crLINEAR DECREASING FLUX
TUBE 1271M = 2.27G = 1.0 x 10⁶ BTU/HR -FT 2
AHi =-246.I BTU/LBMA INDICATES CRITICAL LOCATION -
--- 3 INCH LENGTH OF TEST SECTION
%
0
%
0 C-\\p \
LI
I I I
F-
100
1271QCRIT
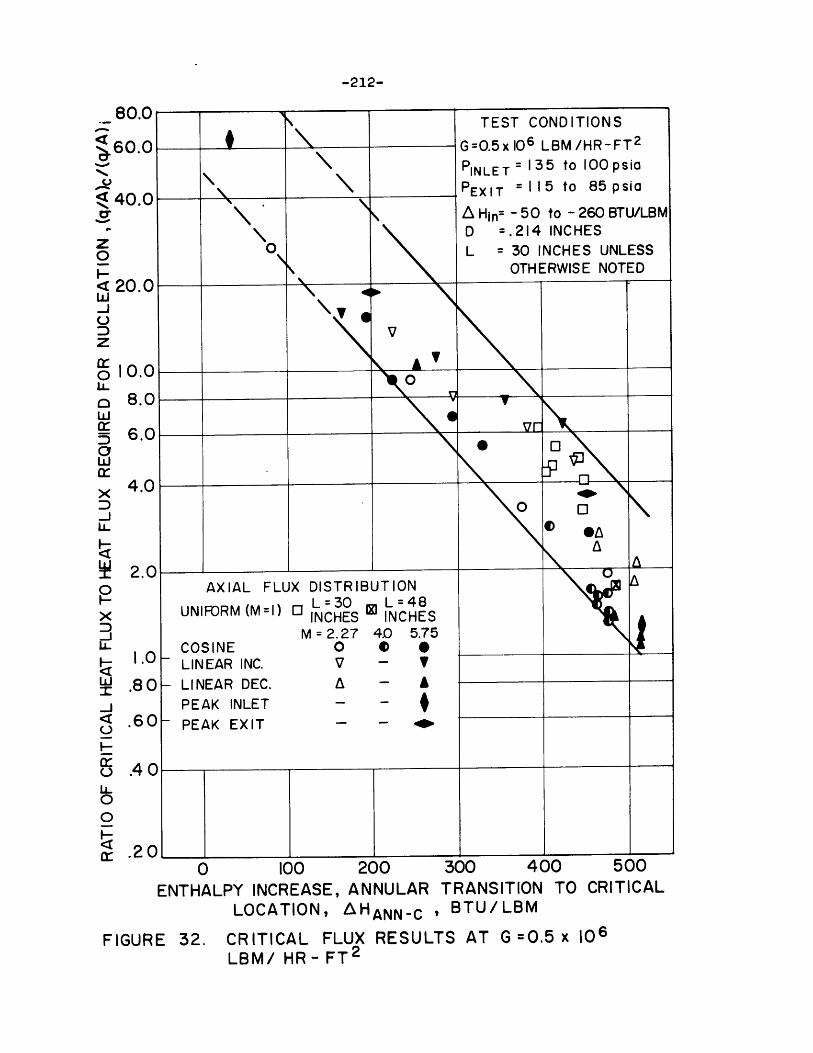
-212-
80.0
60.0
5 40.0
z0
6 20.0w
zc:010.0
N8.0w
o
6.0wa:
u-
~2.0
x-
I<- 1.0w .80
< .60
o .4 Cu-00
cr .20I I
0
\\ ~:A
0 0
0
AXIAL FLUX DISTRIBUTION
UNIFORM (M=1) 0 L=30 0L=48INCHES INCHES
M=2.27 4.0 5.75COSINE 0 0 *LINEAR INC. v - v
- LINEAR DEC. A - A
PEAK INLET - -
- PEAK EXIT - -
TEST CONDITIONS
G=O.5xlO6 LBM/HR-FT 2
PINLE T = 135 to 100 psia
PEXIT = 115 to 85 psia
A Hn=DL =
- 50 to - 260 BTU/LBM.214 INCHES30 INCHES UNLESSOTHERWISE NOTED
0 100 200 300 400ENTHALPY INCREASE, ANNULAR TRANSITION TO
LOCATION, AHANN-C , BTU/LBM
500CRITICAL
FIGURE 32. CRITICAL FLUX RESULTS AT G =0.5 x 10⁶LBM/ HR- FT 2
1 4- A ft I I I-

-213-
AI I TEST CONDITIONS
0q
z
M
0
a
wa:
C
a
wxx_jL'
4wM0
x-
I<-
wx
-0
0
00r
60.0
40.0
20.0
IQO8.0
6.0
4.0
2.0
1.0
.80
.60
.40
.20100 200 300 400 500
ENTHALPY INCREASE, ANNULAR TRANSITION TO CRITICALLOCATION, AHANN-C, BTU/ LBM
FIGURE 33. CRITICAL FLUX RESULTS AT G= 1.0 x 10⁶LBM/HR -FT 2
-AG=1.O x 106 LBM/HR-FT 2
PINLET = 153 to 105 psia
PEXIT =131 to 38 psia
A H In = - 60 to -270 BTU/LBMD = .214 INCHES
L = 30INCHES UNLESSOTHERWISE NOTED
0
AXIAL FLUX DISTRIBUTION
UNIFORM (M=) INCHES INCHES A#*M = 2.27 4.0 5.75 -
COSINE0 0LINEAR INC. V - V
-LINEAR DEC. 1 - APEAK INLET - - #PEAK EXIT - -

0r
Zz
Z
Oz
woJ0
LL0w
a:w
-J
U-
wm0
x
-
w
I-J
0
0
U-0r
60.0
40.0
20.0
1 0.0
8.0
6.0
4.0
2.0
1.0.80
.60
.40
.20
-v \
AXIAL FLUX DISTRIBUTION
M =2.27 4.0 5.75
-UNIFORM (M=I) 0COSINE 0 0 0LINEAR INC. V - VLINEAR DEC. A - A
PEAK INLET - -
PEAK EXIT - - +
1 |
100 200 300 400 500ENTHALPY INCREASE, ANNULAR TRANSITION TO CRITICAL
LOCATION , AHANN-C , BTU/LBM
FIGURE 34. CRITICAL FLUX RESULTS AT G = 2.0 x 10⁶LBM/ HR -FT2
TEST CONDITIONSG=2.OxlO6 LBM/HR-FT 2
PINLET = 227 to I10 psia
PEXIT = 120 to 72 psiaD = .214 INCHESL = 30 INCHESA Hin= -100 to - 280 BTU/LBMNOTE : TEST SECTIONS#506, 2501 AND 2554 WERE
SUBCOOLED AT CRITICALLOCATION AND THEREFOREARE NOT SHOWN
..
e

-215-
REQUIRED CAVITY SIZE
wz 10-3
0
z
a-
W10-4 --
w
x
L-i
z
w
C')w-oz0
zw
1076
3Xl0-7 -10- 4
FIGURE 35. DIMENSIONLESS REPRESENTATION OF BERGLES-ROHSENOW NUCLEATION THEORY. THE EFFECTOF LIMITED MAXIMUM CAVITY SIZES IS SHOWNFOR P=100 psia (TW~-.1) ONLY
10-3 10-2
DIMENSIONLESS TEMPERATURE, AT10-1

-216-
40.0
TEST CONDITIONSP ATMOSPHERIC
20.0 G =.088 x 106 LBM/HR -FT 2
D = .366 INCHES
AHIN= -4.0 to - 135.0 BTU/LBM
1 0.0
8.0 - - -
6.0 ±30% QCRITIC UPPER IMIT
wS4.0
TEST SECTION LENGTH
x U 9 INCHESD 2.0 112 INCHES 1*%- 2.0- 18 INCHES -
o &1 24 INCHESA2 48 INCHES LOWER LIMIT OF DATA
X N 72 INCHES_1 0 96 INCHES- 1.0 --- CONNECTS TESTIJ SECTIONS OF EQUAL
0.80 LENGTH
S0.60 tlO% QCRITICAL
o 0.40 n M
0.0
200 300 400ENTHALPY INCREASE,
500 600 700 800ANNULAR TRANSITION TO CRITICAL LOCATION
A HANN -C , BTU/ LBM
UNIFORM FLUX DISTRIBUTION DATA OF HEWITT ET AL. (REF41)FIGURE 36.

I I I I80.0-
0
50.0-
10.0
35.0 -
NL
F-
w I.0-J
9 0.5
-00
ti O.210 100 200
ENTHALPY300 400 0
INCREASE, ANNULAR
I I ITEST CONDITIONS
G = 1.0 x 10 LBM/HR FT 2 ._A HIN = -159.4 BTU/LBMTEST CONDITIONS
G = 1.0 x 10⁶ LBM/HRFT2 .AHIN = - 246.3 BTU/LBM
P = 127 to 52 psiaD =.214 INCHESL = 30 INCHES
0 INDICATESCR ITICAL LOCATION
o' - -
- CRITICALREGION LIMITSFROM FIG. 33
UNIFORM FLUX DISTRIBUTIONTEST SECTION 132
i i I i
100 200 300 400TRANSITION TO LOCAL
0 100 200 300POSITION, AHANN-x, BTU/
400LBM
FIGURE 37. OPERATING HISTORIES FOR TOTAL INPUT POWER UP TO THE CRITICAL POWER(UNIFORM AND LINEAR FLUX DISTRIBUTIONS)
LINEAR INCREASING FLUX DISTRIBUTEOTEST SECTION 1204
i i - I I
TEST CONDITIONSG =1.0 x 10⁶ L BM/HR FT 2
AHIN = -70.5 BTU/LBM
P =140 to 63 psla
D. 214 INCHESL= 30 INCHES
INDICATESCRITICAL LOCATION
\ \A'0'
- CRITICAL -
REGION FROMFIG. 33
LINEAR DECREASING FWX DISTRBUTIONTEST SECTION 1255
i i i I
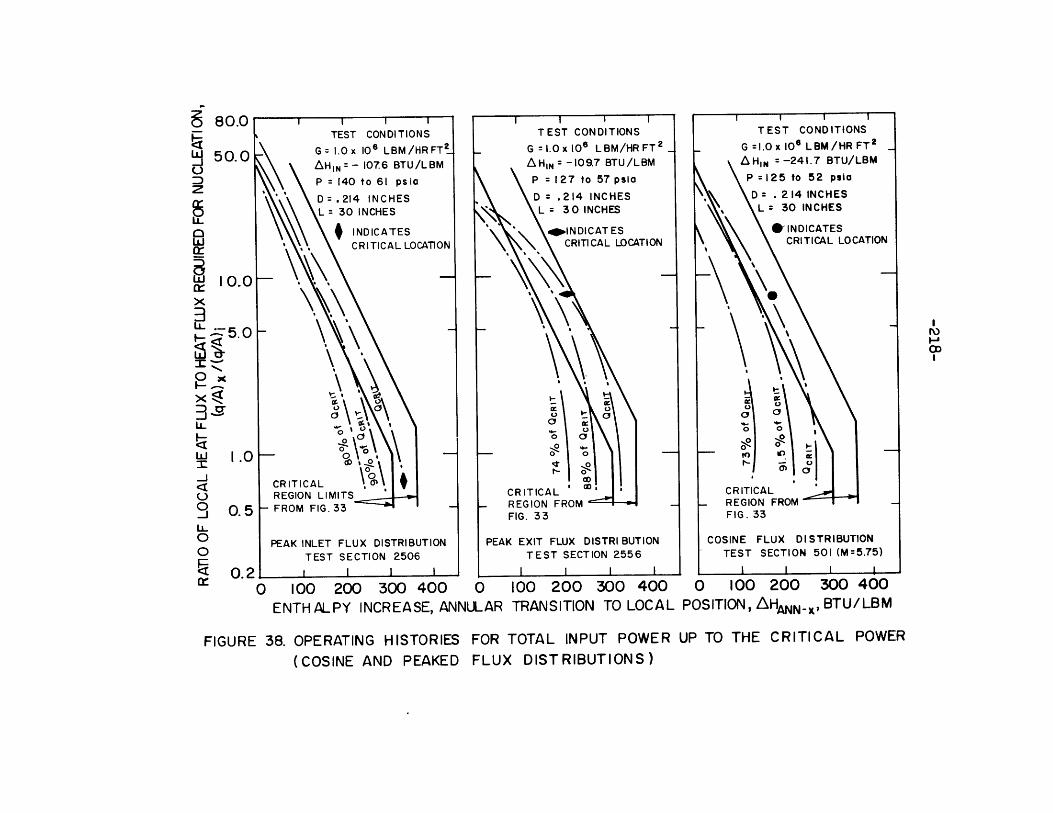
TEST CONDITIONS
G= 1.O x 106 LBM/HRFT?-
P :140 to 61 psicAHIN = - 107.6 BTU/LBM
D .214 INCHESL= 30 INCHES
INDICATESCRITICAL LOCATION
80.0
50.0
z
w
I 10.0x
LL
I-
w 1.0
01 0.5
LL00F
PEAK INLET FLUX DISTRIBUTIONTEST SECTION 2506
I I
I I ITT EST CONDITIONS
1|
G =1.0 x 10⁶ LBM/HR FT 2
A HIN = -109.7 BTU /LBM
P = 127 to 57 psia
PEAK EXIT FLUX DISTRIBUTIONTEST SECTION 2556
1 1 1 1
I I I I
TEST CONDITIONS
G=I.OxIOLBM/HRFT2
-
\A HIN =-241.7 BTU/LBM
P =125 to 52 psia
COSINE FLUX DISTRIBUTIONTEST SECTION 50[ (M=5.75)
I I I I
0 100 200 300 400 0 100 200 300 400 0 100 200 300 400ENTHALPY INCREASE, ANNULAR TRANSITION TO LOCAL POSITION, AHANN-x, BTU/LBM
FIGURE 38. OPERATING HISTORIES FOR TOTAL INPUT POWER UP TO THE CRITICAL POWER
(COSINE AND PEAKED FLUX DISTRIBUTIONS)
F
CRITICALREGION LIFROM FIG
H-
I-
I I I
-
i
i

-219-
100 200 300
ENTHALPY INCREASE, ANNULAR TRANSITIONTO LOCAL POSITION, HANN-X ,BTU/ LBM
FIGURE 39. EFFECT OF AXIAL FLUX DISTRIBUTIONON THE CRITICAL
80.0
50.0
x...
U- 0
0
zx o
M z
$oI0
LL0-3
-w
10.0
5.0
1.0
400
LOCAT ION

80.0
50.0
10.0
5.0
1.0
.5
.2100 200 300 400 0
CRITICAL LOCATIONS-o TEST SECTION 201D TEST SECTION 333* TEST SECTION 501
CRITICALREGION FROM _
4, FIGURE 33
TEST CONDITIONSG= 1.OX 106
LBM/HR-FT 2 .AHIN'-245 BTU/LBM
P= 131 TO 64 psia_D=.214 INCHES
L=30 INCHESM=MAXIMUM FLUX/ ,
MINIMUM FLUX
COSINE FLUX DISTRIBUTIONS LINEAR DECREASINGTRIBUTIONS
100 200
FLUX DIS-
300 400
ENTHALPY INCREASE, ANNULAR TRANSITION TO LOCAL POSITION, AHANN-X ,BTU/LBM
FIGURE 40. THE EFFECT OF M VALUE (RATIOTHE CRITICAL LOCATION
OF MAXIMUM TO MINIMUM FLUX) ON
I IIA CRITICAL LOCATION,
TEST SECTION 1252A CRITICAL LOCATION,
TEST SECTION 1553
TEST CONDITIONSG= I.0X10 6
LBM/HR FT2AHIN'- 2 4 T BTU/LBM
P=131 TO 64 psiaD= .214 INCHESL= 30 INCHESME MAXIMUM FLUX/
MINIMUM FLUX
- -

80.0
t
xHz
xo
u-~o cIz
o =0
w
0
-9E
50.0 - l)1kl ll lI"N-50. Nb G=0.5X 10⁶ LBM/HR-FT 2
SP=12 TO 93 psia \
D=.214 INCHESSL=30 INCHES
10.0 -CRITICAL.\
5.0 _REGION LIMITS '- CRITICALFROM FIG. 32 *REGIONA HIN =- 2374 BTU/LBM LIMITS FFTEST SECTION 2552 FIG. 32
1.0 A HIN = -101.7 BTU/LBMTEST SECTION 2553
.5 -PEAK EXIT FLUX DISTRIBUTION PEAK INL
0 100 200 300 400 500 0 100ENTHALPY INCREASE, ANNULAR
TO LOCAL POSITION, AHANNXFIGURE 41. THE EFFECT OF
LOCATION (PEAKINLET SUBCOOLING ON THE CRITICALEXIT AND INLET FLUX DISTRIBUTIONS)
200 300 400 500
TRANSITION, BTU/LBM

-222-
N| K TEST CONDITIONSG=0.5X10⁶ LBM/HR-FT 2-P =124 TO 106 psiaD=.214 INCHESL = 30 INCHES
z0
H
C-)
z
0
Lii
0-
LL%
C-)0-J
00
As IN = -2324 BTU/LTEST SECTION 1560
LINEAR DECREASING FLUX DISTRIBUTION
oo 200 300 400 500ENTHALPY INCREASE, ANNULAR TRANSITION TOLOCAL POSITION, AHANN-X , BTU/LBM
FIGURE 42. THE EFFECT OF INLET SUBCOOLING ON THECRITICAL LOCATION (LINEAR DECREASINGFLUX DISTRIBUTION)
CRITICAL REGION NLIMITS FROM FIG. 32

-223-
TEST CONDITIONS
PCRITICAL = 4 0 to 175 psia
AHin = -50 to-280 BTU/LBMD = .214 INCHESL = 30 AND 48 INCHES-
z0
w
z
warw
-J
w
x
w
-0
0
cr300 400 500
ENTHALPY INCREASE, ANNULAR TRANSITION TO CRITICALLOCATION, A HANN -C , BTU/LBM
FIGURE 43. COMPARISON OF CRITICAL FLUX RESULTS FOR THERANGE OF MASS VELOCITIES INVESTIGATED
60.0
40.0 1-
20.0-
10.0 k-
8.0
6.0
4.01-
2.0 k-
200
1.0
.80
.20100
.60-
.40-

0r
0*
z0
z0r
LL0rQ
-
LJ-
0
U-0J
0
0r
0.20
80.C
60.0
40.
20.C
I 0.c
8.C
6.C
4.0
2.C
I.C0.80
0.60
0.40
0 200 400 600 800ENTHALPY INCREASE, ANNULAR TRANSITION TOPOSITION, A HANN -X , BTU/ LBM
1000LOCAL
FIGURE 44. EFFECT OF LENGTH ON THE CRITICALCONDITION
-2214-
DATA OF HEWITT ET AL(REF41)
TEST CONDITIONS
P ~ ATMOSPHERICG= .088 x K 6 LBM/HR-FT 2
D= .366 INCHESAH -110 BTU/LBM
LOWER LIMIT OFCRITICAL CONDITIONFROM FIGURE 36
CRITICAL LOCATION-INDICATED BY SYMBOL
BELOW FOR TESTSECTION OF LENGTH \
0 9 INCHESE 12 INCHESI 18 INCHES N
E 24 INCHES
-12 48 INCHES[5 72 INCHES0 96 INCHES

-225-100.0
80.0
60.0
40.0
20.0
10 .c
8.0
6. C
4.C
2.c
I.c
0.8 C
0.6 C
0.4 C
I
TYPICAL FOR 96TEST SECTIONS
DATA OF HEWITT ET AL(REF 41 )
TEST CONDITIONSP ~ ATMOSPHERICG =.088 x 106 LBM/ HR-FT 2
D=.366 INCHESL= 12 INCHES
I3 12 INCH LONG TESTSECTION CRITICALLOCATION
0 96 INCH LONG TESTSECTION CRITICALLOCATION
LIMIT OFAL CONDITIONFIGURE 36
LOWER LIMIT OFCRITICAL CONDITIONFROM FIGUrE 36
UPPERCR ITIC
6 FROM
-4.64
-23.1
INCH
-------
-------
- - - -
0 200 400 600 800ENTHALPY INCREASE, ANNULAR TRANSITION TOPOSITION , AHANN-X,BTU/LBM
1000LOCAL
FIGURE 45. EFFECTCON DIT I
OF INLETON
SUBCOOLING ON THE
.\
= - P
0.
CRITICAL
AHin:x-130.3
-I 12.9 0 '7
2c

1000800
600 - SPIKE LENGTH =.085 INCHES SPIKE LENGTH =.50 INCHES SPIKE LENGTH 1.5 INCHES
400
M=417
200
a 0 zM10050 80 -0
0U. M=5 604-o 60 - te
20 -r0
1 0 -
x4 CRITICAL REGION LIMITS6- D S C C CwA FROM FIGURE 33
x2OM
=51 T 45
-
lo-
08 -AHIN -674 BTU/LBM tHIN=- 1190 8TU/LBM AHIN=119 3 BTU/LBM
x 60 -CINDICATES THECRITICAL LOCATION (INDICATESTHE CRITICAL LOCATION INDICATES THE CRITICAL LOCATION .-J
u40
0 50 100 150 200 250 300 350 0 50 100 150 200 250 300 350 0 50 100 150 200 250 300 350ENTHALPY NCREASE, ANNULAR TRANSITION TO LOCAL POSITION, AHANN-x BTU/LBM
FIGURE 46 THE EFFECT OF FLUX SPIKE LENGTH ON THE CRITICAL CONDITION FOR G=10X10 6 LBM/HR-FT2

100.0 | I_cr80.0 -
60.0 - SPIKE LENGTH 1.0 INCHES SPIKE LENGTH= 5.0 INCHES SPIKE LENGTH =9.0 INCHES
400 ---
N N% N.CRITICAL REGION LIMITSN0.0 -.- - -- FROM FIGURE 33
10.0 -
8Bo - -- - -; 0. NTEST SECTION
6.0 - - 7250, M=2 27
AI --
-pa
t 20 -- -
TEST SECTION 7550, M=5.7
x - TEST SECTION 7750, M=70
FLAGGED SYMBOLS INDICATE THE CRITICAL FLAGGED SYMBOLS INDICATE THE CRITICAL FLAGGED SYMBOLS INDICATE THE CRITICALLOCATION LOCATION LOCATION
w 4 LCTO
0 50 100 150 200 250 300 350 0 ~50 100 150 200 250 300 350 0 50 100 150 200 250 300 350
ENTHALPY INCREASE, ANNULAR TRANSTION TO LOCAL POSITION, AHANN-X , BTU/LBM
FIGURE 47. THE EFFECT OF FLUX SPIKE LENGTH AND M VALUE (RATIO OF MAXIMUM TO MINIMUM FLUX) ON THE CRITICAL CONDITION FOR G= l.OX 106 LBM/HR-FT2 AND
AH 2s-I10 BTU/LBM

-228-
5000- TEST CONDITIONSG=2.5X10 6 LBM/HR-FT 2
Pl000 psiaD=446 INCHES
Z L=72 INCHES
AHINLET=-10 TO-175BTU/LMBw IVARIATION DUE TO
UNCERTAINTY INZ (000 -CRITICAL LOCATION
0 00w500
w
Lz- 200
w
0H 100
u 50AXIAL FLUX DISTRIBUTIONt 50 UNIFORM M=I oI
m ~COSINE M =5.0 0PEAK INLET M=50 $PEAK EXIT M=5.0 +
20LL L
-40 -20 0 20 40 60 80 (000t ENTHALPY INCREASE, ANNULAR TRANSITION TO LOCAL POSITION
AHANN-C, BTU/LBM
FIGURE 48. CRITICAL FLUX RESULTS AT 1000 PSIA FROMBABCOCK AND WILCOX DATA (REFERENCE 15)

-229-
$5000 5 -TEST RUNS I,2 AND 4G=2.5X10 LBM/HR-FTP= 1000 psiaD=.446 INCHESL=72 INCHES
2000 -AHINLET--30 BTU/LBMz0 1o CRITICAL LOCATION FOR
UNIFORM FLUX DISTRIBU-S1000 -- TO
u 500 - --
50 -
0 200 -
ti looII
0 00
x D 50-J
LiHX
-J20
c- -40 -20 0 20 40 60 80 100u ENTHALPY INCREASE, ANNULAR TRANSITION TO LOCAL POSITIONo AHANN-X , BTU/LBM0
FIGURE 49. ESTIMATION OF THE CRITICAL REGION WIDTH (IN % TOTAL
INPUT POWER) OF FIGURE 48 FOR 1000 psia DATA(REFERENCE 15)

-230-
G=I.0X10 6 LBM/HR-FT 2
P= 2000 psiaD=441 AND .411 INCHES
L=72 INCHESAHIN=-20 TO-1OO
BTU/LBM
IVARIATION DUE TOUNCERTAINTY INCRITICAL LOCATION
2000
1000
500
200
100
50
20-20 20 40 60 80
'-p
100
ENTHALPY INCREASE , ANNULAR TRANSITION TO LOCAL POSITIONA HANN-C , BTU -LBM
FIGURE 50 CRITICAL FLUX RESULTS AT 2000 PSIA FROMBABCOCK AND WILCOX DATA (REFERENCE 5)
5000 I-
AXIAL FLUX DISTRIBUTIONUNIFORM M= 1.0 o
- CENTRAL PEAK M= 3.05PEAK INLET M=5.0 $PEAK EXIT M= 5.0 +
-40

-231-
4 TEST RUN 47'5000 -SG=I.0X10 6 LBM/HR-FT 2
X P= 2000 psia0\0 D=411 INCHES
' L=72 INCHES
z te AHINLETu-20 BTU/LBM
2000- CRITICAL LOCATIONFOR CENTRAL PEAK
WITH SPIKE FLUXI DISTRIBUTIONz I A
10000
500a0
x
w AN-,BT/M
200
0H100
4 50
0
LLo -40 -20 0 20 40 60 80 1000 ENTHALPY -INREASE, ANNULAR TRANSITION TO LOCAL POSITION
AHANN..X , BTU/LBM
FIGURE 51. ESTIMATION OF THE CRITICAL REGION WIDTH (IN%TOTAL INPUT POWER ) OF FIGURE 50 FOR 200OPSIADATA REFERENCE 5)

-232-
r
O"
z
z
LL
0
0*
0 u
I-w
-
C-)
LL
0O1
0 10 20 30 40 50 60ENTHALPY INCREASE ANNULAR TRANSITION TO LOCAL POSITION
AHANN-X , BTU/LBM
FIGURE 52. THE EFFECT OF INLET SUBCOOLING ON CRITICAL FLUXRESULTS FOR COSINE FWX DISTRIBUTION WITH FLUXSPIKE (REFERENCE 5)
4000
2000
1000
800
600
400
200