Mangement Conference 2006 - ENTREPRENEURIAL FUNCTIONALITY OF
Upload
uni-marburgCategory
view
0download
0
Acta Biomaterialia xxx (2013) xxx–xxx
Contents lists available at ScienceDirect
Acta Biomaterialia
journal homepage: www.elsevier .com/locate /actabiomat
The effect of nanoparticle degradation on poly(methacrylic acid)-coatedquantum dot toxicity: The importance of particle functionalityassessment in toxicology
1742-7061/$ - see front matter � 2013 Acta Materialia Inc. Published by Elsevier Ltd. All rights reserved.http://dx.doi.org/10.1016/j.actbio.2013.09.041
⇑ Corresponding author. Tel.: +32 9264 8076; fax: +32 9264 8189.E-mail address: [email protected] (S.C. De Smedt).
Please cite this article in press as: Soenen SJ et al. The effect of nanoparticle degradation on poly(methacrylic acid)-coated quantum dot toxiciimportance of particle functionality assessment in toxicology. Acta Biomater (2013), http://dx.doi.org/10.1016/j.actbio.2013.09.041
Stefaan J. Soenen a,b, José-Maria Montenegro c, Abuelmagd M. Abdelmonem c, Bella B. Manshian d,Shareen H. Doak d, Wolfgang J. Parak c,e, Stefaan C. De Smedt a,⇑, Kevin Braeckmans a,b
a Faculty of Pharmaceutical Sciences, Ghent University, Ghent, Belgiumb Center of Nano- and Biophotonics, Ghent University, Ghent, Belgiumc Department of Physics, Philipps University of Marburg, Marburg, Germanyd DNA Damage Group, Swansea University, Swansea, UKe CIC biomaGUNE, San Sebastián, Spain
a r t i c l e i n f o
Article history:Received 16 May 2013Received in revised form 24 September 2013Accepted 30 September 2013Available online xxxx
Keywords:Quantum dotCadmiumToxicityDegradationParticle functionality
a b s t r a c t
Colloidal semiconductor nanoparticles (quantum dots) have attracted a lot of interest in technologicaland biomedical research, given their potent fluorescent properties. However, the use of heavy-metal-containing nanoparticles remains an issue of debate. The possible toxic effects of quantum dots remaina hot research topic and several questions such as possible intracellular degradation of quantum dotsand the effect thereof on both cell viability and particle functionality remain unresolved. In the presentwork, poly(methacrylic acid)-coated CdSe/ZnS quantum dots were synthesized and characterized, afterwhich their effects on cultured cells were evaluated using a multiparametric setup. The data reveal thatthe quantum dots are taken up through endocytosis and when exposed to the low pH of the endosomalstructures, they partially degrade and release cadmium ions, which lowers their fluorescence intensityand augments particle toxicity. Using the multiparametric method, the quantum dots were evaluatedat non-toxic doses in terms of their ability to visualize labeled cells for longer time periods. The datarevealed that comparing different particles in terms of their applied dose is challenging, likely due to dif-ficulties in obtaining accurate nanoparticle concentrations, but evaluating particle toxicity in terms oftheir biological functionality enables an easy and straightforward comparison.
� 2013 Acta Materialia Inc. Published by Elsevier Ltd. All rights reserved.
1. Introduction
The use of colloidal nanoparticles (NPs) in technological andbiomedical applications is vastly increasing [1,2]. There are cur-rently over 800 consumer products containing NPs, includingmany foods, beverages and cosmetics. The nanotechnology indus-try is growing very rapidly, and is predicted to have a total value ofUS$3.1 trillion by the year 2015 [3]. Currently, NPs are omnipres-ent in many different consumer products, but the number ofbiomedical applications is still limited due to several questionsremaining on the possible induction of toxic side-effects by NPs[4–6]. Uncertainties regarding the safety of NPs are being fed bythe continuous discovery of new pathways and mechanisms bywhich NPs may interfere with cellular wellbeing, which can eitherbe beneficial for biomedical purposes or pose serious threats to hu-man health [7]. One example is the recent finding that NPs can
induce DNA damage and chromosome mutations, as shown for car-bon nanotubes that were found to selectively stabilize human telo-meric i-motif DNA and inhibit telomerase activity [8]. To progresstowards use of NPs without risks, more data are required on the(toxic) effects of NPs on cells, tissues and whole organisms [9]. Inorder to fulfill the current needs in nanotoxicity research, NPsshould be screened rapidly on a variety of cells under standardizedconditions, enabling a comparison of data obtained for differentmaterials and between different research groups [10]. In this view,we recently established a multiparametric methodology that looksat the interactions between cultured cells and NPs in order to get aprofound knowledge of the possible effects of these materials oncultured cells [11]. Using a variety of cell types that have showngreat potential for nanotoxicity research [12–14], being primaryhuman umbilical vein endothelial cells (HUVECs), murine C17.2neural progenitor cells and rat PC12 pheochromocytoma cells,the obtained results are representative for a wide variety of celltypes. This methodology therefore allows for determining thenon-cytotoxic levels of NPs (i.e. the concentration of NPs
ty: The

2 S.J. Soenen et al. / Acta Biomaterialia xxx (2013) xxx–xxx
appropriate for cell labeling applications) and additionally helps inunraveling the mechanisms that are involved in the cytotoxicprofile of the NPs under investigation. Furthermore, by comparingthe data obtained against data for other NPs that have been testedunder identical conditions, physicochemical features of the NPsthat contribute to their cytotoxicity can be defined, paving theway for a more rational and safer NP design.
One important aspect with respect to rigorous NP toxicity test-ing is the design, purification and characterization of the NPs underinvestigation [15]. If any cytotoxic effects are to be ascribed to spe-cific physicochemical features of the NPs, it is of utmost impor-tance to test well-characterized NPs free of contaminants orimpurities [16]. In this direction, poly(methacrylic acid)(PMA)-coated CdSe/ZnS core–shell quantum dots (QDots) are auseful system, as these NPs are well defined and have been exten-sively characterized. QDots are small semiconductor NPs that pos-sess several exciting features such as high photostability, narrowand tunable emission spectra and high brightness [17]. Owing tothese properties, QDots have shown great potential for many bio-medical applications, including cell labeling applications [18–21],long-term tracking of (single) molecules [22], in vivo imaging[23,24] and photodynamic therapy [25,26]. However, despite theirexcellent photophysical properties, their toxicity, in particular dueto the release of Cd2+ ions [27,28], remains an issue of debate[29,30].
2. Materials and methods
2.1. Nanoparticles
CdSe/ZnS colloidal nanoparticles were synthesized and madewater-soluble as described in the Supplementary information.The nanoparticles were carefully characterized as also describedin full detail in the accompanying Supplementary information.
2.2. Cell culture
C17.2 neural progenitor cells and PC12 cells are maintained inhigh glucose Dulbecco’s modified Eagle’s medium (DMEM), sup-plemented with 10% fetal bovine serum, 5% horse serum, 2 mML-glutamine and 1% penicillin/streptomycin (Gibco, Invitrogen,Merelbeke, Belgium). Cells were maintained in a humidified atmo-sphere at 5% CO2 and fresh medium was given every other day.C17.2 cells were passaged (1/10) when reaching 90% confluency.PC12 cells were grown in 25 cm2 cell culture flasks (Corning,Amsterdam, The Netherlands) that were coated with collagen(rat tail collagen type I, Invitrogen, Belgium) and passaged (1/5)when growing in small clumps (�5 cells per clump and reaching70–80% confluency). Fresh medium was given every other day.
For some long-term experiments, such as the effect of intracel-lular pH on Cd2+ in time, and the toxicity derived from this freeCd2+, non-proliferating cell cultures are required as dilution ofthe number of particles per cell due to cell division abolishes anyattempt to analyze these parameters. Therefore, in the currentstudy, non-proliferating cell populations were established toenable the investigation the time-dependent effects of the intracel-lular environment on QDot functionality and toxicity. Next to ana-lyzing these effects without the problem of exponential QDotdilution, these conditions also better mimic the in vivo conditionswhere autologous cells or stem cells after transplantation showminimal proliferation. To establish non-proliferating cell popula-tions, cells were exposed with 60 lM Apigenin (Sigma–Aldrich,Bornem, Belgium) together with the Sil NP exposure. After removalof the medium, fresh media containing 60 lM Apigenin were used,where media were replaced for 50% every other day with fresh
Please cite this article in press as: Soenen SJ et al. The effect of nanoparticleimportance of particle functionality assessment in toxicology. Acta Biomater (
Apigenin-containing medium for the duration of the experiments.Under these conditions, cell death was found to be minimal andcell proliferation was reduced to �9% of the normal value. Further-more, removal of the medium with normal cell culture mediumnot containing any Apigenin resulted in a recovery of cell prolifer-ation to near-control levels after �3 days.
Primary human umbilical vein endothelial cells (HUVECs) werekindly provided by Dr. Aldo Ferrari (ETH Zurich, Switzerland). Forcultivation, cells were kept in 75 cm2 cell culture flasks (Corning,Amsterdam, The Netherlands) coated with collagen (rat tail colla-gen type I, Invitrogen, Belgium) prior to cell seeding. The cells weremaintained in endothelial cell basal growth medium and growthsupplement (Cell Applications, Tebu-Bio, Le Perray en Yvelines,France) and passaged (1/5) when reaching 80–90% confluency.Every other day, fresh medium was given. For HUVEC cells, the Api-genin treatment resulted in slight toxic effects and proliferationcould be impeded better using serum-free conditions. To establishnon-proliferating HUVEC cultures, cells were given endothelial cellserum-free defined medium (Cell Applications, Tebu-Bio, Le Perrayen Yvelines, France) when reaching high levels of confluency. Con-fluent HUVEC monolayers could then be maintained for at least1 week without any observable signs of cell death or reactive oxy-gen species (ROS) induction.
2.3. Cell–nanoparticle interaction studies
The following cell–NP interactions were studied; a full method-ology can be found in the Supplementary information that accom-panies this paper.
2.3.1. Intracellular QDot localizationTo evaluate possible endosomal localization of the QDots, C17.2,
HUVEC or PC12 cells were seeded in collagen-coated 35 mm diam-eter glass bottom MatTek dishes (MatTek Corporation, Ashland,MA, USA) at 4 � 104 cells per dish in 1.5 ml of full culture medium.Cells were allowed to settle overnight prior to being incubatedwith the lipophilic membrane tracer dye 3,30-dioctadecyloxacarbo-cyanine perchlorate (DiO; Molecular Probes, Invitrogen, Belgium)for 30 min at 2.5 lg ml�1. Next, a mixture of the QDot at 15 nMand the lipophilic dye DiO (2.5 lg ml�1) in full cell medium wasprepared and added to the cells for 30 min at 37 �C at a humidifiedatmosphere. Subsequently, the media were removed, cells washedthree times with phosphate buffered saline (PBS) and fixated with4% paraformaldehyde (PFA) for 15 min at ambient temperatureprior to visualization using a Nikon Cs1 confocal laser scanningmicroscope (Nikon Belux, Brussels, Belgium).
Cellular uptake of the PMA-coated QDots was also evaluatedusing transmission electron microscopy (TEM), following 24 hexposure of the various cell types to 10 nM of QDots, as describedin the Supplementary information.
2.3.2. Quantitative determination of cellular QDot levelsThe number of QDots per cell was determined by measuring the
cellular Cd2+ levels using the Measure-iT kit (Molecular Probes,Invitrogen, Merelbeke, Belgium) as described in the Supplementaryinformation.
2.3.3. Effect of pH on QDot stabilityThe effect of pH on QDot fluorescence intensity and release of
Cd2+ ions was determined by preparing three buffer solutions ofpH 7.4, 5.5 and 4.5, after which the QDots (5 nM) were exposedto these buffers for a period up to 5 days. Every 24 h, fluorescenceintensity or Cd2+ release was measured, as described in theSupplementary information.
degradation on poly(methacrylic acid)-coated quantum dot toxicity: The2013), http://dx.doi.org/10.1016/j.actbio.2013.09.041

S.J. Soenen et al. / Acta Biomaterialia xxx (2013) xxx–xxx 3
2.3.4. Determination of intracellular QDot degradationC17.2, PC12 or HUVEC cells were seeded in 75 cm2 cell culture
flasks at a density of 2.5 � 106 cells per flask and allowed to settleovernight. Then, the cells were given fresh medium containing10 nM of QDots and allowed to incubate for 24 h. For C17.2 andPC12 cells, their medium was supplemented with 60 lM Apigenin.For HUVEC cells, cells were allowed to form confluent monolayersafter cell labeling and medium was transferred to serum-free de-fined medium for culture of non-proliferative HUVECs. Next, mediawere aspirated, cells washed twice with PBS and fresh media opti-mized for non-proliferating cultures was given as described above,after which the cells were kept in culture for the duration of theexperiment. After 1, 2, 3, 4 and 5 days of further culture under pro-liferation-restricted conditions, cells from the various flasks werelifted and centrifuged at 0.4 rcf. The cells were redispersed in PBSand counted using a Bürker chamber. Then, 2 � 106 cells were ta-ken, which were centrifuged again, after which 50 ll of DMSOwas added to every pellet to lyse all cells. A 10 ll aliquot was col-lected from every sample and transferred to wells of a 96-wellplate, after which 200 ll per well of the Measure-iT kit was addedand Cd2+ concentrations were measured according to the manufac-turer’s instructions (kex: 490 nm; kem: 520 nm) using a WallacEnvision plate reader instrument. The Cd2+ concentrations weredetermined using the Cd2+ calibration curve which is part of thekit. Note that, as this is an end-point assay, the samples measuredafter 1, 2, 3, 4 and 5 days were all obtained from different flasks.Data are expressed as mean ± SEM for three independentexperiments.
Along with the determination of free cellular Cd2+ levels, the to-tal Cd2+ levels were determined at the same time points as de-scribed above. These data revealed no significant differences inthe total Cd2+ content (both free and QDot-associated) at the differ-ent time points. Previous experiments furthermore revealed nointerference of the QDots themselves with the assay readout, seeSupplementary information Section V.
For CdCl2-treated cells, a similar approach was followed, wherecells were incubated with CdCl2 at different concentrations (0, 1, 5,20, 50, 100, 250 or 500 nM) for 24 h, after which the cells werewashed twice with PBS, lifted and centrifuged at 0.4 rcf. The cellswere redispersed in PBS and counted using a Bürker chamber.Then, 2 � 106 cells were taken, which were centrifuged again, afterwhich 50 ll of DMSO was added to every pellet to lyse all cells andCd2+ concentrations were then determined as described above.
2.3.5. Determination of cell viabilityCell viability for all three cell types was assessed using an MTT
assay, both in proliferative and in non-proliferative cell popula-tions. This assay was performed both for cells exposed to QDotsand cells exposed to CdCl2. A full description of both methodolo-gies can be found in the accompanying Supplementaryinformation.
2.3.6. Determination of reactive oxygen speciesInduction of reactive oxygen species for all three cell types was
assessed using 10 lM 5-(and-6)-chloromethyl-20,70-dichlorodihy-drofluorescein diacetate, acetyl ester (CM-H2DCFDA; MolecularProbes, Invitrogen, Merelbeke, Belgium), both in proliferative andin non-proliferative cell populations. This assay was performedfor both cells exposed to QDots and cells exposed to CdCl2. A fulldescription of both methodologies can be found in the accompany-ing Supplementary information.
2.3.7. Determination of mitochondrial membrane potential and DNAdamage
For these studies, cells were incubated with the PMA-coatedQDots for 24 h at various concentrations (from 0 to 30 nM), after
Please cite this article in press as: Soenen SJ et al. The effect of nanoparticleimportance of particle functionality assessment in toxicology. Acta Biomater (
which mitochondrial membrane potential was evaluated spectro-fluorometrically using 20 lM JC-10 dye and DNA damage was as-sessed by staining for phosphorylated c-H2Ax using fluorescentantibodies followed by fluorometric plate reading as described infull in the Supplementary information.
2.3.8. Determination of HUVEC cell morphologyThe morphology of HUVEC cells was evaluated by exposing the
cells to the PMA-coated QDots for 24 h at concentrations at whichno acute toxicity was noticed (up to 20 nM), after which cells werestained for Tubulin and F-Actin and visualized using a Nikon Cs1confocal laser scanning microscope as described in the Supplemen-tary information.
2.3.9. Determination of PC12 functionalityThe ability of PC12 cells to induce neurite sprouting was evalu-
ated after exposing the cells for 24 h to the PMA-coated QDots atconcentrations at which no acute toxicity or effects on cell mor-phology were noticed (up to 10 nM). After QDot-exposure, the cellswere incubated with nerve growth factor for 48 h and stained fora-tubulin followed by confocal laser scanning analysis as describedin the Supplementary information.
2.3.10. Determination of QDot transfer in proliferating cellsQDot distribution in proliferation cells was evaluated as fol-
lows: C17.2, PC12 or HUVEC cells were seeded at 1.25 � 105 cellsper flask (5 ml total medium) and allowed to settle overnight, afterwhich the cells were incubated with the QDots at 0 or 2 nM for24 h. Following incubation, media were aspirated, cells washedtwice with PBS, lifted by trypsin and kept in culture in full medium,without any QDots, where for half of the dishes, cells were resee-ded in MatTek dishes at 2.5 � 104 cells per dish and 1.25 � 105
cells per flask every other day, at either the odd or even days afterQDot exposure. The cells reseeded in the flasks were kept in culturefor 2 more days and then treated similarly for the duration of theexperiment (a total of 9 days), where the MatTek seeded cells wereallowed to settle for 2 h. Prior to analysis, media were removed,cells washed three times with PBS, fixed in 2% PFA for 20 min atambient temperature and permeabilized in 0.1% Triton X-100 for15 min at ambient temperature. Cell nuclei were then counter-stained using DAPI (300 nM; 5 min) after which the dishes werestored at 4 �C until being viewed by epifluorescence microscopy(Nikon Cs1).
The number of QDot positive cells was determined by analyzingthe microscopy images using ImageJ. From the collected images,more than 250 cells per condition out of three independent exper-iments were analyzed for the total number of cell nuclei and thenumber of QDot-positive cells. Data are expressed as mean ± SEMand are gathered for more than 250 cells analyzed per condition.Data are given as the number of QDot positive cells over the totalnumber of DAPI-stained cells.
2.4. Statistical analysis
All data are expressed as mean ± SEM unless indicated other-wise and data were analyzed using one-way analysis of variance(ANOVA). When comparing different QDot concentrations to thesame control group (the reference group), the Dunnett post hocanalysis method was used. In all cases, the degree of significanceis indicated when appropriate (⁄p < 0.05; ⁄⁄p < 0.01; ⁄⁄⁄p < 0.001).
degradation on poly(methacrylic acid)-coated quantum dot toxicity: The2013), http://dx.doi.org/10.1016/j.actbio.2013.09.041

4 S.J. Soenen et al. / Acta Biomaterialia xxx (2013) xxx–xxx
3. Results and discussion
3.1. Nanoparticle characterization
The synthesis of the PMA-QDots used in the present work hasbeen well-documented in multiple studies. The PMA-QDots havebeen thoroughly characterized and display a decent batch-to-batchreproducibility [18,28,31]. The QDots used in the present studyconsist of spherical CdSe/ZnS core–shell structures with a diameterof the inorganic core–shell structure of �4.7 ± 0.9 nm diameter, asassessed by TEM (Supporting Fig. S.2), with initially hydrophobicsurfactant capping. These QDots are overcoated with PMA mole-cules, which are amphiphilic. The hydrophobic side-chains ofPMA can interdigitate the hydrophobic surfactants on the originalQDot surface, while the hydrophilic backbone renders the resultingQDots water-soluble [29]. Upon applying the PMA coating andtransferring the QDots to an aqueous environment (10 mM PBS,pH 7.4), QDots with a hydrodynamic diameter of dh 11 ± 3 nmand a zeta potential of �18 ± 1 mV were obtained, as determinedby dynamic light scattering and electrophoretic mobility measure-ments, which is in line with previous reports. In PBS, the QDots re-mained stable in suspension for at least 3 months without anydetectable agglomeration. The particles have a maximal emissionat 597 nm and a quantum yield of 6.7%.
3.2. Cellular uptake of PMA-coated QDots
In view of cell labeling and NP-toxicity studies, cell uptake lev-els and intracellular localization of the QDots must be carefullyevaluated. Upon incubating the cells with 15 nM QDots, which isa typical QDot concentration used for cell labeling [18], confocalmicroscopy revealed endolysosomal localization of the QDots inall three cell types (Fig. 1A) as is commonly observed for NPs[32–34]. For endosomal visualization, the lipophilic dye 3,30-dioc-tadecyloxacarbocyanine perchlorate (DiO) was used. As this dyeeventually will stain multiple intracellular compartments, theexposure time of the cells was kept low (30 min), in which casemostly endosomes will be stained positive. Additionally, the QDotsthemselves were only allowed to be taken up by the cells for30 min, resulting in relatively low uptake values compared to dataobtained after longer incubations (see, for instance, Fig. 4). Notethat due to the resolution limit of optical microscopy no individualQDots inside the endosomes can be resolved, and that the fluores-cence signals originate from clusters of QDots within the sameendosomal vesicles [35]. In order to obtain more quantitative infor-mation, the level of cell-associated Cd2+ was determined using apreviously validated spectrophotometric technique [36], as de-scribed in the Supporting information. In short, this fluorescentdye-based technique makes use of an increase in fluorescence thatoccurs when the dye binds free Cd2+ ions and has been used bymultiple groups [32,36]. Upon acidic digestion of cell-associatedQDots, the level of free Cd2+ is determined, from which the numberof QDots is calculated using a dilution series of the QDot stock-treated under identical conditions. The accuracy of this quantita-tive assessment therefore depends on the intrinsic problems asso-ciated with determining QDot concentrations and determiningQDot-associated Cd2+ levels [16]. Therefore, the obtained absolutevalues are prone to error. However, relative values can be used forcomparative purposes in between different experiments using thesame samples. Quantitative determination of cellular QDot levelsupon 24 h exposure to various QDot concentrations revealed a con-centration-dependent, sub-linear increase in the number of QDotsper cell as well as the total number of cell-associated QDots (Fig. 1Band C), suggestive of a saturable endosomal uptake mechanism forthe QDots. Interestingly, C17.2 and HUVEC cells had similar uptake
Please cite this article in press as: Soenen SJ et al. The effect of nanoparticleimportance of particle functionality assessment in toxicology. Acta Biomater (
levels, whereas PC12 cells had ingested lower numbers of QDots,which has been observed for various types of NPs [14,37]. This islikely due to the smaller overall size of the PC12 cells and theirsmaller surface area, resulting in a reduced area of interaction ofNPs with the cell membrane, hereby impeding NP uptake.
As the lipophilic dye DiO and the QDots could only be used forshort exposure times, the intraendosomal localization of the QDotsat later time points was further shown by TEM of the three differ-ent cell types, following a 24 h exposure to the QDots at 10 nM.This slightly lower concentration was selected to avoid conditionsat which acute toxic effects occur, as this might lead to artifacts interms of cell organelle structure and organization. Fig. 2 shows thatfor all three cell types, the QDots reside in vesicular structures,bearing the morphological features of endosomal or lysosomalcompartments. Together, these data indicate that the particlesare taken up through the endosomal pathway and finally residein the endolysosomal compartment, where they will be subjectedto lower pH values, different ionic strengths and different proteincompositions than in the extracellular or cytoplasmicenvironment.
3.3. Effect of pH-mediated QDot degradation on Cd2+ release andfluorescence intensity
For cadmium-based QDots, one primary cause of toxicity hasbeen suggested to be free Cd2+ ions [27,28], a well-known metaltoxicant [29,38]. However, it also has been shown that a ZnS shellaround the CdSe core slows down corrosion of the QDots and thusreduces cytotoxicity [28]. By using the fluorescent dye-based as-say, the presence of free Cd2+ ions in the 2 lM QDot stock suspen-sion was evaluated, showing levels of 3.9 lM of free Cd2+.Comparison to the Cd2+ concentration after acidic digestion ofthe QDots, as determined with the same assay, demonstrates thatin neutral aqueous solution �1.6% of the total Cd2+ content of theQDots is present as free Cd2+, the rest is bound to the QDots. Notethat this percentage may depend on the QDot concentration. Underdiluted conditions the equilibrium can shift towards a larger per-centage of dissolved Cd2+. In previous work we calculated the per-centage of Cd2+ which is on the surface of the CdSe core to be �4%(cf. the Supporting information). Thus �40% of the surface Cd2+
atoms from the CdSe cores (under the ZnS shell) in the 2 lM QDotstock solution had dissolved under equilibrium conditions.
Free Cd2+ has been found to be able to affect cells starting fromconcentrations of 1 lM, but this value has been found to be depen-dent of cell type and conditions of incubation [28]. In context withthe determined value of 3.9 lM of free Cd2+ in the stock solutionand the further dilution of the QDots in cell medium prior to celllabeling (at least by 100-fold), this suggests that the free QDot-de-rived Cd2+ (in the cell medium) is likely not to be solely responsiblefor acute cytotoxic effects. Although the dilution of the QDots willshift the equilibrium between free and NP-associated Cd2+, thehigh dilution levels used here will likely not shift the equilibriumto such extent that more than 1 lM of free Cd2+ could be obtained.This was further verified by exposing cells for 24 h to pre-condi-tioned medium that was previously exposed to the QDots at theconcentrations used for cell labeling (up to 20 nM) for 24 h andwas subsequently ultracentrifuged at 115,584g. This medium thenonly contained free ions derived from the diluted QDot stocks,which was found not to result in significant effects on cell viability(Supporting Fig. S.5).
Upon endosomal uptake, the QDots will however be exposed tovarying environmental pH values, ranging from 7.4 for extracellu-lar medium to 4.5 in the lysosomes. As acidic conditions are knownto induce acid etching of the QDot surface and hereby release Cd2+
[37,39], the effect of pH on Cd2+ release was evaluated using previ-ously optimized endosomal-pH buffer systems [36] (see Support-
degradation on poly(methacrylic acid)-coated quantum dot toxicity: The2013), http://dx.doi.org/10.1016/j.actbio.2013.09.041
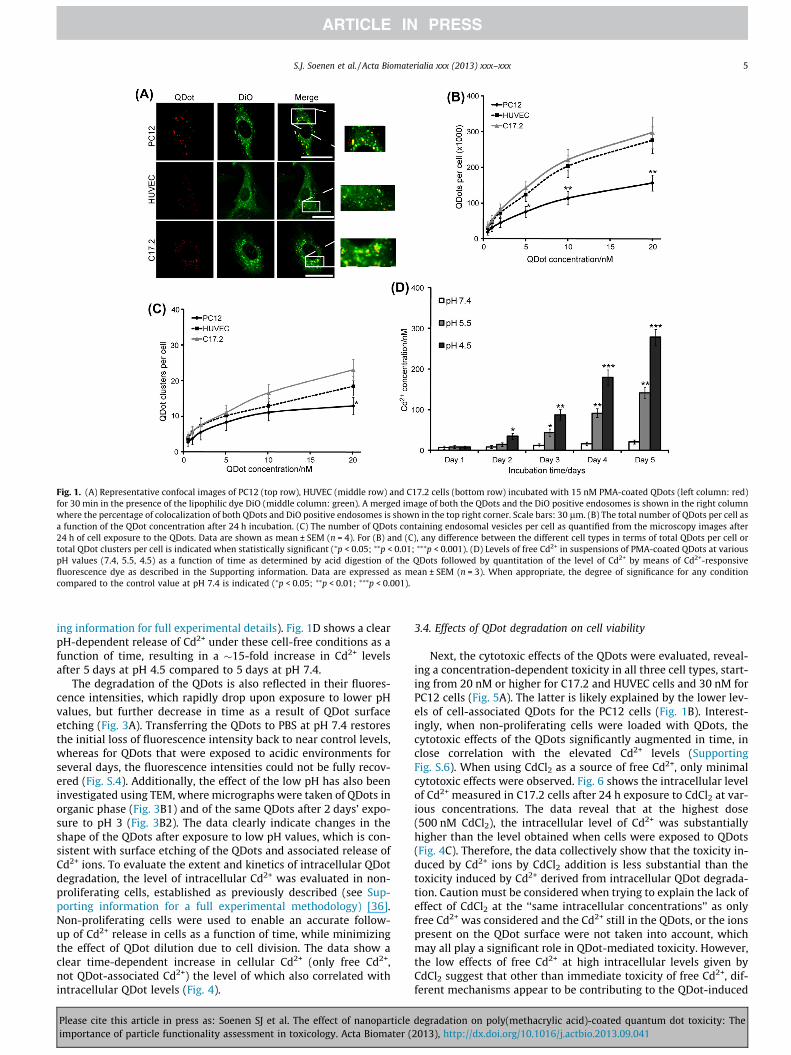
Fig. 1. (A) Representative confocal images of PC12 (top row), HUVEC (middle row) and C17.2 cells (bottom row) incubated with 15 nM PMA-coated QDots (left column: red)for 30 min in the presence of the lipophilic dye DiO (middle column: green). A merged image of both the QDots and the DiO positive endosomes is shown in the right columnwhere the percentage of colocalization of both QDots and DiO positive endosomes is shown in the top right corner. Scale bars: 30 lm. (B) The total number of QDots per cell asa function of the QDot concentration after 24 h incubation. (C) The number of QDots containing endosomal vesicles per cell as quantified from the microscopy images after24 h of cell exposure to the QDots. Data are shown as mean ± SEM (n = 4). For (B) and (C), any difference between the different cell types in terms of total QDots per cell ortotal QDot clusters per cell is indicated when statistically significant (⁄p < 0.05; ⁄⁄p < 0.01; ⁄⁄⁄p < 0.001). (D) Levels of free Cd2+ in suspensions of PMA-coated QDots at variouspH values (7.4, 5.5, 4.5) as a function of time as determined by acid digestion of the QDots followed by quantitation of the level of Cd2+ by means of Cd2+-responsivefluorescence dye as described in the Supporting information. Data are expressed as mean ± SEM (n = 3). When appropriate, the degree of significance for any conditioncompared to the control value at pH 7.4 is indicated (⁄p < 0.05; ⁄⁄p < 0.01; ⁄⁄⁄p < 0.001).
S.J. Soenen et al. / Acta Biomaterialia xxx (2013) xxx–xxx 5
ing information for full experimental details). Fig. 1D shows a clearpH-dependent release of Cd2+ under these cell-free conditions as afunction of time, resulting in a �15-fold increase in Cd2+ levelsafter 5 days at pH 4.5 compared to 5 days at pH 7.4.
The degradation of the QDots is also reflected in their fluores-cence intensities, which rapidly drop upon exposure to lower pHvalues, but further decrease in time as a result of QDot surfaceetching (Fig. 3A). Transferring the QDots to PBS at pH 7.4 restoresthe initial loss of fluorescence intensity back to near control levels,whereas for QDots that were exposed to acidic environments forseveral days, the fluorescence intensities could not be fully recov-ered (Fig. S.4). Additionally, the effect of the low pH has also beeninvestigated using TEM, where micrographs were taken of QDots inorganic phase (Fig. 3B1) and of the same QDots after 2 days’ expo-sure to pH 3 (Fig. 3B2). The data clearly indicate changes in theshape of the QDots after exposure to low pH values, which is con-sistent with surface etching of the QDots and associated release ofCd2+ ions. To evaluate the extent and kinetics of intracellular QDotdegradation, the level of intracellular Cd2+ was evaluated in non-proliferating cells, established as previously described (see Sup-porting information for a full experimental methodology) [36].Non-proliferating cells were used to enable an accurate follow-up of Cd2+ release in cells as a function of time, while minimizingthe effect of QDot dilution due to cell division. The data show aclear time-dependent increase in cellular Cd2+ (only free Cd2+,not QDot-associated Cd2+) the level of which also correlated withintracellular QDot levels (Fig. 4).
Please cite this article in press as: Soenen SJ et al. The effect of nanoparticleimportance of particle functionality assessment in toxicology. Acta Biomater (
3.4. Effects of QDot degradation on cell viability
Next, the cytotoxic effects of the QDots were evaluated, reveal-ing a concentration-dependent toxicity in all three cell types, start-ing from 20 nM or higher for C17.2 and HUVEC cells and 30 nM forPC12 cells (Fig. 5A). The latter is likely explained by the lower lev-els of cell-associated QDots for the PC12 cells (Fig. 1B). Interest-ingly, when non-proliferating cells were loaded with QDots, thecytotoxic effects of the QDots significantly augmented in time, inclose correlation with the elevated Cd2+ levels (SupportingFig. S.6). When using CdCl2 as a source of free Cd2+, only minimalcytotoxic effects were observed. Fig. 6 shows the intracellular levelof Cd2+ measured in C17.2 cells after 24 h exposure to CdCl2 at var-ious concentrations. The data reveal that at the highest dose(500 nM CdCl2), the intracellular level of Cd2+ was substantiallyhigher than the level obtained when cells were exposed to QDots(Fig. 4C). Therefore, the data collectively show that the toxicity in-duced by Cd2+ ions by CdCl2 addition is less substantial than thetoxicity induced by Cd2+ derived from intracellular QDot degrada-tion. Caution must be considered when trying to explain the lack ofeffect of CdCl2 at the ‘‘same intracellular concentrations’’ as onlyfree Cd2+ was considered and the Cd2+ still in the QDots, or the ionspresent on the QDot surface were not taken into account, whichmay all play a significant role in QDot-mediated toxicity. However,the low effects of free Cd2+ at high intracellular levels given byCdCl2 suggest that other than immediate toxicity of free Cd2+, dif-ferent mechanisms appear to be contributing to the QDot-induced
degradation on poly(methacrylic acid)-coated quantum dot toxicity: The2013), http://dx.doi.org/10.1016/j.actbio.2013.09.041

Fig. 2. Transmission electron micrographs of (A) C17.2, (B) HUVEC and (C) PC12 cells exposed to QDots for 24 h at 10 nM. The bottom figures are enlarged views of therespective areas indicated in the top figures. Scale bars: (A,B) 200 nm, (C) 100 nm.
Fig. 3. (A) Effect of pH on QDot fluorescence intensity. Relative fluorescence intensity levels of 5 nM suspensions of PMA-coated QDots at various pH values (7.4, 5.5, 4.5) as afunction of time. Data are expressed as mean ± SEM (n = 3) and the degree of statistical significance of treated samples vs. control samples is indicated when appropriate(⁄p < 0.05; ⁄⁄p < 0.01; ⁄⁄⁄p < 0.001). (B) Transmission electron micrographs of the QDots upon synthesis (B1) and after 2 days’ exposure to pH 3 (B2). Scale bars: (B1) 10 nm,(B2) 20 nm.
6 S.J. Soenen et al. / Acta Biomaterialia xxx (2013) xxx–xxx
toxicity (Supporting Figs. S.7 and S.8). One possible explanation forthe clear correlation between QDot-induced toxicity and intracel-lular QDot-derived Cd2+ levels, lies in the endosomal enclosure ofthe QDots [36]. Where Cd2+ derived from CdCl2 can more freely dis-tribute throughout the cell cytoplasm and will be taken up by thecell in a short time span, this is not the same for Cd2+ derived fromcadmium-based QDots. The intraendosomal degradation of theQDots likely results in a more heterogeneous distribution of Cd2+,with very high local Cd2+ concentrations in a confined space (endo-some) that easily exceed the toxic threshold, thereby affecting cellhomeostasis. Additionally, the Cd2+ derived from QDots is gradu-ally released over time and will immediately be subjected to a deg-radative environment of low pH, unlike the Cd2+ ions that arederived from CdCl2. The presence of the ions in the low pH environ-ment of the endosomes at high local concentrations may result inhigher toxic effects than more homogeneously distributed Cd2+.Furthermore, NPs such as QDots are known to affect cellular well-being, for instance by the induction of ROS. When cells are alreadysubject to stress induced by the intracellular presence of NPs, theadditional presence of Cd2+ will likely result in toxic effects morequickly than the same levels of Cd2+ would in cells that have no
Please cite this article in press as: Soenen SJ et al. The effect of nanoparticleimportance of particle functionality assessment in toxicology. Acta Biomater (
other stress inducers. This hypothesis also supports the earlierwork of other groups [40,41] who found that intracellular Cd2+ re-lease was more toxic than extracellular Cd2+.
These data collectively show that minor toxic effects occur atconcentrations of 500 nM of free Cd2+. Compared to the QDots,similar minor toxic effects were noticeable at concentrations of10 nM. Whereas the amount of free intracellular Cd2+ derived fromthe QDots was much lower than Cd2+ levels derived from CdCl2, thetotal amount of Cd2+ added was much higher in the case of theQDots (for 10 nM QDots; an experimental value of 1.32 lM Cd2+
was obtained). Based on these values, it can be concluded thatthe majority of QDot-associated Cd2+ is not released and remainsconfined within the QDot core. These ions do not appear to playany major role in the toxicological effects of Cd2+ as when compar-ing the toxicity of CdCl2 and QDots based on the total amount ofCd2+ added, the QDots display less toxicity.
3.5. Effects of QDots on oxidative stress
To further test this hypothesis, the effect of CdCl2 and QDots on oxi-dative stress were evaluated in non-proliferating cells, indicating a
degradation on poly(methacrylic acid)-coated quantum dot toxicity: The2013), http://dx.doi.org/10.1016/j.actbio.2013.09.041

Fig. 4. (A–C) Levels of free Cd2+ in (A) PC12, (B) HUVEC and (C) C17.2 cells exposed to various concentrations of PMA-coated QDots for 24 h and subsequently kept in non-proliferating state, after which the cellular Cd2+ levels are measured after 1, 2, 3, 4 and 5 days. Data are expressed as mean ± SEM (n = 3). Note that only free Cd2+ wasmeasured, no acid digestion was employed and any remaining QDots were found not to significantly interfere with the assay readout.
Fig. 5. (A) Viability and (B) ROS induction of PC12, HUVEC and C17.2 cells as a function of QDot concentration after 24 h incubation. Data are represented as mean ± SEM(n = 6) and expressed as relative to untreated control cells. (C) Quantitative levels of JC-10 (light grey) and c-H2Ax (dark grey) for HUVEC cells exposed for 24 h to differentconcentrations of QDots. Data are expressed as mean ± SEM (n = 3) and are presented as relative to that of untreated control cells (=100%). When appropriate, the degree ofsignificance is indicated (⁄p < 0.05; ⁄⁄p < 0.01; ⁄⁄⁄p < 0.001).
S.J. Soenen et al. / Acta Biomaterialia xxx (2013) xxx–xxx 7
clear concentration-dependent induction of ROS for either CdCl2 orQDots (Fig. 5B, Supporting Figs. S.8 and S.9). However, for the QDots,the level of ROS also increased in time, which is in line with the increas-ing Cd2+ concentrations. As the level of ROS is higher for the QDots thanfor CdCl2, this supports our hypothesis on local high Cd2+ concentra-tions obtained upon intraendosomal QDot degradation. When cellswere co-incubated with 5 mM N-acetylcystein (NAC), an FDA-ap-proved free radical scavenger, ROS levels were reduced to near controllevels (Supporting Fig. S.8). The addition of NAC was also able to par-tially restore cell viability (Supporting Fig. S.6), indicating that ROSare an important mediator in QDot-induced toxicity, but other mecha-nisms must also contribute to the overall cytotoxicity.
To evaluate whether the elevated ROS levels have any secondaryeffects on cell physiology, mitochondrial membrane potential
Please cite this article in press as: Soenen SJ et al. The effect of nanoparticleimportance of particle functionality assessment in toxicology. Acta Biomater (
(DWm) and DNA damage were evaluated. The DWm was evaluatedusing the JC-10 dye, which remains in the cytoplasm as green mono-mers until it is taken up by healthy mitochondria with a normalDWm, which will make the dye aggregate and its fluorescence emis-sion will shift (red color). The ratio of green over red (as shown inFig. 5C) therefore indicates the ratio of damaged over healthy mito-chondria. The data show that, in line with the onset of ROS, at QDotconcentrations from 10 nM and above, a clear and significant in-crease in damaged mitochondria can be seen, at levels below thoseat which acute toxicity occurs (30 nM). The significant effects at con-centrations below toxic levels clearly indicate that these results arenot artifacts caused by cell death, but rather that the QDot-mediatedonset of ROS precedes cell death. Together with the observation thatNAC treatment can partially overcome QDot-induced toxicity, these
degradation on poly(methacrylic acid)-coated quantum dot toxicity: The2013), http://dx.doi.org/10.1016/j.actbio.2013.09.041

Fig. 6. Levels of free Cd2+ in C17.2 cells exposed to various concentrations (1, 5, 20,50, 100, 250 and 500 nM) of CdCl2 for 24 h. Data are expressed as mean ± SEM(n = 3). ND: non-detectable (values are within noise-level of the assay and cannotbe distinguished from the background level).
8 S.J. Soenen et al. / Acta Biomaterialia xxx (2013) xxx–xxx
results show that ROS induction is one of the prime mechanisms bywhich these NPs elicit toxic effects.
As elevated ROS levels are known to possibly result in DNAdamage, which may have far-reaching consequences in the safetyof these materials as this a hallmark of carcinogenicity, the occur-rence of DNA double strand breaks was evaluated (Fig. 5C). Thiswas done by staining for phosphorylated c-H2Ax foci, which areformed by the rapid phosphorylation of histone H2Ax at sites ofDNA double strand breaks. Similar as for the loss of DWm, signifi-cant DNA damage was found to occur at doses at which acute tox-icity was minimal (20 nM).
Taken together, these data indicate that the QDot-induced ROSlevels result in secondary effects which, at higher levels, will resultin cell death, but are still significant even at lower levels, wherethey induce cell stress or carcinogenicity.
Fig. 7. (A) Representative confocal images of HUVEC cells exposed for 24 h to PMA-coatimages shown are merged images of QDots (red) and a-tubulin cytoskeleton (green). Sexposed to PMA-coated QDots for 24 h and stained after 2 additional days of culture. The§ for 20 nM-treated cells. (C) Effect of QDots on PC12 cell functionality. Representative co2 (2nd column), 5 (3rd column) or 10 nM (4th column) and subsequently exposed to nervQDots (red) and a-tubulin (green). The area indicated by the white rectangle is magnified(D) The number of neurites of a certain length per cell after 3 days of NGF exposure for celof significance is given when compared with untreated control cells (⁄p < 0.05; ⁄⁄p < 0.0
Please cite this article in press as: Soenen SJ et al. The effect of nanoparticleimportance of particle functionality assessment in toxicology. Acta Biomater (
3.6. Effects of QDots on cell morphology and functionality
To further refine the non-toxic concentration of PMA-coatedQDots and to analyze the contribution of time-dependent Cd2+ re-lease, the morphology of QDot-exposed HUVECs was evaluated. Asa primary human cell type with a typical well-spread morphology,these cells are perfectly suited to assess QDot-mediated distur-bance of actin or tubulin cytoskeleton [14]. Furthermore, previousdata on iron oxide NPs have shown that cell deformations usuallyoccur after 2–3 days after initial cell exposure [14], making this aninteresting parameter to study with respect to time-dependentCd2+ release. Fig. 7A and B reveals a concentration-dependentreduction in cell-spreading, which is in line with previous reportson various types of nanoparticles [36,42,43]. Note that for these as-says, only low QDot concentrations (up to 20 nM) were selectedthat do not induce significant levels of acute cell death as theoccurrence of apoptotic bodies or condensed cells would substan-tially influence the results obtained. The reduction in cell spreadingcorrelates well with the onset of ROS, suggesting a possible influ-ence of ROS in the cytoskeletal deformations. However, previousdata have suggested that the conjoined effects of multiple mecha-nisms play a role in cell deformations, including (1) the endosomallocalization of QDots resulting in enlarged lysosomal compart-ments [30] and (2) a loss of lysosomal functionality, resulting inlarge compartments containing high numbers of rigid NPs andhereby occupying a substantial part of the cellular cytoplasmiccompartment, sterically hindering normal cytoplasmic functional-ity [36].
Next, the effect of the QDots on cell functionality was investi-gated. To evaluate the effect of Cd2+ release, the PC12 model sys-tem was used, which was previously found to be an excellentmodel for a fast, sensitive and quantifiable assessment of cell func-tionality upon nanoparticle exposure. In this assay, cell functional-ity is evaluated by induction of neurite outgrowth upon
ed QDots at 5 nM (left column), 10 nM (middle row) and 20 nM (right column). Thecale bars: 50 lm. (B) Histograms representing the cell area distribution of HUVECsaverage cell areas are indicated with ⁄ for control cells, X for 10 nM-treated cells andnfocal images of PC12 cells exposed to PMA-coated QDots for 24 h at 0 (left column),e growth factor (NGF; 100 ng ml�1) for 2 days. Images shown are merged images ofat the bottom of the image, showing only the QDot fluorescence. Scale bars: 30 lm.
ls exposed to 0, 1, 2, 5 or 10 nM of PMA-coated QDots. When appropriate, the degree1; ⁄⁄⁄p < 0.001).
degradation on poly(methacrylic acid)-coated quantum dot toxicity: The2013), http://dx.doi.org/10.1016/j.actbio.2013.09.041

Fig. 8. The percentage of QDot positive cells for cells incubated with 2 nM QDots for24 h after 0, 2, 4 and 6 average cell doubling times as evaluated by microscopyanalysis. The data are expressed as mean ± SEM (n = 3).
S.J. Soenen et al. / Acta Biomaterialia xxx (2013) xxx–xxx 9
stimulation with nerve growth factor (NGF) [13]. When cells wereexposed to QDots at nominally non-toxic concentrations, the out-growth of neurites after 2 days of stimulus with NGF (4 days afterinitial cell exposure) was found to be significantly impeded athigher QDot concentrations (Fig. 7C and D).
3.7. Assessment of QDot functionality for comparative data analysis
Based on all the data obtained, the non-cytotoxic concentrationof PMA-coated core/shell QDots of 4.7 nm CdSe/ZnS diameter is�2 nM. Previously, the multiparametric methodology applied inthe current study has been used to evaluate PMA-coated Au NPsof the same size and identical (PMA) surface coating [43] as wellas commercially available polymer-coated core–shell QDots [36].For the Au particles, the non-toxic level was found to be 10 nM,indicating a fivefold higher toxicity of the QDots, owing to differ-ences in the metal core of the NPs and the forthcoming photophys-ical properties of these materials as QDots, for instance, are well-known to produce ROS under light irradiation which less outspo-ken for Au NPs. Interestingly this value fits remarkably to veryearly studies, in which PMA-coated CdSe/ZnS QDots were foundto be more than three times toxic than PMA-coated Au NPs [28].Given the difficulties in accurately assessing NP concentrations[16], differences in the uniformity by which the PMA polymercovers the NPs and polydispersity differences between the two dif-ferent NP types, these absolute values should, however, be treatedwith care and making comparisons should be done cautiously.
Given the difficulties in comparing different NPs due to theproblems associated with accurately determining NP concentra-tions [16], the applicability of the QDots for fluorescence celltracking was evaluated at their non-toxic concentration (2 nM).In previous work, it was found that carboxyl-functionalized com-mercially available QDots of similar size tested under identicalconditions were found to be non-toxic at 1 nM [36]. Note that alsothe PMA-coated QDots as used in this study are terminated by car-boxyl-groups. Differences in the methods used for determiningQDot concentrations are most likely the reason for the slight differ-ence in the values of these studies [16]. At non-toxic concentra-tions, labeled cells were able to be monitored by fluorescencemicroscopy for approximately four cell doublings (Fig. 8). In theend, the duration by which QDot labeled cells could be efficientlyvisualized at non-toxic conditions (approximately four cell dou-blings) was the same for both types of carboxylated Qdots (com-mercial and synthesized ones), indicating that both types ofQDots resulted in similar efficiencies in terms of cell labeling strat-egies. The ability to track the cells by fluorescence microscopy isinfluenced by the number of QDots internalized by the cell, as wellas other factors such as their coating and quantum yield. These
Please cite this article in press as: Soenen SJ et al. The effect of nanoparticleimportance of particle functionality assessment in toxicology. Acta Biomater (
data demonstrate that when assessing NP toxicity, the number ofcell-associated NPs determines cytotoxic effects rather than the to-tal number of NPs added to the cells, which is in line with earlierfindings [44]. Here, we demonstrated the importance of intracellu-lar NP concentrations in the cytotoxicity of nanomaterials as wellas the necessity to assess the functionality of the nanomaterialsat non-toxic conditions. In the end, it is important to evaluatewhether the NPs at their non-toxic concentration are still func-tional for the desired application, such as cell tracking. Especiallygiven the difficulties in accurately determining NP concentrations,assessing their biomedical functionality appears like an informa-tive and fruitful tool, which allows the comparison of particleswith respect to both toxicological and technical features of theNPs, thereby providing a good overview of the respective NPstrength for a selected purpose.
4. Conclusions
In conclusion, the present work demonstrates the importance ofNP degradation in the cellular microenvironment in the cytotoxiceffects of nanomaterials. Therefore, the data collectively show thatthe toxicity induced by Cd2+ ions by CdCl2 addition is less substan-tial than the toxicity induced by Cd2+ derived from intracellularQDot degradation (when compared at the same intracellular freeCd2+ concentration). Note that under the conditions used in thisstudy, the majority of QDot-associated Cd2+ is not released and re-mains confined within the QDot core. These ions do not appear toplay any major role in the toxicological effects of Cd2+ as whencomparing the toxicity of CdCl2 and QDots based on the totalamount of Cd2+ added, the QDots display less toxicity. Together,these data reveal that while current cadmium-containing QDotsare well-suited for monitoring cell behavior by fluorescencemicroscopy for a low number of cell divisions, Cd2+-based QDotformulations do not appear to be optimally suited for long-termcell tracking after endosomal uptake. Optimization of QDot formu-lations can occur at both the level of the QDot core as at the level ofthe coating applied for QDot biofunctionalization. The currentstudy demonstrates the need for specialized model systems, suchas non-proliferating cells, in order to be able to study this effectin more detail at later time points under conditions close to rele-vant physiological conditions. Additionally, there is a need fortechniques that enable one to determine the chemical state of allNP-associated ions in real-time in live cells. Considering thetechnical difficulties in terms of accurately assessing NP concentra-tions, it is also vital to accurately assess functional (= cell-associ-ated) NP levels. In order to enable a comparison of different NPs,it is therefore more suited to use NP functionality (e.g. the abilityto fluorescently visualize labeled cells) at non-toxic concentrationsas the final parameter which determines NP safety, rather thancomparing various NP concentrations, which may not be veryinsightful.
Acknowledgements
S.J.S. is a postdoctoral fellow from the FWO-Vlaanderen. Finan-cial support from the FWO-Vlaanderen (Krediet aan Navorsers toS.J.S.), the UGent consortium NB Photonics, and from the EuropeanCommission (grant Nandiatream to W.J.P.) are gratefully acknowl-edged. The authors wish to thank Prof. Alain R. Brisson, UniversitéBordeaux, for his expertise in cellular TEM.
Appendix A. Supplementary data
Supplementary data associated with this article can be found, inthe online version, at http://dx.doi.org/10.1016/j.actbio.2013 .09.041.
degradation on poly(methacrylic acid)-coated quantum dot toxicity: The2013), http://dx.doi.org/10.1016/j.actbio.2013.09.041

10 S.J. Soenen et al. / Acta Biomaterialia xxx (2013) xxx–xxx
Appendix B. Figures with essential colour discrimination
Certain figures in this article, particularly Figures 1 and 7, aredifficult to interpret in black and white. The full colour imagescan be found in the on-line version, at doi:http://dx.doi.org/10.1016/j.actbio.2013.09.041.
References
[1] Magnuson BA, Jonaitis TS, Card JW. A brief review of the occurrence, use, andsafety of food-related nanomaterials. J Food Sci 2011;76:R126–33.
[2] Nasir A, Friedman A. Nanotechnology and the nanodermatology society. JDrugs Dermatol 2010;9:879–82.
[3] Report L. Nanomaterials state of the market: stealth success, broad impact;2008. Available from: http://portalluxresearchinecom/research/document3735:2008.
[4] Fairbrother A, Fairbrother JR. Are environmental regulations keeping up withinnovation? A case study of the nanotechnology industry. Ecotoxicol EnvironSaf 2009;72:1327–30.
[5] Faunce T, Watal A. Nanosilver and global public health: internationalregulatory issues. Nanomedicine (Lond) 2010;5:617–32.
[6] Hamburg MA. Science and regulation. FDA’s approach to regulation of productsof nanotechnology. Science 2012;336:299–300.
[7] Soenen SJ, Demeester J, De Smedt SC, Braeckmans K. Turning a frown upsidedown: exploiting nanoparticle toxicity for anticancer therapy. Nano Today2013;8:121–5.
[8] Chen Y, Qu K, Zhao C, Wu L, Ren J, Wang J, et al. Insights into the biomedicaleffects of carboxylated single-wall carbon nanotubes on telomerase andtelomeres. Nat Commun 2012;3:1074.
[9] Joris F, Manshian BB, Peynshaert K, De Smedt SC, Braeckmans K, Soenen SJ.Assessing nanoparticle toxicity in cell-based assays: influence of cell cultureparameters and optimized models for bridging the in vitro–in vivo gap. ChemSoc Rev 2013. http://dx.doi.org/10.1039/C3CS60145E.
[10] Thomas CR, Xia T, Rallo R, Zhao Y, Ji Z, Lin S, et al. Nanomaterials in theenvironment: from materials to high-throughput screening to organisms. ACSNano 2011;5:13–20.
[11] Soenen SJ, Rivera-Gil P, Montenegro JM, Parak WJ, De Smedt SC, Braeckmans K.Cellular toxicity of inorganic nanoparticles: common aspects and guidelinesfor improved nanotoxicity evaluation. Nano Today 2011;6:446–65.
[12] Elder A, Yang H, Gwiazda R, Teng X, Thurston S, He H, et al. Testingnanomaterials of unknown toxicity: an example based on platinumnanoparticles of different shapes. Adv Mater 2007;19:3124–8.
[13] Pisanic 2nd TR, Blackwell JD, Shubayev VI, Finones RR, Jin S. Nanotoxicity ofiron oxide nanoparticle internalization in growing neurons. Biomaterials2007;28:2572–81.
[14] Soenen SJ, Himmelreich U, Nuytten N, De Cuyper M. Cytotoxic effects of ironoxide nanoparticles and implications for safety in cell labelling. Biomaterials2011;32:195–205.
[15] Rivera Gil P, Oberdorster G, Elder A, Puntes V, Parak WJ. Correlating physico-chemical with toxicological properties of nanoparticles: the present and thefuture. ACS Nano 2010;4:5527–31.
[16] Rivera-Gil P, Jimenez De Aberasturi D, Wulf V, Pelaz B, Del Pino P, Zhao Y, et al.The challenge to relate the physicochemical properties of colloidalnanoparticles to their cytotoxicity. Acc Chem Res 2013;46:743–9.
[17] Chan WCW, Maxwell DJ, Gao XH, Bailey RE, Han MY, Nie SM. Luminescentquantum dots for multiplexed biological detection and imaging. Curr OpinBiotech 2002;13:40–6.
[18] Rivera-Gil P, Yang F, Thomas H, Li L, Terfort A, Parak WJ. Development of anassay based on cell counting with quantum dot labels for comparing celladhesion within cocultures. Nano Today 2011;6:20–7.
[19] Azzazy HM, Mansour MM, Kazmierczak SC. From diagnostics to therapy:prospects of quantum dots. Clin Biochem 2007;40:917–27.
[20] Bhirde A, Xie J, Swierczewska M, Chen X. Nanoparticles for cell labeling.Nanoscale 2011;3:142–53.
[21] Wu X, Liu H, Liu J, Haley KN, Treadway JA, Larson JP, et al. Immunofluorescentlabeling of cancer marker Her2 and other cellular targets with semiconductorquantum dots. Nat Biotechnol 2003;21:41–6.
Please cite this article in press as: Soenen SJ et al. The effect of nanoparticleimportance of particle functionality assessment in toxicology. Acta Biomater (
[22] Pinaud F, Clarke S, Sittner A, Dahan M. Probing cellular events, one quantumdot at a time. Nat Methods 2010;7:275–85.
[23] Kim S, Lim YT, Soltesz EG, De Grand AM, Lee J, Nakayama A, et al. Near-infraredfluorescent type II quantum dots for sentinel lymph node mapping. NatBiotechnol 2004;22:93–7.
[24] Ballou B, Ernst LA, Andreko S, Harper T, Fitzpatrick JAJ, Waggoner AS, et al.Sentinel lymph node imaging using quantum dots in mouse tumor models.Bioconjug Chem 2007;18:389–96.
[25] Tsay JM, Trzoss M, Shi LX, Kong XX, Selke M, Jung ME, et al. Singlet oxygenproduction by peptide-coated quantum dot-photosensitizer conjugates. J AmChem Soc 2007;129:6865–71.
[26] Zhu XC, Lu WT, Zhang YZ, Reed A, Newton B, Fan Z, et al. Imidazole-modifiedporphyrin as a pH-responsive sensitizer for cancer photodynamic therapy.Chem Commun 2011;47:10311–3.
[27] Derfus AM, Chan WCW, Bhatia SN. Probing the cytotoxicity of semiconductorquantum dots. Nano Lett 2004;4:11–8.
[28] Kirchner C, Liedl T, Kudera S, Pellegrino T, Javier AM, Gaub HE, et al.Cytotoxicity of colloidal CdSe and CdSe/ZnS nanoparticles. Nano Lett2005;5:331–8.
[29] Chen N, He Y, Su Y, Li X, Huang Q, Wang H, et al. The cytotoxicity of cadmium-based quantum dots. Biomaterials 2012;33:1238–44.
[30] Ambrosone A, Mattera L, Marchesano V, Quarta A, Susha AS, Tino A, et al.Mechanisms underlying toxicity induced by CdTe quantum dots determined inan invertebrate model organism. Biomaterials 2012;33:1991–2000.
[31] Zhang F, Lees E, Amin F, Gil PR, Yang F, Mulvaney P, et al. Polymer-coatednanoparticles: a universal tool for biolabelling experiments. Small2011;7:3113–27.
[32] Cho SJ, Maysinger D, Jain M, Roder B, Hackbarth S, Winnik FM. Long-termexposure to CdTe quantum dots causes functional impairments in live cells.Langmuir 2007;23:1974–80.
[33] Soenen SJ, Brisson AR, Jonckheere E, Nuytten N, Tan S, Himmelreich U, et al.The labeling of cationic iron oxide nanoparticle-resistant hepatocellularcarcinoma cells using targeted magnetoliposomes. Biomaterials2011;32:1748–58.
[34] Parak WJ, Boudreau R, Le Gros M, Gerion D, Zanchet D, Micheel CM, et al. Cellmotility and metastatic potential studies based on quantum dot imaging ofphagokinetic tracks. Adv Mater 2002;14:882–5.
[35] Brandenberger C, Muhlfeld C, Ali Z, Lenz AG, Schmid O, Parak WJ, et al.Quantitative evaluation of cellular uptake and trafficking of plain andpolyethylene glycol-coated gold nanoparticles. Small 2010;6:1669–78.
[36] Soenen SJ, Demeester J, De Smedt SC, Braeckmans K. The cytotoxic effects ofpolymer-coated quantum dots and restrictions for live cell applications.Biomaterials 2012;33:4882–8.
[37] Moulis JM. Cellular mechanisms of cadmium toxicity related to thehomeostasis of essential metals. Biometals 2010;23:877–96.
[38] Su Y, Hu M, Fan C, He Y, Li Q, Li W, et al. The cytotoxicity of CdTe quantum dotsand the relative contributions from released cadmium ions and nanoparticleproperties. Biomaterials 2010;31:4829–34.
[39] Soenen SJ, Himmelreich U, Nuytten N, Pisanic 2nd TR, Ferrari A, De Cuyper M.Intracellular nanoparticle coating stability determines nanoparticlediagnostics efficacy and cell functionality. Small 2010;6:2136–45.
[40] Chang E, Thekkek N, Yu WW, Colvin VL, Drezek R. Evaluation of quantum dotcytotoxicity based on intracellular uptake. Small 2006;2:1412–7.
[41] Schneider R, Wolpert C, Guilloteau H, Balan L, Lambert J, Merlin C. Theexposure of bacteria to CdTe-core quantum dots: the importance of surfacechemistry on cytotoxicity. Nanotechnology 2009;20:225101.
[42] Mahto SK, Park C, Yoon TH, Rhee SW. Assessment of cytocompatibility ofsurface-modified CdSe/ZnSe quantum dots for BALB/3T3 fibroblast cells.Toxicol In Vitro 2010;24:1070–7.
[43] Soenen SJ, Manshian B, Montenegro JM, Amin F, Meermann B, Thiron T, et al.The cytotoxic effects of gold nanoparticles: a multiparametric study. ACS Nano2012;6:5767–83.
[44] Soenen SJ, Manshian B, Doak SH, De Smedt SC, Braeckmans K. Fluorescent non-porous silica nanoparticles for long-term cell monitoring: Cytotoxicity andparticle functionality. Acta Biomater 2013. http://dx.doi.org/10.1016/j.actbio.2013.04.026.
degradation on poly(methacrylic acid)-coated quantum dot toxicity: The2013), http://dx.doi.org/10.1016/j.actbio.2013.09.041
Copyright © 2022 FDOKUMEN