Experimental study of a liquid fluidization in a microfluidic channel
Upload
independentCategory
view
1download
0
c h e m i c a l e n g i n e e r i n g r e s e a r c h a n d d e s i g n 8 6 ( 2 0 0 8 ) 3 5 9 – 3 6 9
avai lab le at www.sc iencedi rec t .com
journal homepage: www.e lsev ier .com/ locate /cherd
The effect of mechanical vibration on gas fluidization ofa fine aeratable powder
Diego Barletta, Giorgio Donsı, Giovanna Ferrari, Massimo Poletto *, Paola Russo
Dipartimento di Ingegneria Chimica e Alimentare, Universita degli Studi di Salerno, Via Ponte Don Melillo, I-84084 Fisciano (SA), Italy
a r t i c l e i n f o
Article history:
Received 16 April 2007
Accepted 18 September 2007
Keywords:
Vibrated fluidization
Aeratable powders
Minimum fluidization velocity
Interparticle forces
Homogeneous fluidization
a b s t r a c t
Fluidization behaviour of a fine aeratable FCC powder assisted by mechanical vibration was
studied in a 85 mm i.d. transparent column. The investigated parameters of vibration were
the peak acceleration value (a/g = 0.5, 1 and 2) and the frequency (between 7 and 200 Hz). The
most significant variations obtained by changing these parameters regard the voidage of the
fixed bed, the effects of aeration on bed expansion and fluidization, the maximum bed
expansion and the onset of bubbling conditions. The typical fluidization curve in presence of
mechanical vibration is characterized with the introduction of key fluidization velocities: a
minimum bed expansion velocity, a minimum velocity for fluid dynamic suspension, the
minimum bubbling velocity and a minimum velocity for stable bubbling. The possibility to
apply the Ergun equation under gas fluidization assisted by vibration was also verified.
Differential pressure drops at different heights inside the bed were used to investigate on
the effects of vibrations on the gas fluidized bed. Changes of differential pressure drop along
ted in the light of some internal bed structure.
of Chemical Engineers. Published by Elsevier B.V. All rights reserved.
# 2007 The Institutionthe bed were interpre
1. Introduction
In industrial applications of powder technology vibrations have
been used together with gas fluidization in order to overcome
cohesion problems arising in the treatment of sticky particles,
as for example in the case of powder drying operations.
Vibrations, in fact, are able to interact directly with structures of
the dispersed phase determined by cohesive forces such as
aggregates and channels. This property has suggested their use
to induce the proper gas fluidization of very fine particles
belonging to the Group C of the Geldart (1973) classification. For
these powders, beds have been often vibrated by means of the
application of sound waves. Vibration without aeration was
also studied on coarser powders because it can determine the
bed expansion. It can, therefore, be used to uncouple the bed
expansion from the gas velocity and provide more flexibility in
the design of process units using fluidized beds.
Fluidization is not the only phenomenon which can be
observed by application of vibrations on a powder bed. An
indication of the complexity of this operation is the number of
phenomena, which were observed in these systems, such as
* Corresponding author. Tel.: +39 089 964 132; fax: +39 089 964 132.E-mail address: [email protected] (M. Poletto).
0263-8762/$ – see front matter # 2007 The Institution of Chemical Endoi:10.1016/j.cherd.2007.10.002
heaping (Hsiau and Pan, 1998), compaction (Thomas et al.,
2000; Kudrolli, 2004), size segregation (Williams, 1976; Kudrolli,
2004), arching (Hsiau et al., 1998), convection (Hsiau and Chen,
2000; Tai and Hsiau, 2004) and, finally, fluidization (Luding
et al., 1994). A consistent part of these studies concerned the
application of vibration to beds of very coarse particles (Group
D of the Geldart classification), for which cohesive and fluid
dynamic effects are negligible, and were performed using beds
of very low depth (a few layers of solids grains). Thomas et al.
(2000) reported the different phenomena observed when
vibrating, at a fixed frequency of 25 Hz, shallow beds of
powders belonging to different groups of the Geldart classi-
fication, including an aeratable Group A and a cohesive Group
C powder. They hypothesized a modified classification of
powders applicable to vibrated fluidization. They also sug-
gested the necessity to investigate the significance of the bed
height in powder vibration.
Pioneering works in the field of application of vibrations to
gas fluidized bed were carried out by Gupta and Mujumdar
(1980) with the use of mechanical vibrations and by Morse
(1955) with the use of sound waves. The different effects of
gineers. Published by Elsevier B.V. All rights reserved.

Nomenclature
a acceleration due to vibration (m s�2)
A vibration amplitude (m)
dp particle diameter (m)
f frequency (s�1)
g acceleration due to gravity (m s�2)
H bed height (m)
Hmb bed height at the minimum for bubbling (m)
Hmf bed height at the minimum for fluidization (m)
DH distance between taps (m)
M bed mass (kg)
P pressure (Pa)
DP gas pressure drop through the bed (Pa)
DPCal gas pressure drop between taps calculated with
Eq. (6) (Pa)
DPErg gas pressure drop through the bed calculated
with Eq. (3) (Pa)
DPErgDH gas pressure drop between taps calculated with
Eq. (4) (Pa)
DPFlDH gas pressure drop between taps calculated with
Eq. (5) (Pa)
u fluid superficial velocity (m s�1)
umb minimum fluid superficial velocity for bubbling
(m s�1)
ume minimum fluid superficial velocity for bed
expansion (m s�1)
umf minimum fluid superficial velocity for fluidiza-
tion (m s�1)
umsb minimum fluid superficial velocity for stable
bubbling (m s�1)
umsf minimum fluid superficial velocity for fluid
dynamic suspension (m s�1)
Greek letters
e bed voidage
mf fluid viscosity (Pa s)
rf fluid density (kg m�3)
rp particle density (kg m�3)
S bed cross section (m2)
v pulsation (s�1)
c h e m i c a l e n g i n e e r i n g r e s e a r c h a n d d e s i g n 8 6 ( 2 0 0 8 ) 3 5 9 – 3 6 9360
vibrations on Group D powders reported by these authors
suggest different mechanisms of action of these two techni-
ques. In particular, application of sound has been proved to be
very effective for the fluidization of fine powders (Chirone et al.,
1993; Russo et al., 1995; Nowak et al., 1993; Levy et al., 1997).
Russo et al. (1995) demonstrated that this kind of vibration
technique was able to break particle aggregates when acting at
the resonance frequencies of the aggregate structure (>100 Hz).
Also mechanical vibration was demonstrated to be effective on
Group C powders (Marring et al., 1994; Janssen et al., 1998;
Mawatari et al., 2002b, 2003; Valverde et al., 2001; Valverde and
Castellanos, 2006) by breaking the aggregates into smaller
pieces which become primary fluidizable particles. These
smaller aggregates may be homogeneously fluidized in gas
streams as typical for Group A powders. The effectiveness of
mechanical vibration has also been proved, even at frequencies
lower than those in the range in which acoustic vibration is
effective. This supports the idea of different mechanisms of
action of these two vibration techniques.
Considering the previous observations on homogenous
expansion in the vibrated gas fluidization of Group C powders
we believe that the full understanding of this kind of
fluidization can only come from a complete understanding
of the effect of vibration on Group A powders. This effect was
the object of several studies (Jaraiz et al., 1992; Wang et al.,
2000, 2002; Mawatari et al., 2002a,b), however, the experiments
reported in the literature on vibrated gas fluidization did not
cover low frequency ranges. Furthermore, often the effects of
frequency were not studied independently of the imparted
vibrational acceleration.
The purpose of this paper is a better understanding of the
separated effects of vibration frequency and acceleration on
the gas fluidization of aeratable powders. To this end an
extensive study on the vibrated gas fluidization of a Group A
powder was carried out. The frequency was changed in a range
between 7 and 100 Hz and the vibrational acceleration was
applied at levels close to the gravity acceleration (a/g = 0.5, 1.0
and 2.0). In addition to conventional fluidization analysis in
which bed expansion and pressure drops were measured at
different gas superficial velocities, also differential gas
pressure measurements at different heights within the bed
were carried out to observe possible internal non-uniformity
of the particulate phase generated by the vibration imparted
by the bed distributor.
2. Methods and materials
2.1. Apparatus
The core of the apparatus is a fluidization perspex column
85 mm i.d. and about 400 mm high. At the bottom the air is
distributed by a 10 mm thick porous plate of sintered brass
particles of about 10 mm diameter. The porous plate is
clamped by the flange connecting the air wind box and the
fluidization column. In the column flange a pressure port is
connected to a u-tube manometer filled with water. For local
gas pressure drop evaluations we used a second column
provided with pressure taps aligned on two arrays of equally
spaced taps each located on two opposite sides of the column
and numbered as indicated in Fig. 1. Couples of these taps
were connected to the ends of the u-tube manometer to
measure differential pressure drops. Desiccated air from the
laboratory line is fed to the wind box by a thermal mass flow
controller (Fe-771000 Aera, F) with a maximum flow rate of
0.17 � 10�3 std m3 s�1 (0 8C and atmospheric pressure). The
column is fixed to the vibrating plane of the actuator by means
of a rigid steel and aluminium structure. The actuator is an
electric inductance vibrator (V100 Gearing and Watson, USA)
which is able to produce a sinusoidal vertical movement in
the range 2–6500 Hz with displacement amplitudes up to
12.7 mm, exerting a maximum force of 26.7 kN. The vibrator
amplifier is connected to a vibration controller Sc-121 (Lab-
works Inc., USA) which is able to work with frequencies
between 2 and 6500 Hz. The controller measures the effective
vibrations by means of a piezoelectric accelerometer
(8636B60M05 Kistler, USA) fixed on the metal structure
supporting the fluidization column.
2.2. Materials
The powder used in the experiments is a sieved fluid cracking
catalyst (FCC) powder with a mean Sauter diameter of 77 mm
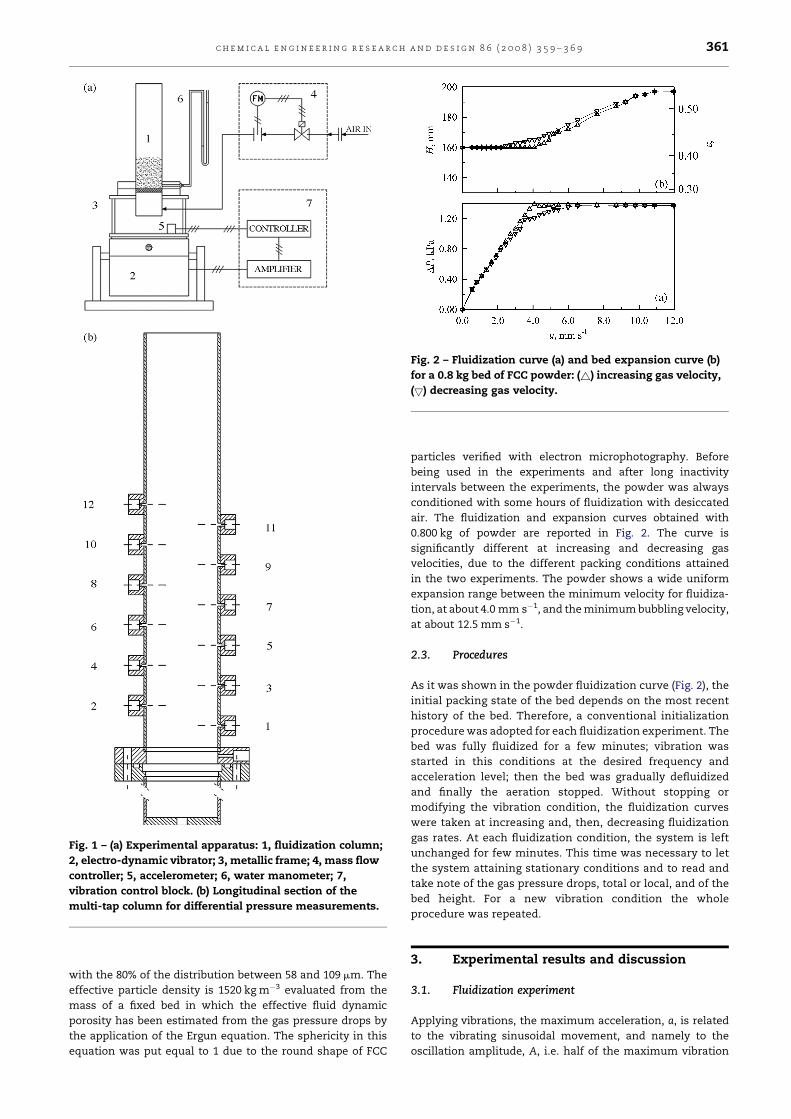
Fig. 1 – (a) Experimental apparatus: 1, fluidization column;
2, electro-dynamic vibrator; 3, metallic frame; 4, mass flow
controller; 5, accelerometer; 6, water manometer; 7,
vibration control block. (b) Longitudinal section of the
multi-tap column for differential pressure measurements.
Fig. 2 – Fluidization curve (a) and bed expansion curve (b)
for a 0.8 kg bed of FCC powder: (~) increasing gas velocity,
(5) decreasing gas velocity.
c h e m i c a l e n g i n e e r i n g r e s e a r c h a n d d e s i g n 8 6 ( 2 0 0 8 ) 3 5 9 – 3 6 9 361
with the 80% of the distribution between 58 and 109 mm. The
effective particle density is 1520 kg m�3 evaluated from the
mass of a fixed bed in which the effective fluid dynamic
porosity has been estimated from the gas pressure drops by
the application of the Ergun equation. The sphericity in this
equation was put equal to 1 due to the round shape of FCC
particles verified with electron microphotography. Before
being used in the experiments and after long inactivity
intervals between the experiments, the powder was always
conditioned with some hours of fluidization with desiccated
air. The fluidization and expansion curves obtained with
0.800 kg of powder are reported in Fig. 2. The curve is
significantly different at increasing and decreasing gas
velocities, due to the different packing conditions attained
in the two experiments. The powder shows a wide uniform
expansion range between the minimum velocity for fluidiza-
tion, at about 4.0 mm s�1, and the minimum bubbling velocity,
at about 12.5 mm s�1.
2.3. Procedures
As it was shown in the powder fluidization curve (Fig. 2), the
initial packing state of the bed depends on the most recent
history of the bed. Therefore, a conventional initialization
procedure was adopted for each fluidization experiment. The
bed was fully fluidized for a few minutes; vibration was
started in this conditions at the desired frequency and
acceleration level; then the bed was gradually defluidized
and finally the aeration stopped. Without stopping or
modifying the vibration condition, the fluidization curves
were taken at increasing and, then, decreasing fluidization
gas rates. At each fluidization condition, the system is left
unchanged for few minutes. This time was necessary to let
the system attaining stationary conditions and to read and
take note of the gas pressure drops, total or local, and of the
bed height. For a new vibration condition the whole
procedure was repeated.
3. Experimental results and discussion
3.1. Fluidization experiment
Applying vibrations, the maximum acceleration, a, is related
to the vibrating sinusoidal movement, and namely to the
oscillation amplitude, A, i.e. half of the maximum vibration
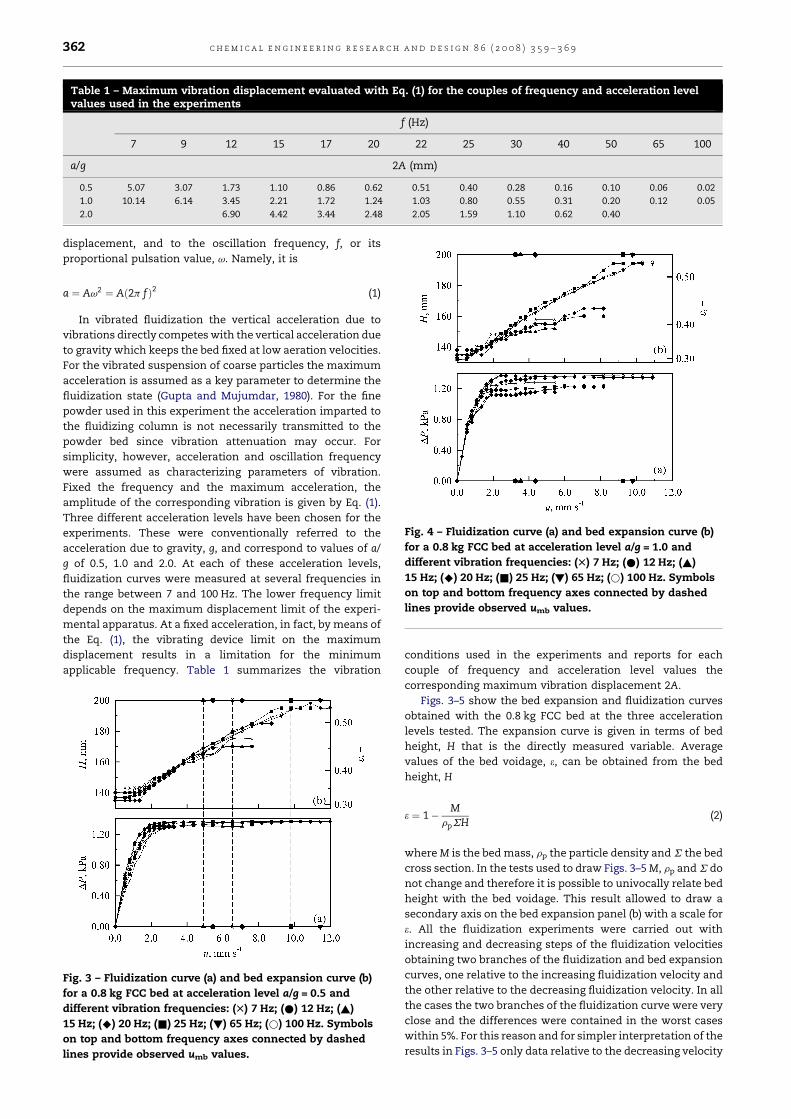
Table 1 – Maximum vibration displacement evaluated with Eq. (1) for the couples of frequency and acceleration levelvalues used in the experiments
f (Hz)
7 9 12 15 17 20 22 25 30 40 50 65 100
a/g 2A (mm)
0.5 5.07 3.07 1.73 1.10 0.86 0.62 0.51 0.40 0.28 0.16 0.10 0.06 0.02
1.0 10.14 6.14 3.45 2.21 1.72 1.24 1.03 0.80 0.55 0.31 0.20 0.12 0.05
2.0 6.90 4.42 3.44 2.48 2.05 1.59 1.10 0.62 0.40
Fig. 4 – Fluidization curve (a) and bed expansion curve (b)
for a 0.8 kg FCC bed at acceleration level a/g = 1.0 and
different vibration frequencies: (T) 7 Hz; (*) 12 Hz; (~)
15 Hz; (^) 20 Hz; (&) 25 Hz; (!) 65 Hz; (*) 100 Hz. Symbols
on top and bottom frequency axes connected by dashed
lines provide observed umb values.
c h e m i c a l e n g i n e e r i n g r e s e a r c h a n d d e s i g n 8 6 ( 2 0 0 8 ) 3 5 9 – 3 6 9362
displacement, and to the oscillation frequency, f, or its
proportional pulsation value, v. Namely, it is
a ¼ Av2 ¼ Að2p fÞ2 (1)
In vibrated fluidization the vertical acceleration due to
vibrations directly competes with the vertical acceleration due
to gravity which keeps the bed fixed at low aeration velocities.
For the vibrated suspension of coarse particles the maximum
acceleration is assumed as a key parameter to determine the
fluidization state (Gupta and Mujumdar, 1980). For the fine
powder used in this experiment the acceleration imparted to
the fluidizing column is not necessarily transmitted to the
powder bed since vibration attenuation may occur. For
simplicity, however, acceleration and oscillation frequency
were assumed as characterizing parameters of vibration.
Fixed the frequency and the maximum acceleration, the
amplitude of the corresponding vibration is given by Eq. (1).
Three different acceleration levels have been chosen for the
experiments. These were conventionally referred to the
acceleration due to gravity, g, and correspond to values of a/
g of 0.5, 1.0 and 2.0. At each of these acceleration levels,
fluidization curves were measured at several frequencies in
the range between 7 and 100 Hz. The lower frequency limit
depends on the maximum displacement limit of the experi-
mental apparatus. At a fixed acceleration, in fact, by means of
the Eq. (1), the vibrating device limit on the maximum
displacement results in a limitation for the minimum
applicable frequency. Table 1 summarizes the vibration
Fig. 3 – Fluidization curve (a) and bed expansion curve (b)
for a 0.8 kg FCC bed at acceleration level a/g = 0.5 and
different vibration frequencies: (T) 7 Hz; (*) 12 Hz; (~)
15 Hz; (^) 20 Hz; (&) 25 Hz; (!) 65 Hz; (*) 100 Hz. Symbols
on top and bottom frequency axes connected by dashed
lines provide observed umb values.
conditions used in the experiments and reports for each
couple of frequency and acceleration level values the
corresponding maximum vibration displacement 2A.
Figs. 3–5 show the bed expansion and fluidization curves
obtained with the 0.8 kg FCC bed at the three acceleration
levels tested. The expansion curve is given in terms of bed
height, H that is the directly measured variable. Average
values of the bed voidage, e, can be obtained from the bed
height, H
e ¼ 1� MrpSH
(2)
where M is the bed mass, rp the particle density and S the bed
cross section. In the tests used to draw Figs. 3–5 M, rp and S do
not change and therefore it is possible to univocally relate bed
height with the bed voidage. This result allowed to draw a
secondary axis on the bed expansion panel (b) with a scale for
e. All the fluidization experiments were carried out with
increasing and decreasing steps of the fluidization velocities
obtaining two branches of the fluidization and bed expansion
curves, one relative to the increasing fluidization velocity and
the other relative to the decreasing fluidization velocity. In all
the cases the two branches of the fluidization curve were very
close and the differences were contained in the worst cases
within 5%. For this reason and for simpler interpretation of the
results in Figs. 3–5 only data relative to the decreasing velocity

Fig. 5 – Bed expansion and fluidization curves with 0.8 kg
FCC bed at acceleration level a/g = 2.0 for different
vibration frequencies: (*) 12 Hz; (~) 15 Hz; (^) 20 Hz; (&)
25 Hz; (!) 65 Hz. Symbols on top and bottom frequency
axes connected by dashed lines provide observed umb
values.
Fig. 6 – Graphical evaluation procedure for ume, umsf and
umsb from the fluidization (a) and bed expansion (b) curves.
c h e m i c a l e n g i n e e r i n g r e s e a r c h a n d d e s i g n 8 6 ( 2 0 0 8 ) 3 5 9 – 3 6 9 363
branches of these curves are reported. In addition to the
mentioned absence of hysteresis, other common features of
the vibrated gas fluidization appear clearly from the inspec-
tion of these figures:
(1) T
he bed packing degree reached by the vibrated bedwithout gas flow is always higher than that reached
without vibration.
(2) T
he pressure drop in the fully fluidized bed may be equal orsmaller, sometimes significantly, than those obtained
without vibration. The latter always correspond to the
bed weight per unit cross sectional area.
(3) T
he bed starts expanding when the gas pressure drop isconsistently smaller than the necessary for fluidization or,
in any case, of the maximum pressure drop obtained at
high gas velocities.
(4) T
he largest bed expansion of the vibrated bed is alwayssmaller than that attained without vibration.
(5) If
the discrepancies between vibrated and not vibratedfluidization are assumed as a measure of the significance
of the effect of vibration, these are generally larger at low
frequencies and tend to become less important at high
frequencies. In particular, this happens under thorough
fluidization conditions.
There are other observations, closely related to point (3)
above, which can be made starting from a closer view of the
fluidization/expansion curves, as it is shown in Fig. 6. The
onset of bed expansion, in fact, corresponds to a reduction in
the slope of the rising branch of the fluidization curve. This
can be expected from the fact that, in the constant bed height
region, the increase of the gas pressure drop is exclusively
dependent on the increase of the gas velocity. When the bed
height increases, instead, the pressure drop rise, due to
increasing gas velocity, is partially compensated by an
increase of the bed permeability due to its expansion. The
onset of bed expansion, therefore, determines a double slope
of the fluidization curve that has also been observed in the
past by Gupta and Mujumdar (1980) and by Mawatari et al.
(2002b). These authors, however, did not have the possibility to
correlate this slope variation with the onset of bed expansion
and did not explicitly relate it to the bed expansion at gas
velocities lower than the minimum for fluidization. As shown
schematically in Fig. 6, we defined the minimum velocity for
bed expansion, ume, which can be clearly evaluated from the
bed expansion curve as the transition value from the constant
bed height region to the increasing bed height region. As
mentioned above, this velocity always corresponds to a slope
change in the bed gas pressure drop curve.
The minimum velocity for bed expansion, ume, is com-
pletely different in the meaning and in the determination
procedure from the minimum fluidization velocity. The latter,
in the case of vibrated fluidization, is more similar to the
minimum velocity for fluid dynamic suspension, umfs, which
has been defined as the intersection between two lines in the
fluidization diagram: (1) the first line is the one that can be
evaluated from the linear regression on the points on the
second rising branch of the fluidization curve, corresponding
to bed expansion; (2) the other line is the horizontal
corresponding to the plateau value of pressure drops. For
conventional fluidization this velocity corresponds to the
attainment of pressure drop values equal to the bed weight per
unit cross sectional area. For vibrated fluidization, instead, the
maximum pressure drop values at high gas velocities might be
smaller than the bed weight per unit cross sectional area.
Therefore, the similitude between the conventional minimum
fluidization velocity and the minimum velocity for fluid
dynamic suspension as defined above is limited to the
procedure to obtain them rather than to the exact physical
meaning.
A further difference with conventional fluidization of
Group A powders has been observed from the direct observa-
tion of vibrated fluidization. In the former case, in fact, the
onset of bubbling corresponds to a visible reduction in the
slope of the bed expansion curve. With vibrated fluidization,
instead, the first bubble appears at velocities not much larger
than umfs and may not correspond to such change of the bed
expansion slope. The value of this velocity, called umb, was

Fig. 7 – ume (a), corresponding bed height (b) and
corresponding pressure drop (c). a/g values for
experimental results: (*) 0.5; (&) 1.0; (^) 2.0. Values for
pressure drop evaluated by application of Ergun equation
for a/g: (*) 0.5; (&) 1.0; (^) 2.0.
Fig. 8 – umsf (a) corresponding bed height (b) and
corresponding pressure drop (c). a/g values for
experimental results: (*) 0.5; (&) 1.0; (^) 2.0. Values for
pressure drop evaluated by application of Ergun equation
for a/g: (*) 0.5; (&) 1.0; (^) 2.0.
c h e m i c a l e n g i n e e r i n g r e s e a r c h a n d d e s i g n 8 6 ( 2 0 0 8 ) 3 5 9 – 3 6 9364
registered during fluidization experiment at the appearance of
the first bubble. The end of the bed expansion, instead, was
associated with intense bubbling and, therefore, it was used to
define a fourth characteristic velocity that is the minimum
velocity for stable bubbling, umsb. This latter was intended as
the end of the bed expansion velocity range. In particular, it is
significant for the observation reported in point (4) on the
reduced bed expansion with vibration. This observation seems
to be in contrast with the findings of Mawatari et al. (2002a)
regarding the reported increase in the umb/umf andHmb/Hmf for
Group A powder for the acceleration range used in this work. It
ought to be noted, however, that Mawatari et al. (2002a)
worked at frequencies between 30 and 54 Hz at which,
according to our observations, the effect of vibrations on
the maximum bed expansion is limited but it is significant in
increasing the initial fixed bed compaction. Mawatari et al.
(2002a) do not report the absolute values of bed height and,
therefore, the reported results might be attributed to a
reduction of Hmf rather than to an increase of Hmb produced
by vibrations. A similar phenomenological picture of the effect
of vibration on the onset of bubbling is given by Valverde et al.
(2001). These authors show that vibration can promote the
onset of bubbling in homogenous gas fluidized beds. However,
the experimental procedure followed by them, application of
vibration on gas fluidized bed at a certain gas velocity, is
somewhat different from the one followed in this work and
does not allow a definite comparison of results.
Intensity of vibration has an important effect on the onset
of bubbling. Fig. 5 relative to a/g = 2.0 in particular shows
minimum bubbling velocities which are close and sometimes
lower than the minimum fluidization velocities. Especially in
these cases the eruption of bubbles may be associated to bed
channelling phenomena. Unfortunately it was not possible to
neatly differentiate between the onset of bubbling and
channelling due to very similar surface phenomena. As a
first approximation, however, we can say that bubbling
applies when umb > umsf and channelling applies when
umb < umsf.
The values of ume, umsf, umb and umsb with the correspond-
ing bed heights and pressure drops are plotted as a function of
the vibration frequency for the different acceleration levels in
Figs. 7–10, respectively. In general all plots show the largest
variations at low vibration frequencies, where larger values of
ume and smaller values of umb and umsb are found. At
frequencies larger than 30–40 Hz, instead, very limited
variations with frequency are observed. In the low frequency
range 0–30 Hz the most significant variations occur for umb and
umsb. For these two velocities trends are so similar to clearly
indicate the direct connection between the two values. This
might be expected from the fact that both these values are
connected to bubbling, even if these two are associated to
different fluidization condition and may differ significantly in
value.
In general, it is possible to say that for Group A powders
vibration has a negative effect on homogeneous fluidization.
This can be explained with the disrupting action of vibration
on the structures generated by interparticle forces. In case of
Group A powders labile structures due to interparticle forces
are responsible of stabilizing homogenous fluidization (Donsı
and Massimilla, 1973) and these might not resist the action of
vibration that, therefore, can determine bubbling at gas
velocities lower than in non-vibrated gas fluidized beds. The
role of frequency on the vibration effectiveness is evident from
Figs. 9 and 10. Lower frequency vibrations produce large and
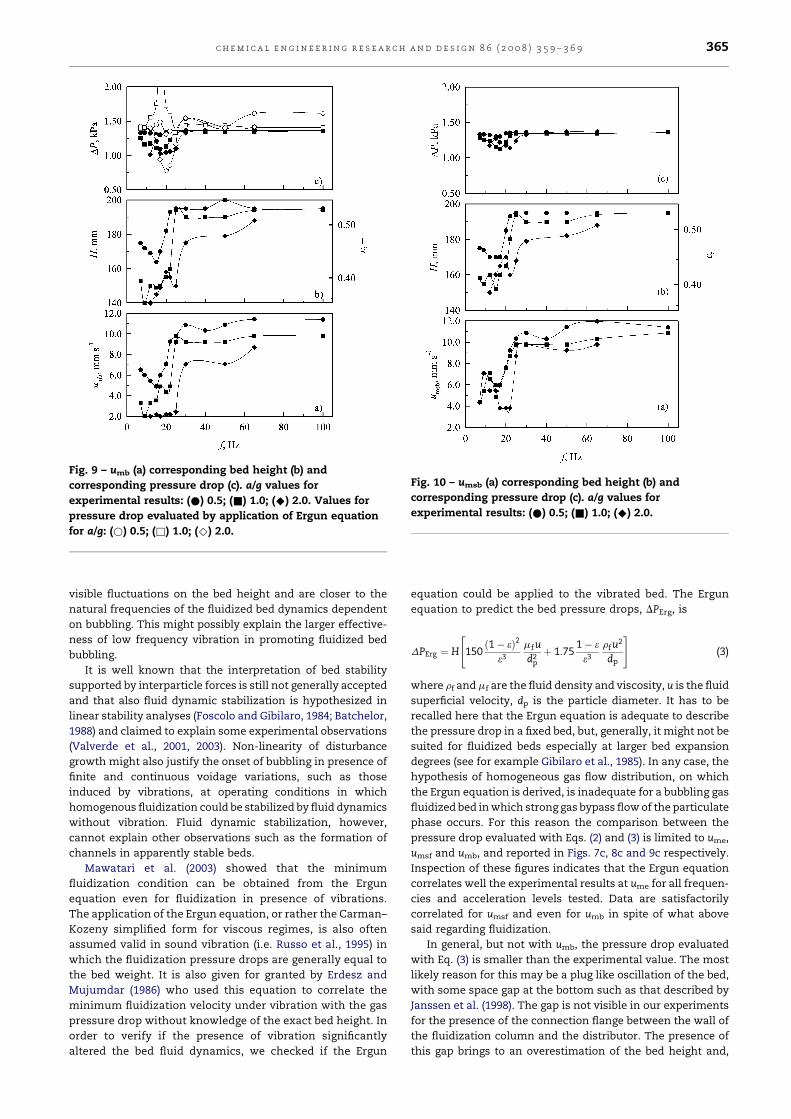
Fig. 9 – umb (a) corresponding bed height (b) and
corresponding pressure drop (c). a/g values for
experimental results: (*) 0.5; (&) 1.0; (^) 2.0. Values for
pressure drop evaluated by application of Ergun equation
for a/g: (*) 0.5; (&) 1.0; (^) 2.0.
Fig. 10 – umsb (a) corresponding bed height (b) and
corresponding pressure drop (c). a/g values for
experimental results: (*) 0.5; (&) 1.0; (^) 2.0.
c h e m i c a l e n g i n e e r i n g r e s e a r c h a n d d e s i g n 8 6 ( 2 0 0 8 ) 3 5 9 – 3 6 9 365
visible fluctuations on the bed height and are closer to the
natural frequencies of the fluidized bed dynamics dependent
on bubbling. This might possibly explain the larger effective-
ness of low frequency vibration in promoting fluidized bed
bubbling.
It is well known that the interpretation of bed stability
supported by interparticle forces is still not generally accepted
and that also fluid dynamic stabilization is hypothesized in
linear stability analyses (Foscolo and Gibilaro, 1984; Batchelor,
1988) and claimed to explain some experimental observations
(Valverde et al., 2001, 2003). Non-linearity of disturbance
growth might also justify the onset of bubbling in presence of
finite and continuous voidage variations, such as those
induced by vibrations, at operating conditions in which
homogenous fluidization could be stabilized by fluid dynamics
without vibration. Fluid dynamic stabilization, however,
cannot explain other observations such as the formation of
channels in apparently stable beds.
Mawatari et al. (2003) showed that the minimum
fluidization condition can be obtained from the Ergun
equation even for fluidization in presence of vibrations.
The application of the Ergun equation, or rather the Carman–
Kozeny simplified form for viscous regimes, is also often
assumed valid in sound vibration (i.e. Russo et al., 1995) in
which the fluidization pressure drops are generally equal to
the bed weight. It is also given for granted by Erdesz and
Mujumdar (1986) who used this equation to correlate the
minimum fluidization velocity under vibration with the gas
pressure drop without knowledge of the exact bed height. In
order to verify if the presence of vibration significantly
altered the bed fluid dynamics, we checked if the Ergun
equation could be applied to the vibrated bed. The Ergun
equation to predict the bed pressure drops, DPErg, is
DPErg ¼ H 150ð1� eÞ2
e3
mfud2
p
þ 1:751� ee3
rfu2
dp
" #(3)
where rf and mf are the fluid density and viscosity, u is the fluid
superficial velocity, dp is the particle diameter. It has to be
recalled here that the Ergun equation is adequate to describe
the pressure drop in a fixed bed, but, generally, it might not be
suited for fluidized beds especially at larger bed expansion
degrees (see for example Gibilaro et al., 1985). In any case, the
hypothesis of homogeneous gas flow distribution, on which
the Ergun equation is derived, is inadequate for a bubbling gas
fluidized bed in which strong gas bypass flow of the particulate
phase occurs. For this reason the comparison between the
pressure drop evaluated with Eqs. (2) and (3) is limited to ume,
umsf and umb, and reported in Figs. 7c, 8c and 9c respectively.
Inspection of these figures indicates that the Ergun equation
correlates well the experimental results at ume for all frequen-
cies and acceleration levels tested. Data are satisfactorily
correlated for umsf and even for umb in spite of what above
said regarding fluidization.
In general, but not with umb, the pressure drop evaluated
with Eq. (3) is smaller than the experimental value. The most
likely reason for this may be a plug like oscillation of the bed,
with some space gap at the bottom such as that described by
Janssen et al. (1998). The gap is not visible in our experiments
for the presence of the connection flange between the wall of
the fluidization column and the distributor. The presence of
this gap brings to an overestimation of the bed height and,
c h e m i c a l e n g i n e e r i n g r e s e a r c h a n d d e s i g n 8 6 ( 2 0 0 8 ) 3 5 9 – 3 6 9366
therefore, of the bed voidage, which justifies the observed
deviation between the Ergun estimate and the pressure drop
measurements. For umb the pressure drop evaluated with
Eq. (3) is generally larger than the experimental value. This is
expected in this case because of the gas bypass of the bed
determined by bubbles which brings to an overestimation of
both the gas velocity and the gas pressure drops in the
particulate phase. From these results we might conclude that
the vibration applied through the fluidization column does not
affect directly the gas–solid interactions inside an aerated bed,
even in condition in which the overall pressure drops through
the bed are consistently different from the bed weight.
Vibrations, instead, are able to change the packing degree of
the bed, determining pressure drops in a vibrated bed different
from those in a non-vibrated bed at the same gas velocity.
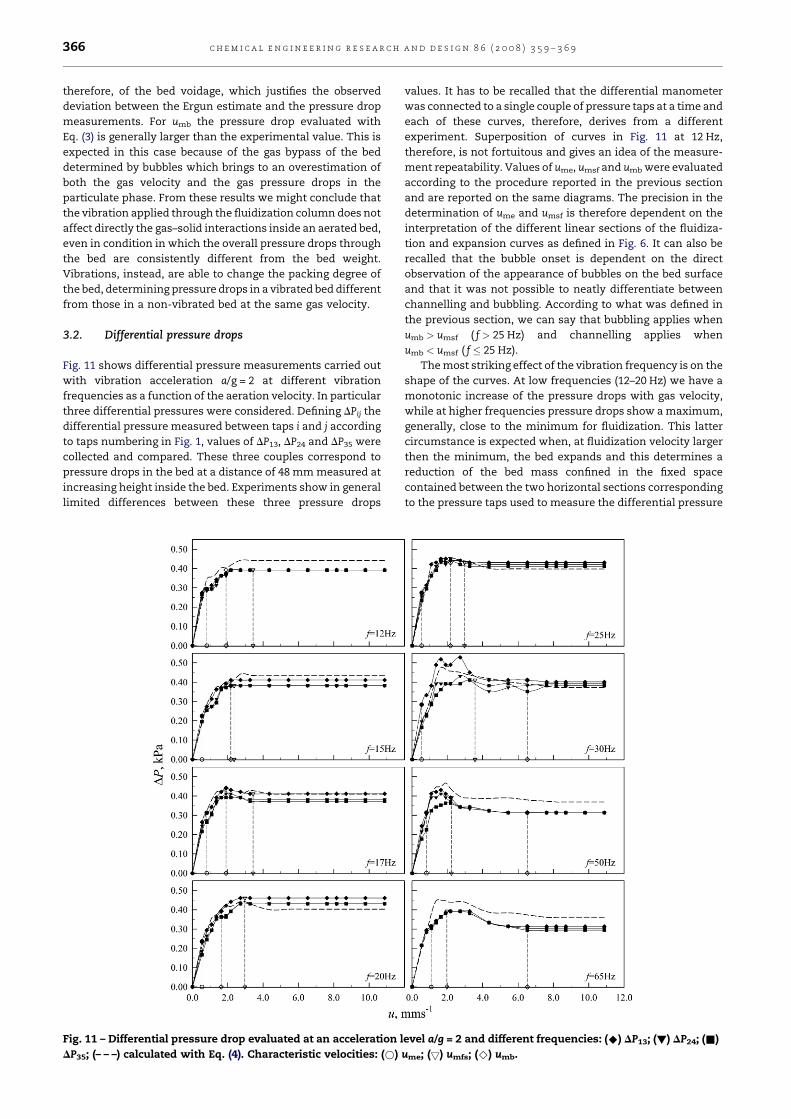
3.2. Differential pressure drops
Fig. 11 shows differential pressure measurements carried out
with vibration acceleration a/g = 2 at different vibration
frequencies as a function of the aeration velocity. In particular
three differential pressures were considered. Defining DPij the
differential pressure measured between taps i and j according
to taps numbering in Fig. 1, values of DP13, DP24 and DP35 were
collected and compared. These three couples correspond to
pressure drops in the bed at a distance of 48 mm measured at
increasing height inside the bed. Experiments show in general
limited differences between these three pressure drops
Fig. 11 – Differential pressure drop evaluated at an acceleration l
DP35; (– – –) calculated with Eq. (4). Characteristic velocities: (*)
values. It has to be recalled that the differential manometer
was connected to a single couple of pressure taps at a time and
each of these curves, therefore, derives from a different
experiment. Superposition of curves in Fig. 11 at 12 Hz,
therefore, is not fortuitous and gives an idea of the measure-
ment repeatability. Values of ume, umsf and umb were evaluated
according to the procedure reported in the previous section
and are reported on the same diagrams. The precision in the
determination of ume and umsf is therefore dependent on the
interpretation of the different linear sections of the fluidiza-
tion and expansion curves as defined in Fig. 6. It can also be
recalled that the bubble onset is dependent on the direct
observation of the appearance of bubbles on the bed surface
and that it was not possible to neatly differentiate between
channelling and bubbling. According to what was defined in
the previous section, we can say that bubbling applies when
umb > umsf ( f > 25 Hz) and channelling applies when
umb < umsf ( f � 25 Hz).
The most striking effect of the vibration frequency is on the
shape of the curves. At low frequencies (12–20 Hz) we have a
monotonic increase of the pressure drops with gas velocity,
while at higher frequencies pressure drops show a maximum,
generally, close to the minimum for fluidization. This latter
circumstance is expected when, at fluidization velocity larger
then the minimum, the bed expands and this determines a
reduction of the bed mass confined in the fixed space
contained between the two horizontal sections corresponding
to the pressure taps used to measure the differential pressure
evel a/g = 2 and different frequencies: (^) DP13; (!) DP24; (&)
ume; (5) umfs; (^) umb.
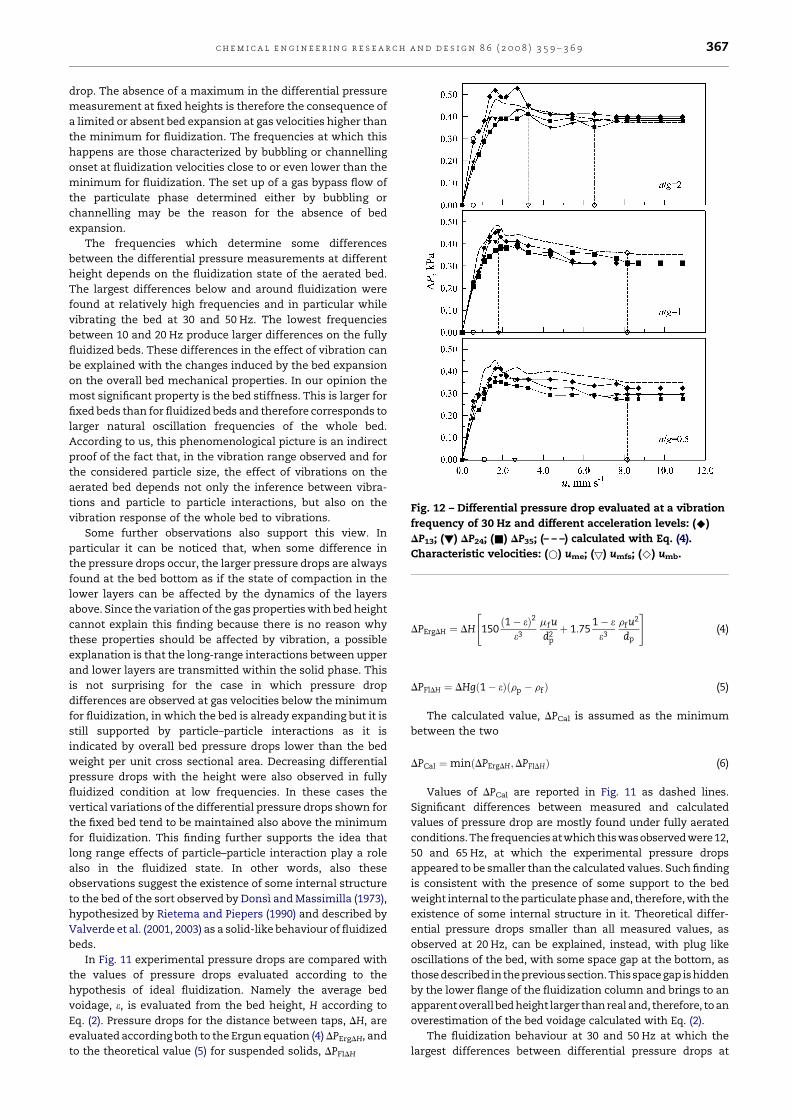
Fig. 12 – Differential pressure drop evaluated at a vibration
frequency of 30 Hz and different acceleration levels: (^)
DP13; (!) DP24; (&) DP35; (– – –) calculated with Eq. (4).
Characteristic velocities: (*) ume; (5) umfs; (^) umb.
c h e m i c a l e n g i n e e r i n g r e s e a r c h a n d d e s i g n 8 6 ( 2 0 0 8 ) 3 5 9 – 3 6 9 367
drop. The absence of a maximum in the differential pressure
measurement at fixed heights is therefore the consequence of
a limited or absent bed expansion at gas velocities higher than
the minimum for fluidization. The frequencies at which this
happens are those characterized by bubbling or channelling
onset at fluidization velocities close to or even lower than the
minimum for fluidization. The set up of a gas bypass flow of
the particulate phase determined either by bubbling or
channelling may be the reason for the absence of bed
expansion.
The frequencies which determine some differences
between the differential pressure measurements at different
height depends on the fluidization state of the aerated bed.
The largest differences below and around fluidization were
found at relatively high frequencies and in particular while
vibrating the bed at 30 and 50 Hz. The lowest frequencies
between 10 and 20 Hz produce larger differences on the fully
fluidized beds. These differences in the effect of vibration can
be explained with the changes induced by the bed expansion
on the overall bed mechanical properties. In our opinion the
most significant property is the bed stiffness. This is larger for
fixed beds than for fluidized beds and therefore corresponds to
larger natural oscillation frequencies of the whole bed.
According to us, this phenomenological picture is an indirect
proof of the fact that, in the vibration range observed and for
the considered particle size, the effect of vibrations on the
aerated bed depends not only the inference between vibra-
tions and particle to particle interactions, but also on the
vibration response of the whole bed to vibrations.
Some further observations also support this view. In
particular it can be noticed that, when some difference in
the pressure drops occur, the larger pressure drops are always
found at the bed bottom as if the state of compaction in the
lower layers can be affected by the dynamics of the layers
above. Since the variation of the gas properties with bed height
cannot explain this finding because there is no reason why
these properties should be affected by vibration, a possible
explanation is that the long-range interactions between upper
and lower layers are transmitted within the solid phase. This
is not surprising for the case in which pressure drop
differences are observed at gas velocities below the minimum
for fluidization, in which the bed is already expanding but it is
still supported by particle–particle interactions as it is
indicated by overall bed pressure drops lower than the bed
weight per unit cross sectional area. Decreasing differential
pressure drops with the height were also observed in fully
fluidized condition at low frequencies. In these cases the
vertical variations of the differential pressure drops shown for
the fixed bed tend to be maintained also above the minimum
for fluidization. This finding further supports the idea that
long range effects of particle–particle interaction play a role
also in the fluidized state. In other words, also these
observations suggest the existence of some internal structure
to the bed of the sort observed by Donsı and Massimilla (1973),
hypothesized by Rietema and Piepers (1990) and described by
Valverde et al. (2001, 2003) as a solid-like behaviour of fluidized
beds.
In Fig. 11 experimental pressure drops are compared with
the values of pressure drops evaluated according to the
hypothesis of ideal fluidization. Namely the average bed
voidage, e, is evaluated from the bed height, H according to
Eq. (2). Pressure drops for the distance between taps, DH, are
evaluated according both to the Ergun equation (4) DPErgDH, and
to the theoretical value (5) for suspended solids, DPFlDH
DPErgDH ¼ DH 150ð1� eÞ2
e3
mfud2
p
þ 1:751� ee3
rfu2
dp
" #(4)
DPFlDH ¼ DHgð1� eÞðrp � rfÞ (5)
The calculated value, DPCal is assumed as the minimum
between the two
DPCal ¼minðDPErgDH;DPFlDHÞ (6)
Values of DPCal are reported in Fig. 11 as dashed lines.
Significant differences between measured and calculated
values of pressure drop are mostly found under fully aerated
conditions. The frequencies atwhich this wasobserved were 12,
50 and 65 Hz, at which the experimental pressure drops
appeared to be smaller than the calculated values. Such finding
is consistent with the presence of some support to the bed
weight internal to the particulate phase and, therefore, with the
existence of some internal structure in it. Theoretical differ-
ential pressure drops smaller than all measured values, as
observed at 20 Hz, can be explained, instead, with plug like
oscillations of the bed, with some space gap at the bottom, as
those describedinthe previoussection. This space gap ishidden
by the lower flange of the fluidization column and brings to an
apparent overall bed height larger than real and, therefore, to an
overestimation of the bed voidage calculated with Eq. (2).
The fluidization behaviour at 30 and 50 Hz at which the
largest differences between differential pressure drops at
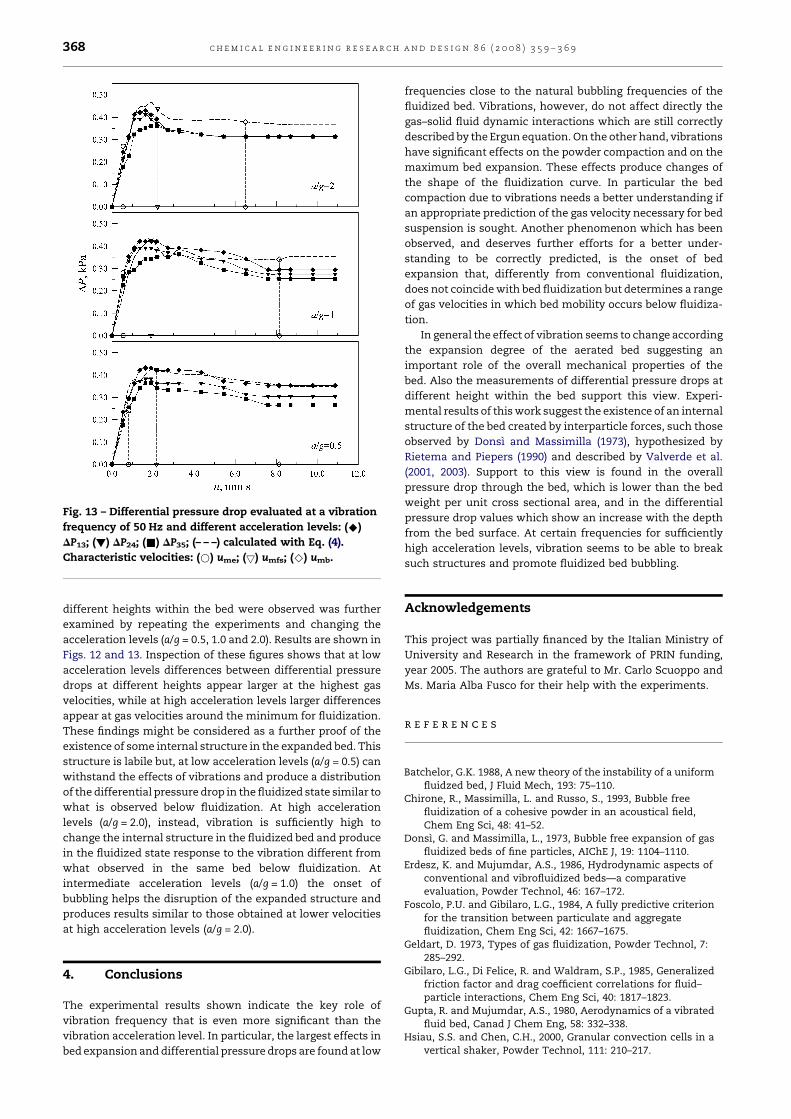
Fig. 13 – Differential pressure drop evaluated at a vibration
frequency of 50 Hz and different acceleration levels: (^)
DP13; (!) DP24; (&) DP35; (– – –) calculated with Eq. (4).
Characteristic velocities: (*) ume; (5) umfs; (^) umb.
c h e m i c a l e n g i n e e r i n g r e s e a r c h a n d d e s i g n 8 6 ( 2 0 0 8 ) 3 5 9 – 3 6 9368
different heights within the bed were observed was further
examined by repeating the experiments and changing the
acceleration levels (a/g = 0.5, 1.0 and 2.0). Results are shown in
Figs. 12 and 13. Inspection of these figures shows that at low
acceleration levels differences between differential pressure
drops at different heights appear larger at the highest gas
velocities, while at high acceleration levels larger differences
appear at gas velocities around the minimum for fluidization.
These findings might be considered as a further proof of the
existence of some internal structure in the expanded bed. This
structure is labile but, at low acceleration levels (a/g = 0.5) can
withstand the effects of vibrations and produce a distribution
of the differential pressure drop in the fluidized state similar to
what is observed below fluidization. At high acceleration
levels (a/g = 2.0), instead, vibration is sufficiently high to
change the internal structure in the fluidized bed and produce
in the fluidized state response to the vibration different from
what observed in the same bed below fluidization. At
intermediate acceleration levels (a/g = 1.0) the onset of
bubbling helps the disruption of the expanded structure and
produces results similar to those obtained at lower velocities
at high acceleration levels (a/g = 2.0).
4. Conclusions
The experimental results shown indicate the key role of
vibration frequency that is even more significant than the
vibration acceleration level. In particular, the largest effects in
bed expansion and differential pressure drops are found at low
frequencies close to the natural bubbling frequencies of the
fluidized bed. Vibrations, however, do not affect directly the
gas–solid fluid dynamic interactions which are still correctly
described by the Ergun equation. On the other hand, vibrations
have significant effects on the powder compaction and on the
maximum bed expansion. These effects produce changes of
the shape of the fluidization curve. In particular the bed
compaction due to vibrations needs a better understanding if
an appropriate prediction of the gas velocity necessary for bed
suspension is sought. Another phenomenon which has been
observed, and deserves further efforts for a better under-
standing to be correctly predicted, is the onset of bed
expansion that, differently from conventional fluidization,
does not coincide with bed fluidization but determines a range
of gas velocities in which bed mobility occurs below fluidiza-
tion.
In general the effect of vibration seems to change according
the expansion degree of the aerated bed suggesting an
important role of the overall mechanical properties of the
bed. Also the measurements of differential pressure drops at
different height within the bed support this view. Experi-
mental results of this work suggest the existence of an internal
structure of the bed created by interparticle forces, such those
observed by Donsı and Massimilla (1973), hypothesized by
Rietema and Piepers (1990) and described by Valverde et al.
(2001, 2003). Support to this view is found in the overall
pressure drop through the bed, which is lower than the bed
weight per unit cross sectional area, and in the differential
pressure drop values which show an increase with the depth
from the bed surface. At certain frequencies for sufficiently
high acceleration levels, vibration seems to be able to break
such structures and promote fluidized bed bubbling.
Acknowledgements
This project was partially financed by the Italian Ministry of
University and Research in the framework of PRIN funding,
year 2005. The authors are grateful to Mr. Carlo Scuoppo and
Ms. Maria Alba Fusco for their help with the experiments.
r e f e r e n c e s
Batchelor, G.K. 1988, A new theory of the instability of a uniformfluidzed bed, J Fluid Mech, 193: 75–110.
Chirone, R., Massimilla, L. and Russo, S., 1993, Bubble freefluidization of a cohesive powder in an acoustical field,Chem Eng Sci, 48: 41–52.
Donsı, G. and Massimilla, L., 1973, Bubble free expansion of gasfluidized beds of fine particles, AIChE J, 19: 1104–1110.
Erdesz, K. and Mujumdar, A.S., 1986, Hydrodynamic aspects ofconventional and vibrofluidized beds—a comparativeevaluation, Powder Technol, 46: 167–172.
Foscolo, P.U. and Gibilaro, L.G., 1984, A fully predictive criterionfor the transition between particulate and aggregatefluidization, Chem Eng Sci, 42: 1667–1675.
Geldart, D. 1973, Types of gas fluidization, Powder Technol, 7:285–292.
Gibilaro, L.G., Di Felice, R. and Waldram, S.P., 1985, Generalizedfriction factor and drag coefficient correlations for fluid–particle interactions, Chem Eng Sci, 40: 1817–1823.
Gupta, R. and Mujumdar, A.S., 1980, Aerodynamics of a vibratedfluid bed, Canad J Chem Eng, 58: 332–338.
Hsiau, S.S. and Chen, C.H., 2000, Granular convection cells in avertical shaker, Powder Technol, 111: 210–217.
c h e m i c a l e n g i n e e r i n g r e s e a r c h a n d d e s i g n 8 6 ( 2 0 0 8 ) 3 5 9 – 3 6 9 369
Hsiau, S.S. and Pan, S.J., 1998, Motion state transitions in avibrated granular bed, Powder Technol, 96: 219–226.
Hsiau, S.S., Wu, M.H. and Chen, C.H., 1998, Arching phenomenain a vibrated granular bed, Powder Technol, 99: 185–193.
Janssen, L. P. B. M. , Marring, E., Hoogerbrugge, J.C. andHoffmann, A.C., 1998, The mechanical behaviour ofvibrated beds of glass and starch powders, Chem Eng Sci,53: 761–772.
Jaraiz, E., Kimura, S. and Levenspiel, O., 1992, Vibrating beds offine powders: estimation of interparticle forces fromexpansion and pressure drop experiments, PowderTechnol, 72: 23–30.
Kudrolli, A. 2004, Size separation in vibrated granular matter,Rep Prog Phys, 67: 209–247.
Levy, E.K., Shnitzer, I., Masaki, T. and Salmento, J., 1997, Effectof an acoustic field on bubbling in a gas fluidized bed,Powder Technol, 90: 53–57.
Luding, S., Hermann, H.J. and Blumen, A., 1994, Simulation oftwo-dimensional arrays of beads under external vibration:sealing behaviour, Phys Rev, E50: 3100–3108.
Marring, E., Hoffmann, A.C. and Janssen, L. P. B. M. , 1994, Theeffect of vibration on the fluidization behavior of somecohesive powders, Powder Technol, 79: 1–10.
Mawatari, Y., Akune, T., Tatemoto, Y. and Noda, K., 2002a,Bubbling and bed expansion behavior under vibration in agas–solid fluidized bed, Chem Eng Technol, 25: 1095–1100.
Mawatari, Y., Koide, T., Tatemoto, Y., Uchida, S. and Noda, K.,2002b, Effect of particle diameter on fluidization undervibration, Powder Technol, 123: 69–74.
Mawatari, Y., Tatemoto, Y. and Noda, K., 2003, Prediction ofminimum fluidization velocity for vibrated fluidized bed,Powder Technol, 131: 66–70.
Morse, R.D. 1955, Sonic energy in granular solid fluidization, IndEng Chem, 47: 1170–1180.
Nowak, W., Hasatani, M. and Derczynski, M., 1993, Fluidizationand heat transfer of fine particles in an acoustical field,AIChE Symp Ser, 89: 137–149.
Rietema, K. and Piepers, H.W., 1990, The effect of interparticleforces on the stability of gas-fluidized beds. I. Experimentalevidence, Chem Eng Sci, 45: 1627–1639.
Russo, P., Chirone, R., Massimilla, L. and Russo, S., 1995, Theinfluence of the frequency of acoustic waves on sound-assisted fluidization of beds of fine particles, PowderTechnol, 82: 219–230.
Thomas, B., Mason, M.O. and Squires, A.M., 2000, Somebehaviors of shallow vibrated beds across a wide range inparticle size and their implications for powderclassification, Powder Technol, 11: 34–49.
Tai, C.H. and Hsiau, S.S., 2004, Dynamic behaviors of powders ina vibrating bed, Powder Technol, 139: 221–232.
Valverde, J.M. and Castellanos, A., 2006, Effect of vibrationon agglomerate particulate fluidization, AIChE J, 52:1705–1714.
Valverde, J.M., Castellanos, A. and Quintanilla, M.A.S., 2001,Effect of vibration on the stability of a gas-fluidized bed offine powder, Phys Rev E, 64 pap 021302: 1–8.
Valverde, J.M., Castellanos, A., Mills, P. and Quintanilla, M.A.S.,2003, Effect of particle size and interparticle forces on thefluidization behaviour of gas fluidized beds, Phys Rev E, 67pap 051305: 1–6.
Wang, T.-J., Jin, Y., Tsutsumi, A., Wang, Z. and Cui, Z., 2000,Energy transfer mechanism in a vibrating fluidized bed,Chem Eng Sci, 78: 115–123.
Wang, Y., Wang, T.-J., Yi, Y. and Yong, J., 2002, Resonancecharacteristics of a vibrated fluidized bed with a high bedhold-up, Powder Technol, 127: 196–202.
Williams, J.C. 1976, The segregation of particulate materials: areview, Powder Technol, 15: 245–251.
Copyright © 2022 FDOKUMEN