The effect of land uses on soil properties
34
1 Title The effect of land uses on soil properties in and around Mabira Forest
Transcript of The effect of land uses on soil properties

1
Title
The effect of land uses on soil properties in and around Mabira Forest

2
CHAPTER ONE
1.0 INTRODUCTION
Land-use changes are environmentally significant in their own right. They degrade or enhance the
land's capacity for sustained use and ability to regain its original cover. In some cases land-cover
changes, or their impacts, can become so large or widespread that they are identified as global
change in themselves. Elsewhere this kind of change has been referred to as globally cumulative
change [Turner, Clark et al. 1990].
Land use patterns in the South Pacific are immensely varied between the various groups of
countries. However, countries of similar size and with a similar degree of development tend to
exhibit similar patterns in their broad land use. The large developed countries, Australia and New
Zealand, have both cleared substantial areas of natural forest to establish pastoral agricultural
systems. The Australian Resource Assessment Commission (1991) notes that since European
settlement approximately half Australia's forests have been cleared or severely modified, while
New Zealand has cleared one-third of its forests in the same period, and a further third in the
preceding millennium of Maori settlement.
Soil structural deterioration has occurred in the over-cultivated and heavily populated districts of
Kisoro, Kabale, Mbale, Kapchorwa, Bushenyi, Mukono and Arua. The main causes of soil
degradation in Uganda include degradation of organic matter content, depletion of vegetative
cover, climate, land form and soil characteristics, land fragmentation, improper farming systems,
soil compaction, overgrazing, deforestation, residual effects of agro-chemicals, bush fires,
population pressure, poverty, illiteracy and lack of awareness and the considerable pressure on
woodlands, forest areas and agricultural lands as sources of fuel wood (NEMA, 2001).

3
1.1 STATEMENT OF THE PROBLEM
The different land uses in and around Mabira forest affect soil properties differently. The population
increase has greatly impacted on the forest environment in form of subsistence, commercial
agriculture, logging, grazing, charcoal burning and infrastructural development. This scenario has
greatly impacted on the soil properties (chemical, physical and biological) of Mabira forest.
Therefore with the inadequate knowledge among the population on the impacts of different land
uses on the soil properties, this study will contribute greatly in identifying the effects of land uses on
the soil properties in and around Mabira Central Forest Reserve.
1.2 DEFINITION OF KEY TERMS
Soil is a natural body synthesized over time from a mixture of inorganic and organic parent
materials, now supporting living plants. Soils with depth have natural horizons (layers) that give
them their properties. Such properties include texture, color, structure, and bulk density.
Land use refers to the degree to which the land reflects human activities (such as residential and
industrial development, roads, mining, timber harvesting, agriculture, grazing). Land use describes
how a piece of land is managed or used by humans
1.3 OBJECTIVES
Overall Objective:
To determine the effect of land uses on soil properties in and around Mabira Forest.
Specific Objectives:
i To determine the soil properties under the forestry land use.
ii To determine the soil properties under the agricultural land use.
1.4 JUSTIFICATION OF THE STUDY
The report is set to promote sustainable land management which will recognize the limits of human
consumption and harmonize the complementary goals of society and the economy while
maintaining environmental quality on the soil properties.

4
The report will aid the decision makers in monitoring agricultural land uses which tends to encroach
on fragile ecosystems and forests since the process requires close coordinating and policy
measures to be introduced.
The research report will be important in determining how fertility can be maintained in the
agricultural land-use systems to obtain high yields.

5
CHAPTER THREE
3.0 MATERIALS AND METHODS
3.1 Area of study
Mabira Forest Reserve lies in the counties of Buikwe and Nakifuma in the administrative district of
Mukono. It was established under the Buganda Agreement in 1900 and occupies an area of 306
km2 with an altitudinal range of 1070-1340m situated between 32 520 – 33 070 E and 0 24 – 0 350
N. It is found 54km east of Kampala and 26km west of Jinja.
The soils of the Mabira Catena are generally ferralitic sandy clay loams with black waterlogged clays in
the valley bottoms. The Mabira catena is characteristic of the entire Mabira Forest Reserve and the
adjacent villages of Najjembe and Kawolo. The general relief of this series is somewhat steeper and the
hills themselves are more ridge-like in appearance with long and generally rounded crests than the
catenas previously described. In this series the upland soil sequence is derived from two different
bands of parent material. The summit and upper slopes are developed over relic ironstone and the
pediment soils from weathering products of phyllite with minor occurrences of aphibolite, which give rise
to red or yellow clays. The red associates of the Mabira Catena are strongly laterized and contain well-
developed murram horizons. The soil has high clay content (well over 60 percent in the lower horizons)
and generally a good nutrient status, particularly in respect of organic matter (4 to 6 percent carbon)
and exchangeable bases (Pallister, 1957).
3.2. SAMPLING PROCEDURE
Three replications were considered randomly in each land use type. Three points were considered
in each replicate. The soil samples from the three points were then mixed to represent one sample
for a replicate. Samples were taken from two depths: 0-15cm and 15-30cm respectively.
3.3 FIELD METHODS
3.3.1 Physical properties
For bulk density the Core Method was used where the metal cores were pushed into the soil
horizons using a hammer and a hoe to obtain samples with specific volumes. After bringing the soil
samples back from the field, cores were covered with a piece of cloth to prevent the soil from falling

6
out of the cores. The cores were also labeled with a regime number. The soil was saturated to
remove air and the wet mass of the soil was placed in an oven to dry for 48 hours. Bulk density
was calculated from the mass of a given volume of dry soil, including the air spaces, but excluding
materials larger than soil, such as rocks or materials with dimensions greater than 2.0 mm. In the
lab, soil samples were dried in order to obtain the dry mass of the soil using AE ADAM machine.
The cores that were used for collecting the soil samples were massed and their volumes by
diameter and height measured with results recorded in a notebook to get the size of the core in
relation to the volume of the soil.
Plate 1. Shows how bulky density was determined using the core method
Source: Photograph taken by the research in the field
The falling head method was used to measure the saturated hydraulic conductivity of the cores
using water and a piece of cloth tired at the bottom. Cores were first submersed in a basin with
water for a night for saturation. After that any empty core was tired to the saturated one with sole
tape and placed in between block for easy measurements and water flow. The cores were filled
with water for the purpose of hydraulic conductivity and measurements were taken in terms of time
using stop watches and a ruler used for height determinations of the cores.

7
Plate 2. Shows how hydraulic conductivity was determined using the falling head method
Source: Photograph taken by the research in the field
Structure was got through the mesh/sieve set up method. With structure the buyoucos hydrometer
meter was used in determining the soil texture. The Munsell Soil Color Chart was used to identify
soils. Each color chip in the Munsell book represents a combination of hue (color), value (lightness
or darkness), and chroma (purity) that reflects the degree of wetness in the soil.
Plate 3. Shows how soil structure was got to be determined by mesh set up method
Source: Photograph taken by the research in the field

8
3.3.2 Chemical properties
For soil pH the pH meter was used in determining the alkalinity, acidity and neutrality of the soil.
For the available phosphorus the bray and Kutz No1 method was used in the phosphorus
assessment in the soil. Organic Matter the Black and Walkley (1934) method was used and
kjeldhal method was used to determine the availability of nitrogen in the soil. The slope positions
were also taken using a suttoo to determine the degrees and centimeters.
3.3.3 Biological properties
The monolith method was used to identify the macro-fauna composition in the different forest and
agricultural regimes in and around Mabira forest. Sampling for macro-fauna was done using a
monolith of size 30cm x 30cm x 30 cm, samples were taken from each regime for example sugar
mechanized, banana, sugar manual, 0-30 years,10 – 20 years,40 – 50 years and above 55 years
at two different depths 0 – 15 cm and 15 – 30 cm.
Sample sites were randomly selected from the different regimes. A hand hoe, basins, a ruler and a
panga were the main tools of importance in activities such as digging the monolith, measuring the
area coverage and depths of the monolith and chopping the monolith respectively. From the two
different levels were put in different basins labeled 0 – 15cm and 15 – 30 cm before the organisms
could be manually counted by breaking the soil laps and any visible organism could be counted
and recorded.
Plate 3. Shows the monolith method used to identify macro-fauna
Source: Photograph taken by the research in the field

9
3.4 DATA ANALYSIS
All the data collected from the field was edited and coded in Microsoft Excel. The transformed data
were subjected to analysis of variance (ANOVA) using Genstat for Windows program. The least
significant difference was used to determine difference between the treatments and depth.

10
Map of Mabira Central Forest Reserve
Source: National Forestry Department

11
Map of Mabira Central Forest Reserve showing the sampling sites
Source: National Forestry Department

12
#
#
##
##
#
#
10 - 20 yearsSample sites
0 - 3 yearsSample sites
Metha (NO)Sample sites
Kitigoma
175
Bugule
KITIGOMA
KKONKO
510000
510000
510500
510500
511000
511000
511500
511500
512000
512000
45000 45000
45500 45500
46000 46000
MABIRA CENTRAL FOREST RESERVELocation of Soil Sampling Sites
0 0.1 0.2 0.3 0.40.05
Kilometers
1:10,000
Legend
# Sampling Points
Roads
All Weather Road, Bound Surface
All Weather Road, Loose Surface
Dry Weather Road
Motorable Track
GPS Track Log
Rivers
Main
Small Permanent
Seasonal
Management Zonation
Production (Low Impact
Recreation/Buffer Zone
Strict Nature Reserve
##
#
#
#
#
#
#
#
#
#
#
#
##
#
#
#
#
#
Location Map Of Sample site in and near Bugule Compartment (175) in Mabira CFR
Map of Mabira Central Forest Reserve showing the location of soil sampling sites
Source: National Forestry Department

13
CHAPTER FOUR
4.0 RESULTS
4.1 THE FOREST LAND USE ON SOIL PROPERTIES
4.1.1 Chemical Properties
4.1.1.1 Organic Matter
Figure 1: Shows the average organic matter in the forest land use
There was a very highly significant effect of treatment (P<0.001) on the quantities of organic matter
in the soil. The highest being the 10-20 year treatment and the lowest the 0-3 years treatment.
Figure 2: Shows the organic matter in the forest land use with depth
Organic matter
0
2
4
6
8
0-3yrs 10-20yrs 40-50yrs >55yrs
Treatment
%
0-15cm
15-30cm
There was a very highly significant effect of depth (P<0.001) on the quantities of organic matter in
the soil. Generally the 0-15cm soil layer had significntly more organic matter than the 15-30cm soil
layer.
Organic matter
4.215.848
4.748 4.748
02468
0-3yrs 10-20yrs 40-50yrs >55yrs
Treatment
%Forest land use

14
4.1.1.2 Phosphorous
There was a very highly significant effect of treatment (P<0.001) on the quantities of Phosphorous
in the soil. Maximum was in treatment 10-20 years (12.09 mg/kg) and minimum was in treatment 0-
3 years (4.19 mg/kg). Treatment 10-20 years had the highest amount of phosphorus.
Figure 3. Shows the average phosphorous in the forest land use
phosphorous
0
5
10
15
0-3yrs 10-20yrs 40-50yrs >55yrs
treatment
mg/k
g
forest
Figure 4: Shows the available phosphorous in a forest land use with depth
There was a very high significant effect of depth (P<0.001) on the quantities of Phosphorous in the
soil. Generally 0-15cm soil layer had significntly more phosphorus than the 15-30cm soil layer.
4.1.1.3 Nitrogen
There was no significant effect of treatment (P<0.168) on the quantities of nitrogen in the soil. The
Maximum was in treatment 10-20 years (0.2550%) and minimum was in treatment 0-3 years
(0.1983%).
Phosphorous
0
5
10
15
20
0-3yrs 10-20yrs 40-50yrs >55yrs
treatment
mg/k
g 0-15cm
15-30cm

15
Nitrogen
0
0.1
0.2
0.3
0.4
0-3yrs 10-20yrs 40-50yrs >55yrs
treatment
%
0-15cm
15-30cm
Figure 5. Shows the average available Nitrogen in the forest land use
Nitrogen
0
0.1
0.2
0.3
0-3yrs 10-20yrs 40-50yrs >55yrs
treatment
% forest
Figure 6. Shows the average nitrogen in the forest land use with the depth
There was a very high significant effect of soil depth (P<0.001) on the quantities of nitrogen in the
soil. Generally 0-15cm soil layer had significntly more nitrogen than the 15-30cm soil layer.
4.1.1.3 Soil pH
There was a very highly significant effect of treatment (P<0.001) on soil pH values. The 0-3 year
treatment was the most acidic while the 10-20 year was the least acidic.
Figure 7. Show the average soil pH for the forest land use
soil pH
0
2
4
6
8
0-3yrs 10-20yrs 40-50yrs >55yrs
treatment
ph v
alu
es
forest

16
There was a significant effect of depth (P<0.005) on soil pH values. This was attributed to the
decreasing organic matter gradient with depth.
Figure 8. Show the average soil pH for the forest land use
Soil pH
0
2
4
6
8
0-3yrs 10-20yrs 40-50yrs >55yrs
treatment
pH
valu
es
0-15cm
15-30cm
4.1.2 Biological Properties
4.1.2.1 Macro fauna – Monolith method
The trend in macro-fauna population decreased with the forest age. The macro-fauna was highest
in the 0-3 years and lowest in the 10-20 years in both 0-15 cm and 15-30 cm depth.
Figure 9. Shows the macro fauna of the forest land use with depth in numbers
333
16.01
302.6 302.6
877.99
20.01
413.8 413.8
0
200
400
600
800
1000
0-3yrs 10-20yrs 40-50yrs >55yrs
0-15cm
15-30cm

17
4.1.3 Physical soil Properties
4.1.3.1 Bulky density
Figure 9. Shows the average bulky density of the forest land use
Bulk density
0
0.5
1
1.5
0-3yrs 10-20yrs 40-50yrs >55yrs
treatment
g/c
m3
forest
There was a very significant effect of treatment (P<0.023) on soil bulk density There was an
observer positive trend of bulk density with forest age (minimum 0-3 up to >55 years) treatment.
Statistically, there was no significant effect of depth (P >0.203) bulk density.
Figure 10. Shows the average bulky density of the forest land use with depth
Bulky density
0
0.5
1
1.5
0-3yrs 10-
20yrs
40-
50yrs
>55yrs
treatment
g/c
m3 0-15cm
15-30cm
The 15-30 cm soil layer consistently had a higher bulk density; with a lower conductivity which
made the 0-15 cm layer more conductive. As bulky density increase soil strength increased, pore
space decreased and soils became more compact.

18
4.1.3.2 Hydraulic conductivity
Figure 11. Shows the average bulky density of the forest land use with depth
Ksat
0
0.5
1
1.5
0-3yrs 10-20yrs 40-50yrs >55yrs
treatment
cm
/hr
forest
Statistically, there was no significant effect of treatment (P >0.22) on hydraulic conductivity.
Hydraulic conductivity showed a decrease with increase of forest age. The maximum was in the 0-
3 years treatment and minimum was in the >55 year treatment. Statistically, there was no
significant effect of depth (P >0.090) on hydraulic conductivity. Generally, the 15-30 cm layer had
lower hydraulic conductivity.
Figure 12 . Shows the average bulky density of the forest land use with depth
Ksat
02000400060008000
0-3yrs 10-
20yrs
40-
50yrs
>55yrs
treatment
cm
/hr
0-15cm
15-30cm
4.1.3.3 Soil Colour
0-3 years
The 0-15 cm in Rep 1, Rep 2 and Rep 3 had very dark brown and black color soils. The 15-30 cm
in Rep 1 and Rep 2 had reddish brown due to the moderate amounts of iron oxides in the soil and
Rep 3 had dark brown colour.

19
Table 1. Shows the soil colour of 0-3 years for forest land use
Treatment Sample Ref Depth colour
0 - 3 years Rep. 1 0 - 15 Very dark brown
15 - 30 Reddish brown
Rep. 2 0 -15 Very dark brown
15 - 30 Reddish brown
Rep. 3 0 -15 Black
15 - 30 Dark brown
10-20 years
Table 2. Shows the soil color of 10-20 years for forest land use
Treatment Sample Ref Depth colour
10 - 20 years Rep. 1 0 - 15 Dark brown
15 - 30 Dark reddish brown
Rep. 2 0 -15 Dark brown
15 - 30 Dark reddish brown
Rep. 3 0 -15 Dark brown
15 - 30 Dark reddish brown
The 0-15 cm depth had dark brown soils in all the sample replications and the 15-30 cm also had
dark reddish brown soils.
40-50 years
The 40-50 years with the depth of 0-15 cm in Rep 1 had black soil colour. The very dark brown
colours were in Rep.2 and Rep 3 in all replications of 0-15 cm layer. The 15-30 cm layer had a very
dark brown colour in all the three sample replications.
Table 3. Shows the soil colour of 40-50 years
Treatment Sample Ref Depth colour
40 - 50 years Rep. 1 0 - 15 Black
15 - 30 Very dark brown
Rep. 2 0 -15 Very dark brown
15 - 30 Very dark brown
Rep. 3 0 -15 Very dark brown
15 - 30 Dark brown

20
>55 years
The 0-15 cm depth in all the three sample replications had very dark brown soil color. The 15-30
cm depth Rep.1 and Rep.2 had dark reddish brown soil colour while the Rep.3 had very dark
brown color.
Table 4. Shows the colour of 40-50 years for forest land use
Treatment Sample Ref Depth colour
Intact (>55 years) Rep. 1 0 - 15 Very dark brown
15 - 30 Dark reddish brown
Rep. 2 0 -15 Very dark brown
15 - 30 Dark reddish brown
Rep. 3 0 -15 Very dark brown
15 - 30 Very dark brown
4.1.3.4 Soil Texture
The 0-3 years and >55 years had coarse textured soils which were sandy loam. The 10-20 years
had fine textured soils which were sandy clay loam. These could be organic matter which
increased permeability by increasing the stability of soil aggregates.
4.2 THE AGRICULTURAL LAND USE ON SOIL PROPERTIES
4.2.1 Chemical Properties
4.2.1.1 Organic Matter
Figure 13: Shows the average organic matter in the agricultural land use
There was a very highly significant effect of treatment (P<0.001) on the quantities of organic matter
in the soil. The highest being the banana treatment and the lowest was sugar treatment.
Organic matter
4.2
4.4
4.6
4.8
5
Sugar_mech Banana sugar
treatment
% agric. Land use

21
Figure 14: Shows the organic matter in the agricultural land use with depth
There was a very highly significant effect of depth (P<0.001) on the quantities of organic matter in
the soil. Generally 0-15cm soil layer had significantly more organic matter especially the banana
treatment than the 15-30cm soil layer of sugar mechanised which had the lowest.
4.2.1.2 Phosphorous
There was a very highly significant effect of treatment (P<0.001) on the quantities of Phosphorous
in the soil. Maximum was in sugar mechanised treatment (4.49 mg/kg) and minimum was in sugar
treatment (3.22 mg/kg).
Figure 15. Shows the average phosphorous in the agricultural land use
Figure 16: Shows the available phosphorous in a agricultural land use with depth
Organic matter
0
2
4
6
Sugar_mech Banana sugar
treatment
%
0-15cm
15-30cm
Phosphorous
0
2
4
6
Sugar_mech Banana sugar
treatment
mg
/kg
Agric. Land use
Phosphorous
0
2
4
6
Sugar_mech Banana sugar
treatment
mg
/kg 0-15cm
15-30cm

22
There was a very high significant effect of depth (P<0.001) on the quantities of Phosphorous in the
soil. Generally 0-15cm soil layer had significntly more phosphorus than the 15-30cm soil layer.
4.2.1.3 Nitrogen
There was no significant effect of treatment (P<0.168) on the quantities of nitrogen in the soil. The
Maximum was in sugar (0.2367%) and minimum was in sugar mechanised (0.2233%). Sugar had
the highest amount of nitrogen in the soil.
Figure 17. Shows the average available Nitrogen in the agricultural land use
Figure 18. Shows the average nitrogen in the agricultural land use with the depth
Nitrogen
0
0.1
0.2
0.3
Sugar_mech Banana sugar
treatment
%
0-15cm
15-30cm
There was a very high significant effect of soil depth (P<0.001) on the quantities of nitrogen in the
soil. Generally 0-15cm soil layer had significntly more nitrogen than the 15-30cm soil layer.
4.2.1.4 Soil pH
There was a very highly significant effect of treatment (P<0.001) on soil pH values. Generally the
soil had low pH implying that it was acidic. The sugar treatment was the most acidic while the
sugar mechanised was the least acidic.
Nitrogen
0.21
0.22
0.23
0.24
Sugar_mech Banana sugar
treatment
% Agric. Land use

23
Soil pH
4.5
5
5.5
Sugar_mech Banana sugar
treatment
va
lue
s
Agric. Land use
Figure 19. Shows the average soil pH for the agricultural land use
There was significant effect of depth (P<0.005) on soil pH values. This was attributed to the
decreasing organic matter gradient with depth. The sugar mechanised had the highest pH and
lowest was the sugar manual.
Figure 20. Shows the average soil pH for the agricultural land use
4.2.2 Biological Properties
4.2.2.1 Macro fauna – Monolith method
Figure 21. Shows the macro fauna for the agricultural land use
Soil Ph
44.5
55.5
6
Sugar_mech Banana sugar
treatment
va
lue
s 0-15cm
15-30cm
Macro-fauna
101.01 144.01
918.98
223441 507
0
500
1000
Sugar_mech Banana sugar
treatment
co
un
t
0-15cm
15-30cm

24
The macro-fauna abundance was highest in the sugar manual treatment with the depth of 0-15 cm
and lowest in the sugar mechanized. For the depth of 15-30 cm, sugar manual still had the highest
macro-fauna abundance and lowest in the sugar mechanized.
4.2.3 Physical soil Properties
4.2.3.1 Bulky density
Figure 20. Shows the average bulky density of the agricultural land use
There was a very significant effect of treatment (P<0.023) on soil bulk density. There was a positive
trend of bulk density with agricultural land use, sugar mechanised being the lowest and sugar
manual the highest in bulky density. Statistically, there was no significant effect of depth (P >0.203)
on the bulk density because it was affected by both the nature of solids and the volume of pores.
Figure 21. Shows the average bulky density of the agricultural land use with depth
The 15-30 cm soil layer consistently had a higher bulk density with a lower conductivity. The
process builds upwards towards the soil surface hence making the 0-15 cm layer more conductive.
Bulky density
0.850.9
0.951
1.051.1
Sugar_mech Banana sugar
treatment
g/c
m3
Agric. Land use
Bulky density
0
0.5
1
1.5
Sugar_mech Banana sugar
treatment
g/c
m3
0-15cm
15-30cm
25
4.2.3.2 Hydraulic conductivity
Figure 22. Shows the average hydraulic conductivity of the agricultural land use
There was no significant effect of treatment (P>0.22) on hydraulic conductivity. Hydraulic
conductivity showed a decrease with the agricultural land uses. The maximum was in the sugar
mechanised and minimum was in the sugarcane treatment. There was no significant effect of
depth (P >0.090) on hydraulic conductivity. The 15-30 cm layer had big pore spaces with sugar
mechanised had the highest rendered conductivity higher followed by sugar manual.
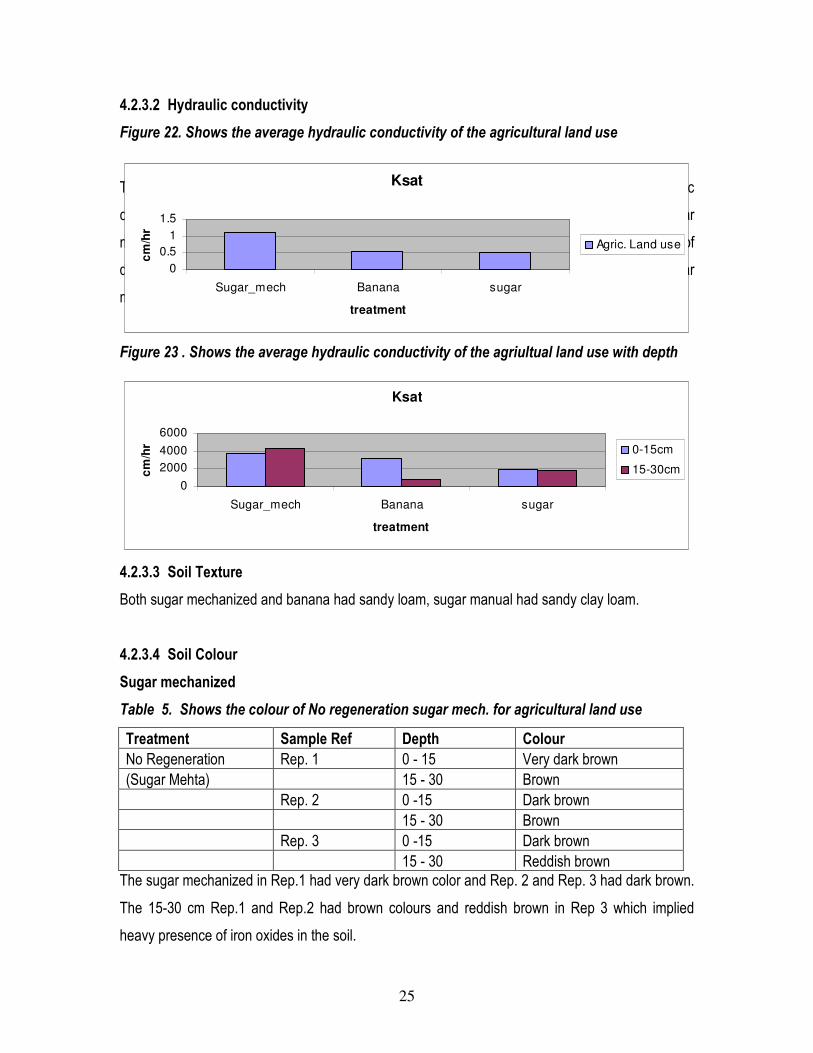
Figure 23 . Shows the average hydraulic conductivity of the agriultual land use with depth
4.2.3.3 Soil Texture
Both sugar mechanized and banana had sandy loam, sugar manual had sandy clay loam.
4.2.3.4 Soil Colour
Sugar mechanized
Table 5. Shows the colour of No regeneration sugar mech. for agricultural land use
Treatment Sample Ref Depth Colour
No Regeneration Rep. 1 0 - 15 Very dark brown
(Sugar Mehta) 15 - 30 Brown
Rep. 2 0 -15 Dark brown
15 - 30 Brown
Rep. 3 0 -15 Dark brown
15 - 30 Reddish brown
The sugar mechanized in Rep.1 had very dark brown color and Rep. 2 and Rep. 3 had dark brown.
The 15-30 cm Rep.1 and Rep.2 had brown colours and reddish brown in Rep 3 which implied
heavy presence of iron oxides in the soil.
Ksat
0
0.5
1
1.5
Sugar_mech Banana sugar
treatment
cm
/hr
Agric. Land use
Ksat
0
2000
4000
6000
Sugar_mech Banana sugar
treatment
cm
/hr 0-15cm
15-30cm

26
Banana
Table 6. Shows the soil colour of Banana
Treatment Sample Ref Depth colour
Banana Rep. 1 0 - 15 Dark brown
15 - 30 Dark reddish brown
Rep. 2 0 -15 Very dark brown
15 - 30 Dark reddish brown
Rep. 3 0 -15 Very dark brown
15 - 30 Dark reddish brown
In banana Rep 1 had dark brown colour and Rep.2 and Rep.3 had very dark brown colours. With
the depth of 15-30 cm all the three replications had dark reddish brown colours.
Sugar manual
Table 7. Shows the colour of Sugar for agricultural land use
Treatment Sample Ref Depth colour
Sugar Rep. 1 0 - 15 Dark brown
15 - 30 Dark reddish brown
Rep. 2 0 -15 Dark brown
15 - 30 Dark reddish brown
Rep. 3 0 -15 Dark brown
15 - 30 Dark reddish brown
The sugar treatment with the depth of 0-15 cm had dark brown soil color. The 15-30 cm had dark
reddish brown in all the 3 replications.

27
5.0 DISCUSSIONS
THE FOREST LAND USE ON SOIL PROPERTIES
The high presence of organic matter in the 10-20 years was attributed mainly to the presence of
abundant vegetation litter available from the forest and to a lesser extent dead fauna the lowest the
0-3 years treatment due spatial and limited vegetation cover. Organic matter varied with depth in
that the upper layers of the soil were often high in an organic fraction called humus. Humus was
relatively resistant to further breakdown and decomposition in the 0-15cm layer and then it moved
downwards to the 15-30cm layer by means like leaches and macro fauna activity. Lal, R. [1981]
described that the most dramastic loss of organic matter, soil humic substances, biological activity
and soil physical quality is undoubtedly associated with tropical deforestation and subsequent soil
management techniques.
The high phosphorous levels were due to charcoal burning in the 10-20 years during
encroachment and evidence of kilns was seen to that effect. Also the amount of phosphorus
increased with the age of the forest up to about 30 years and then level off as the forest
approached climax (stable intact forest). This was attributed to the fact that litter on the forest floor
from which the phosphorus comes from, also increased with the forest age. Phosphorus was high
in the 0-15cm layer because it was released by decomposition of organic matter on and then it
moved downwards to the 15-30cm layer by means like leaches and macro fauna activity.
Phosphorus was low in the 0-3years due to limited litter on the soil surface which Nayle [2002]
stated that organic matter has liitle capacity to strongly fix phosphate ions. Soils high in organic
matter especially active fractions of organic matter exhibit relatively low levels of phosphorous
fixation.
Treatment 10-20 years had the highest amount of nitrogen because the forest land use type
contained pools of nitrogen in the plant biomass and when they died they released these into the
soil from the decomposing organic matter and the lowest the 0-3 years treatment due to limited
vegetation cover. The amount of nitrogen increased with the age of the forest and stabilized at 40-
50 years and above (intact forest). This was attributed to litter on the forest floor from which the
nitrogen comes from, also increased with forest age. Nitrogen was released in the 0-15cm layer

28
due to the decomposition of organic matter and then it moved downward to the 15-30cm layer by
means like leaches and macro fauna activity. Boyd [1992] asserts that since the decomposition of
organic matter is caused by living organisms, nitrogen availability in soil is influenced by
temperature, moisture and aeration. Thus, the supply is extremely variable as it could the case with
the 10-29 treatment.
The soil pH was attributed to the presence of organic matter in the soil. Generally the soil had low
pH implying that it was acidic and decreasing organic matter gradient with depth. This could also
be as Miller [1995] reports that ammonia and oxides of nitrogen and sulphur are also deposited dry
on vegetation and soils are washed into the soil by rain where they produce acidity. The depth of
15-30 cm the difference was not significant in that a high pH, nutrients became insoluble and plants
could not readily extract them apart from the 10-20 years treatment.
Macro-fauna decreased with the forest age and this was attributed to the organic matter availability
in the soils, good aeration, structure, the differently adaptability of the different macro-fauna
species to the treatments, macro-fauna was highest in the 0-3 years treatment. In the 10-20 years
treatment, there was charcoal burning in that locality, which limited the survival of many macro-
fauna. Different macro faunal groups might had survival strategies to fit with the varying soil
compactness thereby creating an increase in biomass albeit slightly and a significant decrease in
abundance and species diversity therefore soil compactness seem to impact positively on the
macro faunal biomass but negatively on abundance and diversity.
The positive trend of bulk density was attributed to the gradual pore space clogging by very fine
suspension carried by rain water (run off) and compaction due to lack of disturbance as the forest
established itself. The fine textured soils such as silt loams, clay and clay loams generally have
lower bulk densities than do sandy soils. The fine textured soils tend to be organised in porous
granules, especially if adequate organic matter is present. Also the gradual elimination of herbs
and shrubs from the forest floor whose roots were contributing to soil porosity (as part of forest
succession). The 15-30 cm soil layer consistently had a higher bulk density than 0-15 cm layer
which was more conductive. The surface horizon of most forested soils has rather low bulk
densities. Tree growth and forest ecosystems functions are particularly sensitive to increases in

29
bulky density. Conventional timber harvest generally disturbs and compacts 20 to 40% of the forest
floor.
Hydraulic conductivity showed a decrease with increase of forest age and this was because the
recently opened forest (0-3, 10-20 year) soils were more porous due to human activities like
digging, charcoal burning and so on. Also the recently opened forest (0-3, 10-20 year) soils had
spaces left behind by rotting roots of dead trees. To some extent, burrows made by macro fauna
also contributed to the high conductivity of soils (0-3 years). Conductivity decreased with forest age
because of soil compaction due to lack of disturbance and pore space clogging by very fine soil
particles as rain water seeped through it. The 15-30 cm layer had lower conductivity because the
pore space clogging and compaction begins from this layer where the pores are smallest. The
process builds upwards towards the soil surface hence making the 0-15 cm layer more conductive.
Hillel [1980] states that hydraulic conductivity is obviously affected by structure as well as by
texture, being greater if the soil is highly porous, fractured or aggregated than if it is highly
compacted and dense.
The 0-3 years 0-15 cm in Rep 1, Rep 2 and Rep 3 had very dark brown and black color soils which
implied that there was organic matter content in the soil. The 15-30 cm in Rep 1 and Rep 2 had
reddish brown colour due to the moderate amounts of iron in the soil and Rep 3 had dark brown
with organic matter. This was due the presence of litter and dead macro-fauna which contributed to
its organic matter content. This could also be as stated by Nayle [2002] that water content of a soil
also influences the level of soil air, and more specifically soil oxygen. Oxygen in turn determines
the oxidation state of several elements and especially of iron in its oxide minerals.
The 0-50 years with the depth of 0-15 cm in Rep 1 had black soil colour. The very dark brown
colours in Rep.2 and Rep 3 showed a high presence of organic matter due the leaf fall and dead
micro organisms in all replications of 0-15 cm. For the 55 years and above in 0-15 cm depth in all
the three sample replications had very dark brown soil color and 15-30 cm depth Rep.1 and Rep.2
had dark reddish brown soil colour attributed to the presence of iron oxides in the soil while the
Rep.3 had very dark brown color.

30
The 0-3 years and >55 years had coarse textured soils which were sandy loam. The 10-20 years
had fine textured soils which were sandy clay loam. These could be the organic matter which
increased permeability by increasing the stability of soil aggregates.
The soil structure of 0-3 years and >55 years had coarse textured soils which were sandy loam.
These held low amounts of water and nutrients which necessitated irrigating and fertilizing
frequently, compacted to form a hardpan and also allowed water to infiltrate but less runoff. The
10-20 years had fine textured soils which were sandy clay loam. These also held large amounts of
nutrients and water which also held things too tightly. This could be organic matter which increased
permeability by increasing the stability of soil aggregates. The organic matter decomposed to form
glues and gums that helped cement or stick soil particles together.
THE AGRICULTURAL LAND USE ON SOIL PROPERTIES
Organic matter was high in the banana treatment and the lowest in sugar. The depth of 0-15 cm
sugar mechanised had the highest organic matter and lowest banana. With the 15-30cm depth
banana had the highest organic matter and lowest sugar mechanised. This was attributed to the
presence of vegetation litter in the surface layers. Pushparajah [1990] asserted that the effects of
organic inputs on the soil physical properties depend on the residence time or quality and
placement of the material, thus organic inputs that decompose slowly will have a greater and more
durable effect on soil physical properties than high quality organic resides.
There was a positive trend of bulk density with agricultural land use, sugar mechanised being the
lowest and sugar manual the highest in bulky density. Boyd [1992] states that deeper in the soil
profile, bulk densities are generally higher, probably as a result of lower organic matter contents,
less aggregation, fewer roots and other soil dwelling organisms and compaction caused by weight
of the over laying layers.
The sugar mechanised had the highest amount of phosphorus because of the fertilizer application
and high organic matter due to the litter on the ground. The trend was that the amount of
phosphorus decreased as the litter decreases due to frequent weeding and burning litter which
hinders the presence of organic matter in the soils hence availability of phosphorous. Phosphorus
was released by decomposition of organic matter on and in the 0-15cm layer and then it moves

31
downwards to the 15-30cm layer by means like leaches and macro fauna activity. This expalins
why phosphoruos was high in the 0-15cm depth. Ronnell [1994] stated that clay soils often have
large reserves of non exchangeable k+ in minerals which supply some overall of the crop needs
from year to year. However, there are very few soils which have large reserves of phosphorous in
soil minerals
Sugar manual had the highest amount of nitrogen which was released into the soil from the
decomposing organic matter. The trend was that the amount of nitrogen increased with the kind of
agricultural land use practices. The reasons for high nitrogen in the 0-15cm were that nitorgen
was released by decomposition of organic matter on and in the 0-15cm layer and then it moved
downward to the 15-30cm layer by means for example by leaches. Ronnell [1994] attributes to
nitrate leaching in heavy textured soils is more complex, because water moves through large
cracks and channels leaving nitrate behind in the soil aggregates where little water movement
occurs.
The high soil pH was attributed to the presence of organic matter in the soil. This could due to
clearing of natural vegetation which causes accelerated organic matter decomposition, nitrate
leaching and acidity production. This could also explain why the sugar treatment was the most
acidic while the sugar mechanised was the least acidic.
For the depth of 15-30 cm sugar manual still had the highest macro-fauna abundance and lowest
in the sugar mechanized. This was attributed to the quality of the organic input to the soil and the
nature of land use which could have influenced soil compactness and consequently faunal
abundance. Hillel [1980] stated that compaction impedes the movement of water and air through
the soil by reducing the number of large pores. The resulting restriction of aeration and drainage
thus exposes roots to several simultaneous stresses.
Sugar manual had the highest bulky density which was attributed to the gradual pore space
clogging by very fine suspension carried by rain water (run off). The 15-30cm layer had a higher
bulk density with a lower conductivity because the pore space clogging and compaction begins
from this layer where the pores are smallest. The process builds upwards towards the soil surface
hence making the 0-15 cm layer more conductive. Also the improper land clearing or tillage

32
reduces the mean diameter of soil aggregates resulting in increases in bulky density and
decreases in aeration, hydraulic conductivity and increased erodibility.
The hydraulic conductivity was high in the sugar mechanised and minimum was in the sugarcane
treatment. This was because the sugar mechanisation had soils which were more porous due to
human activities like digging. Hillel [1980] reported that in a saturated soil of stable structure, as
well as in a rigid porous medium such as sandstone, for instance, the hydraulic conductivity is
characteristically constant. It is order of magnitude is about 10-2-10-3 cm/sec in a sandy soil and 10-
4-10-7 cm/sec in a clayey soil.
In banana Rep 1 had dark brown colour and Rep.2 and Rep.3 had very dark brown colours which
showed high presence of organic matter. With the depth of 15-30 cm all the three replications had
dark reddish brown colours implying high heavy presence of iron oxides in the soil. Nayle [2002]
shows how organic matter to be dark brown to black in colour. Organic coatings tend to darken and
mask the brighter colours from compounds such as iron oxides. The red or brown colours are of
well drained uplands and have the presence of oxidized iron oxides.
6.0 CONCLUSION
The land uses affected the soil properties differently (chemically, physically and biologically). The
forest land use greatly influenced the Soil pH, Organic matter due to the leaf fall and macro-fauna.
The macro-fauna abundance and hydraulic conductivity had been also influenced by the
agricultural land use activities such as burning little and monoculture practices. The land pressure
by the population should be eased to manage the land sustainably for proper determination of soil
properties in and around Mabira Central Forest Reserve.

33
ACKNOWLEDGMENT
First and foremost, I would like to thank the Almighty God for the wisdom, guidance, courage and
decisions made whenever I sat down to concentrate on this research report without whom I would
not have completed this report.
I wish to extend my sincere thanks to my parents Mr. and Mrs. Wabwire Geoffrey whose roles have
contributed a lot to my life without their prayers, love and protection; I would not be where I am
now.
I am indeed grateful with the group members who were Catherine, Amos and Edward whose
positive critics and guidance culminated in writing up what constitutes the contents of this report.
I wish to extend my heartfelt gratitude to the MUIENR staff and National Forestry Authority staff
especially Mr. Tonga for their willingness to participate when we were conducting research in
Mabira Central Forest Reserve I am indeed grateful.
A lot of thanks go to my resource personnel DR. MAJALIWA MAJOLOLO for the expert guidance
he rendered to ensure that my report was successfully completed.
MAY GOD BLESS YOU ALL

34
REFERENCES
Pushparajah, E. [1989] Soil Management and Small holder development in the Pacific Islands.
International board for soil research and management – Thailand.
Hillel David [1980] Fundamentals of Soil Physics, Harcourt Brace Jovanovich Publishers, New
York. P 179.
Boyd, G. Ellis and Ray L. Cook [1992], Soil Management, Krieger Publishing company Malabar,
Florida. P 61-191
Turner II, B.L., W.C. Clark, R.W. Kates, J.F. Richards, J.T. Mathews, and W.B. Meyer, eds. 1990.
The Earth as Transformed by Human Action: Global and Regional Changes in the Biosphere Over
the Past 300 Years. Cambridge University Press, Cambridge.
National Environmental Management Authority (2001), State of Environment Report.
Ronell. L. David [1994] Soil Science, Published by Pearson Education [pte] Ltd, England, P 153-
160].
Lal, R. [1981] Deforestation of Tropical Rainforest and Hydrological problems, Published by John
Wiley and Sons, p.131-140 Chichester UK.
Pushparajah, E. and Latham. M. [1990] Organic matter management and tillage in Humid and sub
humid Africa. P 176. proceedings of the third regional workshop of the AFRICALAND programme
held at Antananarivo, Madagascar.
Nayle. C. Brady and Ray R. Well [2002] The Nature and Properties of Soils. Thirteenth edition,
Pearson Education ltd. USA.
Miller. W. Raymond and Roy. L. Donahue [1995] Soils in our Environment, Published
by Prentice Hall inc. New Jersery.