Soil ecosystem services and land use in the rapidly changing Orinoco River Basin of Colombia
12
Agriculture, Ecosystems and Environment 185 (2014) 106–117 Contents lists available at ScienceDirect Agriculture, Ecosystems and Environment jo ur nal home p age: www.elsevier.com/locate/agee Soil ecosystem services and land use in the rapidly changing Orinoco River Basin of Colombia Patrick Lavelle a,b,∗ , Nubia Rodríguez c , Orlando Arguello c , Jaime Bernal c , Cesar Botero a , Paula Chaparro a , Yolanda Gómez c , Albert Gutiérrez c , María del Pilar Hurtado a , Sandra Loaiza a , Sandra Xiomara Pullido c , Edgar Rodríguez a , Catalina Sanabria a , Elena Velásquez d , Steven J. Fonte a,1 a Institut de Recherche pour le Développement, BIOEMCO, 32 rue H. Varagnat, 93143 BONDY Cedex, France b Centro Internacional de Agricultura Tropical, AA 6713 Cali, Colombia c Corporación Colombiana de Investigacion Agropecuaria, Centro de La Libertad, Villavicencio, Meta, Colombia d Universidad Nacional de Colombia, Palmira, Valle, Colombia a r t i c l e i n f o Article history: Received 12 March 2013 Received in revised form 16 December 2013 Accepted 20 December 2013 Keywords: Agricultural intensification Ecosystem function Llanos Orientales Soil macro fauna Soil quality a b s t r a c t In the Orinoco River Basin of eastern Colombia large scale and rapid conversion of natural savannas into commercial agriculture exists as a critical threat for the ecological integrity of this fragile region. The highly acidic and compacted soils inherent to this region require thorough physical and chemical conditioning in order for intensive cropping systems to be established. Assessing the impact of this dra- matic soil perturbation on biodiversity, ecosystem services and other elements of the natural capital is an urgent task for designing sustainable management options in the region. To address this need, we evaluated soil macro invertebrate communities and soil-based ecosystem services (climate regulation, hydrologic functions, soil stability provided by macro aggregation and nutrient provision potential) in four major production systems: improved pastures, annual crops (rice, corn and soy bean), oil palm and rubber plantations, and compared them to the original savanna. Fifteen plots of each system were sam- pled along a 200 km natural gradient of soil and climatic conditions. In each plot, we assessed climate regulation by measuring green house gas emissions (N 2 O, CH 4 and CO 2 ) and C storage in aboveground plant biomass and soil (0–20 cm). Soil biodiversity (macro invertebrate communities) and three other soil-based ecosystem services, were assessed using sets of 12–20 relevant variables associated with each service and synthesized via multivariate analyses into a single indicator for each ecosystem function, adjusted in a range of 0.1–1.0. Savannas yielded intermediate values for most indicators, while each production system appeared to improve at least one ecosystem service. For example, nutrient provision (chemical fertility) was highest in annual cropping systems (0.78 ± 0.03) due to relatively high con- centrations of Ca, Mg, N, K, and available P and low Al saturation. Hydrological functions and climate regulation (C storage and GHG emissions) were generally improved by perennial crops (oil palm and rubber), while indicators for macro invertebrate biodiversity and activity (0.73 ± 0.05) and soil macro aggregation (0.76 ± 0.02) were highest within improved pastures. High variability within each system indicates the potential to make improvements in fields with lowest indicator values, while differences among systems suggest the potential to mitigate negative impacts by combining plots with contrasted functions in a strategically designed landscape mosaic. © 2014 Published by Elsevier B.V. ∗ Corresponding author at: Institut de Recherche pour le D´ eveloppement, BIOEMCO, 32 rue H. Varagnat, 93143 BONDY Cedex, France. E-mail address: [email protected] (P. Lavelle). 1 Current address: University of California, Dept. of Plant Sciences, Davis, CA 95616, United States. 1. Introduction The need to increase agricultural production for food and energy resources is driving agricultural frontiers into the last remaining arable lands (Hubert et al., 2010). In Colombia, the Eastern Plains (Llanos Orientales) are now being rapidly converted from semi- natural savanna, dedicated largely to extensive cattle ranching and low-input traditional agriculture, to highly intensified commercial production of food (rice, soy bean, maize), biofuels (sugar cane and oil palm) and rubber. It is estimated that over 50,000 ha has been 0167-8809/$ – see front matter © 2014 Published by Elsevier B.V. http://dx.doi.org/10.1016/j.agee.2013.12.020
-
Upload
independent -
Category
Documents
-
view
2 -
download
0
Transcript of Soil ecosystem services and land use in the rapidly changing Orinoco River Basin of Colombia

SR
PPSEa
b
c
d
a
ARR1A
KAELSS
B
9
0h
Agriculture, Ecosystems and Environment 185 (2014) 106– 117
Contents lists available at ScienceDirect
Agriculture, Ecosystems and Environment
jo ur nal home p age: www.elsev ier .com/ locate /agee
oil ecosystem services and land use in the rapidly changing Orinocoiver Basin of Colombia
atrick Lavellea,b,∗, Nubia Rodríguezc, Orlando Arguelloc, Jaime Bernalc, Cesar Boteroa,aula Chaparroa, Yolanda Gómezc, Albert Gutiérrezc, María del Pilar Hurtadoa,andra Loaizaa, Sandra Xiomara Pullidoc, Edgar Rodrígueza, Catalina Sanabriaa,lena Velásquezd, Steven J. Fontea,1
Institut de Recherche pour le Développement, BIOEMCO, 32 rue H. Varagnat, 93143 BONDY Cedex, FranceCentro Internacional de Agricultura Tropical, AA 6713 Cali, ColombiaCorporación Colombiana de Investigacion Agropecuaria, Centro de La Libertad, Villavicencio, Meta, ColombiaUniversidad Nacional de Colombia, Palmira, Valle, Colombia
r t i c l e i n f o
rticle history:eceived 12 March 2013eceived in revised form6 December 2013ccepted 20 December 2013
eywords:gricultural intensificationcosystem functionlanos Orientalesoil macro faunaoil quality
a b s t r a c t
In the Orinoco River Basin of eastern Colombia large scale and rapid conversion of natural savannasinto commercial agriculture exists as a critical threat for the ecological integrity of this fragile region.The highly acidic and compacted soils inherent to this region require thorough physical and chemicalconditioning in order for intensive cropping systems to be established. Assessing the impact of this dra-matic soil perturbation on biodiversity, ecosystem services and other elements of the natural capital isan urgent task for designing sustainable management options in the region. To address this need, weevaluated soil macro invertebrate communities and soil-based ecosystem services (climate regulation,hydrologic functions, soil stability provided by macro aggregation and nutrient provision potential) infour major production systems: improved pastures, annual crops (rice, corn and soy bean), oil palm andrubber plantations, and compared them to the original savanna. Fifteen plots of each system were sam-pled along a 200 km natural gradient of soil and climatic conditions. In each plot, we assessed climateregulation by measuring green house gas emissions (N2O, CH4 and CO2) and C storage in abovegroundplant biomass and soil (0–20 cm). Soil biodiversity (macro invertebrate communities) and three othersoil-based ecosystem services, were assessed using sets of 12–20 relevant variables associated with eachservice and synthesized via multivariate analyses into a single indicator for each ecosystem function,adjusted in a range of 0.1–1.0. Savannas yielded intermediate values for most indicators, while eachproduction system appeared to improve at least one ecosystem service. For example, nutrient provision(chemical fertility) was highest in annual cropping systems (0.78 ± 0.03) due to relatively high con-centrations of Ca, Mg, N, K, and available P and low Al saturation. Hydrological functions and climate
regulation (C storage and GHG emissions) were generally improved by perennial crops (oil palm andrubber), while indicators for macro invertebrate biodiversity and activity (0.73 ± 0.05) and soil macroaggregation (0.76 ± 0.02) were highest within improved pastures. High variability within each systemindicates the potential to make improvements in fields with lowest indicator values, while differencesamong systems suggest the potential to mitigate negative impacts by combining plots with contrastedy des
functions in a strategicall∗ Corresponding author at: Institut de Recherche pour le Developpement,IOEMCO, 32 rue H. Varagnat, 93143 BONDY Cedex, France.
E-mail address: [email protected] (P. Lavelle).1 Current address: University of California, Dept. of Plant Sciences, Davis, CA
5616, United States.
167-8809/$ – see front matter © 2014 Published by Elsevier B.V.ttp://dx.doi.org/10.1016/j.agee.2013.12.020
igned landscape mosaic.© 2014 Published by Elsevier B.V.
1. Introduction
The need to increase agricultural production for food and energyresources is driving agricultural frontiers into the last remainingarable lands (Hubert et al., 2010). In Colombia, the Eastern Plains(Llanos Orientales) are now being rapidly converted from semi-
natural savanna, dedicated largely to extensive cattle ranching andlow-input traditional agriculture, to highly intensified commercialproduction of food (rice, soy bean, maize), biofuels (sugar cane andoil palm) and rubber. It is estimated that over 50,000 ha has been
ms an
ccWeR
soCfspecatfctcp
Ci(ouabtwlcotnm1
iaibal2tia
bpstlesti2p(cevi
P. Lavelle et al. / Agriculture, Ecosyste
onverted in the last two decades and recent trends show this agri-ultural expansion to be accelerating (Romero Ruiz et al., 2012).
ith economic development as the main driver of this growth, thenvironmental implications for the Llanos and the entire Orinocoiver Basin are only beginning to be understood.
Representing a key hurdle to the agricultural intensification,oils in the region are inherently acidic (pH currently in the rangef 3–5) and compact (bulk density in the range of 1.4–1.6 g cm−3).onversion to commercially viable agriculture thus requires theormation of an arable soil layer via deep tillage to de-compactoils, along with substantial applications of lime to increase soilH (Amézquita et al., 2004). Following this soil intervention, largexpanses of monoculture (up to several hundred hectares) are typi-ally established, where chemical fertilizers are applied along with
mixture of biological (e.g., Beauveria bassiana spores) and syn-hetic pesticides, according to individual crop requirements. Soilunction and the provision of ecosystem services are thus dramati-ally modified (Decaëns et al., 1994). However, the implications ofhis abrupt management shift are likely to vary depending on theropping system that is implemented and the ecosystem service orroperty being considered (Wall, 2012).
While there currently exist a clear intention on the part of theolombian government to ensure that development of the Llanos
s sustainable in social, economic and environmental dimensionsRippstein et al., 2001), similar dynamics that have played outver the last 20 yr in the Brazilian Cerrado region (Goedert, 1989)rge caution in this process. Development of the Cerrados clearlychieved large gains in terms of productivity and economic yields,ut irreparable errors were also incurred in the process, leadingo extensive degradation of natural capital that should be avoidedherever possible (Jepson, 2005; Guecker et al., 2009). The very
ow initial quality of soils in the Llanos makes them particularly sus-eptible to erosion and biodiversity loss, while the dense networkf waterways and riparian forest traversing the region are likelyo face adverse effects associated with changes in water quality,utrient load, and movement – resulting from large scale imple-entation of intensive production systems (Sanchez and Salinas,
983).While soil and environmental degradation is likely to occur
n many cases, the enhancement of intrinsic soil properties andssociated increases in productivity may also improve soil qual-ty and functioning via the promotion of biological activity andiodiversity in soils (Decaëns et al., 1994), facilitation of below-nd aboveground C sequestration, and improvement of soil hydro-ogical functions due to improved soil structure (Amézquita et al.,004). Despite these potential benefits, a clear understanding ofhe net impacts associated with land use conversion in the Llanoss essential for guiding future development policy and land man-gement decisions.
In order to address this need, we assessed the provision of soil-ased ecosystem services in four prominent and rapidly expandingroduction systems in the Llanos: annual crops (maize, rice andoybean), improved pastures, oil palm and rubber and comparedhese with semi-natural savanna as a reference. Soils provide aarge number of important ecosystem services such as plant nutri-nt provision, water storage and regulation, maintenance of soiltructure, and climate regulation, while conserving a very impor-ant component of agro ecosystem biodiversity (i.e., soil macronvertebrate communities) (Millennium Ecosystem Assessment,005; Wall, 2012). These services can be measured by a set of soilarameters assembled in composite indicators of a specific serviceVelasquez et al., 2007a). We hypothesized that there would be
lear tradeoffs, such that each system would benefit at least onecosystem service relative to the natural savanna, but that the pro-ision of other services would likely decline. We also sought todentify shortcomings of current practices within each productiond Environment 185 (2014) 106– 117 107
system that could be targeted for improvement in the developmentof new management options.
2. Materials and methods
2.1. Site information and study design
The study region, in the Altillanura Plana of Colombia, extendsnortheast from the Meta Department to the Venezuelan borderand is bounded to the north by the Andean Cordillera Oriental. Atroughly 200 m in elevation, climate is characterized by distinct wetand dry seasons, with very little rainfall between December andMarch and average annual temperatures around 26 ◦C. Soils aremainly Oxisols with low fertility and high acidity and Al saturation(Lascano and Estrada, 1989; IGAC, 2004).
The study was conducted along a 200 km transect, runningEast from Puerto Lopez towards Carimagua, paralleling the MetaRiver to the north (Fig. 1). There exists a slight gradient in pre-cipitation between Puerto Lopez (2700 mm yr−1) and Carimagua(2300 mm yr−1) as well as a subtle gradient in soil texture, withsand content higher in Puerto Lopez than in Carimagua; however,with marked local variability. To be consistent with the objective ofthe study of providing data relevant for the whole region of the Altil-lanura, we choose 15 replicates for each system, distributed acrossthe entire region using a stratified approach, so that five fields ofeach treatment were located within each of three areas along theregional transect. Each field, in turn, was characterized by the samecomplete set of parameters, replicated 3 times at 200 m intervalsinside the field, to provide a representative average measurementof soil parameters in the plot with all points located at least 50 mfrom field edges.
Although it was not possible to get clear information onthe age and history of the cultivated plots, some general infor-mation could be collected. Humans have long impacted theoriginal savanna with a clear management intensity gradientfrom Carimagua, where the most preserved savannas with ratherdense tree cover could be found, to Puerto Lopez where all treeshad been eliminated and grazing pressure was high. Improvedpastures were rather heterogeneous, since the oldest ones mayhave been installed some 10–15 yr ago and are degraded withrelatively high densities of weeds and heavily compacted soils.Transitory crops are always recently implemented systems sincecropping is usually maintained for a few cycles, during 2–4 yrbefore perennial tree crops are installed. Rubber and oil palm hadbeen installed 3–10 yr prior to sampling in all cases. While thesesystems are typically installed in fields following annual crops,some rubber plots in Carimagua had been directly converted fromsavanna.
2.2. Soil and ecosystem service assessment
Soil and macro fauna sampling was conducted in June andJuly of 2011, during the rainy season. At each sampling pointwe assessed soil chemical and physical characteristics, soil macroinvertebrate communities, C in plant aboveground biomass andgreenhouse gas (GHG) emissions. Soils were sampled at two depths(0–10 cm and 10–20 cm) from a central monolith at each samplingpoint (25 cm × 25 cm) after soil macro invertebrates were sortedout.
2.3. Biodiversity
Macro invertebrates, considered an indicator of soil biodiversity,were sampled using the TSBF methodology (Anderson and Ingram,1993). Soil was extracted from a central 25 cm × 25 cm × 20 cmmonolith plus two other monoliths 25 cm × 25 cm × 10 cm located

108 P. Lavelle et al. / Agriculture, Ecosystems and Environment 185 (2014) 106– 117
June a
1wtct
sstactS
2
psrurtphgsafms
Fig. 1. Location of the 75 plots sampled between
0 m N and S respectively from the central point. These samplesere hand-sorted in the field and macro fauna separated into 16
axonomic groups, largely separated by order. Each plot was thenharacterized using the sum of macro invertebrates found in thehree monoliths.
Nutrient provision services, or the ability of managementystems to support primary production, were evaluated usingtandard analytical methods of 20 variables associated with soil fer-ility (Anderson and Ingram, 1993), evaluated at both the 0–10 cmnd 10–20 cm depths. These variables included C and N contents,ation exchange capacity (CEC), Al saturation, macro- and micronu-rient concentrations (Ca, K, Mg, P Bray II, Al, B, Fe, Mn, Cu and Zn).oil pH was measured in a 2:1 water solution.
.4. Soil hydrological services
A large set of soil physical properties was combined in a com-osite indicator considered a reliable surrogate for soil hydrologicalervices. These comprise infiltration that avoids erosive surfaceunoff, storage of water at different potentials for subsequent plantse and prevention of inundations in low-lying areas. A set of 12elevant variables were assessed: volumetric and gravimetric mois-ure content, micro (<0.03 �), meso (0.03–3 �) and macro (>3 �)orosity, plant available water retained at tensions between waterolding capacity (−0.1 MPa) and wilting point (−15 MPa), aggre-ate stability, bulk density, resistance to vertical penetration andhear strength resistance. All measurements were taken at 0–10
nd 10–20 cm depths. Samples used for bulk density were removedrom the vertical walls of the central monolith excavated for soilacro fauna sampling, and texture was measured on the same soilample used for chemical assessments.
nd July, 2011, in the Meta Department, Colombia.
Soil stability assessed by aggregate morphology provides anintegrative measure of soil biological activity over the past severalyears and is an important determinant of the physical stabiliza-tion of soil C, rooting potential, infiltration and aeration. Aggregatemorphology was evaluated using a method developed by Velasquezet al. (2007b). Two small blocks 10 cm × 10 cm × 10 cm were takenon each side of the central monolith and carefully placed into plas-tic boxes for transport to CIAT. In the laboratory, these soil blockswere gently separated into their aggregated components and clas-sified as: biogenic, root or physical aggregates (according to theirorigin and shape), non-macro aggregated soil (passing through a5 mm sieve), stones and large organic particles (roots, litter or woodpieces). Elements separated in this way were then air dried andweighed.
Climate regulation, associated with soil processes and above-ground vegetation was assessed through two components, Cstorage in above- and belowground biomass and emissions of GHGusing static field chambers. The closed static chamber techniquemeasures emissions of green house gases (methane, nitrous oxideand carbon dioxide) from the soil plant system. Proposed in 1981 byMosier and Hutchinson, it has been widely used since. Morris et al.(2013) have shown that a set of discrete measurements spread overa several week time period provide data sets that are comparable tocontinuous measurements made by automatic systems. The greatspatial and temporal variability of emissions requires the use of var-ious chambers and the uptake of 4–5 air samples taken at 5–10 minintervals to check for non-linear gas fluxes in time (Rochette and
Eriksen-Hamel, 2008). Differences in plant cover associated withland use affect microbial biomass and activity, soil C and N contentsand physical properties. These patterns, in turn, greatly affect GHGfluxes, especially N2O.
P. Lavelle et al. / Agriculture, Ecosystems and Environment 185 (2014) 106– 117 109
Fig. 2. Projection of chemical variables (a) and the 75 sampling points according to crop systems (b) in the plane formed by Factors 1 and 2 of PCA analysis. C, Ca, K, Mg. . .:respective contents in different soil nutrients; Subscript number indicate soil layer (1 = −10 cm; 2 = 10–20 cm); CEC: cation exchange capacity; ECEC: effective cation exchangecapacity; Al Sat: saturation of the cation exchange capacity by Al cations, measured by two methods (1 and 2). (b) Letters indicate localization of the barycenter for eachs crops,p Monte
eJcncalocNcbCacigu
c5ccwfw2bd
ystem; ellipses show envelope for 75% points of a given category; T: Transitory
lantations. Ellipses show envelop for 75% of points from a given system. (p < 0.01:
Nitrous oxide (N2O), carbon dioxide (CO2) and methane (CH4)missions from the sampling farms were measured monthly fromune to November of 2011 using static chamber technique in fieldonditions (Chu et al., 2007). Three circular PVC collars were perma-ently installed at each sampling point. Prior to each gas sampling,ylindrical PVC chambers (0.03 m2, 10 cm height) were clampednd hermetically sealed to the collars. Air samples were then col-ected from each chamber at 0, 15 and 30 min following placementf the caps, using 20 mL disposable syringes fitted with plastic stop-ocks (Cole Palmer Instruments Co.). Samples were analyzed for2O and CH4 on a gas chromatograph equipped with an electronapture detector (ECD) and Flame ionization detector (FID). Car-on dioxide was determined in an analyzer with infrared detection.hanges in volumetric concentration of each gas was converted to
mass flux by using the ideal gas law, taking into account recordedhanges in temperature within the chamber over the samplingntervals. Fluxes of the three GHGs were then used to calculatelobal warming potential (GWP) and expressed in CO2 equivalentnits (IPCC, 2007).
Aboveground biomass was calculated as the sum of herba-eous and tree components. Herbaceous biomass was cut on0 cm × 50 cm areas at each point, dried and weighed and the Concentration was estimated as 50% of the dry biomass. Carbonontained in woody material of perennial crops and savanna treesas evaluated according to Mac Dicken (1997), using tree circum-
erence and height (measured with a LaserAce hypsometer) along
ith allometric equations developed for the region (Ibrahim et al.,007). Carbon storage in the upper 20 cm of soil was determinedased on the C concentration and soil bulk density measurementescribed above.
IP: Improved Pastures, R: Rubber plantations, NS: Natural Savanna, OP: Oil Palm Carlo permutation test on coordinates of the sampling points).
2.5. Data analysis
Variables associated with nutrient provision services, soil phys-ical and hydrological properties, aggregate morphology and soilbiodiversity were processed separately for each service followingthe methodology adapted from Velasquez et al. (2007a) to createa set of synthetic indicators that would capture the largest part ofvariance expressed by the different variables. An initial principalcomponent analysis (PCA) allows for identification of the vari-ables that best discriminate among the different plots and land usetypes. Variables with significant contribution (>50% of the maxi-mum value) to either of the first two principal component axes areselected and their contribution to PCA axes 1 and 2 multiplied bythe overall variability explained by each PCA axis in order to gener-ate a weight factor for each variable. Values for each variable werethen multiplied by their corresponding weight factor and summedto generate a raw sub-indicator value using the following formula.
Ii1 = F1 × (˛Ia + ˇIb + �Ic· · ·) + F2 × (˛IIa + ˇIIb + �IIc· · ·)where Ii is the value of the indicator of service i (e.g.,. nutrient pro-vision services) at point 1; F1 is the % of variance explained by PCAaxis 1 of the data set I; ˛I, ˇI and � I the respective contributions ofvariables a, b and c to factor I and a, b and c the values of variablesmeasured at the point 1 considered. This value was then scaled toa number ranging from 0.1 to 1.0 by a homothetic transformation,
for comparability across sub-indicators.The general methodology used for climate regulation servicesdid not apply since clear internationally recognized summary vari-ables (GWP and C storage) already exist. We therefore used primary
110 P. Lavelle et al. / Agriculture, Ecosystems and Environment 185 (2014) 106– 117
F ong 5t erence
dbsflap4
lat(aw2i
3
3
nahos
ig. 3. (a–d) Indicators of soil-based ecosystem services and soil quality provided amhe standard error of the mean. Different letters above bars indicate significant diff
ata and generated two indicators, one of C storage in soils andiomass (expressed as Mg C ha−1) and the other involving emis-ions of GHGs (CO2, CH4 and N2O) expressed as a CO2 equivalentux. These values were also scaled to a 0.1–1.0 range of variationnd we used the average of the two sub-indicators to allow com-arison of a general indicator of climate regulation with the other
indicators.All analyses were conducted using the mean of the three samp-
ing points for each field. Multivariate PCA and coinertia analysesnd permutation Monte Carlo test to compare production sys-ems were realized using the R environment and ade-4 libraryThioulouse et al., 1997; R Development Core Team, 2004). Univari-te comparison of the synthetic indicators across cropping systemsith ANOVAs was carried out using JMP 9.0 software (SAS Institute,
010). The assumptions of ANOVA (homoscedasticity and normal-ty) were verified and log transformations were applied as needed.
. Results
.1. Nutrient provision services
Soils were relatively acidic with average values of 4.66 inatural savannas and oil palm plantations to 5.03 in lime-amended
nnual crops (Table 1). Fertilization and amendment of soilsad strong impacts on Al saturation that was reduced to 25.26%n average in annual crops from an initial 79.23% in originalavannas, but still exhibited high values between 50 and 75%production systems in the Altillanura plana region of Colombia. Error bars represents (p < 0.05).
in the other management systems. Soil management generallyincreased C and N contents from 1.97% and 0.10%, respectively,in the original savanna to maximum values of 2.72% and 0.14% inimproved pastures. Soil nutrient contents were largely influencedby fertilization processes with average effective cation exchangecapacity increased from 2.41 g kg−1 in savanna to a maximum of4.78 g kg−1 in annual crops, with particularly large increases in Ca,Mg and available P contents (Table 1).
Since soil chemical fertility varied considerably, the 75 differentplots were clearly separated by PCA on the 40 variables describingtheir respective chemical characteristics in 0–10 cm and 10–20 cmsoil layers (Fig. 2). The first principal components axis clearlyexpressed a gradient of soil fertility: all but seven (Al total contentat 0–10 cm and Al saturations 1 and 2 at 0–10 and 10–20 cm, Feat 0–10 and 10–20 cm depth) soil variables projected on the sameside of the first factorial axis (36.6% explained variance), thus clearlyopposing soils rich in nutrients and with high C and N, to poor soilswith low organic matter and nutrient content (Fig. 2a). The secondaxis (15.5% of explained variance) was associated with soil acidityand opposed soils with higher pH values and Ca and Mg contents,to acid soils with high Al saturation.
Production systems were aligned along axis 1 and separa-tion was significant (29.3% variance observed, p < 0.001; Fig. 2b).
Semi-natural savanna and palm tree plantations were located atone end, annual cropping systems at the opposite extreme, withimproved pastures and rubber plantations in the middle. Axis 2rather exhibited variability inside systems. The indicator formula
P. Lavelle et al. / Agriculture, Ecosystems and Environment 185 (2014) 106– 117 111
F nd pra ion oP
wtpbwotiu
3
cd(gaf
aps
3
u92lIf(c
(paeia
ig. 4. Correlation circle of soil macro fauna variables with factors 1 and 2 (left) analysis of data from the 5 production systems analyzed in the Altillanura plana regalm plantations, C: Rubber plantations, T: Transitory crops.
as calculated with 29 of the 40 initial variables that had respec-ive weights larger than 50% of the highest value, following therocedure recommended by Velasquez et al. (2007a). Differencesetween production systems for the soil chemical fertility indicatorere significant (ANOVA test: p < 0.01) with lowest average values
bserved in semi-natural savanna (0.31 ± 0.04) and oil palm plan-ations (0.32 ± 0.02) and highest in annual crops (0.78 ± 0.03), withmproved pastures and rubber plantations having intermediate val-es (Fig. 3a).
.2. Soil hydrological functions
Soils exhibited rather important variations in texture, with sandontent ranging from 21 to 81% (mean: 47.2%; Table 2), while bulkensity was high on average (1.44), varying between 1.1 and 1.67both soybean fields with highly contrasted conditions). Availableravimetric water was generally low, between 1.9 and 11.0% (aver-ge: 5.7%) and mean diameter values for stable aggregates variedrom 1.8 to 6.1 (average: 4.2 mm, Table 2).
The indicator was constructed using 11 of the 12 variables char-cterizing hydrologic properties and suggested higher values forerennial crops and natural savannas, but the ANOVA test was notignificant (p > 0.05; Fig. 3b).
.3. Soil biological function and diversity
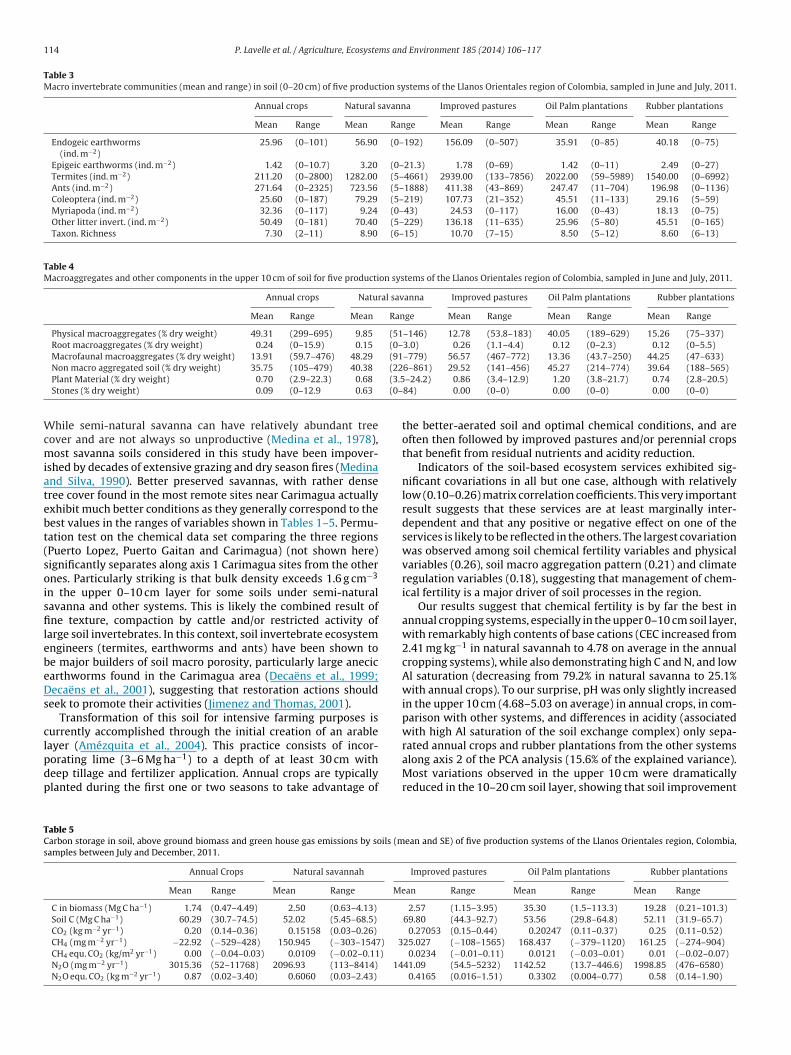
Soil macro invertebrate communities varied widely with landse, ranging from a minimum of 26.7 ind. m−2 (under rice) to504 ind. m−2 (in improved pasture), with an overall average of227. Termites were by far the most abundant group (71.8%), fol-
owed by ants (16.6%), earthworms (2.8%) and Coleoptera (2.6%).mproved pastures (3793 ± 761 m−2) had the largest communities,ollowed by oil palm plantations (2394 ± 491 m−2), native savanna2225 ± 590 m−2) rubber plantations (1872 ± 561 m−2) and annualrops (619 ± 264 m−2; Table 3).
Earthworm communities exhibited higher densities in savanna60.1 ± 3.0 m−2) than in all systems (Table 3), except for improvedastures (173.9 ± 8.6 m−2), where densities were increased by
lmost a factor of three. They were mostly comprised of endogeicarthworms (92.2%). Meanwhile, termite abundance was highestn improved pastures (1283 ± 81.3 m−2) and lowest in the undernnual crops (211 ± 35 m−2; Table 3). Contrary to the general trendojection of sample points in the plane defined by factors 1 and 2 (right) of a PCAf Colombia. EWM: earthworms, P: Improved pastures, SN: Natural savanna, PA: Oil
observed in termites and earthworms, the other important ecosys-tem engineers as defined by Jones et al. (1994); ant abundance washighest in the semi-natural savanna (724 ± 36 m−2). Taxonomicrichness also decreased from the more natural to more disturbedareas since soil nesting species dominant in savanna and pasturesoils are the most sensitive to disturbances.
The indicator of macro invertebrate abundance and diversitysignificantly separated systems (p < 0.001) with highest valuesin improved pastures (0.73 ± 0.05), followed by native savannas(0.58 ± 0.04); oil palm (0.57 ± 0.03) and rubber (0.52 ± 0.03), all farabove annual crops (0.29 ± 0.04; Fig. 3c).
Principal component analysis of the data matrix (comprised ofabundance for 7 large taxonomic units and taxonomic richness,sum of invertebrates collected at each of the 75 plots) confirmed thetrends expressed above and clearly ranked sites along axis 1 (43.8%of variance explained; Fig. 4) according to the abundance of all theinvertebrate groups, in the order: Improved pastures (IP), naturalsavanna (NS), oil palm plantations (OP), rubber plantations (R) andannual crops (T). Axis 2 opposed sites with large densities of Myri-apoda (annual crops with large Polydesmid populations) to naturalsavannas, improved pastures and oil palm plantations respectively,characterized by high populations of Coleoptera and social insects.Production systems explained 25.7% of variance according to thepermutation test (p < 0.001).
3.4. Soil macro aggregation
On average, only 37.9% of the soil volume was not macro-aggregated, with biogenic aggregates contributing 35.8% of thetotal soil mass and physical aggregates comprising 25.1%. Impor-tant differences were suggested in macro fauna associated biogenicaggregates, with this fraction representing only 14.3% of the soilunder annual crops and oil palm plantations, while savanna andimproved pastures possessed much larger percentages of the wholesoil as biogenic aggregates (48.3 and 56.6%; respectively).
Natural savannas, improved pastures and rubber plantationsrespectively, with high amounts of biogenic aggregates in soils,were opposed along axis 1 (31.4% explained variance) of PCA, toannual crops and palm tree plantations, with a predominance of
physical aggregates and non-macro aggregated soil (figure notshown). Axis 2 (23.2%) separated plots with high amounts ofstones and non-aggregated soil. This effect was independent fromsystems and likely linked to local soil conditions. The permutation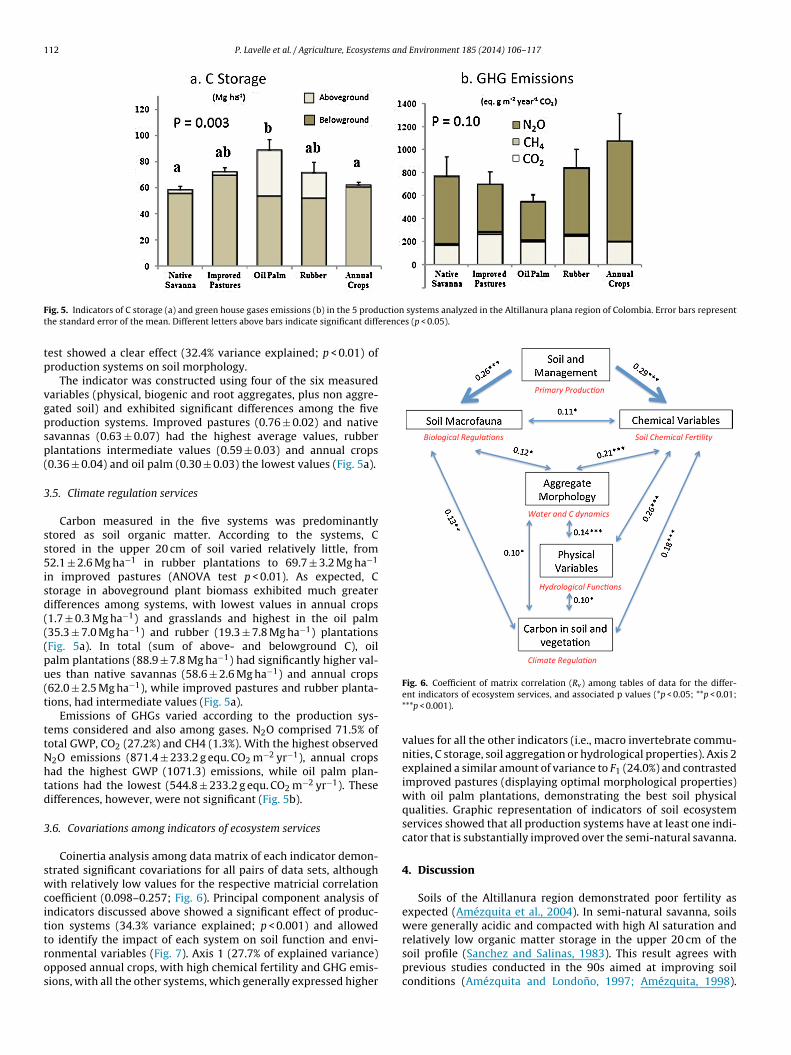
112 P. Lavelle et al. / Agriculture, Ecosystems and Environment 185 (2014) 106– 117
F uction systems analyzed in the Altillanura plana region of Colombia. Error bars representt erences (p < 0.05).
tp
vgpsp(
3
ss5isd(((pu(t
ttNhtd
3
swcittros
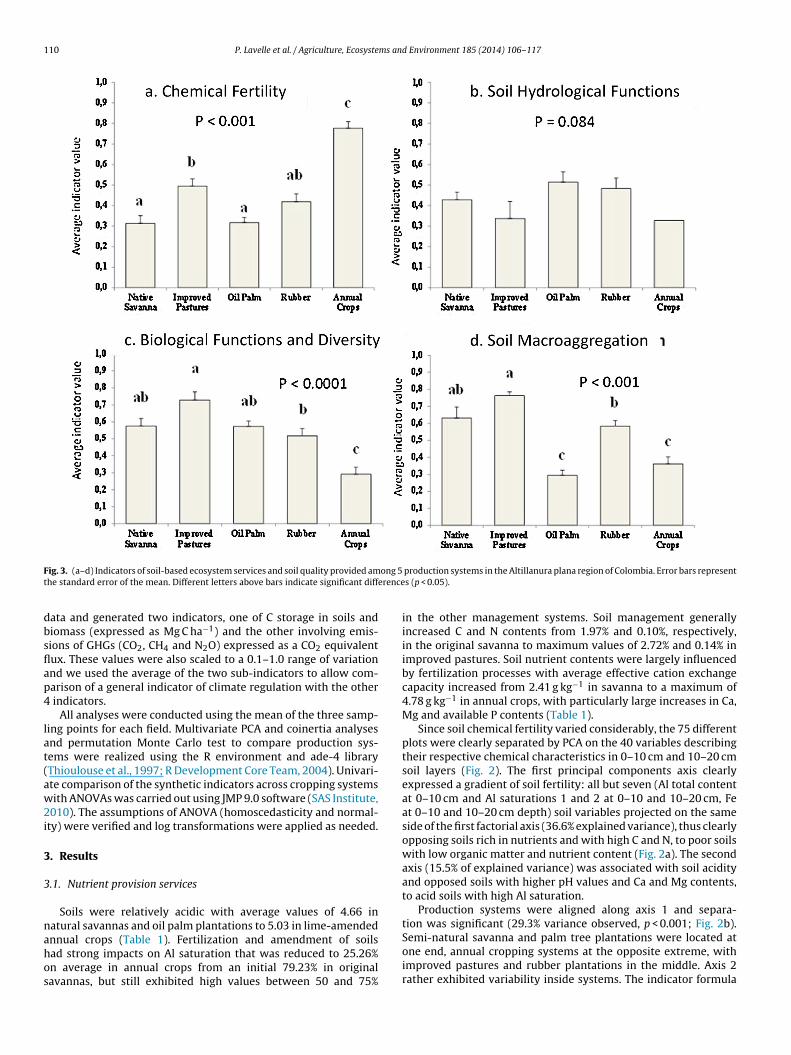
ig. 5. Indicators of C storage (a) and green house gases emissions (b) in the 5 prodhe standard error of the mean. Different letters above bars indicate significant diff
est showed a clear effect (32.4% variance explained; p < 0.01) ofroduction systems on soil morphology.
The indicator was constructed using four of the six measuredariables (physical, biogenic and root aggregates, plus non aggre-ated soil) and exhibited significant differences among the fiveroduction systems. Improved pastures (0.76 ± 0.02) and nativeavannas (0.63 ± 0.07) had the highest average values, rubberlantations intermediate values (0.59 ± 0.03) and annual crops0.36 ± 0.04) and oil palm (0.30 ± 0.03) the lowest values (Fig. 5a).
.5. Climate regulation services
Carbon measured in the five systems was predominantlytored as soil organic matter. According to the systems, Ctored in the upper 20 cm of soil varied relatively little, from2.1 ± 2.6 Mg ha−1 in rubber plantations to 69.7 ± 3.2 Mg ha−1
n improved pastures (ANOVA test p < 0.01). As expected, Ctorage in aboveground plant biomass exhibited much greaterifferences among systems, with lowest values in annual crops1.7 ± 0.3 Mg ha−1) and grasslands and highest in the oil palm35.3 ± 7.0 Mg ha−1) and rubber (19.3 ± 7.8 Mg ha−1) plantationsFig. 5a). In total (sum of above- and belowground C), oilalm plantations (88.9 ± 7.8 Mg ha−1) had significantly higher val-es than native savannas (58.6 ± 2.6 Mg ha−1) and annual crops62.0 ± 2.5 Mg ha−1), while improved pastures and rubber planta-ions, had intermediate values (Fig. 5a).
Emissions of GHGs varied according to the production sys-ems considered and also among gases. N2O comprised 71.5% ofotal GWP, CO2 (27.2%) and CH4 (1.3%). With the highest observed2O emissions (871.4 ± 233.2 g equ. CO2 m−2 yr−1), annual cropsad the highest GWP (1071.3) emissions, while oil palm plan-ations had the lowest (544.8 ± 233.2 g equ. CO2 m−2 yr−1). Theseifferences, however, were not significant (Fig. 5b).
.6. Covariations among indicators of ecosystem services
Coinertia analysis among data matrix of each indicator demon-trated significant covariations for all pairs of data sets, althoughith relatively low values for the respective matricial correlation
oefficient (0.098–0.257; Fig. 6). Principal component analysis ofndicators discussed above showed a significant effect of produc-ion systems (34.3% variance explained; p < 0.001) and allowed
o identify the impact of each system on soil function and envi-onmental variables (Fig. 7). Axis 1 (27.7% of explained variance)pposed annual crops, with high chemical fertility and GHG emis-ions, with all the other systems, which generally expressed higherFig. 6. Coefficient of matrix correlation (Rv) among tables of data for the differ-ent indicators of ecosystem services, and associated p values (*p < 0.05; **p < 0.01;***p < 0.001).
values for all the other indicators (i.e., macro invertebrate commu-nities, C storage, soil aggregation or hydrological properties). Axis 2explained a similar amount of variance to F1 (24.0%) and contrastedimproved pastures (displaying optimal morphological properties)with oil palm plantations, demonstrating the best soil physicalqualities. Graphic representation of indicators of soil ecosystemservices showed that all production systems have at least one indi-cator that is substantially improved over the semi-natural savanna.
4. Discussion
Soils of the Altillanura region demonstrated poor fertility asexpected (Amézquita et al., 2004). In semi-natural savanna, soilswere generally acidic and compacted with high Al saturation and
relatively low organic matter storage in the upper 20 cm of thesoil profile (Sanchez and Salinas, 1983). This result agrees withprevious studies conducted in the 90s aimed at improving soilconditions (Amézquita and Londono, 1997; Amézquita, 1998).
P. Lavelle et al. / Agriculture, Ecosystems and Environment 185 (2014) 106– 117 113
R
OP
IP
NS
T
GHG Emissions
Hydrologicalservices
C storage
Macrofauna
Soilmacroaggrega�o n
ChemicalFer�lit y
Fig. 7. Correlation circle of indicators with factors PCA 1 and 2 (upper left), and projection of individual plots of each production system on the F1/F2 plane defined by PCAon indicators.
Table 1Chemical properties (mean and range) in the upper 10 cm of soil in five production systems of the Llanos Orientales region of Colombia, sampled in June and July, 2011.
Annual crops Natural savanna Improved pastures Oil Palm plantations Rubber plantations
Mean Range Mean Range Mean Range Mean Range Mean Range
pH 5.03 (4.35–6.30) 4.68 (4.14–5.27) 4.78 (4.14–5.64) 4.64 (4.03–5.50) 4.91 (3.86–6.68)MO g kg−1 4.27 (2.42–7.17) 3.39 (1.13–5.6) 4.69 (2.22–6.72) 3.65 (1.71–6.60) 3.46 (1.55–5.22)C g kg−1 2.48 (1.41–4.17) 1.97 (0.66–3.25) 2.72 (1.29–3.90) 2.12 (0.99–3.84) 2.01 (0.90–3.03)N g kg−1 0.12 (0.06–0.19) 0.10 (0.05–0.16) 0.14 (0.07–0.20) 0.11 (0.06–0.17) 0.11 (0.08–0.17)C:N 20.98 (13.7–55.28) 19.77 (12.82–24.42) 20.39 (17.19–24.16) 20.47 (17.61–35.72) 19.69 (12.59–23.36)P Bray II mg kg−1 27.85 (0.86–113.01) 3.00 (0.27–44.26) 4.50 (0.62–30.79) 4.73 (0.61–57.72) 10.32 (0.49–143.37)K mg.Kg−1 0.21 (0.03–0.45) 0.06 (0.02–0.16) 0.09 (0.02–0.30) 0.08 (0.02–0.31) 0.08 (0.01–0.26)Ca mg kg−1 2.61 (0.08–5.85) 0.36 (0.07–3.02) 0.75 (0.03–3.94) 0.38 (0.07–2.18) 1.11 (0.10–3.79)Mg mg.Kg−1 0.97 (0.04–2.03) 0.14 (0.03–0.85) 0.30 (0.03–1.41) 0.16 (0.04–0.83) 0.38 (0.07–1.38)AI mg kg−1 0.99 (0–3.25) 1.86 (0.3–4.2) 1.91 (0.00–3.60) 2.00 (0.00–4.20) 1.48 (0–4.00)CIC cmol kg−1 11.12 (4.4–19.2) 8.04 (2.8–16.1) 10.48 (3.30–19.70) 8.03 (1.70–13.00) 8.97 (2.89–14.70)CICE cmol kg−1 4.78 (1.47–8.09) 2.41 (0.84–6.38) 3.06 (0.96–5.38) 2.62 (0.72–4.44) 3.04 (1.12–6.24)Al Sat1% 25.26 (0–92.18) 79.23 (12.11–94.88) 65.82 (0.00–92.86) 73.37 (0.00–94.55) 50.23 (0–92.23)Al Sat2% 9.45 (0–34.00) 24.86 (3.54–38.71) 19.31 (0.00–37.74) 28.76 (0.00–200) 16.85 (0–62.22)S mg kg−1 21.48 (8.06–49.82) 14.94 (0–27.84) 15.79 (7.09–29.37) 11.64 (0.00–34.57 12.68 (1.11–29.89)B mg kg−1 0.40 (0.1–0.69) 0.25 (0.02–0.51) 0.31 (0.12–0.46) 0.29 0.07–0.64) 0.30 (0.03–0.54)Fe mg kg−1 54.14 (8.02–395.26) 44.25 (18.4–336.32) 62.39 (15.03–227.27) 46.82 (18.9–241.7) 73.88 (10.52–528.45)Mn mg kg−1 6.28 (0.69–27.22) 1.72 (0.45–8.17) 4.57 (0.63–23.36) 2.22 (0.32–8.57) 2.96 (0.55–12.8)Cu mg kg−1 0.67 (0.13–1.52) 0.34 (0.06–1.05) 0.64 (0.24–2.34) 0.42 (0.09–1.68) 0.35 (0.09–0.84)Zn mg kg−1 3.13 (0.35–10.04) 0.86 (0.19–12.63) 1.42 (0.26–6.43) 0.99 (0.31–6.01) 0.87 (0.26–3.50)
Table 2Physical properties (mean and range) in the upper 10 cm of soil five production systems of the Llanos Orientales region of Colombia, sampled in June and July, 2011.
Annual crops Natural savanna Improved pastures Oil Palm plantations Rubber plantations
Mean Range Mean Range Mean Range Mean Range Mean Range
Soil moisture (g 100 g−1) 35.09 (25.33–48.00) 31.32 (12.67–42.33) 34.93 (30.67–40.67) 34.93 (30.67–40.67) 34.77 (23.33–44.33)Soil moisture (cm3 100 cm−3) 50.09 (30.00–76.67) 46.04 (20–60) 50.2 (34.67–58.00) 50.2 (34.67–58.00) 47.23 (34–58.00)Bulk Density
(g cm−3)1.42 (1.09–1.67) 1.49 (1.26–1.66) 1.44 (1.11–1.63) 1.44 (1.11–1.63) 1.37 (1.24–1.57)
Available water % 5.07 (3.60–8.44) 5.28 (1.92–7.15) 4.93 (3.05–7.24) 4.93 (3.05–7.24) 6.45 (3.00–8.89)Macroporosity % 8,00 (3.92–16.77) 8.11 (3.09–15.63) 6.29 (3.36–11.68) 6.29 (3.36–11.68) 8.9 (5.12–15.31)Mesoporosity % 7.74 (4.74–17.71) 8.44 (3.15–13.65) 6.76 (4.22–10.92) 6.76 (4.22–10.92) 9,00 (3.76–12.64)Microporosity % 32.19 (14.94–43.09) 30.94 (15.39–38.67) 33.75 (23.3–40.82) 33.75 (23.3–40.82) 31.65 (23.5–42.71)Tot. Porosity % 47.96 (30.00–59.33) 47.5 (39.67–57.00) 46.87 (38.33–55.0) 46.87 (38.33–55.00) 49.56 (41.00–56.00)Mean Aggr. Diam. (mm) 4.44 (3.03–5.63) 4.2 (2.62–5.41) 4.58 (2.80–6.05) 4.58 (2.8–6.05) 4.57 (2.75–6.03)Sand % 39.76 (28.83–58.83) 49.85 (21.5–81.33) 45.51 (30.79–63.07) 45.51 (30.79–63.07) 48.41 (23.50–72.29)Silt % 32.65 (20.00–46.00) 28.49 (11.33–45.21) 31.63 (20.43–49.38) 31.63 (20.43–49.38) 30.2 (13.87–49.33)
114 P. Lavelle et al. / Agriculture, Ecosystems and Environment 185 (2014) 106– 117
Table 3Macro invertebrate communities (mean and range) in soil (0–20 cm) of five production systems of the Llanos Orientales region of Colombia, sampled in June and July, 2011.
Annual crops Natural savanna Improved pastures Oil Palm plantations Rubber plantations
Mean Range Mean Range Mean Range Mean Range Mean Range
Endogeic earthworms(ind. m−2)
25.96 (0–101) 56.90 (0–192) 156.09 (0–507) 35.91 (0–85) 40.18 (0–75)
Epigeic earthworms (ind. m−2) 1.42 (0–10.7) 3.20 (0–21.3) 1.78 (0–69) 1.42 (0–11) 2.49 (0–27)Termites (ind. m−2) 211.20 (0–2800) 1282.00 (5–4661) 2939.00 (133–7856) 2022.00 (59–5989) 1540.00 (0–6992)Ants (ind. m−2) 271.64 (0–2325) 723.56 (5–1888) 411.38 (43–869) 247.47 (11–704) 196.98 (0–1136)Coleoptera (ind. m−2) 25.60 (0–187) 79.29 (5–219) 107.73 (21–352) 45.51 (11–133) 29.16 (5–59)Myriapoda (ind. m−2) 32.36 (0–117) 9.24 (0–43) 24.53 (0–117) 16.00 (0–43) 18.13 (0–75)Other litter invert. (ind. m−2) 50.49 (0–181) 70.40 (5–229) 136.18 (11–635) 25.96 (5–80) 45.51 (0–165)Taxon. Richness 7.30 (2–11) 8.90 (6–15) 10.70 (7–15) 8.50 (5–12) 8.60 (6–13)
Table 4Macroaggregates and other components in the upper 10 cm of soil for five production systems of the Llanos Orientales region of Colombia, sampled in June and July, 2011.
Annual crops Natural savanna Improved pastures Oil Palm plantations Rubber plantations
Mean Range Mean Range Mean Range Mean Range Mean Range
Physical macroaggregates (% dry weight) 49.31 (299–695) 9.85 (51–146) 12.78 (53.8–183) 40.05 (189–629) 15.26 (75–337)Root macroaggregates (% dry weight) 0.24 (0–15.9) 0.15 (0–3.0) 0.26 (1.1–4.4) 0.12 (0–2.3) 0.12 (0–5.5)Macrofaunal macroaggregates (% dry weight) 13.91 (59.7–476) 48.29 (91–779) 56.57 (467–772) 13.36 (43.7–250) 44.25 (47–633)
(22(3.5(0–
Wcmiatebt(soisfilebeDs
clpdp
TCs
Non macro aggregated soil (% dry weight) 35.75 (105–479) 40.38
Plant Material (% dry weight) 0.70 (2.9–22.3) 0.68
Stones (% dry weight) 0.09 (0–12.9 0.63
hile semi-natural savanna can have relatively abundant treeover and are not always so unproductive (Medina et al., 1978),ost savanna soils considered in this study have been impover-
shed by decades of extensive grazing and dry season fires (Medinand Silva, 1990). Better preserved savannas, with rather denseree cover found in the most remote sites near Carimagua actuallyxhibit much better conditions as they generally correspond to theest values in the ranges of variables shown in Tables 1–5. Permu-ation test on the chemical data set comparing the three regionsPuerto Lopez, Puerto Gaitan and Carimagua) (not shown here)ignificantly separates along axis 1 Carimagua sites from the othernes. Particularly striking is that bulk density exceeds 1.6 g cm−3
n the upper 0–10 cm layer for some soils under semi-naturalavanna and other systems. This is likely the combined result ofne texture, compaction by cattle and/or restricted activity of
arge soil invertebrates. In this context, soil invertebrate ecosystemngineers (termites, earthworms and ants) have been shown toe major builders of soil macro porosity, particularly large anecicarthworms found in the Carimagua area (Decaëns et al., 1999;ecaëns et al., 2001), suggesting that restoration actions should
eek to promote their activities (Jimenez and Thomas, 2001).Transformation of this soil for intensive farming purposes is
urrently accomplished through the initial creation of an arableayer (Amézquita et al., 2004). This practice consists of incor-
orating lime (3–6 Mg ha−1) to a depth of at least 30 cm witheep tillage and fertilizer application. Annual crops are typicallylanted during the first one or two seasons to take advantage ofable 5arbon storage in soil, above ground biomass and green house gas emissions by soils (mamples between July and December, 2011.
Annual Crops Natural savannah
Mean Range Mean Range Me
C in biomass (Mg C ha−1) 1.74 (0.47–4.49) 2.50 (0.63–4.13)
Soil C (Mg C ha−1) 60.29 (30.7–74.5) 52.02 (5.45–68.5)
CO2 (kg m−2 yr−1) 0.20 (0.14–0.36) 0.15158 (0.03–0.26)
CH4 (mg m−2 yr−1) −22.92 (−529–428) 150.945 (−303–1547) 3CH4 equ. CO2 (kg/m2 yr−1) 0.00 (−0.04–0.03) 0.0109 (−0.02–0.11)
N2O (mg m−2 yr−1) 3015.36 (52–11768) 2096.93 (113–8414) 14N2O equ. CO2 (kg m−2 yr−1) 0.87 (0.02–3.40) 0.6060 (0.03–2.43)
6–861) 29.52 (141–456) 45.27 (214–774) 39.64 (188–565)–24.2) 0.86 (3.4–12.9) 1.20 (3.8–21.7) 0.74 (2.8–20.5)84) 0.00 (0–0) 0.00 (0–0) 0.00 (0–0)
the better-aerated soil and optimal chemical conditions, and areoften then followed by improved pastures and/or perennial cropsthat benefit from residual nutrients and acidity reduction.
Indicators of the soil-based ecosystem services exhibited sig-nificant covariations in all but one case, although with relativelylow (0.10–0.26) matrix correlation coefficients. This very importantresult suggests that these services are at least marginally inter-dependent and that any positive or negative effect on one of theservices is likely to be reflected in the others. The largest covariationwas observed among soil chemical fertility variables and physicalvariables (0.26), soil macro aggregation pattern (0.21) and climateregulation variables (0.18), suggesting that management of chem-ical fertility is a major driver of soil processes in the region.
Our results suggest that chemical fertility is by far the best inannual cropping systems, especially in the upper 0–10 cm soil layer,with remarkably high contents of base cations (CEC increased from2.41 mg kg−1 in natural savannah to 4.78 on average in the annualcropping systems), while also demonstrating high C and N, and lowAl saturation (decreasing from 79.2% in natural savanna to 25.1%with annual crops). To our surprise, pH was only slightly increasedin the upper 10 cm (4.68–5.03 on average) in annual crops, in com-parison with other systems, and differences in acidity (associatedwith high Al saturation of the soil exchange complex) only sepa-rated annual crops and rubber plantations from the other systems
along axis 2 of the PCA analysis (15.6% of the explained variance).Most variations observed in the upper 10 cm were dramaticallyreduced in the 10–20 cm soil layer, showing that soil improvementean and SE) of five production systems of the Llanos Orientales region, Colombia,
Improved pastures Oil Palm plantations Rubber plantations
an Range Mean Range Mean Range
2.57 (1.15–3.95) 35.30 (1.5–113.3) 19.28 (0.21–101.3)69.80 (44.3–92.7) 53.56 (29.8–64.8) 52.11 (31.9–65.7)
0.27053 (0.15–0.44) 0.20247 (0.11–0.37) 0.25 (0.11–0.52)25.027 (−108–1565) 168.437 (−379–1120) 161.25 (−274–904)
0.0234 (−0.01–0.11) 0.0121 (−0.03–0.01) 0.01 (−0.02–0.07)41.09 (54.5–5232) 1142.52 (13.7–446.6) 1998.85 (476–6580)
0.4165 (0.016–1.51) 0.3302 (0.004–0.77) 0.58 (0.14–1.90)

ms an
wpocalovpta
ifighfdid(aiAna2di5h(ras
flspattpl2bctsClt(cieptaCa
ctd
P. Lavelle et al. / Agriculture, Ecosyste
as only sustained in the upper 10 cm. Soil physical improvementrovided by deep tillage previous to the crop establishment was notbserved in our plots which suggests that improvement of physi-al characteristics, considered a necessary condition to implementnnual cropping systems (Amézquita et al., 2004), may be short-ived within these production systems if no further interventionccurs. We also note that indicators of other soil ecosystem ser-ices, biodiversity (macro fauna communities index), soil stabilityrovided by macro aggregation, and climate regulation serviceshrough C storage and control of GHG emissions, were lowest undernnual cropping systems.
The potential of improved pastures for enhancing soil macronvertebrate communities (Decaëns et al., 1994) was clearly con-rmed in this study. Increased C inputs from large roots and aboveround biomass likely provided better quality food as well as muchigher organic matter inputs. Earthworm densities increased three
old from 56.9 to 156.1 ind. m−2 while termite densities more thanoubled from 1282 in semi-natural savanna to 2939 ind. m−2 under
mproved pastures. Other groups, with the exception of ants, alsoemonstrated generally higher densities under improved pasturesTable 3). Taxonomic diversity also appeared to be higher, with theverage number of orders found at each sampling point increas-ng from 8.9 to 10.7 in savanna vs. improved pastures, respectively.long with enhanced activities of the major soil ecosystem engi-eers, we observed a 28.3% increase in the accumulation of biogenicggregates produced by macro fauna (Velasquez et al., 2007a,012), a 26.7% increase in physical aggregates and a resulting 28.3%ecrease in the non-aggregated soil fraction. At the same time, the
ndicator for nutrient provision services (chemical fertility) was7.6% higher than in the original savanna. While the indicator forydrological functions decreased from 0.43 ± 0.06 to 0.34 ± 0.04Fig. 2) on average under improved pastures, the combined climateegulation index was the highest of all five systems with an aver-ge value of 0.55 (±0.04) much higher than recorded in the originalavanna (0. 34 ± 0.04; data not shown).
Perennial crops (palm and rubber) presented rather high valuesor all indicators, and demonstrated the highest values for hydro-ogical functions (although differences were non-significant) and Ctorage. The accumulation of C in aboveground biomass led to oilalm plantations having the highest C storage (35.3 ± 7.0 t ha−1),lthough the combined climate regulation indicator was secondo improved pastures as a result of the low GHG emissions inhese modified grasslands. The environmental impact of oil palmlantations has been addressed in a rather large number of pub-
ications (Comte et al., 2012; Obidzinski et al., 2012; Smith et al.,012; Reijnders and Huijbregts, 2008) and our indicators need toe assessed in a larger number of sites to reach a definitive con-lusion on the overall impact of these systems. It is also importanto point out that the majority of the plantations considered in thistudy were relatively young (<5 yr since implementation) and that
benefits measured here for oil palm or rubber plantations areikely to increase, but are also highly variable (Fig. 5a). Thus, uncer-ainty in the net ecosystem C balance in these systems is greatZiegler et al., 2012). We therefore suggest that the synthetic indi-ators developed here described a situation that may be largelynfluenced by previous land use. Monitoring plantations from thearly stages to more mature perennial production systems wouldrovide a clearer view of the overall C balance and contributionso ecosystem services over time. Previous studies have shown thatged rubber plantations may lose high amounts of belowground, followed by significant decreases in soil macro fauna abundancend diversity as plantations age (Gilot et al., 1995).
Overall, changes in soil chemical parameters following the initialreation of an arable layer at all sites drastically improved concen-rations and availability of P, K, Ca and Mg, while CEC was more thanoubled and average Al saturation reduced from ca. 80% in savannas
d Environment 185 (2014) 106– 117 115
to 25% in annual crops (Table 1). Surprisingly, the changes observedfor pH, N and C contents were much less dramatic. Physical param-eters in the upper 0–10 cm soil layer that determine hydrologicalfunctions suggested some changes, although no significant differ-ences were observed among systems. This result suggests that localvariability in soil texture and differences in the implementation ofmechanical activities when creating the arable layer can play animportant role in determining soil water dynamics.
The greatest differences across land uses were observed inmacro invertebrate communities and soil macro aggregation pat-terns. Macro invertebrate communities indeed are highly sensitiveand quickly respond to subtle changes in resource availability andhabitat conditions, as is confirmed by abundant past literature(Lavelle and Pashanasi, 1989; Decaëns et al., 1994; Barros et al.,2002; Rousseau et al., 2013). Modification of macro invertebratecommunities, especially of soil ecosystem engineers that build andshape the habitat in the upper 10–30 cm of soil, result in observablechanges in soil macro aggregation and macro porosity. More soil isconverted into biogenic aggregates (Lavelle et al., 2006; Velasquezet al., 2012) and denser networks of galleries and other macro poresare formed (Hallaire et al., 2000). These modifications often resultin long-term improvements to water infiltration and changes inwater retention patterns and can produce emergent effects at largerscales (Lavelle et al., 2006). These changes, however, may take along time to become evident and translate into significant modifica-tions of soil physical parameters. Alterations to chemical propertiesgenerally occur at even greater time scales, except when massiveadditions of lime and fertilizer generate an immediate change thatcan often have persistent residual effects. For these reasons, pat-terns observed in this preliminary examination of soil ecosystemservices in the region will need to be monitored over time to iden-tify a clear trend and provide more conclusive information on therespective long-term impacts of management. In any case, theseresults confirm that soil macro invertebrate communities and mor-phological analyses are highly sensitive early indicators of change(Velasquez et al., 2012).
Along the same line, a significant proportion of the varianceamong systems that is not explained by differences in the produc-tion system is probably due to differences in past management,previous to system installation. The transition phase between theinitial degraded savanna and the newly intensified agro ecosys-tem is critical since conditions inherited from the original state(organic matter and nutrient concentrations, soil aggregation, bio-diversity) may drive essential soil processes towards divergentpathways according to their characteristics. Holling (2001) statesthat conditions of connectedness and potential at the onset of anew adaptive cycle, determine the trajectory that the ecosystemwill follow as it progressively shifts from the “release” to the “reor-ganization” and “exploitation” phases of the cycle. This means thatbiodiversity and biogeochemical cycles inherited from the origi-nal semi-natural savanna, that determine “connectedness” and the“potential” (here expressed as organic matter, nutrient reservesand, possibly, accumulated soil macro aggregation), are essentialfeatures to understand the state of the system at the time we con-ducted the diagnostic, and for understanding current and futuretrajectories of ecosystem change.
Organization of the landscape and proximity to natural sys-tems may be a third determinant of the observed variation (Lovelland Johnston, 2009). An interesting outcome of this study is thedifference in provision of soil based-ecosystem services by differ-ent production systems. Annual crops enhance the nutrient supplypotential of soils and represent an attractive option to achieve fast
economic return which may be needed to compensate the costof creating an arable layer (Amézquita et al., 2004). On the otherhand, these systems suggest large negative impacts on soil macroinvertebrate communities and other soil ecosystem properties that
1 ms an
cctanoi
crtoona(sqattvemtem
vdrwwtioifitponcvtita
A
taCtiao
R
A
16 P. Lavelle et al. / Agriculture, Ecosyste
ould be mitigated if favorable systems adjacent to these field plotsould serve as colonization sources. Alternation of complemen-ary systems, in time by rotations or in space via strategic spatialrrangement of plots would allow interactions and increase con-ectedness at landscape scale. This would allow the whole matrixf plots dedicated to different uses for conserving soil capital andts capacity to provide ecosystem services.
Beyond local landscape construction, limits to large-scale landonversion should be set taking into consideration biodiversityetention, ecosystem engineer promotion and waterway protec-ion in relation to long-term landscape health. Considering therganization of the agricultural territory at landscape scale isf utmost importance when considering the fate of the denseetwork of gallery forests that cover roughly 20% of the areand of the streams and other water bodies. Lovell and Johnston2009) state that “Although the conventional approach to land-cape ecology is based on a model that assumes poor ecologicaluality in the human-dominated matrix, a review of recent liter-ture reveals important opportunities to improve the quality ofhe landscape matrix by increasing spatial heterogeneity throughhe addition of semi-natural landscape elements designed to pro-ide multiple ecosystem services. Taken alone, these individuallements might not appear to have a large impact on the environ-ent, but when considered together within the entire landscape,
he contribution could be significant, particularly when theselements are intentionally designed to improve landscape perfor-ance”.In the meantime, accurate monitoring of soil quality and pro-
ision of ecosystem services should be developed to detect soilegradation and prevent irreversible impacts. Soils of the Llanosegion are heavily compacted (apparent density around 1.5–1.6),ith low hydraulic conductivity and very limited porosity to retainater available to plants (in the range 4–6% on average). Prac-
ices that would deteriorate even more this situation would likelyncrease flooding and surface runoff with associated increased riskf soil erosion and transfer of nutrients from surface applied fertil-zers to rivers. At a larger scale, this could yield severe implicationsor the larger Orinoco River Basin (i.e., degradation of water qual-ty, eutrophication, and facilitation of dissolved organic C fluxeso the atmosphere). Applying the same sort of indicators that weresent in this study may carry out diagnostics of soil quality andther soil ecosystem services. The identification of significant vs.on-impacted variables made in this study will permit the appli-ation of protocols with a significant reduction in the number ofariables measured, but with only minimal losses to sensitivity andhe information obtained. Furthermore, we recommend perform-ng analyses of ecosystem services at the landscape scale and overime, in order to increase the understanding of determinants of ESnd allow designing ecoefficient agricultural landscapes.
cknowledgements
First, we would like to thank the farmers involved in this studyhat allowed us to conduct research on their land. We would alsoppreciate the contributions of Arbey Alvarez, Mercedes Castaneda,arolina Quintero and others who helped in the field and labora-ory, as well as Jorge Lozano and others in CORPOICA who providedmportant logistical support. We also thank Silvia Elena Castanond Carlos Nagles for providing the map. The Colombian Ministryf Agriculture funded this research.
eferences
mézquita, E., Londono, H., 1997. La infiltración del agua en algunos suelos delos Llanos Orientales y sus implicaciones en su uso y manejo. Revista SuelosEcuatoriales 27, 163–168.
d Environment 185 (2014) 106– 117
Amézquita, E., 1998. Propiedades físicas de los suelos de los llanos orientales ysus requerimientos de labranza. Encuentro Nacional de Labranza, Villavicencio,Colombia, pp. p29.
Amézquita, E., Thomas, R.J., Rao, I.M., Molina, D.L., Hoyos, P., 2004. Use of deep-rootedtropical pastures to build-up an arable layer through improved soil propertiesof an Oxisol in the Eastern Plains (Llanos Orientales) of Colombia. Agriculture,Ecosystems & Environment 103, 269–277.
Anderson, J.M., Ingram, J.S.I., 1993. Tropical Soil Biology and Fertility. A Handbookof Methods, 2nd edition. CAB International, Wallingford U.K.
Barros, E., Pashanasi, B., Constantino, R., Lavelle, P., 2002. Effects of land use systemon the soil macro fauna in western Brazilian Amazonia. Biology and Fertility ofSoils 35, 338–347.
Chu, H., Hosen, Y., Yagi, K., 2007. NO, N2O CH4 and CO2 fluxes in winter barleyfield of Japanese Andisol as affected by N fertilizer management. Soil Biology &Biochemistry 39, 330–339.
Comte, I., Colin, F., Whalen, J.K., Gruenberger, O., Caliman, J.P., 2012. Agriculturalpractices in oil palm plantations and their impact on hydrological changes, nutri-ent fluxes and water quality in Indonesia: a review. Advances in Agronomy 116,71–124.
Decaëns, T., Lavelle, P., Jimenez, J.J., Escobar, G., Rippstein, G., 1994. Impact of landmanagement on soil macrofauna in the Oriental Llanos of Colombia. EuropeanJournal of Soil Biology 30, 157–168.
Decaëns, T., Mariani, L., Lavelle, P., 1999. Soil surface macrofaunal communities asso-ciated with earthworm casts in grasslands of the Eastern Plains of Colombia.Applied Soil Ecology 13, 87–100.
Decaëns, T., Galvis, J.H., Amézquita, E., 2001. Propriétés des structures produitespar les ingénieurs écologiques à la surface du sol d’une savane colombienne.Comptes Rendus de l’Académie des Sciences de Paris. Série III 324, 465–477.
Gilot, C., Lavelle, P., Blanchart, E., Keli, J., Kouassi, P., Guillaume, G., 1995. Biologicalactivity of soils in Hevea stands of different ages in Côte d’Ivoire. Acta ZoologicaFennici 196, 186–190.
Goedert, W.J., 1989. Cerrado region – agricultural potential and policy for its devel-opment. Pesquisa Agropecuaria Brasileira 24, 1–17.
Guecker, B., Boechat, I.G., Giani, A., 2009. Impacts of agricultural land use onecosystem structure and whole-stream metabolism of tropical Cerrado streams.Freshwater Biology 54, 2069–2085.
Hallaire, V., Curmi, P., Duboisset, A., Lavelle, P., Pashanasi, B., 2000. Soil structurechanges induced by the tropical earthworm Pontoscolex corethrurus and organicinputs in a Peruvian ultisol. European Journal of Soil Biology 36, 35–44.
Holling, C.S., 2001. Understanding the complexity of economic, ecological, and socialsystems. Ecosystems 4, 390–405.
Hubert, B., Rosegrant, M., van Boekel, M.A.J.S., Ortiz, R.A., 2010. The future of food:scenarios for 2050. Crop Science 50, S1–S17.
Ibrahim, M., Chacón, M., Cuartas, C., Naranjo, J., Ponce, G., Vaga, P., Casasola, F.,Rojas, J., 2007. Almacenamiento de carbono en el suelo y la biomasa arbóreaen sistemas de usos de la tierra en paisajes ganaderos de Colombia, Costa Rica yNicaragua. Agroforestería en las Américas 45, 27–36.
IGAC, 2004. Mapa de suelos de la Altillanura de los Llanos Orientales de Colombia.IPCC., 2007. Climate change: Synthesis Report. Contribution of Working Groups I, II
and III to the Fourth Evaluation Report of Intergovernmental Pannell on ClimateChange. Geneva, Switzerland.
Jepson, W., 2005. A disappearing biome? Reconsidering land-cover change in theBrazilian savanna. Geographical Journal 171, 99–111.
Jimenez, J.J., Thomas, R. (Eds.), 2001. The Nature’s Plow: Soil Macro InvertebrateCommunities in the Neotropical Savannas of Colombia. CIAT, Cali, Colombia.
Jones, C., Lawton, J.H., Shachak, M., 1994. Organisms as ecosystem engineers. Oikos69, 373–386.
Lascano, C.L., Estrada, J., 1989. Long-term productivity of legume based and puregrass pastures in the Eastern Plains of Colombia. in:. In: Proceedings of the XVIInternational Grassland Congress, Nice, France, pp. 1179–1180.
Lavelle, P., Pashanasi, B., 1989. Soil macro fauna and land management in PeruvianAmazonia (Yurimaguas Loreto). Pedobiologia 33, 283–291.
Lavelle, P., Decaëns, T., Aubert, M., Barot, S., Blouin, M., Bureau, F., Margerie, P., Mora,P., Rossi, J.P., 2006. Soil invertebrates and ecosystem services. European Journalof Soil Biology 42, S3–S15.
Lovell, S.T., Johnston, D.M., 2009. Designing landscapes for performance based onemerging principles in landscape ecology. Ecology and Society 14, 1–24.
Mac Dicken, K.G., 1997. A Guide to Monitoring Carbon storage in Forestry and Agro-forestry projects. http://www.winrock.org/fnrm/files/carbon.pdf
Medina, E., Mendoza, A., Montes, R., 1978. Nutrient balance and organic matterproduction in Trachypogon savannas of Venezuela. Tropical Agriculture 55,243–253.
Medina, E., Silva, J.F., 1990. Savannas of northern South America – a steady-state reg-ulated by water water interactions on a background of low nutrient availability.Journal of Biogeography 17, 403–413.
Millennium Ecosystem Assessment, 2005. Maweb.org.Morris, S.G., Kimber, S.W.L., Grace, P., Van Zwieten, L., 2013. Improving the statistical
preparation for measuring soil N2O flux by closed chamber. Science of the TotalEnvironment 465, 166–172.
Obidzinski, K., Andriani, R., Komarudin, H., Andrianto, A., 2012. Environmental andsocial impacts of oil palm plantations and their implications for biofuel produc-
tion in Indonesia. Ecology and Society 17, 25.R Development Core Team, 2004. R: A Language and Environment for StatisticalComputing. R Foundation for Statistical Computing, Vienna, Austria.
Reijnders, L., Huijbregts, M.A.J., 2008. Palm oil and the emission of carbon-basedgreenhouse gases. Journal of Cleaner Production 16, 477–482.

ms an
R
R
R
R
S
SS
Ziegler, A.D., Phelps, J., Yuen, J.Q., Webb, E.L., Lawrence, D., Fox, J.M., Bruun, T.B.,
P. Lavelle et al. / Agriculture, Ecosyste
ippstein, G., Amézquita, E., Escobar, E., Grollier, C., 2001. Condiciones Naturalesde la Sabana Capitulo 1. In: Rippstein, G., Escobar, G., Motta, F. (Eds.), Agroce-cología y biodiversidad de las sabanas en los Llanos Orientales de Colombia. CIATPublications, Cali, Colombia.
omero-Ruiz, M.H., Flantua, S.G.A., Tansey, K., Berrio, J.C., 2012. Landscape transfor-mations in savannas of northern South America: land use/cover changes since1987 in the Llanos Orientales of Colombia. Applied Geography 32, 766–776.
ousseau, L., Fonte, S.J., Téllez, O., van der Hoek, R., Lavelle, P., 2013. Soil macro faunaas indicators of soil quality and land use impacts in smallholder agroecosystemsof western Nicaragua. Ecological Indicators 27, 71–82.
ochette, P., Eriksen-Hamel, N.S., 2008. Chamber measurements of soil nitrous oxideflux: are absolute values reliable? Soil Science Society of America Journal 72,331–342.
anchez, P., Salinas, J.G.J.G., 1983. Low input technology for managing oxisols and
ultisols in tropical America. Advances in Agronomy 34, 279–405.AS Institute, 2010. JMP 9.0. Cary, NC, USA.mith, D.R., Townsend, T.J., Choy, A.W.K., Hardy, I.C.W., Sjoegersten, S., 2012. Short-
term soil carbon sink potential of oil palm plantations. Global Change BiologyBioenergy 4, 588–596.
d Environment 185 (2014) 106– 117 117
Thioulouse, J., Chessel, D., Doledec, S., Olivier, J.M., 1997. ADE-4: a multivariateanalysis and graphical display software. Statistics and Computing 7, 75–83.
Velasquez, E., Lavelle, P., Andrade, M., 2007a. GISQ, a multifunctional indicator ofsoil quality. Soil Biology & Biochemistry 39, 3066–3080.
Velasquez, E., Pelosi, C., Brunet, D., Grimaldi, M., Martins, M., Rendeiro, A.C., Barrios,E., Lavelle, P., 2007b. This ped is my ped: visual separation and near infraredspectra allow determination of the origins of soil macroaggregates. Pedobiologia51, 75–87.
Velasquez, E., Fonte, S.J., Barot, S., Grimaldi, M., Desjardins, T., Lavelle, P., 2012. Soilmacro fauna-mediated impacts of plant species composition on soil functioningin Amazonian pastures. Applied Soil Ecology 56, 43–50.
Wall, D.H.E. (Ed.), 2012. Soil Ecology and Ecosystem Services. Oxford UniversityPress, Oxford, U.K..
Leisz, S.J., Ryan, C.M., Dressler, W., Mertz, O., Pascual, U., Padoch, C., Koh,L.P., 2012. Carbon outcomes of major land-cover transitions in SE Asia: greatuncertainties and REDD plus policy implications. Global Change Biology 18,3087–3099.