the effect of land use planning on economic vulnarability
353
THE EFFECT OF LAND USE PLANNING ON ECONOMIC VULNARABILITY TO DISASTER MANAGEMENT IN LOW INCOME NEIGHBOURHOODS OF ELDORET URBAN AREA, KENYA Dedan Oriewo Ong’anya A Thesis Submitted in Partial Fulfillment of Requirement for the Award of Degree of Doctor of Philosophy in Disaster Management and Sustainable Development of Masinde Muliro University of Science and Technology OCTOBER 2020.
-
Upload
khangminh22 -
Category
Documents
-
view
0 -
download
0
Transcript of the effect of land use planning on economic vulnarability
THE EFFECT OF LAND USE PLANNING ON ECONOMIC VULNARABILITY
TO DISASTER MANAGEMENT IN LOW INCOME NEIGHBOURHOODS OF
ELDORET URBAN AREA, KENYA
Dedan Oriewo Ong’anya
A Thesis Submitted in Partial Fulfillment of Requirement for the Award of Degree of
Doctor of Philosophy in Disaster Management and Sustainable Development of
Masinde Muliro University of Science and Technology
OCTOBER 2020.
ii
DECLARATION
This thesis is my work prepared with no other tyan indicated sources and support and has
not been presented elsewhere foa degree or any other award
Signature…………………………… Date …………………………
Dedan Oriewo Ong’aya
CDS/H/10/09
CERTIFICATION
The undersigned certify that they have read and hereby recommend for acceptance of
Masinde Muliro University of Science and Technology, a thesis titled: The Effect of Land
Use Planning on Economic Vulnarability to Disaster Management in Low Income
Neighbourhoods of Eldoret Urban Area, Kenya.
Signature……………………………………………. Date……….……………………..
Prof. Samuel S. China
Department of Disaster Management and Sustainable Development
Masinde Muliro University of Science and Technology
Signature……………………………………………. Date……….……………………..
Prof. Jacob Wakhungu
Department of Veterinary Sciences and Technology
Masinde Muliro University of Science and Technology
iii
COPYRIGHT
This thesis is a copyright material protected under the Berne convention, the copyright Act
2001 and other international and national enactments in their behalf, on intellectual
property. It may not be reproduced by any means in full or in part except for short extracts
in fair dealing for research or private study, critical scholarly review or discourse with
acknowledgement, with written permission of the Director of Research and Post Graduate
School (DRPGS) on behalf of both the author and Masinde Muliro University of Science
and Technology.
iv
DEDICATION
This Research Thesis is dedicated to my late parents, Jashon Ong`anya Osweta and Mama
Philister Odaso Ong`anya who brought me on this World, and to my wife Josephine Ounga
Ong`anya, my children, Jack Brian, Kendrick Keynes, Naomi Victory and Joy Juneau’s for
their encouragement, moral, material and spiritual support during this programme.
v
ACKNOWLEDGEMENTS
I would like to acknowledge God Almighty for bringing me this far, not forgetting the
people that I have interacted with to make this work successful. I am obliged to register my
sincere gratitude to my supervisors, Prof. S.S. China and Prof. J.W. Wakhungu for their
guidance, support and constructive criticism during the preparation of this thesis. I wish
also to acknowledge the role played by my research assistants, namely, Alphonse Otieno,
Kevin Kwamoi, Victor Okwema, and Otieno Ondula, all who assisted me during data
collection period. Further, I`m greatly indebted to Prof. L.S.Mulongo, the Director of
Simuplan Consultant who incorporated me in his firm as one of the consultants especially
in the urban land use planning and housing issues. I may not have mentioned everybody
who in one way or another, contributed to the successful completion of this thesis, but my
heartfelt recognition is hereby registered to all of them for their overwhelming support they
offered.
vi
ABSTRACT
The urban residents of low income neighbourhoods Worldwide faces economic vulnerability to
Disaster due to difficulties to acquire serviced land to enhance their economic resilience by
improved human settlements and for commercial purposes. Land use planning seeks to
regulate land use in ordly and efficient manner. Thus, it enables low income urban residents in
neighbourhoods to access serviced land at affordable prices, access socio-economic services,
infrastructure, transportation facilities and good environment. This study sought to evaluate the
effect of land use planning on economic vulnability to disaster management (EVDM), with a
view to determine the best urban land use planning strategies and policies that could minimize
disaster risk among the urban residents in Eldoret Urban Area (EUA). Specifically the study
went out: (i) To examine the influence of urban land use planning regulatory instruments on
economic vulnerability to disaster management in low income neighbourhoods in EUA; (ii) To
determine the effect of urban land zoning on economic vulnerability to disaster management in
low income neighbourhoods of EUA; and (iii)To establish the effects of urban land transit
circulation and connectivity on economic vulnerability to disaster management in low income
neighbourhoods of EUA. Subsequently, H01, H02, and H03 were derived from the specific
objectives respectively. Descriptive survey research design was used. The classical spatial
economic theory (making room model); and disaster reduction theory (community-based
model) was applied in this study. The study targeted the urban residents in Eldoret Urban
Areas of (Langas, Kamukunji and Kapsaos). Proportional stratified random sampling was
applied for the purpose of quantitative data collection, while purposive sampling was used for
qualitative data. A total sample size of 550 respondents was sampled. Questionnaire was the
main instruments to collect primary data, alongside key informant interviews (KIIs) and focus
group discussions (FGDs). Finally; descriptive, inferential, regression and correlationstatistics
were applied in data analysis and interpretation. Results indicated that land use planning
regulatory instruments have combined influence of 69.0% over disaster management. Test
results on H01 showed that there was significantly positive relationship between urban land use
planning and disaster management. The effect of Land use planning regulatory instrument on
EVDM was significant positive (R=0.878), the study revealed that Land use planning
regulatory instrument accounted for 87.8% (R2=.771) of EVDM. The other variables in the
urban areas explained the remaining 12.2%. Urban Land use Zoning (LUZ) had a combined
influenced of 73.0% on EVDM. Test results on H02 indicated that there was a significant
positive relationship between LUZ and EVDM activity level. Circulation and connectivity had
a combined influence of 73.0% on EVDM. Test results for H03 observed that there was a
significant positive relationship between connectivity and circulation and EVDM activity level
(r= .883). There was an indication that Connectivity and Circulation explained 78.0%
(R2=.780) of EVDM. The findings are a pointer to the fact that land use planning and its three
dimensions had significantly positive effects on economic vulnerability to disaster
management. From these results, it can be concluded that urban land use planning is a critical
tool or technique in designing and developing urban areas where hazardous zones are mapped,
demarcated and kept off from urban residents’ socioeconomic activities. The study
recommends that urban authorities must focus on urban land use planning to achieve
sustainable development and growth.
vii
TABLE OF CONTENTS
CONTENTS PAGES
CERTIFICATION ............................................................................................................. II
COPYRIGHT .................................................................................................................... III
DEDICATION ................................................................................................................... IV
ACKNOWLEDGEMENTS ............................................................................................... V
ABSTRACT ....................................................................................................................... VI
TABLE OF CONTENTS ................................................................................................ VII
LIST OF TABLES ......................................................................................................... XIV
LIST OF FIGURES ....................................................................................................... XVI
LIST OF PLATES ....................................................................................................... XVIII
LIST OF APPENDICES ................................................................................................ XIX
LIST OF ABBREVIATION AND ACRONYMS .......................................................... XX
OPERATIONAL DEFINITION OF TERMS ........................................................... XXII
CHAPTER ONE: INTRODUCTION ............................................................................... 1
1.1 Background of the Study .............................................................................................. 1
1.2 Statement of the Problem ........................................................................................... 19
1.3 Purpose of the Study .................................................................................................. 22
1.4 Research Objectives ................................................................................................... 22
1.5 Research Hypotheses .................................................................................................. 23
1.6 Justification ................................................................................................................ 24
1.7 The Scope of the Study .............................................................................................. 25
1.8 Assumptions of the Study .......................................................................................... 25
CHAPTER TWO: LITERATURE REVIEW ................................................................ 27
2.1 Introduction ................................................................................................................ 27
2.2 Planning and Urban Land Use Concept ..................................................................... 27
2.2.1. Planning Concept. ..................................................................................................... 27
2.2.2. Urban Land Use Concept. ......................................................................................... 28
2.3. Legal framework of Land Use Planning in Kenya ..................................................... 33
viii
2.4. Land Use Planning and Urban Growth in Kenya. ...................................................... 38
2.5. Urban Planning Dynamics which influences Urban Land Use Planning ................... 46
2.5.1. Spatial Development Planning.................................................................................. 47
2.5.2. Strategic Development Planning .............................................................................. 48
2.5.3 Integrated Development Planning ............................................................................ 48
2.5.4. Sectoral Development Planning................................................................................ 49
2.5.5. Physical Planning ...................................................................................................... 50
2.5.6. Urban Master Plan .................................................................................................... 52
2.5.7. Infrastructural Development Planning ...................................................................... 53
2.5.8. Environmental planning. ........................................................................................... 54
2.5.9. Transportation Planning. ........................................................................................... 54
2.5.10. Sustainability Planning. ......................................................................................... 55
2.6. Urban Land Use Planning and Disaster Management ............................................... 56
2.7. Land Use Plannig Regulatory Instruments ................................................................. 58
2.7. The Indicators of Land Use Planning Regulatory Instruments .................................. 64
2.7.1. Minimum Lot Size. ................................................................................................... 64
2.7.2. Floor Area Ratio. ...................................................................................................... 64
2.7.3. Building Code /standard ........................................................................................... 66
2.7.4. Building Permits ....................................................................................................... 67
2.7.5. Open/Green Space. ................................................................................................... 67
2.7. 6. Green Buildings. .................................................................................................... 69
2.7.7. Building lines/set backs ............................................................................................ 69
2.7.8. Buffer Zones ............................................................................................................. 70
2.7.9. Way leaves or Right of Way Protections .................................................................. 71
2.7.10. The enforcement of Property Rights. ..................................................................... 72
2.7.11. Construction or Building Materials and Technologies. ......................................... 73
2.8. Land Use Zoning ........................................................................................................ 75
2.8.1. Functional Zoning. .................................................................................................... 79
2.8.2. Formed Based Zoning. .............................................................................................. 80
2.8.3. Intensity Zoning. ....................................................................................................... 80
2.8.4. Incentive zoning. ....................................................................................................... 81
ix
2.8.5. Natural Hazard Zoning. ............................................................................................ 82
2.9. Urban Land Transit Circulation and Connectivity ..................................................... 82
2.9.1. Traffic Calming......................................................................................................... 86
2.9.2. Street Section. ........................................................................................................... 88
2.9.3. Bicycle Accommondation......................................................................................... 89
2.9.4. Accessibilty Index..................................................................................................... 89
2.9.5. Parking Standard. ...................................................................................................... 90
2.10. Disaster Management ............................................................................................... 91
2.11. Dimensions of economic vulnerability to Disaster Management ........................... 102
2.11.1. Urban Residents Income, Saving and Consumption in low income neighbourhoods
............................................................................................................................. 104
2.11.2. Urban Residents Employment Opportunities in low income ...... neighbourhoods.
............................................................................................................................. 105
2.11.3. Credit facilities/Loans to Urban Residents in Low Income ..... Neighbourhoods.
............................................................................................................................. 106
2.11.4. Urban Residents Investment in low income neighbourhoods. ............................ 106
2.11.5. The Provision of Urban Services and Green Infrastructure to Urban Residents ... in
Low Income Neighbourhoods. ............................................................................ 108
2.12. The Effects of Land Use Planning on Economic Vulnarability to Disaster
Management in Eldoret Urban Area. ...................................................................... 110
2.12.1. Effect of Land Use Planning Regulatory Instruments on Economic Vulnarability
to Disaster Management. ........................................................................................ 110
2.12.2. Effect of Land Zoning on Economic Vulnarability to Disaster ... Management.
............................................................................................................................. 113
2.12.3 Effect of Land Transit Circulation and Connectivity on Economic Vulnarability to
Disaster Management. ............................................................................................ 114
2.13. Evaluation of Land Use Planning Strategies on Economic Vulnability to Disaster
Management............................................................................................................ 115
2.13.1. Sum Up Grading Strategy. ................................................................................... 115
2.13.2. Mixed Use Development. .................................................................................... 117
2.13.3. Development Corridors........................................................................................ 119
x
2.13.4. Gentrification/Re-development. .......................................................................... 121
2.13.6. Industrial Parks Strategies. .................................................................................. 122
2.14. Evalaution of Land Use Policy Framework on Economic Vulnability to Disasterf
Management in Low Income Neighbourhoods of Eldoret Urban Area.................. 123
2.14.1. Land Tenure Security........................................................................................... 126
2.14.2. Land Administration/Management. ..................................................................... 128
2.14.3. Land Information system, Cadastry system and land registration. ...................... 129
2.15. Empirical Review ................................................................................................... 131
2.16. Research Knowledge Gap ....................................................................................... 146
2.17. Theoretical Framework ........................................................................................... 147
2.17.1 The Classical Economic Theory on Urban Spatial Structure (Making Room
Model) ..................................................................................................................... 148
2.17.2. Risk Reduction Theory (Community-Based Model) ........................................... 151
2.18. Hyogo Framework for Disaster Risk Reduction (2005-2015)................................ 154
2.19. Sendai Framework for Disaster Risk Reduction (2015-2030)................................ 157
2.20. Conceptual Framework for the Study ..................................................................... 158
CHAPTER THREE: RESEARCH DESIGN AND METHODOLOGY .................... 164
3.1 Introduction .............................................................................................................. 164
3.2 The Study Site .......................................................................................................... 164
3.4. Reaserch Study Population ....................................................................................... 166
3.5. Research Design Framework ................................................................................... 169
3.5 Data Collection Methods. ......................................................................................... 171
3.6 Target Population ..................................................................................................... 172
3.7 The Sample Size ....................................................................................................... 173
3.8 Sampling Procedure ................................................................................................. 176
3.9 Data Collection ......................................................................................................... 177
3.9.1 Primary Data Collection ......................................................................................... 178
3.9.2 Secondary Data Collection ..................................................................................... 179
3.9.3 Triangulation ........................................................................................................... 179
3.10. Pilot Study............................................................................................................... 179
3.11. Validity of the Questionnaire .................................................................................. 181
xi
3.12. Reliability of the Questionnaire .............................................................................. 182
3.13. Limitations of the Study ......................................................................................... 183
3.14. Measurement and Scaling of Data .......................................................................... 185
3.15. Materials and Methods............................................................................................ 188
3.16. Analysis of Data...................................................................................................... 189
3.17. Missing Data and Outliers ...................................................................................... 190
3.18. Ethical Considerations ............................................................................................ 191
CHAPTER FOUR: DATA PRESENTATION ANALYSIS AND
INTERPRETATION ............................................................................................. 193
4.1 Overview .................................................................................................................. 193
4.2 Response Rate .......................................................................................................... 193
4.3 Neighbourhoods Demographic Information ............................................................ 195
4.4. Distribution of Respondents Demographic Characteristics in Study Area .............. 201
4.5. Economic Vulnarability to Disaster Management in Low Income Neighourhoods of
Eldoret Urban Area. ................................................................................................ 208
4.5.1 Dimensions of Economic Vulnarability to Disaster Management in Low Income
Neighbourhoods of Eldoret Urban Area. ................................................................ 209
4.5.2 The Mean Scores on Dimensions of Economic Vulnarability to Disaster
Management in Low Income Neighbourhoods of Eldoret Urban Area.................. 212
4.6. Income and Employment (IE) in Low Income Neighbourhoods of EUA. .............. 214
4.8. Urban Residents in Low Income Urban Residents Investment and Financial Credit of
EUA. ...................................................................................................................... 232
4.10. Housing Quality and Quantity (HQQ) .................................................................... 233
4.10. Housing Mobility (HM) .......................................................................................... 237
CHAPTER FIVE: EFFECTS OF LAND USE PLANNING REGULATORY
INSTRUMENTS ON ECONOMIC VULNARABILITY TO DISASTER
MANAGEMENT IN LOW INCOME NEIGHBOURHOODS OF ELDORET
URBAN AREA. ...................................................................................................... 240
5.1. Introduction. ............................................................................................................. 240
5.2. Regulatory Instruments Influence ............................................................................ 245
5.3. Correlation Analysis ................................................................................................. 248
xii
5.4. Multiple Liner Regression Analysis ......................................................................... 250
5.5. Multiple Regression Analysis .................................................................................. 251
5.7 Hypotheses Testing .................................................................................................. 252
CHAPTER SIX: EFFECTS OF URBAN LAND ZONING ON ECONOMIC
VULNARABILITY TO DISASTER MANAGEMENT IN LOW INCOME
NEIGHBOURHOODS OF ELDORET URBAN AREA .................................... 256
6.1 Introduction .............................................................................................................. 256
6.2 Types of Land Use Zoning in Eldoret Urban Area .................................................. 257
6.3 Urban Land Use Zoning Influence ........................................................................... 260
6.4. Results of Correlation Analysis ................................................................................ 266
CHAPTER SEVEN: EFFECTS OF LAND USE TRANSIT CIRCULATION AND
CONNECTIVITY ON ECONOMIC VULNARABILITY TO DISASTER
MANAGEMENT IN LOW INCOME NEIGHBOURHOODS OF ELDORET
URBAN AREA ....................................................................................................... 269
7.1 Introduction .............................................................................................................. 269
7.2 Circulation and Connectivity ................................................................................... 270
7.3 Elements of Circulation and Connectivity ............................................................... 270
7.3. Results of Regression Analysis ................................................................................ 272
CHAPTER EIGHT: SUMMARY, CONCLUSIONS, AND RECOMMENDATIONS
.................................................................................................................................. 276
8.1 Introduction .............................................................................................................. 276
8.2 Summary of the Findings ......................................................................................... 276
8.3. Influence of Urban Land Use Planning Regulatory Instruments on Economic
Vulnarabity to Disaster Management in Low Income Neighbourhoods of Eldoret
Urban Area .............................................................................................................. 278
8.4. Effect of Urban Land Zoning on Economic Vulnarabity to Disaster Management in
Low Income Neighbourhoods of Eldoret Urban Area............................................ 281
8.5. Effects of Urban Land Transit Circulation and Connectivity on Economic
Vulnarability to Disaster Management in Low Income Neighbourhoods of Eldoret
Urban Area .............................................................................................................. 283
8.6. Conclusions .............................................................................................................. 285
xiii
8.6.1 Influence of Urban Land Use Planning Regulatory Instruments on Economic
Vulnarability to Disaster Management in Low Income Neighbourhoods of Eldoret
Urban Area .............................................................................................................. 285
8.6.2 Effect of Urban Land Zoning on Economic Vulnarability to Disaster Management in
Low Income Neighbourhoods of Eldoret Urban Area............................................ 286
8.6.3 Effects of Urban Land Transit Circulation and Connectivity on Economic
Vulnarability to Disaster Management in Low Income Neighbourhoods of Eldoret
Urban Area .............................................................................................................. 287
8.7. Recommendations .................................................................................................... 289
8.7.1 Recommendation one based on the specific objective one..................................... 289
8.7.2 Recommendation two based on specific objective two. ......................................... 289
8.7.3. Recommendation three based on specific Objective three. .................................... 290
8.8. Suggestions for Further Studies ............................................................................... 290
REFERENCES ................................................................................................................ 292
APPENDICES ................................................................................................................. 311
xiv
LIST OF TABLES
Table 3. 1: Research Study Population ............................................................................. 169
Table 3. 2: Research Design Framework and Study Indicators ........................................ 170
Table 3. 3: Sample Size (Based on Stratified Proportional Random Sampling Technique)
........................................................................................................................................... 175
Table 3. 4: Stratified Proportional Random Sampling Technique .................................... 176
Table 3. 5: Pearson Correlations of all Constructs with the overall Economic Vulnarability
to Disaster management (EVDM) (n=481) ....................................................................... 181
Table 3. 6: Reliability & Validity Analysis ....................................................................... 183
Table 5.1: Distribution of Elements of Regulatory Instruments (LUPRI) ........................ 241
Table 5.2: Distribution of Regulatory Instruments Influence ........................................... 245
Table 5.3: Correlations of Overall Variables .................................................................... 249
Table 5.4: Summery of the Regression Model .................................................................. 251
Table 5.5: The Coefficients of Multiple Regression Analysis .......................................... 252
Table 5.6: Effect of Land Use Planning Regulatory Instrument of Urban Land Use
Planning on Economic Vulnarability to disaster management ......................................... 254
Table 6.1: Descriptive Statistics for Types of Urban Land Use Zoning (ULUZ) ............. 257
Table 6.2: Distribution of the Measure of Land Use Zoning Influence ............................ 261
xv
Table 6.3: Relationship between Land Use Zoning and Economic Vulnarability to Disaster
Management ...................................................................................................................... 267
Table 6.4: Descriptive Statistics for Elements of Circulation and Connectivity .............. 270
Table 7.2: Relationship between Connectivity and Circulation (CC) and Economic Vulnarability to
Disaster Management .................................................................................................................... 274
xvi
LIST OF FIGURES
Figure 2. 1: Conceptual Framework Lining Study Variables ........................................... 161
Figure 3. 1: Study Area Map. ............................................................................................ 165
Figure 4. 1: Response Rate of Respondents ...................................................................... 195
Figure 4. 2: Gender of Respondents .................................................................................. 198
Figure 4. 3: Marital Status ................................................................................................. 198
Figure 4. 4: Age Brackets of Respondents. ....................................................................... 199
Figure 4. 5: Highest Level of Education of Respondents.................................................. 199
Figure 4. 6: Household Family Size (No. of Children). .................................................... 200
Figure 4. 7: Head of the Household. ................................................................................. 200
Figure 4. 8: Alternative Sources of Livelihood of Respondents. ...................................... 200
Figure 4.9: Responses Dimensions of Economic Vulnarability to Disaster Management in
Low Income Neighbourhoods of EUA. ......................................................... 210
Figure 4. 10: Distribution of Respondents on Monthly Rent Payable .............................. 216
Figure 4.11: Distribution of Proportion of Sampled Urban Residents Income Spent on
Food ............................................................................................................... 221
Figure 4.12: Distribution of Sub-Location Proportion of Urban Residents Income Spent on
Food ............................................................................................................... 222
xvii
Figure 4.13: Distribution of Respondents Main Sources of Income of Urban Residents. 226
Figure 4.14: Distribution of Respondents Reasons Behind Land Occupation .................. 230

xviii
LIST OF PLATES
Plate 4.1: Housing Structures of Kamukunji Slum Dwelling ........................................... 217
Plate 4.2: Housing at Kapsoya Formal Settlement ............................................................ 219
Plate 4.3: Socioeconomic Activity in Langas Informal Settlement .................................. 227
Plate 4.4: Types of Housing in Kamukunji ....................................................................... 235
Plate 7. 1: Urban Land Use Transit Circulation and Connectivity .................................... 271

xix
LIST OF APPENDICES
APPENDIX 1: HOUSEHOLD QUESTIONNAIRE ........................................................ 311
APPENDIX 2: INTERVIEW PROTOCOL ...................................................................... 324
APPENDIX 3: RESEARCH PERMITS ........................................................................... 325
xx
LIST OF ABBREVIATION AND ACRONYMS
AIDS Acquired Immune Deficiency Syndrome
APHRC African Population and Health Research Center
BCR Building Construction Restrictions
CBD Central Business District
CC Circulation and Connectivity
DRM Disaster Risk Management
DRR Disaster risk reduction
EUA Eldoret Urban Areas
EVDM Economic Vulnarability to Disaster Management
FAO Food and Agriculture Organization
GDP Gross Domestic Product
GOK Government of Kenya
HFA Hyogo Framework for Action
HIV Human Immunodeficiency Virus
LURI Land Use Regulatory Instruments
LUZ Land Use Zoning
NGOs Non-Governmental Organizations
PRSPs Poverty Reduction Strategy Papers
SIDA Swedish International Development cooperation Agency
SIMPLE Sustainable Integrated Management and Planning for Local
Government Ecosystems
xxi
SPSS Scientific Program for Social Statistic
SRI Stanford Research Institute
UK United Kingdom
UN United Nations
UN-Habitat United Nations Human Settlements Programme
UNISDR United Nations International Strategy for Disaster Reduction
UNOCHA UN Office for the Coordination of Humanitarian Affairs
USA United States of America
xxii
OPERATIONAL DEFINITION OF TERMS
Building Code: - set of ordinances or regulations and associated standards intended to
control aspects of design, construction, materials, alteration and occupancy
of structures necessary to ensure human safety and welfare, including
resistance to collapse, damage and fire.
Cadastre System: -land registry which records the land ownership, the tenure, the precise
location, the dimension (area) of individual parcel(s) of land.
Compactness Development: -an urban form that reduces the over exploitation of natural
resources and increase economics of agglomeration, with benefit in terms of
proximity. It is a built-up area, with high density.
Connectivity: - a process of connecting from one area to another. It makes mobility easy
for all means of transportation including walking, bicycles, and will support
livelihood activities.
Densification: -the process of increasing the rate of population in urban area, either by
encouraging compact development, provision of urban services and urban
infrastructure.
Disaster Management: - is the organization and management of resources and
responsibilities for dealing with all humanitarian aspects of emergencies, in
particular preparedness, respose and recovery in order to lessen the impact
of disaster. It aims at saving lives and reducing human suffering; protect
and restore livelihoods and reduce the risks faced by communities when
affected by disaster and conflict.
Disaster Risk Management:-- a process of using administrative decision making,
operational skills and organization capacities to implement strategies,
policies and coping capacities of society, community and households to
lessen the adverse impacts of hazards and possibility of disaster.
Disaster Risk Reduction: -- the practice of reducing disaster risks through systematic
analysis and management of casual factors ofdisasters, including reduced
exposure to hazards, lessened vulnerability of people and property, wise
management of land use and environment, and improved preparedness.
xxiii
Disaster: - is a serious disruption of the functioning of household, community or
society causing widespread human, material, economic, social or
environmental losses, which exceed the ability of the affected household,
community or society to cope with using their own resources.
Economic Exposure: - is a process where by residents of a neighbourhood or country is
exposed to economic shocks. Economic exposure is unexpected changes
which are impossible to predict economically.
Economic Resilience: - is the ability of residents of a meighbourhood or country to do
something about a shock either directly or in economic terms, such as the
ability to use fiscal or monetary stimuli. It could also include governance,
and here we include land use governance.
Economic Vulnarability:-is the exposure of groups or individuals to stress as aresult of
economic factors, where stress refersto unexpected changes and disruption
to livelihoods. The economic vulnerability could be conceptualized in three
strands-poverty dynamics, sustainable livelihood and food security.
Exposure: -the process whereby the households, community or society comes into contact
with an environmental, economic conditions or social influence that has a
harmful or beneficial effect
Formal area: - is an urban area under urban planning. It is serviced land with in urban
area which covers built-up area of an urban area.
Gentrification: - is theprocess of renovating and revival or re-development of deteriorated
urban neighborhood /areas. It means the influx of more affluent
residential/commercial built-up areas which as a result increases property
values and likely to displace low-income families and small businesses.
Hazard:-a natural process or phenomenon, or a substance or a human activity, that can
cause loss of life, injury, and other health impacts, property damage, loss of
livelihoods and services, social and economic disruption or environmental
degradation.
Informal Settlement: - refers to urban areas with both low-income and miudium income ,
with high density, inadequate urban services and inadequate infrastructural
development. It is also characterized with poor land tenure security and
poor quality&quantity housing.
xxiv
Integrated Plan: -plan seeking to bring a lasting improvement in the economic, physical,
social, and environmental conditions of an urban area. It means that all
policies, projects and proposals are considered in relation to one another.
Land Administration: -system and processes to administer land; which includes the
transfer rights in land, from one party to another, through sale, lease, loan,
gift or inheritance; regulating land and property development; the use of and
conservation of land; the collection of revenue and taxation of land and the
resolving of conflicts concerning the ownership and the use of land.
Land Information System: - is a geographic information system for cadastral and land-
mapping. It consists of an accurate and reliable land record cadastre and its
associated attribute and spatial data that represent the legal boundaries of
land tenure. It allows data stewards to retrieve, create, update, store, view,
analyze and publish land information.
Land Tenure Security: - implies enforceable claims on land supported by national
regulatory frameworks. It can be freehold, leasehold, trust land, collective
(i.e., co-operative or condominium tenure).
Land Use Planning: -process of regulating land use in efficient, equitable and sustainable
way, thus avoiding conflicts both in rural and urban development.
Mitigation:- is the process of minimizing the effects of disaster. Examples, building codes
and zoning, vulnerability analysis, public education.
Neighbourhood: - is a geographically located community within a larger city, town
suburban or rural area. Neighbourhoods are often social communities within
considerable face-to-face intergration among members. It is an organization
of children and adults in residential areas as a unit of inclusive
neighbourhood, aiming at creating safe, resilient and connected
communities.
Physical Planning: - is an exercise based on a land use plan used to propose the optimal in
infrastructural development for public services, transport, economic
activities, recreation and environmental protection for a settlement or area.
Preparedness: - is a process of planning how to respond. Examples, preparedness plans,
emergency exercises, training and warning system.
Pre-urban Area: -/land in the fringe of an urban area. It is land in the urban boundary
mainly predominated with agricultural activities, but due to high population
xxv
growth, the area is being brought under the built-up area of the urban areas
and urban socioeconomic activities.
Recovery: - is actions taken after a disaster to restore or improve the pre-disaster living
conditions of the affected households, communities, or society while
encouraging and facilitating necessary adjustments to reduce disaster risk.
Returning the community to normal.
Resilience: - the ability of the households, community or society potentially exposed to
hazards to resist, absorb, adapt to, and recover from the stresses of hazard
event, including preservation and restoration of its essential basic structures
and functions.
Response: - is the provision of emergency services and public assistance during and
immediately after disaster to save lives, reduce health impacts, ensure
public safety and meet the basic needs of the affected people. Efforts to
minimize the hazards created by a disaster.
Slum: - means a compact area of poorly built congested tenements, in hygienic
environment usually with inadequate infrastructure and lacking proper
sanitation and drinking water facilities.The issue of tenability of slum needs
clarification. Untenable slums are located along major storm water drains,
railwaylines, major transport alignment, along river banks, other hazardous
and objectionable areas, while, tenable slums are allocated on non-
objectionable & non-hazardous lands.
Spatial Planning: - the process to determine space structure and space pattern that consists
within a region or urban area.
Spatial Structure: -the distribution of space (land) allocation for various development
activities, including residential areas, infrastructural network, commercial
areas, cultivation, or environmental conservation systems, which function as
a support for the society’s social, and economic activities.
Sprawl Development: -fragmented development generally characterized by low-density
settlements that are car dependent and often lack access to public
infrastructure and services.
Vulnerability:-relative lack of capacity of household, community or society or ability of
an asset to resist damage and loss from a hazard. It also means conditions
that increase the susceptibility of a community, household or society to the
xxvi
impact of hazards. It also means the demished capacity of individual or
group to anticipate copewith, resist and recover from the impact of a natural
or man-made hazard.
Vulnerable Groups: -members of group who are exposed to the impact of hazards, such
as displaced people, women, the elderly, the disabled, orphans, children and
any group subject to discrimination..
Warning Systems: -means of persuading people and organizations to take actions to
reduce the impact of hazards.
1
CHAPTER ONE
INTRODUCTION
1.1 Background of the Study
Globally, controlling and dealing with economic vulnerability, especially among the
residents of low-income neighbourhood in urban areas has been recognised as hard and
diffult. In USA, Britain, China, India, Japan, Malaysia, Nigeria, Ghana, Ethiopia and
Kenya among others, dealing with socioeconomic and environmental hazards and
vulnerabilities is a challenge experienced and whose severity is worrying (Bendimerad,
2008). This has left urban residents to experience devastating outcomes and impacts from
inadequate and inequitable socioeconomic and environmental services. Although
regulatory policy and planning processes such as development planning, land-use
planning, natural resource management planning, poverty reduction planning, are
considered critical to disaster management (Action Aid International. 2006; African Union
Commission, 2009).
According to UN-Habitat (2008), over a half of humanity globally now lives in cities,
where they are occupying only 3% of world space or land and by 2050, almost 70% of the
World’s population would be residing in urban areas. This means that effective and
efficient urban land use planning would be critical for improved productivity of urban
basic needs or economic activities. This would enhance provision of green spaces for
future expansions and recreations, residential, commercial, and industrial and other land
uses critical to urban neighbourhood welfare. The practice and the implementation of land
2
use planning would also enhance the possibility of the neighbourhood residents accessing
the serviced land, hence economic activities and therefore be able to built economic
resilience.
Rapidly exploding growth of cities is overwhelming government institutions with the
pressures of urbanization. With cities expanding so rapidly, much of the growth is
haphazard, far exceeding the cities’ capacity to adequately plan and control development.
As a result, uncontrolled urbanization often feeds the growth of slums, reinforces poverty
or economic vulnarabilities in low income neighbourhoods and diminishes cities’ ability to
deal with disasters. The urbanization has taken place without regard to protecting against
extreme hazard events. Faced with the needs to provide housing infrastructure and
services, cities developed haphazardly and often without any formal land use planning
process. Whenever, urban land use planning is applied, their application appears to be
weak and wanting. Migration aggravates the problem by creating large scale informal
construction (Acemoglu, Como, Fagnani, and Ozdaglar, 2013). Migrants also face
significant challenges in adapting their past experience and coping strategies or economic
resilience to the economic shocks in cities.
In urban planning, land use planning seeks to order and regulate land use in an efficient
and ethical way, thus, preventing land use conflicts. It promotes a more desirable social
and environmental outcomes as well as amore efficient use of resources (land).
Governments use land use planning to manage development of land within their
jurisdictions. A land use plan provides a vision for the future possibilities of development
in neighbourhood, districts, cities or any defined planning area (Ore Fika, 2016). Goals of
3
land use planning may include environmental conservation, restraint of urban sprawl,
minimization of transport costs, prevention of land use conclicts, and reduction to exposure
to pollutants. While, the objective land use p[anning is to influence, control or direct
changes in the use of land so that it is dedicated to the most beneficial use,, while
maintaining the quality of the environment and promoting conservation of the land
resources (Rabe & Ore Fike ,2015).
Land use planning was introduced by the colonial governments during colonial period to
bring order and land use efficient in Africa urban areas. This marks the introduction of the
zoning ordinances, the implementation of regulatory instruments. However, the the rapid
urbanization appropriate land use implementation is necessary. A propriate implementation
of land use in urban areas tends to reduce risk in urban areas. Risk in urban areas is a
combination of two factors:- first, location and exposure to hazards; and second, increased
vulnerability due to poor local governance, environmental degradation and the
overtrenching of resources. Therefore, inappropriate land use planning in a neighbourhood
may increase the residents’ vulnerability to disaster. According to IFRC (2016),
vulnerability is the diminishing capacity of an individual or group to anticipate copewith,
resist and recover from the impact of a natural or man-made hazard. Vulnarability is most
often associated with poverty, but it can also arise when people are isolated, insecure and
defenceless in the face of risk, shock or strss (IFRC, 2016). Vulnarability has been used to
describe the state of risk, usually associated with geographical location rather than with
individuals or social groups.

4
However, this study tends to evaluate and examine the economic vulnarabity to three
neighbourhoods in Eldoret Urban Area, with the fourth one one act as a control area of
study.In fact this is concerced with the growth and economic transformation pathways
which is subjected to arane of shocks that would affect economies in varying ways.
Economic vulnerability is the exposure of individual or groups to strss as aresult of
economic and environmental change, where, stress refers to unexpected changes and
disruption to livelihoods. Awang (2001), indenties three strands within the economic
vulnerability in terms of either:- poverty dynamics, sustainable livelihood and food
securirty.
Chambers and Conway (1991), emphasis the livelihood approach. Livelihood comprises
the capabilities, assets (stores, resources, claims and access) and activities required for
ameans of living. Alivelihood is sustainable, when individuals or groups can cope with and
recover from stress and shocks, maintain or enhances it capacities and assets, and provide
provide sustainable livelihood opportunities for the next generation.
In most developing countries, legislative and institutional arrangements inhibit rather than
enable local action. While it is recognized that disasters are initially local events,
accountability, authority and resources are not sufficiently decentralized to enable local
governments to assume ownership and take actions to manage disaster risk effectively.
Furthermore, politicians, administrators, and community leaders all face conflicting
priorities, and household disaster risk management especially, in low-income
neighbourhood almost invariably takes the back seat to other needs which may be
considered more pressing or easier to solve. Risk is not managed preemptively, but thought

5
of in terms of something to be dealt with when disaster strikes, through emergency
response and humanitarian assistance (Bin, & Landry, 2013).
An additional weakness relates to the project planning processes of government. While
concepts are often understood and policies are in place, carrying these policies and
concepts to practice is a major hurdle for governments at all level (Christian Aid, 2014;
Corbyn, 2010). The process of project planning and execution needs to be recognized as a
major weakness if progress in DM has to be achieved. Even among cities which have
shown competency in establishing planning processes to control their physical
development, carrying these planning processes into project planning and execution
remains a challenging step.
DM is a professional practice that still lacks its own set of acceptable standards of practice.
This results in a dispersion of effort and an ineffective use of resources. It also erodes the
political support for local level action on DM. Providing tools to enable translating
national policies into mainstreaming planning processes at the local level would help cities
in understanding the options that are available to them for managing risks and for planning
and implementing urban DM (Fagiolo, and Roventini, 2012).
It implies that most urban areas prone to hazards and vulnerable to socioeconomic and
environmental problems exposing residents of urban neighbourhood to disaster risks. The
practice to most urban areas is to build in flood prone areas, set up structures in river
banks, on top of electricity lines, under high voltage power lines, deep inside the sea
without fear of disasters risks. These urban areas lack adequate practices that prevent
hazards and vulnerabilities from becoming risks that cause disasters. This is the case in
6
slum areas, informal settlements or per-urban areas where income appears to be low and
therefore, the residents could not afford serviced urban land.
Globally, the rapid and often growing population together with rising urban areas is
recognized as a threat to a greater number of people, environmental health and
socioeconomic assets, which are exposed to the risk of disasters. These urban areas lack
adequate practices that prevent hazards and risks from causing disasters. Protecting rising
urban residents from automatic exposure to high risks whose outcomes and impacts are
disastrous is a desired goal but not yet realised. In fact, economic exposure is occurring in
urban neighbourhood especially, of low-income settlements of slums, and informal
settlements. This has exerted pressure on available urban land sizes whose proportion is
smaller compared to the population supported. So building safer and secure cities from
land size of 3% to support population size of more than 60% is a concern. The urban
authorities together with its household population are worried of the increasing number of
disasters most of which are preventable.
Although it has been widely acknowledged that regional economies and land use are
highly interrelated, little is known about how a change or intervention in land use may
influence the economic vulnarabilities to disaster management of low-icome residents in
urban neighbourhood in major cities. In the field of urban and regional planning, the
interactions between land use planning and economic vulnarabity to disaster management
have traditionally been considered from a top down perspective; that is, land use planning
and economic vulnarabity to disaster management structural changes are assumed to have
significant effects on land use and the spatial structure of the region. However, bottom up
7
connections are rarely considered. This lack of appreciation of the bottom up impacts may
limit current land use planning practices and decision making. It might also lead to
unintended conflicts between land use planning and economic development.
The evidence emerging from recent experience makes a compelling case for a radical shift
away from narrowly focused development approaches towards a major new emphasis on
community resilience or neighbourhood resilience and disaster management. Floods which
are caused by swelling rivers in the catchment areas of neighboring countries, floods from
cyclones, storm surges, earthquakes, fires and other such events, when combined with
social and economic vulnerabilities, and added to environmental depletion, can multiply
the shocks from disasters and lead to crippling economic losses. Moreover, the risks posed
by the regional effects of climate change require considerable adaptation by the exposed
populations. But at the same time, governments in vulnerable countries are faced by hard
budget choices, which make major investments in emergency preparedness usefully very
difficult (IFRC, 2012).
Urban land use practices that will attract and woo socioeconomic and environmental
activities to create employment opportunities, sources of income, quality and quantity
housing, enhanced housing mobility, availability and accessibility to investment and
financial credits are missing. Although these are basic important resources any population
would require to build its economic resilience, coping ability and capacity to protect,
prevent and become resilient to recover from any disaster events whenever they occur.
Given that land as a significant socioeconomic and environmental resource, its relationship
to man and other development activities must be critically considered. And because of its
8
scarcity, the rising urban population and increasing urban growth and development highly
depend on creating a competition that surrounds human live. It implies that its scarcity
requires practices that strategically improve its productivity, adequately, equitably and
sustainability (Morales, 2014). This can be source of conflicts and disputes that occur
during the space or land use allocation both in rural as well as in urban areas. This becomes
even severe in urban areas which have been registering influx of migrants and natural
population growth (Rabe, 2014).
The year 2008 marked the first time in history where more people lived in urban centers
than in the rural regions. Since the beginning of 2008, more people lived in urban centers
than outside of them with majority lacking the basic needs. The anticipated urban
population swell to 5.3 billion by 2030, will continue to be potential victims of disasters
whose outcomes and impacts are devastating. This means that effective and efficient urban
land uses are critical for improved productivity of urban basic needs. This would enhance
provision of greenspaces for future expansions and recreations, residential commercial, and
industrial and other land uses critical to urban residents welfare. Approaches and tools that
study and map, analyse economic, environmental and hazard data; formulation of
alternative development decisions; and design of long-range plans for different
geographical and administrative scales are critical.
In America for example, many Americans would live nowhere but a city. They consider
cities to arouse strong opinions, pro and con, because there are many things both to like
and to dislike about cities (Metternicht, 2017). Yet cities are now homes to disasters from
risk causing hazards. These hazards lead to disasters whose outcomes and impacts are

9
extremely devastating to majority of urban residents. This trend is the same in India,
China, Japan, Germany, UK, and other countries (Putman, 2010). Nearly all of the
population growth in the world will be in urban areas in the next few decades, especially in
low-and middle-income countries. It is a move that if not checked, then abnormal
population density rates on fixed small urban land sizes will cause further harm than good.
Moreover, high economic vulnerability level to disasters of urban population especially in
low-income neighbourhoods indicate that more people are prone to devastating disaster
outcomes and impacts (Alberto, 2013).
The cause for rural urban migration is in search for alternative and better living standards.
But how to strike a balance between desire to achieve socioeconomic and environmental
development and other human lives desires is the challenge. Even urban authorities
mandated to implement land use practices with buildings, infrastructures, services and
management of urban expansion that can automatically cope with any form of disasters, for
example storms, fires, busting raw sewer lines, floods or earthquakes have failed to
adequately and equitably achieve this. So most urban population, the over 60% are left to
face frequent disasters risks. But the migrants end up experiencing employment shortages,
with large number of people concentrated on fragile lands, making reduction of
vulnerability, and coping ability to disasters in urban areas a mission impossible (Eerrd,
2008). The determination to satisfy each expectations of more than 70% of world
population that has migrated to urban areas using only 9% available urban land proves
difficult This land size in its fixed distribution feature cannot be affected but only
improved in productivity, including practices that enhance multiple and balanced uses
(Gaube and Remesch, 2013).
10
Urban land use practices that provide adequate greenspaces, adequate circulation and
connectivity, that accommodate primary and alternative transportation modes critical
during emergencies are considered important but seems lacking. For example, during
emergency evacuations from floods, fire outbreaks, landslides, and collapsing buildings
among common urban disasters become difficult. In USA, the terrorist attacks of
September 11, 2001, and the televised images of traffic jams stretching for miles as
Hurricanes Rita and Katrina of 2004 and 2005 approached the Gulf Coast earlier this year
brought home once again the difficulty of evacuating large urban areas (Shekhar, 2005).
Mass evacuations are among the most difficult challenges faced by transportation
professionals, but planning for a complete evacuation of a specific city is difficult because
such evacuations are only rarely necessary. Such damaging hurricane focused attention on
the nation’s capacity to respond to emergencies and evacuate its citizenry in a safe and
timely manner. Transportation professionals are part of emergency management teams in
some urban areas, but the potential for transportation in general and transit in particular to
play a more significant role in emergency response and evacuation is far from being
realized (Shekhar, 2005; TRB, 2008).
Most emerging growing urban areas are densely populated. The disparities in
socioeconomic status are visible in disaster management process. Those residents with
high income have low densities compared to low income residents. For example, in estates
such as Elgon View in Eldoret, Laving’ton, Kileleshwa, Runda, there are four persons
occupying an hectare while in Kawangware, Kibera, Kariobangi, Mthare and Mukuru,
Kipkaren, Brigadier, Huruma, Langas, and Maili Nne, low income tenements go up to 800
persons per hectare (Khayesi, 2007; Coulombel, 2010). But densely-populated regions are

11
among the highest at risk of disasters and health-related emergency, yet little is known
about risk coping and supportive strategies to urban residents. In such cases households are
often ill-equipped to cope with disaster and evacuation, regardless of their susceptibility to
threat. Household and individual preparedness is critical to the overall effectiveness and
cost-efficiency of national disaster response strategy. Moreover, urban households with the
lowest incomes, lack employment, no investment assets, lack high level of housing
mobility, live in poor quality housing that face among the highest risks of disasters in
urban areas (Chan, Yue, Lee, and Wang, 2016).
These low quality housing are prone to collapsing, frequent fires, floods, bursting and open
raw sewer lines, unhygienic features with sizes unsuitable for large number of occupants.
In general these buildings have bad conditions not qualified for occupancy yet most urban
residents continue to occupy these hazardous facilities. This is true in most informal
settlement and slum areas which are considered highly volatile to violence with many
hotspots for violent activities. These are behaviours that cannot attract and woo serious
large scale investment that would create employment in these areas. While in the informal
sector more than 75% are actively involved out of which some 49% of slum dwellers are
either regular or casual job seekers. Hence for them to survive in city life, about 19% are
household enterprises with 26% considered unemployed. This rate of unemployment
account largely on the youth and women where 46% of youth & 49% of women
unemployed. This translates into more than 70% of the city’s slum dwellers who are living
below poverty line; up from 26% (1992). This means that poverty itself is a disaster that
needs to be fought in order to deal with poverty related disaster risks and improve urban
resdents wellbeing (Gunjal, 2016).
12
According to Baker, (2012), by the middle of the 21st century, the total urban population of
the developing world will double, increasing from 2.3 billion in 2005 to 5.3 billion in
2050. It implies that urban space is therefore, an issue which concerns both the rich and the
poor. But the poor cannot afford the amount and quality of land uses by wealthy people.
However, both the poor and the rich essentially and constantly use space for standing,
sitting, walking or putting things on the ground (Davy, 2007). According to Smolka
(2012), urban residents need to understand and be aware of space they own exclusively and
the one they have rights to use even though they do not own the space. Thus, the issue of
urban land accessibility and affordability is a reality to every urban residents residing in
city or urban area.
Demographic, environmental, economic, social spatial and institutional are considered as
current and future challenges threatening development of sustainable cities (UN-Habitat
Report, 2009). These challenges have resulted in emerging new spatial configuration or
structure, which includes the spread of risky slums, informal settlements and pre-urban
growth in global cities, from hazards exposures leading to eventual disasters. These
hazards include floods, landslide, fire, low standard of living, living below poverty line,
evictions, unhygienic environment, high rate of illiteracy, unemployment, inadequate
credit facilities as well as inadequate business opportunities (Shaw, 2012). The urban land
use in these spatial forms are not organized, exposing residents to risky hazard prone zones
that threatens the residents in these areas who are likely to experience disaster risks. The
lack of infrastructure and services, unsafe housing, inadequate and poor health services can
turn natural hazard into disaster. There are also the man-made hazards caused by poor
regulation of construction and building practices in urban areas (Reuters, 2000). The most
13
vulnerable groups, typically living in poverty, tend to settle and build homes in unsafe
(informal-slum) neighbourhood and are without adequate provision of infrastructure and
critical services. The urban poor are particularly vulnerable to climate change and natural
hazards due to their location within cities, and therefore lack reliable basic services
(UNISDR, 2015).
Land use planning, in African continent was introduced by the colonial rulers through the
urban planning. But in Africa continent, the land use planning, especially, its instruments
or tools need re-evaluation (Payne, 2011). This is because all these were introduced by the
colonial masters during the colonial rule and therefore, might not be appropriate in
directing land use planning in Africa cities or towns today. Different types of production
and economic activities require different spaces; thus, more diversified economies will
have a wider diversity of economic spaces. Thus, it is through land use planning, that, the
urban areas or forms would be able to provide a competitive, quantity and quality suitable
space or land in appropriate locations, to match the needs of emerging economy which
shall assist the urban residents to manage disaster hazard risks amongst them.
According to (UN-Habitat, 2010), by 2030, the global urban population will be 8 billion,
out of which 3.4 billion shall be living in slums and informal settlements. In the three
urban forms of slums, informal settlements and pre-urban areas, the main cause of disaster
risks is the lack of serviced land, land security which exposes the urban residents to
physical and market evictions as well as inappropriate management of urban land spatial
structure elements. In the vast majority of sub-Saharan African cities, as well as in Kenyan
urban centers, the urban poor as well as large segments of low and middle-income groups
14
do not have access to land provided by the public and formal Private Sector (Durand,
2005). This has been evidence in many Kenyan urban areas including Eldoret Urban Area
(Eldoret Municipal Strategic Development Plan, 2012).
In Eldoret Urban Areas, the slum areas, informal settlements and pre -urban areas are
unplanned and therefore, make it difficult to access serviced land, services and
infrastructures, thus enhance disaster risk hazards among the urban residents in these
spatial forms or structure. Most of urban residents’ in these areas do not also have any
form of land security. And whenever the serviced urban land is available, the issue of
affordability arises. Because of high prices of urban land, most vulnerable households
cannot afford them; therefore, the only option available to them is to occupy the unserviced
urban land in the slum, informal settlements and pre-urban areas which are fragile and
exposed to disaster hazard risks. The land is poor in terms of topography such as wetlands,
land under electricity voltage, which are all disaster risk exposed (Eldoret Municipal
Strategic Development Plan, 2012).
During disaster occurrences, most urban residents depend on well-wishers whenever, a
disaster strikes. When a building collapses, fire breaks out, floods or any other hazards is
triggered causing disasters, donations of foodstuffs, beddings, temporary shelters (Tents),
are common practices (Putman, 2010; Coulombel, 2010). An indication that most practices
still rely on relief distribution instead of providing urban residents with the capacity to
develop their economic potential, and attract business and capital. Equally disturbing is
that well-wishers without well-organized patterns are disaster of its kind (Hunte, 2010;
Khayesi, 2007).
15
This is because most of urban areas are experiencing employment shortages, with large
number of people concentrated on fragile lands, making reduction of vulnerability, and
coping ability to disasters in metropolitan areas a critical challenge facing development.
The determination to satisfy each expectations of more than 70% of world population that
has migrated to urban areas using only 9% available urban land proves difficult This land
size in its fixed distribution feature cannot be affected but only improved in productivity,
including practices that enhance multiple and balanced uses (Gaube V. and Remesch A.,
2013).
The outcomes and impacts of such expriences among the urban residents are devastating
and disrupt livelihoods, cause loss of human lives and damages to properties and
infrastructure. While this is the common practice, consequence of disasters are felt among
urban residents without immediate solutions. In a rapidly urbanising world where
population growth has remained high, greater numbers of people than ever before in
human history are moving to towns and cities, many of which are sited in hazard prone
areas where new residents lack local knowledge (Galland, 2012).
Also human interaction with and other elements determine level of hazard disturbance and
risk level interference. So it is upon man and his environmental reactions to minimize
hazards and risks from turning into disasters. This has been paralleled in the disaster
management sector by a shift from seeing disasters as extreme events created by natural
forces, to viewing them as manifestations of unresolved development problems. This has
led to increased emphasis on integration of poverty reduction programs with other sectoral
issues such as environmental management, better land use, gender and public health.
16
Instead of designing and developing urban areas where hazards are not triggered to react
and risks are minimized leading to no disaster occurrences, many urban residents are
commonly with increased disasters. Worrying is the rising urban population indicating that
when urban disaster occur, the casualties would also grow. Since 1900 there has been an
increase in the numbers of disasters with an even greater increase in the physical,
economic, social, environment and human costs of these events (King, Harwood, Cottrell,
Gurtner, and Firdaus, 2013). In some countries, the numbers of people affected by disasters
have increased comparably, but numbers of deaths have diminished, but this is not the case
in most countries such as Kenya, Nigeria, Indonesia, India, and Philippines among others
(King, et. al., 2013).
Although the understanding of such provisions, would provide a guide for planning and
implementing alternative modes of travel to afford greater accessibility for residents and
visitors, mitigate congestions and pollution, and support a more efficient and sustainable
land use pattern. Transition to a more complete multi-modal transportation system requires
an integrated land use and transportation planning approach which has always been
inadequate. The planned transportation system shall support the City’s vision for a land use
pattern with concentrated mixed-use Village Centers and neighborhoods (Rabe, 2014).
Transportation access is the heart of a successful mixed-use development pattern, where
more intense growth occurs around major roadways and transit facilities. Yet most of the
urban areas continue to lag behind achievement of improved properly connected and
circulated cities with all modes of transportation. Although achievement of this would
enhance business transactions increase, its inadequacy denies urban residents chances to
17
experience rapid business outcomes. A condition that denies them stable sources of
income, from which consumption and savings can be derived. This would cause
households to be vulnerable, lack capacity and coping ability to disasters (Chambers,
2004).
Furthermore, it is recognized that better connectivity and circulation outside cities. Yet the
resultant cities consist of informal and unplanned structures that lacks accessibility is a
common trend. Most urban areas consist of slums as that lack accessibility leading to
vulnerability and capacity of the urban residents in these areas. Travel in these cities is
dramatically very poor and disproportionate with anticipated population growth in the
region. These cities have failed to keep pace with growing urban population and desired
sustainable growth and economic development. When a disaster such as fire, floods, and
any event that require urgent attention, the areas are disconnected, fire fighting engines
cannot reach them, leading to unnecessary outcomes impacts. Deaths, property damages,
economic losses that would otherwise have been reduced, rises to higher and unimaginable
levels.
Sprawling slums and squatter settlements, uncontrolled skyrocketing housing in wrong
areas, street family life are common practice. This leads to difficulty of access to essential
services such as greenspaces, roads, safe electricity and water and sanitation are inadequate
if not lacking totally (Putman, 2010). If the current urban residents are experiencing
various challenges now, then only miracle would save the anticipated urban population of
2050 (Putman, 2010).
18
Changing demographics, changing lifestyles, disaster mitigation, transportation choices,
housing choices, energy conservation and green infrastructure are some of the current
challenges urban authorities struggle to balance. Balancing urban land use and achieving
the coordinated and harmonious development of cities and their environs are becoming
difficult to realize. The intention to balance the property rights of owners expanding their
use with the property rights of surrounding owners. Further, the intention to promote
efficiency and economy in the process of development including, adequate provision for
public facilities and services and balancing land use with the transportation system; the
promotion of safety from fire, flood waters, and other dangers; adequate provision for light
and air, distribution of population, affordable housing; the promotion of good civic design
and arrangement; efficient expenditure of public funds; and the promotion of energy
conservation.
Although the expectation of any urban region is an area with demarcated residential,
commercial, industrial, and agricultural and any other classification useful for the urban
residents, most urban areas indicate outcome without any formal direction. One cannot
identify an area left for future urban expansion, road reserves, nature and types of housing
of specific areas. The outcomes are urban areas without rules typical of permission of a list
of land uses. While rules such as a series of specific standards governing lot size, building
height, and required yard and setback provisions, are critical to guide the construction of
housing, what is experienced in towns does not indicate a guided practice. For example, in
Kenya, the requirement is to land owners must not use land reserves and for any land user
around road areas, leave 6 meters for any expansion. But the outcomes are buildings or
investments in road reserves, or deep inside the road 6 metre rule (Musyka, 2004). SThis
19
goes against the sole reason of ensuring protection of flights security. Thus in spite of what
is often a dire need for proper land use to reduce disaster risks, land use and development
planning and practices that support good use are limited or non-existent.
The difficulty faced in urban areas include common practices such as digging up already
made facilities, for example roads, to lay additional sewer pipe, power lines, water pipes,
fibre optic communication lines. This lea ds to destruction to already made roads, sewer
paths, power lines and houses among others. This is an indication of the high degree of
disorderly and phased development patterns that would also be less expensive for urban
population cannot be realized. Moreover, desire to achieve public services and low-density
(Eldoret Municipal Strategic Development Plan, 2012).
1.2 Statement of the Problem
Urban areas continue to be the hotbed of socioeconomic and environmental disasters. The
urban residents in low income neighbourhoods Worldwide, faces economic vulnerability to
disaster management due to difficulties to acquire serviced land. The rapid urban
expansion, rapid urban population and rapid slum growth and informal settlements are
being experienced in the world, as a result of rural-urban migration and natural population
growth. According to UN-Habitat, (2008), more than ahalf of World population lives in
urban areas by 2005, and by 2030, World population would be 8 billion out whch 70%
would be living in urban areas yet 3.4.billion would be living in slums and informal
settlements areas. The same is applicable in African cities too, and particularly in Kenyan
cities. A study by Obundho (2004) indicates that population in Eldoret Urban Area (EUA)
20
since 1963 has been growing at 6%, yet urban space or land remains constant 147 sq. km
as per 2009 Kenya Population census.
Most slum and informal settlement areas such as Langas, Kamkunji, and Hururma of
Eldoret, tends to have low-income, high rates of unemployment, and people lives under
hazardous conditions such as poverty, poor health, polluted surroundings, poor waste
management, faulty electric installation, destruction of sewer lines and underground
telecommunication, power, water and sewer lines, fire destructions, falling and sinking
buildings, floods, droughts, are increasing in frequency and severity. This is a poverty
developing environment exposing urban residents to all sorts of poverty related disasters.
Inability to afford quality and quantity housing, acquisition and ownership of assets that
are collateral for financial credit instruments would be lacking in this low-income
neighourhoods. The inadequate and inequitable infrastructural facilities and lack of green
space in most urban neighbourhoods discourages socioeconomic and environmental
development and growth of investments, linkages to other regions, business opportunities
and emergency management, especially in slum and informal settlement areas. These have
caused the urban residents to be experiencing economic vulnerability.
Therefore, to curb the rapid urbanization and expanding population in cities, a proper
resorce management, especially land becomes a necessity, land use planning.The urban
land use planning which was introduced by colonial governments in Africa in the nineteeth
century, was meant to bring order and efficiency in land use by urban residents in
upcoming cities and urban neighbourhoods. However, in Eldoret Urban Area, the
authorities and institutions meant to implement these instruments appears to be weak and
21
inefficient, making even planning in formal structure neighourhoods rather inadequate. For
example Kapsoya a formal area which serves as control or reference point these planning
tools have been inadequately implementd. This is evidenced by unnecessary building
heights as opposed to Kapsoya neighbourhood. In Eldoret Urban Area, encroachment by
private developers into road reserves, recreational spaces, riparian areas, water runoff
paths, uncontrolled building heights and sizes among others is rampant. For example,
Kapsoya (a formal spatial structure) that was planned to have specific types of housing
structures has failed to maintain this plan, and today developers establish their own
patterns. This has led to congestion, overcrowding, lack of clean water, access roads, that
when fire occurs, total destruction of properties and deaths casualties is expected. The
problem in the study area is that the planning authority within Eldoret Municipality or
Uashin Gishu County appears to be ineffective and therefore, unable to implement land use
regulatory instruments effectively in amanner to influence the economic vulnarabilities of
urban residents residing on slums, informal settlements and per-urban areas of Eldoret
neighbourhood. As such this has resulted in urban residents continue to experience low-
income, unemployment, inadequate urban services, poor infrastructures, poor quality and
quantity housing in these slums and informal settlements in Eldoret Urban Area.
Therefore, this study sort to evaluate and examine the influences of urban land use
planning regulatory instruments, urban land use zoning and urban land use transit
connectivity and circulations in managing urban land use risks and urban land use hazards
to moderate or reduce economic vulnerability to disaster management in Eldoret Urban
Area.
22
1.3 Purpose of the Study
The purpose of this study was to explore the urban land use planning practices
effectiveness in disaster risk management in Kenyan urban areas, the study focuses on
Langas, Kapsoya, Kamkunji and Kapsaos in Uasin Gishu County. These spatial structures,
slums, informal settlements and the pre-urban areas challenges and experienced are
indicators of suffering urban residents undergo, that probably emphasis the needs of land
use planning to change the whole situation for a better urban area land uses and urban
residents livelihood. The study uses urban land use transit Circulation and Connectivity,
urbanland use zoning, and urban land use planning regulatory instruments as exploratory
variables, while urban residents income, employment, investment and credit facilities,
socio-economic services and housing quantity and quality as dependent variable.
1.4 Research Objectives
The overall objective was to evaluate the effect of land use planning on economic
vulnerability to disaster management in low income neighbourhoods of Eldoret Urban
Area with a view to determine the best urban land use planning strategies and policies that
can minimize urban residents economic vulnerability to management in low income
neighbourhoods of Eldoret Urban Area. The specific objectives of the study were:-
i. To establish the influence of Land Use Planning Regulatory Instruments on
Economic Vulnarability to Disaster management in low income neighbourhoods of
Eldoret Urban Area
23
ii. To determine the effect of Land use Zoning on Economic Vulnarability to Disaster
management in low income neighbourhoods of Eldoret Urban Area
iii. To examine the influence of Land Use Transit Circulation and Connectivity on
Economic Vulnarability to Disaster management in low income neighbourhoods of
Eldoret Urban Area
1.5 Research Hypotheses
The three research hypothesis that were tested in this study involved testing the
relationship between the effect of land use planning on economic vulnerability to disaster
management in low income neighbourhoods of Eldoret Urban Area. In fact, the three
aspects of hypotheses indicate only the null.
H1: There is no significant relationship between urban land use planning regulatory
instruments and economic vulnerability to disaster management in low income
neighbourhoods of Eldoret Urban Area.
H02: There is no significant relationship between land use zoning and economic
vulnability to disaster management in low income neighbourhoods of Eldoret
Urban Area.
H03: There is no significant relationship between land use transist circulation &
connectivity and economic vulnerability to disaster management in low income
neighbourhoods of Eldoret Urban Area.
24
1.6 Justification
The Eldoret Urban Area land spatial structure expansion is characterized by inadequate and
low quality services in terms of inadequate water facilities, electricity, sewage system,
drainage, sanitation facilities, housing, open spaces, inadequate infrastructure and lack of
serviced urban land as well as transport facilities. Therefore, majority of urban residents in
the low income neighbourhoods are subjected to urban poverty, unhealthy or unhygienic
living and environmental conditions, hence, urban residents are exposed to disaster hazard
risks. The urban poor, especially in the slum areas, informal settlements and pre-urban
areas are subjected to evictions, flash floods, fire, diseases, unhealthy environment, mud-
slides and poor quantity and quality housing. The urban residents in low income
neighbourhoods in EUA, especially, in slums, and informal settlements are also subjected
to urban land market distortion and poor urban land spatial structure elements.
Subsequently, these urban residents in slums and informal settlements, tends to occupy
disaster risk prone areas, which are vulnerable to both natural and manmade disaster risks
of flood, mudslide and fire and extra , hence, enhances urban poverty to these residents.
Urban land use planning, therefore, is required to address land issues, especially, land
spatial structure, and land planning instruments. This will enables the urban residents to
stimulate economic activities of the urban poor, by providing services, infrastructures,
open spaces, urban development corridors, urban development nodes, industrial and
commercial parks and transport facilities to enable the households build capacity to cope
with disaster resilience, hence sustainable livelihood. Therefore, this study is justified to
contribute towards generating research data and findings which could be used by the policy
25
makers to formulate policies, strategies which are likely to improve land use institutions,
land administration/ management, land use instruments, to assist in disaster risks reduction
among the urban residents in Eldoret Urban Areas, and in turn could be applied in any
other urban area in Kenya.
1.7 The Scope of the Study
This research is to investigate and examine urban land use planning regulatory
instruments, urban land zoning and urban land transit connectivity & circulation and how
these indicators affect the economic vulnarabilities or variables (income & employment,
urban services, credit facilities& investment and quantity & quality housing, and housing
mobility ), of the low income neighbourhoods in Eldoret Urban Area and how this enable
them create and build capacity to cope with disaster risk hazards, hence reduced disaster
risks and therefore, enjoy sustainable livelihood, enhances their poverty dynamic and food
security. The study covered the period from 2000 to 2016. The study was conducted in the
former Eldoret Municipality (Eldoret Urban Area), where the research concentrated mainly
in the low-income neighbourhoods of informal settlement of Langas estate, slum area of
Kamukunji estate, pre-urban area of Kapsaos area, where land use planning were minimal.
However, the study also paid due attention on land use planning activities in the formal
area of Kapsoya estate as control area.
1.8 Assumptions of the Study
The study assumption is that the urban residents would always attempt to access and
occupy serviced land free from hazardous aspect and that the urban authority by
26
developing and implementing land use planning regulatory instruments, urban zoning and
transit connectivity and circulation would enable urban residents to achieve their goal.
However, due to weak institutions, and weak land law and poor regulation enforcement by
urban authority, urban residents in slums, informal settlements and pre-urban areas end-up
occupying hazardous areas, and poor housing, inadequate urban services &infrastructures
exposing themselves to disaster risks That the respondents were available to give required
information without fear. That the findings of the study would be generalized for the urban
and cities land use planning in relationship to economic vulnerability to disaster
management throughout the country and other regions.
27
CHAPTER TWO
LITERATURE REVIEW
2.1 Introduction
The aim of this chapter was to report on the review of literature related to the research
topic, The Effect of Land Use Planning on Economic Vulnarability to Disaster
Management in Low Income Neighbourhoods of Eldoret Urban Area, Kenya. This chapter
discusses land use planning regulatory instruments, land zoning, land transit circulation
and connectivity dimensions, the relevant theories to guide the study such as the classic
economic spatial structure theory (making room model), and disaster risk reduction theory
(community based model), as well as conceptual framework. The chapter also discussed
the knowledge gap on the subject matter and further reviewed policy documents stipulating
the implementation of programmes of interventions to disaster management in urban low
income neighbourhoods populations, while discussing the strategies of interventions
integrated in disaster management resilience regarding the urban population.
2.2 Planning and Urban Land Use Concept
2.2.1. Planning Concept.
Planning as aconcept refers to the process of deciding what to do and how to do it.
Planning occurs at many levels, from day to day decisions made by indivuals and families,
to complex decisions made by businesses and governments. Planners are professionals
who facilitate decision making. Planners do not make decisions themselves; rather, they
28
support decisions makers (managers, public officials, citizens) by coordinating information
and activities. Their role is to create alogical, systematic decision making process that
results in the best actions (Payne, 2006).
Good planning requires a methodical process that clearly defines the steps that lead to
optimal solutions. This process should reflect the following principles:- comprehensive,
efficient inclusive, informative, integrated logical and transparent.
2.2.2. Urban Land Use Concept.
Land use planning is a concept that guides development and re-development in an orderly
manner and goes on to ensure a balanced growth with preservation of the community’s
assets. It should aid and designates the location and utilization of private and public space
for example, residential, commercial, industrial and public utilities such as education,
health facilities, recreation, open space and at the same time determines the density and
intensity for land use categories. The aim is to foster growth in any urban areas’ economy
with thriving neighborhoods that are integrated with, and highly accessible to, good jobs,
stable income, investment opportunities, shopping, amenities and recreation.
According to Trond and Elco (2017) urban land use planning considers managing
residential growth, striving for economic development, and influencing thoughtful land use
decisions in the urban area and beyond. The urban residents believe in achieving a
balanced and accessible urban community with educational excellence, safe
neighborhoods, and a strong business community. To this end, the citizenry encourages
growth in a pattern consisting of a collection of community villages, each anchored by
29
mixed-use village centers along transit corridors with concentrated shopping, employment,
a variety of housing choices, and amenities.
Land use planning involves activities that man pursues on the environment that determine
his destruction or construction on the environment. Land is an important though scarce
resource. The wise land uses assure sustainable future survival of man. From the urban
development perspective, land is a resource that greatly determines how cities work; it is
strategic for improving their productivity, equality and sustainability (Durand-Lessrver,
2014). Hence conflicts and disputes are bound to occur during the space or land use
allocation both in rural as well as in urban areas. This becomes more severe in urban areas
which have been registering influx of migrants and natural population growth.
According to available literature, controlling disaster risks in urban areas is an
experiencing challenge. The desire is to create urban areas with a balanced use, separation
of uses, cities where authorities and inhabitants to interact with urban land resource. A
balanced land uses, and separation of uses among others, are anticipated from this
interaction. The drive is to have prepared urban residents capable to recover, and progress
forward when disasters occur. This leads to a desire to build urban areas that provide urban
residents with stable income, employment, able to invest in stable and sustainable socio-
economic sectors, strong household mobility, have improving quantity and quality housing
(Todo, Nakajima, and Matous, 2015).
But disasters have always been experienced in urban areas as a result of human interaction
with nature, technology and other living entities. At the same time, the drive to create
integrated, inclusive, and reflective urban development remain valid but not pursued.
30
Although this interaction is anticipated to support current and future urban growth patterns,
inadequate resources are normally the challenge experienced. Even establishing measures
that if undertaken can promote sustainable development is a difficult achievement in most
urban areas. This has denied the authorities having practices that provide the basis for
stable and sustainable livelihoods, wellbeing and improved living standards. Likewise,
achieving the four fundamentals objects of urban areas proves difficult. These fundamental
objects or ideals are beauty, convenience, environment and health. Equally important is
that these urban areas are rapidly expanding, which presents a host of challenges for urban
local bodies. The need to provide more affordable land, infrastructure, and housing; to
create economic opportunities for all sections of the population; and to deliver basic
services in an efficient and cost-effective manner is equally important but difficult to
realize. Most urban areas struggle with the desire to use scarce land resource to provide
growing demands for services desired by urban residents. This means that innovative,
creative, and sustainable strategies are needed to ensure improved productivity of the
scarce urban land compared to the population proportion. Furthermore, these areas are
engaged in practices that equip urban areas to be disaster free or safe. The main focus of
most of these cities is to ensure urban residents are resilient to recovery, and are not
vulnerable to any disasters (Scrieciu, Barker, and Ackerman, 2013).
But one of the most enduring physical manifestations of social exclusion in African cities
is the proliferation of slums and informal settlements. The outcomes and impacts are high
rate of population density, poor sanitation, unclean water, unplanned sprawling structures
in form of shacks, malnutrition and high rate of poverty (Taupo, and Noy, 2016). Urban
populations living in slum and informal settlements experience the most deplorable living
31
and environmental conditions, which are characterized by inadequate water supply, squalid
conditions of environmental sanitation, breakdown or non-existence of waste disposal
arrangements, overcrowded and dilapidated habitation, hazardous location, insecurity, and
vulnerability to serious health risks. Slum residents are also excluded from participating in
the economic, social, political and cultural spheres of the city all of which create and
nurture capabilities (Wisner et al., 2004; Shepard et al., 2013).
Instead of using policy, investments, and capacity to convert urban scarce land into
productive and sustainable resource, the outcomes are increased exposure and vulnerability
of urban residents and their assets to disasters. For example, in many cases, infrastructure
is located in flood-prone areas; schools and hospitals are not constructed according to
specifications to be resilient to floods, and new real estate development takes place over
wetlands, thereby obstructing their natural drainage-related functions. Although it is
understood that urban land use management processes such as land use planning,
development control, Greenfield development, and urban redevelopment can play an
important role in reducing disaster risk, their inadequate application makes it difficult to
prove whether they are effective methods. Moreover, the county governments are denied
opportunities to make valid practices to have productive, innovative and creative urban
areas.
Practices that pursue understanding interaction between hazards and urban growth patterns
are critical. This can provide basis of evaluating how disasters interact with existing and
future urban growth patterns enabling designing a combination of measures that minimize
such risks, for example, developing spatial growth strategies to direct development away
32
from inundation-prone floodplains. Apart from that, the drive to discourage development
in areas with high liquefaction potential in the event of a disaster will also be possible.
Moreover, identifying Greenfield site can disclose disaster risk information. This will
allow potential private investors to be better informed of the need to adequately assess the
costs and benefits of developing land in certain ways. However, most urban areas
experience challenges that indicate lack of such practices (Khayesi, 2007; Coulombel,
2010; Gunjal, 2016).
This means that safety and security of habitats in urban areas is not guaranteed. For
example 60 per cent of residents in Nairobi Kenya now live in slums with no or limited
access to even the most basic services. According to UNOCHA Report (2011), a ferocious
fire has razed to the ground, hundreds of houses in three estates in one of Nairobi’s Slums
Mukuru Fuata Nyayo, Kayaba and Marigoini estates, leaving one child dead, several
people missing and more than 1700 urban residents homeless and stripped of their property
and livelihoods. That means urban poverty is set to be Kenya's defining crisis over the next
decade if it is not urgently addressed. This means poverty is being urbanized in Kenya, a
worry to human security, stability and economic development. The only effort or form that
dominates assistance in Kenyan urban areas is food aid that victims receive (Gaube and
Remesch, 2013).
According to the ancient philosophical thoughts, nature of universe was divided in three
different elements: water, air, and land. Surprisingly, the system of property rights has the
same attitude and refers to all above mentioned elements (Epstein, 2012). This part of
literature review will focus on the property rights of land, which itself is unique resource,
33
as it is fixed (Jacobs, 1999). This scholar argues that property rights determine the property
ownership. Subsequently, Bromley (1991) and Needham (2006) emphasized that there are
different types of property rights: - state property, private property, common property and
non-property. The property rights as reveals by the literature review include different
elements that are referred as “bundle of rights” (Renard, 2007; Ostrom, 1976). But what
are the elements that are included in this bundle and which determine ownership? These
Scholars refer to five different elements as follows: - right to access, withdrawal right, right
to management, exclusion rights and right for alienation (Blomquist, 2012 & Ostrom,
2009). Property is a thing or things owned (Oxford Dictionary). Private property is an
individual right in land and is the strongest tool for distribution of good (Davy, 2009).
However, for the purpose of this study, we are concerned with other property rights such as
state property rights and common property rights. The controversial elements in property
rights touches’ on security. But on contrary, Harvy (2011), states that private ownership
may result in less security for the poor as they can be forced to sell their properties as their
ability to pay the land taxes is low.
2.3. Legal framework of Land Use Planning in Kenya
The land in Kenya is subdivided as agricultural land, forest, and other; agricultural land is
further divided into arable and arid lands. In Kenya, people value land differently where
farmers and pastoralists land is property to be owned and a source of livelihood, and access
to land and controlling it are key concerns. The elite consider land as a marketable
commodity from which to make windfall profits through market speculation mechanisms.
34
As a nation, the public, politicians and administrators view land as a sovereign entity
whose boundaries reflect a social, cultural and political identity.
Kenya has faced major challenges in urban land use, especially the economic and
environmental sectors. In the housing sector, land uses have been biased meaning a
difficulty for urban residents to access affordable quality standards housing. Moreover,
Kenya has been experiencing an annual shortfall of housing, exceeding 250,000 units.
There has also been an occurrence of rapid urbanization which is as a result of rural-urban
migration and realization of high population growth. Access to both prime and virgin land
for housing has provided a perfect opportunity for investors in the sector but with unequal
opportunity of land use. Only a few wealthy and well connected investors or individuals
have ability of land use of virgin and prime areas. This has led to expansive growth of
slums and informal settlements ,distorted access to land, high cost of finance ,existence of
rigid building laws and regulations and the deterioration of housing stock due to lack of a
maintenance framework.
According to Ministry of Lands report (2017) land use laws and regulations have
undergone through a review process. This is meant to keep up with the best global
practices and the ever growing demand and challenges, in particular urban areas. Such
laws are; the housing policy 2004, housing act, and the building code. Equally, the current
housing policy sessional paper NO.3 of 2004 has been reviewed to reflect on the
government strategies of wholesomely addressing the challenges faced by the housing
sector and any other land use. The focus is to establish housing funds to help in reducing
the cost of construction hence low cost of housing, review of building laws of 1968, to
35
conform to constitution of Kenya 2010. The reviewed laws provide strict penalty and
sanctions for any persons found liable for the collapsing of any building. However, most
buildings in urban areas are still substandard and continue collapsing in the eyes of the
reviewed laws and regulations to support sustainable urban land use.
It means that land use laws in the country has not been adequate and cannot help urban
residents to access basic needs such as shelter, education, food and clothing. According to
Saunders and Becker (2015) the building stock had been neglected due to the poor
maintenance culture and both the public and residential buildings are the most affected in
Kenya. Although the ministry established maintenance policy for inspecting all buildings
in every 5 years no improvement has been recorded. The country urban areas still
experiences a demand of 250,000 housing units per annum and yet it is capable to provide
only 50,000 units per annum, a low number inadequate to bridge demand deficit of
250,000 units annually. However, 922 housing units have been completed in Kibera zone
through slum upgrading programme and the ministry will commence construction of over
8,000 units under Civil Servants Housing Scheme. Yet due to poor urban land use, the
original slum dwellers relocated for the construction of these units do not have direct
access to them. This has continued to push further the slum and squatter problem
unresolved in Kenya. There are many interested developers such as the World Bank, UN
Habitat, SIDA, AFD and Shelter Afrique. These developers have also not been able to
bridge the missing link of availability, affordability, low cost housing and social housing
and accessibility and balanced land use for all urban residents. But their proper planning
has introduced aspect that was lacking and can be replicated in other areas. Their hard
work bore fruits as there has been a rapid growth in the number of schools, markets , roads
36
, lighting programs, sewer lines and dwelling houses hence changing the lives of many
Kenyans.
Kenya`s national spatial efforts date back to the colonial era when the British
administration established various Ordinances aimed at controlling land use in the East
African Protectorate. Key among these was the Town Land Ordinance of 1902, and the
Crown Land Ordinance of 1915. The former declared all land in the protectorate as crown
land, while the latter reinforced it by declaring that all land, including that which occupied
by indigenous Africans, as being subject to the Governor`s authority and power(National
Spatial Plan in Kenya,2015-2045). The 1931 Planning Ordinance provided legislation on
control of development in towns. However, the milestone in Kenya`s colonial planning and
land use planning and its development were outlined in the Swynnerton plan (1954) and
the development and Land Use Planning Regulations of 1961, latter repealed and enacted
as part of the Land Use Planning Act Cap 303 of 1968 (Kenya National Spatial Plan,
2015). The power and functions of the National and County Governments are outlined in
the Constitution of Kenya (2010), County Government Act of 2012 and the Urban Areas
and Cities Act of 2011. Article 185 of the New Constitution (2010), requires that the
County Assemblies to pass legislation necessary for effective of those functions. At the
same time some functions fall under the jurisdiction of both the national government and
the County governments (Kimani and Musungu, 2014; Galland, 2012).
The history of planning legislation in Kenya spans from both the pre-colonial period and
post-colonial period. Planning of urban areas during colonial period was largely driven by
a segregation policy based on various ordinances, orders in council, regulations and White
37
Paper (Kiwanis & Musungu, 2010). However, following independence, the ordinance and
laws from the colonial era were repealed and replaced during the 1960s. The planning
legislation introduced in the 1960s was reviewed again in the constitution of Kenya 2010.
In 2010, Kenya promulgated a new constitution. The key planning land use and
development control status include the County Government Act 2012. Urban Area and
Cities Act 2011, the Physical Planning Act 1996 and Environment Management and Co-
ordination Act 1999. Some of the policy and in that area expected to support this urban
development agenda include the County Government Act (2012), the Urban Areas and
Cities Act (2011), the National Land Commission Act (2012) and the draft National Urban
Development Policy (2012). At policy level, the constitution of Kenya, (2010) and the
National Land Policy-Sessional Paper no. 3 0f 2009 without doubt provide an improved
framework for planning and land use and development control, (Sifuna, 2009). For
instance, Article 66 of the constitution mandates the state to regulate the use of any land, or
any interest in right over any land in the interest of defense, public safety, public order,
public morality, public health or land use planning (Sifuna, 2009). Before the advent of the
devolved system of government, the physical planning Act (Cap 286) and the Local
Government (Cap 265) provided clear guidelines on the procedure for plan preparation
(physical development plans) and for implementation and development control (Syagga,
2006). The County Government Act (2012) and Urban Areas and Cities Act (2011) enable
county governments to allocate land and enforce development control and planning
(development implementation) at local level. The Physical Planning Act (Cap286) is still
in force- albeit that it is inconsistent with the new laws and sprit of the 2010 constitution
(Syagga, 2006).
38
2.4. Land Use Planning and Urban Growth in Kenya.
Land use planning is the conceptualization, coordination, and encouragement of private
and public use of land to satisfy long-term public interest. It provides means of managing
human developments to ensure maximum use of limited resource base and to retain for
future generations a maximum number of available alternatives (Baldwin, 1985). The
dispersal or concentration of pollutants depends upon spatial location of the activities
concerned (Njunguna, 2007).
Land use planning focuses on development pattern, housing element, rehabilitation &
redevelopment, special planning areas and neighborhoods’ preservation and revitalization.
County governments envision carefully planned and well-designed urban area that is
amenity driven with balanced development in all sectors. It seeks to regulate land use in an
efficient and ethical way, thus preventing land-use conflicts. Different governments use
land-use planning to manage the development of land within their jurisdictions. This is
focused to create diversity of current and new business and industry start-ups, well-planned
open spaces, and integrated amenities. Without directly speaking, rapid urban population
desires to grow with an emphasis to create a more sustainable development pattern that
appeals to urban residents and a broad demographic for longer generations to come (King,
Harwood, Cottrell, Gurtner, and Firdaus, 2013). At that time, a goal or objective of urban
land use planning is to establish disbursed employment areas and balanced mixed use
activity centers which aims at creating jobs opportunities and generates high income to the
urban residents, hence their ability of the urban residents to invest.
39
There are clear reasons for cities to believe that good planning now will result in better
economies and revenues later. The importance of cities to viable regional economic growth
and development, to preserving the environment, and to meeting emerging market needs is
becoming clearer every year. It is well recognized that successful regional economic
development is dependent upon the existence of successful cities as centers of commerce,
transportation, culture, education, and medical services, among other important services.
Developers are increasingly attracted to cities, which lead other municipalities in becoming
development ready that is by removing unnecessary obstacles to approving development
projects. Development that occurs in existing urban centers, particularly compact, mixed
use development near transit and other services and infrastructure is much more cost-
efficient and environmentally sound than development at the urban fringe or sprawl
development.
Planning includes managing continued residential growth, striving for economic
development, and influencing thoughtful land use decisions in the cities and beyond.
Urban residents demand a balanced and accessible urban area with educational excellence,
safe neighborhoods, and strong business continuity. It implies that growth in a pattern
consisting of a collection of community villages, each anchored by mixed-use village
centers along transit corridors with concentrated shopping, employment, a variety of
housing choices, and amenities are encouraged.
The urban land use planning is seen as a blue print that guide urban authorities vision of
developing as a collection of multiple village areas each with balanced and separated
mixed-land use village center cores anchored with commercial and employment centers
40
served by business parks, industrial parks, commercial and residential parks, restaurants,
retail shopping and cultural opportunities such as art theatres and galleries, regional
economic hubs.
In Kenya, this can be critical tool for realization of vision 2030 and beyond. It can enable
Kenya to plan for village centers that represent higher intensity areas within a distinct
geographic area along transit corridors and are a cluster of community oriented
neighborhoods character areas with local commercial, office, and mixed use spaces. These
centers are equipped with public gathering spaces with civic uses, such as schools,
libraries, and parks and have a distinct identity and village theme. Uses will be integrated
to the maximum extent possible in order to encourage a pedestrian-oriented design and
transit ridership. The future Village Centers will be served by a robust transit system and
provide a variety of housing types appealing to a broad demographic. The Village Center
development pattern offers a more sustainable land use strategy, a strong sense of
community, pedestrian oriented commercial nodes, mixed-uses, employment,
entertainment, and local services. It also appeals to people who cannot or prefer not to
drive as a primary means of transportation, such as the senior urban citizens and younger
generations.
These planned villages represent smart growth strategy with a proper job-to-housing
balance, a neighborhood and community-based system, a synergy with the urban areas that
improve communication and a successfully operating multi-modal transportation network.
It would offer planned opportunities for urban residents to live, work, and play. This
development pattern centers on what the local residents love about their neighborhood
41
while setting measures to ensure those special characteristics are enhanced and preserved.
Guided by smart growth principles, land uses should be concentrated within a 1⁄4 to a 1/3
of a mile from the primary transit stop of the Village (Putman, 2010). Ideally, land uses
become less intense moving away from the village center with low density residential,
large lots and agricultural uses around the fringe of the village. This could help alleviate
urban households with high density rates problem currently threatening dream for
overcrowding, pollution experience (Spence, Annez and Buckley 2009 and Strange 2008).
Furthermore, balanced planning for mixed-urban land use developments incorporates
residential units, commercial properties, and employment uses. These areas may also
contain cultural amenities such as performing arts centers, entertainment venues, museums,
education and training centers, and community gathering places. This would allow urban
residents to minimize and shorten trips by clustering multiple services and activities and by
supporting alternatives to automobile transportation. Planning for development on activity
centers can reduce sprawl, conserve open space and protect irreplaceable natural resources
on the urban fringe. It lead to less land space use since compact community and building
design require less land for construction. Also reduced is energy needed for transportation,
transporting water and providing other services, while reducing the carbon footprint, urban
heat island effect and environmental impact.
Apart from that, land uses and development supportive of an aging population is critically
important to urban areas. In developed countries, aging population is larger than the
youthful one. But in developing world, it is the reverse. This means that urban land use
must integrate the understanding that the youthful population requires planning towards
42
old age. Since most residents have chosen to retire in urban areas and seasonal residents
may become permanent, placing a high demand for senior related services such as health
and medical care, living assistance, quality affordable housing, transit, and human services
(Paton, Mamula-Seadon, 2013). Urban residents envision the future to include diverse
opportunities for end-of life planning and services. To meet the needs of this population,
the county governments will require fully integrated medical healthcare services at
convenient locations, rehabilitation and therapy facilities and end-of-life preparation such
as funeral and mortuary services, a cemetery or interment facility. A place to bury and lay
persons to rest completes the circle of life and creates a permanent sense of home among
residents and so are critical.
Cities and Urban Areas play a crucial role as engines of development as well as centers of
connectivity, creativity, innovation, and as service hubs for the surrounding areas.
According to Saunders, Beban, and Coomer, (2014) service-based land uses and
commercial uses are lagging behind residential construction. Growth and development
requires building materials for everything from streets and landscaping to buildings.
Ensuring that urban areas have adequate resources to provide these necessary materials
should be one of the main reasons behind a new requirement that cities begin to plan for
sources of aggregate and incorporate into their general plans. It creates land use
designations, transportation corridors, and village core and resort designations. In Kenya
land use planning could play a significant role for the success of the four big a gendas of
the Kenyatta`s administration, that is the provision of adequate housing, food security, free
education and the universal healthcare.
43
Academic Scholars of land use planning worldwide have attempted to analysis urban
spatial structure, (Alonso, 1964; Muth, 1967 and Brueckner, 1987). According to
Bruckner, (1987), spatial structure of city or urban area refers to systems, methods and
approaches used by the public and private sectors to influence the distribution of people
and socio-economic activities in urban land available spaces of various scales within that
city or an urban area. Yen, (2012), argues that spatial planning can be defined as the
coordination of practices and policies affecting spatial structure. In her words, spatial
planning is synonymous with the practices of urban planning. In fact, urban spatial
structure systems, tends to determine the urban forces and factors which tend to influences
the urban expansion and the direction it takes.
However, Cities have a spatial structure which is not always visible from the ground but
which appears when analyzing data. Many cities which appears very dissimilar from the
ground share the same spatial structure. The two outstanding urban structures in the
modern cities are urban sprawling and compact cities. Most cities are characterized by low
population density, leapfrog or fragmented development, scattered suburban linear patterns
and overdependence on private transport. The sprawling cities has been fueled by rural-
urban migration, unaffordable housing in city-centers and land administration rigidities.
Thus sprawling development reinforces unsustainable development. Likewise, some urban
areas are characterized by high population density, centralized development, spatial mixed
land uses and functions and well developed public transportation. Compactness and
connectivity generally have produced more sustainable urban pattern and forms.
Compactness is also an element of densification of a city or urban area.
44
Therefore, Angel, (2011), basing his argument on the two above characteristics of the
urban spatial structure, point out that, the spatial structure of cities could be described by
two superimposed patterns: the spatial pattern of population distribution within the built-up
area, and pattern of population movement around the city during the day.
He further, said that, to describe urban spatial structure, one must make use of basic data
on land uses. In this case, to analysis spatial structure of an urban area, we are interested in
the degree of spatial concentration of urban population and employment. At the city-wide
level, activity may be relatively centralized or decentralized depending on how
concentrated it is near a central business district. On the other hand, Brueckner, (2014),
argues that, understanding the spatial structure of a city allow urban planners to:- predict
the main direction of future development , develop strategies which are compatible with
current spatial structure ,and influence the evolution of the current structure in a manner
consistent with Municipal or urban authority objectives.
Urban growth alters not only the pattern of land use and land values, but also the intensity
of site use. As supply of land in urban area is fixed in short term, this will create scarcity.
Thus, in the short-run the supply of urban land is inelastic. The medium and long-term
supply of urban land is elastic provided that there is an absence of constraints such as
green belt controls and use restrictions, and assuming the availability of transport.
Profitability and utility are largely determined by accessibility. The greater the accessibility
of a location, the greater the comparative advantage and the greater the demand for
property or urban land at that location (Brueckner, 2012). In the case of business use,
45
general accessibility refers to nearness to transport facilities; for example, rail, bus stations;
and motorways, labor, customers and service facilities such as banks and post office.
Bertaud (2012) argues that Land spatial structure or urban spatial structure is the
arrangement of urban public space, the way the urban land is arranged. According to the
scholar, urban spatial structures are shaped by market forces, with regulations, primary
infrastructural investments and taxes. This affects many aspects of how cities function and
has implication for accessibility, environmental sustainability, safety, social equity, social
capital, cultural creativity and economics (Genesis, 2008). Subsequently, this scholar
points out that the demand for and access to land for residential purpose was the main
drivers for spatial growth within the city/urban area. According to Dowall (2010), urban
structure in brief is the arrangement of land use in urban areas. The spatial structure of
urban area can be defined by its: land consumption, spatial distribution of population and
pattern of daily trips. Rates of urbanization can fluctuate rapidly and be hard to predict.
This makes planning for urban growth a challenge, especially in developing countries,
where more than 90 percent of urban growth is occurring. There are linkages of urban
spatial structure and household transit, pollution due to transport and disaster risk
management. Thus, urban spatial structure tends to have influence on households disaster
risk management.
The built-up form of a city can be represented both as asset of spatial elements; for
example, green space, central business districts, high rise residential, transportation
corridors, gentrification, urban development nodes (Angel, 2011). But Yuen (2013) and
Angel (2014), point out that other factors such as: non-economic factors, especially,
46
population growth and migration; government interventions in form of policies; regional
socio-cultural and political factors all account to the spatial structure urban areas growth.
In Eldoret Urban Area, centripetal forces, especially the rural-urban migration, population
growth, need for employment, availability of urban services and good infrastructure have
attracted many into the urban area of (EUA), especially after the attainment of political
independence in 1963, causing urban expansion or growth.
2.5. Urban Planning Dynamics which influences Urban Land Use Planning
Urban planning is available force for City leaders to achieve sustainable development.
Urban planning is a technical and political process concerned with the development and
design of land use and the built environment, including air, water, and the infrastructure
passing into and out of urban areas, such as transportation, communications and
distribution networks (Bruckner, 2009).
Urban planners, direct the development of Cities and Towns. Awell developed, effective
urban plan requires thorough research and input from numerous stakeholders, including
citizens, landowners, and government staff. Urban planners should think about their plans
from the perspective of all who will be impacted by their efforts.
The Local Government perspective, urban planning touches on numerous City-life
elements: - new and pre- existing land, buildings, roads, communal spaces, transportation,
economic development, infrastructure, and the environment, among others. These aspects
are categorized into different conceptual areas or dynamics as below:-
47
2.5.1. Spatial Development Planning
In the urban land planning, spatial planning systems consist of methods and approaches
used by the public and private sector to influence the distribution of people and activities in
spaces of various scales. Spatial development planning is therefore the coordination or
practices and policies affecting spatial organization. It is practiced in the urban planning.
This infers that it involves planning efforts in urban areas. The planning through spatial is
focused towards land use, urban, regional, transport and environmental planning. All these
are believed to create environment favoringby socioeconomic developments.
According to Cox, and Perry (2011) this is a public sector planning tool used to influence
the future spatial distribution of activities, distribution of people and activities in spaces of
various scales in order to improve the built, economic and social environments of
communities. It aims to create a more rational territorial organization of land uses and the
linkages between them, to balance demands for development with the need to protect the
environment, and to achieve social and economic objectives. Spatial planning tries to
coordinate and improve the impacts of other sectoral policies on land use, in order to
achieve a more even distribution of economic development within a given territory than
would otherwise be created by market forces. Spatial planning is therefore recognized as
an important lever for promoting sustainable development and improving the quality of life
(World Bank, 2014). Spatial planning in both urban and rural areas is a key instrument for
working towards sustainable development at the local level. More specifically, urban
planning is a potent tool both for reducing the overall impact of settlements on the regional
environment and for improving conditions within settlements.
48
2.5.2. Strategic Development Planning
Strategically, urban planning has a critical role to play in improving people’s wellbeing
and the quality of life. International conferences on sustainable development have
highlighted this message; from the United Nations Conference on Environment and
Development in Rio de Janeiro in 1992 to the United Nations Conference on Human
Settlements (Habitat II, the City Summit) in Istanbul in 1996 even the (Habitat 111) in
Ecuador 2016. According to Baker, (2013), Strategic Development Planning is an initiative
that provides a basis for coordinating and targeting development efforts and interventions
in urban and rural areas. Experience has shown that lack of spatial frameworks in the form
of up-to-date urban development plans clearly indicating recommended land use, land
ownership, land tenure, and the planned urban expansion for the towns in which
interventions are taking place, can lead to unsustainable location of facilities and services.
This in itself not only diminishes the impact of the interventions but also results in wasteful
application of resources.
Urban areas development needs to be more consciously planned. This would make them
able to address sustainability appropriately. Therefore strategic development planning
practices also need to be changed to reflect a new awareness and to integrate
environmental, health, economic and social concerns of the 21stcentury.
2.5.3 Integrated Development Planning
Integrated development planning is a strategy to prevent socioeconomic, environmental
and climate impacts on the population. In urban areas this is used as mitigated intervention
49
tool that focuses on tackling flooding, drought, water scarcity and heat stress, as well as to
avoid exposure of valuable elements to risks. Climate impacts can be prevented when
changing land use in a way that it positively affect the regional water balance, which
influences the evapotranspiration process through infiltration, the soil water redistribution
process, and surface roughness, which controls overland flow velocity and floodplain flow
rates. Afforestation, forest transformation, sustaining wetlands, avoiding bare soil during
precipitation season, modified vegetation cover, and introducing drought/flood-tolerant
crops can also reduce flood and drought risk.
Land-use planning is also useful in case of snow avalanches, as for instance is used in
Switzerland, where zoning restricts new building areas at risks. Three zones are
established: red where building in strictly prohibited, blue where building is possible but
designs have to take impacts into account, and yellow with no restrictions. The use of maps
and plans provide information regarding these restrictions and negative impacts are
considerably avoided. Some areas are more prone to flooding than others. Africa is
currently experiencing significant economic growth and associated demographic changes,
including rising urbanization. But without the requisite infrastructure, spatial and
settlement planning. In urban areas, the requirements of social, economic, and ecological
sustainable development are usually intertwined with the problems of land-use
intransigence, fragmentation, and deterioration of quality of natural systems.
2.5.4. Sectoral Development Planning
Each sector in the economy is generally required to formulate their annual or five year
plan. For instance, the agricultural sector, education sector, health sector, or tourism sector.
50
These entire sectors are supposed to develop their own development plans. It is these
sectoral plans that are generally combined to develop the integrated development plans of a
country or a region. The medium plans in Kenya, especially, the five years development
plans are both sectoral and integrated development plans.
2.5.5. Physical Planning
Mankind derives his livelihood and survival by exploiting the three physical matters on
earth, namely soil (land), water and air.Although those matters appear to be in abundance,
they are finite and over exploitation without proper planning might lead to mankind
extinction. The rising population has exerted pressure on the little productive land
available forcing people to cultivate on steep slopes and riverbanks thus causing soil
degradation and erosion.
This has resulted in crop failures, food deficiency and poverty thus pushing people out of
rural areas to seek the elusive greener pastures in urban centers.Availability of well-paying
jobs, business opportunities, electricity, clean water, entertainment, efficient transport and
other amenities attract people to urban areas.This has led to rapid urbanization and
industrialization. However, the slow economic growth coupled with demand for urban
lifestyles overwhelm supply leading to mushrooming of illegal and uncontrolled
development that negates the pull factor.
Planning is needed to ensure the population is having access to basic incentives including
urban services. These populations also requireproper human settlements, organized
transport, proper infrastructure, economic development, good governance and harmonious
51
living with nature and proper physical planning must be achieved.Physical planning is
deciding in advance what to do, where, when, with what and how, in, under and above
land. It is a thought process that guides land use thereby has to be guided by a set of rules,
regulations and standards.This is a process through which a planning authority prohibits
and regulates use, sub-division and development of land and buildings within its area of
jurisdiction.
The main goal of land use planning is to divide land uses to meet the economic and social
needs of people while safeguarding the future resources. Land use planning is basically the
public policy exercise that designates and regulates the use of land to improve a
community’s physical, economic, social efficiency, and well-being of the people with
considering socioeconomic trends as well as physical and geographical features.Physical
planning can be designed as an exercise that uses the land use plan as a framework to
propose the ideal physical infrastructure for a settlement or area, including infrastructure
for public services, transport, economic activities, recreation, and environmental
protection. A physical plan may be prepared for an urban area or a rural area. A physical
plan for an urban region can have both rural and urban components, although the latter
usually predominates.
A physical plan at a regional scale can also deal with the provision of specific regional
infrastructures, such as a regional road or a bulk water supply system. Both the Land use
plans and physical plans are not necessarily mutually exclusive. Laws, regulations, plans,
and institutional frameworks should form the basis of reconstruction planning. If existing
instruments are not realistic or are contributing to informality, use the reconstruction
52
process as an opportunity to improve them; the planning process should join active
collaboration among the reconstruction agencies, the affected community, the private
sector, and other stakeholders, thereby engendering their ownership of the planning
process. The planning process should respond to issues of land rights and titling and to
discrepancies in the administration of land records, address the needs of informal occupiers
of land, and work with them to find viable alternatives. It is common practice in many
countries to prepare comprehensive development plans that address both land use zoning
and the provision of physical infrastructure.
2.5.6. Urban Master Plan
According to Yen, (2012), Urban Master Plan is a blue print and reference framework
charting overall configuration and direction of future urban growth. It is based on forecast
and assumptions about urban population growth, economic dynamics, social factors and
urban land use needs of a specific city or urban area. Durand- Lesserve, (2010), argues that
Urban Master Plan if not formulated and implemented well, then likely to be restrictive
regulation instrument and even increases transport costs and further inflate urban land
prices/ housing prices undurely. This scholar pointed out that this is a case in most African
cities/urban centers. However, Master planningwas introduced in African cities by colonial
governments in Africa. The purpose of master plans was to create orderly, pre-approved
development using regulatory mechanisms this form of planning is now widely seen as
aggrevating urban challenges. Master plans have been critised for being ill equipped to
deal with the realities of fast growing, informal, and heterogeneous African cities, the
governments of which are often riddled with corruption and capacity constraints,the
53
diversity of tenure arrangements that characteristize these cities, and for rationalizing
oppressive slum clearances in the name of orderly development (UN ECA, 2014; Clarke
Annez & Lin, 2010). Therefore, Master planning, currently, especially, in African Cities,
have be criticized to be out of step with urban realities and that does not serve interests of
the poor.
2.5.7. Infrastructural Development Planning
Land use, transportation and infrastructure planners prepare plans and policies that affect
the growth and appearance of neighborhoods, cities, and urban regions. Their work affects
the siting and sizing of new development at the urban scale as well as the physical design
of specific sites. The site planning process itself involves site selection, program
development, and site analysis and design, and plan implementation.
Their work may also protect historic buildings and special design districts in the
urban core, as well as open spaces and agricultural lands affected by unwanted or
premature urban growth in rural areas. Integrated land use and transportation plans
have emerged in recent years to promote new concepts, such as: “transit-
oriented development,” “complete streets,” and “safe routes to schools,” and to reverse
the negative effects of urban sprawl and decay. These planners often use
geographic information systems (GIS), population projections, economic base studies, and
land suitability analyses based on roadway and infrastructure capacities and
environmental factors to determine the quantity and location of new industrial, commercial
and residential development in towns and cities. They also forecast the impacts of new
urban development on communities, roadway networks, and the environment. They may
54
also prepare plans and strategies to make our use of natural resources in land use and
transportation systems more efficient. In general, their work seeks to make our
neighborhoods, cities and regions more livable, sustainable and resilient for everyone.
2.5.8. Environmental planning.
Environmental planning is a process of facilitating decision making to carry out land
development with consideration given to the natural environment, social, political,
economic and governance factors and provides a holistic framework to achieve sustainable
outcomes. Amajor goal of environmental planning is to create sustainable communities
which aim to conserve and protect underdeveloped land (Conacher, 2010).
From environmental planning assessments encompases areas such as land use, socio-
economics, transportation, economic and housing characteristics, air, pollution, noise
pollution, the wtlands, habitat of the endangered species, flood zones susceptibility, coastal
zones erosion and visual studies among others, and is referred to As an integrated
environmental planning assessment. It is ability to analyse environmental issues that will
facilitate critical decision making. Many environmental planning actions currently revolve
around the reduction of emissions and material reuse, not adaptations in order to lessen
future climate change impacts (Beer, 1977).
2.5.9. Transportation Planning.
Trasportation planning is the process of defining future policies, goals, investments, and
designs to prepare for future needs to move people and goods to destinations. As practice
to day, it is a collaborative process that incorporates the input of many stakeholders
55
including various government agencies, the public and private businesses. Trasportation
planners apply amulti-model and or comprehensive approach to analysizing the wide range
of alternatives and impacts on the transportation system to influence beneficial outcomes
(Wegner, 2012). According to Wegner, (2012), transportation planning which is
commonly referred to transport planning involved with the evaluation, assessment, design
and sitting of transport facilities (generally) streets, highways, bike lines, and public
transport lines.
Trasportation planning as indicate above is to be determined by the availability of
land.Thus, transportation planning has a direct influence to land use planning.The earth`s
surface, called the land scape, is a unique and valuable resources. Land use (aso called
Land Development and Spatial Development) refers to how the landscape is treated,
including the location and design of buildings, transportation facilities, parks and farms.
2.5.10. Sustainability Planning.
Sustainability planning emphasizes the integrated nature of human activites and therefore,
the need to balance economic, social and environmental objectives. Interest in
sustainability can be considered a reaction to overaly specialized decision-making focused
on easily measured goals and impacts, while ignoring those that are indirect or more
difficult to measure. According to American Planning Asociation, sustainability planning
require comprehensive analysis that accounts for all significant impacts, including those
distant in space and time. It strives for development (increased quality) rather than growth
(increased quantity), and recognizes resource constraints and ecological risks such as fossil
fuel depeletion, habitat loss and climate change. Conventional planning asks “Does it
56
work”, sustainability planning tends to ask “Does it fit?” That is, wether individual
decisions fit into overall long-term goals. The sustainability issues from the economic
perspectives are- efficient mobility, local economic development, and resources
operational efficiency; from the social aspects- social equity,(fairness), human safety and
health, affordability and community cohesion; and from the environmental perspective, the
major issues are- air, noice and water pollution reduction, climate change emissions,
resource conservation and open space.
2.6. Urban Land Use Planning and Disaster Management
Land use planning mechanism allows for resource management and the reconciliation of
diverging interests for example, creation of areas with specific development goals and
restriction to expansion and reserve areas. It is therefore supports countries to reduce and
manage the risks of natural and manmade disasters. It is theorized that good administration
and management of land is crucial to poverty reduction, conflict transformation,
improvement in the quality of local governance and ultimately sustainable economic
growth. But lacking is the approaches integrated into land use planning for disaster risk
management. According to Hailu,(2013), most townslack mitigation awareness,
forecasting preparedness, and make respond to disaster recovery process difficult. In fact
majority of urban households depend on relief support without which their coping
strategies are weak and inadequate. Moreover most of them fail to improve on
infrastructural rebuilding; they end up reconstructing same structures as the ones
destroyed. Their vulnerability and exposure to hazard risks that lead to disasters are high.
57
This group is excluded from participating in the economic social, political and cultural
spheres in urban areas all of which create and nurture capabilities (Barrett, 2002).
According to Schustereder, Hohfeld, Lech and Leppert (2016) study done in Philippines
did not find any indication that there was impact regarding the long-term effects of
Sustainable Integrated Management and Planning for Local Government Ecosystems
(SIMPLE model of Philippines) on Household disaster risk management and household
well-being. On the likelihood of people living in hazard areas in the control sites, it was
found to be lower than in the SIMPLE sites by 7.3 percentage points, yet the findings
indicate that they are aware but are still living in disaster risky zones. This implies that
there is need for mechanisms to eliminate the current problem that is still holding them to
disaster risky zones even if they are aware. Although it appears counterintuitive, a possible
explanation is that respondents in SIMPLE sites are more informed and aware that they are
living in hazard zones than their matched counterparts. At the same time, households in
SIMPLE sites are significantly more aware of initiatives such as tree nurseries, tree
planting, and seedling provision than the inhabitants of the control sites. Municipal
officials also report having more initiatives such as tree nurseries, tree planting, mangrove
nurseries, and seedling provisions in the program areas. Hence, based on municipal
officers’ and household reports find some evidence in support of greater reduction of
disaster risk. It is important to make proper planning for urban land uses to enhance use of
such initiatives to make households disaster risk free (Kimathi, 2013).
It implies that there is a higher presence of zoning officers and zoning ordinances among
SIMPLE municipalities in Philippines. Also results suggest that the SIMPLE program
58
contributed positively to improving household awareness about disaster-relevant issues
such as reported hazard zones, the risks involved in living in hazard areas, and disaster
preparedness; although there was no impacts related to welfare improvements. This
indicates that the donor-assisted intervention process has contributed to some of the crucial
land-related issues in the selected rural municipalities and cities of Philippines. More
importantly, however, is the point that the program’s potential long-term impact will
remain limited as long as the two core issues of unequal landownership and land rights are
not resolved.
Some cautions should be noted, however: it is possible that the impacts are confounded by
factors that are difficult to measure. The success of SIMPLE can also be affected by the
mayor’s all-out support to the program, external resources and other donor funding, as well
as frequency of disasters in the areas. It is also important to note that although households
are aware of disaster risky areas but still live in such areas. This is an indication that some
unknown pressure for instance economic pushes them to risk their lives to expose
themselves to such areas. It is critical to have proper planning that develops urban land
uses in ways that eliminate risk exposure.
2.7. Land Use Plannig Regulatory Instruments
Lack of common guiding principles in planning and coordination among different sector
such as agriculture, livestock, industry, transport, forestry, wildlife, urban development and
social services had results in competing and uncoordinated land use practices. As part of
land use planning, regulatory instruments is fundamental in development pattern changes
and spatial structure reformation, land market efficiency improvements, supply constraints
59
and price increases in property markets, and labor market shifts that suggest the possibility
of countervailing effects. The economic consequences of land use policies may highly
depend on context and that institutional settings as well as substantive policies are essential
for achieving more systematic coordination of land use planning and economic
development practices.
The regulatory framework is based on philosophy of economic productivity, social
responsibility, environmental sustainability and cultural conservation. The aims of the
instruments are for efficiency, access to land use information, equity, elimination of
discrimination and public benefit sharing. This study pursued various studies undertaken
by the research teams in their respective countries to help identify planning tools and
regulatory instruments. The process of identifying these planning tools and regulatory
instruments included desk-based research of documents relevant to the national and
regional contexts and the case studies and initial interviews with actors in the case study
areas. They also relate to different levels of governance: national, regional, local at case
study levels. These planning tools and instruments were identified as being potentially
relevant to accountability and interest of national and county governments. However, at
this point there was no attempt to assess the significance and role of these planning tools
and instruments. As a result it may be expected that some of those initially identified will
be discarded as not being relevant to the proposed study. These instruments identified after
literature search include land use policy, legislation, land use planning and land reforms.
Land use regulations play an important role as basis for negotiation among public sector
and private stakeholders. For instance, a developer might be allowed a FAR increase
60
pertaining to a project site in a return for designating a green space on the site or allowing a
wider right- of- way for road that would encroach on the site. And in Kenya, after a
protracted land policy formulation process stretching between February 2004 and
December 2009, the country obtained a comprehensive national land policy. Key features
of this policy were subsequently anchored in the Constitution of Kenya 2010. For the first
time in history, the policy and constitutional frameworks provided Kenya with a unique
opportunity to undertake comprehensive land reforms to respond to contemporary land
issues.
In a country like Kenya, land distribution has been largely in favor of loyalists of the
executive and political leadership through history. This indicates that land reforms are
critical for upsetting this status quo. Land reforms are also seen to threaten the interests of
those who benefitted from irregular allocation of public land who, in a majority of cases,
are citizens with reasonable political influence. Such forces placed overt and subtle
roadblocks to the process of formulating the land policy and reviewing the constitution
whose chapter on land enables the implementation of key proposals in the land policy. The
delivery of Kenya’s national land policy and the embedding of its key features in the
chapter on land in the constitutional must therefore be seen as the great epochal
achievements they indeed are. However, only the effective implementation of these
documents that can cascade the intended benefits to the citizenry. It was therefore
necessary to expeditiously develop enabling land laws resonant with the policy and the
constitution.

61
Land-use planning instruments are designed to alter land use which in turn shall determine
the urban form and land utilized by the public sector, private sector and community actors
(Moreles, 2013). The study shall concentrate mainly on the informal settlements, slums
and per-urban areas, but will also explore the situation in formal settlement of Eldoret
Urban Area. In essence, the Kenyan constitution requires that among other principles, land
be managed in an equitable, nondiscriminatory, efficient, productive and sustainable
manner. The constitution further requires that community-based dispute resolution
mechanisms be applied in resolving conflicts.
The legal and institutional framework of land, land use, and the system of acquisition and
disposition of land rights which have been in place since the colonial times has brought
about tension, strife and litigation in land matters in Kenya. The structural framework and
principles for the management and administration of land inherited from the colonial times
and developed over the three decades since independence has largely failed to instill
confidence in the land market. Some of the problems within the land sector in Kenya may
be attributed to its colonial history, a proliferation of statutes governing ownership and use
of land, broad socioeconomic patterns and demographic trends that have exerted pressure
on usable land. Other issues that have taken a center stage in the land debate in Kenya
include the optimal economic use of land, rural and urban development, squatting, the
quality and security of protection of the environment.
Some of these instruments provide the details of relevant legislation, regulation, and
guidance relating to planning, land reforms, land use plans, heritage, and the environment;
for example, pollution, air, smoke, waste, habitats, water, and energy. In Kenya, land
62
reforms that have far-reaching implications for securing the land rights of rural people
(upward of 42 million in 2011), and promoting political stability and economic
development has taken center stage. The absence of a clearly defined land use regulatory
framework in Kenya after years of independence has resulted in a haphazard approach to
managing the different land use practices and policy responses. Land use continues to be
addressed through many uncoordinated legal and policy frameworks that have done little
to unravel the many issues that affect land use management. It means that what can provide
legal, administrative, institutional and technological framework for optimal utilization and
productivity of land related resources in a sustainable and desirable manner at national,
county and community levels has been missing.
Whenever, a household or any other institution, individual, urban authority or building
societies are planning on building a building, it's important to become familiar with the
various restrictions, as well as the purpose of those that may apply. Selecting a parcel
where the house will be constructed is the first step. From there, familiarity with national
and county building construction restrictions could enhance cost saving.
Every building constructed requires a building permit and inspections. Building code
restrictions ensure the home is properly constructed and meets current energy-efficiency
requirements. This would be useful in managing collapsing houses in major cities in Kenya
While these may vary somewhat with a locality; building codes are consistent with regard
to sound construction practices and adequate structural support systems, as well as
plumbing, electrical and heating-air conditioning installations. Obtaining energy-efficient
63
specifications allows determine the type of windows, insulation and heating/air
conditioning for the house.
The standard distance sideways must also be understood of its importance to a dividing
fence or block wall is approximately five feet. In Kenya, those building along the road
must ensure a six meter distance reserved for road expansion. This is known as property-
line setback, that ensures the fire engines and fighters have access to any part of the lot. In
addition, the front of each house is the same distance from the curb or edge of the street.
This distance falls into setback restrictions regarding a clear line of sight for the fire
department. Knowing the setback restrictions is essential in determining the dimensions of
the house with regard to the lot.
The restrictions for those who build in hillside parcel also must understand that the limit
the height of a roof to ensure that the view of neighborhood residents is not obstructed.
Moreover, for those living in the bed of rift valley such as Nakuru town, the tallest
building allowed used to be two story building. Becoming familiar with any height
restrictions allows in designing the new building. Some localities and home communities
have restrictions regarding overhead power lines, which require installing underground
conduits. In addition, many suburban localities restrict the use of septic tanks. Unless the
water source is a well, the local public utilities board must sign off on the home building
project, approve a sewer connection and install a water meter. A gas company installs a gas
meter, and the electrical provider installs a meter in a panel provided by an electrician.
64
2.7. The Indicators of Land Use Planning Regulatory Instruments
Planning regulation is the control in the manner in which land is used and developed,
mainly in urban areas (Sutcliffe, 1980). In urban planning, the publicizing of the need for
observance of planning regulations in land development is an important function that the
law performs. The main sources of authority for land use development control in Kenya
are the various laws and regulations such as zoning regulations, building codes, by-laws
and several statutes usually prepared by the central government, local authorities or their
agencies. According to Delafons, (1973) zoning limits the rights of private individuals
since it involves the regulation by zones under the enforcement of various ordnances
power.
2.7.1. Minimum Lot Size.
The essence of fixing minimum lot sizes or areas is to prevent overcrowding, to ensure
adequate light and ventilation and to facilitate easy movement of people, vehicles and
goods. The actual amount of plot will depend on the type of land use activity,
recommended densities and plot coverage ratio.
2.7.2. Floor Area Ratio.
Floor Area Ratio is the ratio of a building total floor area (gross floor area) to the size of
the piece of land upon which it is built. It is often used as one of the regulations in City
planning along with the building to land ratio. The term can also refer to limits imposed on
such a ratio through zoning (Moreles, 2012). As per formula FAR is equal to gross floor
area over area of the plot. Floor Area Ratio is sometimes called floor area space ratio, floor
65
space index, site ratio or plot ratio. The Floor Area Ratio is the building should cover in
relation to the total area of the plot. The essence of fixing plot coverage is to ensure a
heathy environment and allow for the expansion and improvement of infrastructural
facilities and social amenties.
The Floor Area Ratio (FAR) can be used in zoning to limit urban density. While it directly
limits building density, indirectly it also limitsthe number of people that a building can
hold, without controlling the building external shape. FAR has a major impact on the value
of the land. Higher allowable FAR yields higher land value (Andres Duary et al (2000).
For the purpose of promoting health, safety, morals or the general welfare of the
community, the legislative body of every municipality is hereby empowered to regulate
and restrict the height, number of stories and size of buildings and other structures, the
percentage of lot that may be occupied, the size of yards, courts, and other open spaces, the
density of population, and the location and use of buildigs, structures and land for trade,
industry, residence or other purposes (Williams,1935).
According to Smolka, 2014), FAR, is the measurement of a building`s floor area in relation
to the size of the lot / percel that the building is located on. FAR is expressed as adecimal
number, and is drived by diving the total area od the building by the total area of the
percel. FARis most often used to express development intensity of non-residential land
uses, and integrated into community`s zoning and other land development controls. FAR
can be used to either limit the intensity of land use to lessen the environmental impacts of
development or control the mass and scale of development.
66
2.7.3. Building Code /standard
Abuilding code which is also known as building standard, building control, building
regulations, is a set of roles that specify the standards for constructed objdects such as
buildings and nonbuilding structures. Buildings must conform to the codes to obtain
planning permission, ususally from a local council. The main puporse of building code is
to protect the public health, safety and general welfare as they relate to construction and
occupancy buildings and structures (Wegner, 2014). Building codes are suppose to be
applied by architects, engineers, interior designers, contructors and other regulators, but are
also used for various purposes by safety inspectors, environmental scientists, real estate
developers, subcontractors, manufacturers of building products and materials, insurance
companies, tenants and others.
The practice of developing, approvoving and enforcing building codes varies considerably
among nations. The pur[ose of building codes is to provide minimum standards for safety
health and general welfare including structural integrity, mechanical interity (including
santation,water supply, ligjht and ventilation), means of engress, fire prevention and
control and energy conservation.Building codes, generally includes:- standards for
structure, placement, size, usage and assemblies, size/location of rooms, foundation, floor
assemblies, roof structures, energy efficiency, stairs and halls, mechanical, electrical,
plumbering, site drainage. Lighting fixtures standards, occupancy rules and swimming
pool regulations; rules regarding parking and traffi9c impact; fire code rules to minimize
the risks of fire and to ensure safe evacation in the event of such an emergency;
requirement for specific building uses; enery provision and consumption; minimum abd
67
maximum room ceiling heights, exit sizes and location and qualifications of individuals
and corporations doing the work.
2.7.4. Building Permits
Obtaining building permits and planning approvals in mandatory in Kenya and it is the
land use regulatory instrument. A developer, or contructor whenever he or she intends to
construct a building one is required to seek building permits and building must be
approved by municipal authority. A planning permit, as in some instances, it may not be
necessary. To get a planning permit, a registered and practicing Physical planner submits
the application on behalf of developer to the country or sub- country authority, while
building permit a registered and practicing architect submits both architechtual and
structural drawings on behalf of the developer (Payne, 2012).
Building permits are typically required for any construction in improvement, repair,
alteration, construction, or demolition, project, including pool or spa installations, sand
blasting, most excarcation and the erection of tempory power poles’ Permits are also
required for re-roofing projects and improvements to plumbering, mechanical and
electrical systems.
2.7.5. Open/Green Space.
Open / Green space is any piece of land that is underdeveloped (has no buildingor other
built structures) and is accessible to the public. Open space can include:- green space
which is land partly or completely covered with grass, trees, shrubs or other vegetations.
Green space includes parks, community gardens, and cementries. Broadly, open space
68
includes green space as well as school yards, playgrounds,public seating areas, public
plazas and vacant lots (Yen, 2014).
Open space provides recreational areas for residents and helps to enhance the beauty and
environmental quality of neighbourhoods. Lack of commubity and public access to safe
open and green space is acritical area of concern for urban residents in any city or urban
area of the world. Using vegetation to reduce the energy costs of cooling buildings has
been increasingly recognized as cost effective reason for in creasing green space and tree
planting. Plants improve air circulation and provide shade. This provides a cooling effect
and help to lower air temperature..
Lack of green spaces leads to higher air temperatures and more ground level ozone, with
fever trees and plants to clean the air and provide oxygen. Additional tree and vegetative
growth provides shape and lowers urban temperatures reducing the demand for air
conditioning and energy costs. Urban green space, such as parks, playgrounds, and
residential greenry can promote mental and physical heath and reduce morbidity and
mortality in urban residents by providing psychological and stress alleviation, stimulating
social cohesion and supporting physical activity, and reducing exposure to air population
(Moreles, 2014). Green space encourages exercise , provide spaces for socialization,
decrease noice and air pollution, and improve immune function by providing exposure to
beneficial microbiota. It also can help with psychological restoration, that is green space
provides a respite for stimulated minds. Urban green spaces such as parks , sport fields,
woods, lakesides, and gardens give people the space for physical activity relaxation, peace,
69
and an escape from heat. Green spaces are also associated with better air quality, reduced
traffic noice, cooler temperatures and greater diversity.
Open spaces have significant importance in the life of the settlements or neighbourhoods.
The areas with high green coverage rate =have ecological and environmental importance.
These green spaces can improve the urban climate, abate the urban heat-island effect by
their ecological balancer function and reduce environmental damages. The green space
would also facilitate water management and promotes biodiversity in built-up areas, and
can help reduce the effects of noice pollution. Greenery also helps to raise the property
value of homes and offuces.
2.7. 6. Green Buildings.
A green building is synomymous with asustainable building, a green building is astructure
that is designed, built, renovated, operated or reused in a resource effecint manner. Green
buildings are designed to meet certain objectives such as protecting occupants health,
improving employees, productivity, using energy, water, and other resources more
efficiently and reducing the overall impact of the environment. Green Buildings includes-
sustainable sites and development, water conservation and efficacy, energy and
atmosphere, material and resources, indoor environment air quality, innovation and
operation and maintenance.
2.7.7. Building lines/set backs
This refers to the distance between the front and back property lines and the distance from
the side property lines respectively to any structure of the property. The rationale Setbacks
70
can also be placed between buildings for similar reasons. Building lines or setback is the
minimum distance between buildingsand lot lines. In land use, a set back is the minimum
distance which a building or other structure must be set back from a street, or road or other
stream a shore of flood plain, or any other place which is deemed to need protection.
Depending on the jurisdiction, other things like fences, landscaping, septic tanks, and
various potential hazards or nuisances might be regulated and prohibited by setback lines.
Setbacks along state, provincial or federal highways may also be set in the laws of the state
or province or the federal governments. Local governments create asetbacks through
ordinances, zoning restrictions, and buiding codes, usually for reasons of public policy
such as safety, privacy, and environmental protection. Building lines are utilized by
communities principally to achieve planned street patterns. They help insure that buildings
will not be erected in the bed of projected streets or of potential street widenings. Building
lines way also be established for the purpose of preserving residential and commercial
front yards.
2.7.8. Buffer Zones
These are zones that separate incompatible land uses and try to prevent conflicts and
reduce possible inconveniences. Zones with planted strips of trees, major routes of
transportation or the use of natural features such as rivers and wetlands are often used as
buffer zones between incompatible land uses. According to Yen (2012), a buffer zone is a
zonal area that lies between two or more areas (often, but not necessarily countries), but
depending on the type of buffer zone, it may serve to separate regions or cojoin
them.Common buffer zones are demilitarized zones, brder zones and certain restrictive
71
easement zones and greenbelts. Buffer zones have various purposes, political or otherwise.
They can be set up to prevent violence, protect environment, shield residential and
commercial zones from industrial accidents or natural disasters or isolate prisons, and have
uses in several other scenarios.
2.7.9. Way leaves or Right of Way Protections
These are rights of way over or through land for carrying sewers, drains, water pipes,
electricity cables or wires on pylons into, though, over or under any land whatsoever. Such
rights are provided under Way leaves Act, Cap 292 of 1962, Laws of Kenya. According to
Moreles, (2012), governments Worldwide, especially, in developing countries should
undertake the regulatory reforms, aiming at removing the regulatory bottlenecks. He
argued that Mexico took the lead in identifying key regulatory bottlenecks at the local level
and designing reforms that structure local incentives to remove these bottlenecks.
Smolka, (2014), identified the key bottlenecks as including building codes, unnecessary
high building standards for electrical and sanitary connections, large minimum lot sizes
and oversized roads, building licenses, and titling procedures. According to this scholar,
the burden of misregulation is currently heavy—estimating that an average of 25% of the
cost of new residential construction is attributable to clearly excessive local regulation. The
two scholars pointed out that removing regulatory bottleneck would be more applicable in
slum areas, informal settlements and perhaps in pre-urban areas, where urban planning is
limited.

72
Right of way is the legal right estabilished by usage or grant to pass a long a specific route
through grounds or ptopertyu belonging to another “a path or thorough fare subject to such
right”. A similar right of access also exists on land held by government, lands that are
typically called public land, state land, or crown land. When one person owns a piece of
land that is bordered on all sides by lands owned by others, an easement may exist or
created so as to initiate a right of way through the bordering land (Yen, 2016).
Afurther definition of right of way chiefly is as type of easement granted or reserved over
the land for as to transportation purposes; this can be for a highway, public footpath,
railway lines, and oil and gas pipelines. The term may also describe priority of traffic flow,
the legal rifght of way of pedestrians, vehicle, or ship to proceed in a particular situation or
place. Therfore, a right of way (ROW) is a right to make a way over a piece of land,
usually to and from another piece of land. A right of way is a type of easement granted or
reserved over the land for transportation purposes, such as highway, public footpath.
Railtrasport, canal as well as electrical transmissionlines, oil and gas pipelines. Aright way
is reserved for the purposes of maintenance or expansion of existing services with the right
of way in the case of an easement, it may revert to its original owners if the fscility is
abandoned.
2.7.10. The enforcement of Property Rights.
The property rights component is an assessment of the ability of individuals to accumulate
private property, secured by clear laws that are fully enforced by state. It measures the
degree to which a country`s laws protect private property rights and the degree to which
governments enforces those laws. It also assess the likelihood that private property will be
73
expropriated and analyzes the independence of the judiciary, the existence of corruption
within the judiciary, and the ability of individuals and businesses to enforce contracts
(Baker, 2011).
The property rights are theoretical socially enforced constructs in economic for
determining how resources or economic goods is used ansd owned. Property rights can be
viewed as an attribute of economic good. This attribute has four broad components and is
often referred to as abundle of tights:- the right to use the good; the right to earn income
from the good; the right to transfer the good to others, alter it, abandonit, or destroy it (the
right to ownership cessation); and the right to enforce property rights.
2.7.11. Construction or Building Materials and Technologies.
There are anumber of items which are used in construction of buildings and other rural
infrastructures some of them are naturally available and some of them are artificial. Many
construction materials are used for same purpose but each of them has their o0wn quality,
durability, and stability, we have to choose construction materials according to purpose
and resources available, items, materials supplied or consumed in construction work.
Types of construction materials are:- stone, bricks, lime, cement, metal, cerimics,
timber,sand, aggregate mortar. The construction materials can be further divided in to two
categories, first naturally available matrials and second indudtrial made materials.
Naturally available materials are_ clay/earth/soil/rock; wood/timber; sand, while the
artificial or industrially made materials are:- cement, bricks, steel, titles, ceramic, paints
and varnishes, glass, plastic, stone,, lime and extra.
74
UH-HABITAT`s Shelter Initiative for Climate Change Mitigation and Adaptation aims to
encourage the use of low-c0ost energy –efficient sustainable building materials and
construction technologies and green building and neighbourhood designe in order mitigate
and adapt to the new conditions of cimate change. The initiative is developed within the
framework of UN-HABITAT`s Sustainable Urban Development Network, and accordingly
with the Kyoto Protocol.
Local governments, developers as well as building and construction industry will be
encouraged to use materials and products with identifiable recycled content. The industry
will Also be advised to use natural, plentiful or renewable materials, such as erath, sand
gravel and extra. Use of locally available,locally produced materials will be promoted
as they minimize the use of energy or pollution caused by transportation of materials.
Finally, materials that have longer lasting or are compatible to conventional products with
long life expectancies will be highly recommended for building and construction use.
According to Sustainable Urban Development Network, (2016), energy efficient and
sustainable building materials and technologies offer many benefits to building owners,
building occupants, which includes positive impact on local economy, energy conservation
and improved occupant health and productivity. Using green building materials and
products promotes conservationof the declining non-renewable energy resoueces
worldwide resulting in the reductionof negative environmental impacts associated with
extension, transportation, processing, fabrication, and installation, reuse recycling and
disposed of building materials.
75
2.8. Land Use Zoning
Zoning regulation is defined as collective property right (Fischel, 2012), or as municipal
property right because it is one of the most important regulation in land use which is
undertaken by local governments (Fischel, 1998). Baldwin, (1985), pointed out that zoning
means prohibition of certain developments or activities in designated area, and
undoubtedly the most common deliberate control wielded over land use. Land zoning
divides the entire urban locality into land use zones that specify the uses permitted in that
zone and the applicable regulations. The role of land use planning in Household disaster
risk management is one of the most challenging issues to implement because of conflicting
values held about land by different segments of the population. Deciding how to use land
is demanding enough. It is even more challenging if there are competing views about the
role that land should play in reducing collective exposure to risk. All land use activities are
expected to comply with the zoning ordinance in order to protect health and safety of
communities. This compliance must be demonstrated prior to establishing utility service,
obtaining a building permit, or securing a privilege license.
Most urban cities can record success in attracting jobs in high tech light manufacturing and
services, information technology, food processing, hospitality and entertainment, printing
and publishing, retail and wholesale businesses, educational institutions and clusters,
health care service and provision, medical and biotech research and manufacturing, and
construction, including green development. There are synergies among these economic
activities, with hospital and medical clusters attracting once and service space, retail, and
some educational activities, such as training home health aides.

76
In addition to permitted uses, the zoning by-law regulates the height, location and size of
buildings; establishes minimum lot areas and frontages for new building lots; and
establishes the minimum number of parking spaces and the minimum amount of
landscaped open space that must be provided for various uses. It allows uses and
improvements, requirements on the location, size and coverage of structures and
improvements, design specifications for particular uses, improvements and types of
development, environmental protections and procedural requirements.
According to Fischel (1998) zoning regulation puts different constraints on land
development as most of the classifications in land use can be changed without asset of land
owners who are affected with changes (Fischel, 1998). Zoning regulations can include use
of the plot; for example, residential, commercial, agricultural, or industrial, can define
maximum building height, as well as number of units on the parcel, boundaries for
building towards the neighbors’ and street, requirements for parking and finally, demand
paid by developers for related infrastructure such as sewer and roads (Fischel, 1998).
Sandroni, (2011), in his article states that land scarcity is the result of the zoning
restrictions together with bad accessibility and because of owners’ ability to keep the
serviced land vacant. And zoning regulations also define, as mentioned, maximum FARs
in different part of the city, but as Brueckner, (2009) argues these limits are not big
constraints on development as FARs often tend to follow the market to operate efficiently.
Zoning can be used to direct the location, type and scale of development as long as the
market demand exists to support the type and scale of land use planned. Six elements of
zoning can be identified: - incentive zoning, inclusionary zoning, natural hazard zoning,
77
intensity zoning, functional zoning and form –based zoning(Sandroni, 2011). Incentive
zoning, provide developers with rewards in exchange for including certain public amenities
or meeting other public objectives. For example, incentive zoning can include density or
floor area bonuses, which allows a developer to build to greater densities so long as they
include certain public amenities, such as parks and open space that benefits community at
large. Density bonuses act as an incentive because developers generate higher return by
reducing the marginal cost of development by building greater densities.
Inclusionary zoning is a policy which requires housing developers to include a certain
percentage of affordable units in their projects to create mixed-income communities. In
United States, the United Kingdom, the Netherlands and South Africa inclusionary zoning
policies have been applied. In fact this inclusionary zoning is appropriate in developing
country cities like Eldoret Urban Area, to incorporate the urban poor in the formal spatial
structure or estates.
However, zoning is one of the most commonly used regulatory tools to plan, control, and
separate urban land uses in developed and developing countries. It is a method by which a
development plan such as Master Plan and or Zoning Ordinance segregates parcel of urban
land ascribes broad classifications of appropriate uses, such as residential, commercial,
height, density, plot ratio, adequate daylight, air, open space and privacy within each zone.
The common practice is for zoning to be complemented with other control mechanisms,
such as plot ratio, land subdivision and building regulations. The primary intension is to
separate incompatible uses, preserve the character of a neighborhood and implement
planning goals, while building new development (Sandroni, 2011).

78
Most land use zones are single-use prescriptions. However, it is possible to allow a
combination of compatible uses such as residential and retail or subcategories within
specified zones; for example, a residential zone may have subcategories indicating
residential occupation at various densities. Critics have increasingly pointed to: the delays
and cost creating regulations involved in zoning; its tendency to be static and rigid and
segregate uses (Morales and Smolka, 2013). The needs and conditions of development in
developing countries are often different from those in developed countries, and require a
more flexible set of standards than what has been introduced based on European or
American experiences (Sandroni, 2011). Asian Cities, for example, are frequently in use of
all types of mixed activities, including residential and commercial (Banerjees, 2014).
Urban Planners that support new urbanism have advocated replacing single use zones with
mixed land use environments which foster heterogeneity of City life and healthy
communities by providing opportunities for social integration and community life that do
not exist in single use, suburban-style development (Banerjees, 2014).
Natural hazards zoning refers to the designation of flood plains, land slide zones, etc. With
climate change impacts becoming increasingly evident in developing country cities, there
is an increased need to incorporate these impacts into local natural hazards zoning
(Sandroni, 2011). Regulatory natural hazards zoning should also be combined with other
types of instruments, such as: economic instruments, an awareness instruments, for
example, making local people aware of the severe danger they face by living in hazard
zones; and investments instruments such as providing relocation areas (Sandroni, 2011).
79
According to Nolon (2011) by 2039 US urban population would increase by 100 million,
however, over one-third which translates into forty million new households members
would live, work, and shop in these urban buildings, traveling from one area to the other
and beyond, largely by car. Where the buildings that house and employ these additional
people are located, how energy conserving they are, and how far these new Americans
must travel from one area to the other would greatly affect the emission of CO2 and how
vulnerable new development would be to sea level rise and natural disasters that
accompany climate change. Many of these new Americans would be attuned to urban
living; many of them are young households looking for residency in vibrant places, others
are immigrants whose skills are needed in urban places, and a large number are aging
couples and individuals among whom there is a growing market for urban places to retire.
2.8.1. `Functional Zoning.
Functional zoning or functional city zoning is amethod used for dividing land use by its
fuinction. According to Fischel, (2012), land use is divided in two ways by its function and
by its physical characteristics. An example of functional zoning would be an area that has
designated zones based on function such as an industrial zone, arecreational zone and
residential zone. An example of an area zoned by its physical characteristics is defined in
terms of characteristics like development density, minimum lot size, and building
coverage, placement and height. Functional zoning tends to create or increase car
dependency, while mixed use zoning tends to enable walking, making it more sustainable.
It has been critised for causing the squandering of land, energy and time (Fischel, 2012).
80
2.8.2. Formed Based Zoning.
Zoning was created in the early 20th
century as arespose to problems associated with
overcrowding in central cities and the intruision of heavy industry into retail and
residential areas. Developed in the later years of the industrial revolution, zoning sought to
address these problems through separating incomatibleuses and limiting residential
density.
The New Urbanism movement (1980 to present), has attracted agreat deal of interst I re-
creating walkable, mixed-use neighbourhoods. As an outgrowth of this movement, form-
based codes or zonng are the latested technique to re-examine the underlying zoning
principle of separating uses and instead provide new means to develop vibrant mix-use
communities. This is accomplished by placing astrong focus on the creation of proper
urban form, wherein mixtures of uses can floueish.
2.8.3. Intensity Zoning.
Intensity zoning is defined as land use zones of permitted intensity, such as the number of
residential units per unit of surface or allowed commercial surface. Such regulation enables
alevel of flexibility in urban development since it permits developers to select which types
of development taxes place as long as this development abides by density constraints.
Intensity zoning, emphasis the high density, average density, low density and no
development. In fact, the low income resident in the neighbourhoods of Eldoret Urban
Areas appears to be high density.
81
2.8.4. Incentive zoning.
Incentive zoning is a tool that can be used to grant provisions that developers want in
exchange for desired public improvements, needs, and goods. Incentive zoning contributes
to strong public-private partnerships and provides flexible, performance based tool that
eplaces “sticks” with “carrots” for smart growth and economic development. Jacobs,
2012), argues that one of the first application of incentive zoning was in New York City,
where increased floor area was provided to office building development in exchange for
the provision of public plaza space accessible to the public at the base of the building.
Jacob (2012), said that incentives can come in many forms:- density bonus, reduced
parking requirements, and other permitting and financial bonus. Those public goods sought
by community in exchange for incentives should be defined through the comprehensive
plan or sector plans and might include public space or greenways, new connecting streets,
work force housing or historical preservation. Thus some important considerations for
incentive zoning include: - economic stimulus, public/private partnership, amenities
selection, incentive selection, administration, coordination and extra.
The Gwinnett County Unified Development Ordinance (2014), discusses both advantages
and disadvantages of incentive zoning. From the advantages perspective, incentive zoning
is one way to ensure that a community contiuesto preserve or enhance desirable public
amenities as it is experiences increased growth pressure. This incentive can help reduce
opposition to development projects by providing needed public amenities such as parks or
public art in exchange to project that developers finds most appropriate for the a location.
Incentive zoning provides a legal trail and clear process by which developers can achieve
82
development that they see as more beneficial to the bottomline. However, the ordinance,
highlights incentive zoning disasdvantages as that incentive zoning may be met with
resistance from some local community members. For instance, a new street connection
may be a traffic improvement that is needed area wide, but nearby residents or businesses
may not receive it well, hence raise concern about through traffic.
2.8.5. Natural Hazard Zoning.
Natural hazards zoning refers to the designation of flood plains, landslide zones, wetlands,
forest zones, oceanic/lakes and river banks. These zones are high- hazard risks areas that
need to be protected, minimum or classified development should be allowed in such areas,
therefore, the natural hazard zoning aims at protecting these fragile lands from general
development. In fact, it is this type or classification of land use zoning which is significant
in disaster risk reduction management.
2.9. Urban Land Transit Circulation and Connectivity
This focuses in ensuring that regional connections and roadways, pedestrians and bicycle
circulation, transit and circulation plan are well calculated designed and developed. This
makes it possible for movement in and outside cities. Lack of circulation and connectivity
can be cited as critical to access to and outside disaster scenes. This can lead to more
property destructions and more lives lost. It also helps in access to market and business
centers as well as industrial areas for job-related activities. In some places, difficulties of
circulation and connectivity cause households to move to and from work places on foot
slowing down economic activities. Moreover, areas with poor circulation and connectivity
83
would be slow in business start-ups and growth as catalyst to quick transactions would be
lacking.
The vast majority of all trips in urban areas are made by automobile and most of this travel
is on two state highways, County roads, and a series of section line roads. The
transportation system serving urban areas is and will continue to be challenged by
substantial physical constraints such as major drainage features, land, and mountain
ranges. There are also non-physical constraints to developing a regional roadway network.
Previousl) approved planned household zoning applications and the greater planning area
precedes the regional transportation plans now in existence. In some cases, prior zoning
approvals do not adequately address regional transportation needs and compatible land
uses. Transportation infrastructure needs to access every corner of where households
would want to go and at the time they want to go there. The most common responses for
why the public transportation options were lacking were because they do not exist, they do
not travel where residents need to go, or they do not travel at the times residents need to
travel.
Urban households desire better connectivity to areas outside of their regions. This would
connect them with other cities and regions, recognizing that transportation routes in and
out of their urban areas are essential for increased economic development and regional
partnerships. This infers that inter-regional connectivity is critically important to the social
and economic welfare for urban households and their continued future growth and
prosperity, particularly access to the major metropolitan areas and connectivity with
proposed economic zone routes that would give access to neighboring communities.
84
Urban areas with guidance for establishing future planning corridors for major roadways
needed for regional connectivity to support projected growth and travel demand. Likewise,
transit studies and regional connectivity plans have occurred and the urban areas have
adopted a master trails plan for urban areas planning purposes. According to Birkmann
(2006) infrastructure is critical factor in determining investment location, nature of
business and security of a given area. Physical infrastructure is seen as an essential
precondition for industrialization and economic development (Mahmud, and Sawada,
2014). Studies show that the development of physical infrastructure improves an
economy’s long-term production and income levels of an economy in both the
macroeconomic endogenous growth literature.
The pressures on urban transport systems are increasing in most developing countries as
part of the process of growth. Motor vehicle ownership and use are growing even faster
than population, with vehicle ownership growth rates of 15 to 20 percent per year common
in some developing countries. The average distance traveled per vehicle is also increasing
in all but the largest, most-congested cities. This growth exceeds the ability to increase
road space, and the major impediment to the efficient working of the urban economies in
large-size cities, and particularly in megacities, is the level of road traffic congestion.
Travel speeds are decreasing and the travel environment for pedestrians and people-
powered vehicles is deteriorating. Downtown weekday traffic speeds are reported to
average 10 kilometers per hour (km/h) or less in Bangkok (Thailand), Manila
(Philippines), Mexico City (Mexico), and Shanghai (China); 15 km/h or less in Kuala
Lumpur (Malaysia) and São Paulo (Brazil). It is estimated that congestion increases public

85
transport operating costs by 10 percent in Rio de Janeiro (Brazil) and 16 percent in São
Paulo. Of the 16 developing-country cities with populations of more than 4 million, 5 of
them (Bucharest, Romania; Jakarta, Indonesia; Kinshasa, Republic of Congo; Lagos,
Nigeria; and Manila) cited average one-way commute times of one and one-quarter hours
or more (UNCHS 1998). Growth of measured gross domestic product (GDP) is also
reduced by freight congestion, delays and unpredictability, difficulties of conducting
business, and increasing signs of disarticulation of the labor market in some large cities
such as São Paulo, Mexico City, and Manila. All this is occurring despite the fact that
motorization is still at a relatively early stage in most developing and transitional
economies; most developing countries have fewer than 100 cars per 1,000 people,
compared with 400 or more per 1,000 people in the richer industrialized countries.
Furthermore, most transport-originated air pollution, as well as nonbusiness time lost to
congestion, is efficiency reducing but is not directly reflected in GDP statistics. The safety
and security of travelers is also diminishing in many large cities. Some of these impacts
can be, and have been, valued in monetary terms. Table 2.2 presents a summary of some
estimates of external costs of road transport at national and regional levels. Recent World
Bank estimates suggest that the total economic damage of air pollution represents up to 10
percent of GDP in polluted cities such as Bangkok, Kuala Lumpur, and Jakarta. For six
developing-country cities with a total population of over 50 million (Mumbai, India;
Shanghai; Manila; Bangkok; Kraków, Poland; and Santiago, Chile), World Bank estimates
show the costs of particulates and other vehicle emissions (excluding lead) as equivalent to
60 percent of the import cost of gasoline and over 200 percent of the import cost of diesel.
86
Parking is an important component of the Circulation & Connectivity’s overall
transportation network and influences various aspects of any urban area’s character
including urban design, walkability, traffic circulation, and economic development. County
and local government services, including the Judicial Center, the Courthouse, the Lake
County Administration Building, and the City Hall are the primary parking generators in
Downtown Tavares. During the visioning sessions conducted by City Staff in 2017, lack of
parking on the east side (mainly due to the Pavilion on the Lake and/or special events) of
Downtown was an issue identified by the participants. The dimensions of land transit
circulation and connectivity are;-
2.9.1. Traffic Calming.
High traffic speeds are frequent problem in the neighbourhood. The Institute of
Transportation Engineers defines traffic calming as changes in the street alignment,
installation of barriers, and other physical measures to reduce the traffic speeds and/or cut
through volumes, in the interest of street safet, livelibility and other public purposes. The
changes may include creating illusion of less space or reduction of roadway width.
The traffic calming guide for neighbourhood streets provides a guidances and procedures
for local community to puese traffic calming in their neighbourhoods streets. The purpose
of traffic calming is to lower vehicles speeds on neighbourhood streets without restricting
access. Traffic calming measures may also alleviate other issues such as cut-through traffic
or through –truck traffic, where motorists or truckers use neighbourhood streets to avoid
and bypass other nearby roads. Traffic calming tends to concentes on existing streets.
87
Wherea safety, maintenance, or operational issue arises folloeing installation of traffic
calming devices, may adjust, relocate or remove the relevant traffic calming devices as
necessary to address the issue, with the same fundingsource used to install the device
originally. The traffic calming devices include the guide which is characterized as non-
intrusive or vertical, horizontal and narrowing devices. Non-intrusive measures include
administrative measures such as a public information campaign, posting certain types of
signs to promote speed reduction, and utilizing pavement makings to reduce the number of
lanes or pavement travelway widths. Wegner, (2014), argues that the non- intrusive
devices offer the advantages that they do not physically constrain vehicle maneuvers and
thus are less invasive. This is particularly desirable for streets that serve as emergency and
bus routes. Other desirable aspects of non-intrusive devices are that they involve standard
signs and pavement makings easily recognized by motorists and can generally be less
costly overall than the vertical, horizontal, and narrowing measures. The non-intrusive
measures included in the traffic calming are community education, community gateways,
pavement making measures, speed display signs and additional $200 fine signs. However,
critics point out that some non-intrusive applications are not as effective because they do
not physically constrain vehicles to reduse speed.
The vertical, horizontal and narrowing devices of traffic calming are devices constructed
and installed on the street pavement surface to narrow the travelway or create vertical,
horizontal shifts on the roadway. These devices can be particularly effective in slowing
vehicles because they physically constrain vehicles to pass over, through or around
physical obstructions on the roadway. Speed humps are the most commonly used traffic
calming devices. Speed humps are among the most recognizable traffic calming devices
88
which may promote aquicker respose by motorists to reduce their speed. The other vertical,
horizontal and narrowing traffic calming are speed lump, speed table, raised intersections,
raised crosswalk and extra.
2.9.2. Street Section.
Abig, big part of urban design is the street. And abig part of designing the street is the
street section, which is the drawing that illustrates widths (right-of-way, driving lanes and
sidewalks), heights- building projections, trees and uses- cars, bikes, pedestrians. The
drawings are extremely helpful tools for designer, and it is especially useful to see sections
of existing street that one has experienced or seen in photos, quantify the qualities of street
space (Jacobs, 2010).
Tree preservation and replacement is partly an element of street section.Large mature trees
play a major part of shaping the visual characterbof the neighbourhood.Construction of
new streets and the addition of curbs and sidewalks to existinf streets can mean removal of
trees from the right-of-way. Walkingways are acombinationof paths, trails, and sidewalks
intended to help increase safe transit, circulatipon and connectivity throughout the
neighbourhood and to the adjucentareas and to help preserve neighbourhood character and
environment. Walkways strengthen connectivity to open spaces, parks, and other green
features as well as to homes, schools, and businesses. Walkways identify pedestrians
needs:- there is need for a continuous pedestrian system; removal of barriersthat restrict
pedestrian travel is needed; many existing neighbourhoods need pedestrian facilities.
89
Sidewalks and trails serve as critical links in the transportation network by providing
pedestrians access to commercial districts, schools, businesses, government offices and
recreaction areas. Because sidewalks and trails provide such fundamental services to the
public, they should be designed to meet the needs of thr widest possible rangeof users.
People with disabilities are better able to participate in the community if it is easier for
them to reach their destination. More accessible sidewalks and trails also mean better,
pedestrian facilities for every one. Neighbourhoods with well designedpedestrian facilities
are generally safer because more people are out walking. Unfortunately, many sidewalks
and trails do not adequately meetthe needs of people with disabilities, who make up one
fith of Kenyans population.
2.9.3. Bicycle Accommondation.
Bike lanes and bike routes are the two main types of bicyle transportation facilities. A bike
lane is portion of aroudway dedicated for bicyles use and designated with stripping ,
marking and signage. A bicycle route is part of bicycle system that is designated with
signage to encourage use of the route to provide contuinty of the system where separate
bicycle lanes are not present or may not be possible due to inadequate right –of –way
width.
2.9.4. Accessibilty Index.
Accessibility is linked with an array of economic and social opportunities, but congestion
can aolso have anegative impact on mobility. Accessibility is the measures of the capacity
of allocation to b reached by or to reach different locations. Therefore, the capacity and
90
arrangement of transport infrastructure are key elements in determining the accessibility of
locality.All location are not equal because some are more accessible than others, which
implies inequalities. Thus, accessibility consequently relies on two core concepts:- location
whereby each location has art of referential attributes, such its population, or level of
economic activity; the second is the distance, which drived from the physical separation
between locations. Distance can only exist when there is possibility to link two locations
through transportation.
According to Wegner, (2012), there are two spatial categories applicable to accessibility
problems, which are interdependent:- the topological accessibility which relates to the
measuring accessibility in asystem of nodes and paths that is transportation network. This
spatial category assumed that accessibility is ameasurable attribute significant only to
specific elements of transportation system, such as terminals- airports, ports or subway
stations. The second type of the spatial category is known as contiguous accessibility And
involves measuring accessibility over a surface. Under such conditions, accessibility is
acummulative mesasure of the attribuites of every location over a pre defined distance, as
space is cobsidered in a contiguous manner. Accessibility is agood indicator of the
underlying spatial structure since it takes into consideration location, as well as the
inequality conferred by distance to other locations.
2.9.5. Parking Standard.
Parking as part of an overall transportation system is one of the crucial issues of our times.
As the number of automobiles increases exponentially around the world, the need to house
them in close proximity to distations creates achallenging design pr0oblem. Therefore,
91
designing the parking facilities or lots requires an integrated design approach of many
professionals. The parking facilities is typically an exposed structure and must be designed
to withstand all aspects of environmental conditions.The constant use of parking facilities
as an expected part of our infrastructures and as revenue genmerating , requires unique
maintenance and operational needs. Operating parking facilities requires interactions with
general public and many legal rules and reguilations. Safety and security of the people
using parking lot are of paramount importance (Yen, 2012).
2.10. Disaster Management
A disaster is defined as a serious disruption of the functioning of a community or a society
causing widespread human, material, economic, or environmental losses that exceed the
ability of the affected community or society to cope using its own resources. A disaster is a
function of the risk process. It results from the combination of hazards, conditions of
vulnerability, and insufficient capacity or measures to reduce the potential negative
consequences of risk (UN/International Strategy for Disaster Reduction, 2004). Therefore,
disasters are not unpredictable and unavoidable events but rather unsolved problems of
development.
Disaster management (DM) refers to the systematic process of using administrative
decisions, organization, operational skills, and capacities to implement policies, strategies,
and coping capacities of the society and communities to lessen the impacts of natural
hazards and related environmental and technological disasters. This includes all forms of
activities, including structural and nonstructural measures to avoid (prevention) or to limit
(mitigation, preparedness, and response) the adverse effects of hazards (adapted from
92
UN/ISDR, 2004).Disasters, both natural and manmade, have the potential to lead to
significant human and economic losses (Paul & Hariharan, 2012). For the disaster to occur,
it has to be triggered by hazards, exposure and vulnerability. While hazards have been
viewed as any dangerous phenomenon, substance, human activity or condition that may
cause loss or life, injury or other health impacts, property damage, loss of livelihoods and
services, social and economic disruption, or environmental damage. Such hazards arise
from a variety of geological, meteorological, hydrological, oceanic, biological, and
technological sources, sometimes acting in combination. Vulnerability entails
circumstances, community, or systems or asset that makes it susceptible to the damaging
effects of hazard. Vulnerability could arise from physical, social, economic, and
environmental factors. Therefore, knowledge of the relationship of development, land use
and disaster risks provide urban planners with deeper understanding of what drives people
to locate themselves in high risk areas.
Disasters include such emergencies as fires, severe weather, tornadoes, earthquakes,
floods, pandemic events, and life threatening situations, equipment failures, cyber-attacks
or terrorist attack. They can strike anywhere at any time with little or no warning (Akeyo,
2010). Existing records, while less reliable, shows a relentless upward movement in the
number of disasters and their human and economic impacts (Ze-fu & Chuan-liang, 2012).
According to Altay and Green (2006), the main categories of disaster types consist of
hurricanes, cyclones, typhoons, floods, drought, earthquakes, volcanic eruption, epidemics,
famine, food insecurity, man-made disasters, population movement, and technological
disasters among others.
93
In many European cities, demographic growth is rather moderate or even negative and
mainly due to migration. The most significant factors affecting urban spatial growth are the
growing number of smaller households and the increasing space consumption by
households. The composition of household types within European cities changes from a
mixture of one-person to more than five-person households to a dominance of single and
couple households within the city and an allocation of family households into the suburban
area. This process is based on residential location decisions of individual households.
Concerning such residential location decisions Dieleman, (2001), Coulombel (2010), Knox
and Pinch (2010) each give a comprehensive literature overview. Rossi, (1980) shifted the
focus from an aggregated level to the individual household and its motivation to seek
another dwelling and pointed out the influence of the life-cycle on residential decision-
making. Wolpert, (1965) and Brown and Moore (1970) refined this approach into a
stress/resistance model.
Various versions of this model exist in the literature (Robson, 1975; Wong, 2002 and
Benenson, 2004). Households may move due to a large number of reasons mainly related
to economic, demographic and behavioural causes. Concerning possible classifications of
households, Coulombel, (2010) comes to the conclusion that a unitary vision of the
household keeps on prevailing in the economic literature on housing as well as in applied
modeling (Coulombel, 2010).
According to Altay and Green (2006), disaster event occurs when resources become
stressed, when non-standard procedures are implemented to save life or when special
authorities are invoked to manage the event. On the other hand, a routine or daily
94
emergency is typically managed with the resources of a single governmental agency, or
partial resources from several, using standard procedures, and with minimal dislocation.
According to Akeyo (2010), the most recurrent disasters in Kenya include floods, drought,
landslides, fires, HIV/AIDS, terrorism among others. While Cutter, Burton and Emrich
(2010) suggest that government should promote resilience and less vulnerability by
developing capacities that can be fostered through interventions and policies to help build
and enhance a people’s ability to respond and recover from disasters. But Comfort (2005),
maintains that protecting citizens from harm is the ideal role of government.
Equally, disaster risk management has attracted global attention. Many researchers in
various sectors including computer science, environmental sciences, health sciences and
business (Hristidis, Chen, Li, Luis, & Deng, 2010). Researchers argue that disasters can
cause businesses to reduced profits and revenues, customer loss, reduce market shares.
These can happen from brief business interruption and major business interruption that
threaten a community’s or a company’s survival (Kaushalya, Karunasena, & Amarathunga,
2014). The national and county governments are challenged to formulate and
implementing actions designed to anticipate risk, prepare citizens to manage risk, and
assist them in recovering from damaging events (Prater & Lindell, 2000). Moreover, it is
important to create mitigation awareness and forecasting, preparedness and coping
strategies to ensure any such eventual, victims are in better place than previous disasters.
However, most of the time recurring disasters find people more unaware of coping
strategies unlike before. For example, fires that destroy slums and shacks structures.
95
In Kenya, this has been experienced in Kariobangi, Sinai, all the Maker slums, Gikomba,
and recently Kijiji in Southlands. Again fires from fuel carrying tankers keep killing
Kenyans who fetch fuel from the fallen tanker. This happens as if it is the first time such
disasters are occurring. The preparedness was only witnessed when fire disasters were
destroying buildings blocking users inside. There the law was enforced on buildings to
have fire fighter devices, fire assembly, and exit routes from such buildings. However,
their effectiveness is yet to be established since people still experience major casualties
when fire strikes. In addition to that, collapsing buildings disasters are yet to have
functioning strategies to mitigate, create awareness and preparedness and recovery
approaches. It is left for users to instantly devise their mechanisms to evade such disasters.
And according to Karunasena and Amarathunga (2014) most slum and squatter dwellers
hardly seek more information on building safety for occupation. They end up occupying
buildings that could be collapsing in the next minute. Moreover, even if they are warned to
vacate a building because it could be collapsing soon, they rarely respond to such warnings
(Cox, and Perry, 2011).
According to Altay and Green (2006), disaster management has four phases comprising of
mitigation; preparedness; response; and recovery. The first two phases involve pre-disaster
hazard adjustments while response and recovery are associated with post-disaster actions.
Hazard mitigation provides passive protection at impact; for example, land use and
building construction practices that prevent property destruction (Prater & Lindell, 2000).
Disaster preparedness supports active response after impact, for example, warning systems,
emergency response plans, and mutual aid agreements that allow emergency personnel to
respond more quickly and effectively. Response involves efforts to minimize the hazards
96
created by a disaster such as search and rescue and emergency relief while recovery
usually meaning the restoration of lifelines and basic services (Waugh & Streib, 2006).
From a global perspective, annual losses from natural hazards alone are staggering. For
instance, in 2001, 700 disasters were identified, resulting in 25,000 deaths, $36 billion in
economic losses, and $11.5 billion in insured losses (Godschalk, 2003). The damage
caused by disaster depends on climate, the geographical location and the type of the earth
surface/degree of vulnerability and disasters adversely the mental, socio-economic,
political and cultural state of the affected area in general (Caymaz, Akyon, & Erenel,
2013).
Often, developing counties suffer more losses as compared to their developed countries
counterparts. For instance, In March 2011, a 9.0-magnitude earthquake struck Japan and
resulted in more than 20,000 people considered either dead or missing. The 2004 Indian
Ocean tsunami that was caused by an earthquake killed approximately 230,000 people in
Southeast Asia while more than 60,000 people were victims of the 2008 Sichuan
earthquake in China (Iwata, Ito, & Managi, 2014). Even where economic losses in the
developing countries tend to be more when considered relative to the country’s Gross
Domestic Product (GDP).
Further, when disasters strike in developing countries, relief s may face additional
challenges. The local government does not always cooperate with the international relief s,
security problems impede access to the victims, and a population’s extreme poverty
increases its vulnerability (Kunz, Reiner, & Gold). Recently, though, there has been a
paradigm shift from traditional relief approach to disaster management incorporating a
97
more holistic and long term approach as part of the development planning process
(Caymaz, Akyon, & Erenel, 2013). According to Claudianos (2014) the millennium
heralded a paradigm shift from vulnerability towards resilience as a lens through which
exposure to risk has been explored. The focus moved from weakness to strength.
Nakuru County is one of the 47 devolved governance units in Kenya. It therefore forms a
focal unit for disaster risk management, besides having key characteristics that are
associated with disaster proneness such as rapid human population growth, urbanization,
and increasing concentration of property contributing exposure to greater losses should
disaster occur (Mayunga, 2009). According to Ze-fu and Chuan-liang (2012) the exposure
of economic assets to emergency incidents and disasters in cities will also grow. The
seeming randomness of impacts and problems and uniqueness of incidents demand
dynamic, real-time, effective and cost efficient solutions, thus making the topic very
suitable for study in the County (Altay & Green, 2006). In addition, the County
government performs numerous other functions that have a direct bearing on planning and
particularly on hazard identification and post-disaster recovery and acts as sites for
implementing numerous national programs (Schwab, 2014).
While these areas of activity are often referred to as separate “phases” or components of
disaster management for administrative funding and programming purposes, in reality they
overlap and affect each other.
Disaster risk reduction is founded on the principle that the adverse impacts of hazards can
be managed, reduced, and sometimes even prevented by taking appropriate actions to
decrease people’s exposure to hazards and their susceptibility to hazard impacts.
98
Conversely, understanding and increasing people’s capacity to anticipate, cope with, resist,
and recover from hazard impacts is an essential component of reducing vulnerability. DRR
aims to enable societies to be more resilient to natural hazards and to ensure that
development does not inadvertently increase vulnerability to those hazards. Therefore,
recovery activities should do more than merely return disaster-affected people and
institutions back to the situation that existed before a disaster. In particular, the recovery
phase of a disaster response also offers opportunities to strengthen the capacity of
communities and their governments to cope with the impact of disasters and to reduce their
vulnerability to future hazards and shocksfor instance, through restoring destroyed
mangroves as protection against storm surge, increasing fishing opportunities, or
developing the disaster management skills of local government authorities. Likewise, DRR
should be incorporated into regular development planning and programming to reduce or
avoid the negative impacts of future hazard events. DRR is implemented using DRM
approaches.
Disaster-affected populations initially will require critical life-saving support. At the same
time, their communities, institutions, and livelihoods will have been physically destroyed
or weakened by the impact of the crisis. Many households and communities will begin a
process of self-recovery as soon as possible after a disaster, out of practical necessity. The
vulnerabilities that turned a hazard into a disaster in the first place often get recreated in the
process. For example, homes may be reconstructed using the same building techniques that
caused them to collapse. Poor households may resort to selling off their scarce productive
assets in the immediate aftermath of a disaster in order to meet their basic needs and
become even more vulnerable to future shocks. International experience also has
99
demonstrated the close links between relief and recovery. The choices made regarding the
kinds of relief assistance to be provided, and how it is provided, can facilitate or hinder the
recovery of affected communities (Christoplos, 2006a). For instance, following the 2005
Pakistan earthquake, instead of distributing expensive winterized tents with a limited
lifespan, the Pakistan Poverty Alleviation Fund (PPAF) provided affected communities
with corrugated galvanized iron sheets and tools. The tools and materials were used by
communities to build themselves temporary shelters using wood and other materials
salvaged from the rubble. They could be used later in permanent home reconstruction.
The choices made regarding the provision of relief also can have positive or negative
impacts on reducing disaster risks—for example, undertaking a rapid environmental
impact assessment to identify whether toxic substances have been released into the
environment following an earthquake (e.g., the chemical leaks from factories damaged by
the May 2008 earthquake in China1) and then mounting a campaign to reduce the threat to
nearby communities. For these reasons, relief needs to be carried out with a view to
supporting and reinforcing the early recovery and risk reduction of disaster-affected
populations.
When a natural disaster strikes in a poor community, not only does it cause serious loss of
life and property, it often takes away or threatens the livelihoods and futures of those who
survived. This is especially the case where productive household members have been lost
or permanently disabled. For many households, not only will their short-term economic
and social vulnerability be increased, but their ability to cope with future shocks may also
be eroded. These pressures can contribute to increased poverty and marginalization in a
100
society. They can aggravate tensions or conflicts that may have already existed within or
between communities prior to the disaster. In the case of slow-onset or regularly recurring
hazard events or shocks, many poor communities live in a constant state of recovery,
where temporary relief has become a permanent coping strategy. For example, in Malawi
drought occurs with such frequency that people have little time to recover before another
drought hits. This has resulted in deepening poverty, chronic food insecurity, and aid
dependency. Thus, in order to be effective and sustainable, recovery initiatives must be
linked to the national and local development context and processes, as well as an
understanding of the economic, social, and political conditions that existed prior to the
disaster. Some of these are likely to have been contributing factors to the risk and
vulnerability that turned the hazard event into a disaster; othersfor instance, underlying
structural issues may have an impact on the strategies adopted for recovery. Lack of
understanding of these processes can lead to poorly targeted and inappropriate assistance.
This is equally the case for infrastructure rehabilitation and reconstruction. There are many
examples of schools and health centers rebuilt after natural disasters that could not afford
ongoing maintenance costs or the staff to run them.
Disasters of all kinds happen when hazards seriously affect communities and households
and destroy, temporarily or for many years, the livelihood security of their members. A
disaster results from the combination of hazard risk conditions, societal vulnerability, and
the limited capacities of households or communities to reduce the potential negative
impacts of the hazard. The recognition of vulnerability as a key element in the risk context
has also been accompanied by growing interest in understanding and enhancing the
positive capacities of people to cope with the impact of hazards. The existence or absence
101
of appropriate socio-economic and institutional systems to mitigate or respond rapidly to
hazards determines a society’s or a community’s susceptibility or resilience to the impacts
of hazards. In other words, the coping capacities ensured by these systems translate
directly into enhanced resilience.
A potentially damaging physical event, phenomenon or human activity that may cause the
loss of life or injury, property damage, social and economic disruption or environmental
degradation. Natural hazards can be classified according to their geological (earthquake,
tsunamis, volcanic activity), hydrometeorological (floods, tropical storms, drought) or
biological (epidemic diseases) origin. Hazards can be induced by human processes (climate
change, fire, and mining of non-renewable resources, environmental degradation, and
technological hazards) Hazards can be single, sequential or combined in their origin and
effects.
A serious disruption of the functioning of a community or a society causing widespread
human, material, economic or environmental losses which exceed the ability of the
affected community or society to cope using its own resources. A disaster is a function of
the risk process. It results from the combination of hazards, conditions of vulnerability and
insufficient capacity or measures to reduce the potential negative consequences of risk.
The probability of harmful consequences, or expected losses (deaths, injuries, property,
livelihoods, economic activity disrupted or environment damaged) resulting from
interactions between natural or human-induced hazards and vulnerable conditions.
102
The purpose of Disaster Management is to reduce the underlying factors of risk and to
prepare for and initiate an immediate response should disaster hit. The Disaster
Management Framework (DMF), considers conceptually, DM as a continuum, and thus as
an ongoing process of interrelated actions, which are initiated before, during or after
disaster situations. The framework is aiming, in particularly, at countries and regions,
which face recurrent exposure to natural hazards. DM actions are aimed at strengthening
the capacities and resilience of households and communities to protect their lives and
livelihoods, through measures to avoid (prevention) or limit (mitigation) adverse effects of
hazards and to provide timely and reliable hazard forecasts. During emergency response,
communities and relief agencies focus on saving lives and property. In post-disaster
situations, the focus is on recovery and rehabilitation, including, however, the concept of
“building back better”. This implies to initiate DRR activities also during recovery and
rehabilitation. The paradigm shift to conceptualize DM as continuum (and no more in
phases) reflects the reality, that the transition between pre- during and post disaster
situations is fluid, in particularly in countries, which are regularly exposed to hazards. The
elements of the framework7- further elaborated - include both structural (physical and
technical) and non-structural (diagnostic, policy and institutional) measures.
2.11. Dimensions of economic vulnerability to Disaster Management
Interest in assessing the sustainability of socio-ecological systems of urban areas has
increased notably, with additional attention generated due to the fact that half the world's
population now lives in cities. Urban areas face both a changing urban population size and
103
increasing sustainability issues in terms of providing good socioeconomic and
environmental living conditions. Urban planning has to deal with both challenges.
Urban residents of low income neighbourhoods play a major role by being affected by
urban planning decisions on the one hand and by being responsible among many other
factors for the environmental performance of a city (e.g. energy use). We here present an
agent-based decision model referring to the city of Vienna, the capital of Austria, with a
population of about 1.7 million (2.3 million within the metropolitan area, the latter being
more than 25% of Austria's total population). Since the early 1990s, after decades of
negative population growth, Vienna has been experiencing a steady increase in population,
mainly driven by immigration.
The positive correlation of income and energy use is long established in the traditional
energy literature (Vringer and Blok, 1995; Pachauri and Spreng, 2002; Cohen et al.,
2005; Wier et al., 2001; Lenzen et al., 2006; Dey et al., 2007; Weber and Matthews, 2008).
Demographic factors such as population growth, household size, average household age
and migration influence urban energy usage. Household size plays an important role in
energy use: above two persons per household, economies of scale can reduce the energy
consumed per capita (Pachauri et al., 2004; Lenzen et al., 2004, 2006; Weber and
Matthews, 2008). Urban populations may have significantly smaller household sizes than
rural populations, due to smaller family sizes and a larger generation gap as well as smaller
dwellings, and are thus less likely to shelter extended families or many generations under
the same roof. The evidence for age is mixed. The most important impact of age may be
through changing household sizes and changing income level.
104
2.11.1. Urban Residents Income, Saving and Consumption in low income
neighbourhoods
From the economics perspective, an individual income, consumption and saving,is factor
which would determine once welfare or standard of living, hence is an economic variable
whch would influences his/her vunarability to disaster management. All these would be
determined by the disposable income of an individual. However, the disposable income is
an element of national income or GDP of a country. National income is abroader national
level economic measure than is personal income. National income includes payments to
individuals (income from wages, and salaries, and other income), plus payments to
government (taxes), plus retained income from the corporate sector (depreciation,
undistributed profits), less adjustments (subsidiaries, government and consumer interest
and stastical discrepancy). Personal income measures national level income to persons and
nonn profit corporations. Personal income includes payments to individuals (income from
wages, and salaries, and other income), plus transfer payments from government, less
employee social insurance contributions. Disposable income measures the after tax income
of persons and non profit corporations.It is calculated by substracting personal tax and
nontax payments from personal income amount of money that households have a vailable
for spending (consumption), and saving after income taxes have been accounted for. Low
income residents in the urban neighbourhoods tends to have low income, hence, low
spending(consumption), and low saving, hence, low economic capacity to build economic
resilience to cope up with the urban neighbourhood vulnarabilties to enable them reduce
disaster in their settlements.
105
2.11.2. Urban Residents Employment Opportunities in low income neighbourhoods.
Economists use the term natural unemployment rate to refer to the unemployment rate
exists when the economy is either in a neither recession nor boom and real GDP is equal to
potential GDP. It has been observed that the actual unemployment rate rises above
the natural unemployment rate when the economy goes into recession and real GDP falls
below potential GDP. And unemployment rate falls below the natural rate when the
economy goes into boom and real GDP rises above potential GDP.
From the economists’ perspective, unemployment refers to number of unemployed, those
who are of working age, who are without work, but who are available for work at acurrent
wage rates, but are unable to acquire any. Unemplyment cause much hardship to those who
experience it. Beyond the obvious ahardship of economic loss, unemployment can have
amore devastating effects on people. If unemployment persists, people ma fall into
poverty. Thus, the urban residents in the neihbourhood settlement areas tend to have low
income to spend, consum, or save and then invest.
In low income neighbourhoods, majority of residents faces unemployment and this is an
economic vulnerability among them and therefore, makes their economic resilience to
disaster management weak. This is a factor also which made the urban residents in these
low income neighbourhoods to occupy the unserviced land which is hazard prone and
again occupying poor quality and quantity housing.
106
2.11.3. Credit facilities/Loans to Urban Residents in Low Income Neighbourhoods.
Urban Residents just like other residents in the Country need credit/loan to acquire
poperties, to improve their existin residential areas, or to start or expand their businesses. A
credit facility is atype of loan made in businesses or corporate finance context. It allows the
borrowing business to take out money over an extended period of time rather than re-
applying for loan each time it needs money (Saches, 2012). On the other hand, loan is
aform of debt incurred by an individual or other entity .The individual borrower directly or
indirectly, approaches the financial institutions or banks for secured or unsecured loans.
The leader may require collateral and the borrower must agree to be re-paying the principle
amount and interest,
Credit facilities may be of the following forms;- a retail credit facilty, a revolving
loanfacility, and a committed facility.Robinson (2012), defines credit as arrangement
between a bank and business that allows the borrower – person,or business to borrow a
particular amount of money , and then to borrow more money if part of the original loan is
paid back. Credit facilities are utilized broadly across the fincial market as away to provide
funding for different purposes, foe instance, businesses, residential improvements, property
and extra.
2.11.4. Urban Residents Investment in low income neighbourhoods.
Many people just like you turn to the markets to help buy a home, send children to college,
or build a retirement nest egg. But unlike the banking world, where deposits are guaranteed
by federal deposit, insurance, the value of stocks, bonds, and other securities fluates with
107
market conditions. No one can guarantee that you will make money from investments, and
they may lose value. Protecting investors is important.
Afew people may stumble into financial security. But for most people, the only way to
attain financial security is to save and invest over long period of time. You just need to
have your money work for you, that is investing. In the modern economy, there are various
ki nds of investment products such as :-stocks, bonds, municipal bonds, mutual funds,
exchange, annunities, certificate of deposit, money market funds, real estate investment
trust, international investing and extra.
According, to Robinson (2008), knowing how to secure your financial well-being is one of
the most important things you will ever need in life. But if you get the facts about saving
and investing and follow through with an intelligent plan, you should be able to gain
financial security over the years and enjoy the benefits of manging your money. However,
the ability to invest, to alarger extent would be determined by the level of investment in
low-income neighbourhoods, with low level education. Another factor, likely to determine
the level of investment is the ability to acquire security in terms of collateral, which is to
be deposited to banks or any financial institutions. In developing countries, the land titles
or land tenure security forms the main collateral for credit or loan security. Yet in most
cases this is lacking mainly amom=ng the low income residents in urban neighbourhoods.
From the economic perspective, investment would also be determined by the level of
individual saving, consumption and the level of disposable income as well as the
availability of employment opportunities.
108
2.11.5. The Provision of Urban Services and Green Infrastructure to Urban Residents
in Low Income Neighbourhoods.
Urban services delivery is growing priority as poverty is urbanizing. Densely populated
urban areas especially in the low income urban neighbourhoods, place pressure on service
delivery systems resulting in numerous, often uncoordinated and unregulated providers.
Therefore,as argued by Rabe (2014), improving service delivery for urban poor is a
priority, especially among the low income residents neighbourhoods of slums and inormal
settlements. The urban services are mainly the water supply, electricity, waste product
management, urban transportation, housing provisions, parking facilities provisions as well
as open spaces, including recreation facilities provisions and the green infrastructure
facilities.
Communities a cross the Country including the urban communities, want to protect their
water quality, while also getting the greatest possible benefits out of every investment they
make. Many are conserving, restoring, or enhancing natural areas while incorporating
trees, rain gardens, vegetated roof, and other practices that mimic natural systems into
developed areas to manage rain water where it falls. Krabben, (2016), states that green
infrastructure can improve water quality, attract investment, revive distressed
neighbourhoods, encourage redevelopment, and provide recreational opportunities, and
help achieve other social, econpmic, public health, and environmental goals.
In developed areas, much of land is covered by buildings, pavement and other
impermeable surfaces that prevent rain snowmelt from soaking into the ground. Instead
this water runs off, often flowing directly to streams, rivers and other water bodies. It can
109
carry pollutants such as oil, chemicals, and lawn fertilizers. In addition, the quantity and
speed of flow can cause soil erosion, flooding, and damage to quatic habitat, property and
infrastructure.
Green infrastructure includes arrange of approaches for managing stormwater near where it
falls. Most of green infrastructure uses the natural processes of soils and vegetation to
capture slow down and filter runoff water, often allowing it to recharge ground water, but
some practices collect and store rain water for future use (Krabbe, 2014). Some techniques
including using permeable pavements, blosswales, raingardens, vegetated or green roofs,
rain barrels,and cisterns, work at the site scale and can fit into individual development,
redevelopment. Largescale management strategies, including preserving, or restoring flood
plains, open space, wetlands, and forests can be used at the watershed level.
Thus, green infrastructure aims at the attainment of sustainable communities. The Smart
Growth Institute (2010), state that sustainable communities are places that balance their
economic assets, natural resources, and social priorities so that residents diverse needs can
be met now and in future. Thsese communities prosper by attracting businesses and people
and offering individuals of all incomes, races and ethnicities access to the opportunities,
services, and amenities they need to thrieve. Consequently, green infrastructure is an
integral component of sustainable communities primarily because it can help communities
protect the environment and human health whi le providing other social and economic
benefits.

110
2.12. The Effects of Land Use Planning on Economic Vulnarability to Disaster
Management in Eldoret Urban Area.
This section of literature review, aims at discussing the influences of the independent
variables (dimensions), mainly floor area ratio, building codes or standards, building
heights, building construction materials, maximum/minimum lot size, right-of way or way
leave, open space and agricultural land conservation, fuctional zoning, formed based
zoning, incentive zoning, and intensity zoning, steet section, traffic calming, accessibility
index, bicycle accommondation, and parking lots on dependent variables (dimensions)-
urban residents disposable income, saving and consumption; urban residents employment
opportunities,the urban residents credit/loan for low income neighbourhoods; investment
opportunities for low income neighbourhoods residents and urban services and green
infrastructures.All these, variables are discussed in relationship to unplanned urban
settlements of low income urban areas areas of slums, informal settlements and per urban
areas of Kamukunji, Langas, and Kapsaos in Eldoret Urban Area. Kapsoya area, in this
case would be appoint of reference or control area.
2.12.1. Effect of Land Use Planning Regulatory Instruments on Economic
Vulnarability to Disaster Management.
The Land Use Planning Regulatory Instruments indicators includes the floor area ratio,
plot ratio, way leave or right-of-way, building permits, building codes or standard, building
heights, building or construction materials, maximum or minimum lot size, open or green
space, enforce,ment of property right, and agricultural land conservation and extra. The
process of implementing the above indicators within a planning neighbourhoods or area
111
like municipality, county, country or community lies on the hands of planning
implementation authority which could be either alocal government or municipality, or
county or country planning authority. Bruckner, (2012), highlighted the aims or goals to be
achieved by implementing the above indicators in aparticular neighbourhood as:- to enable
urban residents access the urban services, green infrastructures, increased land value,
achieve affordable housing and serviced land, parking facilities, safe roads and streets
ensuring proper connectivity and circulation, reduction in road accidents or to ensure
safety and security for the urban residents, ensure public health and environment, to check
of neighbourhood population density, check on urban sprawl and encourage urban
compactness as well as urban growth and quality, quantity housing and reduction of
residents disaster risks such as floods or fire.
Paynee (2012), argues that planning institutions and authorities responsible for
implementing the land use planning regulatory instruments, especially in the developing
countries in African cities, appears to be weak and ineffective, thus, uable to enforce these
instruments, making instruments goals unachievable. This explains way building keeps on
collapse in cities. For instance, in Nairobi city this is the case, and many have lost their
lifes. In Kapsoya estate, aformal spatial structure in Eldoret Urban Area, which is appoint
of reference or control for this study, the implementation of there instruments appears to be
lacking, this is evidenced by tall buildings which hasd cropped up in the area and have
failed to check on the area density and crowdness, putting pressure on the available urban
services and green infrastructure in the area.

112
Again, the goal of agricultural land conservation and open space Hs also been facing
achallenge due to poor or weak implementation on regulatory instruments. This can seen in
the Kapsos, a pre-urban area, on the Eldoret Urban Area outskit, which is being
encroached by the dense urban population which has brought large pieces of land into
urban set up. Many pre urban areas around Eldoret Urban Area such as Illula, Kapsaret,
Kiplombe, areas under pressure, and more land has been transferred from agriculture to
urban transferred from agriculture to urban built-up, threatening food security issue in the
town as well as in the country. This is also true to the open/green spaces within Eldoret
Urban Area which has been targeted by land grubbers.
In the words of Carlos Morales, (2012), land use planning regulatory instruments,
are not applicable in the low income settlements like slums and informal settlements, like
Kamukunji and Langas in Eldoret Town. In the first place, land use regulatory instruments
are implementable in these neighbourhoods, since, they are out of planning authority.
Although, their implementation in the low income neighbourhoods, are likely to have
influence on economic vulnerability to disaster management in Eldoret Urban Area. The
applicability, of the land regulatory instruments in Eldoret Town, low income
neighbourhoods included, are likely to generate employment opportunities in the building
and consteruction sector. The created employment opportunities, in construction industry
would enhance, urban residents’ disposable income, hence, saving and consumption, thus
improving on poverty level, among the low income urban residents in Eldoret town, and
therefore, enablethem to built economic resilience to manage disaster in their settlements.
The enhanced income among the urban residents would enable them to acquire
113
credits/loans to involve in investment in improving their housings and even start new
businesses.
2.12.2. Effect of Land Zoning on Economic Vulnarability to Disaster Management.
Fischel, (2011), identified the land zoning, indicators as functional zoning, formed based
zoning, incentive zoning, and intensity zoning. He argued that all the four zoning
indicators may have influence on economic vulnerability to disaster management in low
income neighbourhoods of urban spatial area. For instance, the functional zoning which
tends to analysis land use o0f spatial area in terms of its functions such as, the residential,
industrial, commercial, recreational zones, would determine the urbanresidents ability to
acquire income, employment, credit/loan facilties, investment as well as urban services and
green infrastructure. The industrial areas, commercial areas, are the two functional area
where job opportunities are created and sustained. In Eldoret Urban Area Langas, the
informal settlement and Kamukunji the slum areas developed as result of the development
of Rivertex industry for the case of Langas and light industries for the case of Kamukunji.
Therefore, the functional zoning tends to increase the demand for serviced land and land
value in the area.
On the other hand, Yuen, (2010), pointed out that, incentive zoning is a tool that can be
used to grant provisions that developers want in exchange for desired public
improvements, needs and goods. Thus, those public goods sought by the community in
exchange incentives should be defined through the comprehensive plan or sector plans and
might include public space or greenways, new connectivity streets, or historical
preservation. All these are needed by the urban residents, of EUA, including managing

114
disaster risls in their settlements. Policy makers, mainly, in the urban jurisdication, need
the intensity zoning to make decisions with regard to development in various settlement
areas of municipality.With regard to housing, and urban services as well as green
infrastructure, the issue of high density, average density, low density and no development
are all important.
2.12.3 Effect of Land Transit Circulation and Connectivity on Economic
Vulnarability to Disaster Management.
Wegner, (2014), identified the indicators of lan transit circulation and connectivity as-
traffic calming, street section, biclycle accommondation, accessibility index, and parking
lots. These indicators tend to have influence on economic vulnerability to disaster
management among the urban residents. The urban resident uses urban streets, parking,
bicyvle lines, walking lines, to access and move to other places or points. Therefore, the
proper use of the above indicators to alarger extent has influences on the number of
accidents that occur in aparticular street. In fact, these indicators would determine the
urban resident’s level of safety while using urban streets.
The provision of bicycle lines and walking lines are two circulation and connectivity transit
indicators which are useful for the urban residents to encourage walk and bicycling, hence, tends
to promote urban residents health and safety. Parking lots tends to generates income to the
municipality or local government which could be used to evelop other urban infrastructure as well
as urban services. These indicators could as well reduce urban congestion and pollution to the
urban residents.
115
2.13. Evaluation of Land Use Planning Strategies on Economic Vulnability to Disaster
Management.
URrban areas suffer greater fatalities and economic losses than rural areas. This is due to
compactness nature of urban areas. Africa and Asia, which have the highest rate of urban
growth globally, are also experiencing the fastest rate of increase in the incidence of
natural disaters, over the last three decades (UN-HABITAT, 2007).Given these trends,
without change in the management of disaster risks and urbanization, risk to cities
residents will increase in the future as population grow. Eldoret is amedium town with
apopulation growth exceeding 6 percent per annum (Eldoret Municipal Strategic Plan,
2012). The current population is 497,449 (GOK Census, 2009), covering an area of 147 sq
kilometer. Rapidly, growing town of Eldoret has been subjected to influx of emigrants,
high population, rapid infrastructure development and rapid commercial activities, all these
have exposed the town residents, especially, and those in low incomemneighbourhoods to
high risk of disaster, hence need for land use planning strategies.
2.13.1. Sum Up Grading Strategy.
A slum household is agroup of individuals living under the same roof in an urban area who
lack one or more of the following five conditions:- access to water, access to sanitation,
secure tenure, durability housing, and sufficient living area (Durand-Lasserve, 2012).
AAccording to Cities Alliances, (2012), the word slum is often used to describe informal
settlements within Cities that have inadequate housing and squalid miserable living
conditions. They are often overcrowded with many people crammed into very small living
spaces. These settlements lacksbasic urban services such as water, sanitation, waste
116
collection, storm drainage, streetlighting, paved side walks and roads for emergency
access. Most also do not have easy access to schools, hospitals or public places for
community togather. Informal settlements generally occupied poor urban lands- riparian,
swampy, resrved land for garbage collection or dumps, steep slope land and refilled
quarries. However, slums have spilled over to serviced lands or reserves like railway safety
zones, land under high voltage power lines and road reserves; hence households living in
slums are widely exposed to disaster risks.
Slum upgrading is aprocess through which informal areas are gradually improved,
formalized and incorporated into the city itself through extending land tenure security, and
urban services to slum dwellers. According to Acioloy Junior (2012), it involves, providing
slum dwellers with the economic, social, institutional and community services available to
other cities. Slum-upgrading is considered a necessary and important component of urban
development. It is beneficial to a city because it forecasting in social inclusiveness;
promoting economic development; addressing overall city issues; improving quality of
life; providing shelter for the poor; and also provides affordable land and urban services to
the slum households. But slum-upgrading is most affective when linked with other
initiatives of goals, such as :- poverty alleviation, health and education, preservation of
historic city centers, environmental and sanitation improvement, city-wide infrastructure
and transport expansion (UN-HABITAT, 2010). However, primary challenges of slum
upgrading are that slums are not homogeneous and there many diverse vested interests in
slums, there can be criminal elements who take advantage of the informal space.
117
The Kenya Slum Upgrading Programme (KENSUP), has been set up as acollaborative
initiative that draws on the expertise of awide variety of partners in order to address this
issue. UN-Habitat`s approach to slum-upgrading is holistic and integrated, as the aims are
multiple. We use the development of an integrated infrastructure system as an entry point
to slum-upgrading in order to reduce the cost of housing. This is combined with the
construction or upgrading of the existing housing stock, later to be linked to capacity
building and income generation activities for the residents of informal settlements, aim at
improving livelihoods (Tibaijuka, 20130. Thus, the task of making slums better living and
working environment for the urban poor, along with the inseparable task of reducing
poverty, can only be achieved through acommon vision.
In EUA, this strategy is being implemented through partnership with the County
Government of Uashin Gishu, the National Government of Kenya, the World Bank and
other interested partners. The slum-upgrading projects aiming at enhancing socio-
economic infrastructures have been going on in Huruma, Langas, and Munyaka with in
EUA. Roads, water supply, sanitation facilities, street lights are all being constructed.
These enhanced infrastructures enable the the urban residents in low income
neighbourhoods to access urban services, employment opportunities, hence increases their
disposable income, saving, consumptions and investment, thus enable them to built
economic resilience.
2.13.2. Mixed Use Development.
Mixed use development is atype of urban development that blends residential, commercial,
cultural, institutional, or entainment uses, where those functions are physically or

118
functionally integrated, and that provide pedestrian connections. Mixed use development
can take the form of a single building, a city block or entire neighbourhoods. The term may
also be usrd more specifically to refer to mixed use real estate development project-
abuilding, complex of buildings, or a district of town or city that is develoed for mixed use
by private developers.
Jacobs, (2010), argues that mixed use development have become popular in USA and has
been adopted in many developing countries including Kenya. Developers and investors
alike are increasingly seeking out opportunities to integrate product types in order to
achieve the ultimate goals of creating destination that draw residents, tenants, visitors, and
patrons to engage, integrate, live, shop, walk and play. Mixed use development has been
cited by both investors as well as scholars as means to solve a problem of effective land
use in supply constrained areas like urban areas. It also provides diversification for
investor portfolios (Jacobs, 2013). Mixed use development, as pointed out by the scholar
above, is one of the ten principles of smart growth, aplanning strategythat seeks to foster
community design and development that serves the economy, community, public health
and environment. At the sametime, the Urban Land Institutes handbook has characterizes
mixed use development as one that:- provides three or more significant revenue producing
uses for instances retail, entainment, office, residential,hotel, or
civic/cultural/recreationfees; fosters integration, density and compatibility of land uses and
creates awalkable community with uninterurupted pedestrian connections.
Mixed use development could be classified into two types:- vertical, horizontal and mixed
use development walkable areas. The vertical mixed use development, combines different
119
uses within the same building, provides for more public uses on the lower floor such as
retail shops, restraint or commercial businesses; provides more private uses on the upper
floors, such as residential units, hotel rooms or office spaces. The horizontal mixed use
development consist of single use buildings within a mixed use zoning district parcel
which allows for arrange of land uses in single development project; provides for a variety
of complementary and integrated uses that are walkable and within a given neighbourhood
tract or land or development project; and finally, mixed use development which combined
both vertical and horizontal mixed use development in an area, within an approximately 10
minutes walking distance to core activities.
Mixed use development in Kenya and particularly, in EUA, has been useful mainly in the
low income settlements where affordable serviced land is rear to comeby. As sum-
upgrading are being implemented in EUA, one of the element of this project has been the
issue of land tenure security this meant that some of the residents in low income
neighbourhoods were able to attain the land title. These allow these residents to adapt the
mixed use development.
2.13.3. Development Corridors.
Development corridors are transport routes that involve facilitating an increasing range of
social and economic development activities. They may evolve to an extent that enhances
only the flow of goods and people (transport corridor), or to an extent that supports trade
(trade corridor), or development of aparticular sector of the economy (an agricultural
corridor). They might involve to an extent that supports wider social development and
economic growth of a sub national region or cross-border region (a fully fledged economic
120
corridor). Wegner, (2011), said that development corridors are complex, because there is
rarely a clear demarcation to determine that a corridor. Thus, “development corridor” is
used in the general sense to refer to acorridor at any stage of evolution from a basic
transport route through to economic corridor. According to Srivastava, (2011). The
development corridor requires the next stage of evolution improvements to the so called
“soft infrastructure” of transport services and transport logistics. But evolution into fully
fledged economic corridor requires broader investments in the area served by the corridor.
Anord, (2007), identified development corridor objectives, as:- reduce average times and
costs of transport; reduce variability fo times and costs transport; increase trade and other
aspects of national economy. Brunner, (2013), concluded that no one economic corridor
matches exactly the characteristics of another. As a corridor evolves the specific objectives
changes, so do the criteria for intervening in the next stage of its evolution. The scholar
also pointed out that, corridors evolve through cycles of development and operational
efficiency, and then a criterion for identifying whether to invest in each new cycle will be
different.
Development corridor promotes urban reconstruction and enhancement of urban growth
where it is strategically needed. The reconstruction of urban process tends to create job
opportunities to urban residents including those from low income neighbourhoods,
enhancing their economic ability to manage disaster risks in their settlements.
In Eldoret Urban Area, two development corridors are being developed, a 35 km. route
from Chepleskei on Eldoret/Nairobi road to mael tisa on Eldoret/Webuye road, this route is
known as Southern route and another one the Northern route. As matter of fact, we expect
121
industriesd, and business parks to develop a long these routes creating employment
opportunities to urban residents in low income neighbourhoods of EUA. This would enable
the urban residents enhances their income, saving, consumption and investments hence be
able to manage disaster risks in their settlements.
2.13.4. Gentrification/Re-development.
Genetrification is assign of economic growth. In the words of All Homes Compaign,
(2013), gentrification is not a force of nature, an evitable economic trend or a pre ordained
social phenomenon. It is a result of decisions made by real people who run institutions,
seek to make profits, and are motivated by greed and power. Todd, (2014), argues that as
money begins to follows in the neighbourhood, many aspects of everyday life are changed
for the better. Buildings and parks are renovated and beautified. Jobs arrive within
increased construction activity and new retail and services businesses. Crime rates
declines. As property taxes increases so does funding to local public schools formally,
neighbourhoods enhances urban services.
However, Thomas, (20160, argues that, if by gentrification you mean displacement of
people of lower incomes then there are no benefits. But if by gentrification you mean
economic development and ignore problems caused by same economic development that
does not deliberately protect workers of lower wages or people of lower incomes, then the
benefits are obviously economic development. But an important question to ask by any
planner, of decision maker is whether, re-development is good or bad? Should the policy
makers or planners practices, encourage, or discourage non-poor households to move into
lower income urban neighbourhoods? On one hand, urba n redevelopment can provide
122
significant benefits to new and existing urban residents. On the other hand, gentrification
can impose risks and costs to vulnerable communities such like those in the low income
neighbourhoods.
The gentrification benefits includes:- improved accessibility and mobility among the urban
residents in the low income neighbourhoods, thus reducing the distances residents travel to
reach urban services and activities like- education, employment, shopping, recreation and
extra; reduction of time and money urban residents must spend on tr[-p-avel; provision of
public infrastructure and services; increased land value; and finally, can improve residents
economic opportunity.
2.13.6. Industrial Parks Strategies.
The 2030 Agenda for Sustainable Development recognizes the importance of inclusive and
sustainable industrialization and the infrastructure that supports in eradicating poverty.
However, premature de-industrialization has also become increasingly noticeable in
developing countries with manufacturing having decreasing share of the gross domestic
product (GDP). Li Yong, (2018), argues that, by delivering public goals and the
accompanying policy interventions in support of investment, industrial parks acted as
catalyst to facilitate industrial development. He further said that, it should be noted that
industrial parks also contribute to sustainable development goals through promoting
socially and environmentally responsible industrialization within the parks themselves, as
well as by demonstrating what is possible to the rest of the country.
123
According to UNIDO, (2018), the principal rationale for establishing industrial parks is to
enable “industry settle and develop at specific location that is planned and improved to that
effect”. Industrial parks for this reason, an important tool within a country`s broader
industrial and infrastructure policy. Acommon definition of industrial park is “a track of
land developed and sub-divided into plots according to a comprehensive plan with the
provision of roads, transportation and public utilities, sometimes also with common
facilities, for use by a group of manufacturers”. UNIDO, (2018), argues that the term
“industrial parks” is often also used however, to cover a broad range of concepts, such as
free-trade zones, export-processing zones, special economic zones, high-tech zones, free-
ports, enterprise zones, etc.
In Kenya, industrial parks examples are Athi River Export Zones, Industrial/Area, in
Nairobi, High Tech Zone along Nairobi-Mombasa Road at Machakos (Konza city) and in
Eldoret, the Africa Economic Zone and Plateau Business Park, being developed by
Chinese Government. The Industrial parks strategy tends to have influence on low income
neighbourhood residents of Eldoret Town, simply by creating job opportunities, hence
increases their income, saving, consumption and hence ability to built economic resilience,
resisting any disaster risks in their neighbourhoods.
2.14. Evalaution of Land Use Policy Framework on Economic Vulnability to
Disasterf Management in Low Income Neighbourhoods of Eldoret Urban Area.
Land use policy considers the way land and natural resources are used and managed,
placing issues of ownership/tenure security (Mwagore, 2002). By land policy, Virtanen,
(1995), means primarily the intensions, programmes and operations of public authority to
124
conyrol land use in desirable direction.Thus this scholar further divides land use policy
into three parts:- control system; monitoring system; and administrative system, The
control system consists of different plan documents, conservation decisions and other plans
that concern aspecific area/region/space. Whether these plans of land use are realized or
not is handled within the monitoring system, in which also environmental impacts are
assessed.The administrative system (either public or private) is responsible for producing
and also partly for executing, land use plans (Virtanen, 1995). In the words of Mwagore
(2002), land use policy is understood as the framework to manage and control land use and
natural resources, excluding the detailed examination of land tenure and land laws.
Overall policy is formed by the prailing political power structure, the polical parties and
the leading political persons at the highest levels of political decision-making structure in
the government. Land use policy is a statement of intent that sets out long term goals on
land use management. It addresses issues relating directly to the use of land, its resources
and perceptions. It is also incorporates all activities that are likely to have an impact on the
use of land and its resouurces.
According to the National Land Use Policy (2016), “the pokicy is important in addressing
issues of optimal utilization of land and land related resources by providing principles and
guildelines for proper management of land resources to promote public good and general
welfare; land use planning to enhance sustainable development; archoring land
development initiatives; mitigating problems associated with poor land use, promoting
environmental conservation, and preparation and reniewof a national spatial plan and
integrationof various levels of land use planning; land and land related conflicts.The land
125
policy initiative has developed aframework and guidelines that set a genda for land policy
processes in Africa. It aims at ensure that all land users have equitable and secure access to
land. According to the Global Land Tool Network (GLTN), these provide aclear overview
of the historical, political and social background of the land question in Africa, and
highlight the role of land as acritical for economic development and reducing poverty. UN-
Habitat, 2004, argues that the land policy initiative process provides abroad framework for
African governments in land policy formulation and implementation, and acts as
afoundation for popular participation in improved governance.
The National Land Policy (2016), highlighted the principles of land policy. It states that
land in Kenya shall be held, used and managed in manner that is equitable, efficient,
productive and sustainable and in accordance with the following principles:- equitable
access to land; security of land rights; sustainable and productive management of land
resources; transparent and cost effective administration of land sound conservation and
protection of ecologically sensitive areas, elimination of gender discrimination in law,
customs and practices related to land and property in land and encourangement of
communities to settle land dispites through recognized local community initiatives
consistent with Kenya constitution.
Molen (2001) and Williamson (2002), states that Land Policy is concerned with definition
of the rule of law and use and ownership of land, that land policy consists of socio-
economic and legal prescription that dectate how the land the benefits from the land are to
be allocated. It relates to economic development, equity, and socil justice, environmental
preservation and sustainable land use (UN-ECE, 1996). The implementation of land policy
126
has a lot to do with institutional arrangements such as the organizational framework of
land administration, management, enforcement of land land laws and the allocation and
monitoring of land of land administration mandates to public sector.
Development policies and programmes that assist poor men, women and youth especially
in low income neighbourhoods to build livelihood assets, diversify income-generating
activities, improve human capacities (health, nutritional status, education, technical skills),
and strengthen community-based self help organizational, can make amajor contribution to
reducing vulnerability and risk, and improving the coping capacity of the poorest.
Improved technogies can help prevent or mitigate damage by natural hazards:- various
methods of water control, for example, can reduce the damage of flood damage, or help
humans, animals and plant survive drought. Improved crops varieties that are drought or
flood tolerant and pest-resistant can make the difference between crop failure and an
acceptable harvest. Improved or zero tillage methods and soil conservation technologies
can increase production in unfavourable agro-ecological areas, haltingenviromental
degradation and ensuring greater sustainability. Development programmes need to get
those disaster risk management technologies into the hands of farmers in vanarable
communities- low income neighbourhoods.
2.14.1. Land Tenure Security.
All Kenyans have aright to access and use land either through lease or freehold title, as
individuals, corporations or collective trusts. However, the availability of land, particularly
arable/cultivatable land, is in increasingly short in supply, and consequently some
prudence is required in the issueing of public land. With a growing population and a finite
127
land source shortage of productive public land for Kenyan farmer and other users is an
unsustainable form of land distribution.
According to National Land Use Policy (2016), land in Kenya is either public, communual
of privately owned. The Country has inherited highly unequal patterns of land distribution.
The peculiar patterns of land tenure, ownership and property rights that currently prevail in
Kenya have to a large extent determined the use and management of land. The security of
tenure on urban land, especially in the slums and informal settlements and per-urban areas
is a key policy option. According to Abdulai, Ndekugri, Olomolaiye and Proverbs (2007),
indicates that land tenure security is an incentive for investing in land based activities and
therefore, an impetus for economic development. Land tenure security refers to the
enforceability of land rights and also immunity from expropriation (Antwi, 2000). Thus it
is acertainity that a person land rights will be recognized by members of their society and
protected in case of challenges (Abudulai, 2007, FAO, 2005).
In Eldoret Urban Area, this policy option is implemented in urban settlements such as
Langas, Kamukunji to allow the urban residents in the low income neighourhoods avoid
physical and market evictions and be able to invest in improving the quality and quantity
of their houses in thse neighbourhoods. However, to achieve land tenure security in Kenya
this policy option should includes the digitalization of land information system to improve
upon the land cadastry system or land records which would assuist in the land registration.
This would enable the land managers and administrators to store, retrieve and manage land
data, hence would enhances land registration and cadastry system of a coutry or urban
128
areas. Currently, the Land Ministry has been struggling to introduce the digitalized land
information system since 2013.
2.14.2. Land Administration/Management.
The European Economic Commision (EEC, 1996), defines land administration as “the
process of determining, recording and disseminating information about the ownership,
value and use of land when implementing land management policies. Dale and Mc
Laughlin (1999), view land administration as acombination of routine process that include
regulating land and property development and the use and conservation of land, the
gathering of revenues from the land through sales, leasing and taxation and the resolving of
conflicts concerning the ownership and use of land .Molen (2002), argues that the main
challenge of land administration system is to support the implementation of land policy.
Therefore, he argues that the essence of land administration is the land information system
which its completeness and accurancy of the information system would determine how
well the land administration system will serve society. The two main tools used to generate
and maintain land administration are cadaster system and land registration.
Land administration system all over the World are reviewing their functional structures and
undergoing major legislative and administrative changes. They are doing this in response
to different internal and external drivers. In developed countries, the major drivers are
advance in geo-information technology and the associated demands fron customers for
improved service delivery. Reforms include electronic lodment and processing of cadastral
and registration documents, digital management records and electronic distribution of
products and services through internet. In the developing countries, the main drivers for
129
trform are need for regulationof non-formal land rights. Reforms here mainly include
innovative legislative and administrative adjustments to accommondate and accelerate the
registration of individual and group rights in customary land and informal settlements.
According to Dale and Mc Laugh (1998), land management is about decision making and
the implementation of decisions about the use of land resources. It entails the process
which allocatesland resources over space and time according to the needs, aspirations and
desires of man and with framework of his technological interventions, his political and
social institutions and his legal and administrative arrangements. It includes the
information in land policy, the organization of land administration arrangements, and the
management of land information. In A frica and particularly, in Kenya, land management
is weak and gives room to corruption and ieequality.
2.14.3. Land Information system, Cadastry system and land registration.
Land information system is a geographic information system for cadastral land use
mapping typically used by local governments, city authorities and other interested bodies
interest in land issues in an area like urban area. It consists of accurate, reliable land
records records cadaster and it is associated with spatial data that represent the legal
boundaries of land tenure and provides avital base layer capable of integration with
geographic systems or as a stand alone solution that allows data stewards to retrieve,
create, update, store, view and analysis and publish land information. A good land
information system is essential tool for planning and also for proper land management and
land administration.
130
The International Federation of Surveyors (1995), defines a cadaster as aparcel –based and
update land information system containing a record of interests in land e.g rights,
restrictions, and responsibilities. It usually includes a geometric description of land parcels
linked to other records describing the nature of interests and ownership or control of these
interests and often the value of the parcel and its improvements. Stendler, (2004) and
Williamson (2001),said land cadaster system is aprocess of land administration with
acomplete, accurate, and reliable information about ownership, use and value of existing
land and its resources. Four common cadastral procedures recognizable in many parts of
the World are:- adjudication, demarcation, surveying and mapping. Adjudication is the
authoritative assertainmentof the existing rights in land. It is usually, the first component of
the land delivery process before land registration. Demarcation is the marking of boundary
limits of each unit on the ground. Surveying is the actual ground measurement of cadastral
land units. The basic requirements of cadastral mapping are to provide sufficient
specification of the location of the land unit. Many of the administration system reforms
around the world involve changes or improvements in cadastral processes and records. The
new Kenyan constitution (2010), and Kenya Land Act (2012), have both aimed at
achieving this in the country, but due to poor flow of land records and land related
information system, corruption in the Ministry of Land and Courts, little has been achieved
so far.
Dale and Mc Laughlin (1999), once more highlighted land registration as an element of
land policy. In their words, land registration is the process of recording recognized interest
in a defined land unit. In addition to documenting the nature and spatial extent of interest
in land, land registration also enable the transfer of such interests; provide evidence for the
131
resolution of land disputes and information for a variety of other public functions.
Registration of property rights describe the use to which the land may be put, the length of
time during which the rights are valid and the manner uin which some or all rights can be
trasferreds to other parties. Some of basic functions of land registration include:-security,
protection, and enforcement of property rights, land transfer, screening poblems and
dispute resolution. Land registration, therefore, is the conventional legal means of securing
rights in land and titles and hence a primary driver of economic development. Land
registration or titiling has been popularized by De Soto (2000).
2.15. Empirical Review
The World of 21st century is experiencing a high rate of urbanization. Before 1850, the
urban population of the World never exceeded 7% (Durand-Lesserve, 2010). These
demographic issues together with the economic factors, environmental factors,
transportation systems, social factors, consumer preferences and governance are forces
which are currently shaping urban expansion, especially in Sub-Saharan Africa Cities. This
urban expansion means more urban land, hence, the need of land use planning. Urban
expansion takes place in different forms in different areas globally. In many cities, this
could be in the form of sprawl, Greenfield or peri-urban areas, leapfrogging or re-
development of built-up areas at higher densities, through infill or remaining open spaces
in already built-up areas (Sholomo, A; Sheppard, & Civco, D. L. 1989). But, it is true that
the urban expansion forms outline above, does not yield the desired urban forms or spatial
structure. In fact, the desired urban expansion and urban land use planning today globally,
is the compact urban development.
132
Land use planning refers to the process by which a society, through its institutions decides
where, within its territory, different socio-economic activities such as agriculture,
housing/shelter, industries, transport facilities, recreation, and commerce should take place
(Bruckner, 2001). This includes protecting well-defined areas from development due to
environmental, cultural, historical, or similar reasons, and establishing provisions that
control the nature of development activities. The latest Global Report on Human
Settlements prepared by UN-Habitat entitled: “Planning for Sustainable Cities, 2009” has
identified five current and future global urban challenges, namely: - demographic;
environmental; economic; social spatial; and institutional. Thus, many scholars or urban
developers as well as relevant institutions or stakeholders have therefore, argued that the
21st century urban planning which includes land use planning must take place with full
understanding of the above factors which are the emerging forces leading to new spatial
configuration or structure of large, multiple nuclei or polycentric regions.
In fact, most stakeholders associated land use planning with regulatory instruments, but in
reality, a set of regulatory instruments is only a small part of the land use planning toolkit,
especially in developing countries (Smolka, M. O. 2012). Modern scholars argue that there
are severe limitations to efficiency of these instruments, especially in developing countries
cities, where the built form is largely informal and where enforcement capacity is weak
(World Bank Report, 2014). Therefore, (Smolka, M. O., 2012) points that, for the
regulatory instruments to be efficient and effective, especially in developing countries
cities, it should be used together with other instruments such as the economic instrument,
financial instrument, and investment instrument.
133
In the words of Smolka, 2012, conventional urban economic models make assumptions
that are at odds with the reality in most third world cities. Among the clearly problematic
assumptions are that all households comply with urban standards and regulations, acquire
land through monetary contracts with same transaction costs, request permission when
changing land uses, and pay fiscal charges and the like. In addition, the models assume all
land is fully serviced, that all housing units can be rented at any location. However, reality
in third world cities is that, majority of the households are faced with different challenges,
chief amongst them are the informality of land market, housing informality, unaffordable
and unaccessible serviced urban land, high urban land prices and large area of unplanned
urban segment as well as urban poverty. All these had made the conventional economic
model assumptions unrealistic especially in the third world cities. In any case the third
world cities are known for their informal settlements which are defined by tenure, access to
public services, and compliance with land use regulations.
The quantity demanded of any good is the amount of the good that buyers are willing and
able to purchase. Many things determine the quantity demanded of any good the price,
consumer preferences, income, number of buyers and substitutes (i.e. prices of related
goods). The law of demand states that, other things equal, the quantity demanded of a good
falls when the price of the good rises. In rural area, households demand land for agriculture
to provide food, shelter/housing and also for provision of other services such as transport
and extra. However, in urban areas land is demanded, not only for residential, but for other
activities such as industrial developments, commerce, transport, recreation and extra.
Households are consumers of land, especially in urban area like Eldoret Urban Area.
134
Each of the households tends to have consumption preferences of land which they want to
occupy or use, but all depends on land price, hence affordability. Therefore, the vulnerable
households (i.e. the poor, women and youth) end up occupying or using low value urban
land which are not of their consumption preferences. This explains why the vulnerable
households end up in informal settlements, slums or peri-urban areas. At the same time,
some of these vulnerable households are forced to occupy or use the environmentally
fragile land such as wet lands, riverbanks, land under electricity voltage, land on top of
pipeline, and waste disposal land which are vulnerable to hazard risks, hence, prone to
disaster.
The major factor which sets the urban land markets is that, the supply of land is fixed (i.e.
inelastic) in the short-term, as it is not possible to manufacture more land to meet
increasing demand. However, in the medium and long term, the supply of the urban land
available for development can be increased (i.e. elastic), through urban expansion, zoning
and installation of bulk infrastructure (Yuen., 2011).
The quantity supplied of any good or service is the amount that sellers are willing and able
to sell. The law of supply states that, other things equal, the quantity supplied of a good or
service rises when the price of the good or service rises. Many factors determine land
supply; amongst them are land price, number of sellers, consumer preferences, topography
as well as technology available and consumers’ income. Topography of the land will
determine whether the land is allocated in a disaster prone area such as wetlands, flooding
areas, mud sliding area, riverbank and extra. The availability of modern technology to
135
some extent would determine the land use, whether it can be developed horizontally or
vertically.
The vulnerable households (i.e. the poor, women and youth), like other households has a
demand for land. The need for land for residential/shelter, transportation, commerce, green
infrastructure and extra. However, the supply or accessibility of land to a large extent is to
be determined by the vulnerable households’ income and land price. However, the
vulnerable households appears to be suffering from unemployment and high magnitude of
poverty, hence, tends to have low income, yet land prices, especially in the urban/cities
areas appears to be high. This explains why majority vulnerable households occupy the
informal settlements, slums and peri-urban areas.
The rapid and unplanned expansion of urban /cities is exposing residents and economic
assets to risk of disasters and the effects of climate change. Therefore, for the urban
households to manage the disaster risk reduction, they need to understand the disaster risk
management cycle or plan. The city/urban authority is responsible for its development,
implementation and monitoring. The land use regulatory instruments discussed here,
whether, public or private should be incorporated in the city/urban disaster risk
management cycle or plan.
Risk Assessment is an essential component in disaster risk management and climate
change adaptation. The purpose of risk assessment is to define the risk, answer questions
about characteristics of potential hazards (such as frequency and severity), and identify
vulnerabilities of communities and potential exposure to given hazards (World Bank,
2015). Thus, risk assessment helps the city/urban authority to prioritizing measures for risk
136
management, giving due consideration to the probability and impact of potential events,
cost-effectiveness of preventive measures, and resources availability.
The disaster risk reduction debate from the global perspective can be analyzed by
evaluating the two recent global documents to this aspect – the Hyogo framework of action
report of 2005 to 2015, and the Sendai framework for disaster risk reduction of 2015 to
2030.
In the 2005 World Conference on Disaster Reduction, the Hyogo Framework for Action
2005–2015 for disaster risk management was developed with the aim of building the
resilience of nations and communities to disasters. Its main components included ensuring
that Household disaster risk management is a national and a local priority with a strong
institutional basis for implementation; identify, assess and monitor disaster risks and early
warning; use knowledge, innovation and education to build a culture of safety and
resilience at all levels; reduce the underlying risk factors; and strengthen disaster
preparedness for effective response at all levels (Gencer, 2013). The framework provided
general understanding of the concept of disaster management emphasizing the importance
of disaster risk management phase’s activities of building disaster resilience (Mayunga, D.
2009).
These phases include hazard mitigation, disaster preparedness, disaster response, and
disaster recovery. This indicates that nations need to develop a comprehensive approach to
disaster management (Carter, 2008). To be effective, this comprehensive approach clearly
needs to cover all aspects of the disaster management cycle and needs to include an
137
appropriate balance of prevention, mitigation, preparedness, response, recovery, and
disaster-related development.
Hazard mitigation involves actions taken before a disaster to decrease vulnerability,
primarily through measures that reduce casualties and exposure to damage and disruption
or that provide passive protection during disaster impact (Tierney et.al, 2001). Its long-
term focus and proactive nature distinguished hazard mitigation from the more immediate
and reactive activities taken during disaster preparedness, response, and recovery. Disaster
mitigation, thus, is concerned with sustained action to reduce or eliminate risk to people or
property (Col, 2007). Technical approaches to mitigate the vulnerability of key
infrastructures include transportation, information and telecommunications systems, health
systems, the electric power grid, emergency response units, food and water supplies,
among others (Godschalk, 2003).
Hazard mitigation is the phase of emergency management dedicated to breaking the cycle
of damage, reconstruction and repeated damage from disasters (Godschalk, 2003).
According to Mohit and Sellu (2013) hazard mitigation has two approaches, that is,
structural approach and non-structural approach. Structural approach is concerned with the
engineering measures adopted to control floods or protect human settlements. They include
the building of seawalls and revetments, levees, embankments and others. On the other
hand, nonstructural approach is based on the adjustments of human activities and societies
to mitigate flood damages. It includes insurance, land use management, awareness,
environmentally sensitive area protection and other emergency and recovery policies for
managing flood damages.
138
Thus mitigation measures include land-use regulations that reduce hazard exposure and
building codes and construction practices designed to ensure that structures resist the
physical impacts created by hazards, such as wind, water, or seismic forces (Tierney et.al,
2001). The most distinguishing feature of mitigation is that it permanently alters physical
conditions of risk, hazards, and vulnerability, thereby lessening the potential severity of
future disaster impacts that can threaten life and property (Schwab, 2014).
Unfortunately, some communities either lack the resources to invest in hazard mitigation
capabilities or simply do not see the need to do so (Carter, 2008). Prater and Lindell (2000)
concurs that pre-disaster measures unquestionably are effective, but local governments
often are reluctant to adopt risk reduction policies for various reasons. Thus, there may be
recognition of the hazards in many communities; risk reduction and vulnerability often are
not salient concerns until after the disaster occurs. Residents have other issues that assume
priority, and local elected officials do not want to dwell on the hazard vulnerability of their
communities as it might hurt economic investment and growth (Cutter et.al, 2010).
The low visibility of Household disaster risk management work in comparison to
emergency relief has made it unattractive for governments chasing votes and international
recognition and for Non-Governmental s (NGOs) dependent on disasters for funding
(Schipper & Pelling, 2006). Prater and Lindell (2000) points out that the first thing a
community must do is to identify the hazards to which the community is vulnerable and
assess the severity of each hazard. Here, a substantial investment in hazard mapping can
pay off in the long run by informing decision making with adequate facts.
139
Risk represents the possible occurrence of a harmful event that has some known likelihood
of happening over time (Comfort, 2005). Thus risk is ever present in a complex social
world, and it would be impossible for any government to eliminate risk altogether.
However, the society should take steps to anticipate a damaging event and to take
proactive steps to reduce that risk, knowing that there would still be some likelihood that
the event could occur (Cutter, Burton, & Emrich, 2010). Further, Schipper and Pelling
(2006) argues that from a developing country perspective, Poverty Reduction Strategy
Papers (PRSPs) provide a vehicle for integrating risk reduction into poverty alleviation
programs but so far, emphasis has been on early warning and relief, not on prevention.
Therefore mitigation measures including appropriate land-use, mandatory and voluntary
building codes, and other long-term loss reduction efforts are very important. In some
cases, mitigation can also include moving neighborhoods and communities to other
locations in order to avoid future losses. Mitigation activities can take the form of specific
projects, such as elevating homes for flood protection, as well as process-related activities,
such as hazard and vulnerability analyses, that are designed to lead to future mitigate
actions (Sutton & Tierney, 2006).
According to Tierney et. al. (2001), disaster preparedness encompasses actions undertaken
before disaster impact that enable social units to respond actively when disaster strikes. It
is the readiness to respond to any emergency based on planning, training and exercises.
According to Col (2007), although emergency managers agree that implementing
emergency plans in real time involves flexible improvisation, planning and exercises but it
is supposed to take into account most surprises. For instance, whereas 260,000 died as a
140
result of Tangshan earthquake of magnitude 7.8 in China, lives were saved largely due to
effective preparedness involving continuous monitoring, mitigation and exercises.
Yet, according to Schwab (2014) preparedness typically signify preparations related to
what to do during a disaster, what food and supplies to have on hand, how to evacuate,
where to go, who to contact, and where to seek emergency shelter. Kapuc (2008) also
asserts the need in creating a culture of preparedness that emphasizes the shared
responsibilities and disaster preparedness at all levels of government and communities. For
instance, there is the need for increased training in disaster preparedness areas such as fire
services, blood donation, first aid and Cardiopulmonary Resuscitation (CPR). Other
needed disaster preparedness provisions include a disaster supplies kit that contains enough
food, water, medication, emergency shelter, smoke detectors, fire extinguishers, storm
shutters, a fire sprinkler system, and carbon monoxide detector.
United Nations (2008) noted that disasters undermine development achievements, thereby
impoverishing people and nations. In the absence of concerted efforts to address root
causes, disasters represent an increasingly serious obstacle to the achievement of the
Millennium Development Goals (MDGs). Further, Comfort (2005) argues that inability to
imagine attacks on the security of U.S. cities on the scale of the 9/11/2001 events limited
government capacity to plan defensively for such threats. Preparedness, thus, is more
temporary and provisional, focused on short-term measures to minimize the effects of
existing risk, hazard, or vulnerability in the absence of mitigation actions (Schwab, 2014).
Preparedness is commonly viewed as consisting of activities aimed at improving response
activities and coping capabilities (Sutton & Tierney, 2006). However, emphasis is
141
increasingly being placed on recovery preparedness that is, on planning not only in order to
respond effectively during and immediately after disasters but also in order to successfully
navigate challenges associated with short- and longer-term recovery. According to Sutton
and Tierney (2006), emergency preparedness practices involve the development of plans
and procedures, the recruitment and training of staff, and the acquisition of facilities,
equipment, and materials needed to provide active protection during emergency response.
Economic Vulnarability to disaster management (EVDM) has long been recognized in the
literature for its role in mitigating the positive environmental, social and economic impacts
of natural hazards (Shreve & Kelman, 2014).
After a disaster occurs, demand for aid supplies will likely change over time; some items
are needed immediately at the earliest stages of relief operations, while other items can be
safely supplied during later stages. Types of pre-positioned stocks vary, and are chosen to
meet the immediate needs of those affected: food items, for example, high-energy biscuits,
and ready-to-eat meals, non-food items such as jerry cans, taps, tents, blankets, hygiene
kits, and kitchen sets, medical supplies and equipment for example telecommunication
equipment, and metal detectors. Some relief stores a variety of items, while some
specialize in a particular sector, such as food (Balcik & Beamon, 2008).
Additional preparedness measures may include the government use of hazard awareness
campaigns to make households and businesses aware of the risks they face and of suitable
hazard adjustments for reducing their vulnerability (Prater & Lindell, 2000). Disaster
Recovery Planning (DRP) are also necessary, involving decisions and actions taken after a
disaster to restoring or improving the pre-disaster living conditions while encouraging and
142
facilitating to obtain necessary adjustments to reduce disaster risk (Kaushalya, Karunasena,
& Amarathunga, 2014). Further, planning for insurance protection is inextricably linked
because the obvious solution for financial needs during an interruption of business is to
transfer the risk of loss through the insurance (Nquot & Kulatunga, 2014).
People, economic activity, and environmental amenities are unevenly distributed across
space. This also holds for the majority of environmental externalities. Spatial planning, the
public policy toolbox used to alter their distribution, is one of the domains where the
tensions between economic and environmental objectives are particularly acute. These
tensions are, furthermore, expected to escalate as demand for housing, energy, food, fibre,
but also ecosystem services, are growing.
To achieve these objectives, SPINE relies on analytical, modelling and empirical work,
investigating the relationships between land use patterns, socioeconomic outcomes,
environmental pressures, and the use of specific policy instruments. SPINE mainly focuses
on cities, as they are not only major drivers of economic growth and employment, but also
the places where many environmental, economic and social challenges have to be tackled.
The response component includes actions taken to respond to the actual disaster once it has
occurred, such as rescuing survivors, conducting mass evacuations, feeding and sheltering
victims, providing emergency medical care, and restoring communications (Schwab,
2014). Emergency response consists of actions taken a short period prior to, during, and
after disaster impact to reduce casualties, damage, and disruption and to respond to the
immediate needs of disaster victims (Tierney et.al, 2001).
143
Urban planning is a process of determining how cities or urban centers shall be developing
and expanding. It is a process of allocating urban land to the various socio-economic
activities. Land is a resource that greatly will determine cities or urban centers` economic
production, hence, people’s livelihood sustainability. It is a strategy for improving their
productivity, equality, and sustainability. Rapid urbanization or urban growth is being
experienced in the world. UN-Habitat (2010) has indicated that in the next 20 years, half of
the developing world’s population will be living in cities. For instance, in 1970, 63% of
developing world’s population was living in rural areas as opposed to 37% in urban areas,
in 2000, 53% lived in rural areas against 47% in urban areas, while in 2030, this would
change to 40% in rural areas and 60% in urban areas (Acioly, 2012). Urban growth in
many cities has been in the increase, due to natural population growth, together with rural-
urban migration and has resulted in increased demand of urban serviced land, urban
infrastructures and services, and therefore, calls for urban planning.
Disaster impacts tend to be large, intractable problems that test the ability of communities,
nations, and regions to offer responses that effectively protect their populations and
infrastructure, to reduce both human and property loss, and to rapidly recover (Altay &
Green, 2006). Accordingly Col (2007) surmise that disaster response comprises immediate
actions to save lives, protect property and meet basic human needs. Hurricane Katrina
revealed weaknesses that may prevent effect response where the national emergency
management system is in disarray, incapable of responding effectively to the immediate
needs of communities along the risk areas and unprepared to coordinate the massive relief
effort required to support recovery (Waugh & Streib, 2006).
144
According to Schwab (2014), a DRP for multi-hazard events is more effective than
concentrating on a single hazard event. Consequently, a multi-hazard approach involves
translating and linking knowledge of a full-range of hazards into disaster and risk
management. It will look not only at natural hazards, but also factors including political
strategies, technical analysis, and operational capabilities and public understanding. This
approach will ultimately lead to greater effectiveness and cost-efficiency (United Nations,
2008). Emergency response activities are conducted routinely by county governments on a
daily basis for emergencies that draw only upon locally available resources. A substantial
share of county government budgets are dedicated to supporting day-to-day emergency
response activities, such as fire suppression and ambulance calls. These emergency
response needs are amplified in a disaster and will prompt local governments to call upon
other entities for assistance, support, and resources (Schwab, 2014).
EVDM also needs to take into consideration the vulnerable populations such as those with
poor health, disabilities, and chronic diseases which are at an increased risk of adverse
health outcomes resulting from disasters (Bethel et.al, 2011). They are more likely to have
a slower response time to disasters or be unable to take appropriate response steps.
Similarly, people with at least one chronic disease may have their illnesses aggravated by
conditions left by the disaster such as extreme heat or cold, lack of potable water, and lack
of food.
Col (2007) defines disaster recovery to include decisions and actions related to replacing
lost residential and business properties, rebuilding the economic base, and repairing and
rebuilding the infrastructure. This component includes restoring housing, transportation,
145
and public services; restarting economic activity; and fostering long-term community
redevelopment and improvements (Schwab, 2014). The post-disaster recovery process
usually consists of a series of distinct but interrelated programs; for instance, covering
infrastructure, medical and health systems, education facilities, and so on. Recovery
requires sustained commitment over time to rebuilding goals and objectives often formed
or articulated after a disaster has happened. On the other hand, effective recovery may be
enhanced by pre-event planning that identifies linkages between all four disaster
management components (Schwab, 2014).
A disaster recovery project is a job which is never completed project planning must be
tested and revised several times during its lifetime. Long-term disaster recovery has
become a much more central concern, and pre-disaster recovery planning has become a
focus in emergency planning (Prazeres & Lopes, 2013). There is more pressure to link
disaster recovery to economic development and to deal with the long-term social and
economic problems exacerbated by disasters. The broadened mission of emergency
management requires a much different skill set than what was once expected of civil
defense officials and has been expected of homeland security officials (Waugh & Streib,
2006).
According to Cutter et. al. (2010), vulnerability is the pre-event, inherent characteristics or
qualities of social systems that create the potential for harm. On the other hand, resilience
is the ability of a social system to respond and recover from disasters and includes those
inherent conditions that allow the system to absorb impacts and cope with an event, as well
as post-event, adaptive processes that facilitate the ability of the social system to re-
146
organize, change, and learn in response to a threat. Vulnerability thus is a function of the
exposure (who or what is at risk) and sensitivity of system that is the degree to which
people and places can be harmed.
According to Schipper and Pelling (2006) disasters do turn back the development clock
through loss of infrastructure, livelihoods and psychological stress (Desiere, Vellema, and
D’Haese, 2015). Climate change too can pose one of the most serious environmental
problems confronting human development. The impacts of climate change on development
are expected to manifest primarily through impacts on natural resources, on which the poor
depend heavily, and on human health. Hence climate change responses, particularly
building adaptive capacity and technology transfer, will regularly be akin to development
activities.
2.16. Research Knowledge Gap
From the foregoing literature, it is clear that there exists a seriously urgent and adequate
knowledge gap in solving urban household disaster risks. There is inadequate research and
practices that relate urban land use planning and disaster risk management among urban
households. There is also lack of consensus among a few studies available as concerning
the influence of land use planning on Household disaster risk management. Nonetheless,
achievement of many national objectives still seems elusive. Planning of urban land use,
especially in the urban spatial structure elements; that is urban forms build-up
environment; informal settlements slum areas and pre-urban areas, CBD, and suburban
areas and urban development corridors, urban development nodes, open space, sprawl and
compactness development; population density patterns and household transit pattern during
147
day and extra, and how it relates to households disaster risk management appears to
present challenges that must be tackled urgently and in a comprehensive way. In fact most
studies and literature available in developing countries, Africa continent and even in Kenya
appears to concentrates on physical, metrological, environmental and chemical disaster
hazard risks but none so far are available on socio- economic hazard risks particularly
among the urban households.
Demographic, institutional, economical, poor coordination mechanism, inadequate land
use planning, social spatial structure and environmental challenges seems to play
significant role in the uncontrolled encroachment in the urban land resulting in spread of
slums, informal settlements, occupation of natural hazard prone location, degradation of
environment, as well as the degradation of service provisions, low income, inadequate
infrastructure provision and inadequate mechanisms for households to manage disaster
hazard risks in Eldoret Urban Area. Otherwise, urban land allocation without proper urban
land use planning will cause the poor households to occupy land which are hazard prone,
hence may suffer from disaster risk. It is nonetheless important that efforts be made
towards a paradigm shift in this valuable resource (urban land), if scarce natural resource is
to be managed. Therefore, this study is set to address the gaps in knowledge and practices
in Eldoret Urban Area in terms of households accessing, affordable urban land for shelter
or residential and other development activities.
2.17. Theoretical Framework
This study was guided by The Economic Classical Theory on Urban Spatial Structure
(Making Room Model), and Disaster Risk Reduction Theory (community-based model).
148
The theories guiding this study was undertaken through looking at factors contributing to
hazard, risks and vulnerability due to structural and non-structural forces created by
economic, social and environmental factors and their impact on urban neighbourhood.
They focused on the economic and environmental dimensions, and overall vulnerability
reduction and resilience building of the urban residents in slums, informal settlements and
per-urban areas neighbourhoos of Eldoret Urban Area. The guiding theory in this study is
the economic classic theory on urban spatial (making room model), while the disaster
reduction theory (community –based model) was supplementary theory.
2.17.1 The Classical Economic Theory on Urban Spatial Structure (Making Room
Model)
The theoretical foundation for the economic analysis of urban spatial structure in general
and urban expansion in particular, was laid out by Alonso, (1964), Mills, (1967), Muth,
(1969), refined by Wheaton, (1976), and later unified by Brueckner, (1987), and finally
unified into making room model by Angel, (2011). The classical economic model was
based on the Burgess, (1923), concentric zone theory, which was essentially an application
to urban land use planning of Von Thunen`s earlier theory relating to rural land around the
city. Von Thunen, (1826) postulated that around a central town, rural land of constant
fertility assumed different forms, land use, diminishing intensively in inverse relationship
to increased distance from the town center. Burgess, and Park, (1925), in their ecological
theories of urban development, suggested that human beings compete for scarce resources
such as land and raw materials with the aim of establishing spatially-disparate urban
environments to satisfy their different economic and social needs. Burgess developed a
149
concentric ring approach, theorizing that a city expands from its original center in a series
of concentric zones (Mc Donagh, 1997). Therefore, the concentric ring approach or model,
suggested that any city extends radically from its canter to form concentric zones and that
as distance from the canter increased there would be a reduction in accessibility, rents, and
densities. Thus, land use would assume the following forms from the centre outwards:- the
central business district (CBD), a zone of transition, an area of factories and low income
housing, an area of higher income housing and commuter zone (Angel, 2011).
The Alonso, (1964), on the other hand building on the Burgess`s concentric theory, pointed
out that the economic variables explains better the human competition for urban resources,
especially the urban land. This theory is able to explain clearly, the various variations in
urban spatial structure among the cities, stating that variation in climate, cultural tradition
or policy environment in different cities may matter less than economic forces or variables
in giving shape to their structure. Economic theories focus on the economic foundations of
City growth. Following this paradigm, it is the market function that distinguishes the City
from the Countryside. A fundamental assumptions of all spartial economic theories is that
locations with good accessibility are more attractive and have higher market value than
peripherial locations,(Durand-Lesserve, 2009) Thus, the economic forces/variables such as
employment, income generations, provision of urban services and infrastructures, as well
as investment attractiveness would determine the urban spatial structure. For instance,
slums and informal settlements have developed in urban areas, especially, either in the
industrial areas, or areas close to any industry. In Eldoret Urban Area, Kamukunji slum has
developed in an area close to light industries, while, Langas an informal settlement has
developed and grew as a result of its proximity to Rivatex Industry.
150
The classical economic model of urban spatial structure is a circular, with a single Central
Business District (CBD), surrounded by concentric rings of residences. The households
have homogeneous incomes and preferences, and their breadwinners commute to the CBD,
where all jobs are concentrated. The theory confirms that, in equilibrium, the price of land
will increase with distance from the city Centre. Perhaps because land use planning is
being practiced right in the CBD and sub-urban areas, and the exercise tend to decline as
distance increases from the CBD. Thus, both land rent and population density appears to
decline with distance from the CBD, (Angel, 2011). The Classical economic theory of
Spatial Structure provides an endogenous solution for the extent of the area that a City
occupies and its average density, given the population and the income, the cost of
transport, the share of buildable land and the agricultural area. According to Brueckner
(2001), the solution of the equilibrium equation in the Classical Economic Theoretical
Model, could be attained only if one of the two alternative prevails :- the area of the city
increase when its population increases, when household incomes increase, when transport
costs decrease, when the share of buildable land increases and when agricultural rents on
the urban periphery decrease or average density city’s population will increase when
population increases, when household incomes decrease, when transport costs increase,
when the share of buildable land decreases and when agricultural rents on the urban
periphery increase. In the words of Brueckner, (2001), both of the above alternatives
demand that a City or Urban area is to undergo land use planning.
The Classical Urban Spatial Structure Theory, at the beginning emphasis the containment
model based on compactness attribute of the model to check on the urban expansion.
However, of late most scholars, (Angel, 2011), have been arguing that judging from the
151
current Global and even Africa regions urban population, Cities and Urban areas need to
be prepared for the rapid urbanization, hence, making room model is appropriate. The
making room paradigm is a more realistic strategy for cities and metropolitan regions that
needs to prepare for their inevitable expansion. Angel, (2011), suggests that an urban
planning challenges posed by Worldwide urban expansion cannot rely on simply
transplanting containment strategy, but should focus to seek to enrich understanding of
context in which preparation for urban expansion must take place in cities.
The making room model as forwarded by Angel, (2011) a scholar attached to Lincoln
Institute of Land Policy, who pointed out that, Cities and Metropolitans should be prepared
for rapid urbanization in the 21st Century by extending urban planning in the informal
settlements, slum areas and even in the per-urban areas
2.17.2. Risk Reduction Theory (Community-Based Model)
Disasters are the greatest challenges for development. When it strikes, it claims and
destroys lives, livelihood, property and infrastructures, causing disruptions on national
scale, and sometimes affecting international arena (Hyee, 2011). Risks are challenges that
can have negative influences on projects unless they are handled properly. Disaster Risks
Reduction is a concept and practice of reducing disaster risks through systematic efforts to
analyses and reduces the casual factors of disasters. It is a process of reducing exposure to
hazards, lessening vulnerability of people and property, wise management of land and the
environment and improving preparedness and early warnings for adverse events are all
examples of disaster risks reduction (UNISDR, 2014). Therefore, people and their
communities must be at the heart of efforts to reduce the impacts of natural and human
152
induced hazards. In fact, the theory adapted in this study therefore, argues that, reducing
the risks and losses of disasters is a collective effort, hence, requires collective action.
Subsequently, this study is grounded on the community–based disaster risk reduction
theory propounded by Shaw, of Oxford University in 2009. The founder of this theory
based his theory on the crunch model. The crunch model provides the framework for
understanding the causes of a disaster (ADPC, 2000; Bakeoff, 2001, Heijmans, 2001;
Cannon, 2004; Marus, 2005). In this model, the progression of vulnerability of a
community is revealed and the underlying causes that fail to satisfy the demands of the
people are identified. The community –based model of disaster risks reduction recognizes
the fact that in the immediate aftermath of a disaster, the first response always comes from
the community itself. It also recognizes that in many cases, top down approaches may fail
to address the specific local needs of vulnerable communities, ignore the potential of local
people, resources, and capacities, and may in some cases even increase people`s
vulnerability. The Community-based Model, also, borrowed allot from the disaster
pressure and release model, which was first published in 1994 by Blaikie and then by
Wisner, 2004. The pressure and release model indicates that there are certain underlying
causes, dynamic pressures and unsafe conditions which contribute to vulnerability. Linking
the above to hazardous trigger events increases the risk in communities.
The basic practice for this theory is that disaster management techniques should adopt a
risk management approach. That is a systematic approach to identifying, assessing and
reducing risks associated with hazards and human activities. According to Béné, et. al.
(2016) it means that risk management must be the integral part of the way individuals,
153
households do their work, not an add-on or a one-off action but a process of constant
improvement.
The risk management approach recognizes that there is a wide range of geological,
meteorological, environmental, technological, socio-economic and political threats to
society. These threats creates hazards of which if human interacts with in a way not
protected, then the resultant outcome and impacts will be devastating (Claire, et. al., 2017).
Risks are located at the point where hazards, communities and environments interact, and
so effective risk management must address all of these aspects. Disasters are seen not as
one-off events to be responded to, but as deep-rooted and longer-term problems that must
be planned for. Effective risk management generally involves a variety of different but
related actions. Such integrated approaches work best when they are informed by specific
local conditions and targeted towards local needs (Bahadur, et. al., 2015).
It is important to note that Household disaster risk management and other forms of risk
management are not simply defensive measures, they must facilitate positive change.
Improved security and safety provide vital support and opportunity to households,
communities, societies and governments so that they can undertake development initiatives
that improve well-being, strengthen livelihoods and contribute to sustainable development.
Effective HDRM actions provide development benefits in the short term, as well as
contributing to vulnerability reduction in the long term, although in practice there may be
trade-offs between different goals.
For much of the world’s population, hazards are part of everyday life. Each time a person
lights a fire to cook, there is the risk of injury to children or of the house catching fire.
154
Where communities live on flood plains or volcanic slopes to benefit from fertile soils,
there are risks associated with flooding or volcanic eruption. Risks become a part of life.
When designing new development projects, we must take note of these risks. For example,
planning an agricultural programme on a flood plain without considering the impacts of
flooding invites failure. Similarly, building houses and schools in a known earthquake
zone without earthquake resistance is foolish. Development has to be appropriate, taking
full account of the context, including the likely hazards.
Applying the community-based model in this study meant that, when the households in
urban areas or the urban authority adopt the urban land use planning practices, especially,
land use planning regulatory tools, zoning and urban land use transit circulations and
connectivity, urban households would be able to reduce vulnerability to the hazard events,
hence, minimize or reduces the existing risks and even manage any existing risks or losses
on their lives, livelihoods, property and even their environment. Thus, the community-
based model of disaster risk reduction, emphases the need of social inclusiveness that is the
involment of community in the process of households disaster risk management- the
participatory approach to the household disaster risk management. It re-enforces the need
of the bottom-up approach to the household disaster risk management.
2.18. Hyogo Framework for Disaster Risk Reduction (2005-2015).
Household disaster risk management needs theory in order to make sense of apparently
chaotic events. In effect, theory is the road map of mitigation, response and recovery
(Drabek, 1989). However, the field is exceptional in that there is an imperative need to
validate theory according to its immediate utility. The urgency with which problems of
155
disaster and emergency response, and hazard and risk mitigation, need to be solved is such
that we cannot afford the luxury of producing theory for its own sake in the hope that
someday it might somehow be useful (Yin and Moore, 1985).
With the theme “Let our people teach us”, a review of the role of education in Disaster
Risk Reduction covered the key activities related to Priority 3 of the Hyogo Framework for
Action 2005-2015: “Building the Resilience of Nations and Communities to Disasters”
which includes: knowledge, education and risk awareness (ISDR, 2006).
The Hyogo Framework for Action 2005-2015 under the theme, “Use knowledge,
innovation and education to build a culture of safety and resilience at all levels”, states that
disasters can be substantially reduced if people are well informed and motivated towards a
culture of disaster prevention and resilience, which in turn requires the collection,
compilation and dissemination of relevant knowledge and information on hazards,
vulnerabilities and capacities (ISDR, 2005).
Shaw et al. (2004), state that the need for teacher education and their roles as disaster
managers in schools were realized after 1983 tsunami in Akita, Japan had killed 13
elementary school children. Whereas Ronan and Johnston (2001) in their findings after
conducting research about hazard education for youth, suggest that hazard education
programmes can help children achieve increased awareness, more realistic risk perceptions
and more knowledge of risk mitigation and increased levels of home-based hazard
adjustment.
156
This framework is the first plan to explain, describe and detail the work required from all
different sectors and actors to reduce disaster losses. This is based on the understanding
that disaster losses are on the rise with grave consequences for the survival, dignity and
livelihood of individuals, particularly the poor, and hard-won development gains.
Moreover, disaster risks are increasingly of global concern and their impacts and actions in
one region can have an impact on risks in another, and vice versa (Reghezza-Zitt et al.,
2012). This, compounded by increasing vulnerabilities related to changing demographic,
technological and socio-economic conditions, unplanned urbanization, development within
high-risk zones, under-development, environmental degradation, climate variability,
climate change, geological hazards, competition for scarce resources, and the impact of
epidemics such as HIV/AIDS, points to a future where disasters could increasingly
threaten the world’s economy, and its population and the sustainable development of
developing countries. In the past two decades, on average more than 200 million people
have been affected every year by disasters.
The Hyogo Framework for Action was developed and agreed on with the many partners
needed to reduce disaster risk including governments, international agencies, disaster
experts and many others. This has brought the stakeholders into a common system of
coordination. The HFA outlines five priorities for action, and offers guiding principles and
practical means for achieving disaster resilience. Its goal is to substantially reduce disaster
losses by 2015 by building the resilience of nations and communities to disasters. This
means reducing loss of lives and social, economic, and environmental assets when hazards
strike. The pace of urbanization in the developing world is led by Asia. Urbanization is
increasingly located in the developing countries: in 1970s, 50% of urban residents lived in
157
developing countries, whereas it is increased to 66% in 1990s, and is projected to be 80%
by 2020.
A household, whether in urban or rural areas may have weaknesses, referred to as
vulnerabilities, but it will also have strengths called capacities. These are found at
community, family and individual level. Capacities create an ability to prepare for, respond
to and recover from the impact of a hazard, reducing the damage and losses.
2.19. Sendai Framework for Disaster Risk Reduction (2015-2030)
The Sendai Framework for Disaster Risk Reduction 2015-2030 is the first major
agreement of the post 2015 development agenda, with seven targets and four priories for
action. The Sendai Framework is a fifteen (15) years, voluntary , non-binding agreement
which recognizes that the State has a primary role to reduce disaster risk but, that
responsibility should be shared with other stakeholders including local government, private
sector and other stakeholders. It aims at achieving the following outcomes:- the substantial
reduction of disaster risk and losses in lives, livelihoods and health and the economic,
physical, social, cultural and environmental assets of persons, businesses, communities,
and countries. The Sendai Framework is the successor instrument to the Hyogo Framework
for Action (HFA) 2005-2015. Thus, the Sendai Framework has been the continuation of
the Hyogo Framework for Action, whereby governments Worldwide have committed to
take action to reduce disaster risk and adapt a guideline to reduce vulnerabilities to natural
hazards.
158
The Sendai Framework for Disaster Risk Reduction 2015-2030, acknowledges that
inadequate land use planning causes urban households to be vulnerable to disaster risk in
urban areas. The Sendai Framework, in fact, states that inadequate planned and managed
cities creates new risks which threatens to erode current development gains, (UNISDR,
2015). This Framework has also emphasized that inadequate infrastructures, inadequate
urban services, unsafe housing, and poor health services can turn natural hazard into a
disaster. Both Hyogo Framework and Sendai Framework acknowledge that poorly planned
and managed urban development exposures individuals and households to disaster risk in
urban areas. According to (UNISDR,2015), weak land use regulations, for instance, the
lack of enforcement of building codes, planning permissions, regulatory investment,
generally, exposures urban households to disaster risk. Therefore, appropriate urban land
use planning would enable urban households to be less vulnerable to urban hazards which
could cause disaster Thus, a well-designed urban land use planning would accomplish the
following:- density management, site selection and development management, a good
building regulations design, provides open space/greenbelt, promote integrations and
enhances public participation. Eldoret Urban Area has been experiencing rapid growth
ofvarious spatial structure, especially, slums, informal settlements and per-urban areas due
to inadequate land use planning practices, but thiscould only be tackle if urban planning is
extended into these spatial structures.
2.20. Conceptual Framework for the Study
The concept and practice of managing disaster risks in built-up areas is systematic efforts
to analyze, understand and manage the causal factors of disasters, including reducing
159
exposure to hazards, resilience, lessened vulnerability of people and property, wise
management of land and the environment, and improved preparedness for adverse events.
This conceptual framework model presents the relationship between disaster risk
management and urban land use planning in a way that is theoretically grounded and
amenable to empirical testing. The framework model presents furthermore, the disaster risk
management (DRM) framework explicitly focused on antecedent conditions, specifically
those related to inherent resilience low vulnerability. Antecedent conditions are the product
of urban land use that lead to households income, employment, investment and credit
facilities, quality and quantity housing, socioeconomic services and housing mobility
specific to households within and between natural systems, the built environment, and
social systems (Cutter, Burton, & Emrich, 2010). DM therefore encompasses enhancing
disaster-risk reduction before a disaster occurs, and also during the reconstruction process,
requires enhanced knowledge regarding the most vulnerable groups, the areas at risk and
the driving forces that influence and generate vulnerability and risk (Birkmann, 2007).
Finally, Disaster Risk Management involves both Household disaster risk management
(prevention, preparedness and mitigation) and humanitarian and development action
(emergency response, relief and reconstruction) as may be contributed by urban land use
planning (Schipper, & Pelling, 2006).
The current increasing cases of disasters and risks experienced in urban areas demonstrate
urban areas with inadequate coping strategies. This exposes urban households to
unmatched challenges they are unable to provide immediate and long term solutions for.
The growing concern is the inability to prevent socioeconomic, demographics,
160
environmental, and transport networks risks events from happening. Most of the disasters
when they occur, the households in such urban areas lack anticipation, resilience,
understanding and forecasting of disaster risks. Yet enhancing communities’ resilience and
Household disaster risk management for sustainable socio-economic urban area
productivity is prudent move many cities pursue.
According to details given above, although there are missing links, this conceptual
framework provides a view that urban land use planning is a useful tool in disaster risk
management. As for many low or middle-income countries suffer from scarce land
resources, continuing resource degradation because of increasing urban population
pressure, natural hazards due to climate change, and a lack of integrated planning and
management of public, private, and ancestral lands and their uses. Although economic
growth remains solid, poverty levels among the urban household population, as well as
unequal income distribution, continue to rise. Very often, the poor are the ones living in
hazardous environments unsuitable for habitation, which present an extreme disaster risk
on lives, livelihood, and properties. Urban land use approaches that will play a crucial role
for the anti-poverty strategy currently and in the future, not only as space for food
production but also for urban growth, nature conservation, and industrial development are
needed. This conceptual framework therefore tries to provide a missing link on the urban
land use planning variables and the disaster risk management variable being explored in
this study. This is presented on Figure 2.1.
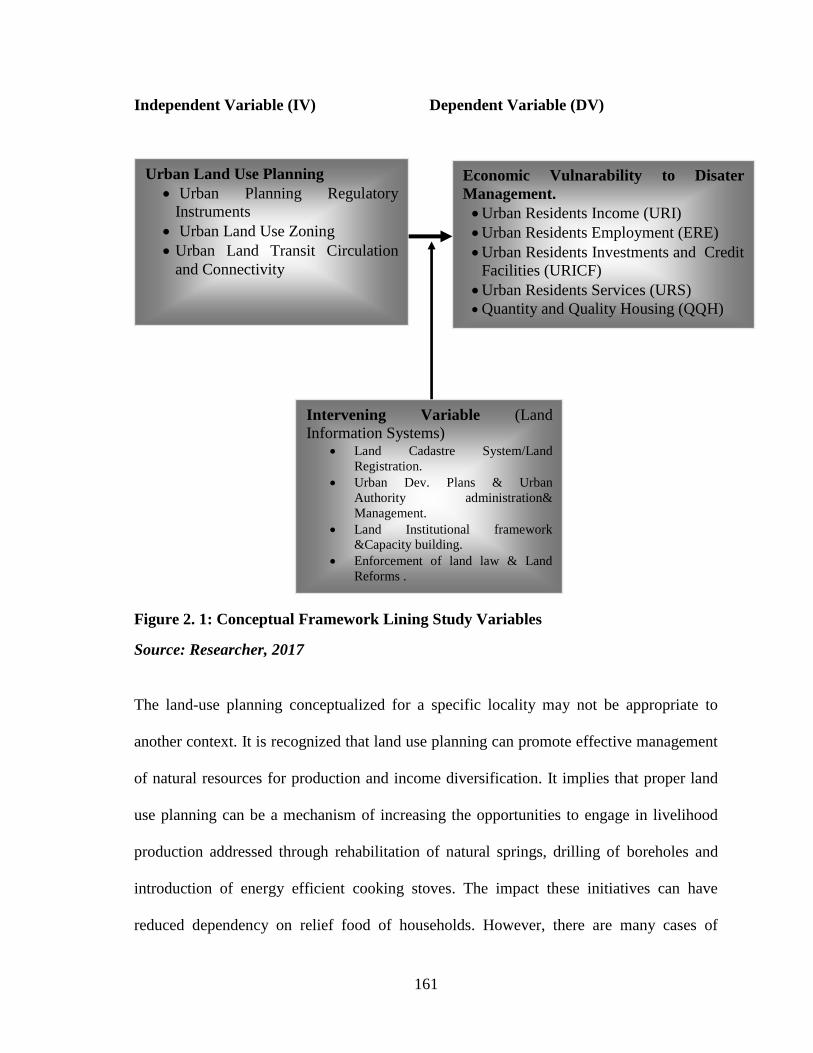
161
Independent Variable (IV) Dependent Variable (DV)
Figure 2. 1: Conceptual Framework Lining Study Variables
Source: Researcher, 2017
The land-use planning conceptualized for a specific locality may not be appropriate to
another context. It is recognized that land use planning can promote effective management
of natural resources for production and income diversification. It implies that proper land
use planning can be a mechanism of increasing the opportunities to engage in livelihood
production addressed through rehabilitation of natural springs, drilling of boreholes and
introduction of energy efficient cooking stoves. The impact these initiatives can have
reduced dependency on relief food of households. However, there are many cases of
Economic Vulnarability to Disater
Management.
Urban Residents Income (URI)
Urban Residents Employment (ERE)
Urban Residents Investments and Credit
Facilities (URICF)
Urban Residents Services (URS)
Quantity and Quality Housing (QQH)
Urban Land Use Planning
Urban Planning Regulatory
Instruments
Urban Land Use Zoning
Urban Land Transit Circulation
and Connectivity
Intervening Variable (Land
Information Systems) Land Cadastre System/Land
Registration.
Urban Dev. Plans & Urban
Authority administration&
Management.
Land Institutional framework
&Capacity building.
Enforcement of land law & Land
Reforms .
162
drought related loss of both animals and human lives, collapsing buildings in urban areas,
people being electrocuted, structures established on the riverbanks, along water lines and in
swampy areas that are prone to disasters and other risks threatening lives (Santos, Toda1,
Orduña1, Santos, Ferrão, Lopez, 2015). It means that desires to increase households’
awareness, preparedness, and readiness and risk reduction capabilities is yet to be
achieved.
The ability to reduce and manage the hazards from future disasters, less vulnerability to
risks, and capacity parameters, together with the disaster management requirements, are
identified, collected, and integrated with traditional land use planning information are
critical. Structure and non-structure measures undertaken to limit the impact of potential
disasters are not adequate for this purpose. It means that measures of mitigating disasters
such as public awareness and flood forecasting, dikes and barrage construction are lacking
or ineffective. This means that households and government agencies lack the ability to
resist, absorb, accommodate to and recover from the effects of hazards promptly and
efficiently by preserving and restoring essential basic structures.
The vulnerable low income residents, especially in cities and urban centers, include the
urban poor, the urban women and the urban youth. These are considered to be more
exposed to the disaster hazard risks. Poverty has been defined as the inability of an
individual or household to command sufficient resources to satisfy basic needs. These
basic needs include food, clothing, shelter, healthcare and other necessities of life (World
Bank Report, 2030). Poverty is multidimensional, involving not only lack of income but
also ill-health, illiteracy, lack of access to basic social services and little opportunity to

163
participate in process that influence people’s lives. The concept poverty is often difficult to
define, though most scholars defined it in terms of households’ income. Therefore, the
vulnerable low income residents in urban areas due to low or inadequate income found
themselves unable to access and afford serviced urban land.
164
CHAPTER THREE
RESEARCH DESIGN AND METHODOLOGY
3.1 Introduction
This chapter provides an explanation of how the research was conducted. It describes the
study site, research design, research methodology, target population, sampling procedures,
data collection methods, research variables and indicators, validity and reliability of the
research data collection methods and data analysis methods. Finally, the assumptions and
limitations are also noted at the end.
3.2 The Study Site
The research study was carried out in Eldoret Urban Area, formally, Eldoret Municipality.
Eldoret is located in the high agricultural potential highlands of Uasin Gishu County in
Rift Valley. It lies at an average altitude of 2,085 meters above sea level. The northern part
of Eldoret is marked by steep slope. Eldoret experiences an average daily means maximum
temperature of 24oC. It receives a total annual average rainfall of 1,149.9mm (Uasin Gishu
County Integrated Development Plan, 2008 – 2022).
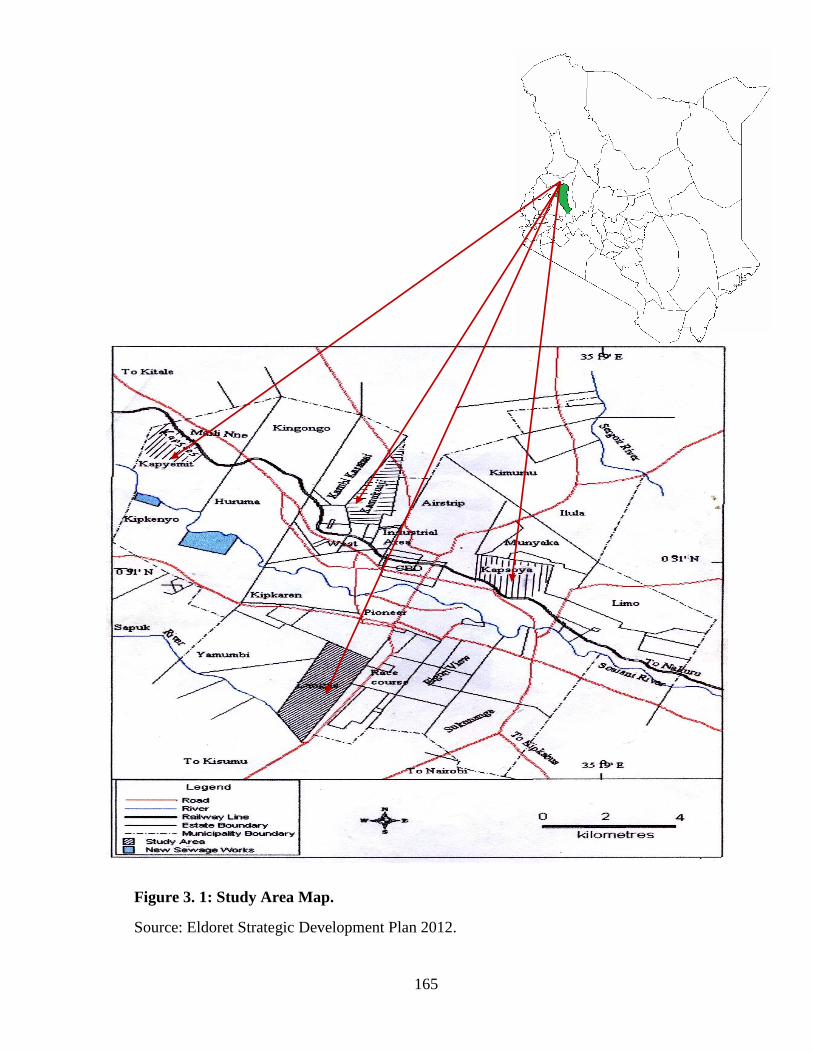
165
Figure 3. 1: Study Area Map.
Source: Eldoret Strategic Development Plan 2012.

166
3.3. Philosophical Paradigm
The term philosophical worldview means a basic set of beliefs that guide the
investigationin the choices of methods (qualitative, quantatitive or mixed method) in a
fundamental ways (Guba, 1994). Other Scholars have called it (paradigm). However,
Lincoln & Guba, (2000), refers to worldview or paradigm as espistemology and ontology
(Crotty, 1998, Neuman, 2000).
The Philosophical Paradigm that was adopted by the researcher is pragmatism. Pragmatism
is sustainable because as philosophical underpinning for mixed methods studies.It is not
fixed to any one system since it draws freely from both qualitative and quantitative
assumptions. It allowed the researcher the freedom to choose the approaches, techniques
and procedures that sufficiently guided the conduct of enquiry into land use planning on
economic vulnerability to disaster management in Eldoret Urban Area.
3.4. Reaserch Study Population
Eldoret Urban Area, was first settled by the Afrikaans in 1908, and by that time the town
was covering only 25 sq.km, with a population of 8,000 people in 1948, this grew to
18,000 people by 1969, and thereafter, at accelerated growth rate of 6% to 197,000 people
in 1999, and to 497,446 in 2009 (Eldoret Municipal Strategic Plan, 2012). .Kamukunji is
located in Uasin Gishu County, Eldoret Urban Area, and Soi Constituency, Kapsuswa-
Kwinet ward, Kiburgen location and Kamukunji sub-location. The settlement has an area
of 237 ha and is approximately 2.5 km north of central business district. The settlement is
named after a meeting place where initial residents used to converge, and is part of the
167
wider Kamukunji Estate. The total population is 9188 which is composed of 1,104
households (Kenya Population Census, 2009).
The settlement is flat on its southern edges and then extends up the sides of a rocky hill on
its northern boundaries. The settlement becomes quite muddy during the rainy season and
is surrounded by undeveloped or agricultural land as well as other less dense settlements to
its northern. Kamukunji estate is also surrounded with a number of quarries, noted among
them is the Kitur quarry. From the south it is surrounded with light industries.
Langas is located 5 km. south of Eldoret (CBD). It measures (425 ha.), with over 3,360
plots all of which were acquired informally. The farm was initially purchased from a white
settler by a Kalenjin land buying group of 53 members. Langas settlement had a population
25021 people during 2009 population census. According to Eldoret Municipal Strategic
Plan, 2012, 95% of residents in Langas, lack land ownership (land title or security). This
raises the questions of land ownership in this settlement as a very critical issue; this would
likely affect development in the area. Langas informal settlement is one of the largest
informal settlements in the municipality. It developed as a result of development of
Rivatex industry in the late 1970s to accommodate textile workers from the industry and
other light industries which developed around Pioneer area. Langas estate is within Langas
ward, Pioneer location, and Kapsaret constituency.
Kapsaos is pre-urban area that was sampled. Kapsaos area is located in Kapyamit location,
Huruma ward, and Turbo constituency. It occupies an area of 345 ha, with a population of
7345 people (Kenya Population Census, 2009). Kapsaos is pre-urban area just adjust to
Mail Nne, which is appropriately 6.5km from the CBD. As a pre-urban area, it has been
168
characterized with a large agricultural land with inadequate services and infrastructure.
Although land in this area has land tenure security (title deeds), but their source of water
was mainly borehole, with no sewage facilities, sanitation has been mainly, pit latrines. In
this area, building code/standards has not been applied as no urban planning is applied in
the area.
Kapsoya estate which formal spatial area used here as control or reference poit is allocated
in Kapsoya location, Kapsoya sub-location, Kapsoya ward, Anaibikoi constituency.
Kapsoya estate is a formal area, site and scheme project started in the 1980s.The site and
scheme had been sub-divided into 1/8 ha and total there are 258 plots. The scheme had
been provided with adequate urban services- piped water, sanitation sewage facilities and
other infrastructure. Housing quality and quantity in the area is good and satisfactory. And
because of the availability of urban services and infrastructure, residents in the estate are
not exposed to disaster risk hazards. However, recently, due to reluctant of the (EUA)
authorizes to enforce the land use regulatory instruments, especially, the building codes,
the Kapsoya population density is rapidly increasing to the cropping up total buildings and
soon the area population would be above the existing or available urban services. Kapsoya
estate covered an area 121.5 ha with a population of 8446 people (Kenya Population
Census, 2009).
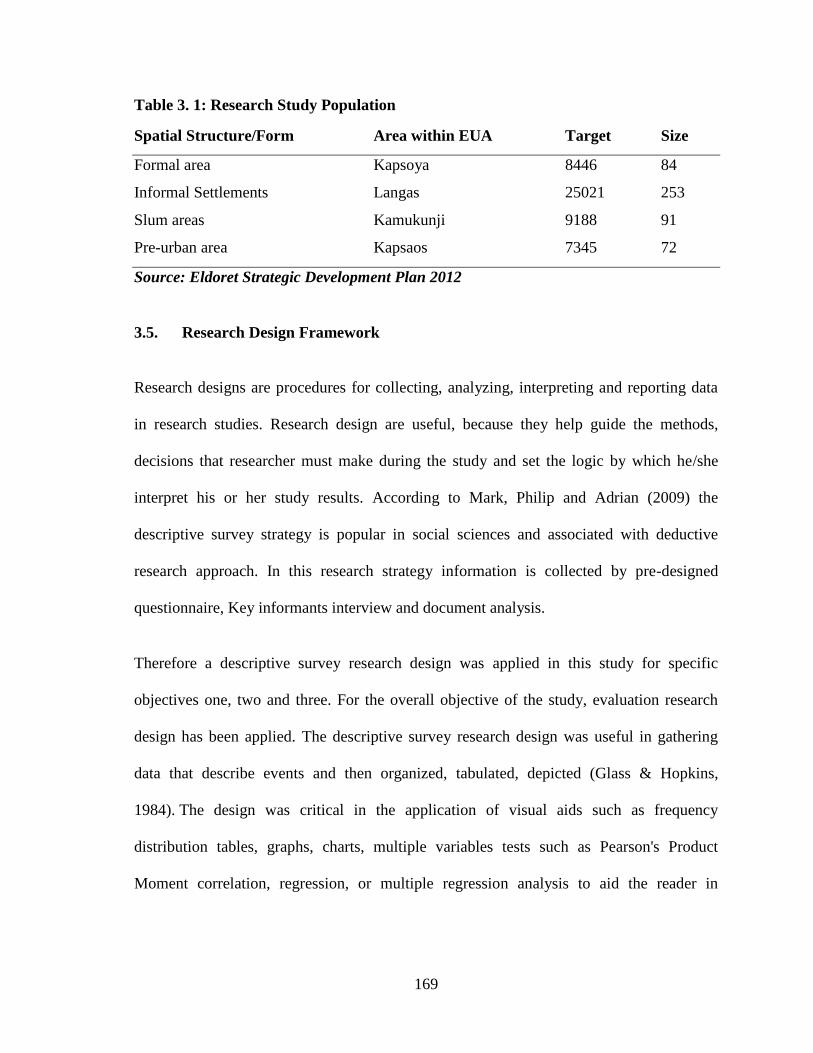
169
Table 3. 1: Research Study Population
Spatial Structure/Form Area within EUA Target Size
Formal area Kapsoya 8446 84
Informal Settlements Langas 25021 253
Slum areas Kamukunji 9188 91
Pre-urban area Kapsaos 7345 72
Source: Eldoret Strategic Development Plan 2012
3.5. Research Design Framework
Research designs are procedures for collecting, analyzing, interpreting and reporting data
in research studies. Research design are useful, because they help guide the methods,
decisions that researcher must make during the study and set the logic by which he/she
interpret his or her study results. According to Mark, Philip and Adrian (2009) the
descriptive survey strategy is popular in social sciences and associated with deductive
research approach. In this research strategy information is collected by pre-designed
questionnaire, Key informants interview and document analysis.
Therefore a descriptive survey research design was applied in this study for specific
objectives one, two and three. For the overall objective of the study, evaluation research
design has been applied. The descriptive survey research design was useful in gathering
data that describe events and then organized, tabulated, depicted (Glass & Hopkins,
1984). The design was critical in the application of visual aids such as frequency
distribution tables, graphs, charts, multiple variables tests such as Pearson's Product
Moment correlation, regression, or multiple regression analysis to aid the reader in
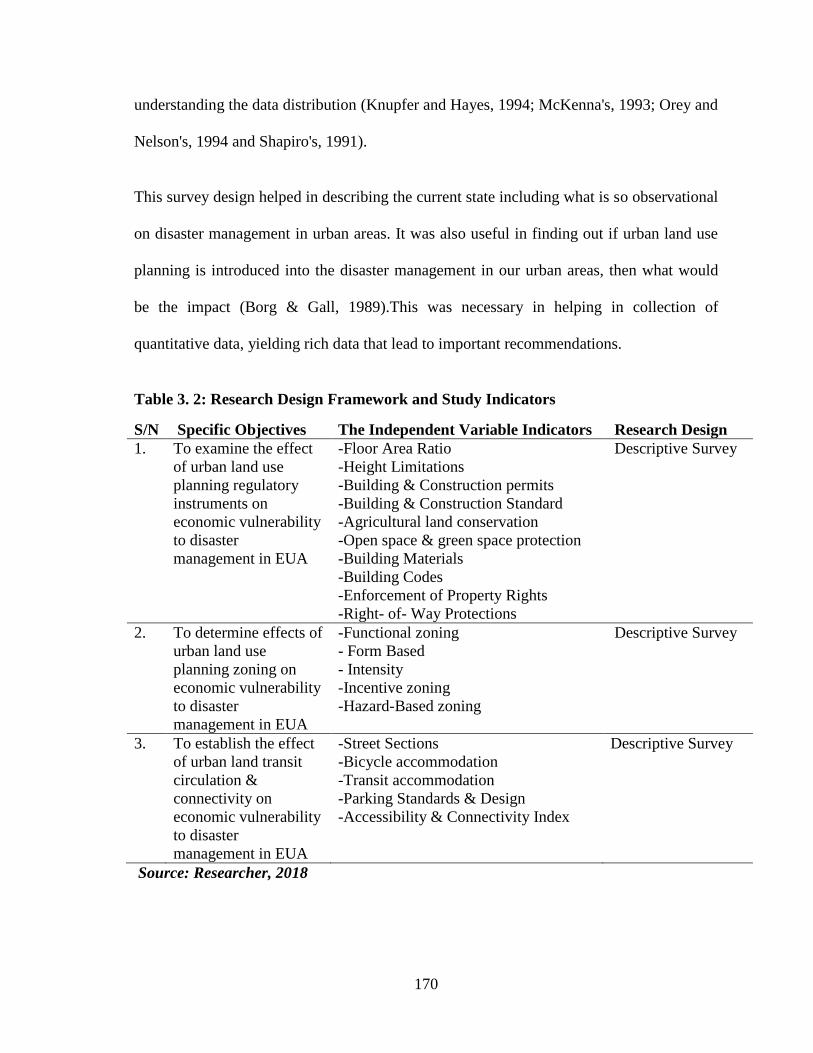
170
understanding the data distribution (Knupfer and Hayes, 1994; McKenna's, 1993; Orey and
Nelson's, 1994 and Shapiro's, 1991).
This survey design helped in describing the current state including what is so observational
on disaster management in urban areas. It was also useful in finding out if urban land use
planning is introduced into the disaster management in our urban areas, then what would
be the impact (Borg & Gall, 1989).This was necessary in helping in collection of
quantitative data, yielding rich data that lead to important recommendations.
Table 3. 2: Research Design Framework and Study Indicators
S/N Specific Objectives The Independent Variable Indicators Research Design
1. To examine the effect
of urban land use
planning regulatory
instruments on
economic vulnerability
to disaster
management in EUA
-Floor Area Ratio
-Height Limitations
-Building & Construction permits
-Building & Construction Standard
-Agricultural land conservation
-Open space & green space protection
-Building Materials
-Building Codes
-Enforcement of Property Rights
-Right- of- Way Protections
Descriptive Survey
2. To determine effects of
urban land use
planning zoning on
economic vulnerability
to disaster
management in EUA
-Functional zoning
- Form Based
- Intensity
-Incentive zoning
-Hazard-Based zoning
Descriptive Survey
3. To establish the effect
of urban land transit
circulation &
connectivity on
economic vulnerability
to disaster
management in EUA
-Street Sections
-Bicycle accommodation
-Transit accommodation
-Parking Standards & Design
-Accessibility & Connectivity Index
Descriptive Survey
Source: Researcher, 2018
171
3.5 Data Collection Methods.
This focuses on types of data collected and sources of data consulted, data collection
methods and instruments which included questionnaires and interviews. The section
explains the rationale for selecting the research methods and sampling techniques used.
Mixed methods approach was used for this study, where both qualitative and quantitative
methods were combined. The mixed methods provide a procedural approach for collecting,
analyzing and mixing both quantitative and qualitative data at some stage of the research
process within a single study to understand a research problem more completely (Mark ,
Philip . and Adrian , 2009; Maree, 2010). For quantitative data, questionnaires were used
to collect information from the residents of the four neighbourhoods of EUA.
For qualitative data collection, a purposive sampling method was used, and according to
Leedy and Ormrod (2001) purposive sampling is applied where people are chosen for a
particular purpose, for instance we might choose people who we have decided are “typical”
of a group or those who represent diverse perspectives on an issue. The County Director of
Lands and Planning, County Head of Physical Planning, Sub- County Administrator
(County Land Surveyor), County Land Registrar, County Land cadastre/ Land Officer and
Chiefs from each area of study (Langas, Kamukuji, Kapsoya and Kapsaos) were selected
for completing questionnaires and face-to-face interviews because they experienced
everyday life and were representing selected areas, thus relevant sources for this study t
topic investigated.
The required data was gathered from primary and secondary sources. In the primary data,
collection was done using questionnaires, focused group discussions and interview
172
process. Likewise, literature reviews of relevant sources of information about the research
problem were conducted as secondary data. A chapter on literature review focused on
books, articles in professional journals, research reports, policy documents such as FAO,
UN/ISDR, Government Reports, and UN-Habitat Report and Acts, conference reports,
internet and periodicals. Sources consulted were international, national and of local
standing and focused on research that provided sound conclusions and recommendations
on learner and educator preparedness.
3.6 Target Population
According to Saunders, et al. (2003), a target population consists of the full group of
potential participants to whom the researcher wants to conduct the research for the study. It
comprises of all the urban residents living within urban, sub-urban and pre-urban areas of
Eldoret town. This research study covered mainly Eldoret Urban Area formally Eldoret
Municipality. It covered the main four spatial structure and forms of urban areas, which
included the slum areas, informal settlements areas, pre-urban areas and formal areas.
Therefore, a study population comprised of the total population of Eldoret Urban Areas as
per 2009 population census which was indicated to be 497,446 who were 18 years and
older (Kenya population census, 2009). The Kenya population census of 2009 estimated
that the above 18 years of age in EUA to be 60%, thus the target populationfor the study
was 298,468. The study concentrated on Langas, Kamukunji and Kapsos, but uses
Kapsoya, a formal area as control study area as shown in Table 3.2.
173
3.7 The Sample Size
This refers to the actual number of subjects involved in this study. Webster, (1985) defines
a sample size as a finite part of a statistical population whose properties are studied to gain
information about the whole. It can simply be defined as a set of respondents selected from
a larger population for the purpose of a survey. The researcher applied proportional
stratified sampling, purposive and systematic sampling techniques in this study.
The Oxford Business and Management Dictionary defines proportionate stratified
sampling as a probability method in which different strata in a population are identified
and in which the number of elements drawn from each stratum is proportionate to the
relative number of elements in each stratum. The proportionate stratified sampling is
necessary when the study population is heterogeneous, thus, the subjects are to be partition
into multiple strata, so that each stratum consists of homogeneous subjects. For the case of
this study, four spatial structures in the Eldoret Urban Area nieghourhoods, those are:-
formal, informal settlements, slums and per-urban areas, with heterogeneous data were
studied. For the purpose of this study, the Fishers model of (1930) and modified by
Kothari, (2004) - proportionate stratified sampling has been adopted. According to Fisher`s
formula, Kothari`s model, any study population of 1000 and above should have sample
size of 10% of stratum, and therefore, a target population of 5000, should have sample size
of 500. The sample size required for the study was determined by using a 95% confidence
level and a sample error of 5% using the Fishers Exact formula for populations larger than
or equal to 5000 as follows: The Fisher`s model is stated here below:-
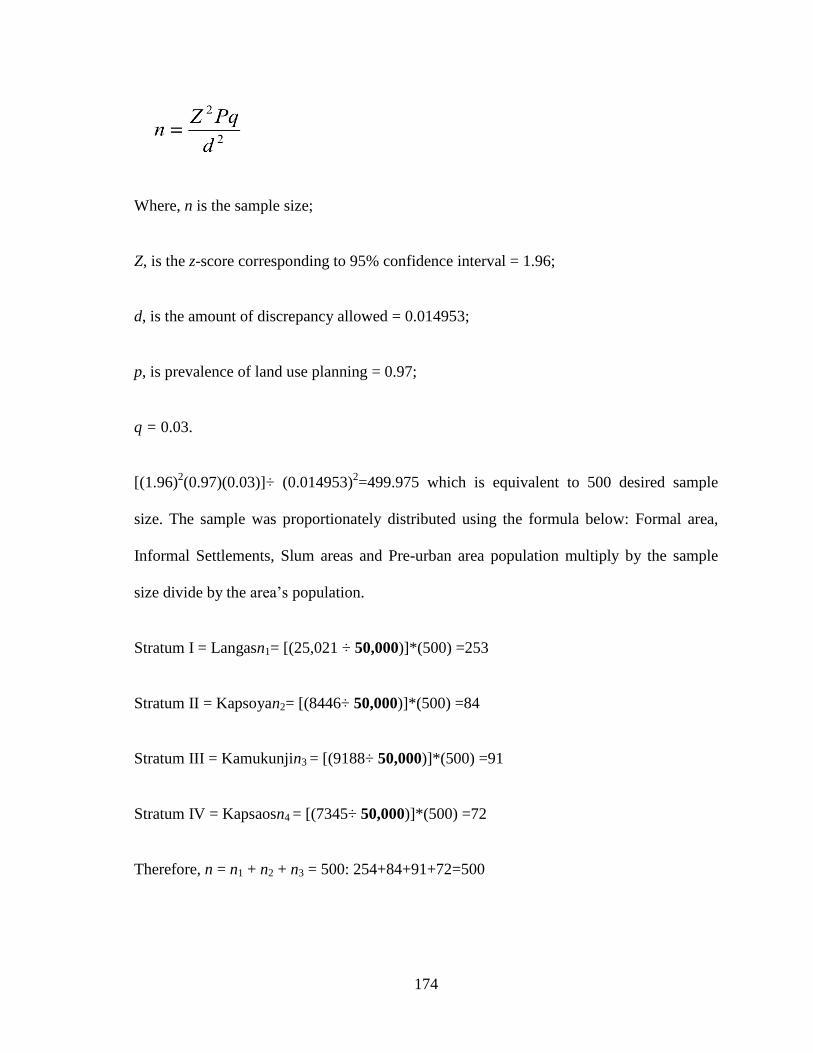
174
Where, n is the sample size;
Z, is the z-score corresponding to 95% confidence interval = 1.96;
d, is the amount of discrepancy allowed = 0.014953;
p, is prevalence of land use planning = 0.97;
q = 0.03.
[(1.96)2(0.97)(0.03)]÷ (0.014953)
2=499.975 which is equivalent to 500 desired sample
size. The sample was proportionately distributed using the formula below: Formal area,
Informal Settlements, Slum areas and Pre-urban area population multiply by the sample
size divide by the area’s population.
Stratum I = Langasn1= [(25,021 ÷ 50,000)]*(500) =253
Stratum II = Kapsoyan2= [(8446÷ 50,000)]*(500) =84
Stratum III = Kamukunjin3 = [(9188÷ 50,000)]*(500) =91
Stratum IV = Kapsaosn4 = [(7345÷ 50,000)]*(500) =72
Therefore, n = n1 + n2 + n3 = 500: 254+84+91+72=500
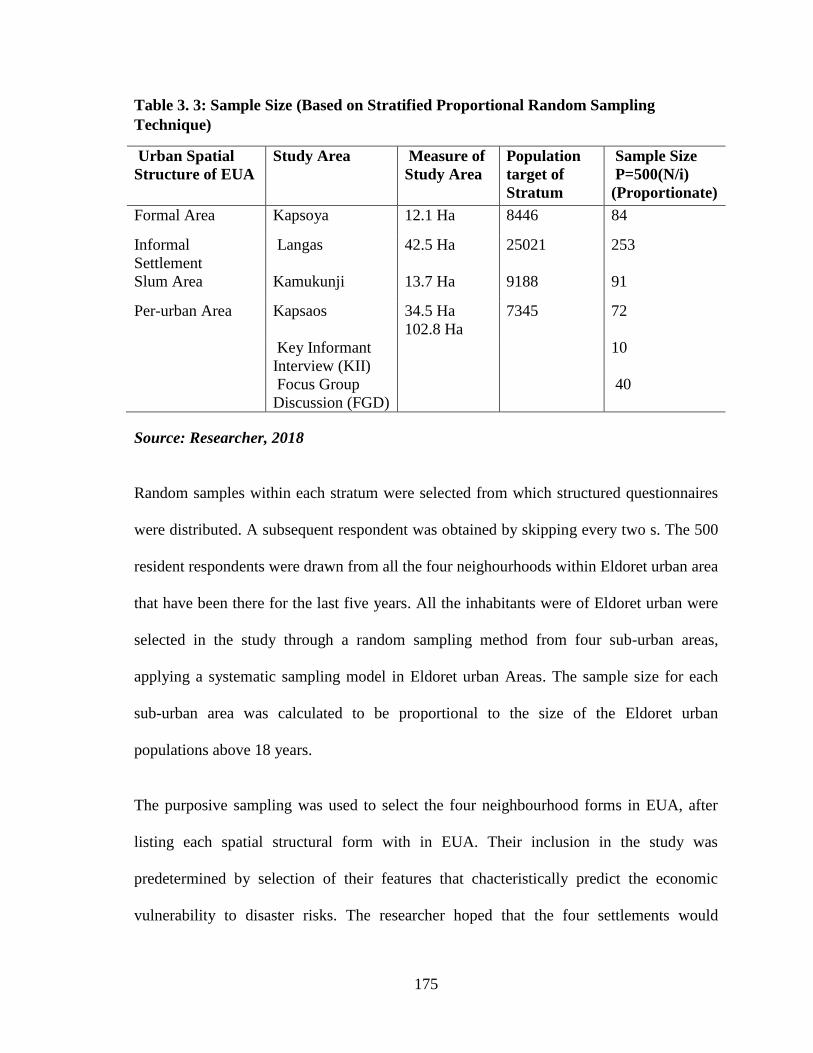
175
Table 3. 3: Sample Size (Based on Stratified Proportional Random Sampling
Technique)
Urban Spatial
Structure of EUA
Study Area Measure of
Study Area
Population
target of
Stratum
Sample Size
P=500(N/i)
(Proportionate)
Formal Area Kapsoya 12.1 Ha 8446 84
Informal
Settlement
Langas 42.5 Ha 25021 253
Slum Area Kamukunji 13.7 Ha 9188 91
Per-urban Area Kapsaos 34.5 Ha 7345 72
102.8 Ha
Key Informant
Interview (KII)
10
Focus Group
Discussion (FGD)
40
Source: Researcher, 2018
Random samples within each stratum were selected from which structured questionnaires
were distributed. A subsequent respondent was obtained by skipping every two s. The 500
resident respondents were drawn from all the four neighourhoods within Eldoret urban area
that have been there for the last five years. All the inhabitants were of Eldoret urban were
selected in the study through a random sampling method from four sub-urban areas,
applying a systematic sampling model in Eldoret urban Areas. The sample size for each
sub-urban area was calculated to be proportional to the size of the Eldoret urban
populations above 18 years.
The purposive sampling was used to select the four neighbourhood forms in EUA, after
listing each spatial structural form with in EUA. Their inclusion in the study was
predetermined by selection of their features that chacteristically predict the economic
vulnerability to disaster risks. The researcher hoped that the four settlements would
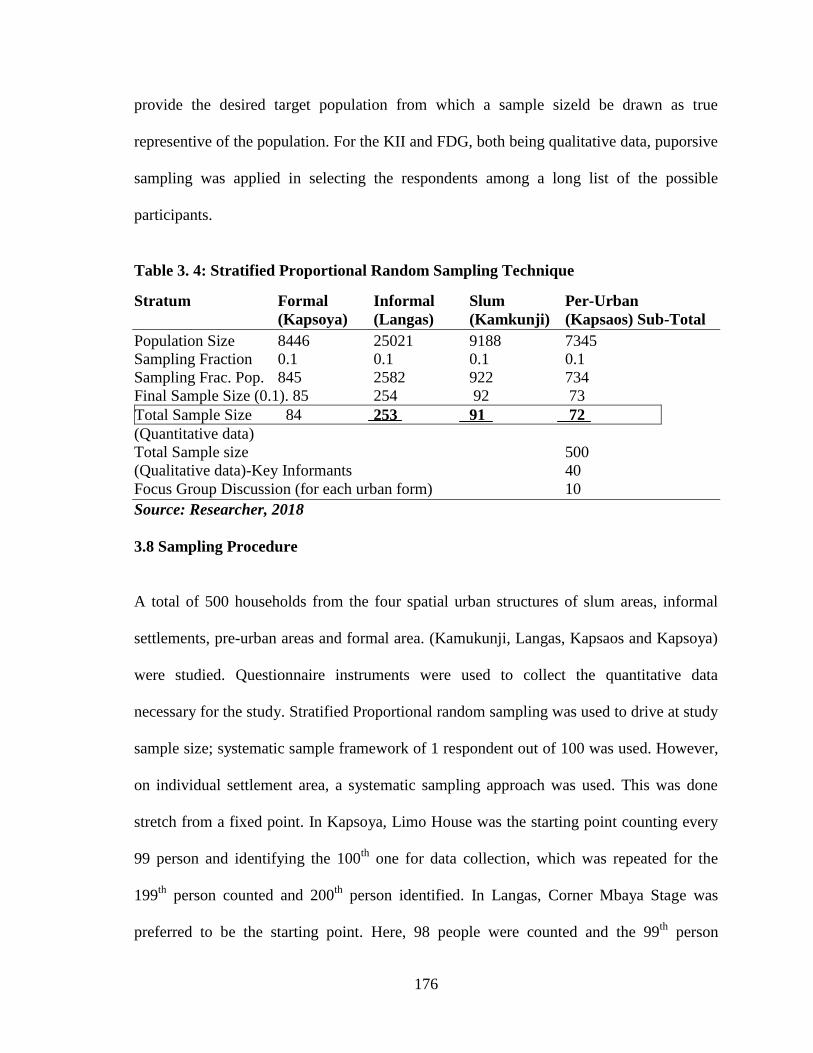
176
provide the desired target population from which a sample sizeld be drawn as true
representive of the population. For the KII and FDG, both being qualitative data, puporsive
sampling was applied in selecting the respondents among a long list of the possible
participants.
Table 3. 4: Stratified Proportional Random Sampling Technique
Stratum Formal Informal Slum Per-Urban
(Kapsoya) (Langas) (Kamkunji) (Kapsaos) Sub-Total
Population Size 8446 25021 9188 7345
Sampling Fraction 0.1 0.1 0.1 0.1
Sampling Frac. Pop. 845 2582 922 734
Final Sample Size (0.1). 85 254 92 73
Total Sample Size 84 253 91 72
(Quantitative data)
Total Sample size 500
(Qualitative data)-Key Informants 40
Focus Group Discussion (for each urban form) 10
Source: Researcher, 2018
3.8 Sampling Procedure
A total of 500 households from the four spatial urban structures of slum areas, informal
settlements, pre-urban areas and formal area. (Kamukunji, Langas, Kapsaos and Kapsoya)
were studied. Questionnaire instruments were used to collect the quantitative data
necessary for the study. Stratified Proportional random sampling was used to drive at study
sample size; systematic sample framework of 1 respondent out of 100 was used. However,
on individual settlement area, a systematic sampling approach was used. This was done
stretch from a fixed point. In Kapsoya, Limo House was the starting point counting every
99 person and identifying the 100th
one for data collection, which was repeated for the
199th
person counted and 200th
person identified. In Langas, Corner Mbaya Stage was
preferred to be the starting point. Here, 98 people were counted and the 99th
person
177
identified to participate in data collection. In Kamukunji 99th
person was counted and the
100th
one was identified as a participant. Lastly, with the case of Kapsaos, every 101stth
person was counted and the 102nd
th was identified for data collection.
Likewise, purposive sampling technique was applied to select Key Informants and Focus
Group Discussion respondents within Eldoret Urban Area. All these exercises resulted in a
sample size 550in this study.
3.9 Data Collection
In order to measure the influence of land use planning on Economic Vulnarability to
Disaster Management, the study conducted a quantitative survey. In each estate, a starting
point was selected. In Kapsoya, for example, Limo House was the starting point.
Beginning from this point, 99 household members were counted and the 100th
one was
identified as a representative of participants in data collection.
In Langas, counting started at Corner Mbaya Stage was used as the starting point. In this
informal area, 98 counts of individual household members were made and the 99th
person
identified to represent the sample size for data collection. When obtaining the
representatives of Kamukunji slum area, 99 persons were counted and 100th
one was
identified to represent data collection participants. Lastly, in Kapsaos, 101st persons were
counted and 102nd
person was identified to represent participants in data collection. All
these processes were repeated until every settlement area was completely covered.
The designed questionnaire forms, with the aid of research assistant, were distributed to the
identified participants who were requested to respondent. They were given time frame
178
considered enough to complete and collect back completed questionnaire. Before the
administration of questionnaire, a letter requesting permission to conduct the research was
requested from National Commission for Science, Technology and Innovation and the
University. Thereafter, the researcher attached a covering letter to the questionnaire and
requested the respondents to participate in this study. The letters for participation from
respondents were required by the researcher before distribution of questionnaires.
When using the personal method, a questionnaire is handed to the respondents who
completed it in his own time, but the researcher is available in case problems are
experienced. The researcher also distributed the questionnaires by hand, so that
respondents could complete them immediately and collect those (De-Vos, et. al. (2007).
The researcher then asked all respondents to return the completed questionnaires after a
week. After two weeks the researcher personally collected the questionnaires from the
participants. The completed questionnaires from the target population of 200 respondents
were collected using the personal method for data collection.
3.9.1 Primary Data Collection
This research study made use of questionnaires (closed /open-ended questions), structured
interviews and unstructured Focus Group Discussion questions were used to collect
relevant primary data from the respondents. Both open ended and closed ended
questionnaires were administrated to the respondents, especially in the slums, informal
settlements and pre-urban areas as well as in formal areas of Eldoret Urban Area.
179
3.9.2 Secondary Data Collection
Secondary data is information that has already been collected for some purpose other than
the problem at hand (Mahottra et al, 2002). As such, while important to understand the
value of secondary data, which may assist to supplement the primary data in answering the
research problem. The document analysis secondary data collection method shall be used
for the purpose of this study. Therefore, the secondary data, especially on land use
planning, and households disaster risk management literature were gathered from the
university libraries, internets sources and referred journals relevant to land issues and
disaster risk management issues in relationship to socio-economic variables.
3.9.3 Triangulation
Triangulation refers to the use of different data collection techniques within one study in
order to ensure that the data are telling you what you think they are telling you (Creswell,
2011). In this study, questionnaire, interviews, focus group discussion (semi-structured
interview) were the main primary data collection techniques, which were combined by the
secondary data collection method of document analysis as a means of qualitative data
collection techniques in support of quantitative data collection techniques of
questionnaires, thus triangulate the study.
3.10. Pilot Study
The pilot study or test is performed to refine the questions on the questionnaire to eliminate
ambiguity or bias where necessary so that the measuring instrument is fine tuned for data
collection. For the purpose of this study, 40 urnban residents or respondents were sampled
180
for piloting and participated in this study and they were randomly selected to test the
questionnaire so that the necessary revisions were made before administration of the
questionnaire to the target respondents. The respondents were not included those in the
target population of 50 elements.
The omission of pilot study is a big error, as researchers always rush to get into the main
inquiry (Bhattacharyya (2003). The pilot study omission error must be avoided as the pilot
study increases the precision of a research project (McBurney, 2001). Moreover, the
researcher should be satisfied that the procedures are effective and free from errors and are
reliable and valid (Sarantakos, 2000). That means, so as to successfully complete a sound
research project, a pilot study is mandatory (De Vos, et al., 2007).
The entire procedure and instrument must be open for criticism and comments by the
random participants and the input by the respondents must be considered when amending
the questionnaire for the main enquiry (Burns and Bush, 2010). Pilot studies accumulate
data from the ultimate subjects of the research project to serve as a guide for the larger
study (Zikmund, 2003). Once a modus operandi has been developed, a pilot study should
be conducted to find the flaws in the procedure. The procedure of a pilot study is priceless
and is an aid to careful research (Cohen and Marion, 2003). A pilot study of the
questionnaire for this research was undertaken to determine if the proposed data analysis
techniques can have any potential problems; to authenticate if the research procedure was
realistic and workable for this study; and to determine the elimination of any ambiguities
that can create statements and instructions that may be confusing in the questionnaire
(Blumberg, et. al. (2005).
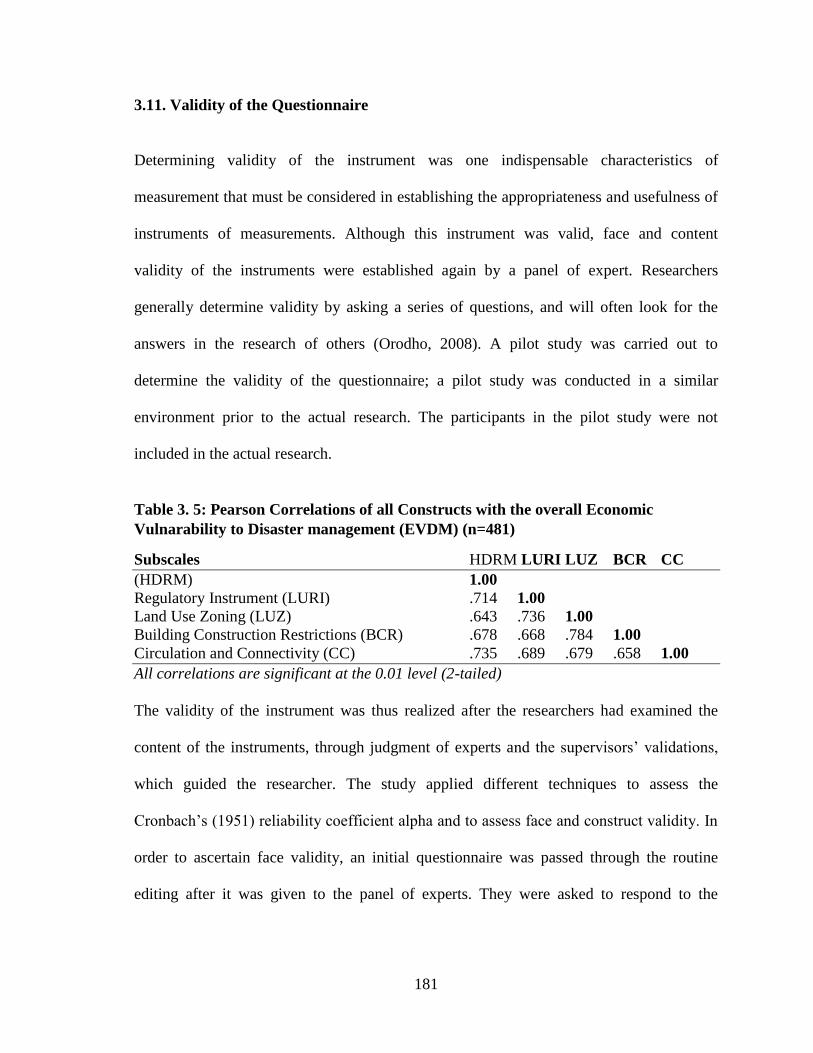
181
3.11. Validity of the Questionnaire
Determining validity of the instrument was one indispensable characteristics of
measurement that must be considered in establishing the appropriateness and usefulness of
instruments of measurements. Although this instrument was valid, face and content
validity of the instruments were established again by a panel of expert. Researchers
generally determine validity by asking a series of questions, and will often look for the
answers in the research of others (Orodho, 2008). A pilot study was carried out to
determine the validity of the questionnaire; a pilot study was conducted in a similar
environment prior to the actual research. The participants in the pilot study were not
included in the actual research.
Table 3. 5: Pearson Correlations of all Constructs with the overall Economic
Vulnarability to Disaster management (EVDM) (n=481)
Subscales HDRM LURI LUZ BCR CC
(HDRM) 1.00
Regulatory Instrument (LURI) .714 1.00
Land Use Zoning (LUZ) .643 .736 1.00
Building Construction Restrictions (BCR) .678 .668 .784 1.00
Circulation and Connectivity (CC) .735 .689 .679 .658 1.00
All correlations are significant at the 0.01 level (2-tailed)
The validity of the instrument was thus realized after the researchers had examined the
content of the instruments, through judgment of experts and the supervisors’ validations,
which guided the researcher. The study applied different techniques to assess the
Cronbach’s (1951) reliability coefficient alpha and to assess face and construct validity. In
order to ascertain face validity, an initial questionnaire was passed through the routine
editing after it was given to the panel of experts. They were asked to respond to the
182
questionnaire. Very few comments were received and some minor changes were done to
enhance the clarity.
3.12. Reliability of the Questionnaire
A reliability of the measuring instrument addresses the question of whether the results of
the measuring processes are consistent on occasions when they should be consistent
(Trochim, 2006). It is a statistical concept that is related to consistency and dependability,
that is, consistency in obtaining the same relative answer when measuring phenomena that
have not changed (Burns and Bush, 2010). Questionnaires have a very limited purpose as
they are often one-time data gathering methods with a very short life, administered to a
limited population (Norval, 2006). The following are important parts of reliability: test-
retest reliability (coefficient correlation of stability). Consistency is estimated by
comparing two or more repeated questions of the measuring instruments. This gives an
indication of the dependability of the result on one occasion which may then be compared
with the results obtained on another occasion and internal consistency reliability. This
indicates how well the test items measure the same thing (Blumberg, et al., 2005). In this
study reliability of the questionnaire was determined using a sample of respondents. The
items were measured by a 6-point Likert-scale, which ranged from strongly disagree (1) to
strongly agree (6). Reliability analysis was subsequently done using Cronbach’s Alpha
which measures the internal consistency to establish if certain items within a scale measure
the same construct. Cronbach Alpha was established for every variable.
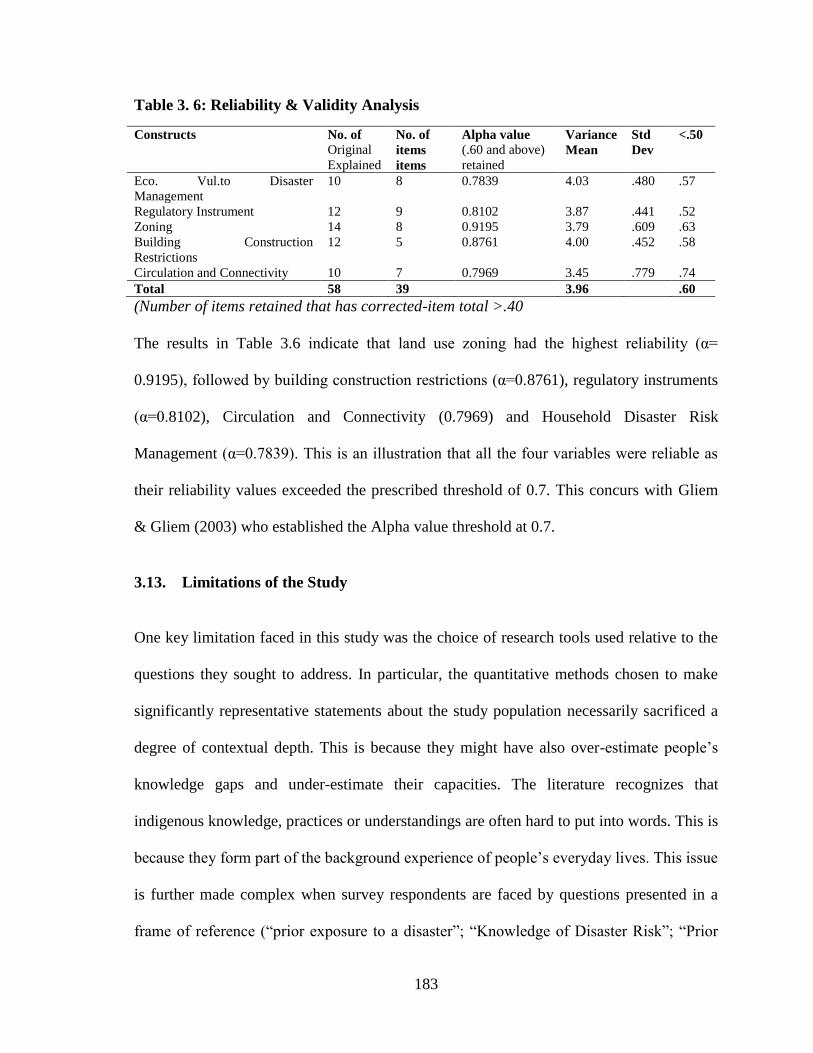
183
Table 3. 6: Reliability & Validity Analysis
Constructs No. of
Original
Explained
No. of
items
items
Alpha value
(.60 and above)
retained
Variance
Mean
Std
Dev
<.50
Eco. Vul.to Disaster
Management
10 8 0.7839 4.03 .480 .57
Regulatory Instrument 12 9 0.8102 3.87 .441 .52
Zoning 14 8 0.9195 3.79 .609 .63
Building Construction
Restrictions
12 5 0.8761 4.00 .452 .58
Circulation and Connectivity 10 7 0.7969 3.45 .779 .74
Total 58 39 3.96 .60
(Number of items retained that has corrected-item total >.40
The results in Table 3.6 indicate that land use zoning had the highest reliability (α=
0.9195), followed by building construction restrictions (α=0.8761), regulatory instruments
(α=0.8102), Circulation and Connectivity (0.7969) and Household Disaster Risk
Management (α=0.7839). This is an illustration that all the four variables were reliable as
their reliability values exceeded the prescribed threshold of 0.7. This concurs with Gliem
& Gliem (2003) who established the Alpha value threshold at 0.7.
3.13. Limitations of the Study
One key limitation faced in this study was the choice of research tools used relative to the
questions they sought to address. In particular, the quantitative methods chosen to make
significantly representative statements about the study population necessarily sacrificed a
degree of contextual depth. This is because they might have also over-estimate people’s
knowledge gaps and under-estimate their capacities. The literature recognizes that
indigenous knowledge, practices or understandings are often hard to put into words. This is
because they form part of the background experience of people’s everyday lives. This issue
is further made complex when survey respondents are faced by questions presented in a
frame of reference (“prior exposure to a disaster”; “Knowledge of Disaster Risk”; “Prior
184
Exposure to a Disaster”; “Duration of Disaster in Days”) that may seem unfamiliar and
arbitrary. For example, an urban household’s Income and Employment, Investment and
Financial Credit, Housing Quality and Quantity, Housing Mobility practices may have
developed in ways that inherently reduce their vulnerability to natural hazards, but urban
household members may struggle to explicitly link these steps with disaster risk
management.
The study made efforts to mitigate these limitations through extensive piloting of tools and
the use of FGDs and KIIs. Indeed, during FGDs the researcher noted that urban household
members were much better able to elaborate their understandings and practices in
relationship to disaster risk management than they were as individuals during the survey.
However, the study’s findings should still be taken as a broad snapshot of the situation in
Uashin Gishu County as a whole, but not as a substitute for more intensive, participatory
research at the county level.
The study also faced the presence of different dialects and religions in different parts of the
study area since Eldoret town is a cosmopolitan area. Translation of the research tools into
local languages other than English and Swahili was not possible, meaning that research
assistants had to translate questions into local dialects on the spot during interviews. This
raised the risk that questions may have been asked in different ways to different
respondents, leaving scope for misinterpretations and potentially affecting the validity of
results in some areas. A related limitation in this respect is the fact that in most of the
households in the pre-urban, informal and slum settlements, majority of the members
lacked reading and writing ability; the survey had to use five separate research assistants;
185
one core, plus additional secondary assistants. Having higher numbers of assistants
involved is again likely to increase sampling error by increasing the variation of assistants’
possible interview styles and respondents’ responses to them.
The research assistants attempted to mitigate these limitations by intensive review of the
questionnaire and multiple rounds of interview simulation at the focused group discussion
workshops, as well as repeated debriefing and close supervision while in the field.
The study was not intent to validate scientific reasons which are supposedly causing
climate change and disasters. Currently, this is part of the global debate. However, the
study analyseschanges in resultant impacts from patterns of rainy seasons and temperatures
as they affected the wider urban households.
Although various efforts were attempted but they did not make it possible to entirely
exclude biases of households and other stakeholders while collecting information about
disaster risk management. There is too much talk about impact of climate change that may
affect people's perceived change of behaviour. Therefore, the study used several methods
to triangulate the given information. Furthermore, it proved difficult to isolate the impact
of climate-change-related hazards from the impact of other socioeconomic events that were
pursued in this study. Therefore, the study took in consideration the interrelationship
between climatic, socioeconomic and natural factors as they lead to disaster risks.
3.14. Measurement and Scaling of Data
Measurement is an underlying concept in conducting a questionnaire survey. Basically,
measurement is the process of allocating numbers to a variable based on a set of rules. To
186
measure a concept (often referred to as an operational definition), it is necessary to have an
indicator or indicators that represent the concept (Bryman, 2012). Although
operationalization is very straight forward for variables such as age or level of education it
is much more difficult for variables such as governance, Household Disaster Risk
Management or , so where the concept is abstract, complex, and not directly observable,
latent (unobservable) variables or constructs are applied (Hair et al., 2014). latent variables
are theoretical creations based on observations that cannot be observed directly or
indirectly and must be inferred from measurable or observable indicators (Manifest
variable), Babbie, 2013; Polites, Roberts and Thatcher, 2012) each of these indicators that
serve as proxy variables would represent a single separate aspects of a larger abstract
concept (Hair et al., 2014).
The second issue in developing a measurement instrument is the measurement scale. A
measurement scale is a tool with predetermined number of closed- ended responses that
can be used to obtain an answer to a question (Hair et al., 2014). Measurement scales are
categorized into four different types, including nominal, ordinal, interval and ratio. Each of
the scales represents a different level of measurements (Babbie et al., 2013; Hair et al.,
2014). Nominal scales are the lowest level of scales because they restrict the analysis
options by assigning names or numbers to variables that enable us to identify or classify
those variables. These scales can be composed of several categories, but they should all be
mutually exclusive. The ordinal scale is the next high level of scale that arranges attributes
of variables in some order; from low to high from less, and so on with result being the add
quality or rank ordering to the measured variables (Babbie et al., 2013).
187
However, these ranked values are not based on equal difference between variables so the
means or variances for ordinal data cannot be calculated. The interval scale is the next
measurement scale and it not only gives the same ranking capability as an ordinal scale, it
also provides precise information on the distances between the attributes of variable, by
capturing the differences in values (Hair et al., 2014). Although interval scale enables the
researcher to carry out almost any type of mathematical computations including the mean
and standard deviation, it does not provide the absolute zero point, and therefore the values
of zero in an interval scale does not mean there is no value (Mooi and Sarstedt, 2011). To
include this information in measurement, the ratio scale should be used, that is, at the
highest level of measurement (Hair et al., 2014).
After choosing the scales to measure the indicators and constructs, the next thing that
should become clear is the coding style. Coding is about assigning number to categories in
a way that facilitates measurements are possible (Hair et al., 2014). Coding is a critical
issue in the application of multivariate analysis; for instances when Likert scales (which
are very popular in questionnaire surveys) are used in a research, it is necessary to code the
categories so they are symmetric and equidistant (Babbie et al., 2013). After fulfilling this
requirement, the outcome values can be treated as the results of interval scales. This means
that while the Likert is ordinal, it can approximate an interval level measurement and the
corresponding variables can be used in multivariate analysis ((Hair et al., 2014).
The measurement scale and coding style applied in this study are summarize in all the
items related to Economic Vulnarability to Disaster Management (EVDM) were defined as
ordinal variables to arrange different attributes of the construct in order. These items were
188
rated on a- Five Point Likert Scale (1= strongly disagree, 4= strongly agree).Data was
gathered from both primary and secondary sources with primary data gathered from
participants through questionnaires and interview process. Literature review of relevant
sources of information about the research problem and research questions were conducted
as secondary data from books, articles in professional journals, research reports, policy
documents, conference reports, internet and periodicals. The data collection method was
carried out through questionnaires and interviews.
3.15. Materials and Methods
This section uses a probit model as a regression technique through the statistical software,
Data Analysis and SPSS to investigate the link among various factors and the probability
of household flood risk reduction measures being applied. A multiple linear regression
model was used to predict effects using the three independent variables in the study: land
use regulatory instruments, land use zoning, and transit connectivity and circulation. In
addition, the β coefficients for each independent variable generated from the model was
subjected to a z–test, in order to test each of the hypotheses under study. The equation used
in this study is:
yi =α + β1X1 + β2X2 +β3X3 + Ɛ
The variables are:
yi equals 1 if a household has undertaken any disaster risk management measure and 0
otherwise. That is yi = Economic Vulnarability to Disaster Management (EVDM)
189
X1 is a vector measuring the level and intensity of the land use regulations
instruments influence on household disaster risk management. X1 = Land Use
Regulatory Instruments (LURI)
X2 is a vector of measuring the level and intensity of land use zoning and its
influence on household disaster risk management. X2 = Land Use Zoning (LUZ)
X3 is a vector measuring the intensity and level of influence of circulation and
connectivity variable on economic vulnerability to disaster management. X4 =
Connectivity and Circulation (CC)
Ƹi is a stochastic error term that is assumed to be distributed normally, Ƹi ∼ N (0,δ2).
α - Constant
β1, β2, and β3 - Coefficient indicating rate of change of Economic Vulnarability to
Disaster Management as measured by its four dimensions of land use regulatory
instruments, land use zoning, Building construction restrictions and Connectivity and
Circulation changes.
All the above statistical tests were analyzed using the Statistical Package for Social
Sciences (SPSS), version 25. All tests were two-tailed. Significant levels were measured at
95% confidence level with significant differences recorded at p < 0.05.
3.16. Analysis of Data
After the fieldwork, data collected from documentary sources and the field was
qualitatively analyzed. Data analysis is data that is statistically analyzed in order to
determine whether the generated hypotheses have been supported (Sarantakos, 2000). The
questionnaires were collected and counted to ensure that all respondents had answered and
190
completed the questions. The returned questionnaires were coded and captured on the
computer. De Vos, et al. (2007) describes data analyses as the process of bringing order,
structure and meaning to the mass of collected data.
Questionnaires received from respondents, content analysis and interview schedules were
checked for completeness with repeat calls being made for incomplete questionnaires to
maintain the number of respondents. Categorization and coding was then done and data
entered into SPSS for windows version 25 for analysis. Both descriptive and inferential
tests were used in the analysis. Data was described or summarized using descriptive
statistics such as mean and frequencies, which helped in meaningfully describing the
distribution of responses. Descriptive data and evidence relating to each research question
were classified into distinctive classes based on their common qualitative characteristics.
Being basically a qualitative research, the results were discussed in a narrative manner.
Various inferential statistics was used to infer population characteristics from the sample.
Pearson’s correlation coefficient was used to establish relationships between variables.
3.17. Missing Data and Outliers
One of the most common problems in survey research is missing data. This problem occurs
when a respondent either deliberately or unintentionally, does not answer one or more
questions. It has been suggested that those responses where the number of missing values
exceeds 15% of the total number of questions in the questionnaire (Hair et. al., 2014)
should be eliminated, but since no such case was found in this study, all responses were
kept for further analysis. A thorough check of the descriptive statistics revealed that
missing data for the variables and respondents ranged between 0.1% and 4.1%, which were
191
less than 10% hence were ignored because it does not have a significant effect on any
analyses (Hair et. al., 2014).
3.18. Ethical Considerations
The study observed and complied with the ethical procedures to protect the rights of the
research participants, involving the principle of voluntary participation which requires that
participants do not need to be coerced into participating in this research. The following
ethical measures were adhered to (Sekaran, 2003). The thesis strived to ensure that no
attempt was made to harm participants deliberately and those who could experience any
form of harm be it through victimization, emotional or otherwise, were informed in
advance of their right to withdraw from participating in the study. Confidentiality means
that information from participants was not to be divulged to the public nor made available
to colleagues, subordinates or superiors. In this study, all information about participants
was treated with confidentiality and the participants were anonymous (Saunders, et al.,
2003). A covering letter also assured respondents that all responses would be treated with
confidentiality and anonymity.
These ethical issues were considered to ensure the safety of the research participants,
during the process of research. According to Creswell (2003), the participants have the
right to participate voluntarily and the right to withdraw at any time, so that individuals are
not being coerced into participation. The participants also have the right to know the
purpose of the study, so that they understand the nature of the research and its likely
impact on them. These aspects were observed before data collection from both the

192
respondents and participants. To ensure confidentiality of responses from participants, the
real names of participants were made confidential only using pseudonyms.
193
CHAPTER FOUR
DATA PRESENTATION ANALYSIS AND INTERPRETATION
4.1 Overview
This chapter presents an analysis and discussions of the data gathered from the
respondents, in Eldoret Urban Area. It comprises the analysis, presentation and
interpretation of the findings resulting from this study. The data were collected through
structured questionnaire, interviews and group discussion interviews. The methodologies
used provided an insight that brought to the fore key effects faced by urban resid in four
spatial structuring forms in Eldoret Urban Area. The chapter discusses the general data
presentation and further discusses data interpretation and analysis of specific objective one.
The analysis and interpretation of data is carried out in two phases. The first part, which is
based on the results of the questionnaire, deals with a quantitative analysis of data. Since
the purpose of the study was to investigate the land use planning and economic
vulnerability to disaster management in Eldoret urban area, Kenya especially, in Langas,
Kapsoya, Kamkunji and Kapsaos. The second part deals with qualitative data analysis, the
content data analysis to analysis the (KII), and (FGD) data.
4.2 Response Rate
The response rate of the respondents is critical to this study because it reflects in-depth of
the data gathered. The response is useful in determining whether to move forward with the
analysis and interpretation of results and findings. Questionnaire forms, key informer
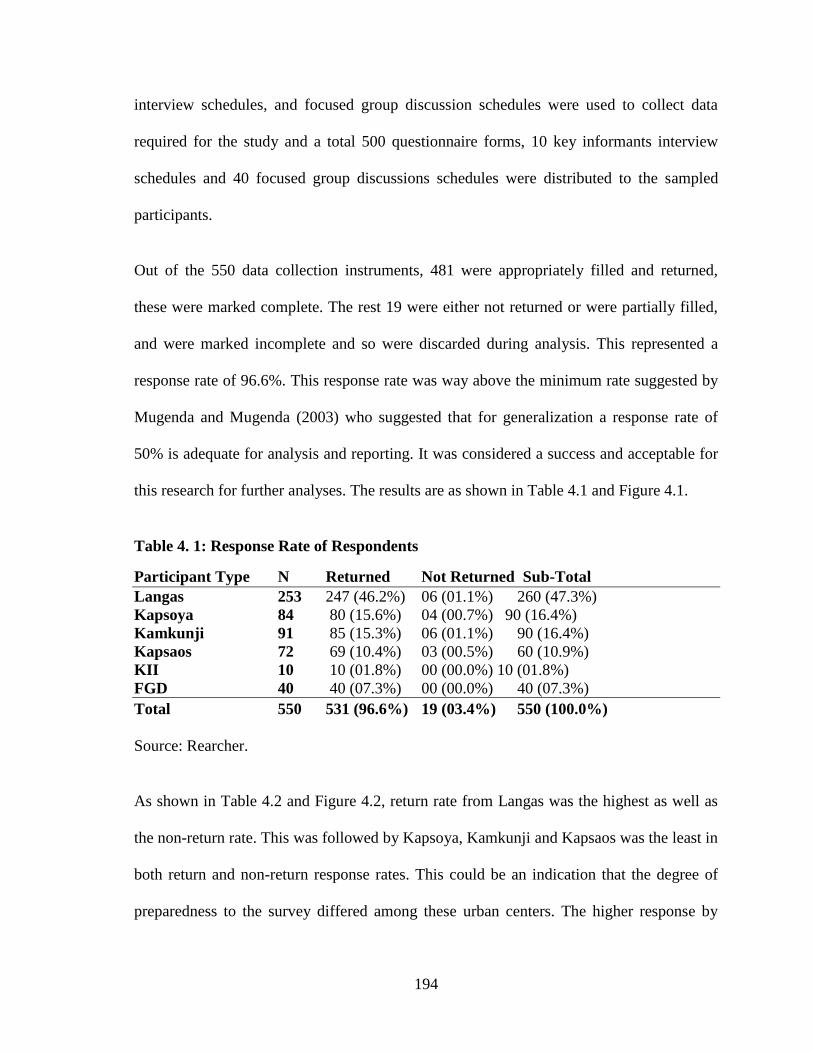
194
interview schedules, and focused group discussion schedules were used to collect data
required for the study and a total 500 questionnaire forms, 10 key informants interview
schedules and 40 focused group discussions schedules were distributed to the sampled
participants.
Out of the 550 data collection instruments, 481 were appropriately filled and returned,
these were marked complete. The rest 19 were either not returned or were partially filled,
and were marked incomplete and so were discarded during analysis. This represented a
response rate of 96.6%. This response rate was way above the minimum rate suggested by
Mugenda and Mugenda (2003) who suggested that for generalization a response rate of
50% is adequate for analysis and reporting. It was considered a success and acceptable for
this research for further analyses. The results are as shown in Table 4.1 and Figure 4.1.
Table 4. 1: Response Rate of Respondents
Participant Type N Returned Not Returned Sub-Total
Langas 253 247 (46.2%) 06 (01.1%) 260 (47.3%)
Kapsoya 84 80 (15.6%) 04 (00.7%) 90 (16.4%)
Kamkunji 91 85 (15.3%) 06 (01.1%) 90 (16.4%)
Kapsaos 72 69 (10.4%) 03 (00.5%) 60 (10.9%)
KII 10 10 (01.8%) 00 (00.0%) 10 (01.8%)
FGD 40 40 (07.3%) 00 (00.0%) 40 (07.3%)
Total 550 531 (96.6%) 19 (03.4%) 550 (100.0%)
Source: Rearcher.
As shown in Table 4.2 and Figure 4.2, return rate from Langas was the highest as well as
the non-return rate. This was followed by Kapsoya, Kamkunji and Kapsaos was the least in
both return and non-return response rates. This could be an indication that the degree of
preparedness to the survey differed among these urban centers. The higher response by
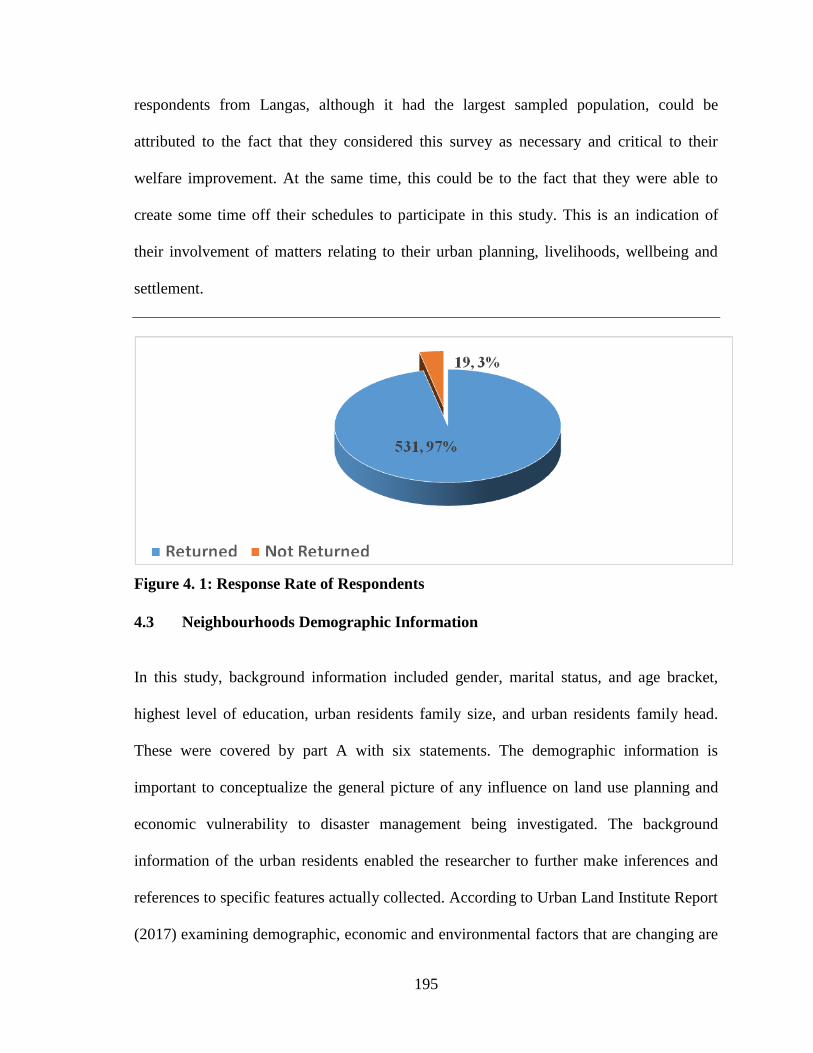
195
respondents from Langas, although it had the largest sampled population, could be
attributed to the fact that they considered this survey as necessary and critical to their
welfare improvement. At the same time, this could be to the fact that they were able to
create some time off their schedules to participate in this study. This is an indication of
their involvement of matters relating to their urban planning, livelihoods, wellbeing and
settlement.
Figure 4. 1: Response Rate of Respondents
4.3 Neighbourhoods Demographic Information
In this study, background information included gender, marital status, and age bracket,
highest level of education, urban residents family size, and urban residents family head.
These were covered by part A with six statements. The demographic information is
important to conceptualize the general picture of any influence on land use planning and
economic vulnerability to disaster management being investigated. The background
information of the urban residents enabled the researcher to further make inferences and
references to specific features actually collected. According to Urban Land Institute Report
(2017) examining demographic, economic and environmental factors that are changing are

196
useful in determining what will be built, where it will be built, and how it will be financed
leaving room for other critical social amenities. The results of demographic profile are as
shown in Table 4.2 and Figure 4.2.
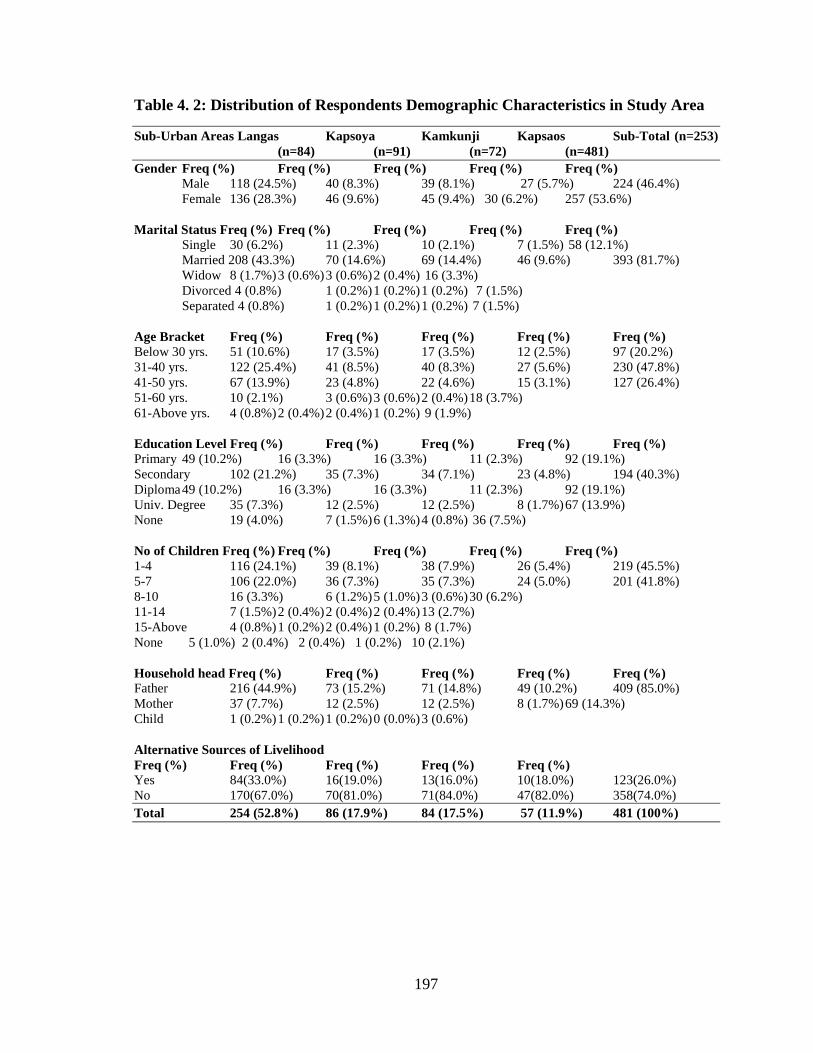
197
Table 4. 2: Distribution of Respondents Demographic Characteristics in Study Area
Sub-Urban Areas Langas Kapsoya Kamkunji Kapsaos Sub-Total (n=253)
(n=84) (n=91) (n=72) (n=481)
Gender Freq (%) Freq (%) Freq (%) Freq (%) Freq (%)
Male 118 (24.5%) 40 (8.3%) 39 (8.1%) 27 (5.7%) 224 (46.4%)
Female 136 (28.3%) 46 (9.6%) 45 (9.4%) 30 (6.2%) 257 (53.6%)
Marital Status Freq (%) Freq (%) Freq (%) Freq (%) Freq (%)
Single 30 (6.2%) 11 (2.3%) 10 (2.1%) 7 (1.5%) 58 (12.1%)
Married 208 (43.3%) 70 (14.6%) 69 (14.4%) 46 (9.6%) 393 (81.7%)
Widow 8 (1.7%) 3 (0.6%) 3 (0.6%) 2 (0.4%) 16 (3.3%)
Divorced 4 (0.8%) 1 (0.2%) 1 (0.2%) 1 (0.2%) 7 (1.5%)
Separated 4 (0.8%) 1 (0.2%) 1 (0.2%) 1 (0.2%) 7 (1.5%)
Age Bracket Freq (%) Freq (%) Freq (%) Freq (%) Freq (%)
Below 30 yrs. 51 (10.6%) 17 (3.5%) 17 (3.5%) 12 (2.5%) 97 (20.2%)
31-40 yrs. 122 (25.4%) 41 (8.5%) 40 (8.3%) 27 (5.6%) 230 (47.8%)
41-50 yrs. 67 (13.9%) 23 (4.8%) 22 (4.6%) 15 (3.1%) 127 (26.4%)
51-60 yrs. 10 (2.1%) 3 (0.6%) 3 (0.6%) 2 (0.4%) 18 (3.7%)
61-Above yrs. 4 (0.8%) 2 (0.4%) 2 (0.4%) 1 (0.2%) 9 (1.9%)
Education Level Freq (%) Freq (%) Freq (%) Freq (%) Freq (%)
Primary 49 (10.2%) 16 (3.3%) 16 (3.3%) 11 (2.3%) 92 (19.1%)
Secondary 102 (21.2%) 35 (7.3%) 34 (7.1%) 23 (4.8%) 194 (40.3%)
Diploma 49 (10.2%) 16 (3.3%) 16 (3.3%) 11 (2.3%) 92 (19.1%)
Univ. Degree 35 (7.3%) 12 (2.5%) 12 (2.5%) 8 (1.7%) 67 (13.9%)
None 19 (4.0%) 7 (1.5%) 6 (1.3%) 4 (0.8%) 36 (7.5%)
No of Children Freq (%) Freq (%) Freq (%) Freq (%) Freq (%)
1-4 116 (24.1%) 39 (8.1%) 38 (7.9%) 26 (5.4%) 219 (45.5%)
5-7 106 (22.0%) 36 (7.3%) 35 (7.3%) 24 (5.0%) 201 (41.8%)
8-10 16 (3.3%) 6 (1.2%) 5 (1.0%) 3 (0.6%) 30 (6.2%)
11-14 7 (1.5%) 2 (0.4%) 2 (0.4%) 2 (0.4%) 13 (2.7%)
15-Above 4 (0.8%) 1 (0.2%) 2 (0.4%) 1 (0.2%) 8 (1.7%)
None 5 (1.0%) 2 (0.4%) 2 (0.4%) 1 (0.2%) 10 (2.1%)
Household head Freq (%) Freq (%) Freq (%) Freq (%) Freq (%)
Father 216 (44.9%) 73 (15.2%) 71 (14.8%) 49 (10.2%) 409 (85.0%)
Mother 37 (7.7%) 12 (2.5%) 12 (2.5%) 8 (1.7%) 69 (14.3%)
Child 1 (0.2%) 1 (0.2%) 1 (0.2%) 0 (0.0%) 3 (0.6%)
Alternative Sources of Livelihood
Freq (%) Freq (%) Freq (%) Freq (%) Freq (%) Yes 84(33.0%) 16(19.0%) 13(16.0%) 10(18.0%) 123(26.0%)
No 170(67.0%) 70(81.0%) 71(84.0%) 47(82.0%) 358(74.0%)
Total 254 (52.8%) 86 (17.9%) 84 (17.5%) 57 (11.9%) 481 (100%)
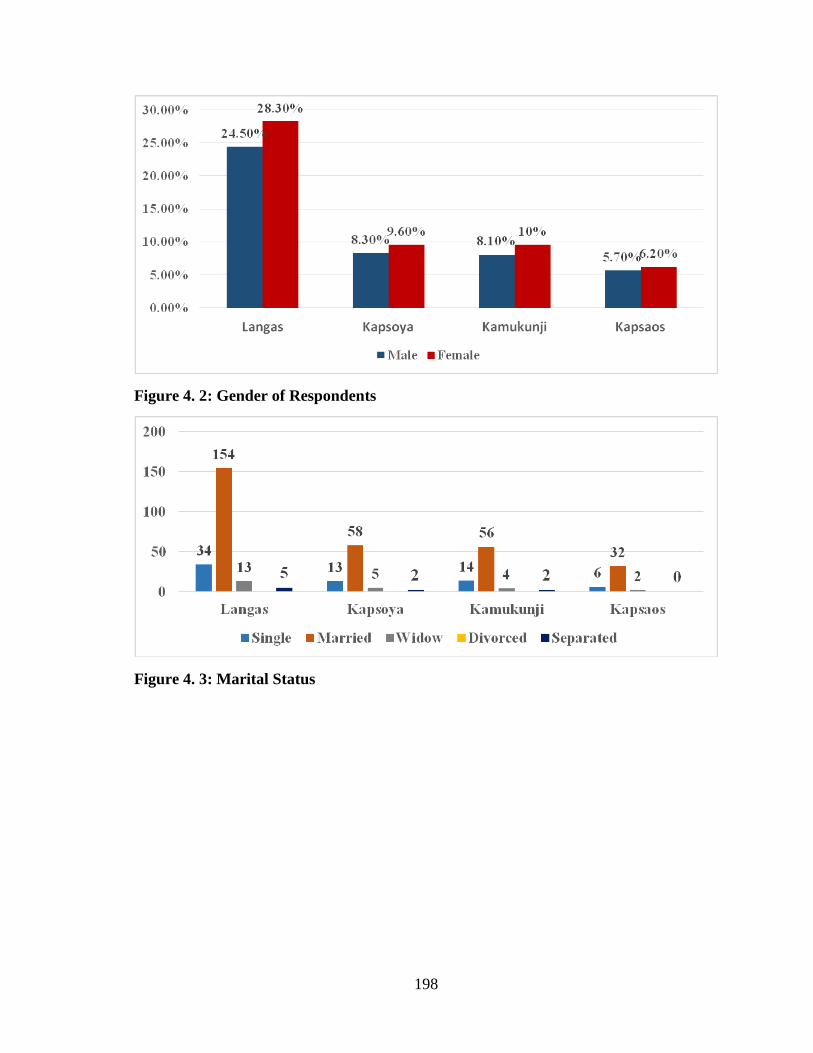
198
Figure 4. 2: Gender of Respondents
Figure 4. 3: Marital Status
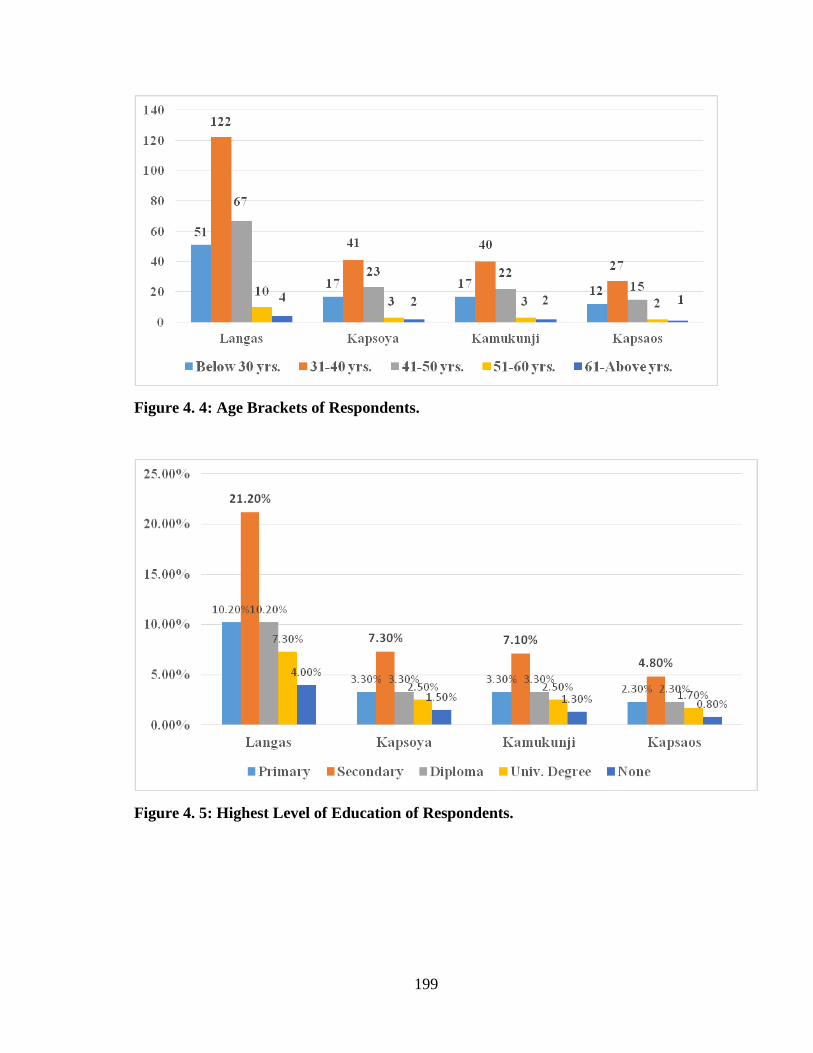
199
Figure 4. 4: Age Brackets of Respondents.
Figure 4. 5: Highest Level of Education of Respondents.

200
Figure 4. 6: Household Family Size (No. of Children).
Figure 4. 7: Head of the Household.
Figure 4. 8: Alternative Sources of Livelihood of Respondents.
201
4.4. Distribution of Respondents Demographic Characteristics in Study Area
The gender ratio was included in order to gain a perspective on disaster management of
urban resident members from males and females who participated in the study. The results
of gender profile of the sampled urban residents from the four study of-urban areas show in
Table 4.3 and Figures 4.3 indicate that males constitute 224 (46.4%) while females
accounted for 257 (53.6%). This is an indication that majority of respondents were
females. The results are an indication that female were the majority participants in this
study (See Appendix V). The dominance of female respondents is not typical of the socio-
cultural norms and practices in most Kenyan societies that have high male headed
households. These findings do not agree with the findings of Antwi, Boakye-Danquah,
Owusu, Loh, Mensah, Boafo, and Apronti, (2015) who found out that male dominance was
the majority in their study.
The results from the sampled urban residents showed a varied marital status. In all the sub-
urban sampled, urban resident respondents with married status were the highest. In
Kapsaos females accounted for 30 (6.2%) and males 27 (5.7%) indicating that majority
were females. In Langas females were 136 (28.3%) and males 118 (24.5%) implying that
majority of respondents were females, moreover, in Kamukunji, females who responded
accounted for 45 (10.0%) and males 39 (8.1%) while in Kapsoya, females were 46 (9.6%)
and males represented 40 (8.3%). In general, males accounted for 224 (46.4%) while
females were represented by 257 (53.6%)
Marriage status in Kenya is considered a social norm and most societies consider married
urban residents as safe and secure from socio-cultural hazards, although marriage also has
202
its own challenges. However, it is considered that female-headed urban residents, widows,
aged group and children were generally perceived to be more vulnerable to socioeconomic
hazards and highly exposed to socioeconomic disasters such as fire, poverty, food
insecurity, drought, flood, landslide, lack of stable income, housing damage, injury or
death and disrupted services as compared with their counterpart households with both
spouses and father as the head of the household.
This could be explained by the fact that urban residents with both spouses are better placed
financially and psychologically. It infers that those who are married could significantly
perceive higher levels of threat on loss of lives of wife, husband, and children than the
other disaster categories. They are therefore able to respond to any disaster risks in a better
mental and emotional state than their single counterparts (Yamano & Jayne, 2002).
However, this is not necessarily same as the results of this study, as shown by the losses
experienced by the majority of the urban residents although most of them had both spouses
available at the time of this study.
The results shown in Table 4.2 and Figure 4.2 indicate that, In Langas majority 122
(25.4%) indicated that they were in the age group 31-40 years. In Kapsoya majority 41
(8.5%) indicated that they were in the age group 31-40 years. 40 (8.3%) indicated that they
were in the age group 31-40 years in Kamukunji while 27 (5.6%) shows that they were in
their 31-40 years from Kapsaos. In General, 230 (47.8%) indicated that they were in the
age group 31-40 years. The results show that everyone was given a chance to participate in
the study and had the opportunity to voice their views.
203
This infers that the sampled urban resident respondents were in their prime middle age or
youthful age, between 31 -50 years. This is the trend in most Kenyan urban societies where
the population is fairly young as majority of respondents were between 31-50 years
accounting for 357 (74.2%). These demographic trends are largely a reflection of trends in
the study areas as reported during the National Population Census 2009.
Such a middle prime age has so much socioeconomic needs require proper planning for
disaster risk management targeting the youth. This age group is prone to hazards such as
drug abuse, crime, especially slum related, unemployment, school drop outs, unplanned
early marriages and sexually transmitted infections. If not checked, these hazards can lead
to disasters that may have impact on households.
In most urban residents, especially those who live in sprawling informal settlements, are
often the victims of drugs and alcohol abuse, criminal gang’ recruitment, high level of
poverty and living below poverty line, financial credits inaccessibility, HIV/AIDS, early
pregnancies, school dropouts, and poor transition rate from primary to secondary schools
and to University among other challenges. So they would prefer slums where infrastructure
is poorly planned and developed for hiding purposes. These findings concur with the
findings of Opiyo, Wasonga, and Nyangito, (2014) who found out that age bracket is a
critical issue when it comes to disaster risk management. Age bracket was also found to
influence urban residents’ decision making and problem solving. While long term and
sustainable sources of employment and income would be pursued by the older generation,
the younger generation would prefer short term and short cuts as means of income
204
generation, hence their concentration to slum areas where there is low level of industrial
sectors that can provide employment.
This result concurs with the findings of Philips (2011) who indicated that proper land use
planning provides connectivity, creativity, innovation, and as service hubs for the
surrounding areas since the youthful urban residents require long term and sustainable. In
another study with similar findings, Beringer (2000), found out that older people may
consider themselves less vulnerable due to their increased experience. Thus the older
generation would pursue decisions that would not expose them to hazard prone zones, yet
for the younger group, this is not an issue.
All the sampled urban resident respondents also had low level of formal education. In
Langas majority 102 (21.2%) who participated in the study are currently graduates with
secondary education consisting of form four or o-level certificate. In Kapsoya majority 35
(7.3%) indicated that their highest level of education by the time of survey was secondary
education. In Kamukunji while 34 (7.1%) shows that they had secondary level of education
certificate while 23 (4.8%) respondents from Kapsaos too indicted that their highest level
of education is secondary. In General, 194 (40.3%) indicated that they attained the
secondary level of education leaving the rest to be distributed among Primary, Diploma
and university degree levels. The results shown in Table 4.2 and Figure 4.2 are the
evidence of the number of urban resident participants in the study constituting secondary
level of education.
Education is said to equip people with knowledge and skills that are useful in
understanding the importance of disaster management. However, with only secondary
205
education, the urban residents who participated in this study may not own adequate
knowledge and skills to enable them take precautionary measures on disaster risk
management.Having low level of education leaves the urban residents with inability to
make well informed decision on disaster risk management, leaving the urban residents with
less strategic options to deal with disasters. This would expose them to hazards common in
unplanned areas, hence increasing chance of disaster risks levels. These results are in
agreement to the results by Saunders and Beban, (2012; 2015 and 2016). The results of
these studies indicated that education is useful for natural hazard risk reduction.
Likewise Ludwig et. al. (2011) and Stobbe (2011), in their study, found out that better
educated people normally live in wealthier neighborhoods since they are generally more
conscious of taking care of their health and general welfare including living standards
compared to households with low level of education. Thus sustainable household disaster
risk management, better education is essential.
The average urban residents size of the sampled urban resident respondents communities
fall between 1-4 children was the majority accounting for 219 (45.5%). This was followed
closely by 5-7 family size brackets that accounted for 201 (41.8%). This reflects the socio
cultural practice where large household size among the sampled households in Eldoret sub-
urban areas, and in Traditional Kenya is seen as a source of pride as well as an economic
asset. It infers that sampled urban resident respondents stable income, employment,
investments and financial credits to enhance sustainability of such family sizes.
It also required the ability to access and acquires quality and quantity housing and housing
mobility. Varieties and diversified sources of income, employment, and low cost financial
206
credit are critical in sustaining such household sizes. Such households also suffer from
inability to access, and acquire quality socioeconomic services. That could help control of
hazards such as school dropout, declining school transitioning rate, school fee payment,
illegal gang’s recruit, drug peddling affecting youth, youth unemployment and gambling
among others.
These findings concur with the findings of Kalaycıoğlu, Rittersberger-Tılıç, Çelik, and
Güneş, (2006) that age, gender, marital status, migration, household size, number of
dependent persons are some of the socio-demographic risks facing urban residents; level of
education and skills, employment status as self-employed or wage or salaried work,
seniority in work, size of workplace and investment if self-employed, degree and nature of
unemployment, levels of income, access to welfare benefits, social networks social
solidarity and reciprocal ties, family pools are some of socioeconomic risks faced; and the
Social security and Insurance and perceptions of risks, attitudes towards disasters
representing behavioral dimensions of risks.
The majority 409 (85.0%) average urban residents’ heads were fathers. This also conforms
to the socio-cultural trend of practice where most households are headed by fathers among
Kenyan societies. Yet the results from gender indicted that most respondents were females,
this could be true when the sampled respondents acted on behalf of the fathers whom
results showed were the minority respondents. Since women have extensive knowledge of
family, social roles of managing natural environmental resources and caring
responsibilities can increasingly play a critical role in disaster risk management. This
implies that households with women as the head would be the key to strengthening disaster
207
resilience, preparedness, protection and recovery of urban residents in low income
neighbourhoods. Moreover, in societies where the socioeconomic status of women is low,
disasters kill more women than men both directly and indirectly through related post-
disaster events.
Likewise, disasters kill women at a younger age than men, and that the impacts of disasters
are never merely determined by nature on its own. The reason for the difference in
mortality lies in the fact that women in general have lower socioeconomic status which, in
turn, leads to unequal access to opportunities and unequal exposure to risks, making them
more vulnerable to disasters. Further on, women’s reproductive roles can limit their
chances of survival those in their final stages of pregnancy and women with young kids are
less mobile. If basic health care infrastructure is severely damaged and access to obstetrical
care is limited, chances of miscarriage as well as maternal and infant mortality increase.
Women also have limited access to economic resources as well as information and
technology, increasing their vulnerability and adaptive capacity to disaster. Traditional
expectations and home-based responsibilities limit women’s mobility and opportunities for
political involvement, education, access to markets, and a myriad of other resources the
lack of which reinforces the cycle of vulnerability. These findings are in disagree with the
findings of Coulombel, (2010) and UNISDR, 2013 a, b and c) who found out that in many
regions, disaster risk is continuing to increase, mostly because greater numbers of
vulnerable people and assets are located in exposed areas, but lacking is the disaster risk
management gender mainstreaming. This has left women, children and the elderly to
continue being vulnerable and victims of disaster risk events.

208
An analysis of the alternative source of sampled urban resident respondents’ livelihood
reveals a marked difference between Langas and the other three urbanresidents sub-urban
areas. Whilst majority of respondents in the other three sampled urban residents did not
have any other source of livelihood aside casual labor and continuous tarmac king, 33% of
urban residents in Langas indicated that they have other sources of livelihood beyond
casual labor and continued tarmac king. Some of the livelihood options mentioned in
Langas includes small scale Trading, farming, fishing and engagement in construction
works.
4.5. Economic Vulnarability to Disaster Management in Low Income Neighourhoods
of E ldoret Urban Area.
This study pursued the three main dimensions of disaster risk management that are
mortality, socioeconomic losses and livelihood losses, assessed as disaster-induced
impoverishment. This study was designed and developed on the understanding that hazards
and disaster risks are not the same and that if a urban resident or mankind does not trigger
hazards to its eventual occurrence, then disaster risks and actual disaster would be
eliminated. Therefore, this study notes that there are no natural disasters but there are
natural hazards that if properly managed, would not lead to disasters. Apart from that
socioeconomic aspect of disasters management were found to have been ignored in
literature hence lacking solutions. Finally, it is high time countries need to move from
being dependent on foreign aid, relief supply, and emergencies. Therefore this study is
built on the framework that risk and disasters occurs as a result of interaction between man
and nature, hence are preventable.
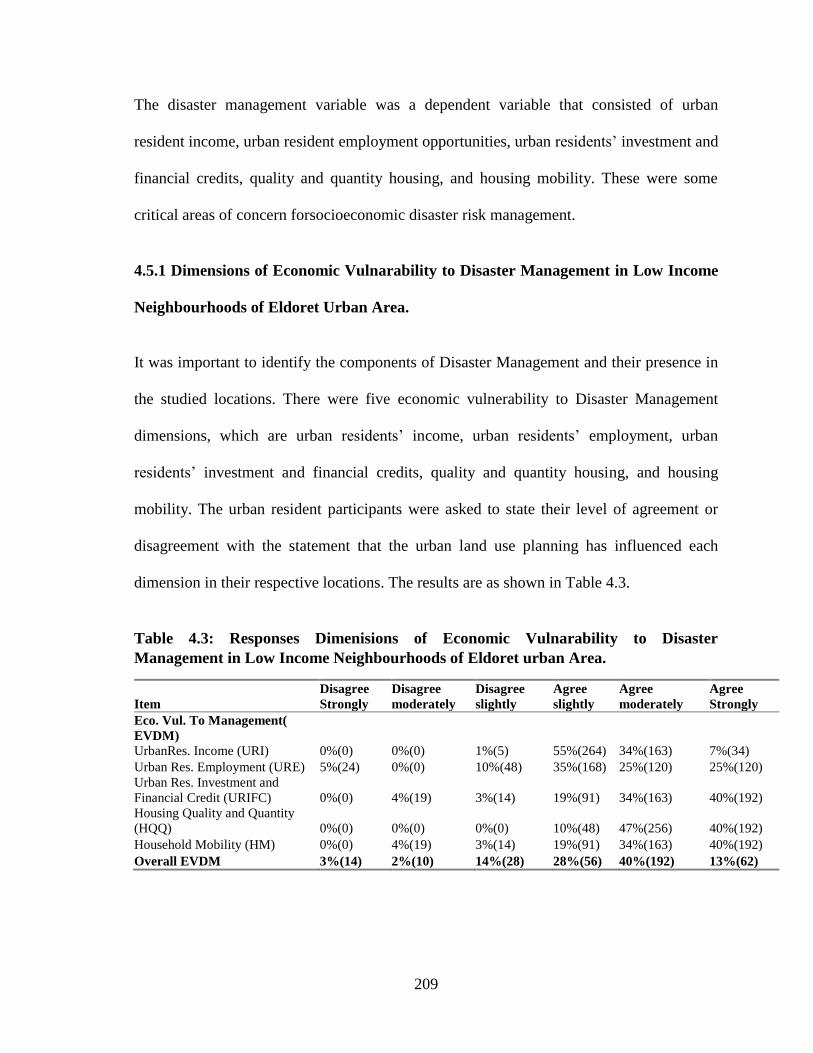
209
The disaster management variable was a dependent variable that consisted of urban
resident income, urban resident employment opportunities, urban residents’ investment and
financial credits, quality and quantity housing, and housing mobility. These were some
critical areas of concern forsocioeconomic disaster risk management.
4.5.1 Dimensions of Economic Vulnarability to Disaster Management in Low Income
Neighbourhoods of Eldoret Urban Area.
It was important to identify the components of Disaster Management and their presence in
the studied locations. There were five economic vulnerability to Disaster Management
dimensions, which are urban residents’ income, urban residents’ employment, urban
residents’ investment and financial credits, quality and quantity housing, and housing
mobility. The urban resident participants were asked to state their level of agreement or
disagreement with the statement that the urban land use planning has influenced each
dimension in their respective locations. The results are as shown in Table 4.3.
Table 4.3: Responses Dimenisions of Economic Vulnarability to Disaster
Management in Low Income Neighbourhoods of Eldoret urban Area.
Item
Disagree
Strongly
Disagree
moderately
Disagree
slightly
Agree
slightly
Agree
moderately
Agree
Strongly
Eco. Vul. To Management(
EVDM)
UrbanRes. Income (URI) 0%(0) 0%(0) 1%(5) 55%(264) 34%(163) 7%(34)
Urban Res. Employment (URE) 5%(24) 0%(0) 10%(48) 35%(168) 25%(120) 25%(120)
Urban Res. Investment and
Financial Credit (URIFC) 0%(0) 4%(19) 3%(14) 19%(91) 34%(163) 40%(192)
Housing Quality and Quantity
(HQQ) 0%(0) 0%(0) 0%(0) 10%(48) 47%(256) 40%(192)
Household Mobility (HM) 0%(0) 4%(19) 3%(14) 19%(91) 34%(163) 40%(192)
Overall EVDM 3%(14) 2%(10) 14%(28) 28%(56) 40%(192) 13%(62)
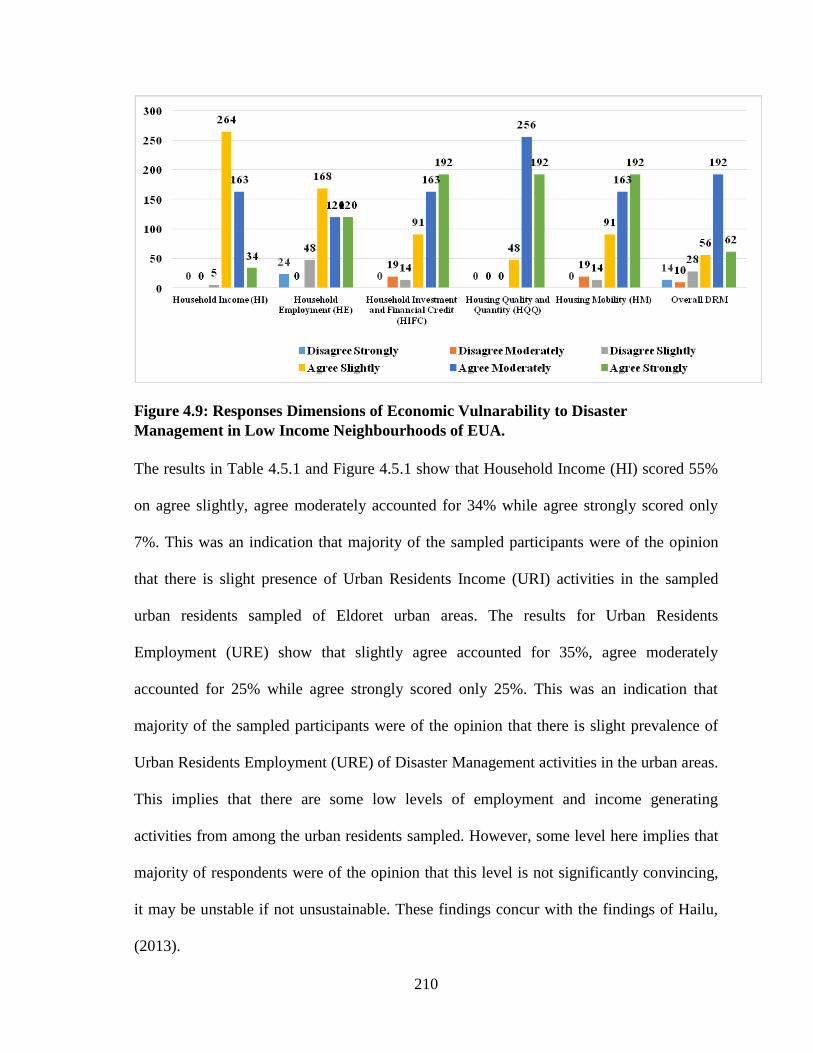
210
Figure 4.9: Responses Dimensions of Economic Vulnarability to Disaster
Management in Low Income Neighbourhoods of EUA.
The results in Table 4.5.1 and Figure 4.5.1 show that Household Income (HI) scored 55%
on agree slightly, agree moderately accounted for 34% while agree strongly scored only
7%. This was an indication that majority of the sampled participants were of the opinion
that there is slight presence of Urban Residents Income (URI) activities in the sampled
urban residents sampled of Eldoret urban areas. The results for Urban Residents
Employment (URE) show that slightly agree accounted for 35%, agree moderately
accounted for 25% while agree strongly scored only 25%. This was an indication that
majority of the sampled participants were of the opinion that there is slight prevalence of
Urban Residents Employment (URE) of Disaster Management activities in the urban areas.
This implies that there are some low levels of employment and income generating
activities from among the urban residents sampled. However, some level here implies that
majority of respondents were of the opinion that this level is not significantly convincing,
it may be unstable if not unsustainable. These findings concur with the findings of Hailu,
(2013).
211
The results for Urban Residents Investment and Financial Credit (URIFC) indicate that
that slightly agree accounted for 19%, agree moderately accounted for 34% while agree
strongly scored only 40%. This was an indication that majority of the sampled participants
were of the opinion that they agree very much that Disaster Management activities of
Urban Residents Investment and Financial Credit (URIFC) is highly prevalent in this.
Finally the results also indicate that Housing Quality and Quantity (HQQ) accounted for
10% on slightly agree, 47% on moderately agree and 40% on very much agree that there is
prevalence of Housing Quality and Quantity (HQQ) activities among the sampled urban
reidents.
This implies that the majority of the sampled participants were of the opinion that Housing
Quality and Quantity (HQQ) activities are moderately low and poorly practiced from
among the urban area urban resiidents sampled. This may be influenced by the desire to
have all better living standard and well-being as the alternatively pursued by urban
migrants globally. This infers that many of the urban residents from different study
locations have strong concern to their Housing Quality and Quantity (HQQ); these findings
are in agreement with the findings of Putman, S.H., 2010) who also found out that Housing
Quality and Quantity (HQQ) is an important element of Disaster Management and
therefore county governments with their disaster risk management tools should ensure that
urban areas are safe and secure for all inhabitants and disasters risk prevalence is
minimized or totally eliminated.
To further analyze the results in Table 4.5.1 and Figure 4.5.1 show that Urban Residents
Income (URI) is the strongest dimension of disaster management, it scored 45% (216), it
212
was followed by Housing Quality and Quantity (HQQ) that scored 44% (211), Urban
Residents Investment and Financial Credit (URIFC) scored 37% (178) while Urban
residents Employment (URE) scored 30% (144), when all the highest frequencies are
added together and divided by two, multifactor analysis of Likert scale scores. This infers
that sampled participants agreed that Urban Residents Income (URI) and Housing Quality
and Quantity (HQQ) are critical to their urban areas under study disaster risk management
intensities. These findings agrees with the results of Coulombel, (2010) who also found out
that Urban Residents Income (URI) is needed for households to steer socioeconomic
development activities and be active in environmental management and regenerate new
opportunities for Urban Residents Income (UEI) and employment activities leading to
sustainability.
4.5.2 The Mean Scores on Dimensions of Economic Vulnarability to Disaster
Management in Low Income Neighbourhoods of Eldoret Urban Area.
There are three indicators used to measure Disaster Management in terms of Urban
Residents Income and Employment (URIE), Urban Residents Investment and Financial
Credit (URIFC) and Housing Quality and Quantity (HQQ) that determines the sampled
urban residents strong desire to minimize their disaster risk vulnerability to improve on
disaster risk management. The higher the mean and low standard deviation indicates a
moderately high and stable disaster management level in the sampled urban residents
respondents while the small mean and large standard deviation implies low level of
disaster management activities in the sampled listed Eldoret urban areas. The results are as
shown in Table 4.5.
213
Table 4.4: Overall Mean Scores on Indicators of Economic Vulnarability to Disaster
Management in Low Income Neighbourhoods.
N Mean Std. Dev
EVDM Dimensions 481 5.3946 .70385
Urban Residen Income (URI) 481 3.9696 .23201
Urban Res Employment (UE) 481 3.6123 .32159
Urban Re Investment and Financial Credit (URIFC) 481 3.8976 .25482
Housing Quality and Quantity (HQQ) 481 3.5678 .25154
Housing Mobility (HM) 481 3.6996 .62182
Results in Table 4.5.2 show the descriptive statistics of the indicators of economic
vulnerability to disaster management level as determined by the five components of
dependent variable. The mean scores for each indicator ranged from 2.0123 (SD = .23201)
to 5.3946 (SD = .70385). Urban Residents Income (URI) of the urban areas had the highest
mean and least deviation, followed by Housing Quality and Quantity (HQQ) of the urban
residents, next was urban residents Investment and Financial Credit (URIFC) activities of
the urban residents with a mean of 3.8976 and standard deviation of .25482, likewise
Urban Residents Employment (URE) of the urban residents had a mean of 3.6123 and a
standard deviation of .32159 and lastly was Housing Mobility with a mean of 3.6996 and
standard deviation of .62182. Overall, the item mean for disaster management was 5.3946
(SD = .70385), which was slightly above average. This implies that there is high low level
of concentration on Urban Residents Income (URI) and Housing Quality and Quantity
(HQQ) activities in the sampled urban residents’ respondents as reported by the
participants. Moreover, this is an indication that urban residents are highly vulnerable as
they are exposed to high risks since all the dimensions of dependent variables point at
unstable level of each dimension. These results disagree with the findings of a study that
concur with that of Twigg, (2015) who found out that the overall mean (2.461) of all items
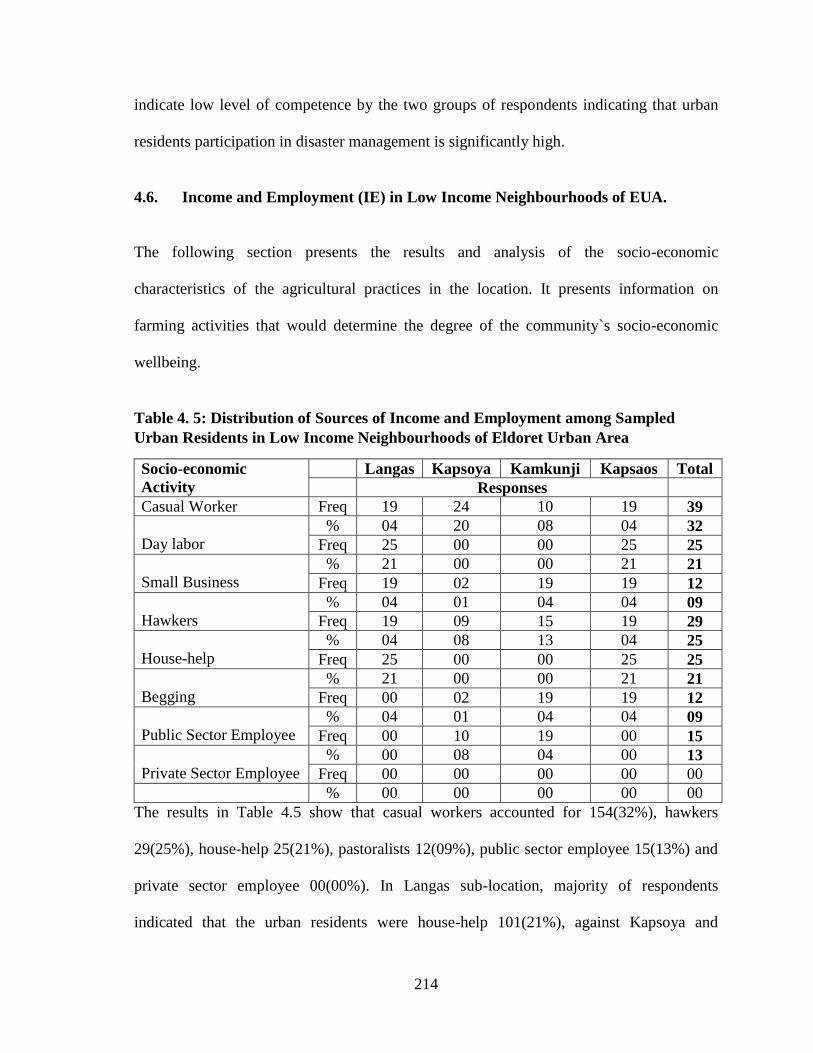
214
indicate low level of competence by the two groups of respondents indicating that urban
residents participation in disaster management is significantly high.
4.6. Income and Employment (IE) in Low Income Neighbourhoods of EUA.
The following section presents the results and analysis of the socio-economic
characteristics of the agricultural practices in the location. It presents information on
farming activities that would determine the degree of the community`s socio-economic
wellbeing.
Table 4. 5: Distribution of Sources of Income and Employment among Sampled
Urban Residents in Low Income Neighbourhoods of Eldoret Urban Area
The results in Table 4.5 show that casual workers accounted for 154(32%), hawkers
29(25%), house-help 25(21%), pastoralists 12(09%), public sector employee 15(13%) and
private sector employee 00(00%). In Langas sub-location, majority of respondents
indicated that the urban residents were house-help 101(21%), against Kapsoya and
Socio-economic
Activity
Langas Kapsoya Kamkunji Kapsaos Total
Responses
Casual Worker Freq 19 24 10 19 39
Day labor
% 04 20 08 04 32
Freq 25 00 00 25 25
Small Business
% 21 00 00 21 21
Freq 19 02 19 19 12
Hawkers
% 04 01 04 04 09
Freq 19 09 15 19 29
House-help
% 04 08 13 04 25
Freq 25 00 00 25 25
Begging
% 21 00 00 21 21
Freq 00 02 19 19 12
Public Sector Employee
% 04 01 04 04 09
Freq 00 10 19 00 15
Private Sector Employee
% 00 08 04 00 13
Freq 00 00 00 00 00
% 00 00 00 00 00
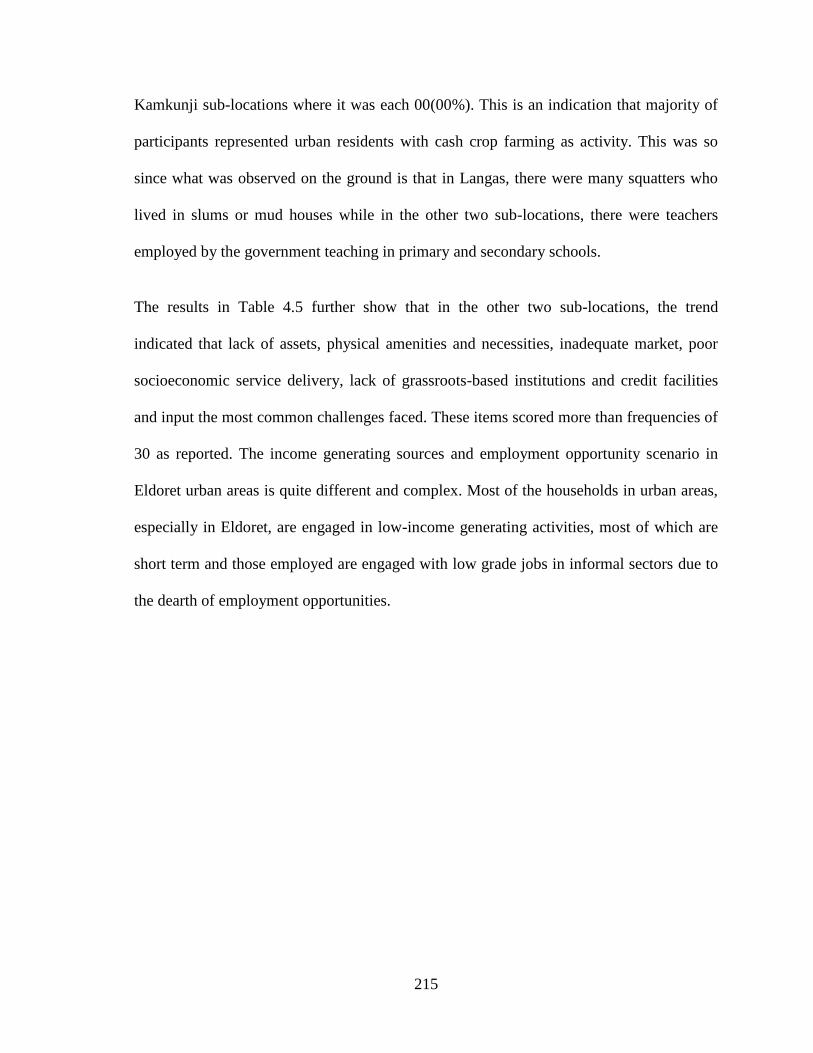
215
Kamkunji sub-locations where it was each 00(00%). This is an indication that majority of
participants represented urban residents with cash crop farming as activity. This was so
since what was observed on the ground is that in Langas, there were many squatters who
lived in slums or mud houses while in the other two sub-locations, there were teachers
employed by the government teaching in primary and secondary schools.
The results in Table 4.5 further show that in the other two sub-locations, the trend
indicated that lack of assets, physical amenities and necessities, inadequate market, poor
socioeconomic service delivery, lack of grassroots-based institutions and credit facilities
and input the most common challenges faced. These items scored more than frequencies of
30 as reported. The income generating sources and employment opportunity scenario in
Eldoret urban areas is quite different and complex. Most of the households in urban areas,
especially in Eldoret, are engaged in low-income generating activities, most of which are
short term and those employed are engaged with low grade jobs in informal sectors due to
the dearth of employment opportunities.
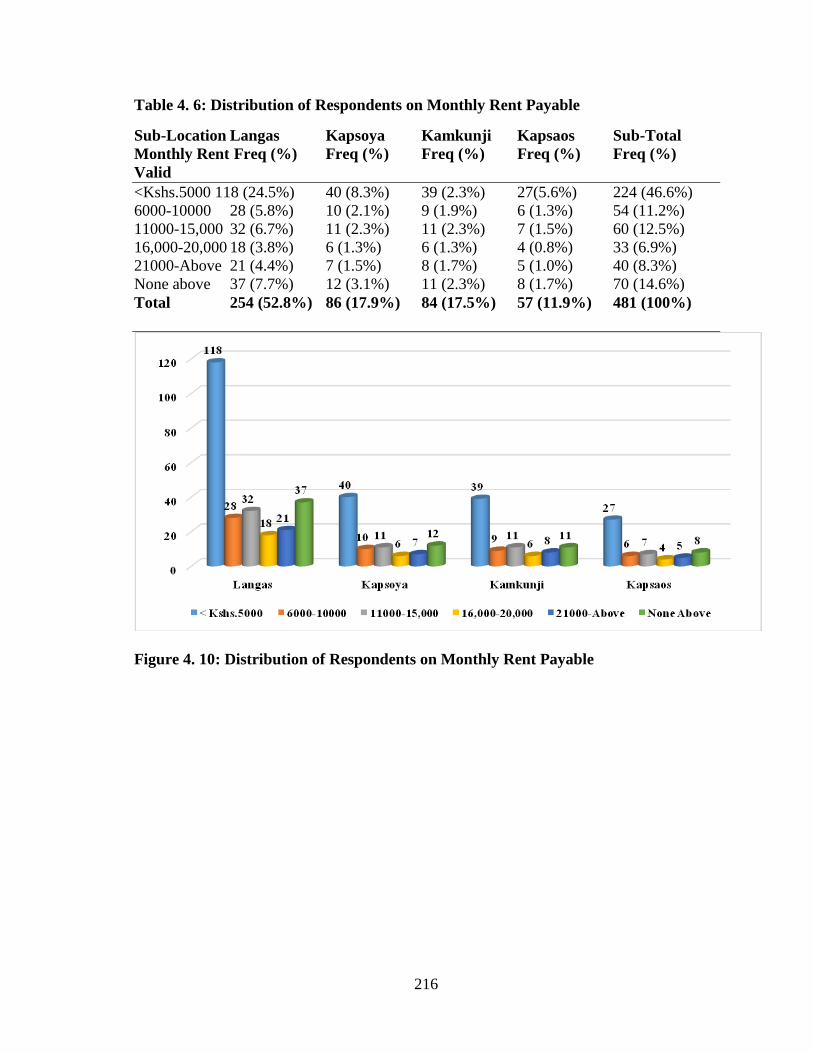
216
Table 4. 6: Distribution of Respondents on Monthly Rent Payable
Sub-Location Langas Kapsoya Kamkunji Kapsaos Sub-Total
Monthly Rent Freq (%) Freq (%) Freq (%) Freq (%) Freq (%)
Valid
<Kshs.5000 118 (24.5%) 40 (8.3%) 39 (2.3%) 27(5.6%) 224 (46.6%)
6000-10000 28 (5.8%) 10 (2.1%) 9 (1.9%) 6 (1.3%) 54 (11.2%)
11000-15,000 32 (6.7%) 11 (2.3%) 11 (2.3%) 7 (1.5%) 60 (12.5%)
16,000-20,000 18 (3.8%) 6 (1.3%) 6 (1.3%) 4 (0.8%) 33 (6.9%)
21000-Above 21 (4.4%) 7 (1.5%) 8 (1.7%) 5 (1.0%) 40 (8.3%)
None above 37 (7.7%) 12 (3.1%) 11 (2.3%) 8 (1.7%) 70 (14.6%)
Total 254 (52.8%) 86 (17.9%) 84 (17.5%) 57 (11.9%) 481 (100%)
Figure 4. 10: Distribution of Respondents on Monthly Rent Payable
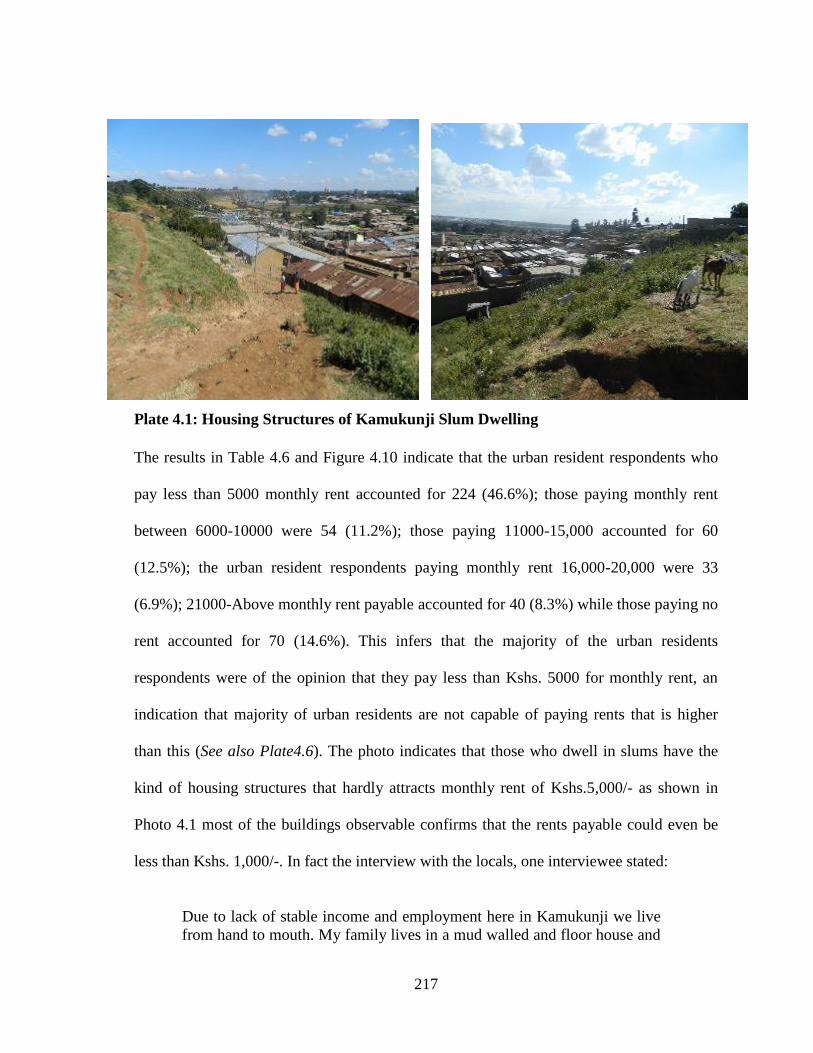
217
Plate 4.1: Housing Structures of Kamukunji Slum Dwelling
The results in Table 4.6 and Figure 4.10 indicate that the urban resident respondents who
pay less than 5000 monthly rent accounted for 224 (46.6%); those paying monthly rent
between 6000-10000 were 54 (11.2%); those paying 11000-15,000 accounted for 60
(12.5%); the urban resident respondents paying monthly rent 16,000-20,000 were 33
(6.9%); 21000-Above monthly rent payable accounted for 40 (8.3%) while those paying no
rent accounted for 70 (14.6%). This infers that the majority of the urban residents
respondents were of the opinion that they pay less than Kshs. 5000 for monthly rent, an
indication that majority of urban residents are not capable of paying rents that is higher
than this (See also Plate4.6). The photo indicates that those who dwell in slums have the
kind of housing structures that hardly attracts monthly rent of Kshs.5,000/- as shown in
Photo 4.1 most of the buildings observable confirms that the rents payable could even be
less than Kshs. 1,000/-. In fact the interview with the locals, one interviewee stated:
Due to lack of stable income and employment here in Kamukunji we live
from hand to mouth. My family lives in a mud walled and floor house and
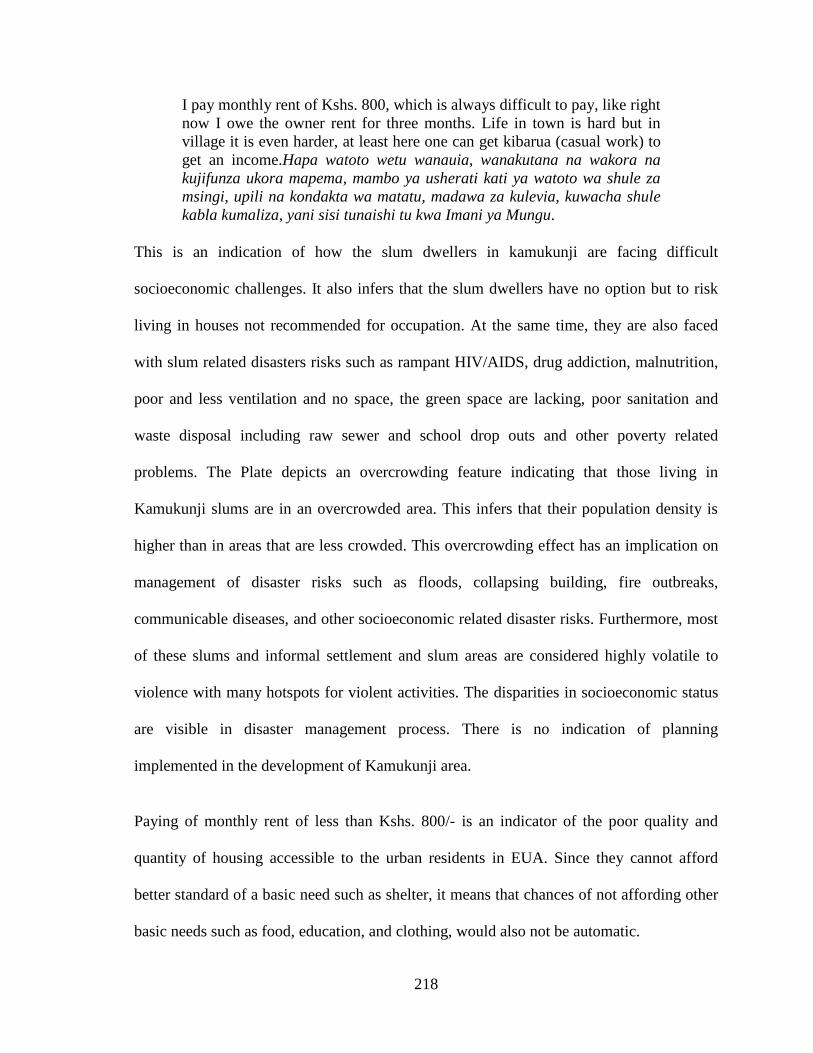
218
I pay monthly rent of Kshs. 800, which is always difficult to pay, like right
now I owe the owner rent for three months. Life in town is hard but in
village it is even harder, at least here one can get kibarua (casual work) to
get an income.Hapa watoto wetu wanauia, wanakutana na wakora na
kujifunza ukora mapema, mambo ya usherati kati ya watoto wa shule za
msingi, upili na kondakta wa matatu, madawa za kulevia, kuwacha shule
kabla kumaliza, yani sisi tunaishi tu kwa Imani ya Mungu.
This is an indication of how the slum dwellers in kamukunji are facing difficult
socioeconomic challenges. It also infers that the slum dwellers have no option but to risk
living in houses not recommended for occupation. At the same time, they are also faced
with slum related disasters risks such as rampant HIV/AIDS, drug addiction, malnutrition,
poor and less ventilation and no space, the green space are lacking, poor sanitation and
waste disposal including raw sewer and school drop outs and other poverty related
problems. The Plate depicts an overcrowding feature indicating that those living in
Kamukunji slums are in an overcrowded area. This infers that their population density is
higher than in areas that are less crowded. This overcrowding effect has an implication on
management of disaster risks such as floods, collapsing building, fire outbreaks,
communicable diseases, and other socioeconomic related disaster risks. Furthermore, most
of these slums and informal settlement and slum areas are considered highly volatile to
violence with many hotspots for violent activities. The disparities in socioeconomic status
are visible in disaster management process. There is no indication of planning
implemented in the development of Kamukunji area.
Paying of monthly rent of less than Kshs. 800/- is an indicator of the poor quality and
quantity of housing accessible to the urban residents in EUA. Since they cannot afford
better standard of a basic need such as shelter, it means that chances of not affording other
basic needs such as food, education, and clothing, would also not be automatic.
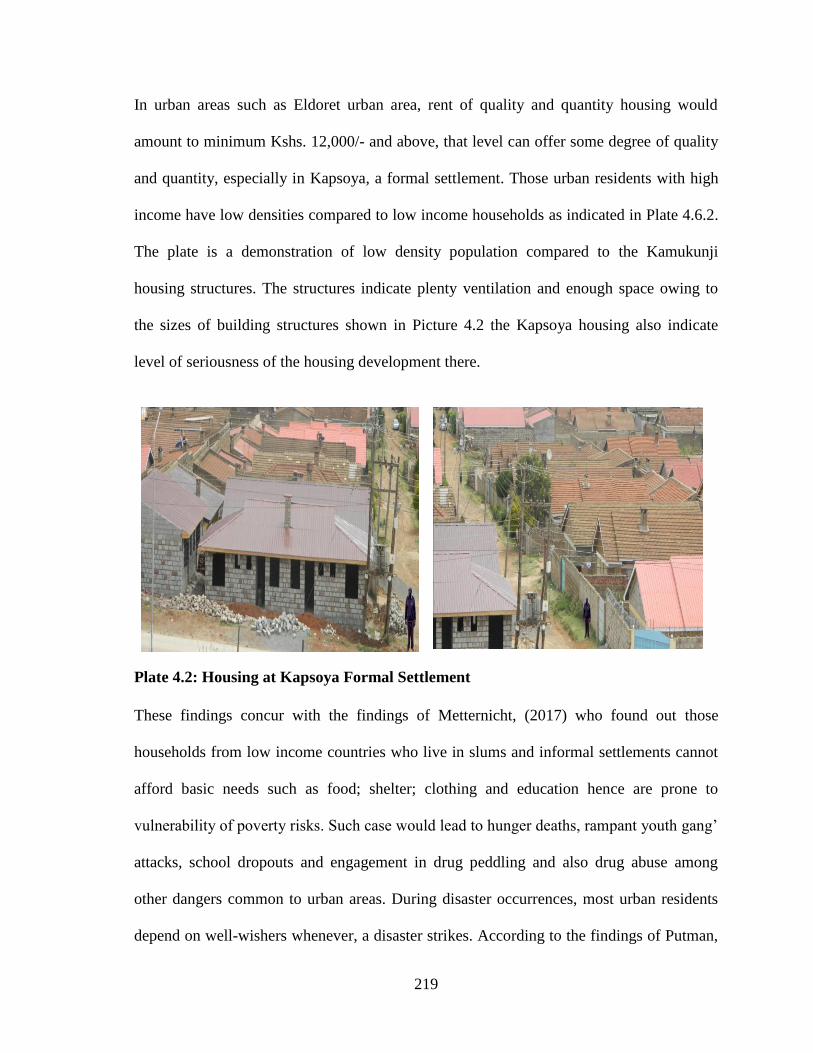
219
In urban areas such as Eldoret urban area, rent of quality and quantity housing would
amount to minimum Kshs. 12,000/- and above, that level can offer some degree of quality
and quantity, especially in Kapsoya, a formal settlement. Those urban residents with high
income have low densities compared to low income households as indicated in Plate 4.6.2.
The plate is a demonstration of low density population compared to the Kamukunji
housing structures. The structures indicate plenty ventilation and enough space owing to
the sizes of building structures shown in Picture 4.2 the Kapsoya housing also indicate
level of seriousness of the housing development there.
Plate 4.2: Housing at Kapsoya Formal Settlement
These findings concur with the findings of Metternicht, (2017) who found out those
households from low income countries who live in slums and informal settlements cannot
afford basic needs such as food; shelter; clothing and education hence are prone to
vulnerability of poverty risks. Such case would lead to hunger deaths, rampant youth gang’
attacks, school dropouts and engagement in drug peddling and also drug abuse among
other dangers common to urban areas. During disaster occurrences, most urban residents
depend on well-wishers whenever, a disaster strikes. According to the findings of Putman,
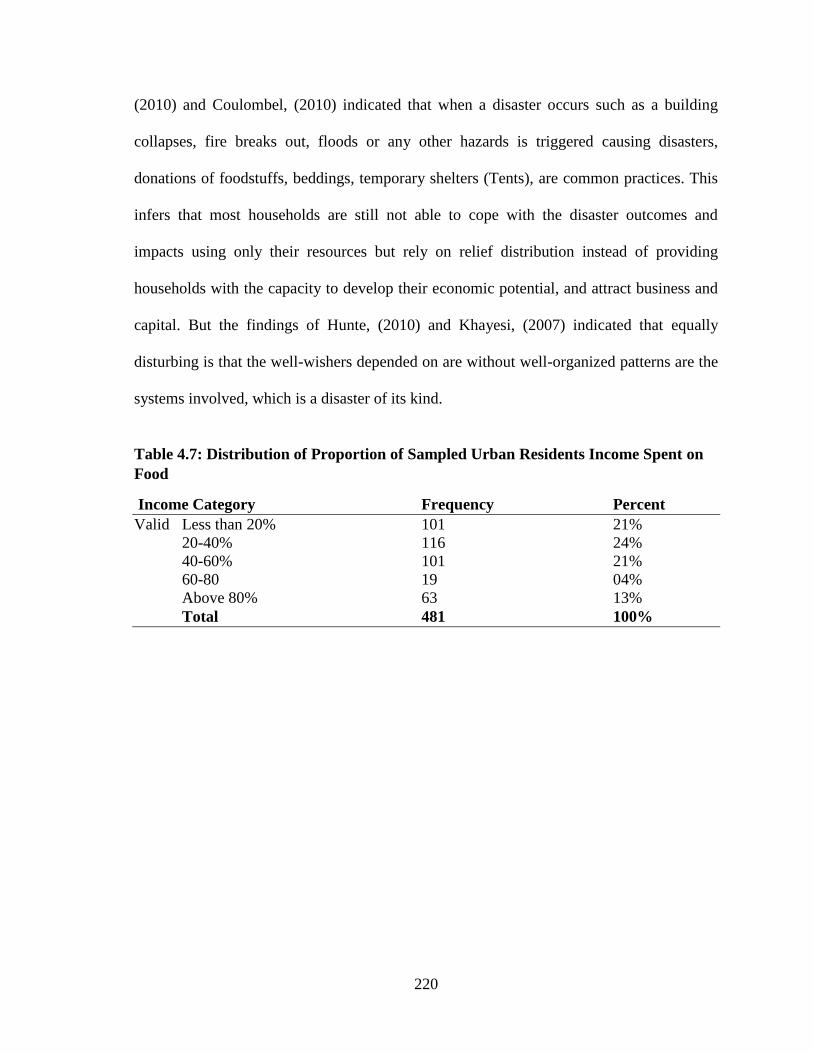
220
(2010) and Coulombel, (2010) indicated that when a disaster occurs such as a building
collapses, fire breaks out, floods or any other hazards is triggered causing disasters,
donations of foodstuffs, beddings, temporary shelters (Tents), are common practices. This
infers that most households are still not able to cope with the disaster outcomes and
impacts using only their resources but rely on relief distribution instead of providing
households with the capacity to develop their economic potential, and attract business and
capital. But the findings of Hunte, (2010) and Khayesi, (2007) indicated that equally
disturbing is that the well-wishers depended on are without well-organized patterns are the
systems involved, which is a disaster of its kind.
Table 4.7: Distribution of Proportion of Sampled Urban Residents Income Spent on
Food
Income Category Frequency Percent
Valid Less than 20% 101 21%
20-40% 116 24%
40-60% 101 21%
60-80 19 04%
Above 80% 63 13%
Total 481 100%
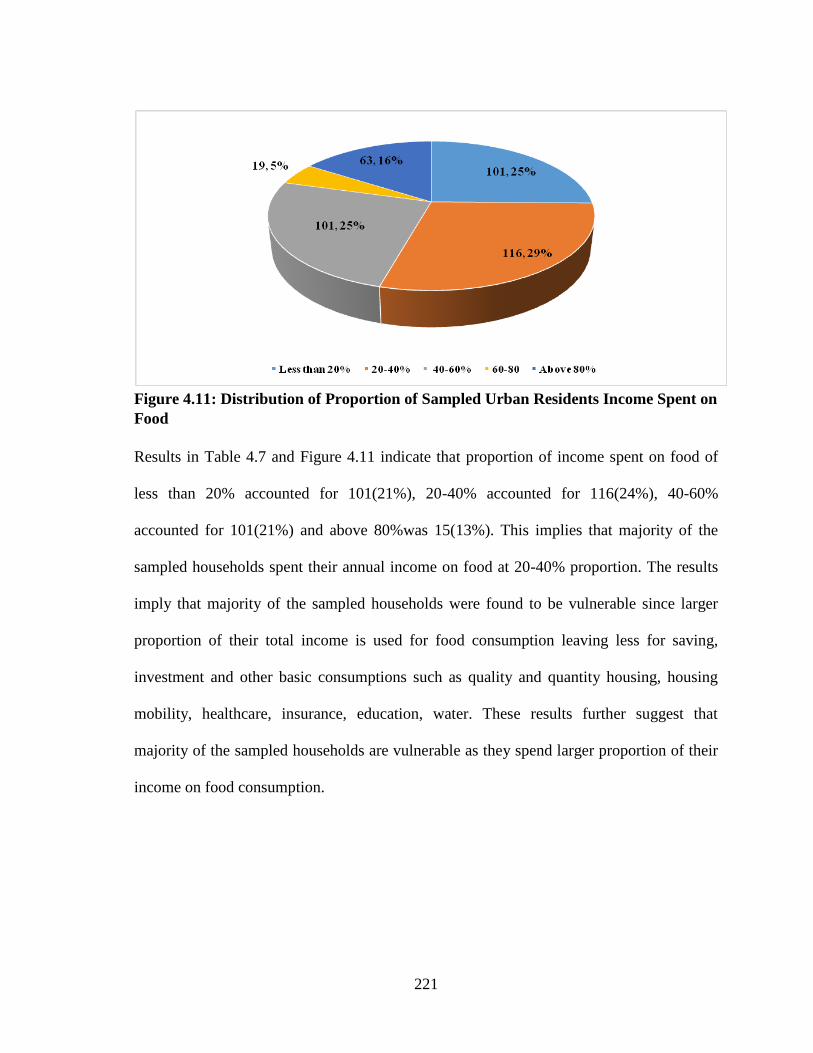
221
Figure 4.11: Distribution of Proportion of Sampled Urban Residents Income Spent on
Food
Results in Table 4.7 and Figure 4.11 indicate that proportion of income spent on food of
less than 20% accounted for 101(21%), 20-40% accounted for 116(24%), 40-60%
accounted for 101(21%) and above 80%was 15(13%). This implies that majority of the
sampled households spent their annual income on food at 20-40% proportion. The results
imply that majority of the sampled households were found to be vulnerable since larger
proportion of their total income is used for food consumption leaving less for saving,
investment and other basic consumptions such as quality and quantity housing, housing
mobility, healthcare, insurance, education, water. These results further suggest that
majority of the sampled households are vulnerable as they spend larger proportion of their
income on food consumption.
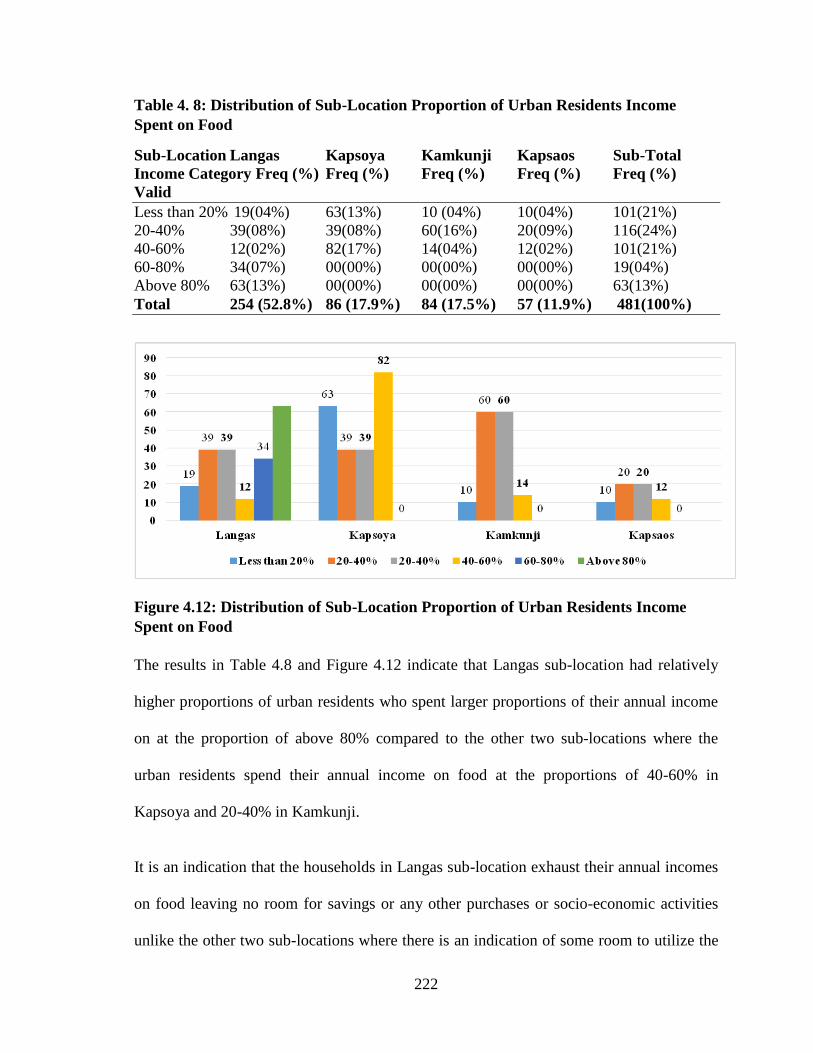
222
Table 4. 8: Distribution of Sub-Location Proportion of Urban Residents Income
Spent on Food
Sub-Location Langas Kapsoya Kamkunji Kapsaos Sub-Total
Income Category Freq (%) Freq (%) Freq (%) Freq (%) Freq (%)
Valid
Less than 20% 19(04%) 63(13%) 10 (04%) 10(04%) 101(21%)
20-40% 39(08%) 39(08%) 60(16%) 20(09%) 116(24%)
40-60% 12(02%) 82(17%) 14(04%) 12(02%) 101(21%)
60-80% 34(07%) 00(00%) 00(00%) 00(00%) 19(04%)
Above 80% 63(13%) 00(00%) 00(00%) 00(00%) 63(13%)
Total 254 (52.8%) 86 (17.9%) 84 (17.5%) 57 (11.9%) 481(100%)
Figure 4.12: Distribution of Sub-Location Proportion of Urban Residents Income
Spent on Food
The results in Table 4.8 and Figure 4.12 indicate that Langas sub-location had relatively
higher proportions of urban residents who spent larger proportions of their annual income
on at the proportion of above 80% compared to the other two sub-locations where the
urban residents spend their annual income on food at the proportions of 40-60% in
Kapsoya and 20-40% in Kamkunji.
It is an indication that the households in Langas sub-location exhaust their annual incomes
on food leaving no room for savings or any other purchases or socio-economic activities
unlike the other two sub-locations where there is an indication of some room to utilize the
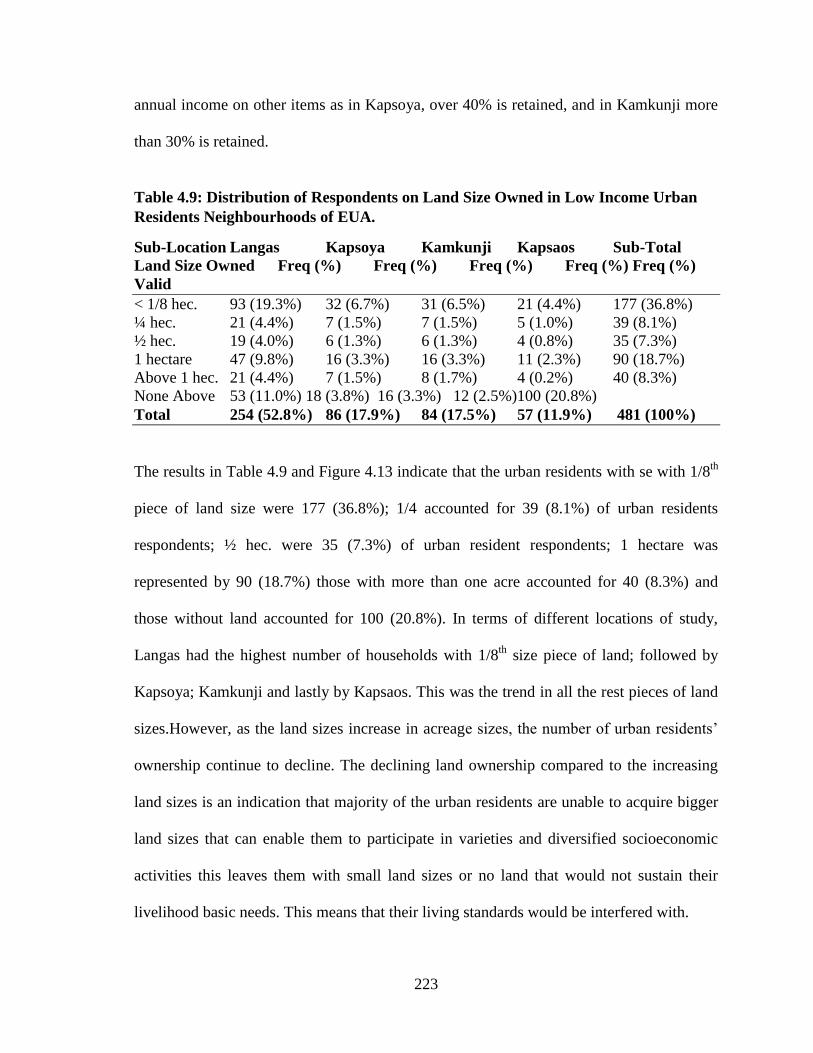
223
annual income on other items as in Kapsoya, over 40% is retained, and in Kamkunji more
than 30% is retained.
Table 4.9: Distribution of Respondents on Land Size Owned in Low Income Urban
Residents Neighbourhoods of EUA.
Sub-Location Langas Kapsoya Kamkunji Kapsaos Sub-Total
Land Size Owned Freq (%) Freq (%) Freq (%) Freq (%) Freq (%)
Valid
< 1/8 hec. 93 (19.3%) 32 (6.7%) 31 (6.5%) 21 (4.4%) 177 (36.8%)
¼ hec. 21 (4.4%) 7 (1.5%) 7 (1.5%) 5 (1.0%) 39 (8.1%)
½ hec. 19 (4.0%) 6 (1.3%) 6 (1.3%) 4 (0.8%) 35 (7.3%)
1 hectare 47 (9.8%) 16 (3.3%) 16 (3.3%) 11 (2.3%) 90 (18.7%)
Above 1 hec. 21 (4.4%) 7 (1.5%) 8 (1.7%) 4 (0.2%) 40 (8.3%)
None Above 53 (11.0%) 18 (3.8%) 16 (3.3%) 12 (2.5%)100 (20.8%)
Total 254 (52.8%) 86 (17.9%) 84 (17.5%) 57 (11.9%) 481 (100%)
The results in Table 4.9 and Figure 4.13 indicate that the urban residents with se with 1/8th
piece of land size were 177 (36.8%); 1/4 accounted for 39 (8.1%) of urban residents
respondents; ½ hec. were 35 (7.3%) of urban resident respondents; 1 hectare was
represented by 90 (18.7%) those with more than one acre accounted for 40 (8.3%) and
those without land accounted for 100 (20.8%). In terms of different locations of study,
Langas had the highest number of households with 1/8th
size piece of land; followed by
Kapsoya; Kamkunji and lastly by Kapsaos. This was the trend in all the rest pieces of land
sizes.However, as the land sizes increase in acreage sizes, the number of urban residents’
ownership continue to decline. The declining land ownership compared to the increasing
land sizes is an indication that majority of the urban residents are unable to acquire bigger
land sizes that can enable them to participate in varieties and diversified socioeconomic
activities this leaves them with small land sizes or no land that would not sustain their
livelihood basic needs. This means that their living standards would be interfered with.
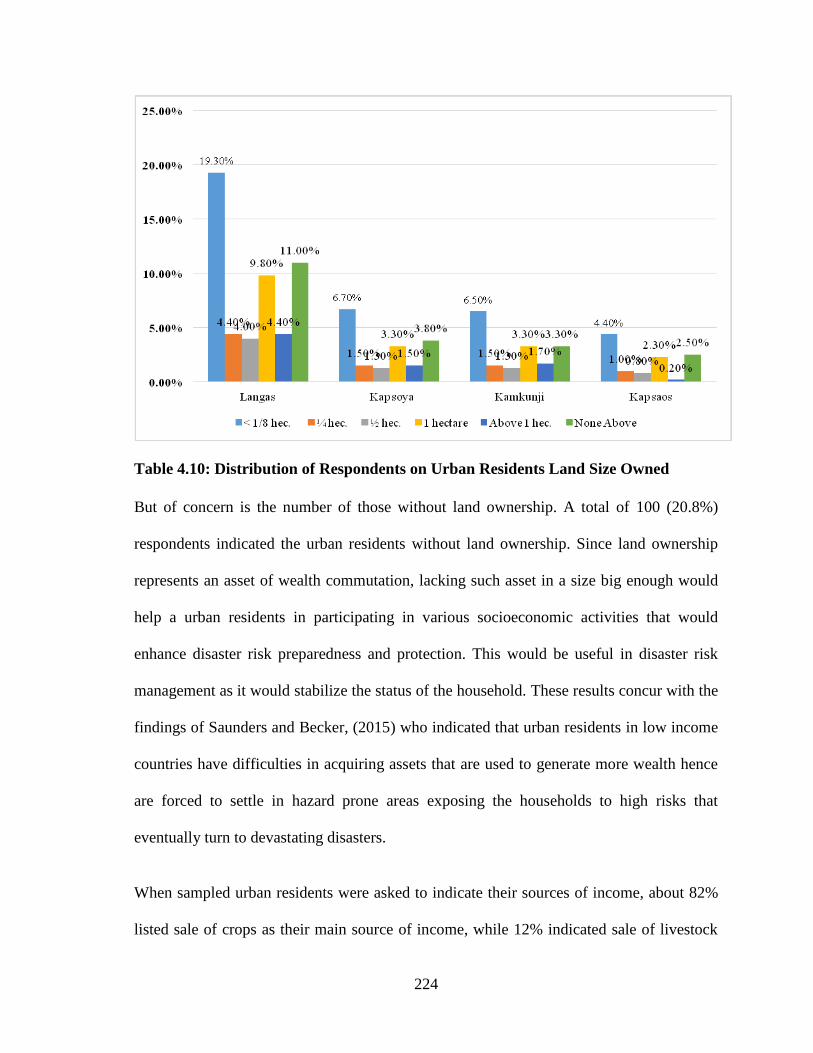
224
Table 4.10: Distribution of Respondents on Urban Residents Land Size Owned
But of concern is the number of those without land ownership. A total of 100 (20.8%)
respondents indicated the urban residents without land ownership. Since land ownership
represents an asset of wealth commutation, lacking such asset in a size big enough would
help a urban residents in participating in various socioeconomic activities that would
enhance disaster risk preparedness and protection. This would be useful in disaster risk
management as it would stabilize the status of the household. These results concur with the
findings of Saunders and Becker, (2015) who indicated that urban residents in low income
countries have difficulties in acquiring assets that are used to generate more wealth hence
are forced to settle in hazard prone areas exposing the households to high risks that
eventually turn to devastating disasters.
When sampled urban residents were asked to indicate their sources of income, about 82%
listed sale of crops as their main source of income, while 12% indicated sale of livestock
225
and livestock products as main source of income. Sale of fish products was mentioned by
21% and about 17% of urban residents indicated to resort to the sale of fuel wood (charcoal
and fire wood) for their income. Significant proportion (31%) indicated to be providing
casual labour to earn income and only 11% indicated to have permanent employment on
which they derive their income. Other sources of income mentioned are handcrafting and
petty trading of which 27% and 28% of sampled urban residents indicated to be their main
sources of income, respectively. About 36% of urban residents indicated to depend on
remittances for their income and only 2% listed bee keeping as their main source of
income.
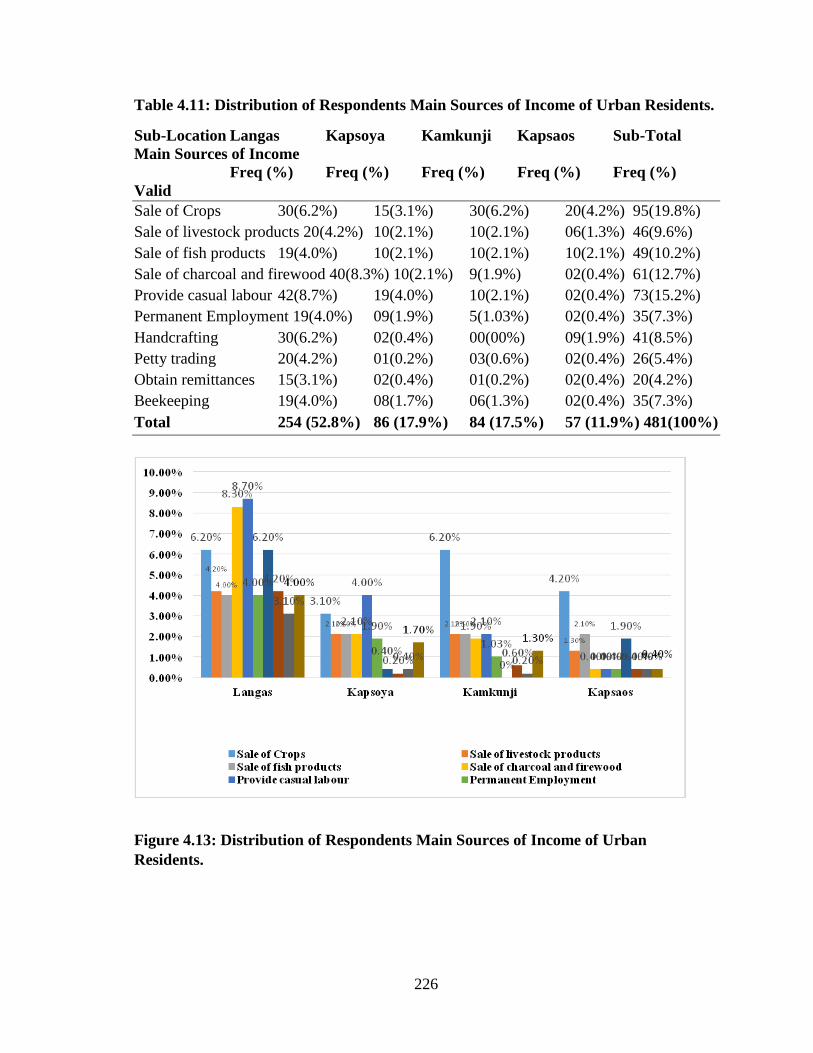
226
Table 4.11: Distribution of Respondents Main Sources of Income of Urban Residents.
Sub-Location Langas Kapsoya Kamkunji Kapsaos Sub-Total
Main Sources of Income
Freq (%) Freq (%) Freq (%) Freq (%) Freq (%)
Valid
Sale of Crops 30(6.2%) 15(3.1%) 30(6.2%) 20(4.2%) 95(19.8%)
Sale of livestock products 20(4.2%) 10(2.1%) 10(2.1%) 06(1.3%) 46(9.6%)
Sale of fish products 19(4.0%) 10(2.1%) 10(2.1%) 10(2.1%) 49(10.2%)
Sale of charcoal and firewood 40(8.3%) 10(2.1%) 9(1.9%) 02(0.4%) 61(12.7%)
Provide casual labour 42(8.7%) 19(4.0%) 10(2.1%) 02(0.4%) 73(15.2%)
Permanent Employment 19(4.0%) 09(1.9%) 5(1.03%) 02(0.4%) 35(7.3%)
Handcrafting 30(6.2%) 02(0.4%) 00(00%) 09(1.9%) 41(8.5%)
Petty trading 20(4.2%) 01(0.2%) 03(0.6%) 02(0.4%) 26(5.4%)
Obtain remittances 15(3.1%) 02(0.4%) 01(0.2%) 02(0.4%) 20(4.2%)
Beekeeping 19(4.0%) 08(1.7%) 06(1.3%) 02(0.4%) 35(7.3%)
Total 254 (52.8%) 86 (17.9%) 84 (17.5%) 57 (11.9%) 481(100%)
Figure 4.13: Distribution of Respondents Main Sources of Income of Urban
Residents.
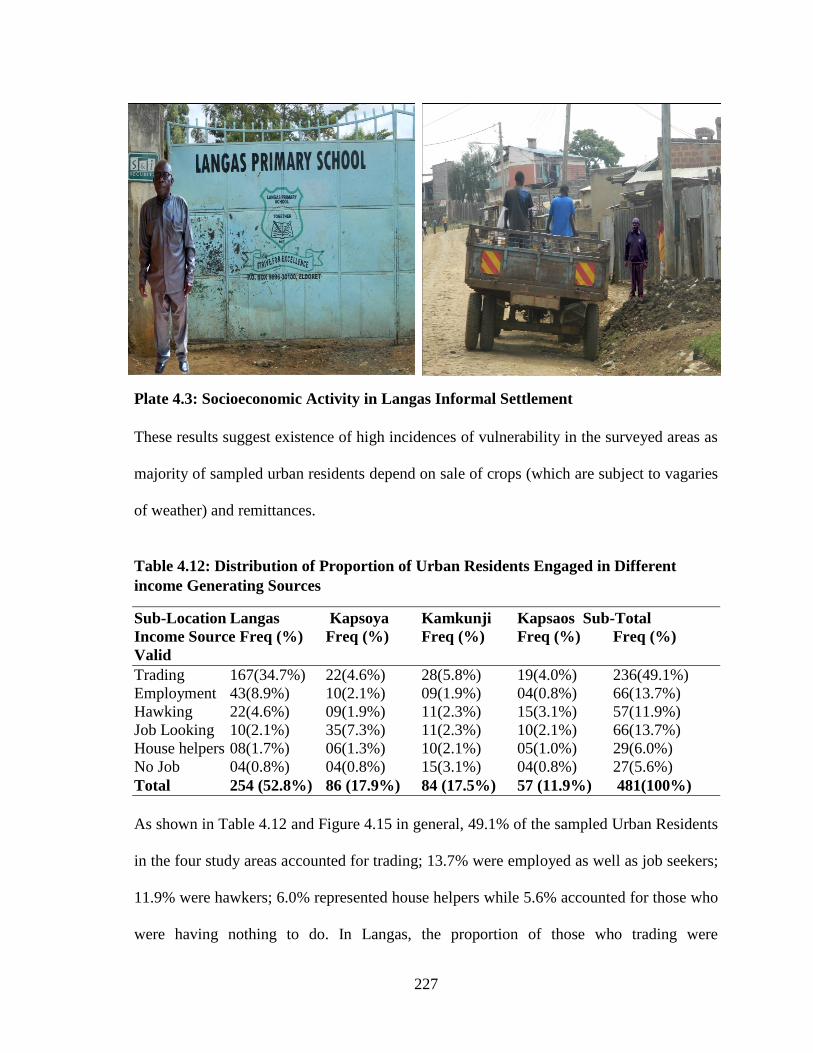
227
Plate 4.3: Socioeconomic Activity in Langas Informal Settlement
These results suggest existence of high incidences of vulnerability in the surveyed areas as
majority of sampled urban residents depend on sale of crops (which are subject to vagaries
of weather) and remittances.
Table 4.12: Distribution of Proportion of Urban Residents Engaged in Different
income Generating Sources
Sub-Location Langas Kapsoya Kamkunji Kapsaos Sub-Total
Income Source Freq (%) Freq (%) Freq (%) Freq (%) Freq (%)
Valid
Trading 167(34.7%) 22(4.6%) 28(5.8%) 19(4.0%) 236(49.1%)
Employment 43(8.9%) 10(2.1%) 09(1.9%) 04(0.8%) 66(13.7%)
Hawking 22(4.6%) 09(1.9%) 11(2.3%) 15(3.1%) 57(11.9%)
Job Looking 10(2.1%) 35(7.3%) 11(2.3%) 10(2.1%) 66(13.7%)
House helpers 08(1.7%) 06(1.3%) 10(2.1%) 05(1.0%) 29(6.0%)
No Job 04(0.8%) 04(0.8%) 15(3.1%) 04(0.8%) 27(5.6%)
Total 254 (52.8%) 86 (17.9%) 84 (17.5%) 57 (11.9%) 481(100%)
As shown in Table 4.12 and Figure 4.15 in general, 49.1% of the sampled Urban Residents
in the four study areas accounted for trading; 13.7% were employed as well as job seekers;
11.9% were hawkers; 6.0% represented house helpers while 5.6% accounted for those who
were having nothing to do. In Langas, the proportion of those who trading were
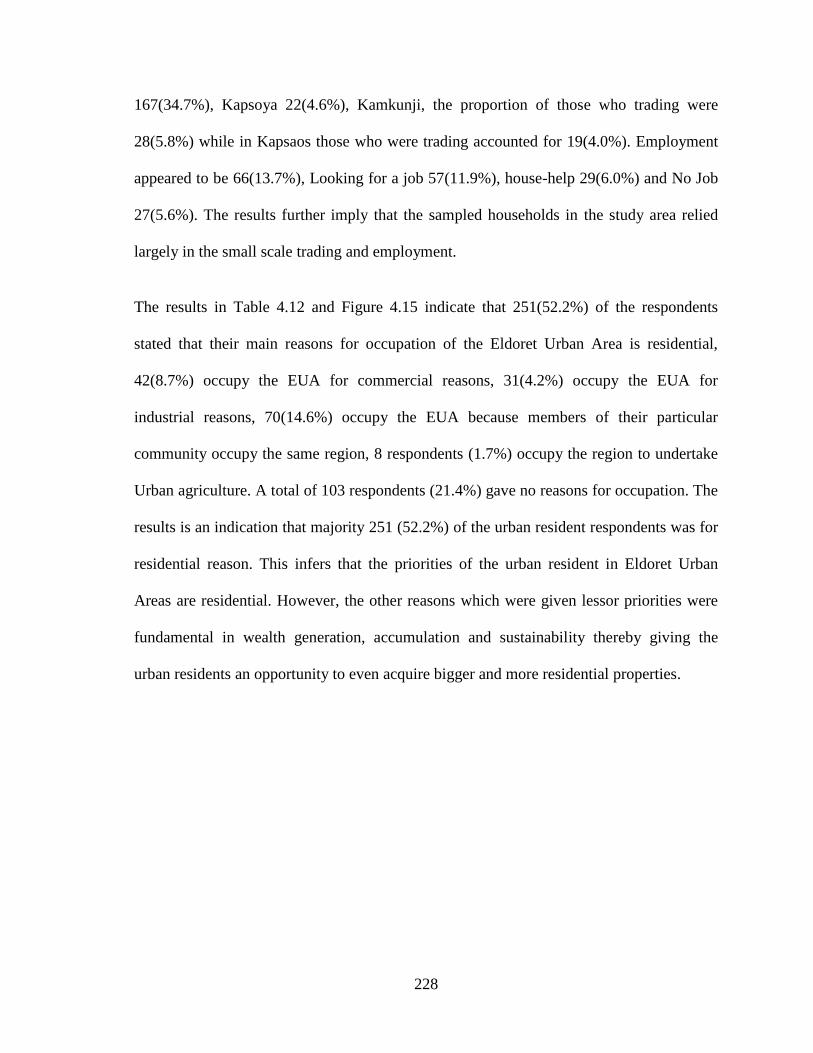
228
167(34.7%), Kapsoya 22(4.6%), Kamkunji, the proportion of those who trading were
28(5.8%) while in Kapsaos those who were trading accounted for 19(4.0%). Employment
appeared to be 66(13.7%), Looking for a job 57(11.9%), house-help 29(6.0%) and No Job
27(5.6%). The results further imply that the sampled households in the study area relied
largely in the small scale trading and employment.
The results in Table 4.12 and Figure 4.15 indicate that 251(52.2%) of the respondents
stated that their main reasons for occupation of the Eldoret Urban Area is residential,
42(8.7%) occupy the EUA for commercial reasons, 31(4.2%) occupy the EUA for
industrial reasons, 70(14.6%) occupy the EUA because members of their particular
community occupy the same region, 8 respondents (1.7%) occupy the region to undertake
Urban agriculture. A total of 103 respondents (21.4%) gave no reasons for occupation. The
results is an indication that majority 251 (52.2%) of the urban resident respondents was for
residential reason. This infers that the priorities of the urban resident in Eldoret Urban
Areas are residential. However, the other reasons which were given lessor priorities were
fundamental in wealth generation, accumulation and sustainability thereby giving the
urban residents an opportunity to even acquire bigger and more residential properties.
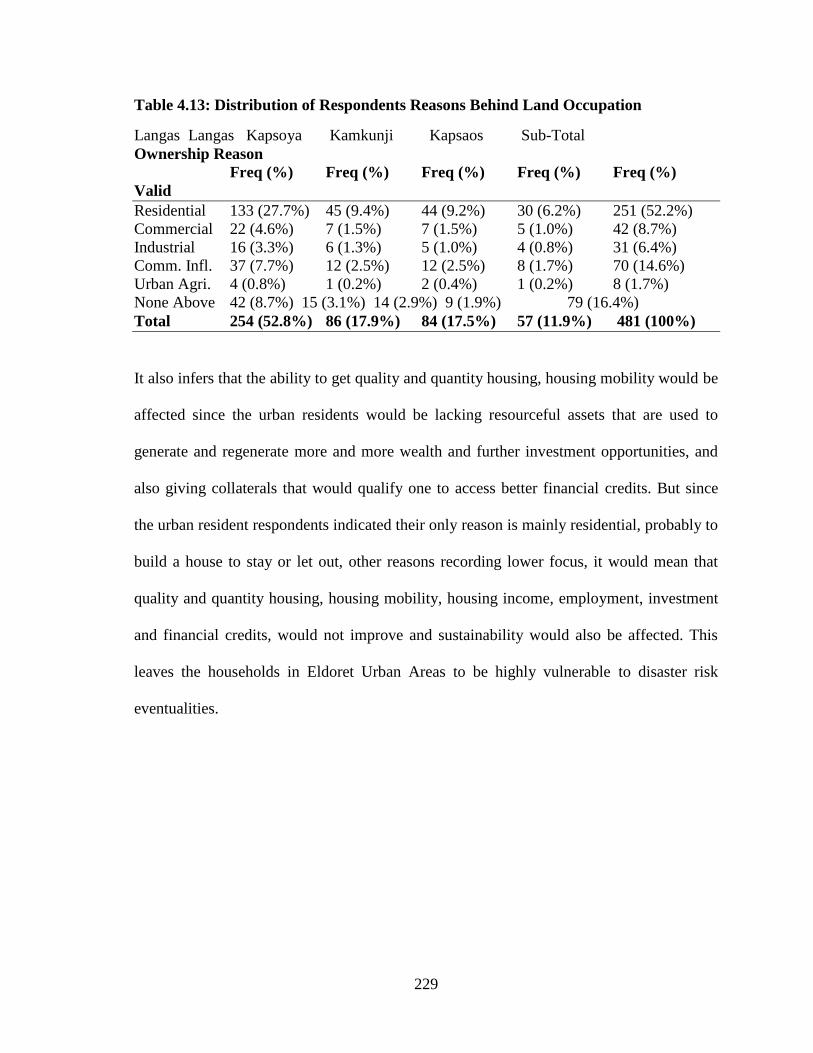
229
Table 4.13: Distribution of Respondents Reasons Behind Land Occupation
Langas Langas Kapsoya Kamkunji Kapsaos Sub-Total
Ownership Reason
Freq (%) Freq (%) Freq (%) Freq (%) Freq (%)
Valid
Residential 133 (27.7%) 45 (9.4%) 44 (9.2%) 30 (6.2%) 251 (52.2%)
Commercial 22 (4.6%) 7 (1.5%) 7 (1.5%) 5 (1.0%) 42 (8.7%)
Industrial 16 (3.3%) 6 (1.3%) 5 (1.0%) 4 (0.8%) 31 (6.4%)
Comm. Infl. 37 (7.7%) 12 (2.5%) 12 (2.5%) 8 (1.7%) 70 (14.6%)
Urban Agri. 4 (0.8%) 1 (0.2%) 2 (0.4%) 1 (0.2%) 8 (1.7%)
None Above 42 (8.7%) 15 (3.1%) 14 (2.9%) 9 (1.9%) 79 (16.4%)
Total 254 (52.8%) 86 (17.9%) 84 (17.5%) 57 (11.9%) 481 (100%)
It also infers that the ability to get quality and quantity housing, housing mobility would be
affected since the urban residents would be lacking resourceful assets that are used to
generate and regenerate more and more wealth and further investment opportunities, and
also giving collaterals that would qualify one to access better financial credits. But since
the urban resident respondents indicated their only reason is mainly residential, probably to
build a house to stay or let out, other reasons recording lower focus, it would mean that
quality and quantity housing, housing mobility, housing income, employment, investment
and financial credits, would not improve and sustainability would also be affected. This
leaves the households in Eldoret Urban Areas to be highly vulnerable to disaster risk
eventualities.
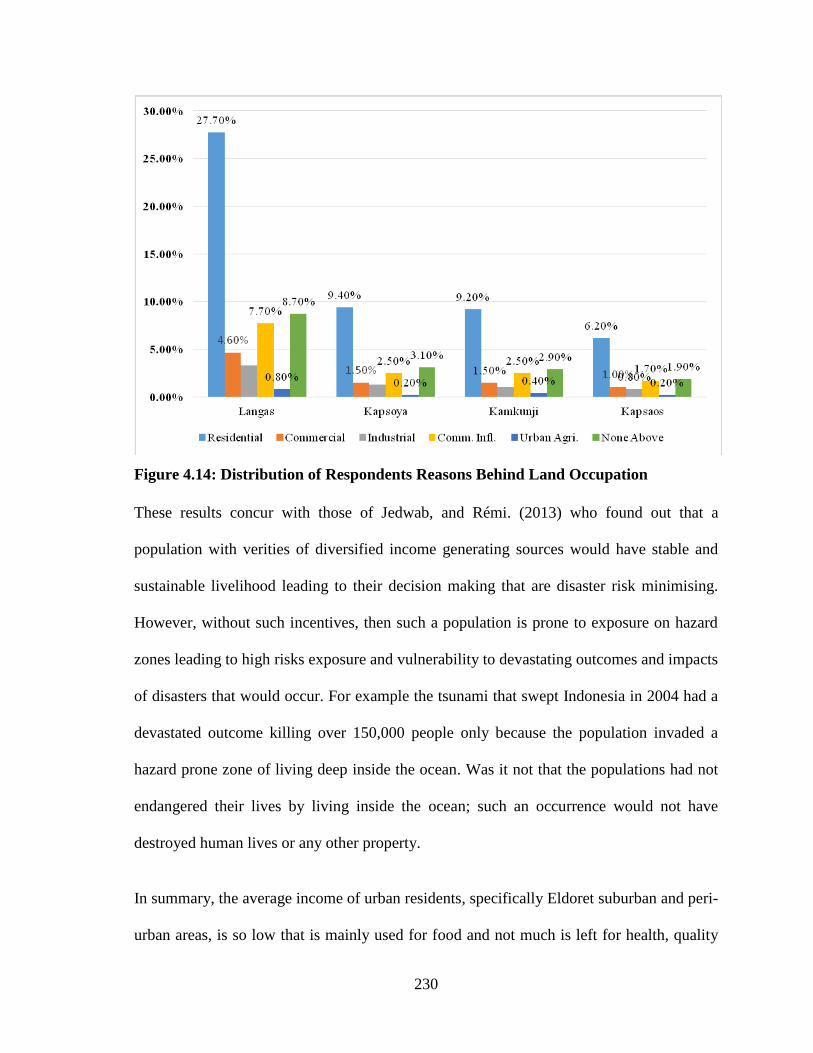
230
Figure 4.14: Distribution of Respondents Reasons Behind Land Occupation
These results concur with those of Jedwab, and Rémi. (2013) who found out that a
population with verities of diversified income generating sources would have stable and
sustainable livelihood leading to their decision making that are disaster risk minimising.
However, without such incentives, then such a population is prone to exposure on hazard
zones leading to high risks exposure and vulnerability to devastating outcomes and impacts
of disasters that would occur. For example the tsunami that swept Indonesia in 2004 had a
devastated outcome killing over 150,000 people only because the population invaded a
hazard prone zone of living deep inside the ocean. Was it not that the populations had not
endangered their lives by living inside the ocean; such an occurrence would not have
destroyed human lives or any other property.
In summary, the average income of urban residents, specifically Eldoret suburban and peri-
urban areas, is so low that is mainly used for food and not much is left for health, quality
231
and quantity shelter, education, clothing, healthcare, and others. The estimation shows that
57.2% of sampled households are employed mostly involved with informal and trivial
works where the proposition of male and female is 57.14% and 42.86%. About 43% of
population is unemployment due to having no specific job.
The occupational structure and level of income of urban residents head is different from
one to another because of the variation in the employment patterns. It is estimated that
nearly 20% of urban residents head among slum dwellers are rickshaw pullers and their
average monthly income (8000–10,000) is also higher among other occupations. The
second position in terms of the occupation of urban residents head is maid/home servants
(15%) which are in essence considered a trifling and odd job and their average monthly
income (less than 5000) are intensely substandard in comparison with other occupations.
After that there are substantial figures of urban residents heads who are involved with
formal employment sectors like, garment’s worker (12.50%) and their average income is
6000–9000; and service holder (6.25%) with income of 8000–11,000, followed by day
labor and small business. It is noteworthy mentioned that most of the respondents are
engaged with informal sectors and seasonal occupation who have to face obscurity to run
their household.
At that time the results show that some of the respondents indicated that they had to sit
inside the house without working which leads leading their family to the starvation, which
is a disaster. It is obvious that urbanization creates more space of business as well as
demands for urban inhabitants, which further leads to create informal jobs like street
vendors, waste pickers, informal transport providers, construction works, and so on. In the
232
process of urbanization, the growth of the informal sector is inevitable because the
informal sector is the primary job generation. There is a close link between working in the
informal sector and poverty due to the fact that the urban informal sector absorbs most of
the urban labour force in one hand. On the other hand, the informal economy workers earn
far less than in the formal economy (Mathur, 2013). However, sampled urban residents
may find themselves trapped in a low-skilled, low-income equilibrium as the continuous
influx of rural migrants maintains wages at near-subsistence levels, hindering the
investments in human capital that would be required to offset the adverse effects of slum
living (Marx, Stoker & Suri, 2013).
4.8. Urban Residents in Low Income Urban Residents Investment and Financial
Credit of EUA.
The results in Table 4.13 indicate that urban residents investment and financial credit by
sampled Urban Residents of industrial property accounted for 00(00%), commercial assets
was 100(25%), while residential property was 164(34%). In Langas sub-location, majority
were commercial and residential investors with a 100(25%). In both Kapsoya and
Kamkunji sub-locations, majority of the respondents indicated that the urban residents
were both involved in commercial and residential investment but on a lower level. In
general, majority of respondents indicated that the households engaged in in some level of
investment and access to some financial credits.
This could infers that due to high cost of capital and cost of assessing investment
properties such as land, sampled respondents do not have much of long term assets or
investment properties. This is an indication that most of them depend on politicians and
233
well-wishers in the event disaster events occurs. Due to poor income and lack of stable
employment, the sampled households indicate a picture of inability to invest on large scale
and long term projects.
4.10. Housing Quality and Quantity (HQQ)
The study sought to find out the Type of Houses Owned by urban residents. The results are
as shown in Table 4.13 and Figure 4.16 and Plates 4.
The results in Table 4.13 and Figure 4.16 indicate that 82(17%) of Langas sub-location
urban residents own house type of very poor (thatched roof, mud walls, non-cement floor),
63(13%) and 10 for Kapsoya and Kamkunji and Kapsaos sub-locations own house types of
very good (iron sheet/tile roof, concrete wall, cement floor). Those who are hazard free
would have houses that are built that can withstand disasters when they occur, houses that
can pass the occupancy test and clean bill of health to the occupants, houses that cannot
just collapse, houses that are built with green space in between them leaving room for
emergency responses. The state of the houses owned by the urban residents would indicate
the socioeconomic status that would prove if the they are disaster prepared or not.

234
Table 4.14: Distribution of Type of Houses Owned by Respondents
Sub-Location Langas Kapsoya Kamkunji Kapsaos Sub-Total
House Type Freq (%) Freq (%) Freq (%) Freq (%) Freq (%)
Valid
Very good (iron sheet/tile roof, concrete wall, cement floor)
03(01%) 22(25%) 01(01%) 07(12%) 33(38%)
Good (iron sheet roof, mud walls, cement floor)
46(18%) 35(40%) 03(04%) 16(28%) 101(21%)
Average (iron sheet roof, mud walls, non-cement flooror thatched, brick wall)
155(61%) 22(25%) 14(16%) 12(20%) 168(35%)
Poor (tined roof, mud walls, non-cement floor)
46(18%) 08(09%) 42(50%) 22(39%) 08(07%)
Very poor (thatched roof, mud walls, non-cement floor)
05(02%) 03(01%) 24(29%) 00(01%) 01(17%)
Total 254 (52.8%) 86 (17.9%) 84 (17.5%) 57 (11.9%) 481(100%)
This is an indication that the majority of sampled urban residents 168(35%) dwell in
houses rated to be on average condition, that means urban resident houses were either iron
sheet roofed, with mud walls and non-cement floor or thatched with brick wall, while
101(21%) were found dwelling in houses which were thatched roofed with mud walls and
non-cement floor. Only 39(08%) of sampled urban residents were found dwelling in
relatively very good houses (houses with iron sheets/tile roof, concrete wall and cement
floor). These results indicate that majority of sampled urban residents live in poor housing
conditions which is a reflection of high incidences of poverty.
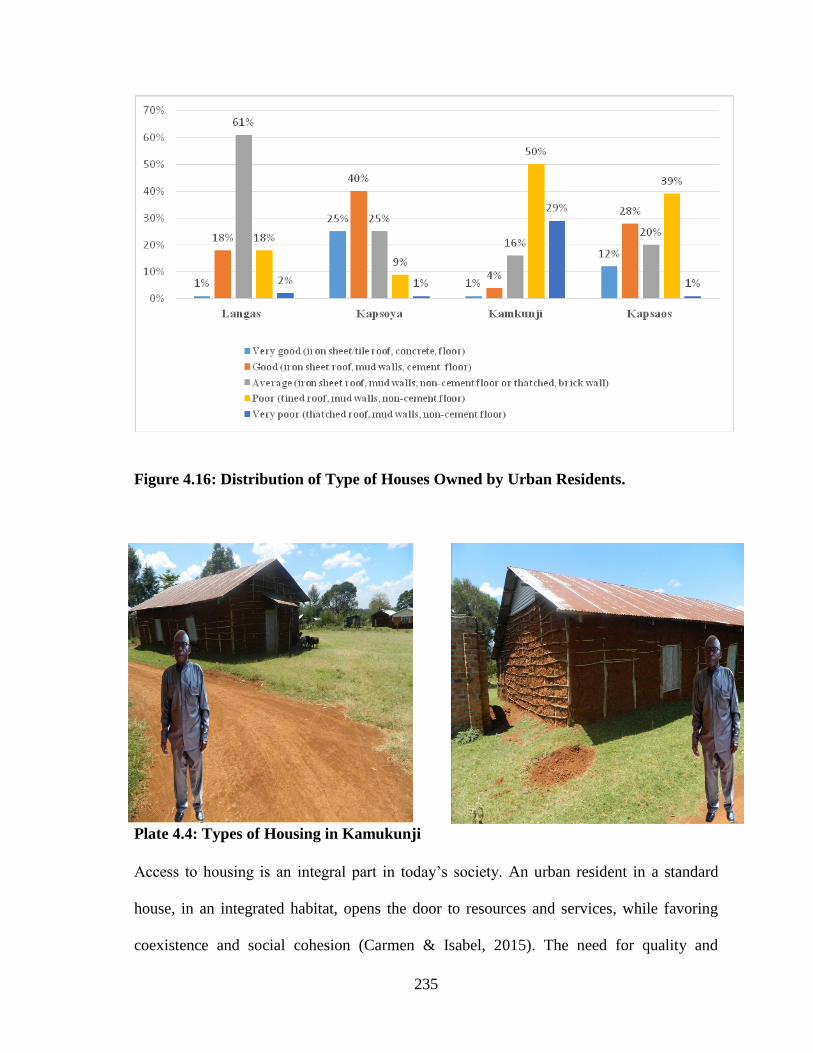
235
Figure 4.16: Distribution of Type of Houses Owned by Urban Residents.
Plate 4.4: Types of Housing in Kamukunji
Access to housing is an integral part in today’s society. An urban resident in a standard
house, in an integrated habitat, opens the door to resources and services, while favoring
coexistence and social cohesion (Carmen & Isabel, 2015). The need for quality and
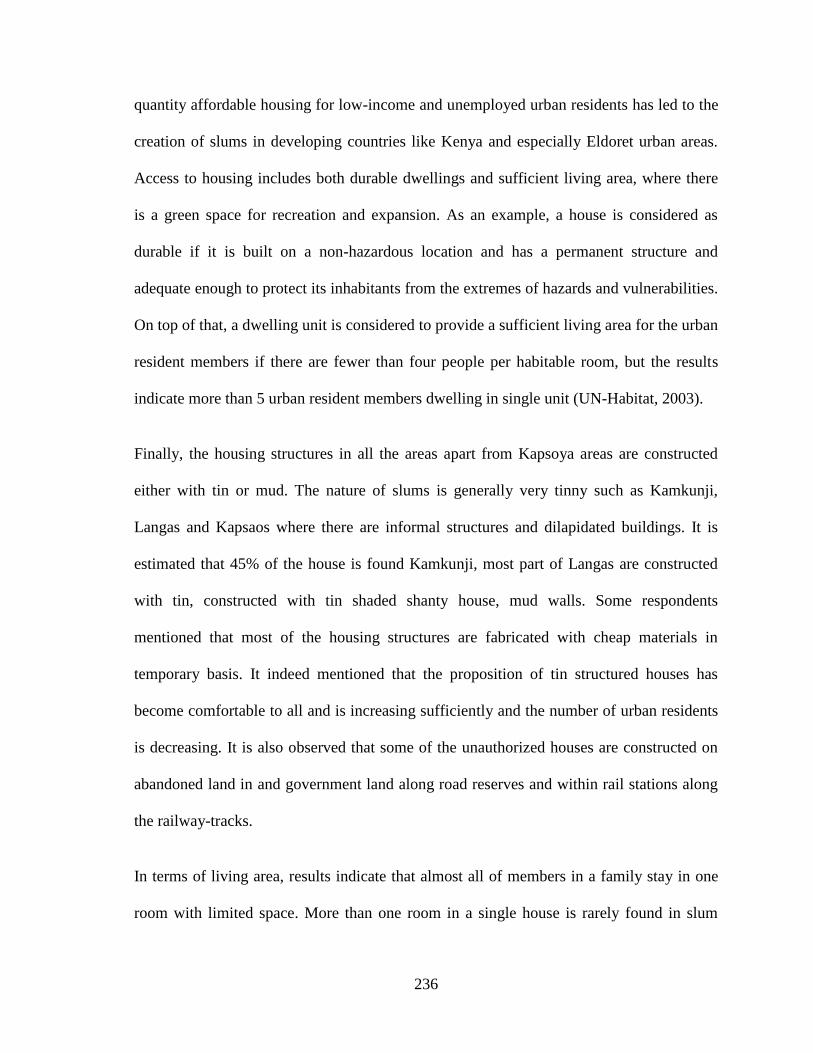
236
quantity affordable housing for low-income and unemployed urban residents has led to the
creation of slums in developing countries like Kenya and especially Eldoret urban areas.
Access to housing includes both durable dwellings and sufficient living area, where there
is a green space for recreation and expansion. As an example, a house is considered as
durable if it is built on a non-hazardous location and has a permanent structure and
adequate enough to protect its inhabitants from the extremes of hazards and vulnerabilities.
On top of that, a dwelling unit is considered to provide a sufficient living area for the urban
resident members if there are fewer than four people per habitable room, but the results
indicate more than 5 urban resident members dwelling in single unit (UN-Habitat, 2003).
Finally, the housing structures in all the areas apart from Kapsoya areas are constructed
either with tin or mud. The nature of slums is generally very tinny such as Kamkunji,
Langas and Kapsaos where there are informal structures and dilapidated buildings. It is
estimated that 45% of the house is found Kamkunji, most part of Langas are constructed
with tin, constructed with tin shaded shanty house, mud walls. Some respondents
mentioned that most of the housing structures are fabricated with cheap materials in
temporary basis. It indeed mentioned that the proposition of tin structured houses has
become comfortable to all and is increasing sufficiently and the number of urban residents
is decreasing. It is also observed that some of the unauthorized houses are constructed on
abandoned land in and government land along road reserves and within rail stations along
the railway-tracks.
In terms of living area, results indicate that almost all of members in a family stay in one
room with limited space. More than one room in a single house is rarely found in slum
237
areas. The estimation shows that just under half of respondents have one room having 5-7
family members staying together. It is also hard to note that 23.75% of house having 7–10
members have been sharing one room. In addition, 27.5% of respondents opined that they
have one room allotted for their family members composed of 1–3 members. It is further
noticed that most of the house in the study area slum is rented with high prices according
to their poor standards. The physical looking of rented houses is not attractive without
having ventilation and stay. The sampled study areas are generally grown on government
land, particularly Kamkunji and Langas. On many occasions, though people have access to
housing, this property does not meet the minimum conditions of habitability. Despites
housing shortage, the price of land and the housing on unauthorized land is significantly
increasing in Kapsoya, and Langas. Moreover, crowded and poorly-serviced low-income
settlements provide a ripe breeding ground for disease transmission, and this is
compounded by a but the relevant authorities portray a picture that has inadequate visible
intervention in the development of housing sectors for urban poor rather largely limited to
eviction threats and practice to them. Therefore, adequate urban residents housing policy
performance becomes critical to achieving sustainable and socially equitable cities
(Carmen & Isabel, 2015).
4.10. Housing Mobility (HM)
The results in Table 4.14 indicate that Housing mobility of Sampled Urban Residents of
homeowner mobility accounted for 184(46%), Move to a New Residence was 148(37%),
while Transfer of economic ownership was 64(16%). In Langas sub-location, majority
were homeowner mobility with a 32(08%). In both Kapsoya and Kamkunji sub-locations,
majority of the respondents indicated that the households were both involved in
homeowner mobility and move to a new residence, an indication that they were yet to

238
pursue own homes. In general, majority of respondents indicated that the urban residents
engaged in Homeowner mobility as housing mobility aimed at improving their status and
wellbeing including living standards.
Table 4.15: Distribution of Respondents Housing Mobility
Sub-Location Langas Kapsoya Kamkunji Kapsaos Sub-Total
Socio-Economic Activities Types
Freq (%) Freq (%) Freq (%) Freq (%) Freq (%)
Homeowner Mobility
32(08%) 84(21%) 68(17%) 25(03%) 184(46%)
Move to a New Residence
100(25%) 32(08%) 16(04%) 12(03%) 148(37%)
Transfer of economic ownership
00 (00%) 32(08%) 32(08%) 10(04%) 64(16%)
None above 00(00%) 00(00%) 00(00%) 00(00%) 00(00%)
Total 254 (52.8%) 86 (17.9%) 84 (17.5%) 57(11.9%) 481(100%)
This could infers that due to high transaction costs of buying and selling a home provide an
incentive for people to extend their stay in the house in order to amortize these costs over a
longer holding period. Additional financial frictions can arise that exacerbate this effect.
Due to poor income and lack of stable employment, the sampled urban residents indicate a
picture of inability to move to better housing or their own residential areas although those
who indicated that they have acquired a piece of a plot were of the opinion that it is for
residential.
This study used regression analysis to find out the relationships between predictive
variable and criterion variable. Regression analysis result as shown in Table 4.16 indicates
that land use planning has significant connection with household disaster management
success or failure.
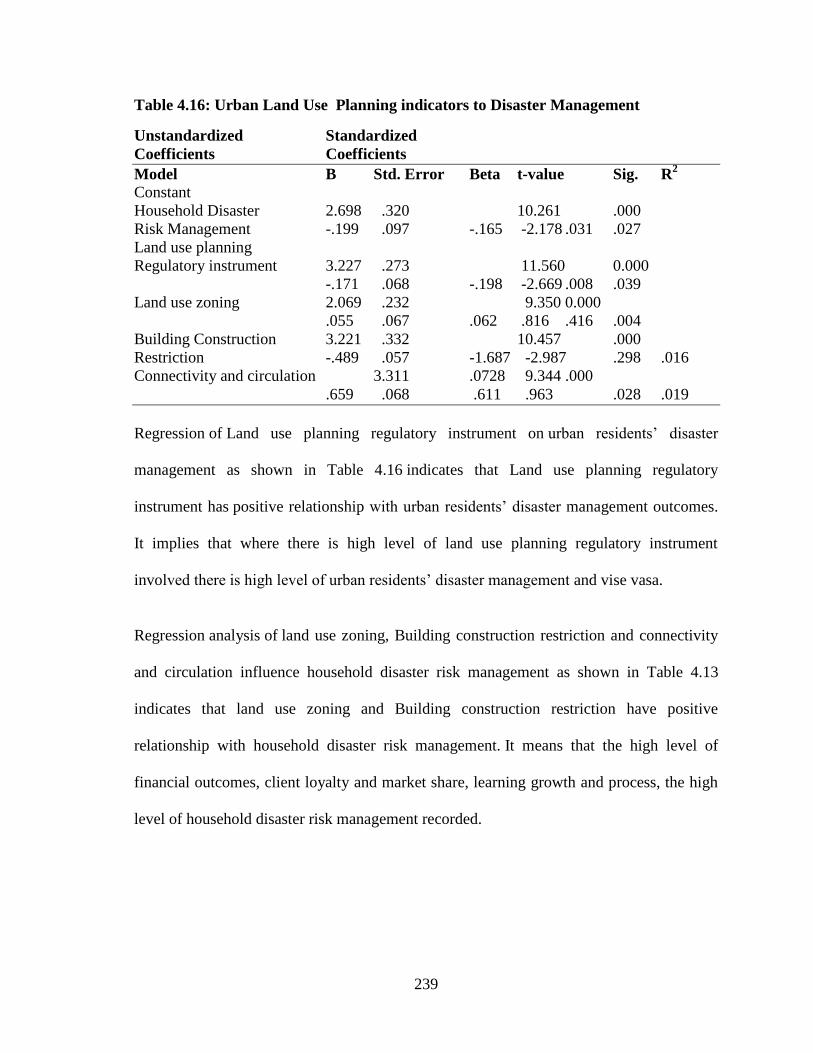
239
Table 4.16: Urban Land Use Planning indicators to Disaster Management
Unstandardized Standardized
Coefficients Coefficients
Model B Std. Error Beta t-value Sig. R2
Constant
Household Disaster 2.698 .320 10.261 .000
Risk Management -.199 .097 -.165 -2.178 .031 .027
Land use planning
Regulatory instrument 3.227 .273 11.560 0.000
-.171 .068 -.198 -2.669 .008 .039
Land use zoning 2.069 .232 9.350 0.000
.055 .067 .062 .816 .416 .004
Building Construction 3.221 .332 10.457 .000
Restriction -.489 .057 -1.687 -2.987 .298 .016
Connectivity and circulation 3.311 .0728 9.344 .000
.659 .068 .611 .963 .028 .019
Regression of Land use planning regulatory instrument on urban residents’ disaster
management as shown in Table 4.16 indicates that Land use planning regulatory
instrument has positive relationship with urban residents’ disaster management outcomes.
It implies that where there is high level of land use planning regulatory instrument
involved there is high level of urban residents’ disaster management and vise vasa.
Regression analysis of land use zoning, Building construction restriction and connectivity
and circulation influence household disaster risk management as shown in Table 4.13
indicates that land use zoning and Building construction restriction have positive
relationship with household disaster risk management. It means that the high level of
financial outcomes, client loyalty and market share, learning growth and process, the high
level of household disaster risk management recorded.
240
CHAPTER FIVE
5.0 EFFECTS OF LAND USE PLANNING REGULATORY INSTRUMENTS ON
ECONOMIC VULNARABILITY TO DISASTER MANAGEMENT IN LOW
INCOME NEIGHBOURHOODS OF ELDORET URBAN AREA.
5.1. Introduction.
This section sought to obtain information on regulatory instruments of urban land use
planning. Urban land use planning regulatory instruments can be explicit. Explicit
instruments are those specifically designed to shape cities for example urban zoning
mechanisms or innovative financing of urban roads in specific city. Implicit instruments
are those that shape a city as an externality, for example a large scale increase in petroleum
tax by a national government would result in more compact cities. Land use regulations are
critical for negotiation among public sector and private stakeholders, buildings sitting and
space, building codes and energy traffic calming, utilities and facilities, lot requirement
and building materials. This is a control approach used to cause restriction to achieve a
smooth and visual skyline and to prevent tall buildings from blocking the view of shorter
buildings and the sunlight from reaching them. It aims to protect shorter buildings from
being overshadowed by taller buildings. This ensures that buildings must conform to the
code to obtain planning permission, usually from a county authority. It is aimed at
protecting public health, safety and general welfare as they relate to the construction and
occupancy of buildings and structures. The results from sampled respondents are as shown
in Table 5.1

241
The results from Table 5.1 show that the regulatory instruments have shown a large
deviation. It shows a mean influence of 4.24%, the maximum reported influence is 69.0%
and the minimum is -48.8% with deviation of 9.32 between the urban residents from
sampled study areas. The mean of regulatory instruments is 4.24, with the maximum and
minimum are 69 and -48.8 respectively.
These results also indicate that the building and construction permits have shown a small
deviation. The mean of building and construction permits is almost 57.7%, which is 57.7%
of influence on economic vulnability to disaster management leaving the rest 42.3% be
influenced by other factors.
Table 5.1: Distribution of Elements of Regulatory Instruments (LUPRI)
Variable N Range Min Max Mean S.D. Var
Stat Stat Stat Stat Stat Std. Error Stat
LUP-RI 481 79.20 -48.8 69.00 4.238 1.03 9.32 95.10
Floor Area Ratio and Height
Limitations 481 5.48 3.11 4.15 3.231 0.732 0.677 0.419
Building and Construction
Permits 481 4.61 1.88 2.87 4.52 0.557 1.184 2.581
Open and Green Space
Protection 481 5.10 1.74 3.84 8.133 0.587 1.154 2.363
Agricultural Land
Conservation 481 6.14 1.56 2.98 8.120 0.668 1.165 2.541
Construction and Building
Standards 481 6.10 1.45 2.86 8.120 0.848 1.174 2.333
Enforcement of Property
Rights 481 0.70 0.90 0.25 0.567 0.421 0.186 0.456
Right-of-Way Protection 481 7.13 3.18 3.57 0.436 0.461 0.264 0.643
Buildings Sitting and
Space 481 4.84 2.99 4.98 5.100 0.626 0.647 0.310
Building Codes and
Energy Traffic calming 481 5.96 2.65 3.55 6.245 0.516 1.312 2.540
Utilities and Facilities 481 5.33 3.18 4.52 0.314 0.601 0.533 0.621
Lot Requirement 481 5.66 2.65 3.53 6.255 0.578 1.321 2.521
Building Materials 481 5.76 2.65 3.58 6.255 0.565 1.342 2.564
Height Restrictions 481 5.15 3.92 5.24 6.451 0.647 0.179 0.357
242
The floor area ratio and height limitations implies that urban land planning regulation
considers the kind of building in certain area to be of specific standards of reference such
as floor area and the height limitations. The mean of floor area ratio and height limitations
is almost 73.2%, which is 73.2% of influence on economic vulnability to disaster
management leaving the rest 26.8% be influenced by other factors.
The open and green space protection of the regulatory instruments shows an experience of
annual frequencies of a maximum of three times influence on economic vulnerability to
disaster management. This implies that open and green space protection registered quite a
small number of influences. The mean of agricultural land conservation on the regulatory
instruments is only about 66.8%, which is 66.8% of the regulatory instruments influence
on economic vulnerability to disaster management leaving 33.2% to be influenced by other
factors.
The construction and building standards of the regulatory instruments indicate an
experience of annual frequencies of a maximum of participation. This implies that
construction and building standards registered quite a small number of influences of
regulatory instruments. The mean of construction and building standards is 84.8%, which
is 84.8% of the Regulatory Instruments. The enforcement of property rights of regulatory
instruments shows an experience of annual frequencies of a maximum of four times
influence of the Regulatory Instruments. This implies that enforcement of property rights
registered quite a small number of degrees of influence of the total regulatory instruments
influence on economic vulnability to disaster management. The mean of enforcement of
property rights of the regulatory instruments is only about 56.7%, which is 56.7% of the
243
urban residents’ disaster management. Finally the results indicate that the right-of-way
protection has shown a smaller deviation. The mean of right-of-way protection is almost
43.6%, which is 43.6% of influence on economic vulnerability to disaster management
leaving the rest 57.4% be influenced by other factors.
Furthermore, the results from Table 5.1 show that the building construction restriction has
shown a moderate deviation of 11.13% among the sampled urban residents from the study
locations. It shows a mean influence of 53.82%, the maximum reported influence is around
56.0% and the minimum is -40.0% with deviation of 11.13 between sampled urban
resident respondents. Building sitting and space shows an experience of annual frequencies
of a maximum of five times and a minimum of three times the influence in the total degree
of influence of building construction restriction.
The mean of building sitting and spaces is 62.6%, which is 62.6% of influence of the total
influence of building construction restriction on economic vulnerability to disaster
management leaving the rest 37.4% be influenced by other factors not covered in this
study. The Building Codes and energy traffic calming of the building construction
restriction shows an experience of annual frequencies of a maximum of four times
influence with a minimum of three levels of experiences. This implies that building codes
and energy traffic calming registered quite a moderate level of influences. The mean of
building codes and energy traffic calming influence is only 51.6%, which is 51.6% of the
building construction restriction influence on economic vulnerability to disaster
management levels.
244
The utilities and facilities indicate an experience of annual frequencies of a maximum of
five times and a minimum of three times the level of influence. This implies that the
utilities and facilities registered quite a moderate level of influences on the board effects on
urban land use planning approaches. The mean of utilities and facilities is 60.1%, which is
60.1% of the total building construction restriction influence on economic vulnerability to
disaster management. The Lot requirement indicates an experience of annual frequencies
of a maximum of five times and a minimum of three times level of influence. This implies
that Lot requirement registered quite a large level of influence of the total building
construction restriction influence on household disaster risk management. The mean of lot
requirement of the board is only about 57.8%, which is 57.8% of the urban residents’
disaster management.
The building materials indicate an experience of annual frequencies of a maximum of six
times and a minimum of four times level of influence. This implies that building materials
registered a high level of influence of the total building construction restriction influence
on household disaster risk management. The mean of building materials of the building
construction restriction is only about 56.5%, which is 56.5% of the disaster management.
The height restrictions indicate an experience of annual frequencies of a maximum of six
times and a minimum of four times level of influence. This implies that height restrictions
registered a high level of influence of the total building construction restriction influence
on household disaster risk management. The mean of height restrictions of the building
construction restriction is only about 64.7%, which is 64.7% of the urban residents’
disaster management.
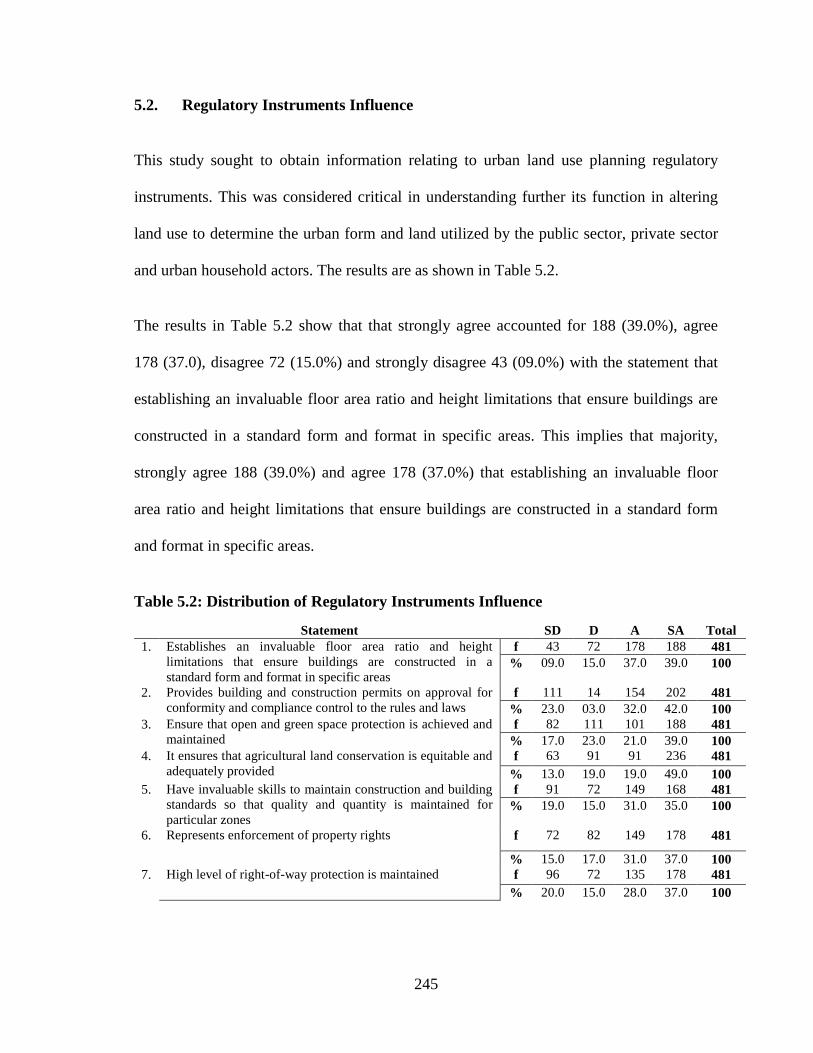
245
5.2. Regulatory Instruments Influence
This study sought to obtain information relating to urban land use planning regulatory
instruments. This was considered critical in understanding further its function in altering
land use to determine the urban form and land utilized by the public sector, private sector
and urban household actors. The results are as shown in Table 5.2.
The results in Table 5.2 show that that strongly agree accounted for 188 (39.0%), agree
178 (37.0), disagree 72 (15.0%) and strongly disagree 43 (09.0%) with the statement that
establishing an invaluable floor area ratio and height limitations that ensure buildings are
constructed in a standard form and format in specific areas. This implies that majority,
strongly agree 188 (39.0%) and agree 178 (37.0%) that establishing an invaluable floor
area ratio and height limitations that ensure buildings are constructed in a standard form
and format in specific areas.
Table 5.2: Distribution of Regulatory Instruments Influence
Statement SD D A SA Total
1. Establishes an invaluable floor area ratio and height
limitations that ensure buildings are constructed in a
standard form and format in specific areas
f 43 72 178 188 481
% 09.0 15.0 37.0 39.0 100
2. Provides building and construction permits on approval for
conformity and compliance control to the rules and laws f 111 14 154 202 481
% 23.0 03.0 32.0 42.0 100
3. Ensure that open and green space protection is achieved and
maintained f 82 111 101 188 481
% 17.0 23.0 21.0 39.0 100
4. It ensures that agricultural land conservation is equitable and
adequately provided f 63 91 91 236 481
% 13.0 19.0 19.0 49.0 100
5. Have invaluable skills to maintain construction and building
standards so that quality and quantity is maintained for
particular zones
f 91 72 149 168 481
% 19.0 15.0 31.0 35.0 100
6. Represents enforcement of property rights f 72 82 149 178 481
% 15.0 17.0 31.0 37.0 100
7. High level of right-of-way protection is maintained f 96 72 135 178 481
% 20.0 15.0 28.0 37.0 100
246
The next item of regulatory instruments was that providing building and construction
permits for approval for conformity and compliance control to the rules and laws. The
results show that strongly agree accounted for 202 (42.0%), agree 154 (32.0%), disagree
14 (03.0%) and strongly disagree 111 (23.0%) that providing building and construction
permits for approval for conformity and compliance control to the rules and laws. This
implies that majority, strongly agree 202 (42.0%) and agree 154 (32.0%) that providing
building and construction permits for approval for conformity and compliance control to
the rules and laws. Moreover, it was shown that strongly agree accounted for 188 (39.0%),
agree 101 (21.0%), disagree 111 (23.0%) and strongly disagree 82 (17.0%) that they
ensure that open and green space protection is achieved and maintained. This implies that
majority, strongly agree 188 (39.0%) and agree 101 (21.0%) that ensure that open and
green space protection is achieved and maintained.
Apart from that, the study also asked to find out if they ensure that agricultural land
conservation is equitable and adequately provided. In Table 5.2, the results show that
strongly agree accounted for 236 (49.0%), agree 91 (19.0%), disagree 91 (19.0%) and
strongly disagree 63 (13.0%). This implies that majority, strongly agree 236 (49.0%) that
ensures that agricultural land conservation is equitable and adequately provided.
In relation to participants having invaluable skills to maintain construction and building
standards so that quality and quantity is maintained for particular zones, results in Table
5.2 show that strongly agree accounted for 168 (35.0%), agree 31.0%(149), disagree 72
(15.0%) and strongly disagree 91 (19.0%). The results is an indication that majority agree
at 168 (35.0%) that participants having invaluable skills to maintain construction and
247
building standards so that quality and quantity is maintained for particular zones, the
results also show that strongly agree accounted for 178 (37.0%), agree 149 (31.0%),
disagree 82 (17.0%) and strongly disagree 72 (15.0%) that regulatory instruments is useful
in represents enforcement of property rights. This is an indication that majority who agree
at 178 (37.0%) are of the opinion that the regulatory instruments is useful in represents
enforcement of property rights. This question sought to establish if high level of right-of-
way protection is maintained. The results show that strongly agree accounted for 178
(37.0%), agree 135 (28.0%), disagree 72 (15.0%) and strongly disagree 96 (20.0%). This
implies that majority, strongly agree 178 (37.0%) and agree 135 (28.0%) that high level of
right-of-way protection is maintained.
These results concur with the findings of Moreles,(2013) who found out that regulatory
instruments help in creating and managing land use practices and their choices among
specific growth management policy instruments determining how land use policy choices
are shaped by institutional features of national and county governments and the household
demands. That these regulatory instrument decisions reflect a balance of the conflicting
interests and responses to socioeconomic and environmental pressures.
The results indicate that land use regulatory instrument of land use planning component
has an influence on disaster risk management. Thus county governments could make use
of land use planning regulatory instrument to provide quality standard housing units
suitable for occupation. This means that hazards and vulnerability to collapsing buildings,
sinking buildings, houses constructed under high voltage power lines, are not going to be
experienced. Moreover, problems related to housing crowding leading to high density
248
populations in a small area will be eliminated. Once such order has been maintained, then
space for expansion and recreation will be restored and access roads will be working hence
in event of any emergencies, accessibility to rescue will be possible. Such an environment
will attract investment of high standards quality such as an academy, for example, in Elgon
View estate, there are various good schools such as Testimony, high class guest houses,
Boma Inn and health facilities and others. But in places like Kamkunji, Langas, there are
only public schools that are overcrowded, lack adequate and well stocked health facilities,
low quality and quantity housing.
5.3. Correlation Analysis
The correlations of the independent variables of Land use planning regulatory instrument
(LUPRI), Land use zoning (LUZ), and Connectivity and circulation (CC) and the
dependent variables household disaster risk management were tested and their significant
relationship recorded. This was important to help understand the relationships that exist
between the independent and dependent variables. The results are as shown in Table 5.3.
The results in Table 5.3 summarize the correlation between the independent variables and
dependent variable. It shows that land use planning regulatory instrument, land use zoning;
building construction restriction and connectivity and circulation are all significantly
related to Economic Vulnarability to disaster management (EVDM). This relationship is
either positive or positive. The components of Urban Land Use Planning of connectivity
and circulation have significantly positive relationship. The results shows that land use
planning regulatory instrument is positively associated with household disaster
management with summary of Pearson Correlations show that land use planning regulatory
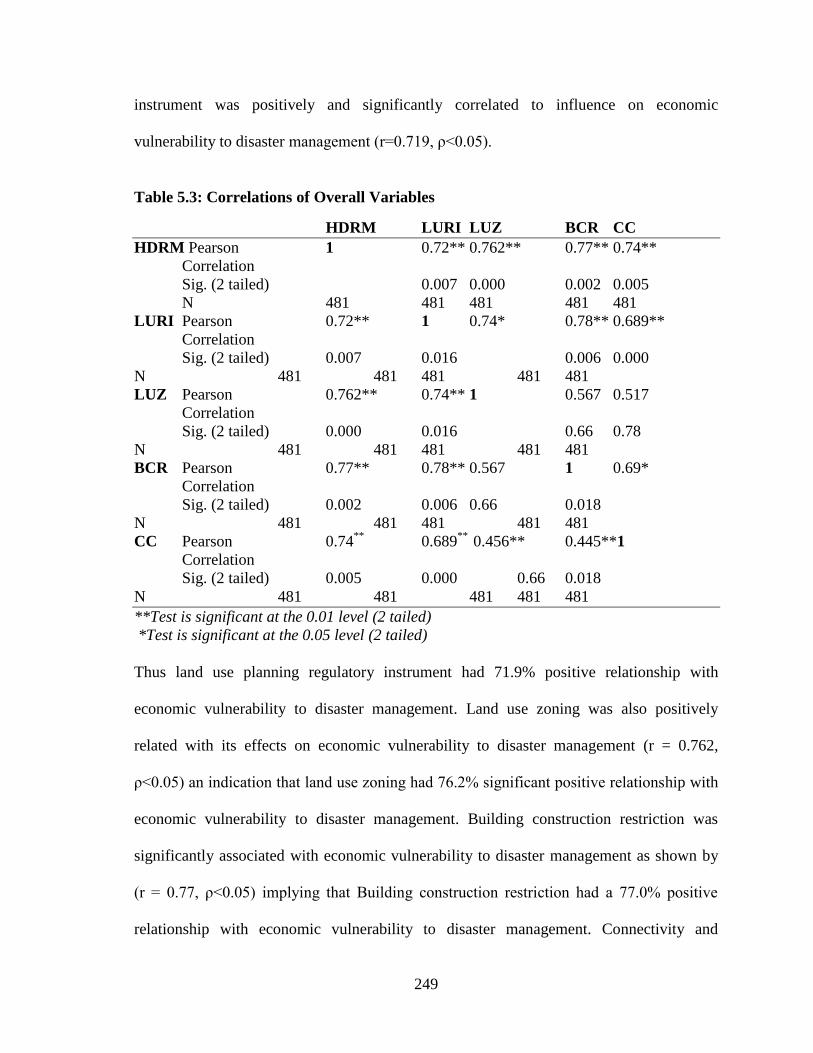
249
instrument was positively and significantly correlated to influence on economic
vulnerability to disaster management (r=0.719, ρ<0.05).
Table 5.3: Correlations of Overall Variables
HDRM LURI LUZ BCR CC
HDRM Pearson 1 0.72** 0.762** 0.77** 0.74**
Correlation
Sig. (2 tailed) 0.007 0.000 0.002 0.005
N 481 481 481 481 481
LURI Pearson 0.72** 1 0.74* 0.78** 0.689**
Correlation
Sig. (2 tailed) 0.007 0.016 0.006 0.000
N 481 481 481 481 481
LUZ Pearson 0.762** 0.74** 1 0.567 0.517
Correlation
Sig. (2 tailed) 0.000 0.016 0.66 0.78
N 481 481 481 481 481
BCR Pearson 0.77** 0.78** 0.567 1 0.69*
Correlation
Sig. (2 tailed) 0.002 0.006 0.66 0.018
N 481 481 481 481 481
CC Pearson 0.74**
0.689**
0.456** 0.445**1
Correlation
Sig. (2 tailed) 0.005 0.000 0.66 0.018
N 481 481 481 481 481
**Test is significant at the 0.01 level (2 tailed)
*Test is significant at the 0.05 level (2 tailed)
Thus land use planning regulatory instrument had 71.9% positive relationship with
economic vulnerability to disaster management. Land use zoning was also positively
related with its effects on economic vulnerability to disaster management (r = 0.762,
ρ<0.05) an indication that land use zoning had 76.2% significant positive relationship with
economic vulnerability to disaster management. Building construction restriction was
significantly associated with economic vulnerability to disaster management as shown by
(r = 0.77, ρ<0.05) implying that Building construction restriction had a 77.0% positive
relationship with economic vulnerability to disaster management. Connectivity and
250
circulation was significantly positively correlated to household disaster risk management
(r=-0.74, ρ<0.05).Therefore, Connectivity and circulation had 74.0% positive relationship
with household disaster risk management.
5.4. Multiple Liner Regression Analysis
The result of regression analysis for both linear and multiple regression analysis provides
the functions of the equation that represents the best prediction of a dependent variable
from several independent variables. This method is used when the independent variables
are correlated with one another and with the dependent variable. The following regression
equation is estimated as follow:
HDRM = α0 + β1LURI + β2LUZ + β3BCR +β4CC + ε……………………………………2
Where: HDRM: Household Disaster Risk Management
α0: Constant LUPRI: Land use planning regulatory instrument
LUZ: Land Use Zoning
BCR: Building Construction Restriction
CC: Connectivity and Circulation
ε: Error term.
Table 5.3 shows multiple regressions which is related to EVDM as dependent variable.
The Table shows the influence of independent variable LUPRI, LUZ, BCR, and CC on
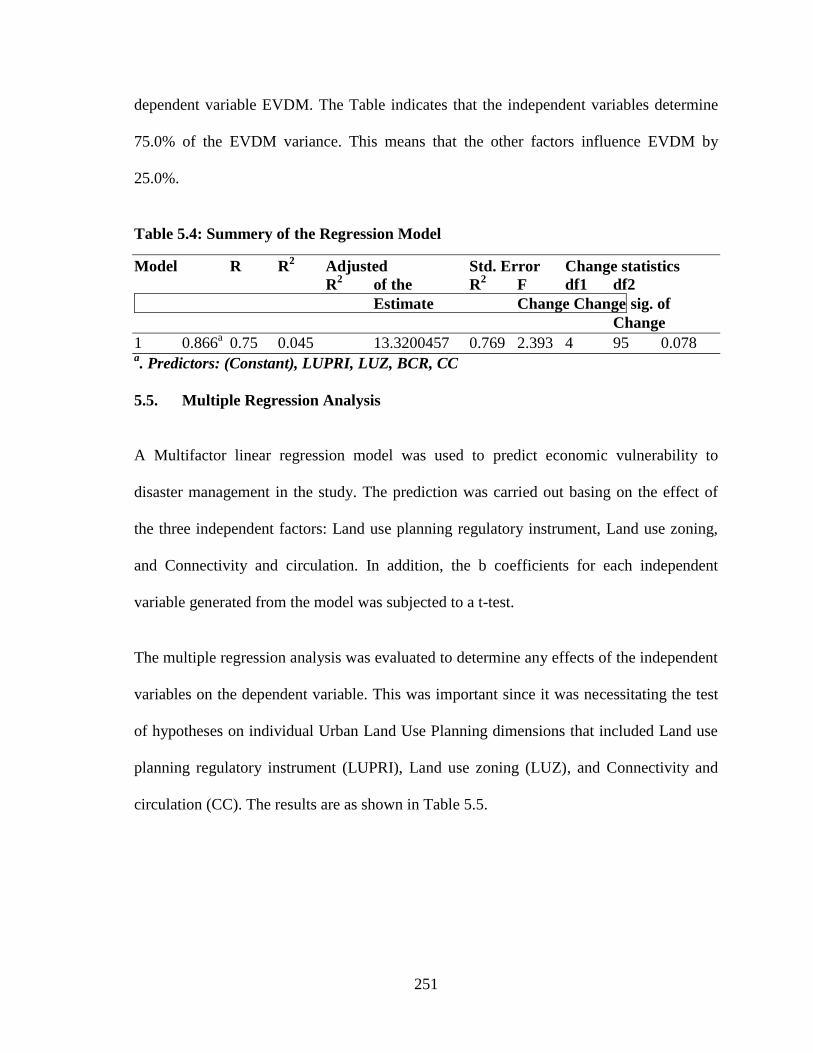
251
dependent variable EVDM. The Table indicates that the independent variables determine
75.0% of the EVDM variance. This means that the other factors influence EVDM by
25.0%.
Table 5.4: Summery of the Regression Model
Model R R2 Adjusted Std. Error Change statistics
R2 of the R
2 F df1 df2
Estimate Change Change sig. of
Change
1 0.866a 0.75 0.045 13.3200457 0.769 2.393 4 95 0.078
a. Predictors: (Constant), LUPRI, LUZ, BCR, CC
5.5. Multiple Regression Analysis
A Multifactor linear regression model was used to predict economic vulnerability to
disaster management in the study. The prediction was carried out basing on the effect of
the three independent factors: Land use planning regulatory instrument, Land use zoning,
and Connectivity and circulation. In addition, the b coefficients for each independent
variable generated from the model was subjected to a t-test.
The multiple regression analysis was evaluated to determine any effects of the independent
variables on the dependent variable. This was important since it was necessitating the test
of hypotheses on individual Urban Land Use Planning dimensions that included Land use
planning regulatory instrument (LUPRI), Land use zoning (LUZ), and Connectivity and
circulation (CC). The results are as shown in Table 5.5.
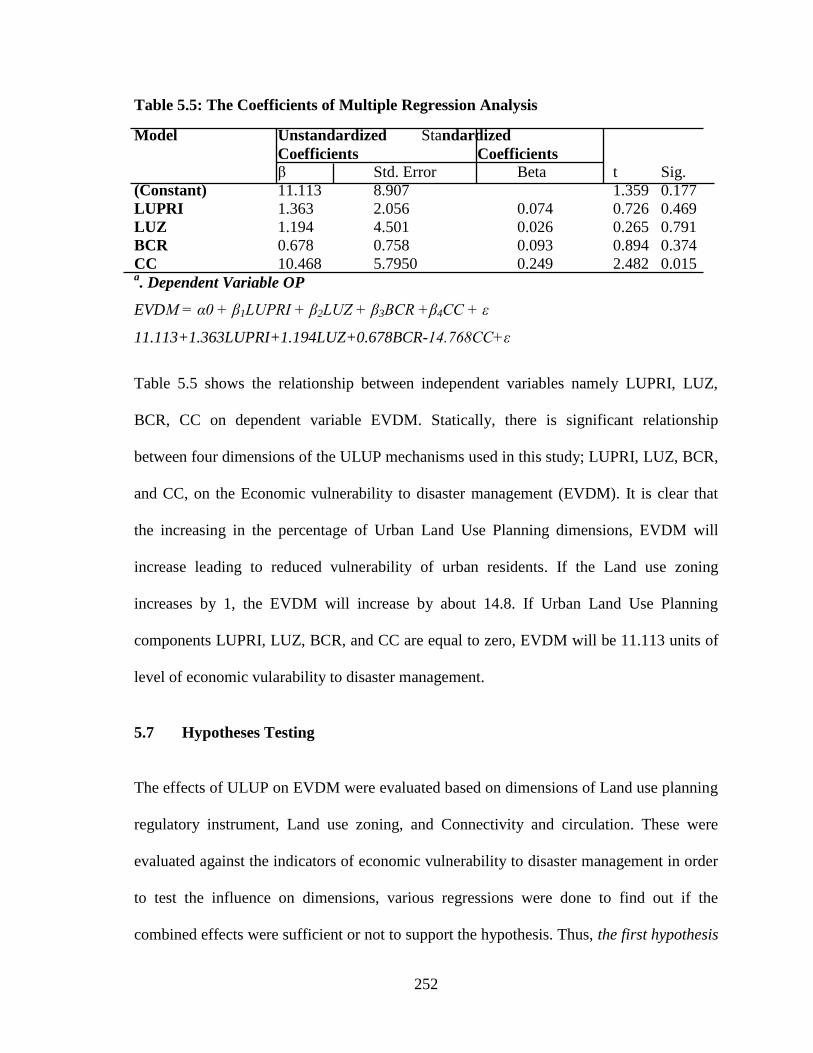
252
Table 5.5: The Coefficients of Multiple Regression Analysis
Model Unstandardized Standardized
Coefficients Coefficients
β Std. Error Beta t Sig.
(Constant) 11.113 8.907 1.359 0.177
LUPRI 1.363 2.056 0.074 0.726 0.469
LUZ 1.194 4.501 0.026 0.265 0.791
BCR 0.678 0.758 0.093 0.894 0.374
CC 10.468 5.7950 0.249 2.482 0.015 a. Dependent Variable OP
EVDM = α0 + β1LUPRI + β2LUZ + β3BCR +β4CC + ε
11.113+1.363LUPRI+1.194LUZ+0.678BCR-14.768CC+ε
Table 5.5 shows the relationship between independent variables namely LUPRI, LUZ,
BCR, CC on dependent variable EVDM. Statically, there is significant relationship
between four dimensions of the ULUP mechanisms used in this study; LUPRI, LUZ, BCR,
and CC, on the Economic vulnerability to disaster management (EVDM). It is clear that
the increasing in the percentage of Urban Land Use Planning dimensions, EVDM will
increase leading to reduced vulnerability of urban residents. If the Land use zoning
increases by 1, the EVDM will increase by about 14.8. If Urban Land Use Planning
components LUPRI, LUZ, BCR, and CC are equal to zero, EVDM will be 11.113 units of
level of economic vularability to disaster management.
5.7 Hypotheses Testing
The effects of ULUP on EVDM were evaluated based on dimensions of Land use planning
regulatory instrument, Land use zoning, and Connectivity and circulation. These were
evaluated against the indicators of economic vulnerability to disaster management in order
to test the influence on dimensions, various regressions were done to find out if the
combined effects were sufficient or not to support the hypothesis. Thus, the first hypothesis
253
(H01) stated in the null form is as follows: There is no relationship between Land use
planning regulatory instrument on economic vulnerability to disaster management.
Hypothesis one sought to establish the effects of Land use planning regulatory instrument
on economic vulnerability to disaster management. This hypothesis was tested by
regressing LUPRI on economic vulnerability to disaster management guided by the
equation: γ = β0+β1LUPRI: Where LUPRI represented Land use planning regulatory
instrument and γ denotes EVDM. The results of the regression are presented in Table 5.6
The results presented in Table 5.6 show that the effect of Land use planning regulatory
instrument on EVDM was significant positive (R= 0.784). This was an indication that
Land use planning regulatory instrument explained 78.4% (R2 =.615) of EVDM. The other
variables in the urban areas explained the remaining 21.6%.
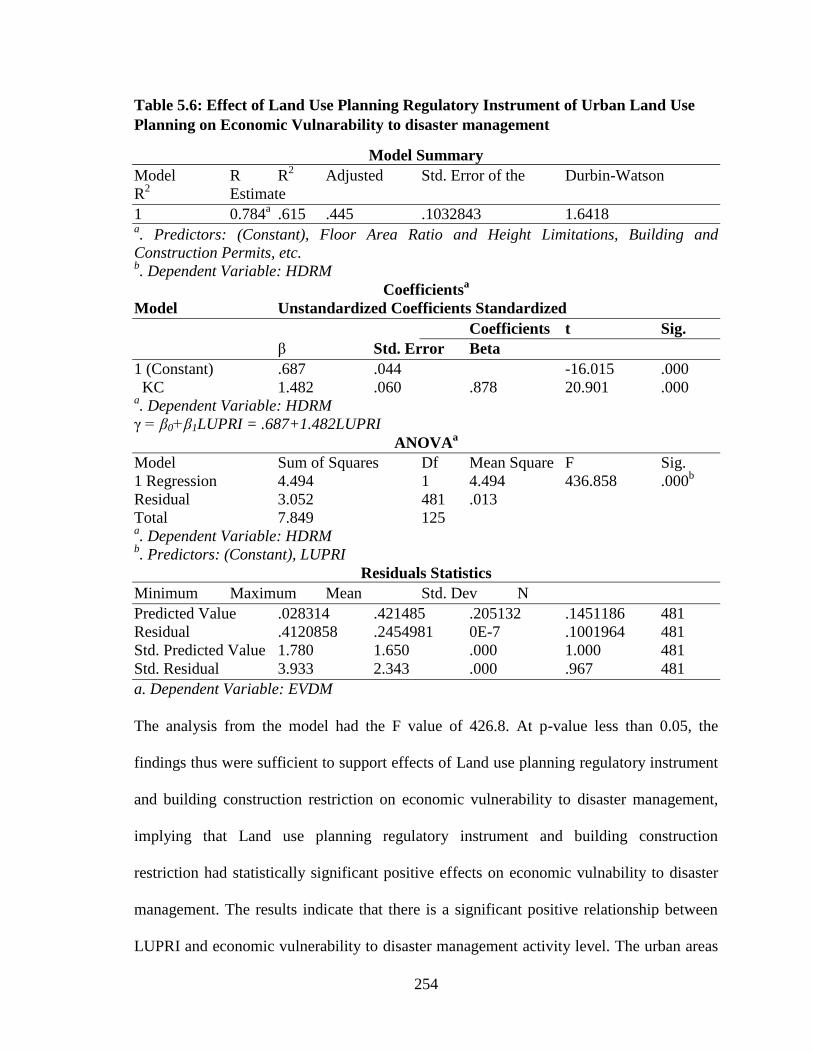
254
Table 5.6: Effect of Land Use Planning Regulatory Instrument of Urban Land Use
Planning on Economic Vulnarability to disaster management
Model Summary
Model R R2
Adjusted Std. Error of the Durbin-Watson
R2 Estimate
1 0.784a
.615 .445 .1032843 1.6418 a. Predictors: (Constant), Floor Area Ratio and Height Limitations, Building and
Construction Permits, etc. b. Dependent Variable: HDRM
Coefficientsa
Model Unstandardized Coefficients Standardized
Coefficients t Sig.
β Std. Error Beta
1 (Constant) .687 .044 -16.015 .000
KC 1.482 .060 .878 20.901 .000 a. Dependent Variable: HDRM
γ = β0+β1LUPRI = .687+1.482LUPRI
ANOVAa
Model Sum of Squares Df Mean Square F Sig.
1 Regression 4.494 1 4.494 436.858 .000b
Residual 3.052 481 .013
Total 7.849 125 a. Dependent Variable: HDRM
b. Predictors: (Constant), LUPRI
Residuals Statistics
Minimum Maximum Mean Std. Dev N
Predicted Value .028314 .421485 .205132 .1451186 481
Residual .4120858 .2454981 0E-7 .1001964 481
Std. Predicted Value 1.780 1.650 .000 1.000 481
Std. Residual 3.933 2.343 .000 .967 481
a. Dependent Variable: EVDM
The analysis from the model had the F value of 426.8. At p-value less than 0.05, the
findings thus were sufficient to support effects of Land use planning regulatory instrument
and building construction restriction on economic vulnerability to disaster management,
implying that Land use planning regulatory instrument and building construction
restriction had statistically significant positive effects on economic vulnability to disaster
management. The results indicate that there is a significant positive relationship between
LUPRI and economic vulnerability to disaster management activity level. The urban areas
255
under study with longevity of tenure creating Land use planning regulatory instrument and
building construction restriction score tended to have higher level of economic
vulnerability to disaster management. γ = β0+β1LUPRI = .687+1.249LLUPRI; if LUPRI is
zero γ will be 1.936 units level of economic vulnerability to disaster management while if
LUPRI is 10; γ will be 0.878+(1.482*10) which is equal to 13.238 showing an increasing
effect of LUPRI on EVDM. The hypothesis that there is no relationship between Land use
planning regulatory instrument on economic vulnerability to disaster management was
therefore rejected. The results were not consistent with the study conducted by Coulombel,
(2010) who reported that there is a positive relation between ownership concentration and
urban areas residents’ disaster management.
These findings are not in agreement with the findings of Shreve & Kelman, (2014) who
found out that there is a significantly positive relationship between urban land planning
component of regulatory instrument and building construction restrictions on Economic
Vulnarability to Disaster Management activity level as measured by EVDM. The results
were consistent with the study conducted by Shreve & Kelman, (2014), they argued that
specific components of urban planning management can be used by increasing buildings
sitting and space, building codes and energy, traffic calming, utilities and facilities, lot
requirement, building materials and height restrictions to ensure strict policy and procedure
observation for any structures being constructed in urban areas. This would create sanity
and minimize triggering hazard into becoming disaster risks as currently the practice.
256
CHAPTER SIX
6.0. EFFECTS OF URBAN LAND ZONING ON ECONOMIC VULNARABILITY
TO DISASTER MANAGEMENT IN LOW INCOME NEIGHBOURHOODS OF
ELDORET URBAN AREA
6.1 Introduction
The main aim of this study was to investigate the influence of urban land use planning
(land zoning) on economic vulnerability to disaster management in low income
neighbourhoods of Eldoret Urban Area.This chapter presents the results of the objective
two that was to determine the effect of urban land use zoning on economic vulnerability to
disaster management in Eldoret urban area. This component was explored by measuring its
functional, form based, intensity, incentives and hazard zoning elements. These elements
determine the productivity of land in a balanced and multiple purposes. Since land does not
increase on its size, it implies that its productivity is the factor that can be interfered with
to boost the output. Hence zoning can be useful in determining the kind of usage such as
industrial, commercial, residential zones and urban land not useful for occupying.
As indicated in Chapter three, data were collected through questionnaires and interviews.
The data collected were analyzed in Chapter four using triangulated analysis techniques.
For quantitative data, frequency distribution tables, charts were used to display and the
qualitative data, descriptive analysis method was employed. Triangulation method was
used through questionnaires, interviews and literature review to determine the similarities,
differences or corroboration in the findings.
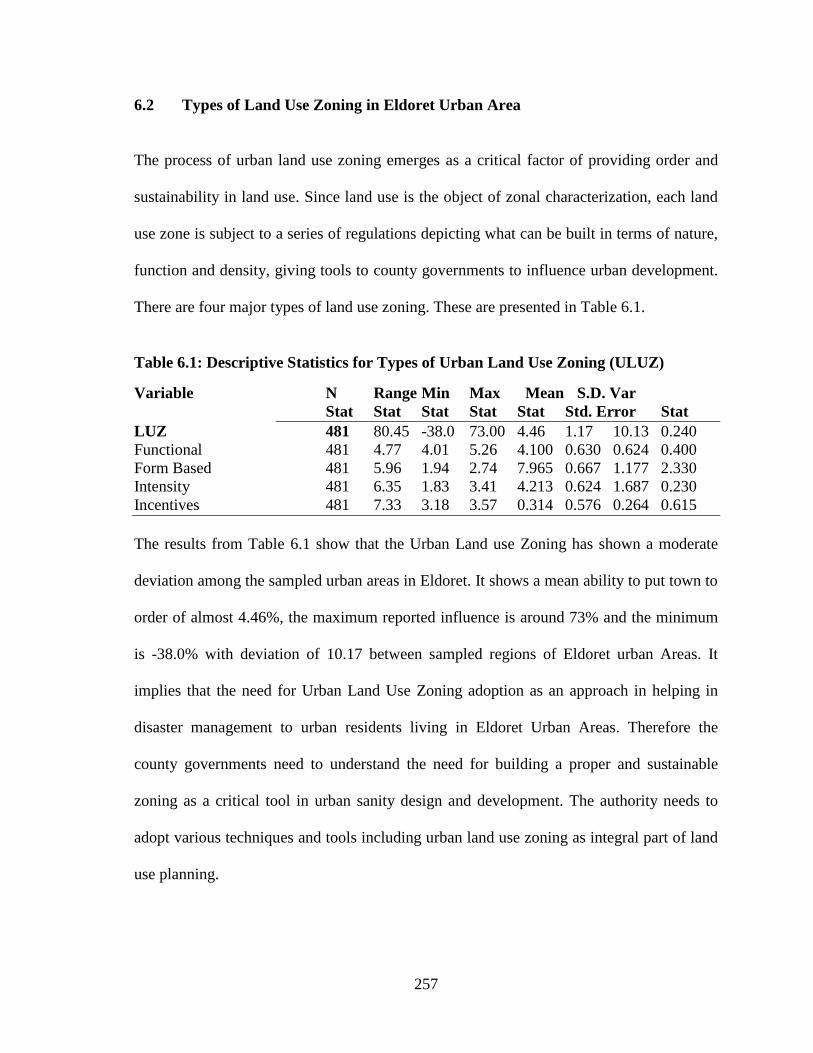
257
6.2 Types of Land Use Zoning in Eldoret Urban Area
The process of urban land use zoning emerges as a critical factor of providing order and
sustainability in land use. Since land use is the object of zonal characterization, each land
use zone is subject to a series of regulations depicting what can be built in terms of nature,
function and density, giving tools to county governments to influence urban development.
There are four major types of land use zoning. These are presented in Table 6.1.
Table 6.1: Descriptive Statistics for Types of Urban Land Use Zoning (ULUZ)
Variable N Range Min Max Mean S.D. Var
Stat Stat Stat Stat Stat Std. Error Stat
LUZ 481 80.45 -38.0 73.00 4.46 1.17 10.13 0.240
Functional 481 4.77 4.01 5.26 4.100 0.630 0.624 0.400
Form Based 481 5.96 1.94 2.74 7.965 0.667 1.177 2.330
Intensity 481 6.35 1.83 3.41 4.213 0.624 1.687 0.230
Incentives 481 7.33 3.18 3.57 0.314 0.576 0.264 0.615
The results from Table 6.1 show that the Urban Land use Zoning has shown a moderate
deviation among the sampled urban areas in Eldoret. It shows a mean ability to put town to
order of almost 4.46%, the maximum reported influence is around 73% and the minimum
is -38.0% with deviation of 10.17 between sampled regions of Eldoret urban Areas. It
implies that the need for Urban Land Use Zoning adoption as an approach in helping in
disaster management to urban residents living in Eldoret Urban Areas. Therefore the
county governments need to understand the need for building a proper and sustainable
zoning as a critical tool in urban sanity design and development. The authority needs to
adopt various techniques and tools including urban land use zoning as integral part of land
use planning.
258
The mean of the functional zoning of the Urban Land Use Zoning is 4.100, with the
maximum and minimum are 5 and 4 respectively. The functional zoning is capable in
organizing the urban land use as commercial, administrative, residential, and industrial and
green space. The functional zoning shows an experience of annual frequencies of a
maximum of five times the influence in the total degree of influence of Urban Land Use
Zoning. The mean of the functional zoning is 63.0%, which is 63.0% of influence of the
total influence of Urban Land Use Zoning on economic vulnerability to disaster
management leaving the rest 37.0% be influenced by other factors. It implies that county
governments such as Uasin Gishu in which Eldoret Urban Authority is housed need to
utilize functional zoning to facilitate the application of urban land use zoning to effective
disaster management to urban residents.
The form based zoning of the Urban Land Use Zoning shows an experience of annual
frequencies of a maximum of three times influence with a minimum of two levels of
experiences. This implies that form based zoning registered quite a small level of
influences. The mean of form based zoning influence is only 66.7%, which is 66.7% of the
orderly function in urban planning influence on economic vulnerability to disaster
management. The form based zoning classifies the land use in terms of downtown,
uptown, east side, historical zones, and manufacturing areas.
The Intensity zoning indicates an experience of annual frequencies of a maximum of four
times and a minimum of three times the level of influence. This implies that the Intensity
zoning registered quite a moderate level of influences on economic vulnerability to disaster
management. The mean of Intensity zoning is 58.1%, which implies that 58.1% of the total
259
Urban Land Use Zoning influence on economic vulnerability to disaster management. This
infers that urban land planning departments, urban land use zoning influences the
designing of high density, average density, low density and no density areas for building
infrastructure that are not disaster risk themselves. This may be the reason why most urban
areas strategically indicate the kind of housing property to be built in a certain areas. In
Kenya for example, various residential areas require specific housing in terms of height,
space, and type. Although in places like Nakuru commercial or residential properties were
not to go beyond certain height, due to the region being near the seismic core prone to
volcanicity, yet today there are many skyrocketing in the presence of this regulation.
The Incentives zoning indicates an experience of annual frequencies of a maximum of four
times and a minimum of three times the level of influence. This implies that the incentive
zoning registered quite a moderate level of influences on economic vulnerability to disaster
management process. The mean of Incentive zoning is 57.6%, which implies that 57.6% of
the total Urban Land Use Zoning influence on economic vulnerability to disaster
management. This infers that urban land planning departments, urban land use zoning
influences the designing of incentives such as Export processing Zones, Konza City, and
Africa Economic Zone in Uasin Gishu, Plateau Business Parks in Uasin Gishu, and
Commercial Parks and extra. These results concur with the finding of Gosnell, et al.,
(2011) and Enermark, (2012) whose studies identified the same factors to have contributed
to challenging strategy implementation in urban planning departments in different
countries globally.
260
6.3 Urban Land Use Zoning Influence
The study also sought to find out the level of urban land use zoning influence from the
urban resident respondents. There are several types of zoning codes in use today and
combinations thereof. It is sometimes difficult to distinguish between the types of codes
and their respective formats or techniques. However, this study made use of functional
zoning, form based zoning, intensity zoning and incentive zoning under which there are
other sub elements. Urban land use zoning is considered to be useful in the following
areas: stabilizing and increasing property values, particularly residential properties;
relieving and checking congestion in the streets and neighborhoods; increasing safety and
enhancing security and administration of security services in buildings and residential
neighborhoods; making business more efficient by ensuring there is order, and making life
healthier by increasing the quality and aesthetic values of a locality, neighborhoods, city or
town. Ten items were identified and measured on a 4-Likert scale of agree and disagree.
The results are as shown in Table 6.2.
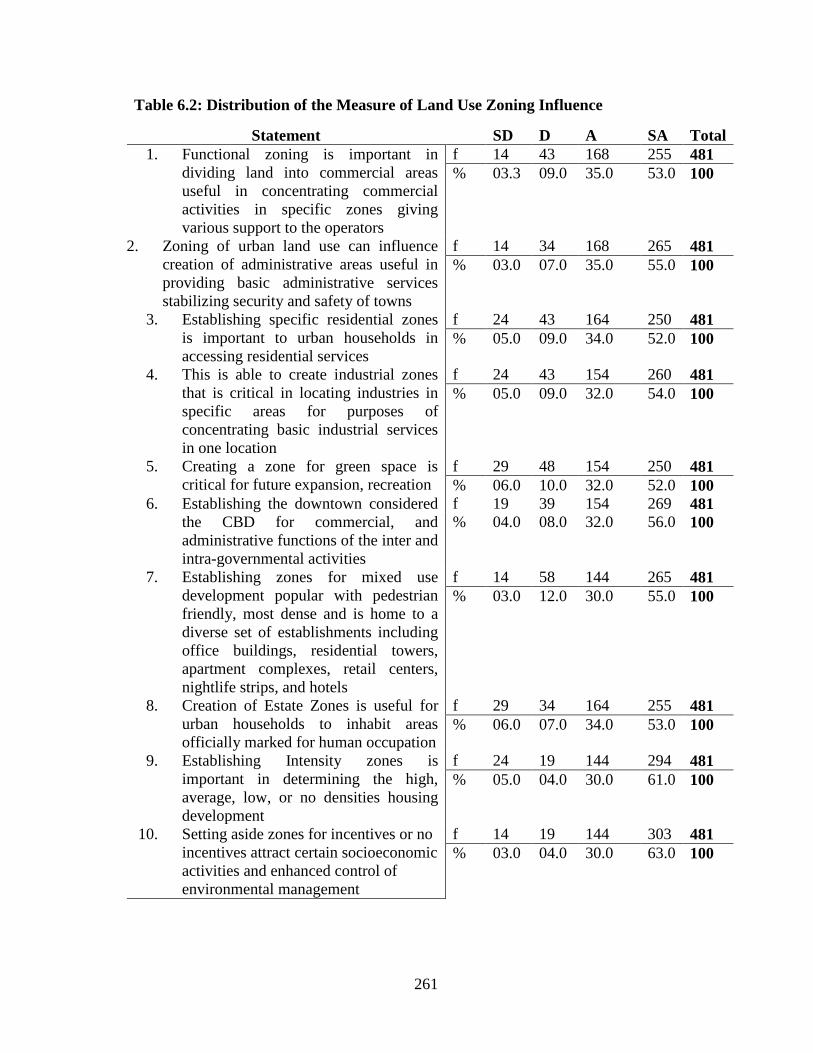
261
Table 6.2: Distribution of the Measure of Land Use Zoning Influence
Statement SD D A SA Total
1. Functional zoning is important in
dividing land into commercial areas
useful in concentrating commercial
activities in specific zones giving
various support to the operators
f 14 43 168 255 481
% 03.3 09.0 35.0 53.0 100
2. Zoning of urban land use can influence
creation of administrative areas useful in
providing basic administrative services
stabilizing security and safety of towns
f 14 34 168 265 481
% 03.0 07.0 35.0 55.0 100
3. Establishing specific residential zones
is important to urban households in
accessing residential services
f 24 43 164 250 481
% 05.0 09.0 34.0 52.0 100
4. This is able to create industrial zones
that is critical in locating industries in
specific areas for purposes of
concentrating basic industrial services
in one location
f 24 43 154 260 481
% 05.0 09.0 32.0 54.0 100
5. Creating a zone for green space is
critical for future expansion, recreation
f 29 48 154 250 481
% 06.0 10.0 32.0 52.0 100 6. Establishing the downtown considered
the CBD for commercial, and
administrative functions of the inter and
intra-governmental activities
f 19 39 154 269 481 % 04.0 08.0 32.0 56.0 100
7. Establishing zones for mixed use
development popular with pedestrian
friendly, most dense and is home to a
diverse set of establishments including
office buildings, residential towers,
apartment complexes, retail centers,
nightlife strips, and hotels
f 14 58 144 265 481
% 03.0 12.0 30.0 55.0 100
8. Creation of Estate Zones is useful for
urban households to inhabit areas
officially marked for human occupation
f 29 34 164 255 481
% 06.0 07.0 34.0 53.0 100
9. Establishing Intensity zones is
important in determining the high,
average, low, or no densities housing
development
f 24 19 144 294 481
% 05.0 04.0 30.0 61.0 100
10. Setting aside zones for incentives or no
incentives attract certain socioeconomic
activities and enhanced control of
environmental management
f 14 19 144 303 481
% 03.0 04.0 30.0 63.0 100
262
The results in Table 6.2 show that strongly agree accounted for 255 (53.0%), agree 168
(35.0%) disagree accounted for 43 (09.0%), and strongly disagree 14 (03.0%). This is an
indication that majority of the participants approved the statement that functional zoning is
important in dividing land into commercial areas useful in concentrating commercial
activities in specific zones giving various support to the operators.
In relations to zoning of urban land use can influence creation of administrative areas
useful in providing basic administrative services stabilizing security and safety of towns,
the results show that strongly agree accounted for 265 (55.0%), agree 168 (35.0%),
disagree accounted for 34 (07.0%), and strongly disagree 14 (03.0%). This is an indication
that majority of the respondents strongly agreed that zoning of urban land use can
influence creation of administrative areas useful in providing basic administrative services
stabilizing security and safety of towns.
At the same time, these results show that strongly agree accounted for 250 (52.0%), agree
164 (34.0%), disagree accounted for (09.0%), and strongly disagree 24 (05.0%). This is an
indication that majority of the participants also agreed that establishing specific residential
zones is important to urban residents in accessing residential services.
Moreover, from the results in Table 6.3, one realizes that strongly agree accounted for 260
(54.0%), agree 154 (32.0%),), disagree accounted for 43 (09.0%), and strongly disagree 24
(05.0%) with the statement that zoning able to create industrial zones that is critical in
locating industries in specific areas for purposes of concentrating basic industrial services
in one location. This implies that majority of participants approved the statement that
263
zoning are able to create industrial zones that is critical in locating industries in specific
areas for purposes of concentrating basic industrial services in one location.
Also participants with opinion of strongly agree accounted for 250 (52.7%), agree 154
(32.0%), disagree accounted for 48 (10.0%), and strongly disagree 29 (06.0%) with the
statement that zoning enhance creation of zones for green space is critical for future
expansion, recreation. This implies that majority of participants agreed with the statement
that zoning enhance creation of zones for green space is critical for future expansion,
recreation.
Again these results reveal that strongly agree accounted for 269 (56.0%), agree 154
(32.0%), disagree 39 (08.0%), and strongly disagree 19 (04.0%) on the statement that
establishing the downtown considered the CBD for commercial, and administrative
functions of inter and intra-governmental activities. This implies that majority of
participants agreed with the statement that establishing the downtown considered the CBD
for commercial, and administrative functions of inter and intra-governmental activities.
In relation to establishing zones for (uptowns) mixed use development popular with
pedestrian friendly, most dense and is home to a diverse set of establishments including
office buildings, residential towers, apartment complexes, retail centers, nightlife strips,
and hotels, the results in Table 6.2 show that strongly agree accounted for 265 (55.7%),
agree 144 (30.0%), disagree 58 (12.0%), and strongly disagree 14 (03.0%). This implies
that majority of participants were strongly of the opinion that establishing zones for mixed
use development popular with pedestrian friendly, most dense and is home to a diverse set
264
of establishments including office buildings, residential towers, apartment complexes,
retail centers, nightlife strips, and hotels.
Furthermore, the results in Table 6.3 indicate that strongly agree accounted for 255
(53.0%), agree 164 (34.0%), disagree 34 (07.0%), and strongly disagree 29 (06.0%) on the
opinion that creation of estate zones is useful for urban residents to inhabit areas officially
marked for human occupation. This implies that majority of participants agreed with the
statement that creation of estate zones is useful for urban residents to inhabit areas
officially marked for human occupation.
In addition to that, the results in Table 6.2 indicate that strongly agree accounted for 294
(61.0%), agree 144 (30.0%), disagree 19 (04.0%), and strongly disagree 24 (05.0%) on the
opinion that establishing Intensity zones is important in determining the high, average,
low, or no densities housing development. This infers that majority of participants agreed
with the statement that establishing Intensity zones is important in determining the high,
average, low, or no densities housing development.
Finally the results in Table 6.3 indicate that strongly agree accounted for 303 (63.0%),
agree 144 (30.0%), disagree 19 (04.0%), and strongly disagree 14 (03.0%) on the opinion
that indicate that setting aside zones for incentives or no incentives attract certain
socioeconomic activities and enhanced control of environmental management. This infers
that majority of participants agreed with the statement that indicates that setting aside
zones for incentives or no incentives attract certain socioeconomic activities and enhanced
control of environmental management.
265
This would enhance the urban residents determining their multiple uses and diversified
socioeconomic activities. This would enhance livelihood stability and sustainability hence
making the urban residents able to minimize their vulnerability to socioeconomic and
environmental disaster risks. Zoning would result in restoring residential density associated
affecting downtown zones, address a zoning and land use inconsistency that would allow
the urban residents plan land use density match the higher density allowed in the former
zoning since Kenya is modernizing, the pervious colonial planned urban system would not
work today, establish an urban household plan implementation overlay zone for the largely
residential areas within suburban areas and its neighborhoods that and its neighborhoods’
that would trigger discretionary review for development exceeding 30 feet in height.
Thus urban land use zoning would enhance planning where different users are able to
access particular zone for specific activities. These results are in agreement with the
findings of Twigg, (2015); Gunjal, (2016); Freire, Maria, Lall, and Leipziger, (2014) and
Gaube, and Remesch, (2013) that zoning is important in organizing urban land space in
multipurpose uses such as sub division and specific area plans, neighborhoods design,
heritage preservation, growth and service boundaries and natural hazards zoning enhancing
equitable and adequate distributions.
Land use zoning will thus ensure that density bonuses allow developers to build more
densely than normally permitted in exchange for providing a public good, such as
affordable housing. This zoning tool achieves two things: developers can build additional
units, increasing potential profit, and loosely populated areas become denser. For example,
instead of building a single-family home on a large plot, a developer would be incentivized
266
to build multiple affordable condominiums a project that would not otherwise be legal.
Density zoning is similar to incentive zoning because it makes exceptions to density
regulations in exchange for some public benefit.
6.4. Results of Correlation Analysis
To test the effect of LUZ on Economic Vulnability to Disaster Management components,
various regressions were done to find out if the combined effects were significant or not to
support the hypotheses. This resulted in the second hypothesis (H02) stated that there is no
relationship: The Effect of Land Use Zoning on Economic Vulnarability to Disaster
Management. Hypothesis two sought to establish the relationship between Urban Land
Zoning dimensions of Urban Land Use Planning on Economic Vulnarability to Disaster
Management. This hypothesis was tested by regressing Land Use Zoning on Economic
Vulnarability to Disaster Risk Management guided by the equation γ= β0+β1LUZ Where
LUZ represented Land Use Zoning and γ denoted Economic Vulnarability to Disaster
Management measures. The results of the regression are presented in Table 6.3.
The results from Table 6.3 are observation that there is a significant positive relationship
between Land Use Zoning and Economic Vulnarabibility to Disaster Management Activity
level (R=.842). This was an indication that Land Use Zoning explained 70.9% (R2= .709)
of Economic Vulnarability to Disaster Management. The other variables affecting
Economic Vulnarability to Disaster Management explained by the remaining 29.1%. The
analysis from the model had the F value of 5.4873 at p-value <0.05, the findings were
sufficient to support the relationship between Land Use Zoning and Economic Vulnability
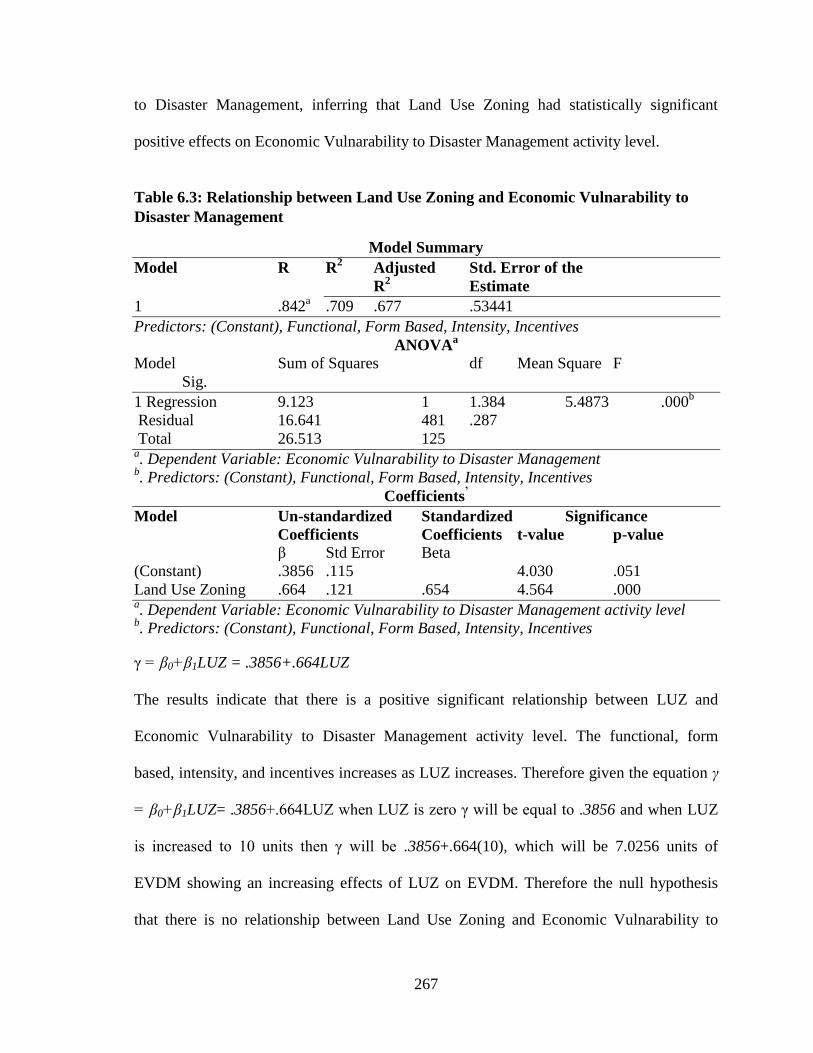
267
to Disaster Management, inferring that Land Use Zoning had statistically significant
positive effects on Economic Vulnarability to Disaster Management activity level.
Table 6.3: Relationship between Land Use Zoning and Economic Vulnarability to
Disaster Management
Model Summary
Model R R2
Adjusted Std. Error of the
R2 Estimate
1 .842a .709 .677 .53441
Predictors: (Constant), Functional, Form Based, Intensity, Incentives
ANOVAa
Model Sum of Squares df Mean Square F
Sig.
1 Regression 9.123 1 1.384 5.4873 .000b
Residual 16.641 481 .287
Total 26.513 125 a. Dependent Variable: Economic Vulnarability to Disaster Management
b. Predictors: (Constant), Functional, Form Based, Intensity, Incentives
Coefficients’
Model Un-standardized Standardized Significance
Coefficients Coefficients t-value p-value
β Std Error Beta
(Constant) .3856 .115 4.030 .051
Land Use Zoning .664 .121 .654 4.564 .000 a. Dependent Variable: Economic Vulnarability to Disaster Management activity level
b. Predictors: (Constant), Functional, Form Based, Intensity, Incentives
γ = β0+β1LUZ = .3856+.664LUZ
The results indicate that there is a positive significant relationship between LUZ and
Economic Vulnarability to Disaster Management activity level. The functional, form
based, intensity, and incentives increases as LUZ increases. Therefore given the equation γ
= β0+β1LUZ= .3856+.664LUZ when LUZ is zero γ will be equal to .3856 and when LUZ
is increased to 10 units then γ will be .3856+.664(10), which will be 7.0256 units of
EVDM showing an increasing effects of LUZ on EVDM. Therefore the null hypothesis
that there is no relationship between Land Use Zoning and Economic Vulnarability to
268
Disaster Management is rejected. Although in the literature there are varied results but this
finding concurs with the finding of Smolka, (2014) who found that urban areas with larger
boards that are weak, LUZ tend to have higher desire for improved Economic
Vulnarability to Disaster Management, which could be to help deal with vulnerability and
resilience problem of urban households. They found out that Land Use Zoning as a
dimension of Land Use Planning which is more entrenched due to socioeconomic values
that can be realized from applying land use planning to bring stability and sustainability in
urban areas in Eldoret and any other city in the world.
In summary, it infers that household’s lives, livelihoods, andwellbeing are at risk either
directly or indirectly from the destructive effects of a hazard.Their incomes and livelihoods
are at risk because movement, access and utilization oftheir productive assetsare restricted
where there is no land use zoning. Each typeof hazard puts somehow a different set of
elements at risk due to their vulnerability. Therefore, land use zoning could be a useful tool
used to reducing such vulnerability. To this end, development planners need to identify
elements that are mostat risk from the principal hazards, which have been identified
(UNDP, 1991). In the Eldoret Town case, elements at risk comprise people’s life and
wellbeing, employment, housing mobility, environmental concerns, local systems and
social structures, coping strategies.
269
CHAPTER SEVEN
7.0 EFFECTS OF LAND USE TRANSIT CIRCULATION AND
CONNECTIVITY ON ECONOMIC VULNARABILITY TO DISASTER
MANAGEMENT IN LOW INCOME NEIGHBOURHOODS OF ELDORET
URBAN AREA
7.1 Introduction
This chapter presents the final objective of the study. This objective intended to establish
the effects of Land Use Transit Circulation and Connectivity on Economic Vulnarability to
Disaster Management in Low Income Neighbourhoods of Eldoret Urban Area. The
circulation system is the backbone of the urban areas, supporting the economy and serving
and influencing land use patterns in a positive way. Eldoret town is growing and
automobile is the primary mode of transportation. The automobile will continue as the
primary mode of transportation, but there is an increasing emphasis on alternatives to the
personal automobile for transportation, such as public transit, bicycling, motorcycle and
walking.
This element is a guide for planning and implementing alternative modes of travel to
afford greater accessibility for residents and visitors, mitigate congestions and pollution,
and support a more efficient and sustainable land use pattern in Eldoret Urban Area.
Transition to a more complete multi-modal transportation system requires an integrated
land use and transportation planning approach that support land use pattern with
concentrated mixed-use linkages to neighborhoods’. Transportation access is the heart of a
270
successful mixed-use development pattern, where more intense growth occurs around
major roadways and transit facilities.
7.2 Circulation and Connectivity
This focuses in ensuring that regional connections and roadways, pedestrians & bicycle
circulation, transit and circulation plan are well calculated designed and developed. This
makes it possible for movement in and outside cities. Lack of circulation and connectivity
can be cited as critical to access to and outside disaster scenes.
7.3 Elements of Circulation and Connectivity
The results in descriptive statistics are displayed in Table 7.1 with variables reflecting
influence of elements of Circulation and Connectivity.
Table 6.4: Descriptive Statistics for Elements of Circulation and Connectivity
Variable N Range Min Max Mean S.D. Var
Stat Stat Stat Stat Stat Std. Error Stat Stat
CC 481 96.11 -56.0 73.00 4.983 1.121 14.44 0.121 Street Sections 481 4.84 3.00 5.00 4.510 0.533 0.541 0.580
Bicycle Accommodation481 6.11 4.16 6.40 6.025 0.576 1.451 2.740
Transit Accommodation481 6.01 4.54 6.60 6.015 0.536 1.451 2.578
Accessibility 481 6.12 4.16 6.54 6.045 0.587 1.451 2.760
Connectivity Index 481 6.32 4.57 6.55 6.505 0.616 1.451 2.960
Traffic Calming 481 6.41 4.58 6.53 6.325 0.567 1.451 2.780
Parking Standards
and Design 481 5.13 2.18 6.77 0.450 0.534 0.531 0.642
The results from Table 7.1.show that the circulation and connectivity has shown a large
deviation of 14.44% among the sampled household. It shows a mean influence of almost
4.983%, the maximum reported influence is 73.0% and the minimum is -56.0% with
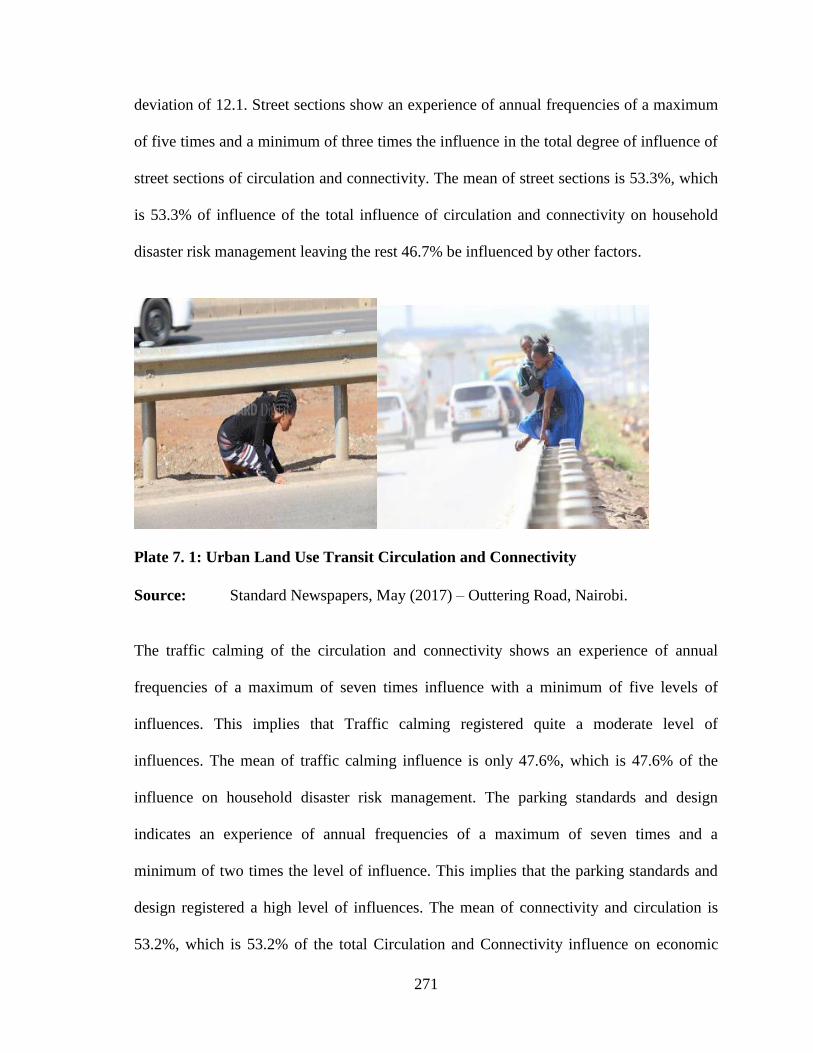
271
deviation of 12.1. Street sections show an experience of annual frequencies of a maximum
of five times and a minimum of three times the influence in the total degree of influence of
street sections of circulation and connectivity. The mean of street sections is 53.3%, which
is 53.3% of influence of the total influence of circulation and connectivity on household
disaster risk management leaving the rest 46.7% be influenced by other factors.
Plate 7. 1: Urban Land Use Transit Circulation and Connectivity
Source: Standard Newspapers, May (2017) – Outtering Road, Nairobi.
The traffic calming of the circulation and connectivity shows an experience of annual
frequencies of a maximum of seven times influence with a minimum of five levels of
influences. This implies that Traffic calming registered quite a moderate level of
influences. The mean of traffic calming influence is only 47.6%, which is 47.6% of the
influence on household disaster risk management. The parking standards and design
indicates an experience of annual frequencies of a maximum of seven times and a
minimum of two times the level of influence. This implies that the parking standards and
design registered a high level of influences. The mean of connectivity and circulation is
53.2%, which is 53.2% of the total Circulation and Connectivity influence on economic
272
vulnerability to disaster management. These results concur with the findings of Saunders,
and Becker, (2015) that Lack of circulation and connectivity can be cited as critical to
access to and outside disaster scenes. This can lead to more property destructions and more
lives lost. It also helps in access to market and business centers as well as industrial areas
for job-related activities. In some places, difficulties of circulation and connectivity cause
households to move to and from work places on foot slowing down economic activities
movement.
7.3. Results of Regression Analysis
The effects of Connectivity and Circulation were evaluated based on key dimensions that
included: street sections, bicycle accommodation, transit accommodation, accessibility,
connectivity index, traffic calming, and parking standards and design. These were
evaluated against the indicators of Economic Vulnarability to Disaster Management. To
test the effect of ULUP on EVDM components, various regressions were done to find out
if the combined effects were significant or not to support the hypothesis. This resulted in
the thirdhypothesis (H03) stated that there is no relationship between Connectivity and
Circulation (CC) and Economic Vulnarability to Disaster Management (EVDM). Third
hypothesis sought to establish the relationship between Connectivity and Circulation and
Economic Vulnarability to Disaster Management. This hypothesis was tested by regressing
Connectivity and Circulation (CC) and Economic Vulnarability to Disaster Management
guided by the equation γ= β0+β1CC where CC represented Connectivity and Circulation
(CC) and γ denoted Household Disaster Risk Management. The results of the regression
are presented in Table 7.2.
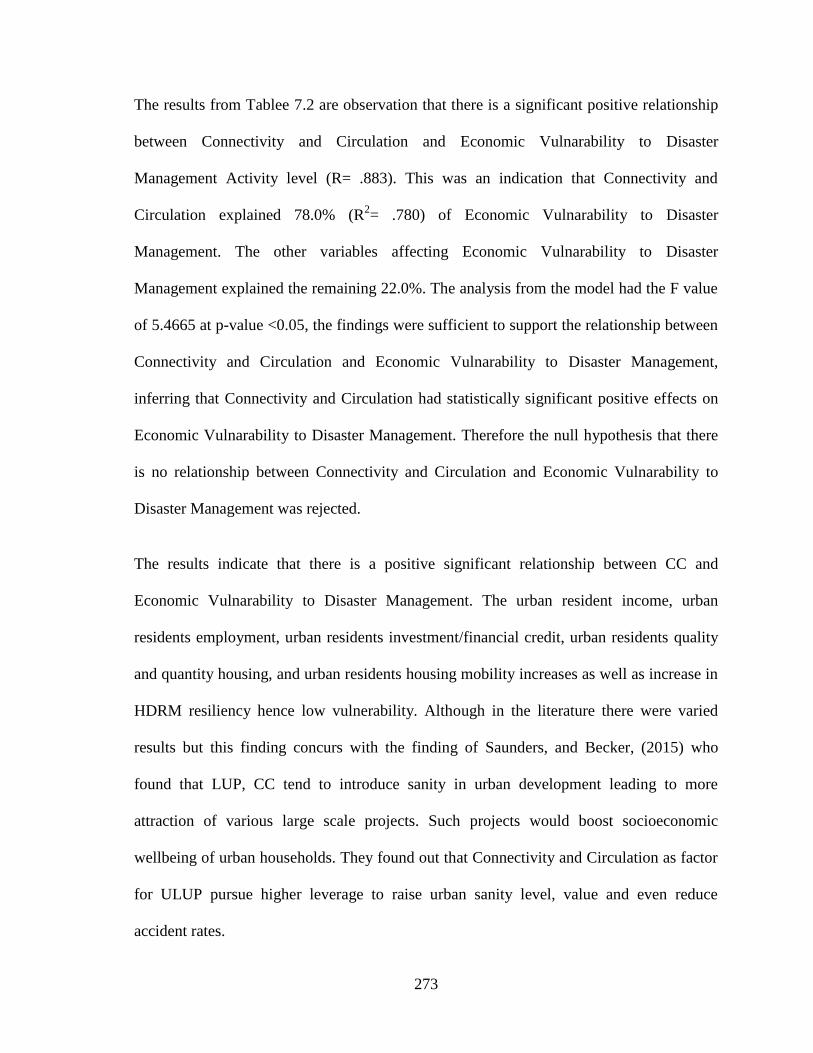
273
The results from Tablee 7.2 are observation that there is a significant positive relationship
between Connectivity and Circulation and Economic Vulnarability to Disaster
Management Activity level (R= .883). This was an indication that Connectivity and
Circulation explained 78.0% (R2= .780) of Economic Vulnarability to Disaster
Management. The other variables affecting Economic Vulnarability to Disaster
Management explained the remaining 22.0%. The analysis from the model had the F value
of 5.4665 at p-value <0.05, the findings were sufficient to support the relationship between
Connectivity and Circulation and Economic Vulnarability to Disaster Management,
inferring that Connectivity and Circulation had statistically significant positive effects on
Economic Vulnarability to Disaster Management. Therefore the null hypothesis that there
is no relationship between Connectivity and Circulation and Economic Vulnarability to
Disaster Management was rejected.
The results indicate that there is a positive significant relationship between CC and
Economic Vulnarability to Disaster Management. The urban resident income, urban
residents employment, urban residents investment/financial credit, urban residents quality
and quantity housing, and urban residents housing mobility increases as well as increase in
HDRM resiliency hence low vulnerability. Although in the literature there were varied
results but this finding concurs with the finding of Saunders, and Becker, (2015) who
found that LUP, CC tend to introduce sanity in urban development leading to more
attraction of various large scale projects. Such projects would boost socioeconomic
wellbeing of urban households. They found out that Connectivity and Circulation as factor
for ULUP pursue higher leverage to raise urban sanity level, value and even reduce
accident rates.
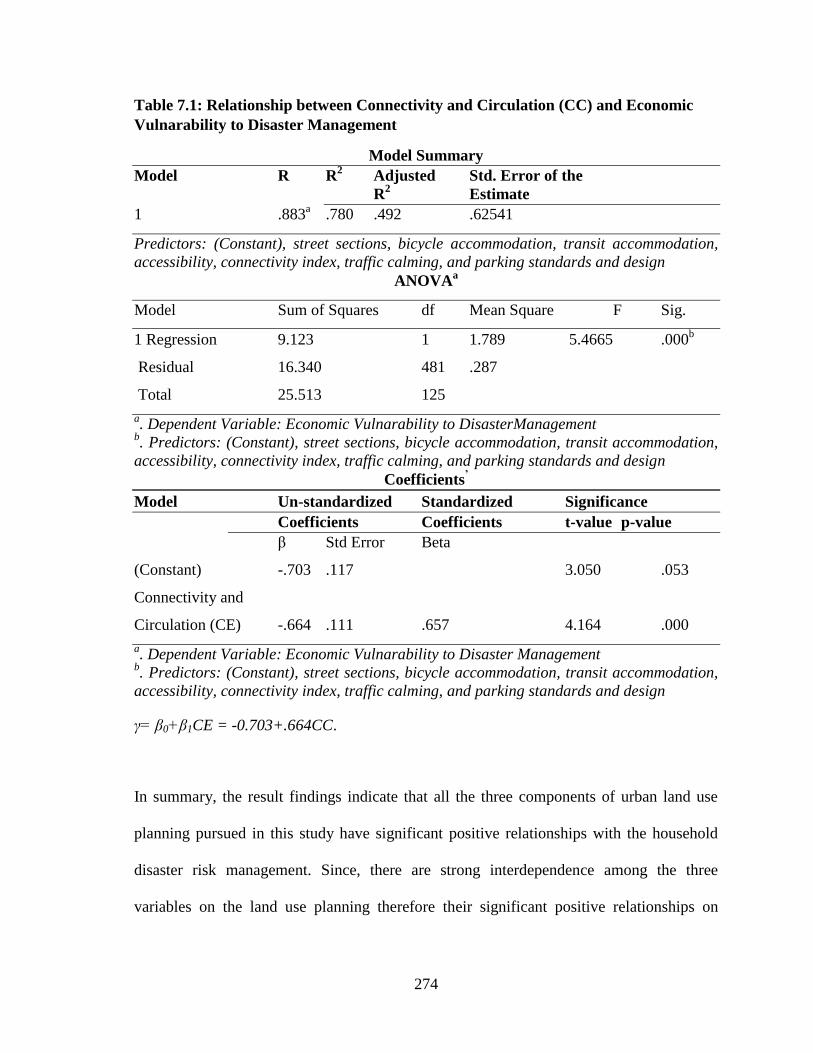
274
Table 7.1: Relationship between Connectivity and Circulation (CC) and Economic
Vulnarability to Disaster Management
Model Summary
Model R R2
Adjusted Std. Error of the
R2 Estimate
1 .883a .780 .492 .62541
Predictors: (Constant), street sections, bicycle accommodation, transit accommodation,
accessibility, connectivity index, traffic calming, and parking standards and design
ANOVAa
Model Sum of Squares df Mean Square F Sig.
1 Regression 9.123 1 1.789 5.4665 .000b
Residual 16.340 481 .287
Total 25.513 125
a. Dependent Variable: Economic Vulnarability to DisasterManagement
b. Predictors: (Constant), street sections, bicycle accommodation, transit accommodation,
accessibility, connectivity index, traffic calming, and parking standards and design
Coefficients’
Model Un-standardized Standardized Significance
Coefficients Coefficients t-value p-value
β Std Error Beta
(Constant) -.703 .117 3.050 .053
Connectivity and
Circulation (CE) -.664 .111 .657 4.164 .000
a. Dependent Variable: Economic Vulnarability to Disaster Management
b. Predictors: (Constant), street sections, bicycle accommodation, transit accommodation,
accessibility, connectivity index, traffic calming, and parking standards and design
γ= β0+β1CE = -0.703+.664CC.
In summary, the result findings indicate that all the three components of urban land use
planning pursued in this study have significant positive relationships with the household
disaster risk management. Since, there are strong interdependence among the three
variables on the land use planning therefore their significant positive relationships on

275
household disaster risk management are indicators that urban land use planning has a
significant positive relationship with the household disaster risk management.
Therefore the process of creating vulnerability profile of Transit, Connectivity and
Circulation factors such as road accidents due to the sharing of narrow roads and
highways, can be dealt with using Transit, Connectivity and Circulation components of
urban land use planning. This could be useful in areas such as social, structural,
environmental andeconomic planning. The benefits of this could be improved accessibility
to neighbourhoods, increased investments and attracting more job opportunities in one
area. This could be critical to the local households who need sustainable sources of
employment opportunities.
276
C HAPTER EIGHT
SUMMARY, CONCLUSIONS, AND RECOMMENDATIONS
8.1 Introduction
This chapter presents summary of discussions, draws conclusions of key findings of this
study and further gives recommendations objective by objective.
8.2 Summary of the Findings
The study found out that majority of urban resident respondents were female members
accounting for 257 (53.6%); with Langas having the largest portion; those who were
married were also the majority accounting for 393 (81.7%); while those aged 31-40 years
old also accounted for the majority representing 230 (47.8%); secondary level of education
were the majority accounting for 194 (40.3%); in terms of urban residents size, those with
1-4 children 219 (45.5%) were the majority, children accounted for 201 (41.8%);
neighbourhoods with father as the urban residents head were the majority with 409
(85.0%).
It was also found out that majority of the respondents 265 (55.0%) stated that there was
slight presence of urban resident Income (NRI); majority 168 (35.0%) of the sampled
respondents stated that there was slight prevalence of Urban Resident Employment (URE);
it was also found out that majority 192 (40.0%) of the sampled participants strongly agreed
that there were slightly some level of urban resident investment and financial credit, 47%
of respondents also agreed that there was some level of housing quality and quantity and
277
housing mobility. The findings indicated that owing to the poor degree of presence of
disaster income dimensions, the sampled urban residents were highly vulnerable as they
were exposed to high risks since all the dimensions of dependent variables point at
unstable level of each dimension.
In terms of awareness and preparedness, 394 (82.0%) of respondents lacked awareness on
disaster risk prevention and preparedness while 259 (54.0%) of respondents indicated that
they had been exposed to disaster previously; 331 (69.0%) of the respondents had never
taken any disaster risk management related training; 374 (78.0%) of respondents did not
have warning systems in their houses, 302 (63.0%) of respondents did not have any
knowledge of disaster management while those who experienced disaster for more than 7
days had high chances of being aware and prepared. 312 (65.0%) of respondents lacked the
basic neighbourhood resident measures for disaster preparedness. The findings indicated
that 177 (36.8%) of the respondents owned 0.125 points of an acre and this was for
residential use which was also a majority 251 (52.2%) respondents. Likewise the findings
indicated that 229 (47.6%) of respondents experienced inadequate socioeconomic services
from their neighborhoods’.
It was also found out that respondents aged ≥61 years were nearly six times more likely to
have protection and preparedness compared with those aged below 30 years (AOR=2.62;
95% confidence interval (CI): 1.6, 6.7). The odds of having protection and preparedness
among respondents who had university level of education were found to be higher
compared with household respondents with no education (AOR=28.1; 95% CI: 8.15, 59.1).
Income was also found to be statistically significant with neighbourhood residents’ disaster
278
risk protection and preparedness. Neighbourhood residents having monthly income
Kshs.>21,000/- were nearly 27.4 times prepared compared with those who had
Kshs.≤5,000/- (2.27, 19.7 (AOR=6.7; 95% CI: 2.27, 19.7). The odds of being prepared for
disaster risk among those having warning system in the urban residents were higher than
those who did not have (AOR=5.4; 95% CI: 2.4, 12.3). Respondents having knowledge on
household preparedness were more likely to be prepared compared with less
knowledgeable lot requirements (AOR=8.92; 95% CI: 1.67, 47.6). The odds of being
prepared among those who had prior exposure were higher compared to those with no such
exposure (AOR=32.67; 95% CI: 6.2, 67.4). The odds of urban residents preparedness were
two times higher among those experiencing >7 days of disaster risk compared with those
experiencing ≤7 day’s duration of disaster risk (AOR=2.5; 95% CI: 1.14, 5.6). It was also
found out that 224 (46.6%) of respondents pay less than Kshs.5,000/- monthly rent, which
points to the low purchasing power among these respondents.
8.3. Influence of Urban Land Use Planning Regulatory Instruments on Economic
Vulnarabity to Disaster Management in Low Income Neighbourhoods of Eldoret
Urban Area
The findings indicated that land use planning regulatory instruments with all its 8
dimensional items have combined influence of 69.0% over economic vulnarabity to
disaster management. The findings indicated that floor area ratio and height limitations and
construction and building standards accounted for higher level of influence of 73.2% and
84.8% respectively on economic vulnerability to disaster management. Other dimensions
were equally influential but at a lower level.

279
This would be useful in disaster management that permits, compliance and conformity to
the regulations, rights and laws are observed before a permit is issued hence buildings
would be constructed to the required standards hence their rampant collapsing would be
avoided. This would influence urban residents to pursue access to agricultural land and
carry out socioeconomic activities that would enable them have some employment and
sources of income, that later would enhance their wealth commutation hence improve their
capability and coping ability to deal with disasters when they occur.
It was found out that majority of respondents 188 (39.0%) strongly agree that establishing
an invaluable floor area ratio and height limitations ensures that buildings were constructed
in a standard form and format in specific areas; the next findings was that 202 (42.0%),
strongly agree that providing building and construction permits for approval for conformity
and compliance control to the rules and laws. Likewise on the green space protection, it
was found out that 188 (39.0%), strongly agree that ensuring that open and green space
protection is achieved and maintained. At the same time, the regulatory instrument
dimension of agricultural land conservation, the findings indicated that 236 (49.0%),
strongly agree that agricultural land conservation is important to urban residents
socioeconomic service access.
In addition to that, it was found out that majority 168 (35.0%) of respondents agree that
participants having invaluable skills to maintain construction and building standards so that
quality and quantity is maintained for particular zones. Likewise, study found out that
majority 178 (37.0%) of respondents agree that regulatory instruments were useful in
represents enforcement of property rights. Finally the findings showed that majority178

280
(37.0%) of respondents strongly agree that high level of right-of-way protection is
maintained.
Test results on H01showed that there was significantly positive relationship between urban
land use planning and economic vulnerability to disaster management. The effect of Land
use planning regulatory instrument on EVDM was significant positive (R= 0.878). This
was an indication that Land use planning regulatory instrument explained 87.8% (R2
=.771) of EVDM. The other variables in the urban areas explained the remaining 12.2%.
The analysis from the model had the F value of 426.8. At p-value less than 0.05, the
findings thus were sufficient to support effects of Land use planning regulatory instrument
on economic vulnerability to disaster management, implying that Land use planning
regulatory instrument had statistically significant positive effects on economic vulnability
to disaster management. The results indicate that there was a significant positive
relationship between LUPRI and economic vulnerability to disaster management activity
level. The urban areas under study with longevity of tenure creating Land use planning
regulatory instrument score tended to have higher level of economic vulnerability to
disaster management. γ = β0+β1LUPRI = .687+1.249LLUPRI; if LUPRI is zero γ will be
1.936 units level of economic vulnerability to disaster management while if LUPRI is 10; γ
will be 0.878+(1.482*10) which is equal to 13.238 showing an increasing effect of LUPRI
on NEVDM. The hypothesis that there was no relationship between urban land use
planning regulatory instruments on economic vulnerability to disaster management was
therefore rejected.
281
8.4. Effect of Urban Land Zoning on Economic Vulnarabity to Disaster
Management in Low Income Neighbourhoods of Eldoret Urban Area
Land use zoning was considered useful in the following areas including functional zoning,
form based zoning, intensity zoning and incentives zoning. In the functional zoning, this
divides urban land in various uses including commercial, administrative, residential, and
industrial and green pace. The findings indicated that Urban Land use Zoning and all its
five dimensional items combined had an influenced of 73.0%. The findings also indicated
that functional and form based land use zoning had highest level of influence on economic
vulnerability to disaster management compared to the other dimensions.
Zoning provide areas specifically allocated suitable for particular activity. It means that
zonal mapping will have already taken place and determination of hazard prone areas
identified and included in the map when zoning and allocation of specific activities are
done. For example, form based zoning is aimed at dividing land into downtown, uptown,
historical zones, and manufacturing areas. While intensity zoning divides and classify
urban land into high density, average density, low density and no density. Finally,
incentive zoning provide for incentives or no incentives. The finding indicated that zoning
would influence economic vulnerability to disaster management by providing specific
zones suitable for particular socioeconomic activities that attract similar investment in such
areas creating employment opportunities, and providing sustainable income to
neighbourhood residents. Other business start ups would also emerge in supporting those
working in these zonal areas.

282
The benefit of zoning is that it helps to separate different, incompatible property uses and
collects together those that are similar. This ensures creation of neighborhoods’ that match
and useful to each other. This can help influencing neighborhoods whose residents are not
hard working to adopt a culture of trying and putting more efforts hence they would
become self-reliant. Zoning would also provide control mechanisms that would limit the
kind of housing construction for example in high density areas, skyrocketing buildings
would be allowed to be constructed, this would put a mechanism that ensures no informal
structures are established in average density areas.
Test results on H02 indicate that there was a significant positive relationship between LUZ
on Economic Vulnarability to Disaster Management in Low Income Neighbourhoods of
EUA in all activity level. The functional, form based, intensity, and incentives increases as
LUZ increases. Therefore given the equation γ = β0+β1LUZ= .3856+.664LUZ when LUZ
is zero γ will be equal to .3856 and when LUZ is increased to 10 units then γ will be
.3856+.664(10), which will be 7.0256 units of EVDM showing an increasing effects of
LUZ on EVDM. Therefore the null hypothesis that there was no relationship between Land
Use Zoning on Neighbourhood Economic Vulnarability to Disaster Management was
rejected. Although in the literature there were varied results but this finding concurs with
the finding of Smolka, (2014) who found that urban areas with larger boards that are weak,
LUZ tend to have higher desire for improved Economic Vulnarability to Disaster
Management, which could be to help deal with vulnerability and resilience problem of
urban residents in the neighbourhoods. They found out that Land Use Zoning as a
dimension of Land Use Planning which was more entrenched due to socioeconomic values
283
that could be realized from applying land use planning to bring stability and sustainability
in urban areas in Eldoret and any other city in the world.
8.5. Effects of Urban Land Transit Circulation and Connectivity on Economic
Vulnarability to Disaster Management in Low Income Neighbourhoods of Eldoret
Urban Area
The findings indicated that circulation and connectivity plus all its seven dimensions had a
combined influence of 73.0% on economic vulnarabitity to disaster management. The
findings further show that the mean of street sections is 53.3%, which directly translates to
the total influence of circulation and connectivity on economic vulnability to disaster
management leaving the remaining 46.7%, be influenced by other factors. The street
section of the circulation and connectivity provides cross sections for typical roadways
detailing lane width, parking, bicycle lanes and required right-of-way. The study also
found out that the mean of traffic calming influence was only 47.6%, which directly
translates to the influence on economic vulnerability to disaster management. That meant
that the parking standards and design registered a high level of influences. The mean of
connectivity and circulation was 53.2%, which was 53.2% of the total Circulation and
Connectivity influence ond economic vulnerability to disaster management.
The findings showed that circulation and connectivity presents the recommended standards
for both on-street and off-street bicycle facilities; provides the standards and recommended
location for paths, trails designed to accommodate pedestrians, and cyclists; presents
recommended bus routes and transit shelter design; presented the percent of urban
residents, employees and mixed-use centers served by pedestrian, bicycle facilities and

284
transit; summarizes a catalog of traffic calming techniques and discusses appropriate
locations and benefits and presents a discussion of shared parking, parking ratios, and on-
and off-street parking.
In the findings from the regression analysis, there was a significantly positive relationship
from among the three dimensions of urban land use planning, indicating that the urban land
use planning also has a significantly positive relationship to economic vulnerability to
disaster management. This finding imply that where the components of land use planning
increased, the wellbeing of the household dimensions also improves and subsequently
develop disaster management strategies such as risk reduction, risk mitigation, and risk
coping. The correlation analysis findings indicated that land use planning regulatory
instrument was positively and significantly correlated to influence on household disaster
risk management (r=0.719, ρ<0.05); Thus land use planning regulatory instrument had
71.9% positive relationship with economic vulnerability to disaster management. Land use
zoning was also positively related with its effects on household disaster risk management
(r = 0.762, ρ<0.05) an indication that land use zoning had 76.2% significant positive
relationship with economic vulnerability to disaster management. Connectivity and
circulation was significantly positively correlated to household disaster risk management
(r=-0.74, ρ<0.05).Therefore, Connectivity and circulation had 74.0% positive relationship
with economic vulnerability to disaster management.
Test results for H03 are depicted in table 7.6 which observes that there was a significant
positive relationship between connectivity and circulation and economic vulnerability to
disaster management activity level (r= .883). This was an indication that Connectivity and
285
Circulation explained 78.0% (R2= .780) of economic vulnability to Disaster Management.
The other variables affecting Economic Vulnarability to Disaster Management explained
the remaining 22.0%. The analysis from the model had the F value of 5.4665 at p-value
<0.05, the findings were sufficient to support the relationship between Connectivity and
Circulation and Economic Vulnarability to Disaster Management, inferring that
Connectivity and Circulation had statistically significant positive effects on Economic
Vulnarability to Disaster Management. Therefore the null hypothesis that there was no
relationship between Connectivity and Circulation and Economic Vulnarability to Disaster
Management was rejected.
8.6. Conclusions
This study hereby drawns the following conclusions based on the three specific objectives,
and the fourth conclusion is based on the overall objective of the study.
8.6.1 Influence of Urban Land Use Planning Regulatory Instruments on Economic
Vulnarability to Disaster Management in Low Income Neighbourhoods of Eldoret
Urban Area
The study concludes that the institutions responsible for implementing the urban land use
planning regulatory instruments meant to manage the economic vulnerability to disaster
management in Low Income of Eldoret Urban Area, appears to be weak and inefficient to
re enforce the implementation and application of these land instruments such that to
influence the economic vulnarabilities to disaster management in low income
neighbourhoods of Eldoret Urban Area.This is evidenced by the widespread of slums, and
286
informal settlements in the urban neighbourhoods and the encroachment of road reserves,
open spaces within the urban area of EUA. The Uashin Gishu County/Urban
administration appears also to experiencing breucracy in issueing building permits and
general implementation of land use regulatory instruments in their jusridication; hence,
residents in the neighbourhoods tend to ignore the application of these instruments. Thus,
floor area ratio, building height restriction, building standards, construction permits are all
ignored by the urban residents in the neighbourhoods, exposing them to be vulnerable to
disaster in their neighbourhoods. This is evidenced in Kapsoya aformal area which the
study have used as control or reference point. The same has been extended even in Langas,
an informal settlement where tall buildings have been emerging.
8.6.2 Effect of Urban Land Zoning on Economic Vulnarability to Disaster
Management in Low Income Neighbourhoods of Eldoret Urban Area
It was evident from the findings that land use zoning has an important role in improving
neighbourhood economic vulnerability to disaster management. Urban land use zoning
would enable them to identify with different zones for specific socioeconomic activities
attraction to such special zones such as industrial parks, commercial zones, residential, and
others, and as such economic vulnerability to disaster management in low income
neighbourhoods would improve since such activities would help stabilize the residents
socioeconomic and environmental management.
The land use zone as an element of land use zone planning was introduced by the colonial
government and it was meant to bring law and order especially in urban area. The colonial
governments were able to implement land zoning and this is evidenced by the fact that
287
urban areas such like Eldoret were divided into industrial areas, commercial areas.
However, urban administrators in the post colonial period have been slow in applying the
land use zone in our urban areas, thus, urban development has been disorderly resulting in
wide spread of slums, informal settlements. The inefficient and lack of proper
implementation of land zoning has exoposed the urban residents to disaster risk in their
settlements.
8.6.3 Effects of Urban Land Transit Circulation and Connectivity on Economic
Vulnarability to Disaster Management in Low Income Neighbourhoods of Eldoret
Urban Area
This study concludes that circulation and connectivity too has a significant effect on
economic vulnerability to disaster management in low income neighbourhoods of EUA.
This was important in enhancing neighborhoods access and connectivity to industrial areas
and improving inter urban areas trade; movement of urban residents to and fro; and
movement of goods and services. The study concludes that appropriate land transit
circulation & connectivity should be adapted and implemented by EUA authority while
designing the transits on neighbourhoods, to make the residents in the low income
neighbourhoods safe and secure. For instance, most road designers, especially, in
developing countries cities have ignored this aspect, such that most persons with
disabilities or physical challenges in many occasions have been suffering.
The overall objective which aims at evaluating the effect of land use planning on economic
vulnerability to disaster management in low income neighbourhoods of Eldoret Urban
Area with aview to determine the best urban land use planning strategies and policies to
288
minimize vulnerability exposure and built vulnerability resilience of low income urban
residents in EUA.
Finally, the general conclusion was that urban land use planning has significant effects on
economic vulnerability to disaster management in low income neighbourhoods of EUA.
Therefore urban land use planning is a critical tool or technique in designing and
developing urban areas where hazardous zones are mapped, demarcated and kept off from
urban residents socioeconomic activities. It has also concluded that the application of land
use planning regulation instruments appropriately in the urban spatial structures, for
instance in the slum areas, informal settlements and pre-urban areas, would brought all
these land forms into urban planning jurisdiction, hence would enable the urban residents
residing in themto manage the disaster risks by adopting various land use regulatory
strategies such as slum-upgrading, mixed-use development, development corridors,
gentrification, special zoning, industrial/business parks, green space/agricultural
conservation. These strategies together with other relevant land policies such land reforms
would enable urban residents in low income neighbourhoods to build capacity and
resilience to reduce disaster risks in their urban areas which would enhances their
economic activities, hence better income, saving, consumption, employment opportunities
and credit facilities.
289
8.7. Recommendations
Basing on the findings of the study, the following recommendations are hereby presented:
8.7.1 Recommendation one based on the specific objective one.
That, the national and county governments who are responsible to administer land use
planning regulatory instruments should improve upon the implementations of land use
regulatory instruments to enhance urban residents to built resilience and capacity to cope
up with economic vulrability to disaster in Eldoret Urban Area. To re enforcing land use
regulatory instruments by urban residents, the physical planning Act of 1996, building
codes, public health Act as well as Environmental Management Act of 1999 should be
applied by the cities/ urban centers administrination authority. It has also recommended
that strategies such as mixed-use development, slum upgrading, gentrification,
development corridors, land reforms candstre system, land tenure security all should be
implemented by land use authorities to enhance urban residents’ vulnerability resilience in
EUA.
8.7.2 Recommendation two based on specific objective two.
The study recommends the application of land zoning, thus the urban residents be able to
manage the economic vulnerability to disaster so that the settlements become safe and
secure.Land use zoning policies should be re-enforce in terms of land tenure security and
land reforms to improve on candstre system in the land. Land zoning would control
sprawling of slums and informal settlements in EUA.
290
8.7.3. Recommendation three based on specific Objective three.
National/County governments should strictly enforce transit land use circulation &
connectivity to ensure proper design,, compliance practices and maintainance of urban
infrastructures.
Transit land circulation & connectivity provide for parking accommodations that result in
increased separation of buildings and increased distance from street or sidewalk to building
to provide spaces for cars. Since urban residents with sprawl, disconnected sidewalks,
streets, poor sidewalk infrastructure, and making walking less feasible, inconvenient,
and/or unsafe which, in turn, lead to lower rates of active transportation walking, biking, or
taking public transit and limit opportunities for leisure-time physical activity. Circulation
and connectivity supporting the economy and serving and influencing land use patterns in
a positive way. Increase travel planning well designed, proportionately with anticipated
urban population growth including support of sustainable growth and economic
development, keeping pace with circulation system. This will provide automobile as
primary mode of transportation, with alternatives such as pedestrians, public transit,
bicycling, and walking. Hence it is recommended to pursue the use of connectivity and
circulations to improve land use value capture.
8.8. Suggestions for Further Studies
The focus of this study was on the use of urban land, (land use planning), and its effects on
economic vulnerability to disaster management in low income neighbourhoods of EUA,
which the findings have indicated that the urban resident respondents lack knowledge,
awareness yet there are various urban planning documents and instruments available with
291
the institutions concered.Therefore,it is critical to pursue and carry out a longitudinal study
to establish the level of implementation these frameworks by the relevant authorities have
on economic vulnerability to disaster management on urban settlements particularly by the
devolved county governments.
292
REFERENCES
Acemoglu D, Como G, Fagnani F, Ozdaglar A (2013) Opinion fluctuations and
disagreement in social networks. Math Oper Res 38(1):1–27
ActionAid International. 2006. Disaster Risk Reduction: Implementing the Hyogo
Framework for Action (HFA). Available at -0.
African Population and Health Research Center (APHRC), (2014). Population and Health
Dynamics in Nairobi’s Informal Settlements: Report of the Nairobi Cross-sectional
Slums Survey. (NCSS) 2012. Nairobi: APHRC.
African Socialism and its Application to Planning (1965). Sessional Paper 10. Repubic of
Kenya, Government Printer.
African Union Commission, The World Bank, UNISDR. 2009. Status Report on Disaster
Risk Reduction in Sub-Saharan Africa: Contributing to the Implementation of the
Hyogo Framework for Action and the African Regional Strategy. Available at
http://www.preventionweb.net/files/12061_UpdatedAfricaStatusReport17Sept09.p
df.
Albala-Bertrand JM (2013) Disasters a nd the networked economy. Routledge, New York
An L (2012) Modeling human decisions in coupled human and natural systems: review of
agent-based models. Ecol Model 229:25–36
Anas A, Liu Y (2007) A regional economy, land use, and transportation model (RELU-
TRAN). J Reg Sci 47(3):415–455
Annabel S. Erulkar, James K. Matheka. "Adolescence in the Kibera Slums of Nairobi
Kenya" (PDF). Population Council. Archived from the original (PDF) on 11 May
2012. Retrieved 10 July 2012.
Asian Conference on Disaster Reduction. 2007. Summary Report 25-27 June 2007.
Available at http://www.adrc.asia/acdr/2007_summary.html.
Asian Disaster Preparadness Center, Asian Disaster Reduction Center, UNISDR. 2007.
Regional Synthesis Report on HFA Implementation in Asia and Pacific: An
Overview of Reports by Countries up to 2007. Available at
http://www.preventionweb.net/files/10503_RegionalSynthesisReportFinalVersion.
pdf.
Asian Disaster Reduction Center. 2008. Total Disaster Risk Management: Good Practices
2008. Available at http://www.preventionweb.net/files/9052_TDRM08.pdf.

293
Atreya A, Ferreira S, Kriesel W (2013) Forgetting the flood? An analysis of the flood risk
discount over time. Land Econ 89(4):577–596
Audio Slideshow: Dr. Biden Sees the Neighbourhoods of Kenya. The White House, United
States (June 2010)
Badan Nasional Penanggulangan Bencana, UNDP. 2009. Lessons Learned: Disaster
Management Legal Reform – The Indonesian Experience. Jakarta: UNDP.
Available
athttp://www.undp.or.id/pubs/docs/Lessons%20Learned%20Disaster%20Manage
ment%20legal%20Reform.pdf.
Bahadur, A. V., Peters, K., Wilkinson, E., Pichon, F., Gray, K. and Tanner, T. (2015) The
3As: tracking resilience across BRACED. Working and Discussion Papers.
London: Overseas
Barberis NC (2012) Thirty years of prospect theory in economics: a review and
assessment. NBER Working Paper 18621, National Bureau of Economic Research,
Cambridge Development Institute.
Barrett, C. B. (2002). Food Security and Food Assistance Programs. Department of
Agricultural, Resource, and Managerial Economics, 35, Warren Hall, Cornell
University, Ithaca, NY
Barro RJ (2009) Rare disasters, asset prices, and welfare costs. Am Econ Rev 99(1):243–
264
Barro RJ (2013) Environmental protection, rare disasters, and discount rates. NBER
Working Paper 19258, National Bureau of Economic Research, Cambridge
Battiston S, Farmer JD, Flache A, Garlaschelli D, Haldane AG, Heesterbeek H, Hommes
C, Jaeger C, May R, Scheffer M (2016) Complexity theory and financial
regulation. Science 351(6275):818–819
Béné, C., Frankenberger, T., Langworthy, M., Mueller, M. and Martin, S. (2016) ‘The
influence of subjective and psycho-social factors on people’s resilience:
conceptual framework and empirical evidence’. Technical Report Series 2:
Strengthening the Evidence Base for Resilience in the Horn of Africa. Nairobi:
International Livestock Research Institute and TANGO International.
Béné, C., Wood, R. G., Newsham, A. and Davies, M. (2012). Resilience: new utopia or
new tyranny? Reflection about the potentials and limits of the concept of resilience
in relation to vulnerability reduction programmes. Working Paper 2012(405).
Brighton: Institute of Development Studies.
294
Berger T, Troost C (2014) Agent-based modelling of climate adaptation and mitigation
options in agriculture. J Agric Econ 65(2):323–348
Beyers WB (1980) Migration and the development of multiregional economic systems.
Econ Geogr 56(4):320–334
Bin O, Kruse JB, Landry CE (2008) Flood hazards, insurance rates, and amenities:
evidence from the coastal housing market. J Risk Insur 75(1):63–82
Bin O, Landry CE (2013) Changes in implicit flood risk premiums: empirical evidence
from the housing market. J Environ Econ Manag 65(3):361–376
Bin O, Polasky S (2004) Effects of flood hazards on property values: evidence before and
after Hurricane Floyd. Land Econ 80(4):490–500
Birkmann, J. (2006) ‘Measuring vulnerability to promote disaster-resilient societies:
conceptual frameworks and definitions’, Towards Disaster Resilient Societies 1:
9–54.
Black R, Adger WN, Arnell NW (2013) Migration and extreme environmental events: new
agendas for global change research. Environ Sci Policy 27:S1–S3.
Black R, Adger WN, Arnell NW, Dercon S, Geddes A, Thomas D (2011a) Migration and
global environmental change
Black R, Bennett SR, Thomas SM, Beddington JR (2011b) Climate change: migration as
adaptation. Nature 478(7370):447–449
Bo¨hringer C, Rutherford TF (2008) Combining bottom–up and top–down. Energy Econ
30(2):574–596.
Botzen WJ, Aerts JC, van den Bergh JC (2009) Willingness of homeowners to mitigate
climate risk through insurance. Ecol Econ 68(8):2265–2277
Bourdieu, P. (1986). The forms of capital. In J. Richardson (Ed.) Handbook of Theory and
Research for the Sociology of Education (New York, Greenwood), 241-258.
BRACED Fund Manager (2017) ‘Annual report 2017’. Forthcoming.
Brandsma A, Kancs d, Persyn D (2014) Modelling migration and regional labour markets:
an application of the new economic geography model RHOMOLO. J Econ Integr
29(2):372–406. http://www.jstor.org/stable/23723860
Brouwers L, Boman M (2011). A computational agent model of flood management
strategies. Comput Methods Agric Res Adv Appl 296–307
295
Brown, L.A., Moore, E.G., 1970. The intra-urban migration process. A perspective.
Geografiska Annaler 52B, 368e381.
Burby RJ (2006) Hurricane Katrina and the paradoxes of government disaster policy:
bringing about wise decisions for hazardous areas. Ann Am Acad Polit Soc Sci
604(1):171–191.
Burma Partnership (2015) ‘Voices of refugees: situation of Burma’s refugees along the
Thailand-Burma border’. www.burmalink.org/briefing-paper-voices-of-refugees-
situation-of-burmas-refugees-along-the-thailand-burma-border/
Cai R, Oppenheimer M (2013) An Agent-based model of climate-induced agricultural
labor migration. In: 2013 Annual meeting, August 4–6, 2013, Washington, DC.
Agricultural and Applied Economics Association
Camerer CF, Kunreuther H (1989) Decision processes for low probability events: policy
implications. J Policy Anal Manag 8(4):565–592
Castellano C, Fortunato S, Loreto V (2009). Statistical physics of social dynamics. Rev
Mod Phys 81(2):591–646.
Cavallo E, Galiani S, Noy I, Pantano J (2013). Catastrophic natural disasters and economic
growth. Rev Econ Stat 95(5):1549–1561
Cavallo E, Noy I (2009). The economics of natural disasters: a survey. RES Working
Papers 4649, Inter-American Development Bank
Chan EY, Yue J, Lee P, Wang SS. Socio-demographic Predictors for Urban Community
Disaster Health Risk Perception and Household Based Preparedness in a Chinese
Urban City. PLOS Currents Disasters. 2016 Jun 27.
Christian Aid (2014). ‘Working toward health convergence: a case study’. London:
Christian Aid. CPCS (Centre for Peace & Conflict Studies) (2014) Listening to
communities of Kayin state. Siem Reap: CPCS.
Christian Aid. 2007. Community-led Policy Monitoring for Disaster Risk Reduction: A
Collection of Practice Notes. Available at
http://www.preventionweb.net/english/professional/publications/v.php?id=1055.
Claire, A., Conway, D., Graber, R. and Jones, L. (2017) ‘Subjective measures of climate
resilience: what is the added value for policy and programming?’ Global
Environmental Change (in press).
Colander D, Howitt P, Kirman A, Leijonhufvud A, Mehrling P (2008) Beyond DSGE
models: toward an empirically based macroeconomics. Am Econ Rev 98(2):236–
240.
296
Corbyn Z (2010) Mexican ’climate migrants’ predicted to flood US. Nature News,
Published online 26 July 2010.
Coulombel, N., 2010. Residential choice and household behaviour: state of the art.
Sustaincity working paper 2.2a, Cachan.
Cox, R. S. and Perry, K. M. E. (2011). ‘Like a fish out of water: reconsidering disaster
recovery and the role of place and social capital in community disaster resilience’,
American Journal of Community Psychology 48(3–4): 395–411.
CPCS (2016). We want genuine peace: voices of communities from Myanmar’s ceasefire
areas in 2015. Siem Reap: CPCS.
Croke, K., Dabalen, A., Demombynes, G., Giugale, M. and Hoogeveen, J. (2013)
‘Collecting high-frequency data using mobile phones: do timely data lead to
accountability?’ Economic Premise 102. Washington, DC: World Bank.
Cuaresma J, Hlouskova J, Obersteiner M (2008) Natural disasters as creative destruction:
evidence from developing countries. Econ Inq 46(2)
Cutter SL, Boruff BJ, Shirley WL (2003) Social vulnerability to environmental hazards.
Soc Sci 84(2):242–261
Cutter, S. L., Barnes, L., Berry, M., Burton, C., Evans, E., Tate,E. and Webb, J. (2008) ‘A
place-based model for understanding community resilience to natural disasters’,
Global Environmental Change 18(4): 598–606.
Dabalen, A., Etang, A., Hoogeveen, J., Mushi, E., Schipper, Y. and von Engelhardt, J.
(2016) Mobile phone panel surveys in developing countries: a practical guide for
microdata collection. Washington, DC: World Bank.
Daniel VE, Florax RJ, Rietveld P (2009a) Flooding risk and housing values: an economic
assessment of environmental hazard. Ecol Econ 69(2):355–365
Daniel VE, Florax RJ, Rietveld P (2009b) Floods and residential property values: a
hedonic price analysis for the Netherlands. Built Environ 35(4):563–576
Deffuant G, Amblard F, Weisbuch G, Faure T (2002) How can extremism prevail? A study
based on the relative agreement interaction model. J Artif Soc Soc Simul 5(4)
87:287–305 301
Deffuant G, Neau D, Amblard F, Weisbuch G (2000) Mixing beliefs among interacting
agents. Adv Complex Syst 3(1):87–98.
Dell M, Jones BF, Olken BA (2014) What do we learn from the weather? The new
climate-economy literature. J Econ Lit 52(3):740–798.
297
Desiere, S., Vellema, W. and D’Haese, M. (2015) ‘A validity assessment of the Progress
out of Poverty Index (PPI)’, Evaluation and Program Planning 49: 10–18.
Dosi G (1990) Finance, innovation and industrial change. J Econ Behav Org 13(3):299–
319.
Dosi G, Egidi M (1991) Substantive and procedural uncertainty. J Evol Econ 1(2):145–
168.
DRR (Disaster Risk Reduction) Working Group (2013) ‘A situational analysis of disaster
risk reduction in Myanmar’. Yangon: DRR Working Group.
Eldoret Strategic Development Plan (2012); Kenya Government Printers.
Enermark, D.G.a.S., (2012). In Planning for States and Nation/States: A TransAtlantic
Exploration: Dublin. p. 47.
European Commission Humanitarian Aid, UNISDR. 2006. Disaster Risk Reduction: 20
Examples of Good Practices from Central Asia. Available at
http://www.preventionweb.net/files/2300_20GoodExamplesofGoodPractice.pdf.
European Parliament. 2010. European Parliament resolution of 21 September 2010 on the
Commission communication: A Community approach on the prevention of natural
and man-made disasters (HYPERLINK
“http://www.europarl.europa.eu/oeil/FindByProcnum.do?lang=en&procnum=INI/
2009/2151” 2009/2151(INI)). Available
athttp://www.europarl.europa.eu/sides/getDoc.do?pubRef=-//EP//TEXT+TA+P7-
TA-2010-0326+0+DOC+XML+V0//EN.
Fagiolo G, Roventini A (2012) Macroeconomic policy in DSGE and agent-based models.
Revue de l’OFCE 5:67–116
Farmer JD, Foley D (2009). The economy needs agent-based modelling. Nature
460(7256):685–686
Feng S, Krueger AB, Oppenheimer M (2010) Linkages among climate change, crop yields
and Mexico–US cross-border migration. Proc Natl Acad Sci USA 107(32):14257–
14262.
Feng S, Oppenheimer M, Schlenker W (2012) Climate change, crop yields, and internal
migration in the United States. Working Paper 17734, National Bureau of
Economic Research, Cambridge.
Filatova T (2014) Market-based instruments for flood risk management: a review of
theory, practice and perspectives for climate adaptation policy. Environ Sci Policy
37:227–242.

298
Filatova T, van der Veen A, Parker DC (2009) Land market interactions between
heterogeneous agents in a heterogeneous landscape-tracing the macro-scale effects
of individual trade-offs between environmental amenities and disamenities. Can J
Agric Econ 57(4):431–457
Folke, C., Carpenter, S., Elmqvist, T., Gunderson, L., Holling, C. S. and Walker, B. (2002)
‘Resilience and sustainable development: building adaptive capacity in a world of
transformations’, AMBIO: A Journal of the Human Environment 31(5): 437–440.
Foster, K. A. (2007) A case study approach to understanding regional resilience. Working
Paper. Buffalo, NY: UB Institute.
Frazier, A. E., Arendt, L. A., Cimellaro, G. P., Reinhorn, A. M., & Bruneau, M. (2010). A
framework for defining and measuring resilience at the community scale: The
PEOPLES resilience framework (pp. 10–0006). Buffalo: MCEER.
Freire, Maria, Somik Lall, and Danny Leipziger. (2014). “Africa’s Urbanization:
Challenges and Opportunities.” Working Paper No. 7, The Growth Dialogue,
Washington, DC.
Fussell E, Curtis KJ, de Waard J (2014) Recovery migration to the City of New Orleans
after Hurricane Katrina: a migration systems approach. Popul Environ 35(3):305–
322.
Galland, D., (2012). Understanding the Reorientations and Roles of Spatial Planning: The
Case of National Planning Policy in Denmark. European Planning Studies. 20(8):
p. 1359-1392.
Gaube V. and Remesch A., (2013). Impact of urban planning on household’s residential
decisions: An agent-based simulation model for Vienna. Journal Environmental
Modelling & Software. Vol. 45; 92-103
Geanakoplos J, Axtell R, Farmer JD, Howitt P, Conlee B, Goldstein J, Hendrey M, Palmer
NM, Yang CY (2012) Getting at systemic risk via an agent-based model of the
housing market. Am Econ Rev 102(3):53–58.
Gemenne F (2011). Why the numbers don’t add up: a review of estimates and predictions
of people displaced by environmental changes. Glob Environ Change 21:S41–S49.
Giesecke JA, Burns WJ, Barrett A, Bayrak E, Rose A, Slovic P, Suher M (2012)
Assessment of the regional economic impacts of catastrophic events: CGE analysis
of resource loss and behavioural effects of an RDD attack scenario. Risk Anal
32(4):583–600.
299
Giesecke JA, Madden JR (2013). Regional Computable General Equilibrium Modeling. In:
Dixon PB, Jorgenson DW (eds) Handbook of Computable General Equilibrium
Modeling SET, Vols. 1A and 1B. Elsevier, pp 379–475.
Gintis H (2007). The dynamics of general equilibrium. Econ J 117(523):1280–1309.
Glaeser EL (2005). Should the government rebuild New Orleans, or just give residents
checks? Econo Voice 2(4):1–7
Go DS, Lofgren H, Ramos FM, Robinson S (2016). Estimating parameters and structural
change in cge models using a Bayesian cross-entropy estimation approach. Econ
Model 52:790–811
Gosnell, H., et al., (2011). Is Oregon’s land use planning program conserving forest and
farm land? A review of the evidence. Land Use Policy. Vol. 28(1): p. 185-192.
Graham, C. and Chattopadhyay, S. (2013) ‘Gender and well-being around the world’,
International Journal of Happiness and Development 1(2): 212–232.
Grazzini J, Richiardi M (2015). Estimation of ergodic agent-based models by simulated
minimum distance. J Econ Dyn Control 51:148–165
Grigg N, Harman I et al (2014). Towards decision-based global land use models for
improved understanding of the earth system. Earth Syst Dyn 5(1):117
Grimm V, Berger U, Bastiansen F, Eliassen S, Ginot V, Giske J, Goss-Custard J, Grand T,
Heinz SK, Huse
Gunja lK. (2016). Agricultural Risk Management Tools. Resource for the e-learning
curriculum course on “Agricultural Risk Assessment and Management for Food
Security in Developing Countries1”Platform for Agricultural Risk Management.
Gupta, S. and Leung, I. 2011. Turning Good Practice into Institutional Mechanisms:
Investing in grassroots women’s leadership to scale up local implementation of the
Hyogo Framework for Action. Huairu Commission and Groots International.
Haer T, Botzen W, Moel H, Aerts JC (2016) Integrating household risk mitigation
behaviour in flood risk analysis: an agent-based model approach. Risk Anal.
Hailu, S., (2013). The Impact of Disaster Risk Management Interventions in Humanitarian
Programmes on Household Food Security: The Case of East Africa, Ethiopia,
Amhara Region, North Wollo Zone.UNOCHA’s Policy Development Studies
Branch
Hallegatte S (2008). An adaptive regional input–output model and its application to the
assessment of the economic cost of Katrina. Risk Anal 28(3):779–799.

300
Hallegatte S, Ghil M (2008). Natural disasters impacting a macroeconomic model with
endogenous dynamics. Ecol Econ 68(1–2):582–592
Hallegatte S, Przyluski V (2010) The economics of natural disasters: concepts and
methods. Policy Research Working Paper Series 5507, The World Bank,
Washington, DC
Hegselmann R, Krause U (2002) Opinion dynamics and bounded confidence models,
analysis, and simulation. J Artif Soc Soc Simul 5(3)
Hilton, M., Maung, Y.M. and Le Masson, V. (2016) ‘Assessing gender in resilience
programming: Myanmar’, BRACED Resilience Intel 2.3. London: Overseas
Development Institute.
Hinz, A., Michalski, D., Schwarz, R. and Herzberg, P. Y. (2007) ‘The acquiescence effect
in responding to a questionnaire’, GMS Psycho-Social Medicine 4.
Hommes C (2013) Behavioural rationality and heterogeneous expectations in complex
economic systems. Cambridge University Press, Cambridge
Hourcade JC, Jaccard M, Bataille C, Ghersi F (2006) Hybrid modeling: new answers to old
challenges. Introduction to the Special Issue of’’ The Energy Journal’’. Energy J
1–11
Hu A, Xie W, Li N, Xu X, Ji Z, Wu J (2014) Analyzing regional economic impact and
resilience: a case study on electricity outages caused by the 2008 snowstorms in
southern China. Nat Hazards 70(2):1019–1030.
Humanitarian Country Team (HTC) (2015) Humanitarian Response Plan 2016. Yangon:
UN.INFORM (Index for Risk Management) (2017) Global results report 2017.
www.inform-
index.org/Portals/0/InfoRM/INFORM%20Global%20Results%20Report%202017
%20FINAL%20WEB.pdf?ver=2016–11–21–164053–717
Hunte, M. (2010), "An international perspective on traffic policing from an Antiguan
perspective", paper presented at the 7th International Police Executive
Symposium, Evanston, IL.
Hunter LM (2005) Migration and environmental hazards. Popul Environ 26(4):273–302
Husby TG (2016) Economic impacts of behavioural responses to flood risk: exploring
general equilibrium effects using micro-level insights. PhD thesis, Institute for
Environmental Studies (IVM), VUUniversity, Amsterdam. Available at
http://dare.ubvu.vu.nl/handle/1871/54109
301
Husby TG, de Groot HL, Hofkes MW, Dro¨es MI (2014) Do floods have permanent
effects? Evidence from the Netherlands. J Reg Sci 54(3):355–377
Husby TG, Mechler R, Jongman B (2016) What if Dutch investors started worrying about
flood risk? Implications for disaster risk reduction. Reg Environ Change
16(2):565–574
Huth A, Jepsen JU, Jo¨rgensen C, Mooij WM, Mu¨ller B, Pe’er G, Piou C, Railsback SF,
Robbins AM, Robbins MM, Rossmanith E, Ru¨ger N, Strand E, Souissi S,
Stillman RA, VabøR Visser U, DeAngelis DL (2006) A standard protocol for
describing individual-based and agent-based models. Ecol Model 198(1–2):115–
126.
IPCC (2012) A Special Report of Working Groups I and II of the Intergovernmental Panel
on Climate Change. In: Field CB, Barros V, Stocker TF, Qin D, Dokken DJ, Ebi
KL, Mastrandrea MD, Mach KJ,
IPCC (2014) Climate change 2014: Impacts, adaptation, and vulnerability. part A: global
and sectoral aspects. Contribution of working group II to the fifth assessment
report of the intergovernmental panel on climate change. University Press,
Cambridge, UK, and New York, NY, USA, pp 1–32
Ivanova O, Heyndrickx C, Spitaels K, Tavasszy L, Manshanden W, Snelder M, Koops O
(2007) RAEM: version 3.0. First report, Transport & Mobility Leuven, Leuven
Jedwab, Rémi. (2013). “Urbanization without Structural Transformation: Evidence from
Consumption Cities in Africa.” Working Paper, George Washington University,
Washington, DC.
Joliffe, K. (2014) Ethnic conflict and social services in Myanmar’s contested regions.
Manila: The Asia Foundation.
Joliffe, K. (2015). ‘Refugee decision-making processes, community-based protection and
potential voluntary repatriation to Myanmar’.
www.burmalibrary.org/docs21/Jolliffe-2015–01-Refugee-decision-making-
processes-community-based-protectionand-potential-repatriation-to-Myanmar-
Jolliffe-red-.pdf
Jones L., Ludi E., and Levine S. (2010). Towards a characterization of adaptive capacity:
a framework for analysing adaptive capacity at the local level. London: Overseas
Development Institute.
Jones, L. and Samman, E. (2016). Measuring subjective household resilience: insights
from Tanzania. London: Overseas Development Institute.
302
Jones, L. and Tanner, T. (2017) ‘“Subjective resilience”: using perceptions to measure
household resilience to climate extremes and disasters’, Regional Environmental
Change 17: 229–243.
Jonkman SN, Bockarjova M, Kok M, Bernardini P (2008) Integrated hydrodynamic and
economic modelling of flood damage in the Netherlands. Ecol Econ 66(1):77–90.
Kafle, S. K. (2012) ‘Measuring disaster-resilient communities: a case study of coastal
communities in Indonesia’, Journal of Business Continuity & Emergency Planning
5(4): 316–326.
Kahneman D, Tversky A (1979) Prospect theory: an analysis of decision under risk.
Econometrica 47(2):263–291
Karanja, Muchiri (3 September 2010). "Myth shattered: Kibera numbers fail to add
up". Daily Nation. Retrieved 4 September 2010.
Kasperson RE, Renn O, Slovic P, Brown HS, Emel J, Goble R, Kasperson JX, Ratick S
(1988) The social amplification of risk: a conceptual framework. Risk Anal
8(2):177–187.
Kates, R. W., Travis, W. R., & Wilbanks, T. J. (2012). Transformational adaptation when
incremental adaptations to climate change are insufficient. Proceedings of the
National Academy of Sciences, 109(19), 7156–7161.
Kempel, S. and Nyein, A.T. (2014) ‘Local governance dynamics in south east Myanmar’.
Assessment for SDC.
Khayesi, M. (2007). The Struggle for Regulatory and Economic Sphere of Influence in the
Matatu Means of Transport in Kenya: A Stakeholder Analysis Kenyatta
University, Nairobi Kenya.
KHRG (Karen Human Rights Group) (2015) ‘With only our voices, what can we do? Land
confiscation and local response in Southeast Myanmar’.
http://khrg.org/2015/06/with-onlyour-voices-what-can-we-do-land-confiscation-
and-local-response
Kim JH, Hewings GJ (2012) Integrating the fragmented regional and subregional
socioeconomic forecasting and analysis: a spatial regional econometric input–
output framework. Ann Reg Sci 49(2):485–513
Kimani, Ndugu P., Kibua, Thomas, and Masinde, Muyundo. (2004). “The Role of the
Matatu industry in Kenya: Economic Costs, Benefits and Policy Concerns.” IPAR
Discussion Paper Series, Discussion Paper No. 053/2004. Kenya Institute of Policy
Analysis and Research. Kenya: Regal Press.
303
Kimathi Mutegi (2013). Kibera: How slum lords cash in on misery, The Nation, Kenya (19
September 2013). Archived copy on the Wayback Machine from 12 October 2013.
King, D., Harwood, S., Cottrell, A., Gurtner, Y., and Firdaus A. (2013). Land Use
Planning For Disaster Risk Reduction and Climate Change Adaptation:
Operationalizing Policy and Legislation at Local Levels.Centre for Disaster
Studies, James Cook University, Australia
Kirman AP (1992) Whom or what does the representative individual represent? J Econ
Perspect 6(2):117–136
Klaiber HA (2014). Migration and household adaptation to climate: a review of empirical
research. Energy Econ 46:539–547
Kniveton DR, Smith CD, Black R (2012). Emerging migration flows in a changing climate
in dryland Africa. Nat Clim Change 2(6):444–447
Koks EE, Bockarjova M, de Moel H, Aerts JC (2014) Integrated direct and indirect flood
risk modeling: development and sensitivity analysis. Risk Anal 35(5):882–900
Koks EE, Carrera L, Jonkeren O, Aerts JC, Husby TG, Thissen M, and Standardi G,
Mysiak J (2016) Regional disaster impact analysis: comparing input-output and
computable general equilibrium models. Nat Hazards Earth Syst Sci 16(8):1911–
1924.
Koks EE, Jongman B, Husby TG, Botzen WJ (2015) Combining hazard, exposure and
social vulnerability to provide lessons for flood risk management. Environ Sci
Policy 47:42–52
Koks EE, Thissen M (2016). A multiregional impact assessment model for disaster
analysis. Econ Syst Res 28(4):429–449
Kousky C, Walls M (2014) Floodplain conservation as a flood mitigation strategy:
examining costs and benefits. Ecol Econ 104:119–128.
Kreft, S., Eckstein, D., Dorsch, L. and Fischer, L. (2015) ‘Global climate risk index 2016:
who suffers most from extreme weather events? Weather-related loss events in
2014 and 1995 to 2014’. Briefing Paper. Bonn: Germanwatch.
Kristoffersen, I. (2017) ‘The metrics of subjective wellbeing data: an empirical evaluation
of the ordinal and cardinal comparability of life satisfaction scores’, Social
Indicators Research 130(2): 845–865.
Leo, B., Morello, R., Mellon, J., Peixoto, T. and Davenport, S. (2015) Do mobile phone
surveys work in poor countries? Working Paper 398. Washington, DC: Center for
Global Development.
304
Magis, K. (2010) ‘Community resilience: an indicator of social sustainability’, Society and
Natural Resources 23(5): 401–416.
Mandel A (2012) Agent-based dynamics in the general equilibrium model. Complex Econ
1(1):105–121
Marchiori L, Maystadt JF, Schumacher I (2012) The impact of weather anomalies on
migration in sub-Saharan Africa. J Environ Econ Manag 63(3):355–374
Martin IW, Pindyck RS (2014) Averting catastrophes: the strange economics of Scylla and
Charybdis. NBER working paper 20215, National Bureau of Economic Research,
Cambridge
Maxwell, D., Constas, M., Frankenberger, T., Klaus, D. and Mock, M. (2015) ‘Qualitative
data and subjective indicators for resilience measurement’. Resilience
Measurement Technical Working Group Technical Series 4. Rome: Food Security
Information Network.
Mayunga, J. S. (2007). Understanding and applying the concept of community disaster
resilience: a capital-based approach. Summer academy for social vulnerability and
resilience building, 1, 16.
McLeman R (2013) Developments in modelling of climate change-related migration. Clim
Change. 117(3):599–611.
Mechler R, Bouwer LM, Linnerooth-Bayer J, Hochrainer-Stigler S, Aerts JC, Surminski S,
Williges K (2014) Managing unnatural disaster risk from climate extremes. Nat
Clim Change 4(4):235–237
Menard L, Slater RO, Flatz J. Disaster preparedness and educational attainment. J Emerg
Manag. 2011;9(4):45–52.
Mercy Corps. Establishing Community Based Early Warning System: Practitioner’s
Handbook. Mercy Corps and Practical Action, 2010.
Metternicht G., (2017). Land Use Planning. Global Land Outlook Working Paper
Miyazawa K (1976) Input–output analysis and the structure of income distribution.
Springer, Heidelberg
Morales Schechinger. C. Land Management and Informal Settlements in Developing
Countries (2012). Institute for Housing and Urban Development, Rotterdam,
Netherland.
305
Morrow, N., Mock, N., Bauer, J. M. and Browning, J. (2016) ‘Knowing just in time: use
cases for mobile surveys in the humanitarian world’, Procedia Engineering 159:
210–216.
Moussaı¨d M (2013) Opinion formation and the collective dynamics of risk perception.
PLOS ONE 8(12)
Mutisya E., and Yarime M., (2011). Understanding the Grassroots Dynamics of Slums in
Nairobi: The Dilemma of Kibera Informal Settlements, International Transaction
Journal of Engineering, Management, & Applied Sciences & Technologies,
Volume 2, No.2 (2011); pages 197–213
Mwagore, Dali (ed.) (2002). Land Use in Kenya—the case of land uses policy. Pp 65—79
PrintfastK enya Limited, Nairobi.PDF—version 5.11. 2002.
http//www.oxfarm,org.uk/Land rights.
Naqvi AA, Rehm M (2014) A multi-agent model of a low income economy: simulating the
distributional effects of natural disasters. J Econ Interact Coord 9(2):1–35
Nelson, V. (2011) Gender, generations, social protection and climate change: a thematic
review. London: Overseas Development Institute.
Nyangweso J. E. O. (2015). Management of Traffic Circulation in Nairobi City, a Case
Study of Upper Hill Area. (Unpublished Master Thesis, University Of Nairobi).
O’Brien, G., O’Keefe, P., Gadema, Z. and Swords, J. (2010) ‘Approaching disaster
management through social learning’, Disaster Prevention and Management: An
International Journal 19(4): 498–508.
O’Connell E, O’Donnell G (2013) Towards modelling flood protection investment as a
coupled human andnatura l system. Hydrol Earth Syst Sci Dis 10(6):8279–8323
Obokata R, Veronis L, McLeman R (2014) Empirical research on international
environmental migration: a systematic review. Popul Environ 36(1):1–25.
Obundho R.A. Urban Planning in Africa. Kenyan Experience and Application (2004).
Nairobi Uinersity Press.
Okoth – Ogendo .H.W.O. (1976).African Land Tenure Reform. In Heyer, Judith, J.K.
Maitha & W.M. Senga (ed.). Agricultural Development in Kenya and Economic
Assessment. Pp 152—185. Oxford University Press, Nairobi.
Okuyama Y (2004) Modeling spatial economic impacts of an earthquake: input–output
approaches. Disaster Prevent Manag 13(4):297–306
306
Okuyama Y, Santos JR (2014) Disaster impact and input–output analysis. Econ Syst Res
26(1):1–12
Oliva G, Panzieri S, Setola R (2010) Agent-based input–output interdependency model. Int
J Crit Infrastruct Prot 3(2):76–82
Oosterhaven J, Bouwmeester MC (2016) A new approach to modeling the impact of
disruptive events. J RegSci 56:5 83–595.
Opiyo, F. E., Wasonga, O. V. and Nyangito, M. M. (2014) ‘Measuring household
vulnerability to climate-induced stresses in pastoral rangelands of Kenya:
implications for resilience programming’, Pastoralism 4(1): 10.
Palmer PI, Smith MJ (2014) Earth systems: model human adaptation to climate change.
Nature 365–366.
Park J, Cho J, Gordon P, Moore JE, Richardson HW, Yoon S (2011) Adding a freight
network to a national interstate input–output model: a transniemo application for
california. J Transp Geogr 19(6):1410–1422
Partridge MD (2010) The duelling models: NEG vs amenity migration in explaining US
engines of growth. Pap Reg Sci 89(3):513–536.
Paton, D. (2003) ‘Disaster preparedness: a social-cognitive perspective’, Disaster
Prevention and Management: An International Journal 12(3): 210–216.
Paton, D. L. and Mamula-Seadon, K. Selway, Community Resilience in Christchurch:
Adaptive Responses and Capacities During Earthquake Recovery, GNS Science,
Lower Hutt, 2013, GNS Science Report 2013/37.
Piguet E (2010) Linking climate change, environmental degradation, and migration: a
methodological overview. Wiley Interdiscip Rev Clim Change 1(4).
Plattner GK, Allen SK, Tignor M, Midgley PM (eds) Managing the Risks of Extreme
Events and Disasters to Advance Climate Change Adaptation, University Press,
Cambridge, UK, and New York, NY, USA
Pratt S, Blake A, Swann P (2013) Dynamic general equilibrium model with uncertainty:
uncertainty regarding the future path of the economy. Econ Model 32:429–439
Prevention Web (2014) ‘Myanmar: basic country statistics and indicators’.
www.preventionweb.net/countries/mmr/data/Renschler,
Putman, S.H., 2010. DRAM residential location and land use model: 40 years of
development and application. In: Pagliara, F., Preston, J., Simmonds, D. (Eds.),
Residential Location Choice. Springer, Berlin Heidelberg, pp. 61-76.
307
Putra HC, Zhang H, Andrews C (2015) Modeling real estate market responses to climate
change in the coastal zone. JALUZ 18(2):18
Quattrociocchi W, Caldarelli G, Scala A (2014) Opinion dynamics on interacting
networks: media competition and social influence. Nat Sci Rep 4(4938)
Rabe Paul, Orl FFake, Ervin, David E., (ed.) (2014) Land Use Control , Evaluating
Economic and Political Effects. Cambridge Unirvisty Press.
Rose A (2004) Economic principles, issues and research priorities in hazard loss
estimation. In: Okuyama Y, Chang S (eds) Modeling the spatial economic impacts
of natural hazards. Springer, Netherlands, pp 119–142
Rose A, Guha GS (2004) Computable general equilibrium modeling of electric utility
lifeline losses from earthquakes. In: Okuyama Y, Chang S (eds) Modeling the
spatial economic impacts of natural hazards. Springer, Berlin, pp 119–142
Rose A, Liao SY (2005) Modeling regional economic resilience to disasters: a computable
general equilibrium analysis of water service disruptions. J Reg Sci 45(1):75–112.
Rose AZ, Oladosu G (2008) Regional economic impacts of natural and man-made hazards:
disrupting utility lifeline services to households. In: Richardson H, Gordon P,
Moore J (eds) Economic impacts of Hurricane Katrina. Edward Elgar, Cheltenham
Rounsevell M, Arneth A, Alexander P, Brown D, de Noblet-Ducoudre´ N, Ellis E,
Finnigan J, Galvin K, Safarzynska K, Brouwer R, Hofkes M (2013) Evolutionary
modelling of the macro-economic impacts of catastrophic flood events. Ecol Econ
88:108–118
Sastry ML (1992) Estimating the economic impacts of elderly migration: an input–output
analysis. Growth Change 23(1):54–79
Saunders W.S.A. and Becker J.S. (2015).A discussion of resilience and sustainability:
Land use planning recovery from the Canterbury earthquake sequence, New
Zealand. International Journal of Disaster Risk Reduction Vol. 14. 73–81
Saunders, W.S.A. J.G. Beban, M.A. Coomer (2015). Analysis of Natural Hazard
Provisions in Regional Policy Statements, Territorial Authority Plans, and CDEM
Group Plans, GNS Science, Lower Hutt, 2014.
Schelling TC (1969) Models of segregation. Am Econ Rev 59(2):488–493
Schelling TC (1978) Micromotives and macrobehaviour. Norton, New York
308
Schreiner, M. (2012) ‘A simple poverty scorecard for Myanmar. Microfinance risk
management’.
www.microfinance.com/English/Papers/Scoring_Poverty_Myanmar_EN_2009.pdf
Scrieciu S, Barker T, Ackerman F (2013) Pushing the boundaries of climate economics:
critical issues to consider in climate policy analysis. Ecol Econ 85:155–165
Shekhar S., (2005). A scientific Approach to Evacuation Planning
Sherrieb, K., Norris, F. H. and Galea, S. (2010) ‘Measuring capacities for community
resilience’, Social Indicators Research 99(2): 227–247.
Smith CD (2014) Modelling migration futures: development and testing of the rainfalls
agent-based migration model—Tanzania. Clim Dev 6(1):77–91.
Smith V, Carbone JC, Pope JC, Hallstrom D, Darden M (2006) Adjusting to natural
disasters. J Risk Uncertain 33(1):37–54
Sobiech C (2013) Theoretical research framework. Agent-based simulation of vulnerability
dynamics. a case study of the German North Sea Coast, Springer Theses, Springer,
Berlin, pp 31–73
South, A. (2011). Burma’s longest war: anatomy of the Karen conflict. Amsterdam:
Transnational Institute.
Steenge AE, Bocˇkarjova M (2007) Thinking about imbalances in post-catastrophe
economies: an input output based proposition. Econ Syst Res 19(2):205–223
Sznajd-Weron K, Sznajd J (2000) Opinion evolution in closed community. Int J Mod Phys
C 11(06):1157–1165.
Taupo T., and Noy, I., (2016). Disaster Impact on Households in Tuvalu
TCG (Tripartite Core Group) (2008) ‘Post Nargis joint assessment’. Yangon: Government
of Myanmar, ASEAN and UN. www.asean.org/wp-
content/uploads/images/archive/21765.pdf
Tesfatsion L, Judd KL (2006) Handbook of computational economics: agent-based
computational economics, vol 2. Elsevier, Amsterdam
Thywissen, K. (2006) Core terminology of disaster reduction. Hong Kong: UNU Press.
Tobin GA (1995). The levee love affair: a stormy relationship? J Am Water Resour Assoc
31(3):359–367.
309
Todo Y, Nakajima K, Matous P (2015) How do supply chain networks affect the resilience
of urban areass to natural disasters? Evidence from the great east Japan
earthquake. J Reg Sci 55(2):209–229.
Transportation Research Board (TRB) Special Report 294 (2008). The Role of Transit in
Emergency Evacuation. Committee on the Role of Public Transportation in
Emergency Evacuation. National Academies USA.
Trond G. Husby and Elco E. Koks (2017). Household migration in disaster impact
analysis: incorporating behavioural responses to risk. Nat Hazards (2017) 87:287–
305: DOI 10.1007/s11069-017-2763-0
Tsuchiya S, Tatano H, Okada N (2007) Economic loss assessment due to railroad and
highway disruptions. Econ Syst Res 19(2):147–162
Tversky A, Kahneman D (1973) Availability: a heuristic for judging frequency and
probability. Cogn Psychol 5(2):207–232
Tversky A, Kahneman D (1992) Advances in prospect theory: cumulative representation of
uncertainty. J Risk Uncertain 5(4):297–323
Twigg J., (2015). Disaster Risk Reduction. Good Practice Review. Humanitarian Practice
Network. Overseas Development Institute, UK.
Twigg, J. (2009) ‘Characteristics of a disaster-resilient community: a guidance note’.
Version 2. UNCT (UN Country Team) (2015) ‘A framework for UN’s work in the
SE’. Concept Note. Yangon: UN.
UNHCR (UN Refugee Agency) (2016) ‘Myanmar southeast operation: returns
assessment’. http://reporting.unhcr.org/node/2541
van der Leeuw SE (2008) Climate and society: lessons from the past 10,000 years.
AMBIO 37(14):476–482
Vigdor J (2008). The economic aftermath of Hurricane Katrina. J Econ Perspect
22(4):135–154.
Walley, Simon. (2011). “Developing Kenya’s Mortgage Market.” Report No. 63391-KE,
World Bank, Washington, DC.
Warner K (2010) Global environmental change and migration: governance challenges.
Glob Environ Change 20(3):402–413
Weisbuch G, Deffuant G, Amblard F, Nadal JP (2002) Meet, discuss, and segregate!.
Complexity. 7(3):55–63.

310
Wiedmann T, Minx J, Barrett J, Wackernagel M (2006) Allocating ecological footprints to
final consumption categories with input–output analysis. Ecol Econ 56(1):28–48
World Bank (2009). Disaster Risk Management Programs for Priority Countries. Global
Facility for Disaster Reduction and Recovery. International Strategy for Disaster
Reduction
World Bank (2009). Disaster Risk Management Programs for Priority Countries. Global
Facility for Disaster Reduction and Recovery. International Strategy for Disaster
Reduction
World Bank. (2011). Vietnam Urbanization Review: Technical Assistance Report, Figure
4.5: Convergence of living standards is possible. Washington, DC.
World Bank. (2016). Kenya Urbanization Review
Zhao X, Chen B, Yang Z (2009) National water footprint in an input-output framework—a
case study of china 2002. Ecol Model 220(2):245–253
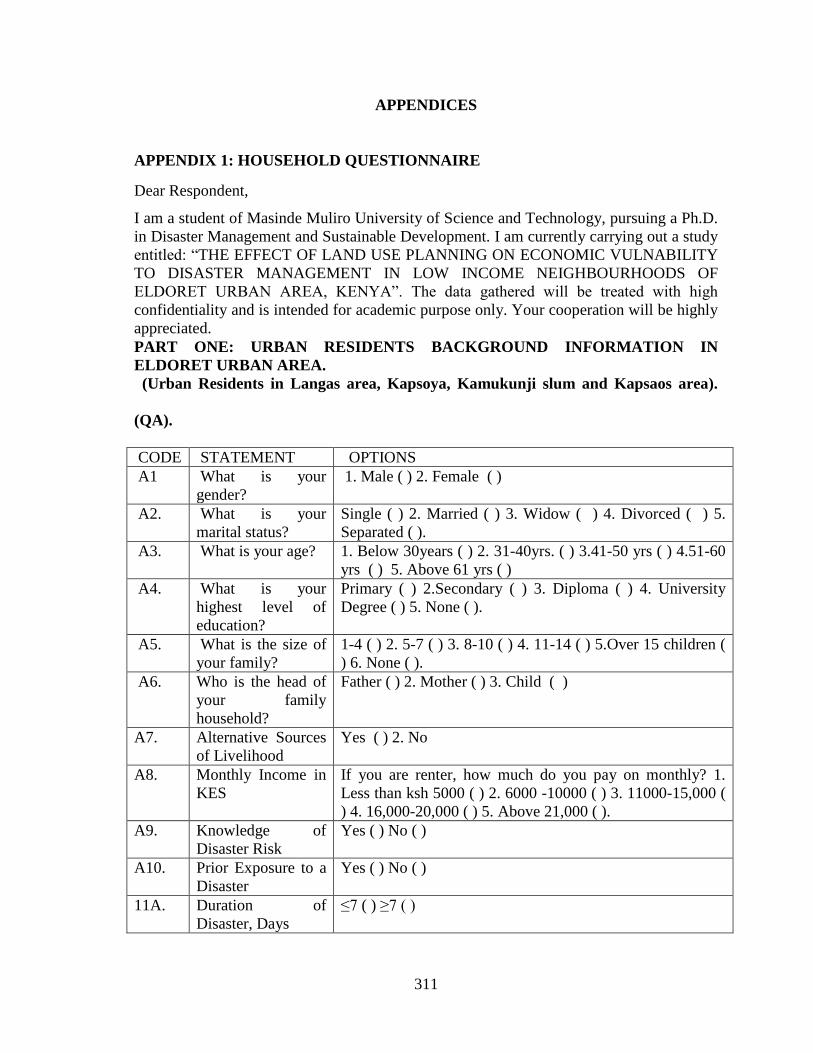
311
APPENDICES
APPENDIX 1: HOUSEHOLD QUESTIONNAIRE
Dear Respondent,
I am a student of Masinde Muliro University of Science and Technology, pursuing a Ph.D.
in Disaster Management and Sustainable Development. I am currently carrying out a study
entitled: “THE EFFECT OF LAND USE PLANNING ON ECONOMIC VULNABILITY
TO DISASTER MANAGEMENT IN LOW INCOME NEIGHBOURHOODS OF
ELDORET URBAN AREA, KENYA”. The data gathered will be treated with high
confidentiality and is intended for academic purpose only. Your cooperation will be highly
appreciated.
PART ONE: URBAN RESIDENTS BACKGROUND INFORMATION IN
ELDORET URBAN AREA.
(Urban Residents in Langas area, Kapsoya, Kamukunji slum and Kapsaos area).
(QA).
CODE STATEMENT OPTIONS
A1 What is your
gender?
1. Male ( ) 2. Female ( )
A2. What is your
marital status?
1. Single ( ) 2. Married ( ) 3. Widow ( ) 4. Divorced ( ) 5.
Separated ( ).
A3. What is your age? 1. Below 30years ( ) 2. 31-40yrs. ( ) 3.41-50 yrs ( ) 4.51-60
yrs ( ) 5. Above 61 yrs ( )
A4. What is your
highest level of
education?
1. Primary ( ) 2.Secondary ( ) 3. Diploma ( ) 4. University
Degree ( ) 5. None ( ).
A5. What is the size of
your family?
1. 1-4 ( ) 2. 5-7 ( ) 3. 8-10 ( ) 4. 11-14 ( ) 5.Over 15 children (
) 6. None ( ).
A6. Who is the head of
your family
household?
1. Father ( ) 2. Mother ( ) 3. Child ( )
A7. Alternative Sources
of Livelihood
1. Yes ( ) 2. No
A8. Monthly Income in
KES
If you are renter, how much do you pay on monthly? 1.
Less than ksh 5000 ( ) 2. 6000 -10000 ( ) 3. 11000-15,000 (
) 4. 16,000-20,000 ( ) 5. Above 21,000 ( ).
A9. Knowledge of
Disaster Risk
Yes ( ) No ( )
A10. Prior Exposure to a
Disaster
Yes ( ) No ( )
11A. Duration of
Disaster, Days
≤7 ( ) ≥7 ( )
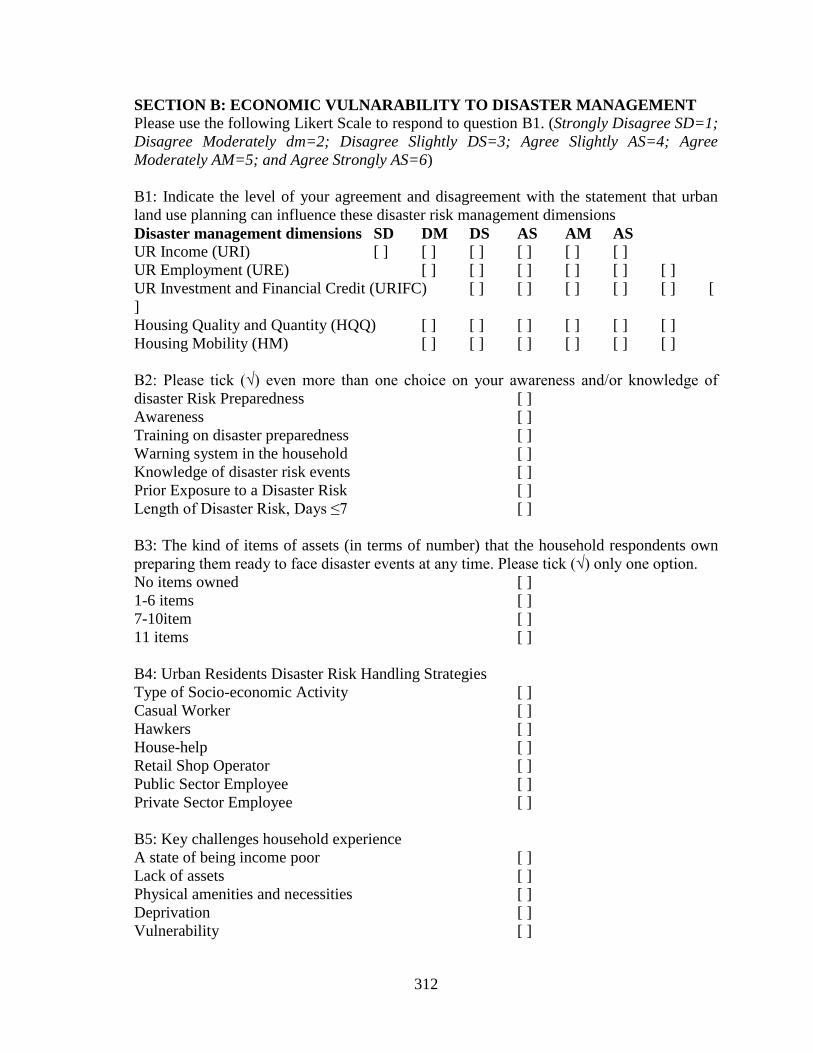
312
SECTION B: ECONOMIC VULNARABILITY TO DISASTER MANAGEMENT Please use the following Likert Scale to respond to question B1. (Strongly Disagree SD=1;
Disagree Moderately dm=2; Disagree Slightly DS=3; Agree Slightly AS=4; Agree
Moderately AM=5; and Agree Strongly AS=6)
B1: Indicate the level of your agreement and disagreement with the statement that urban
land use planning can influence these disaster risk management dimensions
Disaster management dimensions SD DM DS AS AM AS
UR Income (URI) [ ] [ ] [ ] [ ] [ ] [ ]
UR Employment (URE) [ ] [ ] [ ] [ ] [ ] [ ]
UR Investment and Financial Credit (URIFC) [ ] [ ] [ ] [ ] [ ] [
]
Housing Quality and Quantity (HQQ) [ ] [ ] [ ] [ ] [ ] [ ]
Housing Mobility (HM) [ ] [ ] [ ] [ ] [ ] [ ]
B2: Please tick (√) even more than one choice on your awareness and/or knowledge of
disaster Risk Preparedness [ ]
Awareness [ ]
Training on disaster preparedness [ ]
Warning system in the household [ ]
Knowledge of disaster risk events [ ]
Prior Exposure to a Disaster Risk [ ]
Length of Disaster Risk, Days ≤7 [ ]
B3: The kind of items of assets (in terms of number) that the household respondents own
preparing them ready to face disaster events at any time. Please tick (√) only one option.
No items owned [ ]
1-6 items [ ]
7-10item [ ]
11 items [ ]
B4: Urban Residents Disaster Risk Handling Strategies
Type of Socio-economic Activity [ ]
Casual Worker [ ]
Hawkers [ ]
House-help [ ]
Retail Shop Operator [ ]
Public Sector Employee [ ]
Private Sector Employee [ ]
B5: Key challenges household experience
A state of being income poor [ ]
Lack of assets [ ]
Physical amenities and necessities [ ]
Deprivation [ ]
Vulnerability [ ]
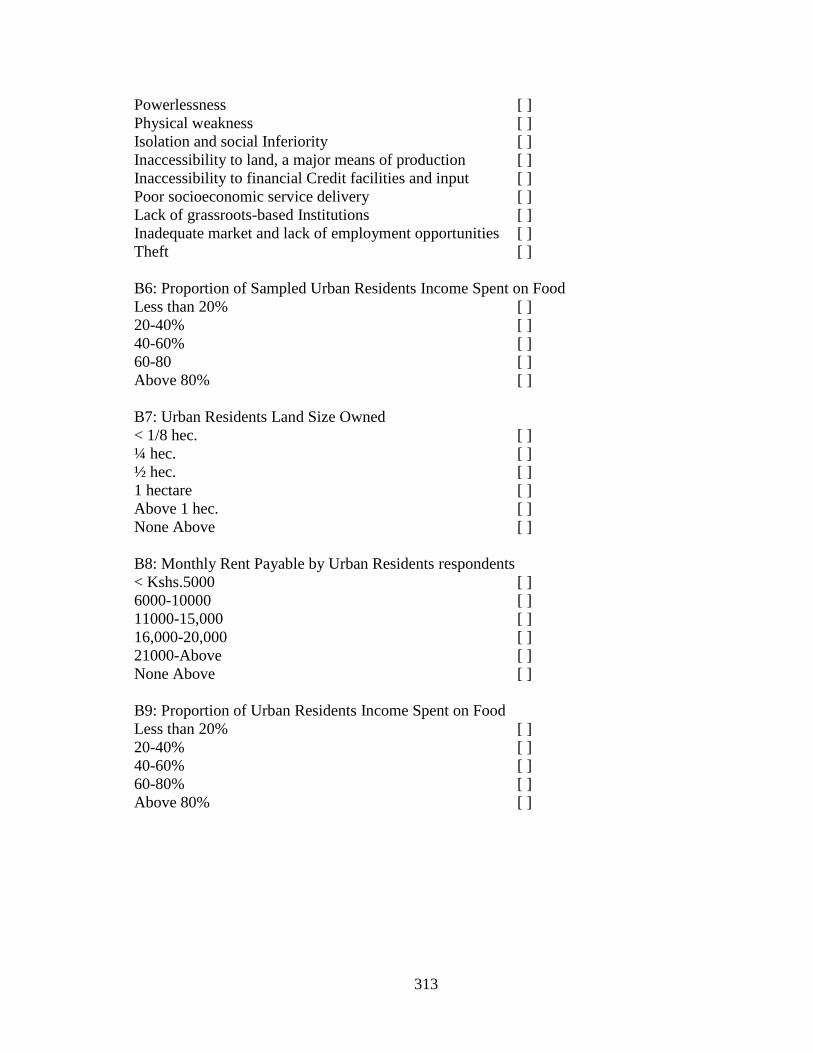
313
Powerlessness [ ]
Physical weakness [ ]
Isolation and social Inferiority [ ]
Inaccessibility to land, a major means of production [ ]
Inaccessibility to financial Credit facilities and input [ ]
Poor socioeconomic service delivery [ ]
Lack of grassroots-based Institutions [ ]
Inadequate market and lack of employment opportunities [ ]
Theft [ ]
B6: Proportion of Sampled Urban Residents Income Spent on Food
Less than 20% [ ]
20-40% [ ]
40-60% [ ]
60-80 [ ]
Above 80% [ ]
B7: Urban Residents Land Size Owned
< 1/8 hec. [ ]
¼ hec. [ ]
½ hec. [ ]
1 hectare [ ]
Above 1 hec. [ ]
None Above [ ]
B8: Monthly Rent Payable by Urban Residents respondents
< Kshs.5000 [ ]
6000-10000 [ ]
11000-15,000 [ ]
16,000-20,000 [ ]
21000-Above [ ]
None Above [ ]
B9: Proportion of Urban Residents Income Spent on Food
Less than 20% [ ]
20-40% [ ]
40-60% [ ]
60-80% [ ]
Above 80% [ ]
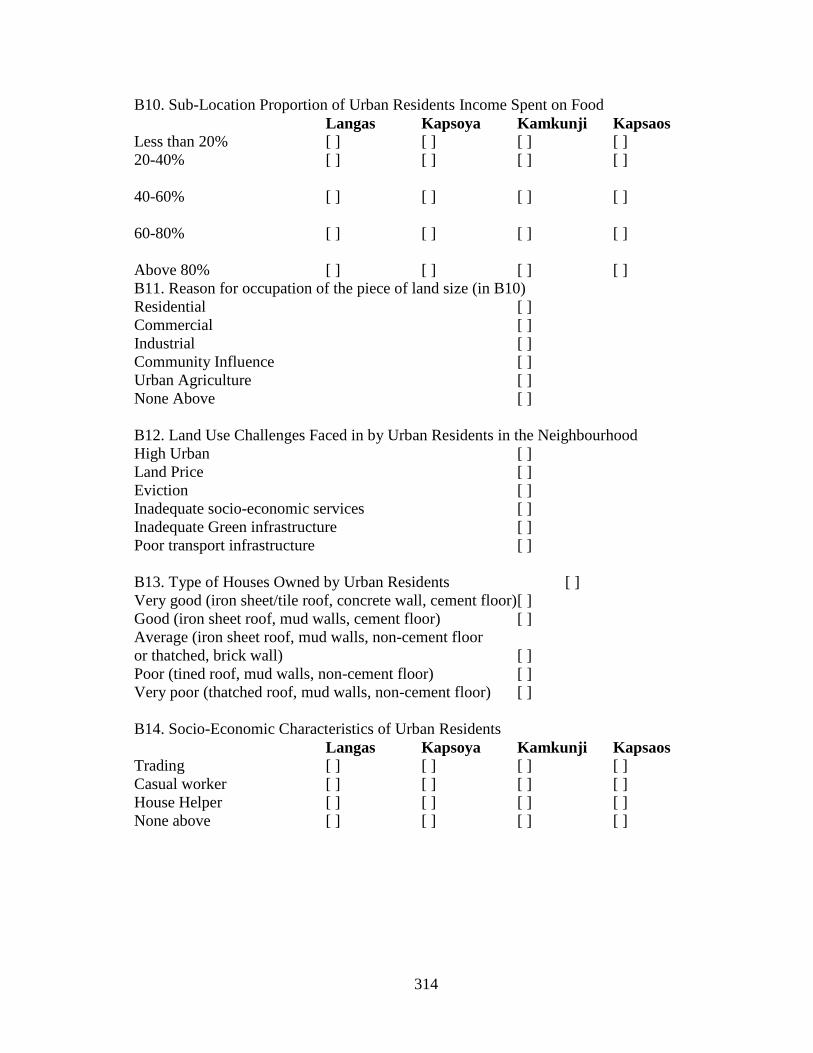
314
B10. Sub-Location Proportion of Urban Residents Income Spent on Food
Langas Kapsoya Kamkunji Kapsaos
Less than 20% [ ] [ ] [ ] [ ]
20-40% [ ] [ ] [ ] [ ]
40-60% [ ] [ ] [ ] [ ]
60-80% [ ] [ ] [ ] [ ]
Above 80% [ ] [ ] [ ] [ ]
B11. Reason for occupation of the piece of land size (in B10)
Residential [ ]
Commercial [ ]
Industrial [ ]
Community Influence [ ]
Urban Agriculture [ ]
None Above [ ]
B12. Land Use Challenges Faced in by Urban Residents in the Neighbourhood
High Urban [ ]
Land Price [ ]
Eviction [ ]
Inadequate socio-economic services [ ]
Inadequate Green infrastructure [ ]
Poor transport infrastructure [ ]
B13. Type of Houses Owned by Urban Residents [ ]
Very good (iron sheet/tile roof, concrete wall, cement floor)[ ]
Good (iron sheet roof, mud walls, cement floor) [ ]
Average (iron sheet roof, mud walls, non-cement floor
or thatched, brick wall) [ ]
Poor (tined roof, mud walls, non-cement floor) [ ]
Very poor (thatched roof, mud walls, non-cement floor) [ ]
B14. Socio-Economic Characteristics of Urban Residents
Langas Kapsoya Kamkunji Kapsaos
Trading [ ] [ ] [ ] [ ]
Casual worker [ ] [ ] [ ] [ ]
House Helper [ ] [ ] [ ] [ ]
None above [ ] [ ] [ ] [ ]
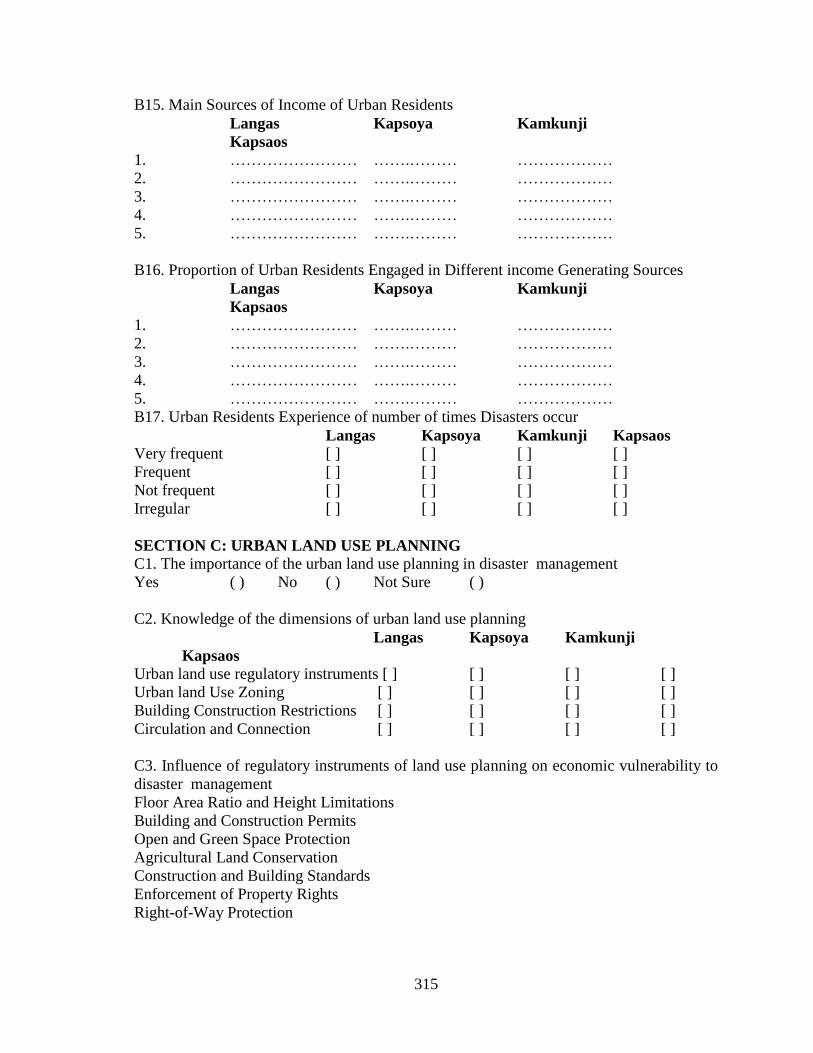
315
B15. Main Sources of Income of Urban Residents
Langas Kapsoya Kamkunji
Kapsaos
1. …………………… …….……… ………………
2. …………………… …….……… ………………
3. …………………… …….……… ………………
4. …………………… …….……… ………………
5. …………………… …….……… ………………
B16. Proportion of Urban Residents Engaged in Different income Generating Sources
Langas Kapsoya Kamkunji
Kapsaos
1. …………………… …….……… ………………
2. …………………… …….……… ………………
3. …………………… …….……… ………………
4. …………………… …….……… ………………
5. …………………… …….……… ………………
B17. Urban Residents Experience of number of times Disasters occur
Langas Kapsoya Kamkunji Kapsaos
Very frequent [ ] [ ] [ ] [ ]
Frequent [ ] [ ] [ ] [ ]
Not frequent [ ] [ ] [ ] [ ]
Irregular [ ] [ ] [ ] [ ]
SECTION C: URBAN LAND USE PLANNING
C1. The importance of the urban land use planning in disaster management
Yes ( ) No ( ) Not Sure ( )
C2. Knowledge of the dimensions of urban land use planning
Langas Kapsoya Kamkunji
Kapsaos
Urban land use regulatory instruments [ ] [ ] [ ] [ ]
Urban land Use Zoning [ ] [ ] [ ] [ ]
Building Construction Restrictions [ ] [ ] [ ] [ ]
Circulation and Connection [ ] [ ] [ ] [ ]
C3. Influence of regulatory instruments of land use planning on economic vulnerability to
disaster management
Floor Area Ratio and Height Limitations
Building and Construction Permits
Open and Green Space Protection
Agricultural Land Conservation
Construction and Building Standards
Enforcement of Property Rights
Right-of-Way Protection
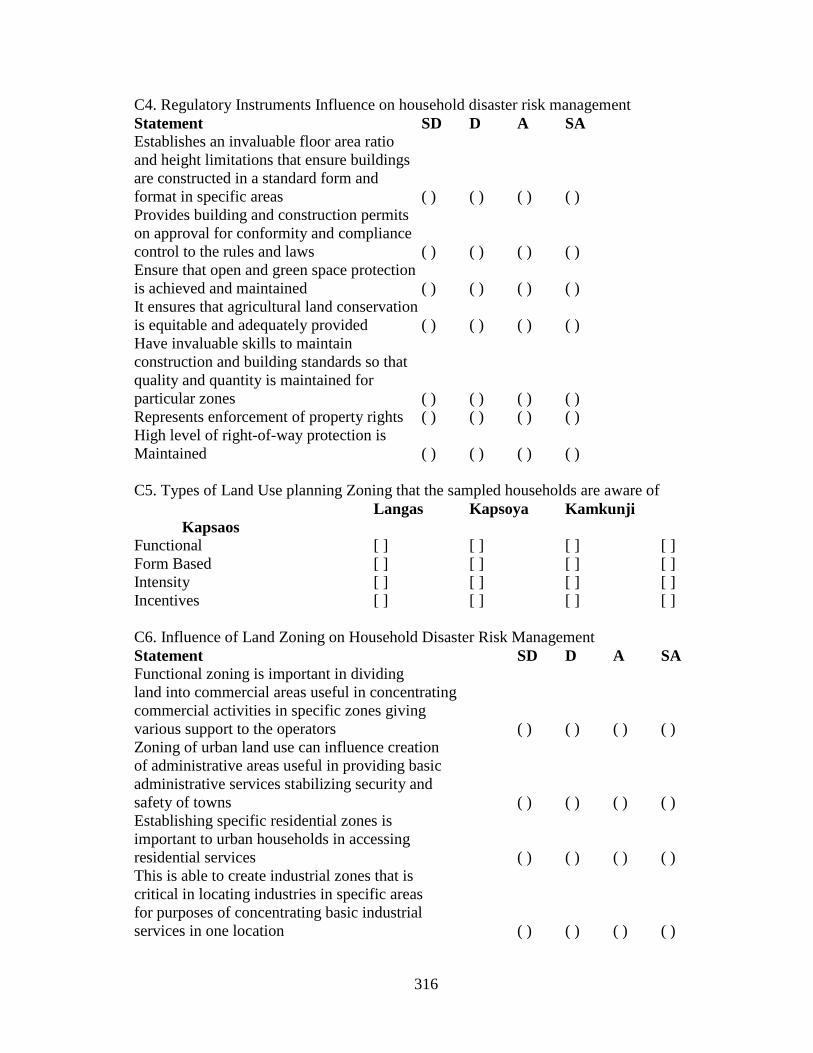
316
C4. Regulatory Instruments Influence on household disaster risk management
Statement SD D A SA
Establishes an invaluable floor area ratio
and height limitations that ensure buildings
are constructed in a standard form and
format in specific areas ( ) ( ) ( ) ( )
Provides building and construction permits
on approval for conformity and compliance
control to the rules and laws ( ) ( ) ( ) ( )
Ensure that open and green space protection
is achieved and maintained ( ) ( ) ( ) ( )
It ensures that agricultural land conservation
is equitable and adequately provided ( ) ( ) ( ) ( )
Have invaluable skills to maintain
construction and building standards so that
quality and quantity is maintained for
particular zones ( ) ( ) ( ) ( )
Represents enforcement of property rights ( ) ( ) ( ) ( )
High level of right-of-way protection is
Maintained ( ) ( ) ( ) ( )
C5. Types of Land Use planning Zoning that the sampled households are aware of
Langas Kapsoya Kamkunji
Kapsaos
Functional [ ] [ ] [ ] [ ]
Form Based [ ] [ ] [ ] [ ]
Intensity [ ] [ ] [ ] [ ]
Incentives [ ] [ ] [ ] [ ]
C6. Influence of Land Zoning on Household Disaster Risk Management
Statement SD D A SA
Functional zoning is important in dividing
land into commercial areas useful in concentrating
commercial activities in specific zones giving
various support to the operators ( ) ( ) ( ) ( )
Zoning of urban land use can influence creation
of administrative areas useful in providing basic
administrative services stabilizing security and
safety of towns ( ) ( ) ( ) ( )
Establishing specific residential zones is
important to urban households in accessing
residential services ( ) ( ) ( ) ( )
This is able to create industrial zones that is
critical in locating industries in specific areas
for purposes of concentrating basic industrial
services in one location ( ) ( ) ( ) ( )
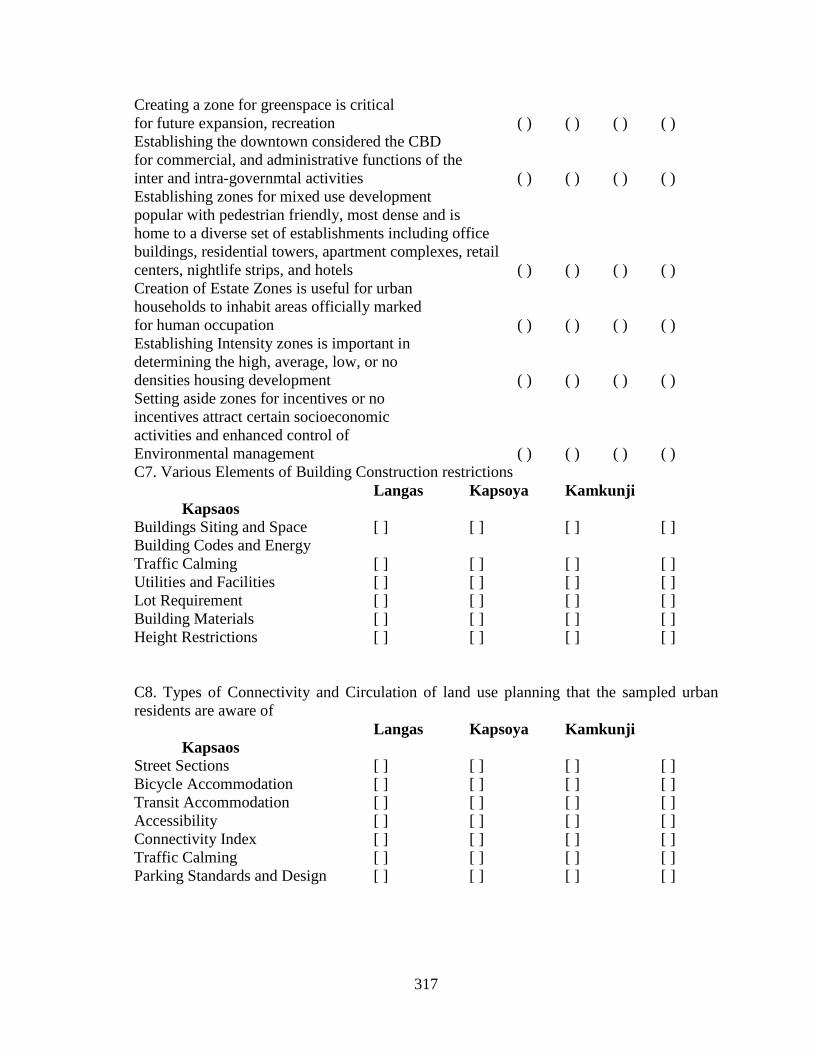
317
Creating a zone for greenspace is critical
for future expansion, recreation ( ) ( ) ( ) ( )
Establishing the downtown considered the CBD
for commercial, and administrative functions of the
inter and intra-governmtal activities ( ) ( ) ( ) ( )
Establishing zones for mixed use development
popular with pedestrian friendly, most dense and is
home to a diverse set of establishments including office
buildings, residential towers, apartment complexes, retail
centers, nightlife strips, and hotels ( ) ( ) ( ) ( )
Creation of Estate Zones is useful for urban
households to inhabit areas officially marked
for human occupation ( ) ( ) ( ) ( )
Establishing Intensity zones is important in
determining the high, average, low, or no
densities housing development ( ) ( ) ( ) ( )
Setting aside zones for incentives or no
incentives attract certain socioeconomic
activities and enhanced control of
Environmental management ( ) ( ) ( ) ( )
C7. Various Elements of Building Construction restrictions
Langas Kapsoya Kamkunji
Kapsaos
Buildings Siting and Space [ ] [ ] [ ] [ ]
Building Codes and Energy
Traffic Calming [ ] [ ] [ ] [ ]
Utilities and Facilities [ ] [ ] [ ] [ ]
Lot Requirement [ ] [ ] [ ] [ ]
Building Materials [ ] [ ] [ ] [ ]
Height Restrictions [ ] [ ] [ ] [ ]
C8. Types of Connectivity and Circulation of land use planning that the sampled urban
residents are aware of
Langas Kapsoya Kamkunji
Kapsaos
Street Sections [ ] [ ] [ ] [ ]
Bicycle Accommodation [ ] [ ] [ ] [ ]
Transit Accommodation [ ] [ ] [ ] [ ]
Accessibility [ ] [ ] [ ] [ ]
Connectivity Index [ ] [ ] [ ] [ ]
Traffic Calming [ ] [ ] [ ] [ ]
Parking Standards and Design [ ] [ ] [ ] [ ]
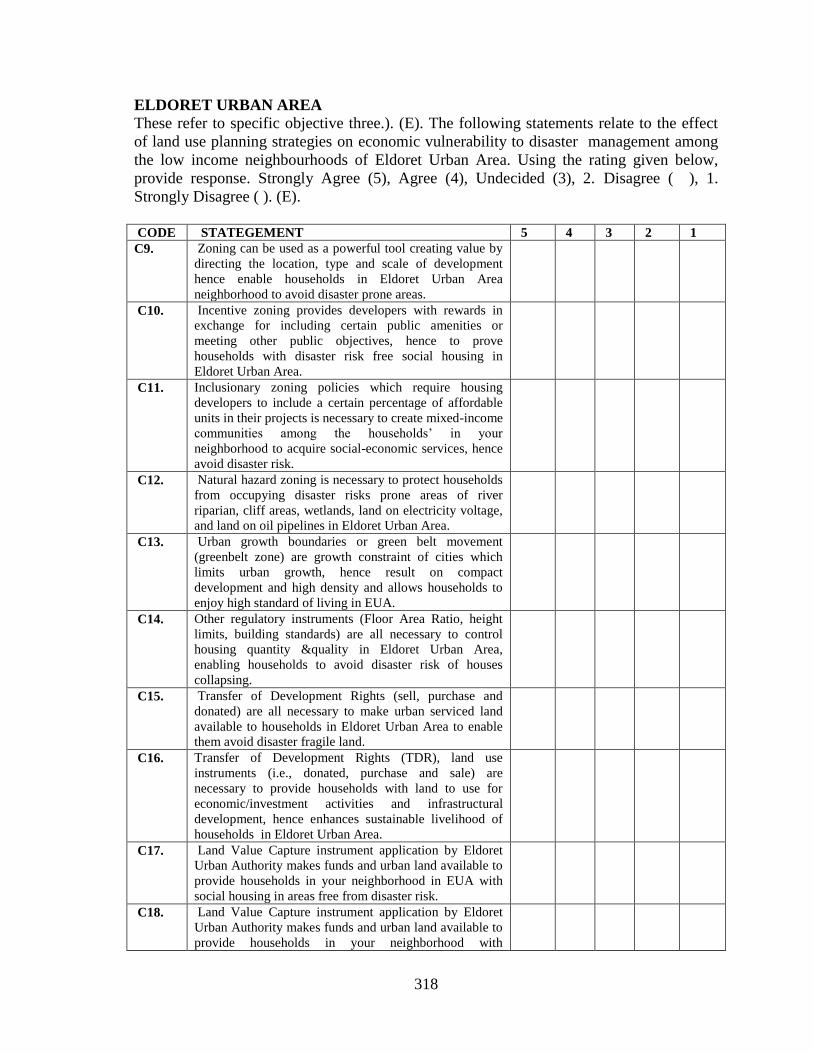
318
ELDORET URBAN AREA
These refer to specific objective three.). (E). The following statements relate to the effect
of land use planning strategies on economic vulnerability to disaster management among
the low income neighbourhoods of Eldoret Urban Area. Using the rating given below,
provide response. Strongly Agree (5), Agree (4), Undecided (3), 2. Disagree ( ), 1.
Strongly Disagree ( ). (E).
CODE STATEGEMENT 5 4 3 2 1
C9. Zoning can be used as a powerful tool creating value by
directing the location, type and scale of development
hence enable households in Eldoret Urban Area
neighborhood to avoid disaster prone areas.
C10. Incentive zoning provides developers with rewards in
exchange for including certain public amenities or
meeting other public objectives, hence to prove
households with disaster risk free social housing in
Eldoret Urban Area.
C11. Inclusionary zoning policies which require housing
developers to include a certain percentage of affordable
units in their projects is necessary to create mixed-income
communities among the households’ in your
neighborhood to acquire social-economic services, hence
avoid disaster risk.
C12. Natural hazard zoning is necessary to protect households
from occupying disaster risks prone areas of river
riparian, cliff areas, wetlands, land on electricity voltage,
and land on oil pipelines in Eldoret Urban Area.
C13. Urban growth boundaries or green belt movement
(greenbelt zone) are growth constraint of cities which
limits urban growth, hence result on compact
development and high density and allows households to
enjoy high standard of living in EUA.
C14. Other regulatory instruments (Floor Area Ratio, height
limits, building standards) are all necessary to control
housing quantity &quality in Eldoret Urban Area,
enabling households to avoid disaster risk of houses
collapsing.
C15. Transfer of Development Rights (sell, purchase and
donated) are all necessary to make urban serviced land
available to households in Eldoret Urban Area to enable
them avoid disaster fragile land.
C16. Transfer of Development Rights (TDR), land use
instruments (i.e., donated, purchase and sale) are
necessary to provide households with land to use for
economic/investment activities and infrastructural
development, hence enhances sustainable livelihood of
households in Eldoret Urban Area.
C17. Land Value Capture instrument application by Eldoret
Urban Authority makes funds and urban land available to
provide households in your neighborhood in EUA with
social housing in areas free from disaster risk.
C18. Land Value Capture instrument application by Eldoret
Urban Authority makes funds and urban land available to
provide households in your neighborhood with
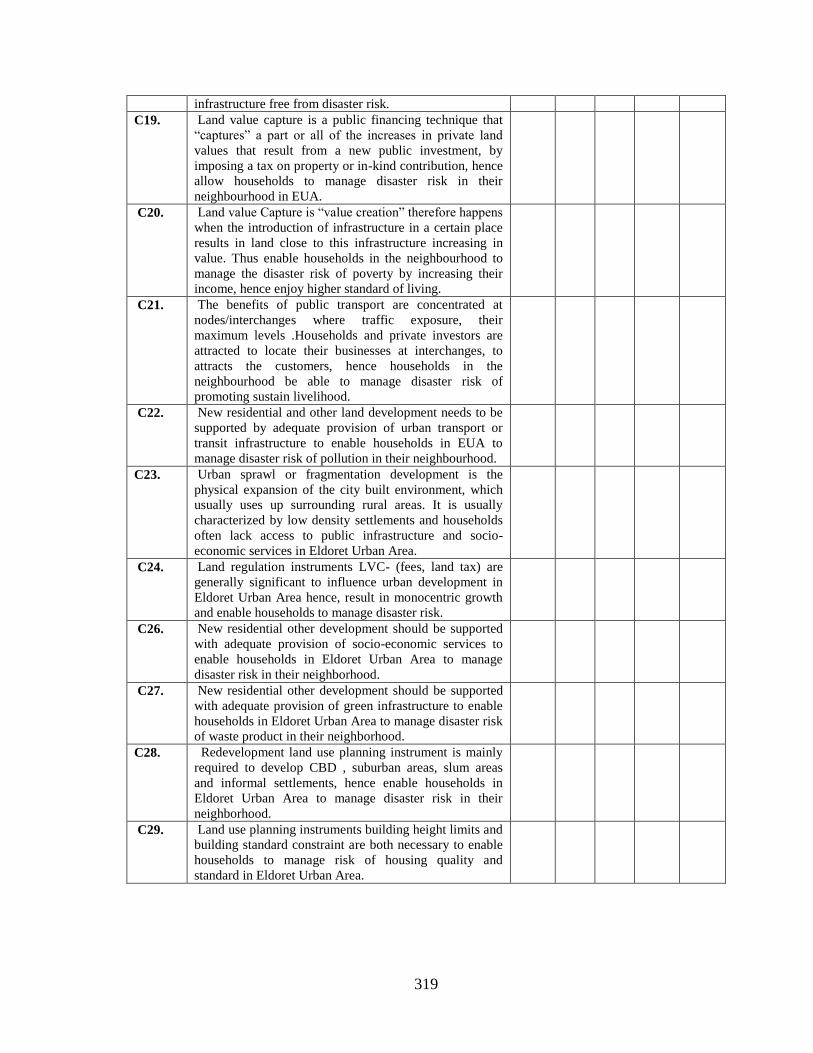
319
infrastructure free from disaster risk.
C19. Land value capture is a public financing technique that
“captures” a part or all of the increases in private land
values that result from a new public investment, by
imposing a tax on property or in-kind contribution, hence
allow households to manage disaster risk in their
neighbourhood in EUA.
C20. Land value Capture is “value creation” therefore happens
when the introduction of infrastructure in a certain place
results in land close to this infrastructure increasing in
value. Thus enable households in the neighbourhood to
manage the disaster risk of poverty by increasing their
income, hence enjoy higher standard of living.
C21. The benefits of public transport are concentrated at
nodes/interchanges where traffic exposure, their
maximum levels .Households and private investors are
attracted to locate their businesses at interchanges, to
attracts the customers, hence households in the
neighbourhood be able to manage disaster risk of
promoting sustain livelihood.
C22. New residential and other land development needs to be
supported by adequate provision of urban transport or
transit infrastructure to enable households in EUA to
manage disaster risk of pollution in their neighbourhood.
C23. Urban sprawl or fragmentation development is the
physical expansion of the city built environment, which
usually uses up surrounding rural areas. It is usually
characterized by low density settlements and households
often lack access to public infrastructure and socio-
economic services in Eldoret Urban Area.
C24. Land regulation instruments LVC- (fees, land tax) are
generally significant to influence urban development in
Eldoret Urban Area hence, result in monocentric growth
and enable households to manage disaster risk.
C26. New residential other development should be supported
with adequate provision of socio-economic services to
enable households in Eldoret Urban Area to manage
disaster risk in their neighborhood.
C27. New residential other development should be supported
with adequate provision of green infrastructure to enable
households in Eldoret Urban Area to manage disaster risk
of waste product in their neighborhood.
C28. Redevelopment land use planning instrument is mainly
required to develop CBD , suburban areas, slum areas
and informal settlements, hence enable households in
Eldoret Urban Area to manage disaster risk in their
neighborhood.
C29. Land use planning instruments building height limits and
building standard constraint are both necessary to enable
households to manage risk of housing quality and
standard in Eldoret Urban Area.
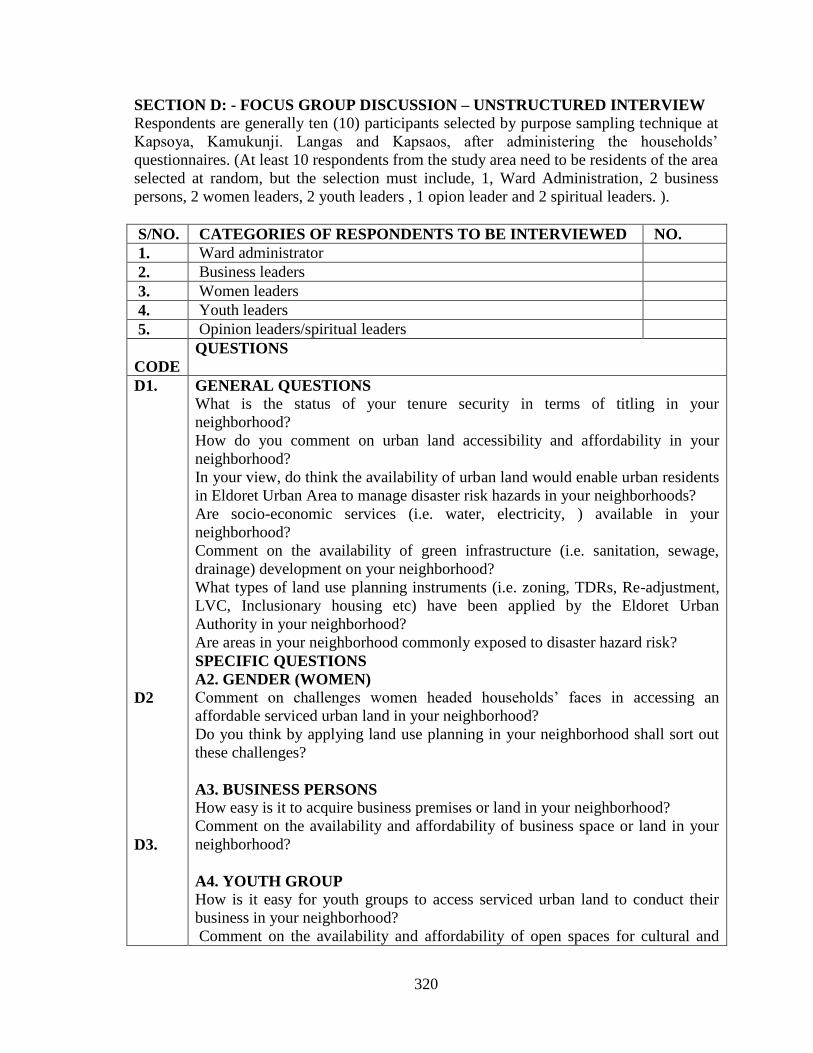
320
SECTION D: - FOCUS GROUP DISCUSSION – UNSTRUCTURED INTERVIEW
Respondents are generally ten (10) participants selected by purpose sampling technique at
Kapsoya, Kamukunji. Langas and Kapsaos, after administering the households’
questionnaires. (At least 10 respondents from the study area need to be residents of the area
selected at random, but the selection must include, 1, Ward Administration, 2 business
persons, 2 women leaders, 2 youth leaders , 1 opion leader and 2 spiritual leaders. ).
S/NO. CATEGORIES OF RESPONDENTS TO BE INTERVIEWED NO.
1. Ward administrator
2. Business leaders
3. Women leaders
4. Youth leaders
5. Opinion leaders/spiritual leaders
CODE
QUESTIONS
D1.
D2
D3.
GENERAL QUESTIONS
a) What is the status of your tenure security in terms of titling in your
neighborhood?
b) How do you comment on urban land accessibility and affordability in your
neighborhood?
c) In your view, do think the availability of urban land would enable urban residents
in Eldoret Urban Area to manage disaster risk hazards in your neighborhoods?
d) Are socio-economic services (i.e. water, electricity, ) available in your
neighborhood?
e) Comment on the availability of green infrastructure (i.e. sanitation, sewage,
drainage) development on your neighborhood?
f) What types of land use planning instruments (i.e. zoning, TDRs, Re-adjustment,
LVC, Inclusionary housing etc) have been applied by the Eldoret Urban
Authority in your neighborhood?
g) Are areas in your neighborhood commonly exposed to disaster hazard risk?
SPECIFIC QUESTIONS
A2. GENDER (WOMEN)
a) Comment on challenges women headed households’ faces in accessing an
affordable serviced urban land in your neighborhood?
b) Do you think by applying land use planning in your neighborhood shall sort out
these challenges?
A3. BUSINESS PERSONS
a) How easy is it to acquire business premises or land in your neighborhood?
b) Comment on the availability and affordability of business space or land in your
neighborhood?
A4. YOUTH GROUP
a) How is it easy for youth groups to access serviced urban land to conduct their
business in your neighborhood?
b) Comment on the availability and affordability of open spaces for cultural and

321
D4.
D5.
sporting activities in your neighborhood?
A5. RELIGIOUS GROUP
a) How does the land use planning as implemented in Eldoret Urban Authority,
assist religious organizations to access serviced land in your neighborhood?
OPINION LEADERS
a) In your view do you think that land use planning is likely to enable Eldoret Urban
Authority improve land tenure security in your neighborhood?
b) Comment on urban land administration and management especially land cadastre
system and land registration in your neighbourhood?
SECTION E: KEY INFORMANTS STUCTURED INTERVIEW
(Chiefs; Physical Planners; Sub-County administrators, Ministry of Land Officers).
Chiefs- 4, Physical Planner – 1, County land director – 1, Sub-county administrators – 4. S/NO. CATEGORIES OF RESPONDENTS TO BE INTERVIEWED. NO.
1. County Director of Lands and Planning
2. County Head of Physical Planning
3. Sub- County Administrator (
4. County Land Surveyor
5. County Land Registrar
6. County Land cadastre/ Land Officer.
7. Chiefs from each area of study (Langas, Kamukuji, Kapsoya and Kapsaos).
8. TOTAL
CODE QUESTIONS
E1.
E2.
CHIEFS OF LANGAS, KAPSOYA, KAMUKUNJI, AND KAPSAOS.
a) Comment on Land tenure security in your neighborhood?
b) What do you attributes to the development of slums and informal settlements in your
neighborhood?
c) Comment on peri-urban development in your neighborhood?
d) Outline how you have been dealing with land conflicts and disputes in your area?
e) Are areas of your neighborhoods commonly exposed to disaster hazard risks?
f) What type of disaster risks are faced by households in your neighborhood as a
result of the development of slums, informal settlements and peri-urban
development’s?. (Floods, Fire, Mudslide, Building collapsing and extra).
g) Comment on how land use planning enables Eldoret Urban Authority to reduce or
overcome disaster risk among the households in your neighborhoods?
h) As land administrator, how have you been able to deal with gender matters with
regard to NEW Kenyan constitution?
i) Outline the Land use administrative and management challenges in Eldoret Urban
Area?
i) Comment on the Eldoret Urban Area, management in terms of responding to space
accessibility availability, housing issues, employment opportunities, environmental
issues and household’s disaster risk management?
SUB-COUNTY ADMINISTRATOR
a) What is the status of land tenure security in Eldoret Urban Area?
b) How does the Eldoret Urban Area Authority deals with small scale business persons
with regard to space need in Eldoret Urban Area?
c) Has the EUA authority used Temporary Occupation Certificate to allocate business
space to households or small scale business persons in Eldoret Urban Area?
d) What do you contributes to the rapid expansion of Eldoret Urban Area`s growth?
e) Comment on the challenges of Eldoret Urban Area Authority in implementing the
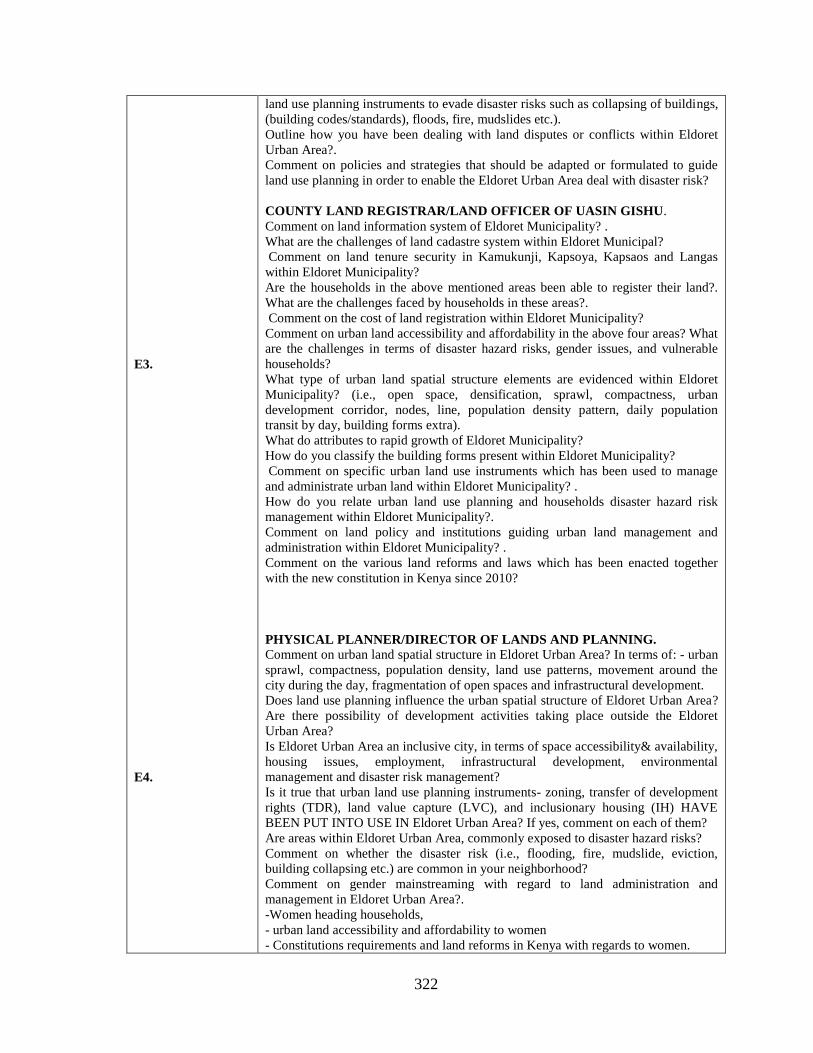
322
E3.
E4.
land use planning instruments to evade disaster risks such as collapsing of buildings,
(building codes/standards), floods, fire, mudslides etc.).
f) Outline how you have been dealing with land disputes or conflicts within Eldoret
Urban Area?.
g) Comment on policies and strategies that should be adapted or formulated to guide
land use planning in order to enable the Eldoret Urban Area deal with disaster risk?
COUNTY LAND REGISTRAR/LAND OFFICER OF UASIN GISHU.
a) Comment on land information system of Eldoret Municipality? .
b) What are the challenges of land cadastre system within Eldoret Municipal?
c) Comment on land tenure security in Kamukunji, Kapsoya, Kapsaos and Langas
within Eldoret Municipality?
d) Are the households in the above mentioned areas been able to register their land?.
What are the challenges faced by households in these areas?.
e) Comment on the cost of land registration within Eldoret Municipality?
f) Comment on urban land accessibility and affordability in the above four areas? What
are the challenges in terms of disaster hazard risks, gender issues, and vulnerable
households?
g) What type of urban land spatial structure elements are evidenced within Eldoret
Municipality? (i.e., open space, densification, sprawl, compactness, urban
development corridor, nodes, line, population density pattern, daily population
transit by day, building forms extra).
h) What do attributes to rapid growth of Eldoret Municipality?
i) How do you classify the building forms present within Eldoret Municipality?
j) Comment on specific urban land use instruments which has been used to manage
and administrate urban land within Eldoret Municipality? .
k) How do you relate urban land use planning and households disaster hazard risk
management within Eldoret Municipality?.
l) Comment on land policy and institutions guiding urban land management and
administration within Eldoret Municipality? .
m) Comment on the various land reforms and laws which has been enacted together
with the new constitution in Kenya since 2010?
n)
PHYSICAL PLANNER/DIRECTOR OF LANDS AND PLANNING.
a) Comment on urban land spatial structure in Eldoret Urban Area? In terms of: - urban
sprawl, compactness, population density, land use patterns, movement around the
city during the day, fragmentation of open spaces and infrastructural development.
b) Does land use planning influence the urban spatial structure of Eldoret Urban Area?
Are there possibility of development activities taking place outside the Eldoret
Urban Area?
c) Is Eldoret Urban Area an inclusive city, in terms of space accessibility& availability,
housing issues, employment, infrastructural development, environmental
management and disaster risk management?
d) Is it true that urban land use planning instruments- zoning, transfer of development
rights (TDR), land value capture (LVC), and inclusionary housing (IH) HAVE
BEEN PUT INTO USE IN Eldoret Urban Area? If yes, comment on each of them?
e) Are areas within Eldoret Urban Area, commonly exposed to disaster hazard risks?
f) Comment on whether the disaster risk (i.e., flooding, fire, mudslide, eviction,
building collapsing etc.) are common in your neighborhood?
g) Comment on gender mainstreaming with regard to land administration and
management in Eldoret Urban Area?.
-Women heading households,
- urban land accessibility and affordability to women
- Constitutions requirements and land reforms in Kenya with regards to women.
323
h). Does the Eldoret Urban Authority have the following documents (master plan;
spatial plan; strategic plan; and sect oral plan) to guide her urban land use
management and administration?. And how frequent do they formulate them?
i) If so how does the EUA, have been able to incorporate urban risk assessment in
those documents so as to ensure disaster risk reduction?.
g) Does Eldoret Urban Area generally, generate or develop a separate Land use
Plans different from the rest (i.e., Master Plan, Strategic Plan, Spatial Plan,
Integrated Plan or Sect oral Plan)?.
h) Does the Eldoret Urban Area authority has a vision guiding the Strategic Plan
which in turn shall enable them achieve the land use planning objectives of
efficiency, equity and sustainability?.
h) What kind of strategies and policies can be adapted by Eldoret Urban Area
Authority to enable households to manage disaster risk in their neighborhood?
- to enhancing households income, saving, investment and employment.
- improve households housing and housing environment.
-providing services and infrastructure to households in EUA.
-Enforcing urban land use regulations- building standard, FAR,.
-improved land information system and cadastre system
- improving households urban land tenure security.
i) Comment on slums/informal settlements upgrading as households disaster risk
management strategy in Eldoret Urban Area?
324
APPENDIX 2: INTERVIEW PROTOCOL
(Land use planning and households disaster risk management in Eldoret Urban Area,
Kenya)
1. Date of interview-------------------------------------------------------------------------------
2. Time of interview----------------------------------------------------------------------------------
3. Place of interview---------------------------------------------------------------------------------
4. Interviewer-----------------------------------------------------------------------------------------
5. Interviewee-------------------------------------------------------------------------------------------
6. Position of interviewee-----------------------------------------------------------------------------
7. Briefly describe the project:- The project is based on the above research topic, which is
a PhD study.
1. Questions: - Are attached.
2. Researcher: - Dedan Oriewo Ong`anya
Reg. No. CDS/H/10/09
Center for Disaster Management and Humanitarian Assistance
Masinde Muliro University of Science and Technology
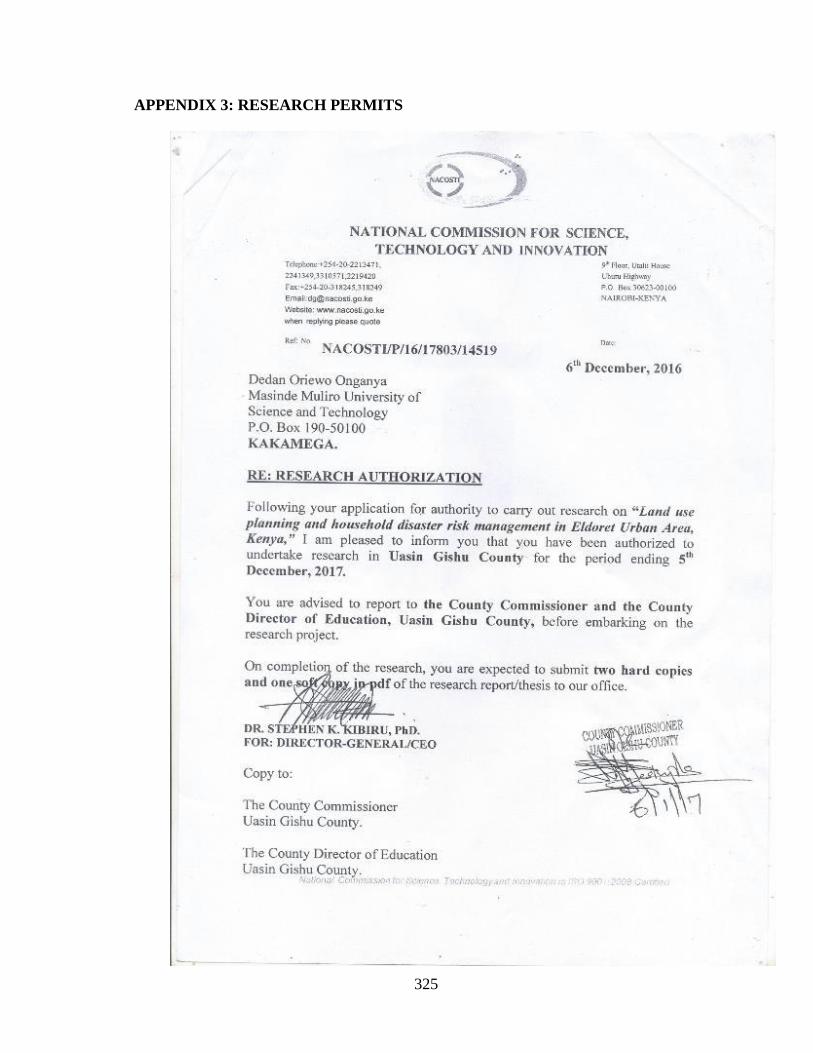
325
APPENDIX 3: RESEARCH PERMITS
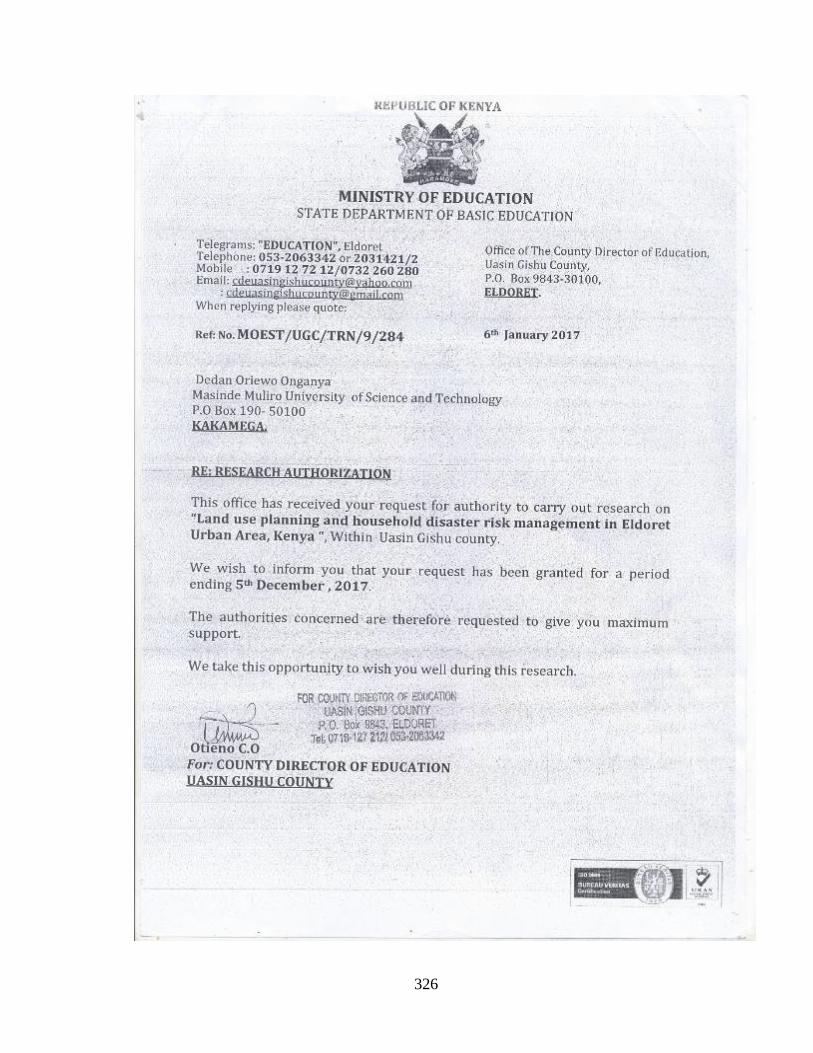
326
327