Planning Group on Economic Issues (PGECON) 16
36
Planning Group on Economic Issues (PGECON) 16 th – 19 th April 2012 Salerno (Italy)
-
Upload
khangminh22 -
Category
Documents
-
view
3 -
download
0
Transcript of Planning Group on Economic Issues (PGECON) 16
Planning Group on Economic Issues
(PGECON)
16th – 19th April 2012 Salerno (Italy)
2
TABLE OF CONTENTS
1 Executive summary...................................................................................................... 3
2 Introduction .................................................................................................................. 4
2.1 Terms of Reference for PGECON 2012 ...................................................................... 4
2.2 Participants ................................................................................................................... 5
3 The revision of the data collection framework: the new Data Collection Multi Annual Plan for the period 2014-2020 ................................................................................................... 5
3.1 The general principles of the new DCMAP and its structure ...................................... 6
3.2 Technical and operative issues of the new DCMAP and its structure ......................... 8
3.3 Level of aggregation of economic data ...................................................................... 10
4 Common understanding of the Ecosystem Indicator: Fuel Efficiency of fish capture (App. XIII EU Decision 93/2010)........................................................................................ 10
5 Common understanding of the variable “Direct subsidies” (App. VI EU Decision 93/2010).................................................................................................................................... 13
6 Compare price per capacity unit, depreciation rates and other assumptions applied by MS in estimating capital value and capital costs .................................................................. 16
7 Assess values of accuracy indicators and compare precision values for different fleet segments and different variables ................................................................................ 19
8 Review of questionnaires used for the collection of economic data (fleet, aquaculture and processing) ................................................................................................................. 21
9 Development of a European Data base of economic data (fleet, aquaculture and processing).................................................................................................................................... 21
10 Identify needs for further actions and suggest appropriate follow-up (studies, workshops, RCM coordination) .................................................................................................... 22
10.1 Workshops.................................................................................................................. 22
10.2 Studies ........................................................................................................................ 24
11 Next year PGECON: date and venue and appointment of the chair person .............. 24
12 Final conclusions and recommendations ................................................................... 25
13 PGECON 2012 List of Participants ........................................................................... 29
Annex 1: Agenda of the 2012 PGECON.................................................................................. 32
Annex 2: Templates circulated before the meeting.................................................................. 34
3
1 EXECUTIVE SUMMARY
The Planning Group on Economic Issues met in Salerno, from 16th to 19th April 2012. The terms of reference for the meeting are given in section 2.1. 27 experts from 16 Member States attended the meeting.
PGECON is an operative meeting with a general aim to compare different approaches and to share different experiences. Participation is open to national experts involved in the implementation of the economic modules of the DCF. Attendance to the PGECON is expected to give useful inputs in improving the national sampling schemes.
The main conclusions and recommendations from the meeting are given in the section n.12.
The meeting dealt with a broad range of issues considered relevant for the improvement of the collection of economic data and for the evolution of the DCF.
A key topic for the meeting was the discussion on the revision of the data collection framework. This discussion considered both the general principles of the new Data Collection Multiannual Program (DCMAP) as well as the technical and operative issues of the new framework.
PGECON discussed that for the economic modules of the DCF, a certain degree of flexibility would be advisable. This will allow to adjust the data requirements in terms of level of aggregation and to include additional variables if a specific scientific or political need emerges or to exclude variables when they turn out not to be needed. However, this flexibility should not exclude the necessity to also have stability in terms of the core of the economic data requirements.
PGECON also addressed the issue of the level of aggregation of economic data. The present DCF requires the collection of economic data by fleet segment, by year and by supra-region. However, there seems to be several scientific fields where the availability of economic data at higher temporal, regional or activity-related level could be necessary. It was concluded that DCF fleet economic data should not be collected at less aggregated levels as it is not feasible to collect data at a level of resolution that fulfils all potential requirements. Rather these data should be disaggregated on the basis of other information (transversal variables) which is available at the required resolution.
PGECON compared the methodologies used by the Member States attending the meeting in calculating the ecosystem indicator on “fuel efficiency of fish capture” and the variable “direct subsidies”. The aim of this comparative exercise was to attempt the definition of a standard methodology to calculate the ecosystem indicator and the direct subsidies.
The Workshop on calculating capital value using PIM and definition of DCF variables, (13th - 17th June 2011) clarified some fundamental concepts related to the PIM methodology for the estimation of capital value and capital cost and illustrated some practical implementation of the approach. As a follow up of this workshop, PGECON carried out a comparison of the average prices per capacity unit and corresponding assumptions applied by the Member States attending the meeting.
Another important topic for the meeting was the exercise aimed at comparing the quality indicators achieved by MS, in order to share experiences and to improve the surveys implemented at national level.
4
Each participant at PGECON presented the questionnaires used for the collection of economic data for the fleet, the aquaculture and the processing sector. The presentations focused on the structure and on the general approach used.
PGECON discussed the utility to implement a European database for the delivery and the access to economic data for the fleet, the aquaculture and the fish processing sector. Most of the participants were in favour of this proposal. A specific workshop should be convened to discuss the practical implementation of such database.
PGECON suggested the Terms of Reference for two other DCF workshops to be held in 2012 (they are already included in the list of eligible meetings for 2012). No specific new studies have been requested but PGECON recommended the European Commission to launch the studies already requested by previous DCF workshops and STECF meetings.
2 INTRODUCTION
The Planning Group on Economic Issues met in Salerno, from 16th to 19st April 2012. The terms of reference for the meeting are given in section 2.1 27 experts from 16 Member States attended the meeting.
The group worked through a series of Sub Groups, presentations and plenary discussions.
In order to achieve the Terms of Reference, the chairman asked the participants before the meeting:
To prepare the following materials:
• A presentation on definitions and methodologies used to estimate the Ecosystem Indicator: Fuel Efficiency of fish capture (App. XIII EU Decision 93/2010)
• An English version of the questionnaires used for the collection of economic data (fleet, aquaculture and processing)
To compile the following 3 templates:
• Template 1 - Composition of “direct subsidies”
• Template 2 - Price per capacity unit, depreciation rates and other assumptions applied by MS in estimating capital value and capital costs
• Template 3 - Values of accuracy indicators achieved for different fleet segments and different variables (fleet, aquaculture and processing).
Templates are given in annex 2. 2.1 Terms of Reference for PGECON 2012
The specific terms of reference for PGECON were as follows:
General Terms of reference
1. Discuss methodological issues regarding the collection of economic variables and suggest best practices
2. Discuss the use of transversal and economic variables
5
3. Discuss coordination issues related to the economic modules of the DCF at European level (fleet economic data, aquaculture, processing sector)
4. Identify tasks that need a regional coordination and propose appropriate TORs for RCMs
5. Propose studies and workshops needed to improve coordination and methodological issues of data collection
6. Define guidelines for an European Data base of economic data (fleet, aquaculture and processing)
Additional specific Terms of reference for the first meeting (2012)
1. Compare price per capacity unit, depreciation rates and other assumptions applied by MS in estimating capital value and capital costs
2. Look into the consistency of depreciation as estimated through PIM and the collected data on investments carried out by the fleet segments
3. Assess values of accuracy indicators and discuss precision targets for different fleet segments and different variables
4. Presentation of questionnaires used for the collection of economic data (fleet, aquaculture and processing). Analysis of the questionnaires in order to improve them. (MS will be required to provide an English version of the questionnaire before the workshop)
5. Propose TORs for studies and workshops
6. Discuss the development of a European Data base of economic data (fleet, aquaculture and processing). Criteria and roadmap.
The agenda of the meeting is reported in annex 1.
2.2 Participants
The full list of participants at PGECON is presented in section 13.
3 The revision of the data collection framework: the new Data Collection Multi Annual Plan
for the period 2014-2020
A presentation with regard to the introduction of the new data collection multi-annual plan was delivered by Angel Calvo Santos (DG MARE). The first draft of the multi-annual programme will be available by June 2012 and a final draft should be ready by December 2012. The presentation was extremely clear and complete and gave several inputs for discussion.
The group decided to organize the discussion on the revision of DCF into two steps:
6
• First step: discuss on the general principles of the new DCMAP and its structure
• Second step: discuss the details of the new DCMAP (disaggregation of economic data, data needs and quality issues).
3.1 The general principles of the new DCMAP and its structure
The discussion was broad and can be summarized in the following conclusions/recommendations:
EMFF. In December 2011, the Commission published a proposal for a European Maritime and Fisheries Fund (EMFF), the financial pillar of the future EU data collection programme, which will provide the financial basis for national programmes implementing the EU MAP 2014- 2020. Data collection program will be part of this financial structure. This will provide a longer period of financial coverage (7 years) and a more stable structure.
However, several PGECON participants considered some potential problems with this new financial framework and asked the DG MARE representative to follow the process of technical implementation of the new EMFF in order to take into account the concerns expressed by the PGECON.
In particular, the proposal from the Commission is very different from the present implementation framework of the DCF. From the financial perspective, there will be one funding instrument for the whole7 years period and this fund will integrate financial support for the control regulation and structural funds. Some people raised concerns if under this new financial set up resources may be shifted (reprogrammed) to other activities with a higher political priority. If reprogramming will be finally allowed it could therefore be risky and could create problems for the implementation of the national programs.
DG MARE representative took note of this concern expressed by some experts and pointed out that the negotiations on the EMFF proposal and the Common Provisions of the structural funds are still going on.
Another aspect that PGECON asked the DG MARE representative to carefully consider is the possibility to exclude the data collection part of the operative programme from the “conditionality” principle which would mean a loss of financial coverage if other parts of the operative program will not be fulfilled.
It would be beneficial if the data collection will be part of the EMFF but with specific rules and a certain degree of autonomy with respect to other EMFF components.
End users, data needs and flexibility.
The new DCF will consist of one operative Programme (7 years) which will include a general framework of the National Programmes but no specific technical details. The latter should be included in the annual work plan which should be presented at the end of October of each year. This will allow to adjust the sampling plans every year and will also allow to ensure more flexibility in order to consider potential changes in data needs and updated requirements by end users.
7
End user is a very wide category, including official ones (like the Commission and the Member States) as well as any other scientific body or stakeholder organizations. It is difficult to anticipate all the possible needs of the end users.. Therefore, it would be advisable to introduce a certain degree of flexibility.
The new DCMAP will have a strong focus on regional cooperation. The role of the Regional Coordination Meeting (RCM) will be enforced. This should be the entity with the power to introduce adjustments for the biological components of the DCF.
PGECON discussed that even for the economic modules of the DCF, a certain degree of flexibility would be advisable. This will allow to recommending certain adjustments of the data to be collected. In case that a specific scientific or political need will emerge, some additional data might have to be collected, such as higher resolution data or another variable. It might, on the other hand, also be recommendable to skip certain data collection requirements in case they have shown to be of negligible importance. However, this flexibility should not exclude the necessity to also have stability in terms of the core of the economic data requirements. In this context, a fixed list of variables (like the present Appendix VI), with clear definitions and a specific fleet segmentation, should continue to be included.
The group concluded that having a flexible framework is important might be helpful, but this should be well organized and structured. A good example is the Structural Business Statistics (SBS) which have a flexible framework that is managed by a steering group that has the legal authority to make decisions. In this context, a possible solution could be that the RCM should be the legal group tackling biological variables while another group (like PGECON) should be set up for economic issues only. Who should attend this legal group (Eurostat participation could be useful) and how decisions should be taken within the group should be clarified by the new regulation.
Harmonization with Eurostat requirements and data policy.
Eurostat requests MS to collect data for structural statistics, while the DGMARE (through DCF) requests MS to collect data for scientific advice. Moreover, no economic data for the fleet and the aquaculture are requested by Eurostat.
PGECON considers that the participation of EUROSTAT at future meetings would be beneficial in order to homogenize sampling practices, data policies (like for the reporting of confidential data), and accuracy indicators between the two programmes.
Another import issue to be coordinated with Eurostat is the use of the same definitions and concepts. The group considered the definition of the glossary of economic terms suggested by STECF as essential in this respect. The group considered that EWG 11-18 listed the principles to be considered in compiling this glossary, the main aim of which is the consistency with EUROSTAT and SBS definitions.
Another aspect that could be harmonized with EUROSTAT is the procedures used to send the data, which are not send sent to EUROSTAT through data calls but on the basis of fixed deadlines. Also protocols for transmission are well defined.
8
Aquaculture. PGECON considered that the inclusion of fresh water aquaculture in National Programs will be very costly. However, DG MARE representative highlighted that in the EMFF proposal presented in December 2011, both maritime and fresh water aquaculture may be able to receive financial support under different measures Therefore, there is a well motivated reason to ask for detailed information. On the other hand it has been pointed out that freshwater aquaculture is not managed by EU authorities, but by national authorities. There is no clear link between management of marine stocks and freshwater aquaculture output. Moreover, aquaculture is not the only source of freshwater fish production, and freshwater fishery is not under consideration for data collection. The scientific value added from freshwater aquaculture data has yet to be specified.
Best practices and protocols for surveys. Over the last years and within the DCF, several workshops and working groups have been organised to suggest protocols for the collection of data and for the calculation of quality indicators. All the results and best practices are included in the reports of these meetings. However, PGECON consider it useful to establish a web repository where national experts can have access to all these documents organized by topic.
PGECON suggests to discuss how this web repository would be organized and who could implement it during the next year’s meeting.
3.2 Technical and operative issues of the new DCMAP and its structure
The discussion stemmed from the presentation of the results of the STECF/EWG 12-01 (March 2012), the working group on the revision of the DCF. The presentation was based on the draft report of the meeting, as the final report was not yet available. STECF/EWG 12-01 pointed out some critical points that should not be changed in the new DCF and suggested some points to be reviewed.
a) Fleet segmentation. The group agreed that the fleet segmentation required by the DCF (appendix III) should not be changed. A possible split of “Demersal trawlers and/or demersal seiners” into two different segments could be considered if there is a specific need by the end users.
b) Complete coverage of all the fleet. The group considered that this requirement of the DCF was included to avoid the possibility for a Member State to exclude part of the fleet from the collection of economic data. However, several Member States expressed their concerns that a lot of time and effort is being invested to collect data for vessels which catch is negligible on the whole. In case of vessels with very low productivity or very low level of activity, the quality of collected data would be very bad. On the other hand, several participants also considered that small-scale fisheries (that in some cases could be characterized by low level of activity) are very important in social terms and also in terms of fishing pressure on coastal resources.
The group concluded that:
• a common list of variables such as appendix VI of present DCF should remain and these variables should be available with regard to the whole fleet (for inactive vessels, that is vessels with zero days at sea over a year, only capacity and capital variables should be collected);
• for vessels with a very low productivity and/or a very limited activity, it should be possible to estimate economic data with no obligation to collect them through a specific survey. The
9
threshold in activity or in production, as well as models for estimation, should be agreed at supra-regional level within a well established legal framework.
• the question of how to report data in case of fleet segments which include both very active and less active vessels and whether these vessels should be reported in separate groups should also be agreed upon at supra regional level.
c) PGECON discussed the proposal made by EWG 12-01 regarding the inclusion of the financial (monetary) costs related to capital flows (depreciation costs and interest costs derived from actual financial statements like balance sheets) in the future DCF. The group understand the reason for asking such inclusion, however the group considered that access to balance sheets and other financial documents would increase the burden for those Member States that are using the questionnaires to collect economic data. The group also observed that most of the small-scale vessels do not have accounting practices and collection of financial costs for these segments would be difficult if not impossible.
The group considered the EWG 12-01 suggestion to include several additional variables. The decision to include these should depend on a cost-benefit analysis, where the specific objectives and needs for each variable should be considered.
d) Aquaculture sector. The group agreed with the recommendation from EWG 12-01 that a specific working group should discuss the issue of the segmentation for the collection of economic data in order to harmonize it with Eurostat.
The group argued that segmentation should reflect economic importance. Some of the less important species do not need to be put into separate segments. This is also proposed because of the problem of confidentiality.
e) Fish Processing. EWG 12-01 suggested to include the variable ‘raw material’ by species and origin (domestic, EU, Non-EU). PGECON considered that the variable with regards to ‘raw material’ by species and by origin was part of the DCR and was removed because of the difficulties in collecting this information. PGECON considered that to draw a link between the fishing sector and the processing sector (to assess the influence of the sector on the sustainable use of fish stocks) data on raw material used in the processing sector is necessary. However, a feasibility study should be conducted to evaluate the possibilities of realistically collecting accurate data on raw material. The group recommended that the inclusion of this variable in the new DCF should be reconsidered on the basis of the result of this study.
f) Transversal variables. PGECON considers necessary to continue to have in the regulation a fixed list of core variables to be collected coupled with corresponding definitions. However, the present DCF requires to collect a list of very detailed information on fishing effort that require a lot of effort from MS. In addition, it is not clear if these specific fishing effort data (like for instance, soaking time, number of operations,…) are required by any end users and if they are really the most appropriate and accurate to assess the effort for specific metier. Therefore, the group considers that even for the effort variables a certain level of flexibility in the new DCMAP should be advisable.
10
3.3 Level of aggregation of economic data
The present DCF requires the collection of economic data by fleet segment, by year and by supra-region. However, there seems to be several scientific fields where the availability of more disaggregated economic data could be necessary.
To open the discussion on this issue, the results of the DCF workshop on “allocation of economic data on disaggregated level” (July 2011) and an overview of the use of economic DCF data in the FISHRENT bio-economic models were presented.
The discussion that followed can be summarized in the following points:
• the resolution level of cost variables to be collected under the DCF is not sufficient for several applications (as for instance management plans, the ecosystem approach, the AER regional analysis)
• however, the DCF should not be altered with respect to the resolution requirements as it is practically impossible to get comprehensive cost data for higher resolution scales. It is considered essential to keep the current segmentation of the fleet also to ensure consistency on data series.
• more disaggregated economic data should be estimated using models and disaggregation of cost data on the basis of correlated transversal and capacity data
• common and standardized methods for disaggregation should be further developed, as recommended by STECF-EWG 11-18. A study to suggest and validate specific methodologies of disaggregation of economic data or an update of the Hamburg DCF workshop should be carried out.
• The new DCF should allow end users to ask for alternative aggregation schemes of the data. This request should be justified and discussed depending on the scientific advice that should be prepared
• The new regulation on the DCF should clearly define the governance structure (within RCMs or PGECON) that will allow end users’ needs to be considered by Member States.
4 Common understanding of the Ecosystem Indicator: Fuel Efficiency of fish capture (App.
XIII EU Decision 93/2010)
DCF requires the calculation of 9 ecosystem indicators, as reported in Appendix XIII of the Commission Decision 93/2010. Most of these indicators are estimated using biological data derived from biological sampling and survey data. Indicator number 9 “Fuel efficiency of fish capture” is defined by DCF as “Indicator of the relationship between fuel consumption and the value of landed catch. It will provide information on trends in the fuel efficiency of different fisheries”.
The group discussed on the appropriateness of this indicator to measure the impact of fishery on the ecosystem. The group also discussed on the utility of having this indicator in the DCF if the use of this
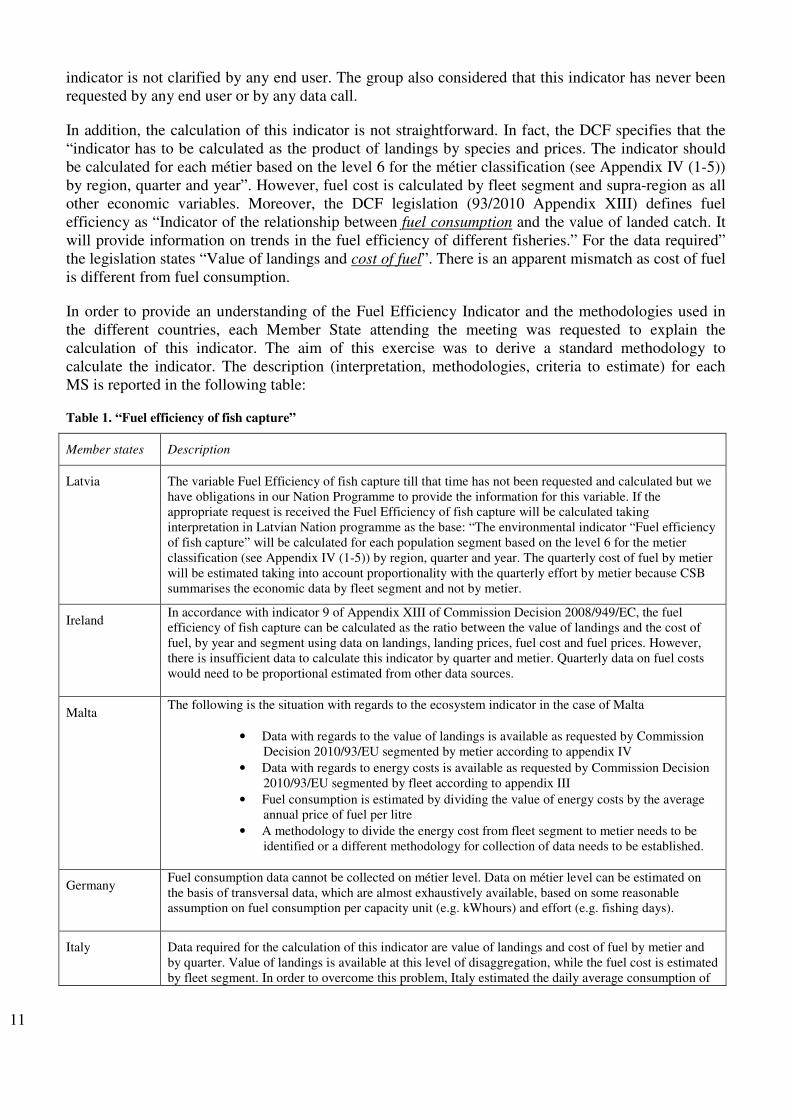
11
indicator is not clarified by any end user. The group also considered that this indicator has never been requested by any end user or by any data call.
In addition, the calculation of this indicator is not straightforward. In fact, the DCF specifies that the “indicator has to be calculated as the product of landings by species and prices. The indicator should be calculated for each métier based on the level 6 for the métier classification (see Appendix IV (1-5)) by region, quarter and year”. However, fuel cost is calculated by fleet segment and supra-region as all other economic variables. Moreover, the DCF legislation (93/2010 Appendix XIII) defines fuel efficiency as “Indicator of the relationship between fuel consumption and the value of landed catch. It will provide information on trends in the fuel efficiency of different fisheries.” For the data required” the legislation states “Value of landings and cost of fuel”. There is an apparent mismatch as cost of fuel is different from fuel consumption.
In order to provide an understanding of the Fuel Efficiency Indicator and the methodologies used in the different countries, each Member State attending the meeting was requested to explain the calculation of this indicator. The aim of this exercise was to derive a standard methodology to calculate the indicator. The description (interpretation, methodologies, criteria to estimate) for each MS is reported in the following table:
Table 1. “Fuel efficiency of fish capture”
Member states Description
Latvia The variable Fuel Efficiency of fish capture till that time has not been requested and calculated but we have obligations in our Nation Programme to provide the information for this variable. If the appropriate request is received the Fuel Efficiency of fish capture will be calculated taking interpretation in Latvian Nation programme as the base: “The environmental indicator “Fuel efficiency of fish capture” will be calculated for each population segment based on the level 6 for the metier classification (see Appendix IV (1-5)) by region, quarter and year. The quarterly cost of fuel by metier will be estimated taking into account proportionality with the quarterly effort by metier because CSB summarises the economic data by fleet segment and not by metier.
Ireland In accordance with indicator 9 of Appendix XIII of Commission Decision 2008/949/EC, the fuel efficiency of fish capture can be calculated as the ratio between the value of landings and the cost of fuel, by year and segment using data on landings, landing prices, fuel cost and fuel prices. However, there is insufficient data to calculate this indicator by quarter and metier. Quarterly data on fuel costs would need to be proportional estimated from other data sources.
Malta The following is the situation with regards to the ecosystem indicator in the case of Malta
• Data with regards to the value of landings is available as requested by Commission Decision 2010/93/EU segmented by metier according to appendix IV
• Data with regards to energy costs is available as requested by Commission Decision 2010/93/EU segmented by fleet according to appendix III
• Fuel consumption is estimated by dividing the value of energy costs by the average annual price of fuel per litre
• A methodology to divide the energy cost from fleet segment to metier needs to be identified or a different methodology for collection of data needs to be established.
Germany Fuel consumption data cannot be collected on métier level. Data on métier level can be estimated on the basis of transversal data, which are almost exhaustively available, based on some reasonable assumption on fuel consumption per capacity unit (e.g. kWhours) and effort (e.g. fishing days).
Italy Data required for the calculation of this indicator are value of landings and cost of fuel by metier and by quarter. Value of landings is available at this level of disaggregation, while the fuel cost is estimated by fleet segment. In order to overcome this problem, Italy estimated the daily average consumption of
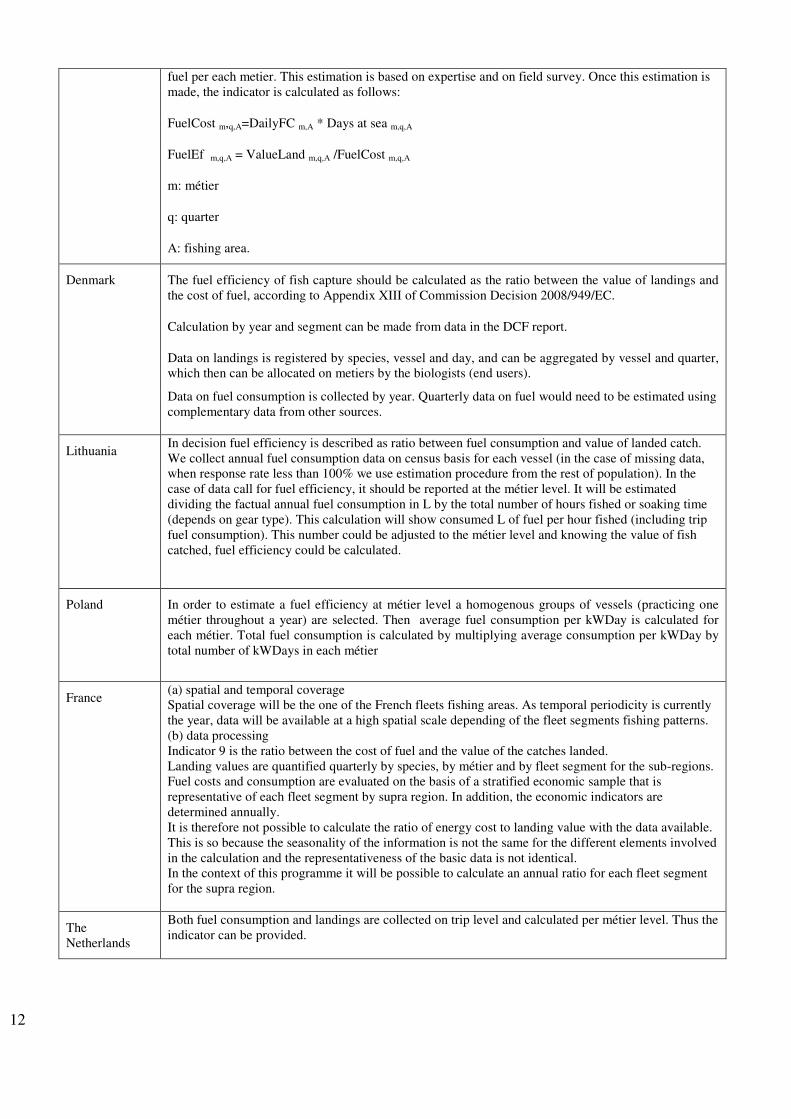
12
fuel per each metier. This estimation is based on expertise and on field survey. Once this estimation is made, the indicator is calculated as follows:
FuelCost m,q,A=DailyFC m,A * Days at sea m,q,A
FuelEf m,q,A = ValueLand m,q,A /FuelCost m,q,A
m: métier
q: quarter
A: fishing area.
Denmark The fuel efficiency of fish capture should be calculated as the ratio between the value of landings and the cost of fuel, according to Appendix XIII of Commission Decision 2008/949/EC.
Calculation by year and segment can be made from data in the DCF report.
Data on landings is registered by species, vessel and day, and can be aggregated by vessel and quarter, which then can be allocated on metiers by the biologists (end users).
Data on fuel consumption is collected by year. Quarterly data on fuel would need to be estimated using complementary data from other sources.
Lithuania In decision fuel efficiency is described as ratio between fuel consumption and value of landed catch. We collect annual fuel consumption data on census basis for each vessel (in the case of missing data, when response rate less than 100% we use estimation procedure from the rest of population). In the case of data call for fuel efficiency, it should be reported at the métier level. It will be estimated dividing the factual annual fuel consumption in L by the total number of hours fished or soaking time (depends on gear type). This calculation will show consumed L of fuel per hour fished (including trip fuel consumption). This number could be adjusted to the métier level and knowing the value of fish catched, fuel efficiency could be calculated.
Poland In order to estimate a fuel efficiency at métier level a homogenous groups of vessels (practicing one métier throughout a year) are selected. Then average fuel consumption per kWDay is calculated for each métier. Total fuel consumption is calculated by multiplying average consumption per kWDay by total number of kWDays in each métier
France (a) spatial and temporal coverage Spatial coverage will be the one of the French fleets fishing areas. As temporal periodicity is currently the year, data will be available at a high spatial scale depending of the fleet segments fishing patterns. (b) data processing Indicator 9 is the ratio between the cost of fuel and the value of the catches landed. Landing values are quantified quarterly by species, by métier and by fleet segment for the sub-regions. Fuel costs and consumption are evaluated on the basis of a stratified economic sample that is representative of each fleet segment by supra region. In addition, the economic indicators are determined annually. It is therefore not possible to calculate the ratio of energy cost to landing value with the data available. This is so because the seasonality of the information is not the same for the different elements involved in the calculation and the representativeness of the basic data is not identical. In the context of this programme it will be possible to calculate an annual ratio for each fleet segment for the supra region.
The Netherlands
Both fuel consumption and landings are collected on trip level and calculated per métier level. Thus the indicator can be provided.
13
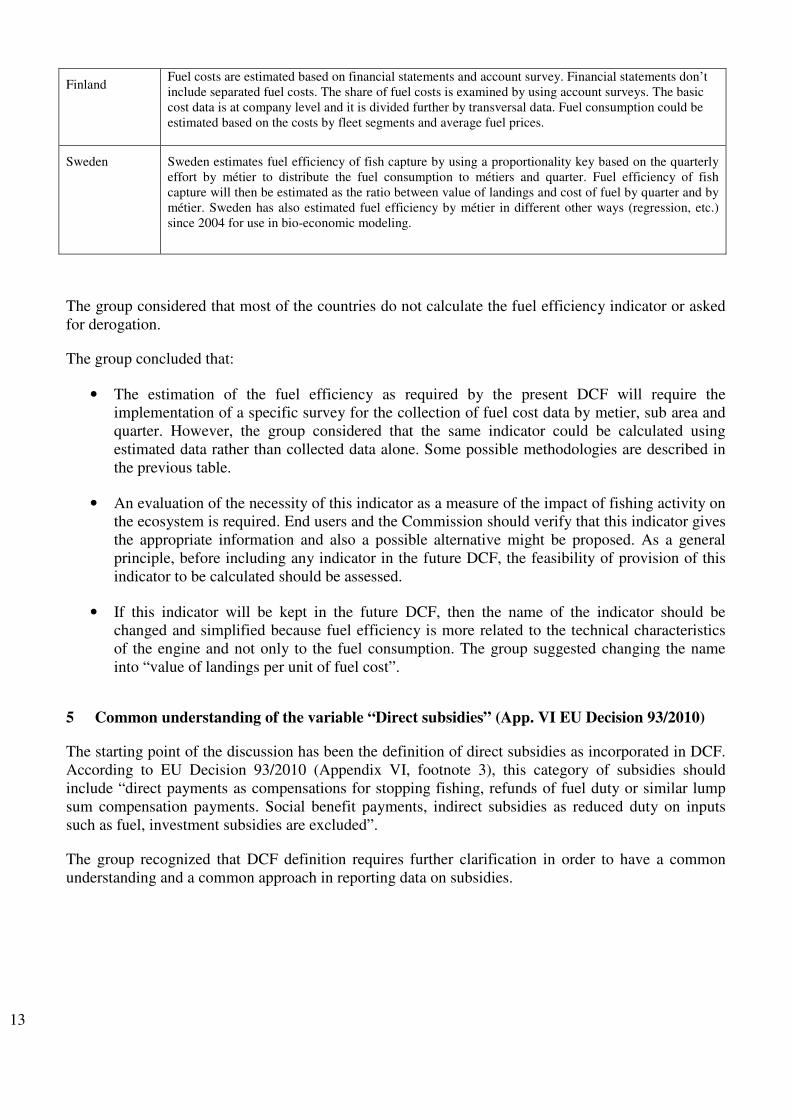
Finland Fuel costs are estimated based on financial statements and account survey. Financial statements don’t include separated fuel costs. The share of fuel costs is examined by using account surveys. The basic cost data is at company level and it is divided further by transversal data. Fuel consumption could be estimated based on the costs by fleet segments and average fuel prices.
Sweden Sweden estimates fuel efficiency of fish capture by using a proportionality key based on the quarterly effort by métier to distribute the fuel consumption to métiers and quarter. Fuel efficiency of fish capture will then be estimated as the ratio between value of landings and cost of fuel by quarter and by métier. Sweden has also estimated fuel efficiency by métier in different other ways (regression, etc.) since 2004 for use in bio-economic modeling.
The group considered that most of the countries do not calculate the fuel efficiency indicator or asked for derogation.
The group concluded that:
• The estimation of the fuel efficiency as required by the present DCF will require the implementation of a specific survey for the collection of fuel cost data by metier, sub area and quarter. However, the group considered that the same indicator could be calculated using estimated data rather than collected data alone. Some possible methodologies are described in the previous table.
• An evaluation of the necessity of this indicator as a measure of the impact of fishing activity on the ecosystem is required. End users and the Commission should verify that this indicator gives the appropriate information and also a possible alternative might be proposed. As a general principle, before including any indicator in the future DCF, the feasibility of provision of this indicator to be calculated should be assessed.
• If this indicator will be kept in the future DCF, then the name of the indicator should be changed and simplified because fuel efficiency is more related to the technical characteristics of the engine and not only to the fuel consumption. The group suggested changing the name into “value of landings per unit of fuel cost”.
5 Common understanding of the variable “Direct subsidies” (App. VI EU Decision 93/2010)
The starting point of the discussion has been the definition of direct subsidies as incorporated in DCF. According to EU Decision 93/2010 (Appendix VI, footnote 3), this category of subsidies should include “direct payments as compensations for stopping fishing, refunds of fuel duty or similar lump sum compensation payments. Social benefit payments, indirect subsidies as reduced duty on inputs such as fuel, investment subsidies are excluded”.
The group recognized that DCF definition requires further clarification in order to have a common understanding and a common approach in reporting data on subsidies.
14
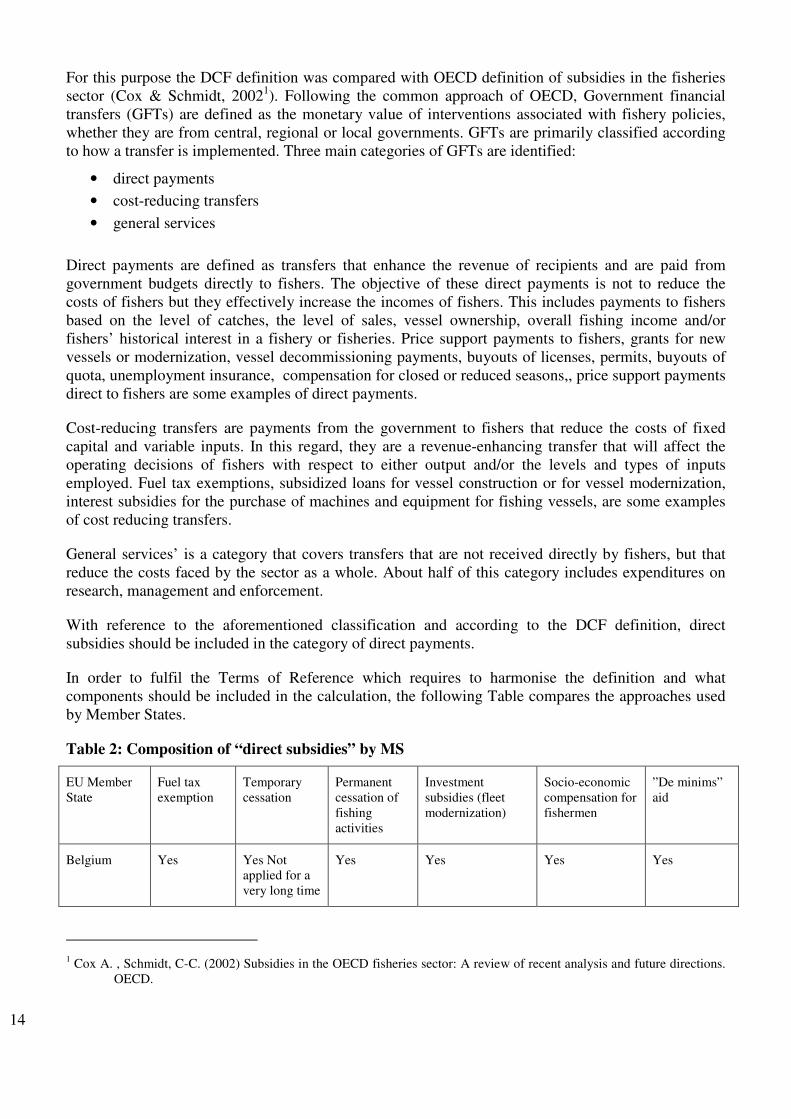
For this purpose the DCF definition was compared with OECD definition of subsidies in the fisheries sector (Cox & Schmidt, 20021). Following the common approach of OECD, Government financial transfers (GFTs) are defined as the monetary value of interventions associated with fishery policies, whether they are from central, regional or local governments. GFTs are primarily classified according to how a transfer is implemented. Three main categories of GFTs are identified:
• direct payments
• cost-reducing transfers
• general services
Direct payments are defined as transfers that enhance the revenue of recipients and are paid from government budgets directly to fishers. The objective of these direct payments is not to reduce the costs of fishers but they effectively increase the incomes of fishers. This includes payments to fishers based on the level of catches, the level of sales, vessel ownership, overall fishing income and/or fishers’ historical interest in a fishery or fisheries. Price support payments to fishers, grants for new vessels or modernization, vessel decommissioning payments, buyouts of licenses, permits, buyouts of quota, unemployment insurance, compensation for closed or reduced seasons,, price support payments direct to fishers are some examples of direct payments.
Cost-reducing transfers are payments from the government to fishers that reduce the costs of fixed capital and variable inputs. In this regard, they are a revenue-enhancing transfer that will affect the operating decisions of fishers with respect to either output and/or the levels and types of inputs employed. Fuel tax exemptions, subsidized loans for vessel construction or for vessel modernization, interest subsidies for the purchase of machines and equipment for fishing vessels, are some examples of cost reducing transfers.
General services’ is a category that covers transfers that are not received directly by fishers, but that reduce the costs faced by the sector as a whole. About half of this category includes expenditures on research, management and enforcement.
With reference to the aforementioned classification and according to the DCF definition, direct subsidies should be included in the category of direct payments.
In order to fulfil the Terms of Reference which requires to harmonise the definition and what components should be included in the calculation, the following Table compares the approaches used by Member States.
Table 2: Composition of “direct subsidies” by MS
EU Member State
Fuel tax exemption
Temporary cessation
Permanent cessation of fishing activities
Investment subsidies (fleet modernization)
Socio-economic compensation for fishermen
”De minims” aid
Belgium Yes Yes Not applied for a very long time
Yes Yes Yes Yes
1 Cox A. , Schmidt, C-C. (2002) Subsidies in the OECD fisheries sector: A review of recent analysis and future directions.
OECD.
15
Finland Yes No No Yes Yes No
France No Yes/No No No No Yes
Germany No Yes Yes Yes Yes No
Ireland No No Yes Yes No Yes
Italy No Yes No No Yes No
Malta No Yes Yes Yes No (no social benefit payments are included).
Yes
Poland Yes Yes Yes Yes Yes Yes (in form of tax exemptions)
Portugal No Yes No Yes Yes No
Sweden No Yes No Yes Yes No
DNK No Yes NO Yes Yes Yes
The Netherlands
No No No No No No
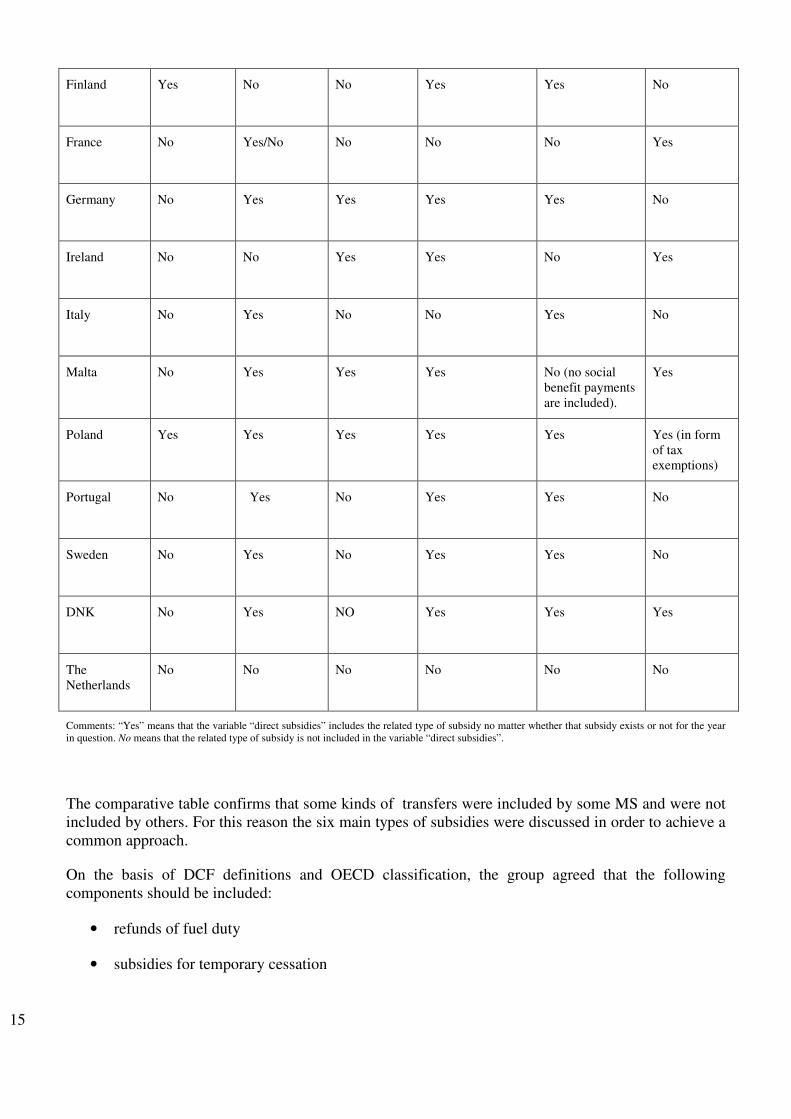
Comments: “Yes” means that the variable “direct subsidies” includes the related type of subsidy no matter whether that subsidy exists or not for the year in question. No means that the related type of subsidy is not included in the variable “direct subsidies”.
The comparative table confirms that some kinds of transfers were included by some MS and were not included by others. For this reason the six main types of subsidies were discussed in order to achieve a common approach.
On the basis of DCF definitions and OECD classification, the group agreed that the following components should be included:
• refunds of fuel duty
• subsidies for temporary cessation
16
• Socio-economic compensation for fishermen (example: funds given to the company to compensate the crew for the loss of income.)
These components have to be included because they directly increase the income of fishermen.
Socioeconomic compensations include both payments for natural disaster or funds given to the company to compensate the crew for the loss of income. The same approach should be applied for the aquaculture sector, where subsidies are used to compensate for natural disasters or other types of damages. It has been noted that at present the de minimis regulation (EC Reg. 875/2007) allows a maximum support of 30,000 Euro per firm for each three-year period during 2007-2013.
The group concluded that the following items should be excluded from direct subsidies,
• Fuel tax exemption
• Subsidies for permanent cessation of fishing activities
• Investment subsidies (fleet modernization)
In the classification of subsidies fuel tax exemption has to be distinguished from refunds of fuel duty. Only the latter s should be considered a direct payment as it directly increases the income of fishermen. On the contrary fuel tax exemption represents a cost reducing subsidy which doesn’t affect the income.
For the same reason subsidies for permanent cessation of fishing activities and investment subsidies have to be excluded from direct subsidies because they are part of investments/disinvestment . In particular, the inclusion of subsidies for permanent cessation in the income could overestimate the economic performance of those fleets which have become inactive during the year. However, even if excluded by the category of Direct Investments, subsidies for permanent cessation or for investment may represent an important source of payments, that could be properly collected and aggregated at segment level.
6 Compare price per capacity unit, depreciation rates and other assumptions applied by MS
in estimating capital value and capital costs
The starting point for the discussion was the presentation of the main conclusions of the workshop on capital value and other variables (Workshop on calculating capital value using PIM and definition of DCF variables, 13th - 17th June 2011). The presentation clarified some fundamental concepts related to the PIM methodology and illustrated its practical implementation through the excel spread sheet, developed within EC study No. FISH/2005/03.
It was clarified that the Perpetual Inventory Method is a method universally recognized as the best performing by all major international organizations (OECD, EUROSTAT) for its simplicity in computation and implementation. However, the excel format available on https://datacollection.jrc.ec.europa.eu/documents should be changed and calibrated according to the specific needs of each country. Furthermore, MS are invited to use more advanced and suitable tools if available.
The required input parameters for the implementation of the PIM through the excel spread sheet are:
17
1. Price/CU (PCU) 2. Depreciation rates (both for the linear and the degressive scheme) 3. Share of capital components in total value 4. Life time of each asset
Considering that it is difficult to obtain a sufficiently large number of observations of average price per asset item (hull, engine, electronics and other equipment), the method followed in the common spreadsheet proposes to estimate the share of each asset item in the total vessel price and to determine the average price on the basis of this share.
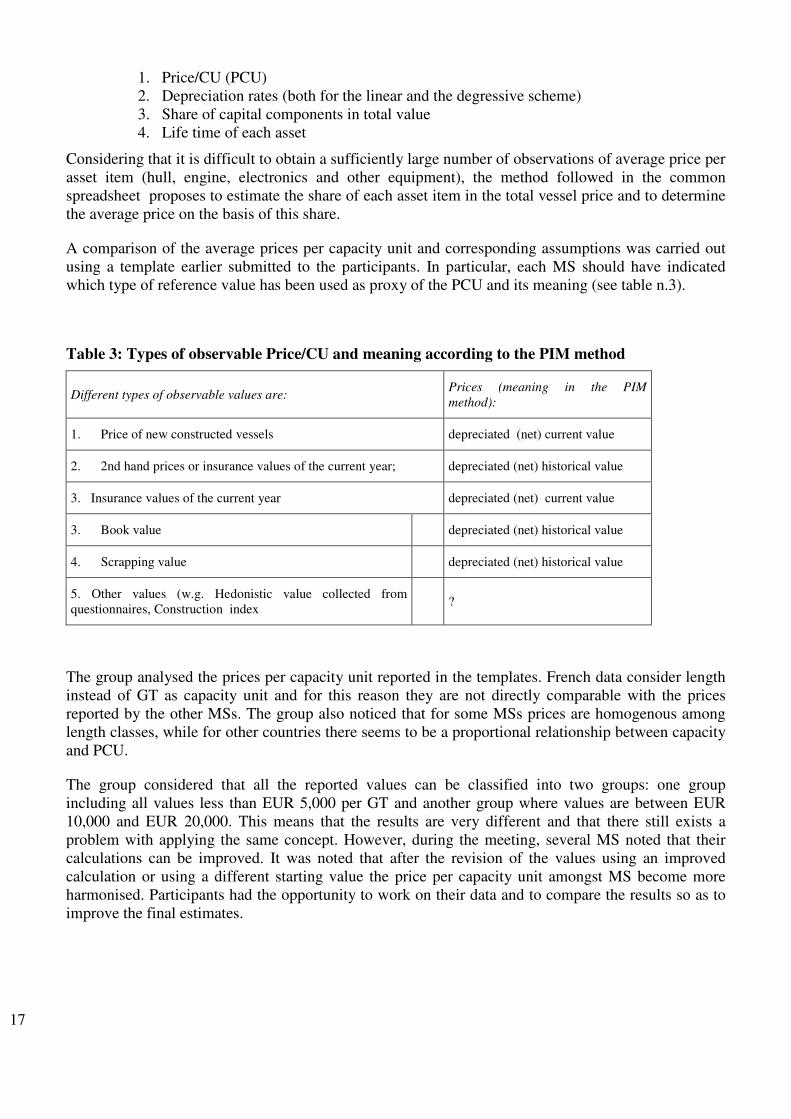
A comparison of the average prices per capacity unit and corresponding assumptions was carried out using a template earlier submitted to the participants. In particular, each MS should have indicated which type of reference value has been used as proxy of the PCU and its meaning (see table n.3).
Table 3: Types of observable Price/CU and meaning according to the PIM method
Different types of observable values are: Prices (meaning in the PIM
method):
1. Price of new constructed vessels depreciated (net) current value
2. 2nd hand prices or insurance values of the current year; depreciated (net) historical value
3. Insurance values of the current year depreciated (net) current value
3. Book value depreciated (net) historical value
4. Scrapping value depreciated (net) historical value
5. Other values (w.g. Hedonistic value collected from questionnaires, Construction index
?
The group analysed the prices per capacity unit reported in the templates. French data consider length instead of GT as capacity unit and for this reason they are not directly comparable with the prices reported by the other MSs. The group also noticed that for some MSs prices are homogenous among length classes, while for other countries there seems to be a proportional relationship between capacity and PCU.
The group considered that all the reported values can be classified into two groups: one group including all values less than EUR 5,000 per GT and another group where values are between EUR 10,000 and EUR 20,000. This means that the results are very different and that there still exists a problem with applying the same concept. However, during the meeting, several MS noted that their calculations can be improved. It was noted that after the revision of the values using an improved calculation or using a different starting value the price per capacity unit amongst MS become more harmonised. Participants had the opportunity to work on their data and to compare the results so as to improve the final estimates.
18
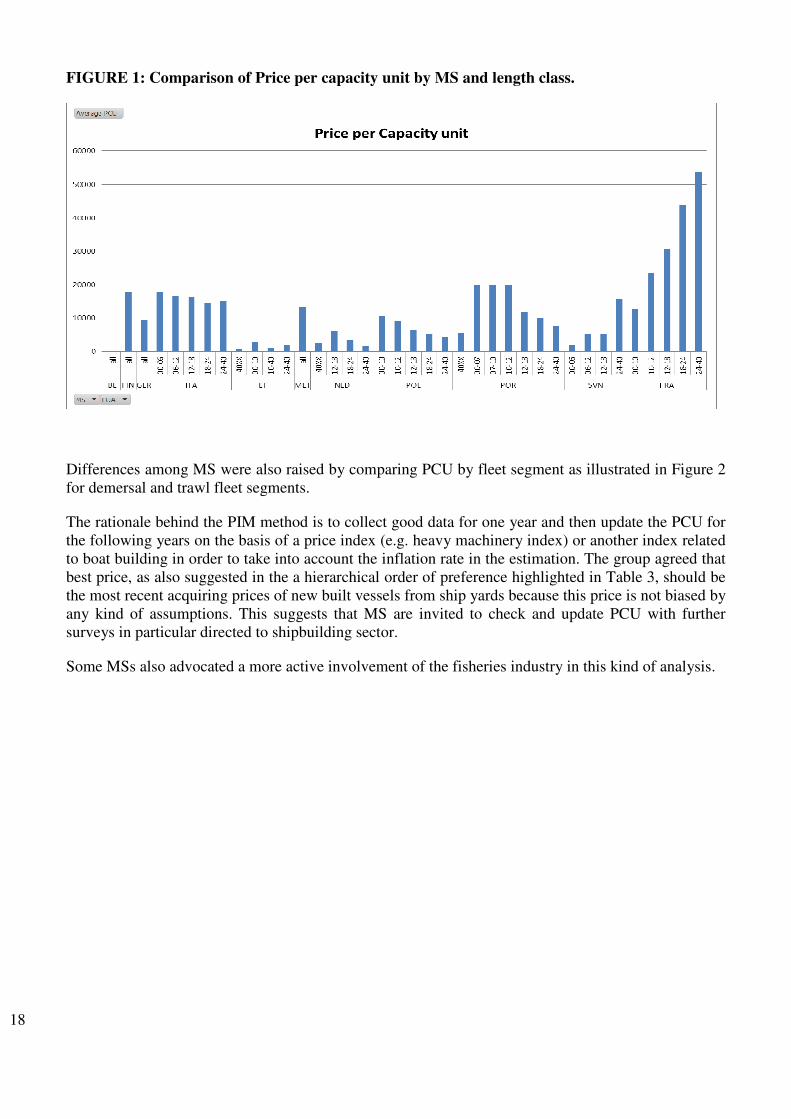
FIGURE 1: Comparison of Price per capacity unit by MS and length class.
Differences among MS were also raised by comparing PCU by fleet segment as illustrated in Figure 2 for demersal and trawl fleet segments.
The rationale behind the PIM method is to collect good data for one year and then update the PCU for the following years on the basis of a price index (e.g. heavy machinery index) or another index related to boat building in order to take into account the inflation rate in the estimation. The group agreed that best price, as also suggested in the a hierarchical order of preference highlighted in Table 3, should be the most recent acquiring prices of new built vessels from ship yards because this price is not biased by any kind of assumptions. This suggests that MS are invited to check and update PCU with further surveys in particular directed to shipbuilding sector.
Some MSs also advocated a more active involvement of the fisheries industry in this kind of analysis.

19
FIGURE 2: Comparison of Price per capacity unit by MS and fleet segments
0
5000
10000
15000
20000
25000
ITA SVN POR POL POR
DTS <12m
0
2000
4000
6000
8000
10000
12000
14000
16000
18000
ITA POL POR SVN
DTS 12-18m
0
2000
4000
6000
8000
10000
12000
14000
16000
18000
ITA NLD POL POR
DTS 18-24m
0
2000
4000
6000
8000
10000
12000
14000
16000
18000
ITA LT NLD POL POR
DTS 16-20m
In relation to the other assumptions and input parameters for the implementation of the PIM, most MS apply both types of depreciation, linear for the micro (fiscal) approach and degressive for the macro (economic) approach, with the same assumptions of the excel format. Many MS apply only the degressive depreciation scheme, considered more appropriate for the fishery sector. On the contrary some MS as Poland, France and Belgium apply only the linear depreciation scheme.
In relation to life time of the assets, most MS consider the number of years of renovation present in the format spread sheet, with the only exception of Slovenia and Netherlands.
Finally, in relation to the share in total investments of each asset, several MS as Italy, Netherlands, Germany, France, Lithuania, Slovenia apply values which differ from the common assumptions.
PGECON concluded that the comparative exercise should be repeated during the next year meeting, adding a regional approach. In addition PGECON 2013 should also investigate the sources of information of PCU used in the different countries.
7 Assess values of accuracy indicators and compare precision values for different fleet
segments and different variables
The present DCF does not request a specific target response rates or Coefficient of Variation (CV). However, a comparison of the quality indicators achieved by MS is considered a useful exercise in order to share experiences and to improve the surveys implemented at national level.
20
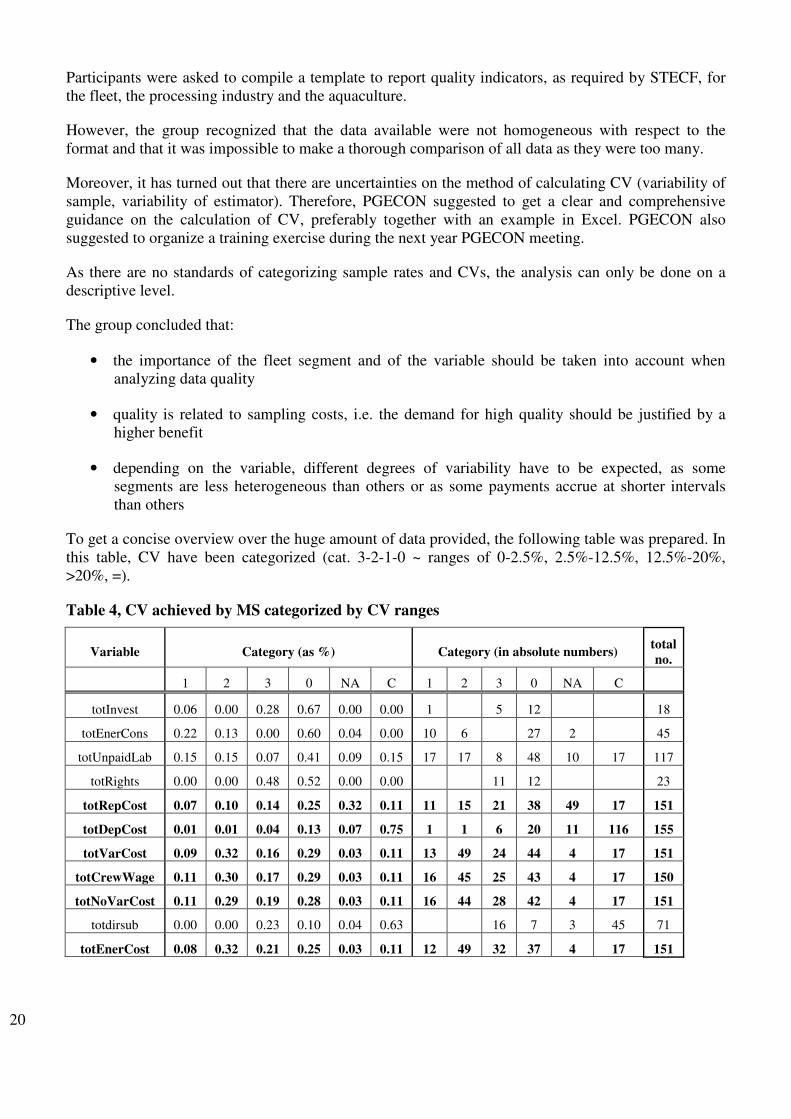
Participants were asked to compile a template to report quality indicators, as required by STECF, for the fleet, the processing industry and the aquaculture.
However, the group recognized that the data available were not homogeneous with respect to the format and that it was impossible to make a thorough comparison of all data as they were too many.
Moreover, it has turned out that there are uncertainties on the method of calculating CV (variability of sample, variability of estimator). Therefore, PGECON suggested to get a clear and comprehensive guidance on the calculation of CV, preferably together with an example in Excel. PGECON also suggested to organize a training exercise during the next year PGECON meeting.
As there are no standards of categorizing sample rates and CVs, the analysis can only be done on a descriptive level.
The group concluded that:
• the importance of the fleet segment and of the variable should be taken into account when analyzing data quality
• quality is related to sampling costs, i.e. the demand for high quality should be justified by a higher benefit
• depending on the variable, different degrees of variability have to be expected, as some segments are less heterogeneous than others or as some payments accrue at shorter intervals than others
To get a concise overview over the huge amount of data provided, the following table was prepared. In this table, CV have been categorized (cat. 3-2-1-0 ~ ranges of 0-2.5%, 2.5%-12.5%, 12.5%-20%, >20%, =).
Table 4, CV achieved by MS categorized by CV ranges
Variable Category (as %) Category (in absolute numbers) total
no.
1 2 3 0 NA C 1 2 3 0 NA C
totInvest 0.06 0.00 0.28 0.67 0.00 0.00 1 5 12 18
totEnerCons 0.22 0.13 0.00 0.60 0.04 0.00 10 6 27 2 45
totUnpaidLab 0.15 0.15 0.07 0.41 0.09 0.15 17 17 8 48 10 17 117
totRights 0.00 0.00 0.48 0.52 0.00 0.00 11 12 23
totRepCost 0.07 0.10 0.14 0.25 0.32 0.11 11 15 21 38 49 17 151
totDepCost 0.01 0.01 0.04 0.13 0.07 0.75 1 1 6 20 11 116 155
totVarCost 0.09 0.32 0.16 0.29 0.03 0.11 13 49 24 44 4 17 151
totCrewWage 0.11 0.30 0.17 0.29 0.03 0.11 16 45 25 43 4 17 150
totNoVarCost 0.11 0.29 0.19 0.28 0.03 0.11 16 44 28 42 4 17 151
totdirsub 0.00 0.00 0.23 0.10 0.04 0.63 16 7 3 45 71
totEnerCost 0.08 0.32 0.21 0.25 0.03 0.11 12 49 32 37 4 17 151
21
The group considered useful to repeat this exercise even in the next PGECON. However, the exercise should be better organized. For instance CV can be requested only for very important variables (such as fuel costs) and only for total income and total costs.
The group also considered that present quality indicators, as requested and defined by STECF are useful but could be complemented by a measure of accuracy (i.e. bias). In this context, PGECON recalled the necessity already expressed by STECF to launch a study on non response and non probability sample survey.
8 Review of questionnaires used for the collection of economic data (fleet, aquaculture and
processing)
Participants presented the questionnaires used for the collection of economic data for the fleet, the aquaculture and the processing sector. The presentations focused on the structure and on the general approach used.
As a first result of this overview, it came out that the approaches used by MS are very different and the level of complexity of the questionnaires ranges from concise ones to very structured ones. Some MS simply request the same variables required by the DCF in their questionnaires, other MS asked for more detailed information.
The group considered this exercise very useful and potentially very beneficial in proving the approaches used. However it was not possible to devote enough time to this issue during the workshop. PGECON suggested to collect all the questionnaires (preferably in English version) and to circulate them among participants.
A web repository has been created to collate all the questionnaires. A password has been given to all participants to have access to this web repository.
9 Development of a European Data base of economic data (fleet, aquaculture and processing)
In the new DCF there will be an important focus on the implementation of regional databases. These regional databases will contain transversal and biological data. Economic data will not be included as they are collected at supra region level. Only for the Mediterranean region economic, biological and economic data would be included in the same database as there is not a mismatch of geographical allocation.
PGECON discussed the implementation of a European database for the storage and access of economic data for the fleet, aquaculture and fish processing sector. Most of the participants were in favour of this proposal.
The conclusions of the discussion on this issue were asfollows:
• It would be better to have a database at European level rather than a regional database due to the problems of geographical allocation. The latter could introduce several problems as there

22
may be methodological difficulties which would introduce a greater burden on MS and would not guarantee good quality data.
• At present, economic data (fleet, aquaculture and processing) are requested every year by the Commission for the compilation of the Annual Reports on the Economic Performance of the fleet, the aquaculture sector and the processing sector. These reports are based on economic analysis of economic data aggregated at the level required by the current DCF. These reports are public and contain statistical appendixes with a compilation of all relevant data. The reports, as well as aggregated data, are downloadable from the data collection web site managed by the JRC.
• Disaggregated economic data at the level of sample units (vessel, aquaculture enterprise, processing enterprise) are stored in national databases. The group considered that no primary economic data should be stored in European databases but only aggregated data.
• The database already set up by JRC should be the starting point for the implementation of the European database of economic data.
• The group considered that a European legal entity would be the best way to manage such database. Therefore, PGECON suggested the Commission investigate if the JRC or EUROSTAT could be available to act as technical administrator of this database.
• A specific workshop (see next section) should be convened to discuss the practical implementation of such database. In particular, the following points should be considered: identification of possible end users and their scientific needs, definition of common formats for transmission of data to the central database, consideration of confidentiality and privacy problems related to the dissemination of socio economic data, identification of resources (technical and monetary) to implement the database.
• Eurostat should be consulted in the implementation of the database to ensure that common rules on publishing policies will be applied.
• An investigation with regard to the possibility of including disaggregated data in order to improve the linkage with biological data and of providing data at regional level (as required for the establishment of regional management plans as required by the CFP) should be undertaken in the future.
10 Identify needs for further actions and suggest appropriate follow-up (studies, workshops,
RCM coordination)
PGECON is the formal group that should suggest to RCMs and to the Commission workshops and studies for the improvement of methodologies and coordination activities in relation to the economic part of the DCF.
10.1 Workshops
PGECON suggested to organize the following two DCF workshop in 2012 (they are already included in the list of eligible meetings for 2012):
23
WS on Aquaculture data collection
This workshop will be organized in late October by the Portuguese Ministry of Agriculture and Sea, General Directorate for Maritime Resources and will be chaired by Leonor Elias.
The Terms of Reference for this workshop have already been drafted by EWG 11-18. PGECON reviewed them and propose the following:
• Present and discuss MS experiences in DCF for aquaculture sector: main critical aspects
• Adoption, if possible, the methodology for estimation of unpaid labour according peculiarity of main European segments
• Propose best practices to be followed by MS in estimating FTE
• Integration of the Glossary of Economic Terms
• Future DCF 2014-2020: suggest appropriate segmentation for the collection of economic data and review the list of variables required by the current DCF
WS on European economic database and on disaggregation of economic data
This workshop will be organized in October by the Maltese Ministry for Resources and Rural Affairs and will be chaired by Jörg Berkenhagen.
A first announcement will be sent to national correspondents by June 2012. The workshop will take place only if the participation of most MS and a sufficient number of statistics experts will be assured.
1. European database:
• Identification of possible end users and their scientific needs
• Definition of common formats for transmission of data to the central database
• Consideration of confidentiality and privacy problems related to the dissemination of socio economic data
• Identification of resources (technical and monetary) to implement the database
• Identification of the organization that should handle the database
2. Disaggregation of economic data
Taking into account the findings of the 2011 workshop on the needs for disaggregation (temporal, spatial, activity-related) the 2012 workshop will address the following issues:
• A practical exercise to disaggregate annual cost data to smaller regional units explicitly using transversal data which are already available.
24
• Investigate the cost structure of different activities of a vessel. This would require input information of cost data at high temporal resolution. Fuel cost seems to be most appropriate for a first approach as it might be most closely linked to different activities (steaming, trawling, different gears) and it is likely that high resolution data can be made available.
• Compile principles of crew cost determination in different fisheries. It is quite common to pay fishermen by the share of revenues. Therefore it appears helpful to compare approaches in different MS. The aim is to find common approaches for deriving crew cost from landings information.
• Exemplary application of linear models to correlate multiple variables.
The workshop can only be accomplished successfully when sufficient exemplary data will be provided and if experts with strong skills in modeling will participate to support the analyses.
10.2 Studies
No specific new studies are requested by PGECON.
However, PGECON recommended the European Commission to launch the following studies already requested by previous DCF workshops and STECF meetings:
• Study to disaggregate economic variables at metier and/or geographical areas
• Study to Standardize Quality Reporting and Propose Methods in the case of Non-Probability Sample Survey (NPSS).
• Study to propose methodologies for estimation of intangible assets in EU fisheries.
• Feasibility study on the collection of raw materials in the fish processing sector
In addition, PGECON considered essential to finalize the Glossary of the economic terms used in the DCF as already proposed by EWG 11-18.
The the glossary, as well as the results of the previous studies would be necessary also for the revision of the DCF.
11 Next year PGECON: date and venue and appointment of the chair person
The next year PGECON will be organized by LEI in the Netherlands and will be chaired by Heleen Bartelings.
The Terms of Reference for this meeting will be prepared by the chair and by the European Commission taking into account the conclusions of the 2012 PGECON, the 2012 RCMs and the 2012 liaison meeting.
25
12 FINAL CONCLUSIONS AND RECOMMENDATIONS
The PGECON was established in 2011 by the Liaison Meeting in order to provide a forum for addressing the methodological issues and the coordination tasks of the economic modules of the DCF.
The first meeting was attended by a good number of Member States. This report demonstrates that there are several important issues for which such a planning group can provide useful advice.
Participants to the PGECON concluded that it could be useful to establish this meeting on a regular basis and to include it in the future governance structure of the new DCMAP.
In the following text, a final list of conclusions and recommendations is reported. This is to be considered as just an indicative summary. For a comprehensive understanding of all the conclusions and for a complete list, please refer to the previous sections of the report.
Issue: the revision of the data collection framework: the new Data Collection Multi Annual Plan for
the period 2014-2020
In December 2011, the Commission published a proposal for a European Maritime and Fisheries Fund (EMFF), the financial pillar of the future EU data collection programme, which will provide the financial basis for national programmes implementing the EU MAP 2014- 2020. Data collection program will be part of this financial structure. This will allow to have longer period of financial coverage (7 years) and a more stable structure. However, several PGECON participants considered some potential problems with this new financial framework and asked the DG MARE representative to follow the process of technical implementation of the new EMFF.
The new DCMAP will have a strong focus on regional cooperation. The role of the Regional Coordination Meeting (RCM) will be enforced. This should be the entity which should have the power to introduce adjustments for the biological components of the DCF. PGECON discussed that even for the economic modules of the DCF, a certain degree of flexibility would be advisable. This will allow to recommending certain adjustments of the data to be collected. In case that a specific scientific or political need will emerge, some additional data might have to be collected, such as higher resolution data or another variable. It might, on the other hand, also be recommendable to skip certain data collection requirements in case they have shown to be of negligible importance. However, this flexibility should not exclude the necessity to also have stability in terms of the core of the economic data requirements. In this context, a fixed list of variables (like the present Appendix VI), with clear definitions and a specific fleet segmentation, should continue to be included. The group suggested to consider the RCM as the legal group tackling biological variables while another group (like PGECON) should be set up for economic issues only. Who should attend this legal group (Eurostat participation could be useful) and how decisions should be taken within the group should be clarified by the new regulation.
In the current DCF, economic data have to be collected for the whole fleet. The group considered that this requirement of the DCF was included to avoid the possibility for a Member State to exclude part of the fleet from the collection of economic data. However, several Member States expressed their concerns that a lot of time and effort is being invested to collect data for vessels which catch is negligible on the whole. The group concluded that a common list of variables such as appendix VI of present DCF should remain and these variables should be available with regard to the whole fleet (for
26
inactive vessels, that is vessels with zero days at sea over a year, only capacity and capital variables should be collected). However, in case there exists in a Member States a fleet segment with a very low productivity and/or a very low of activity, it should be possible to estimate economic data with no obligation to collect them through a specific survey. The threshold in activity or in production, as well as models for estimations, should be agreed at regional level within a well established legal framework.
As general recommendation, the group considered that the inclusion of additional variables in the new DCMAP should depend on a cost-benefit analysis, where the specific objectives and needs for each variable should be considered.
The present DCF requires the collection of economic data by fleet segment, by year and by supra-region. However, there seems to be several scientific fields where the availability of more disaggregated economic data could be necessary. PGECON suggested that the DCF should not be altered with respect to the resolution requirements as it is practically impossible to get comprehensive cost data for higher resolution scales. It is considered essential to keep the current segmentation of the fleet also to ensure consistency on data series. More disaggregated economic data should be estimated using models and disaggregation of cost data on the basis of correlated transversal and capacity data. In addition PGECON concluded that the new DCF should allow end users to ask for additional aggregation of the data. This request should be justified and discussed depending on the scientific advice that should be prepared and on the data availability. The new regulation on the DCF should clearly define the governance structure (within RCMs or PGECON) that will allow end users’ needs to be considered by Member States.
Issue: Common understanding of the Ecosystem Indicator: Fuel Efficiency of fish capture (App. XIII
EU Decision 93/2010)
DCF requires the calculation of 9 ecosystem indicators, as reported in Appendix XIII of the Commission Decision 93/2010. Indicator number 9 “Fuel efficiency of fish capture” is defined by DCF as “Indicator of the relationship between fuel consumption and the value of landed catch. It will provide information on trends in the fuel efficiency of different fisheries”. The group recognized that most of the countries do not calculate the fuel efficiency indicator or asked for derogation. Moreover, Appendix XIII is confused on the concept, as it defines a relationship with fuel consumption but requests fuel cost data
The group concluded that the estimation of the fuel efficiency as required by the present DCF will require the implementation of a specific survey for the collection of fuel cost data by métier, sub area and quarter. However, the group considered that the same indicator could be calculated using estimated data rather than collected data. An evaluation of the necessity of this indicator as a measure of the impact of fishing activity on the ecosystem is required. End users and the Commission should verify if this indicator gives the appropriate information. PGECON recommended that if this indicator will be kept in the future DCF, then the name of the indicator should be changed into “value of landings per fuel cost”
27
Issue: Common understanding of the variable “Direct subsidies” (App. VI EU Decision 93/2010).
The group recognized that the DCF definition reported in a footnote of appendix VI requires further clarification of the variable “direct subsidies” in order to have a common understanding and a common approach in reporting data.
On the basis of DCF definitions and OECD classification, the group agreed that the following components should be included in the variable “direct subsidies”:
• refunds of fuel duty
• subsidies for temporary cessation
• socio-economic compensation for fishermen (example: funds given to the company to compensate the crew for the loss of income.)
The group concluded that the following items should be excluded from direct subsidies:
• Fuel tax exemption
• Subsidies for permanent cessation of fishing activities
• Investment subsidies (fleet modernization)
Issue: Compare price per capacity unit, depreciation rates and other assumptions applied by MS in
estimating capital value and capital costs
Participants analyzed the prices per capacity unit estimated in different countries. This exercise showed that there still exist differences in the application of the method. During the meeting several participants discovered some errors in their calculations and received useful information on how to improve the estimations. PGECON concluded that this comparative exercise should be repeated also during the next year meeting.
Issue: Assess values of accuracy indicators and compare precision values for different fleet segments
and different variables
The present DCF does not require MS to achieve a specific target in terms of response rates or CV. However, a comparison of the quality indicators achieved by MS was carried out by PGECON in order to share experiences and to improve the surveys implemented at national level.
The group considered useful to repeat this exercise even in the next PGECON. However, the exercise should be better organized. For instance CV can be required only for very important variables (such as fuel costs) and only for total income and total costs.
The group also considered that present quality indicators, as requested and defined by STECF are useful but could be complemented by a measure of accuracy (i.e. bias). In this context, PGECON recalled the necessity already expressed by STECF to launch a study on non response and non probability sample survey.
28
Issue: Review of questionnaires used for the collection of economic data (fleet, aquaculture and
processing)
Participant presented the questionnaires used for the collection of economic data for the fleet, the aquaculture and the processing sector. As a first result of this overview, it came out that the approaches used by MS are very different and the level of complexity of the questionnaires ranges from very concise ones to very structured ones. Some MS simply report request in the questionnaires the same variables required by the DCF in the questionnaires, other MS asked for more detailed information.
The group considered this exercise very useful and potentially very beneficial in proving the approaches used. A web repository has been created to collate all the questionnaires. This instrument will allow participants to PGECON to download the different questionnaires and to analyse them in order to improve the approaches used.
Issue: Development of a European Data base of economic data (fleet, aquaculture and processing)
PGECON discussed the utility to implement a European database for the storage and the access to economic data for the fleet, the aquaculture and the fish processing sector. Most of the participants were in favour of this proposal. PGECON concluded that it would be better to have a database at European level rather than a regional database due to the problems of geographical allocation. The group considered that no primary economic data should be stored in European databases but only aggregated data. PGECON also suggested that the database already set up by JRC should be the starting point for the implementation of the European database of economic data.
The group considered that a European legal entity would be the best one to manage such database. Therefore, PGECON suggested the Commission to investigate if the JRC or EUROSTAT could be available to act as technical administrator of this database. A specific workshop should be convened to discuss the practical implementation of such database.
Issue: Identify needs for further actions and suggest appropriate follow-up (studies, workshops, RCM
coordination)
PGECON is the formal group that should suggest to RCMs and to the Commission workshops and studies for the improvement of methodologies and coordination activities in relation to the economic part of the DCF.
PGECON suggested the Terms of Reference for two other DCF workshops to be held in 2012 (they are already included in the list of eligible meetings for 2012). No specific new studies have been requested but PGECON recommended the European Commission to launch the studies already requested by previous DCF workshops and STECF meetings.
29
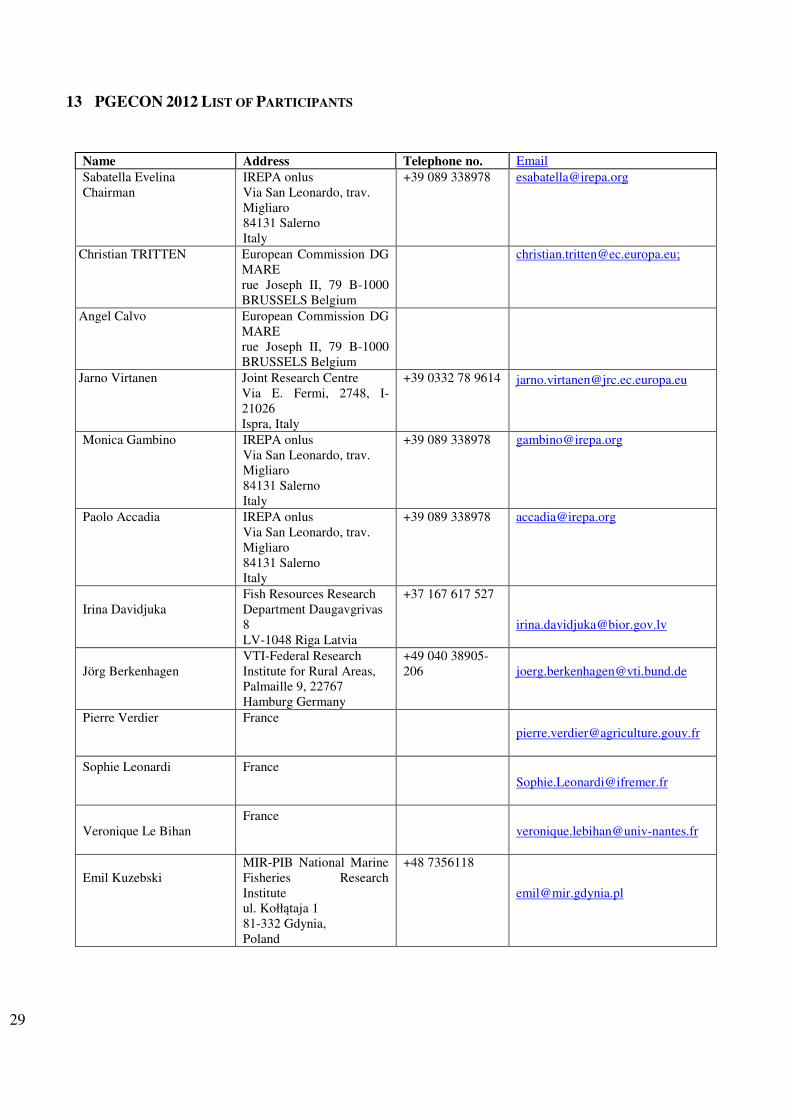
13 PGECON 2012 LIST OF PARTICIPANTS
Name Address Telephone no. Email
Sabatella Evelina Chairman
IREPA onlus Via San Leonardo, trav. Migliaro 84131 Salerno Italy
+39 089 338978
Christian TRITTEN
European Commission DG MARE rue Joseph II, 79 B-1000 BRUSSELS Belgium
Angel Calvo European Commission DG MARE rue Joseph II, 79 B-1000 BRUSSELS Belgium
Jarno Virtanen
Joint Research Centre Via E. Fermi, 2748, I-21026 Ispra, Italy
+39 0332 78 9614 [email protected]
Monica Gambino
IREPA onlus Via San Leonardo, trav. Migliaro 84131 Salerno Italy
+39 089 338978
Paolo Accadia
IREPA onlus Via San Leonardo, trav. Migliaro 84131 Salerno Italy
+39 089 338978
Irina Davidjuka
Fish Resources Research Department Daugavgrivas 8 LV-1048 Riga Latvia
+37 167 617 527
Jörg Berkenhagen
VTI-Federal Research Institute for Rural Areas, Palmaille 9, 22767 Hamburg Germany
+49 040 38905-206 [email protected]
Pierre Verdier
France
Sophie Leonardi
France
Veronique Le Bihan
France
Emil Kuzebski
MIR-PIB National Marine Fisheries Research Institute ul. Kołłątaja 1 81-332 Gdynia, Poland
+48 7356118
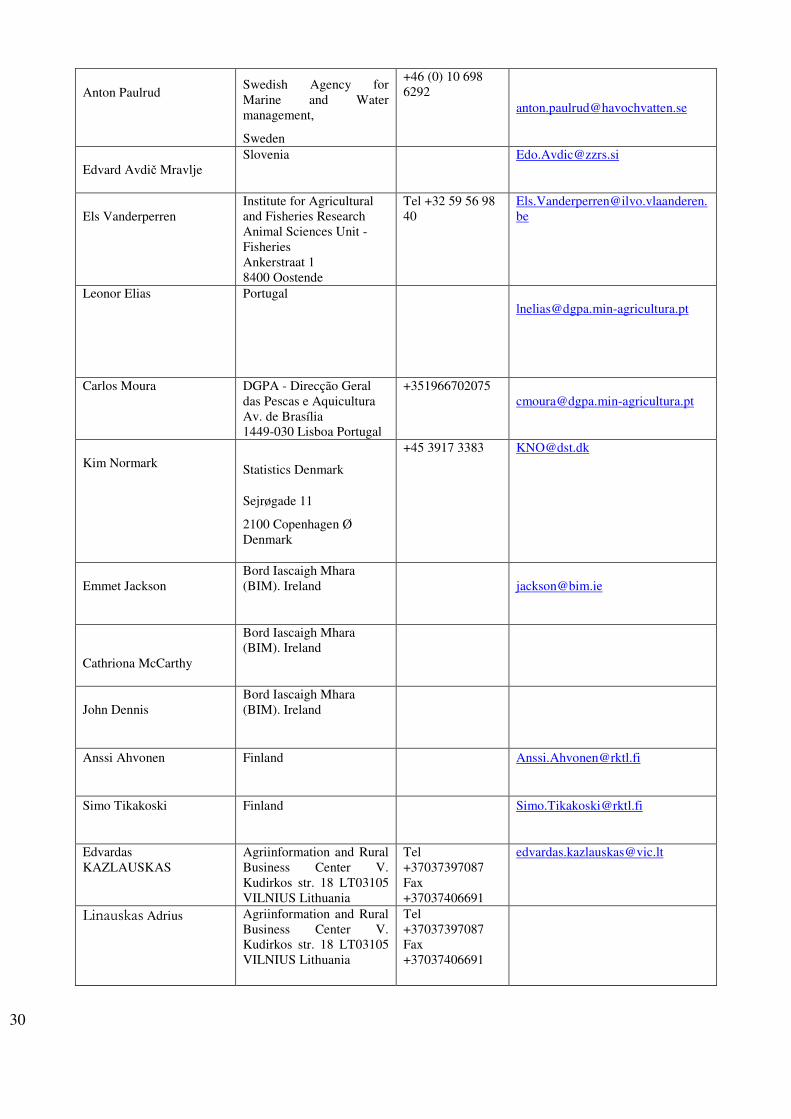
30
Anton Paulrud
Swedish Agency for Marine and Water management,
Sweden
+46 (0) 10 698 6292
Edvard Avdič Mravlje
Slovenia
Els Vanderperren
Institute for Agricultural and Fisheries Research Animal Sciences Unit - Fisheries Ankerstraat 1 8400 Oostende
Tel +32 59 56 98 40
Leonor Elias
Portugal
Carlos Moura
DGPA - Direcção Geral das Pescas e Aquicultura Av. de Brasília 1449-030 Lisboa Portugal
+351966702075 [email protected]
Kim Normark
Statistics Denmark
Sejrøgade 11
2100 Copenhagen Ø Denmark
+45 3917 3383 [email protected]
Emmet Jackson
Bord Iascaigh Mhara (BIM). Ireland
Cathriona McCarthy
Bord Iascaigh Mhara (BIM). Ireland
John Dennis
Bord Iascaigh Mhara (BIM). Ireland
Anssi Ahvonen
Finland
Simo Tikakoski
Finland
Edvardas KAZLAUSKAS
Agriinformation and Rural Business Center V. Kudirkos str. 18 LT03105 VILNIUS Lithuania
Tel +37037397087 Fax +37037406691
Linauskas Adrius
Agriinformation and Rural Business Center V. Kudirkos str. 18 LT03105 VILNIUS Lithuania
Tel +37037397087 Fax +37037406691
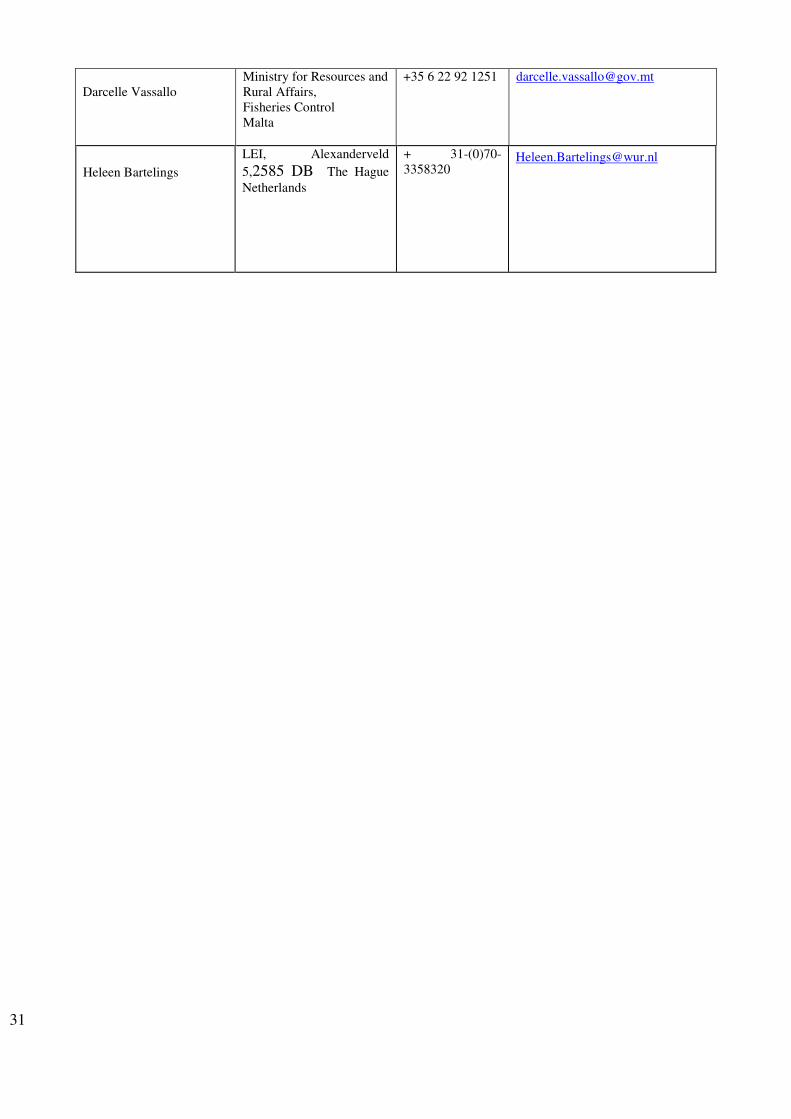
31
Darcelle Vassallo
Ministry for Resources and Rural Affairs, Fisheries Control Malta
+35 6 22 92 1251 [email protected]
Heleen Bartelings
LEI, Alexanderveld
5,2585 DB The Hague
Netherlands
+ 31-(0)70-3358320
32
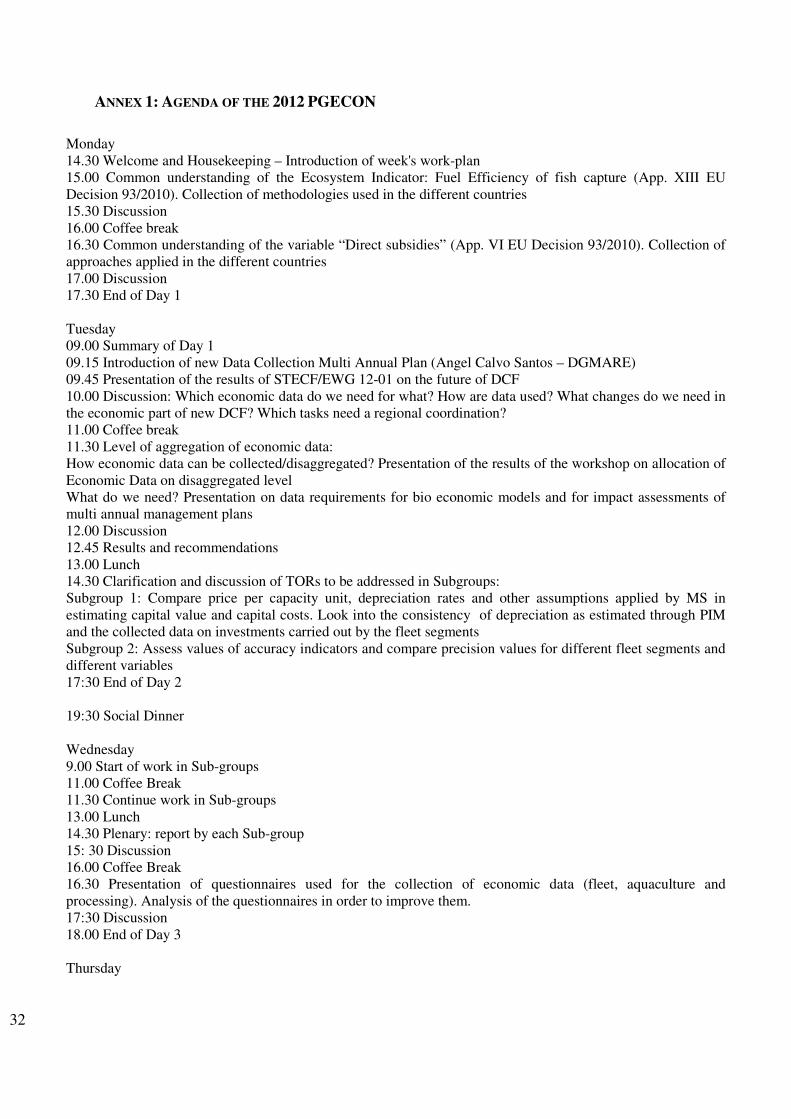
ANNEX 1: AGENDA OF THE 2012 PGECON
Monday 14.30 Welcome and Housekeeping – Introduction of week's work-plan 15.00 Common understanding of the Ecosystem Indicator: Fuel Efficiency of fish capture (App. XIII EU Decision 93/2010). Collection of methodologies used in the different countries 15.30 Discussion 16.00 Coffee break 16.30 Common understanding of the variable “Direct subsidies” (App. VI EU Decision 93/2010). Collection of approaches applied in the different countries 17.00 Discussion 17.30 End of Day 1 Tuesday 09.00 Summary of Day 1 09.15 Introduction of new Data Collection Multi Annual Plan (Angel Calvo Santos – DGMARE) 09.45 Presentation of the results of STECF/EWG 12-01 on the future of DCF 10.00 Discussion: Which economic data do we need for what? How are data used? What changes do we need in the economic part of new DCF? Which tasks need a regional coordination? 11.00 Coffee break 11.30 Level of aggregation of economic data: How economic data can be collected/disaggregated? Presentation of the results of the workshop on allocation of Economic Data on disaggregated level What do we need? Presentation on data requirements for bio economic models and for impact assessments of multi annual management plans 12.00 Discussion 12.45 Results and recommendations 13.00 Lunch 14.30 Clarification and discussion of TORs to be addressed in Subgroups: Subgroup 1: Compare price per capacity unit, depreciation rates and other assumptions applied by MS in estimating capital value and capital costs. Look into the consistency of depreciation as estimated through PIM and the collected data on investments carried out by the fleet segments Subgroup 2: Assess values of accuracy indicators and compare precision values for different fleet segments and different variables 17:30 End of Day 2 19:30 Social Dinner Wednesday 9.00 Start of work in Sub-groups 11.00 Coffee Break 11.30 Continue work in Sub-groups 13.00 Lunch 14.30 Plenary: report by each Sub-group 15: 30 Discussion 16.00 Coffee Break 16.30 Presentation of questionnaires used for the collection of economic data (fleet, aquaculture and processing). Analysis of the questionnaires in order to improve them. 17:30 Discussion 18.00 End of Day 3 Thursday
33
09.00 Discuss the development of an European Data base of economic data (fleet, aquaculture and processing). Criteria and roadmap 10.00 Identify needs for further actions and suggest appropriate follow-up (studies, workshops, RCM coordination) 11.00 Coffee Break 11.30 General discussion on the results of the meeting: did we address our TORs? Is PGECON useful? What should be the role of PGECON in the next DCF period (2014-2020)? 12.00 Next year PGECON: date and venue and appointment of the chair person 12.30 AOB 13.00 End of meeting Subgroups: SG1: Capital issues SG2: Data Quality issues
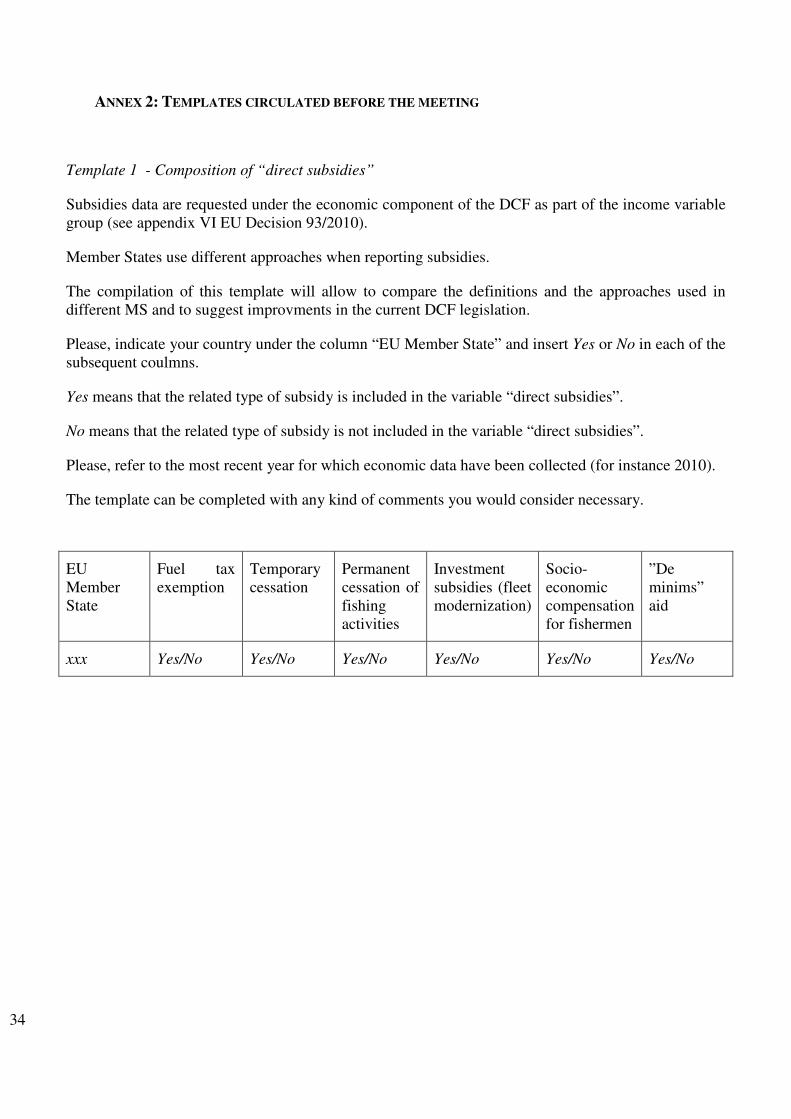
34
ANNEX 2: TEMPLATES CIRCULATED BEFORE THE MEETING
Template 1 - Composition of “direct subsidies”
Subsidies data are requested under the economic component of the DCF as part of the income variable group (see appendix VI EU Decision 93/2010).
Member States use different approaches when reporting subsidies.
The compilation of this template will allow to compare the definitions and the approaches used in different MS and to suggest improvments in the current DCF legislation.
Please, indicate your country under the column “EU Member State” and insert Yes or No in each of the subsequent coulmns.
Yes means that the related type of subsidy is included in the variable “direct subsidies”.
No means that the related type of subsidy is not included in the variable “direct subsidies”.
Please, refer to the most recent year for which economic data have been collected (for instance 2010).
The template can be completed with any kind of comments you would consider necessary.
EU Member State
Fuel tax exemption
Temporary cessation
Permanent cessation of fishing activities
Investment subsidies (fleet modernization)
Socio-economic compensation for fishermen
”De minims” aid
xxx Yes/No Yes/No Yes/No Yes/No Yes/No Yes/No
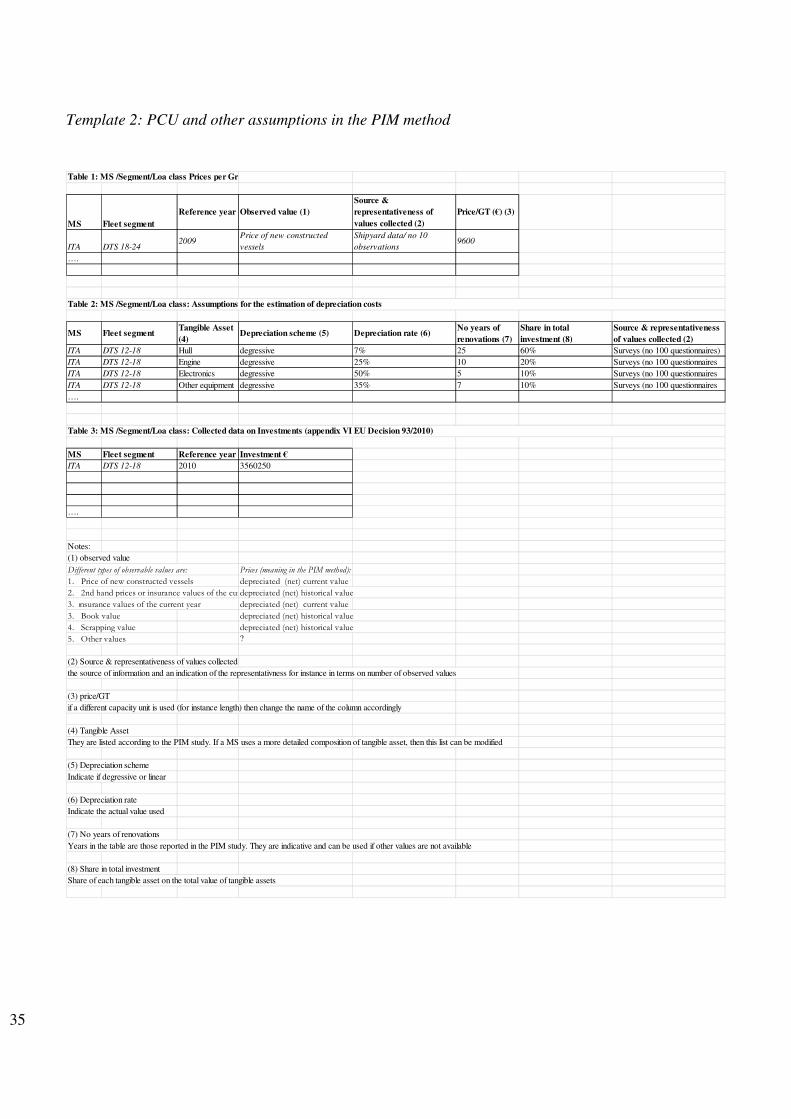
35
Template 2: PCU and other assumptions in the PIM method
MS Fleet segment
Reference year Observed value (1)
Source &
representativeness of
values collected (2)
Price/GT (€) (3)
ITA DTS 18-242009
Price of new constructed
vessels
Shipyard data/ no 10
observations9600
….
MS Fleet segmentTangible Asset
(4)Depreciation scheme (5) Depreciation rate (6)
No years of
renovations (7)
Share in total
investment (8)
Source & representativeness
of values collected (2)
ITA DTS 12-18 Hull degressive 7% 25 60% Surveys (no 100 questionnaires)
ITA DTS 12-18 Engine degressive 25% 10 20% Surveys (no 100 questionnaires
ITA DTS 12-18 Electronics degressive 50% 5 10% Surveys (no 100 questionnaires
ITA DTS 12-18 Other equipment degressive 35% 7 10% Surveys (no 100 questionnaires
….
MS Fleet segment Reference year Investment €
ITA DTS 12-18 2010 3560250
….
Notes:
(1) observed value
Different types of observable values are: Prices (meaning in the PIM method):
1. Price of new constructed vessels depreciated (net) current value
2. 2nd hand prices or insurance values of the current year;depreciated (net) historical value
3. Insurance values of the current year depreciated (net) current value
3. Book value depreciated (net) historical value
4. Scrapping value depreciated (net) historical value
5. Other values ?
(2) Source & representativeness of values collected
the source of information and an indication of the representativness for instance in terms on number of observed values
(3) price/GT
if a different capacity unit is used (for instance length) then change the name of the column accordingly
(4) Tangible Asset
They are listed according to the PIM study. If a MS uses a more detailed composition of tangible asset, then this list can be modified
(5) Depreciation scheme
Indicate if degressive or linear
(6) Depreciation rate
Indicate the actual value used
(7) No years of renovations
Years in the table are those reported in the PIM study. They are indicative and can be used if other values are not available
(8) Share in total investment
Share of each tangible asset on the total value of tangible assets
Table 1: MS /Segment/Loa class Prices per Gross Tonnage
Table 2: MS /Segment/Loa class: Assumptions for the estimation of depreciation costs
Table 3: MS /Segment/Loa class: Collected data on Investments (appendix VI EU Decision 93/2010)
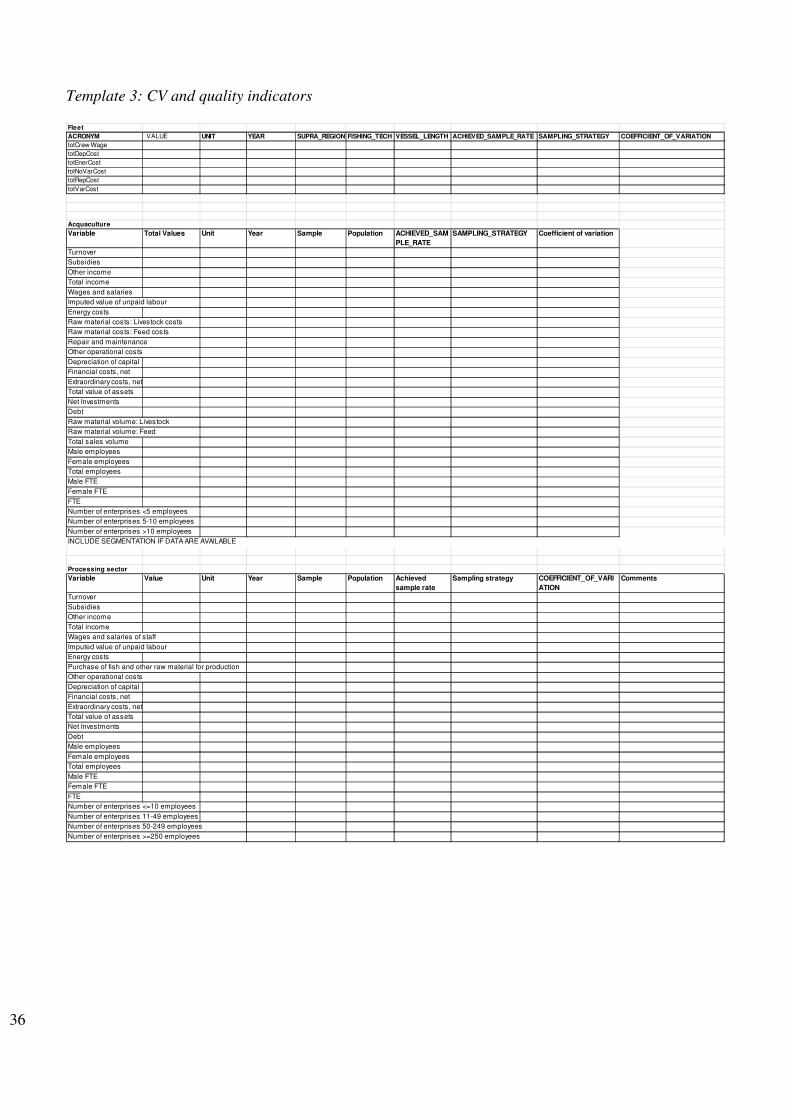
36
Template 3: CV and quality indicators
Fleet
ACRONYM VALUE UNIT YEAR SUPRA_REGION FISHING_TECH VESSEL_LENGTH ACHIEVED_SAMPLE_RATE SAMPLING_STRATEGY COEFFICIENT_OF_VARIATION
totCrew Wage
totDepCost
totEnerCost
totNoVarCost
totRepCost
totVarCost
Acquaculture
Variable Total Values Unit Year Sample Population ACHIEVED_SAM
PLE_RATE
SAMPLING_STRATEGY Coefficient of variation
Turnover
Subsidies
Other income
Total income
Wages and salaries
Imputed value of unpaid labour
Energy costs
Raw material costs: Livestock costs
Raw material costs: Feed costs
Repair and maintenance
Other operational costs
Depreciation of capital
Financial costs, net
Extraordinary costs, net
Total value of assets
Net Investments
Debt
Raw material volume: Livestock
Raw material volume: Feed
Total sales volume
Male employees
Female employees
Total employees
Male FTE
Female FTE
FTE
Number of enterprises <5 employees
Number of enterprises 5-10 employees
Number of enterprises >10 employees
INCLUDE SEGMENTATION IF DATA ARE AVAILABLE
Processing sector
Variable Value Unit Year Sample Population Achieved
sample rate
Sampling strategy COEFFICIENT_OF_VARI
ATION
Comments
Turnover
Subsidies
Other income
Total income
Wages and salaries of staff
Imputed value of unpaid labour
Energy costs
Purchase of fish and other raw material for production
Other operational costs
Depreciation of capital
Financial costs, net
Extraordinary costs, net
Total value of assets
Net Investments
Debt
Male employees
Female employees
Total employees
Male FTE
Female FTE
FTE
Number of enterprises <=10 employees
Number of enterprises 11-49 employees
Number of enterprises 50-249 employees
Number of enterprises >=250 employees