THE EFFECT OF ISCHAEMIA ON CAVERNOSAL SMOOTH ...
280
THE EFFECT OF ISCHAEMIA ON CAVERNOSAL SMOOTH MUSCLE A thesis submitted to University College London, University of London in part fulfilment of the requirement for the degree of; DOCTOR OF PHILOSOPHY by Pardeep Kumar Department of Applied Physiology The Institute of Urology UCL 2012
-
Upload
khangminh22 -
Category
Documents
-
view
2 -
download
0
Transcript of THE EFFECT OF ISCHAEMIA ON CAVERNOSAL SMOOTH ...

THE EFFECT OF ISCHAEMIA ON CAVERNOSAL SMOOTH
MUSCLE
A thesis submitted to University College London, University of London in part fulfilment of the
requirement for the degree of;
DOCTOR OF PHILOSOPHY
by
Pardeep Kumar
Department of Applied Physiology
The Institute of Urology
UCL
2012

2
ABSTRACT
Ischaemic priapism is a pathological condition characterised by a prolonged painful penile
erection. Corporal blood aspirates show a combination of hypoxia, acidosis and glucopenia. Initial
treatment includes ice packs, corporal aspiration and subsequent washout with room temperature
fluids. The effect of ischaemia on cavernosal smooth function was examined.
In vitro guinea-pig cavernosal smooth muscle strip experiments showed that simulated ischaemia
caused a significant and marked reduction in phenylephrine-induced (PE) contraction (plateau
PE30 response 35±19%, plateau PE60 response 29±16% of control). The degree of depression
was similar to that seen in nerve-contraction although there appeared to be some metabolic
reserve as shown by early preservation of the peak PE response (peak PE30 response 83±31%,
peak PE60 response 36±35% of control). Nerve-contraction did not recover upon reperfusion
whereas agonist-contractures demonstrated complete recovery. Experiments recording the effect
of the elements of ischaemia showed this depression to be secondary to combined hypoxia and
substrate depletion (absence of superfusate glucose and Na pyruvate). Isolated muscle cells
showed a significant reduction in agonist-induced calcium transients during similar interventions.
Simulated ischaemia markedly reduced nerve- and abolished agonist-relaxation. These
detrimental effects were completely reversible upon reperfusion. Nerve-relaxation recovered
whereas nerve-contraction did not. This effect was again secondary to the combination of hypoxia
and substrate depletion. This suggests that relaxatory nerves are more resistant to ischaemic
damage, a finding which would contribute to the pathogenesis of ischaemic priapism and the
contractile failure observed in this condition.
Intracellular acidification caused a significant and reversible increase in nerve-mediated
contraction. Intracellular acidification also augmented PE contractures at 30 min. (peak PE30
response 120±12%, plateau PE30 response 117±9%). Intracellular acidification induced a
significant and reversible increase in PE-induced calcium transients in isolated cells. This
augmentation of function was via an oxygen-dependent mechanism.

3
Reduction in superfusate temperature significantly suppressed nerve-contraction. This was not
due to reduced recruitment of nerve fibres at low temperature. The time-course of phasic nerve-
contractions and agonist-contractures was prolonged, slowing responses significantly. Nerve-
relaxation was significantly ameliorated at low temperatures. The phasic relaxation was also
prolonged with the return to pre-contracted tension following EFS-mediated relaxation slowed to a
greater degree than the initial relaxatory response. No change in magnitude of agonist-induced
relaxation was observed. Overall reduced temperature interventions affect contraction to a
greater degree than relaxatory mechanisms. These effects were not due to changes in the visco-
elastic properties of the tissue at low temperature.
Prolonged ischaemia is detrimental to contractile function before relaxatory responses. Substrate
depletion is a late finding in ischaemic priapism, with undetectable blood glucose after 6-12 hours
of priapism. Depletion of the energy substrates glucose and Na pyruvate, combined with hypoxia,
is central to the contractile failure seen in ischaemic priapism. This depression is irreversible on
contractile nerves at an earlier stage when compared to relaxatory nerves and the smooth muscle
itself, propagating the ischaemic priapic state. Reversal of these conditions should form part of
any treatment regimen for patients who have priapism. Low temperature interventions do not
improve CSM function with nerve-mediated function significantly reduced at low temperature as
well as slowing CSM contractile responses. It may be beneficial to use oxygenated washout fluids
at body temperature which contain energy substrates such as glucose and Na pyruvate to treat
ischaemic priapism.

4
ACKNOWLEDGEMENTS
I would like to thank everyone who helped make this happen
My supervisors Prof. Chris Fry and Mr Suks Minhas
Mr David Ralph, Mr Asif Muneer and my colleagues in the lab
St Peter’s Department of Andrology and St Peter’s Trust for Kidney, Bladder & Prostate Research
for their support and financial assistance
My family – Harbans, Rupinder and Veronica
‘Obstacles are those frightful things you see when you take your eyes off the goal’ Henry Ford
‘The journey is the reward’ Chinese Proverb

5
CONTENTS
Page
Title page 1
Abstract 2
Acknowledgements 4
Contents 5
List of Figures 10
List of Tables 14
List of Abbreviations 17
1.0 Introduction
1.1 Priapism 18
1.1.1 High flow priapism 19
1.1.2 Low flow ischaemic priapism 21
1.2 The penis
1.2.1 Macroscopic structure 29
1.2.2 Blood supply of the penis 31
1.2.3 Innervation of the penis 34
1.2.4 Central pathways involved in penile erection 36
1.3 Mechanism of penile erection and detumescence
1.3.1 Corpora cavernosae 36
1.3.2 Corpus spongiosum and glans penis 39
1.4 Mechanisms of cavernosal smooth muscle contraction
1.4.1 Cavernosal smooth muscle cell structure 39
1.4.2 Neurotransmitters involved in penile detumescence and 40
maintenance of penile flaccidity
1.4.2.1 Noradrenaline 40
1.4.2.2 Calcium sensitisation and maintenance of CSM tone 42

6
1.4.2.3 Endothelins 42
1.4.2.4 Oxygen tension and maintenance of penile flaccidity 44
1.4.3 Molecular mechanism of smooth muscle contraction 44
1.4.4 Energy consumption during smooth muscle contraction 45
1.5 Mechanisms of cavernosal smooth muscle relaxation
1.5.1 Neurotransmitters involved in penile detumescence 46
1.5.2 Molecular mechanism of CSM relaxation 48
1.5.3 Other endogenous mediators of CSM tone 50
1.6 Calcium regulation in cavernosal smooth muscle 51
1.7 Effect of ischaemia on cavernosal smooth muscle
1.7.1 The effect of hypoxia on CSM contraction 54
1.7.2 The effect of acidosis on CSM contraction 55
1.7.3 The effect of combined elements of ischaemia 56
1.8 Experimental models for the study of ischaemia on CSM 57
1.9 Effect of low temperature on smooth muscle 60
1.10 Aims and objectives of thesis 62
2.0 Material and Methods
2.1 Solutions and chemicals
2.1.1 Tyrode’s solution 64
2.1.2 Chemicals and drugs 64
2.1.3 Simulation of ischaemia 65
2.2 Tissue collection and preparation 66
2.3 Isometric tension measurement
2.3.1 Equipment and set-up 68
2.3.2 Calibration of tension transducer 71

7
2.3.3 Muscle strip preparation and mounting 71
2.3.4 Electrical field stimulation (EFS) experiments 72
2.3.5 Agonist-induced contraction and relaxation experiments 77
2.3.6 Reduced temperature interventions 80
2.4 Estimation of stress/relaxation characteristics
2.4.1 Equipment and set-up 81
2.4.2 Experimental protocol 83
2.4.3 Calibration of equipment 84
2.4.4 Data Analysis 85
2.5 Isolated cell experiments (I)
2.5.1 Principles of epifuorescence microscopy 87
2.5.2 Equipment and set-up 89
2.5.3 Cavernosal cell isolation 93
2.6 Isolated cell experiments (II)
2.6.1 Measurement of [Ca2+]i by epifuorescence microscopy 94
2.6.2 Intracellular loading of Fura-2 95
2.6.3 Experimental procedure 96
2.6.4 Calibration of the Fura-2 signal 100
2.7 Statistical analysis 103
3.0 Results
3.1 Results I – Basic tissue parameters
3.1.1 Isometric contractions elicited by electrical field stimulation 104
3.1.2 Isometric contractures elicited by phenylephrine (PE) 108
3.1.3 Isometric relaxations elicited by electrical field stimulation 110
3.1.4 Isometric relaxations elicited by carbachol 116

8
3.1.5 PE-induced Ca2+ transients in isolated CSM cells 119
3.1.6 Summary of basic tissue parameters 121
3.2 Results II – Simulated ischaemia on nerve-mediated contraction
3.2.1 Simulated ischaemia on nerve-mediated contraction 124
3.2.2 Components of ischaemia on nerve-mediated contraction 127
3.2.3 Combinations of ischaemia components on nerve contraction 135
3.2.4 Acidosis and substrate depletion on nerve contraction 140
3.2.5 Hypoxia and acidosis on nerve contraction 144
3.2.6 Summary of ischaemia on nerve-mediated contraction in CSM 148
3.3 Results III – Ischaemia on agonist-induced contractures
3.3.1 Simulated ischaemia on PE contractures 151
3.3.2 Simulated ischaemia on PE contractures in the presence of nifedipine
3.3.3 Simulated ischaemia on Ca2+ transients in isolated CSM cells 155
3.3.4 Components of ischaemia on agonist contraction 158
3.3.5 Combination of ischaemia components PE contractures 167
3.3.6 Acidosis and substrate depletion on PE contractures 173
3.3.7 Hypoxia and acidosis on PE contractures 176
3.3.8 Summary of ischaemia on contraction in CSM 179
3.4 Results IV – Ischaemia on EFS-mediated relaxation
3.4.1 Simulated ischaemia on EFS relaxation 184
3.4.2 Components of ischaemia on EFS relaxation 186
3.4.3 Combination of ischaemia components on EFS relaxation 190
3.4.4 Acidosis and substrate depletion on EFS relaxation 193
3.4.5 Hypoxia and acidosis on EFS relaxation 196
3.4.6 Summary of ischaemia on EFS relaxation in CSM 199

9
3.3 Results V – Ischaemia on agonist relaxation
3.5.1 Simulated ischaemia on carbachol relaxation 202
3.5.2 Components of ischaemia on carbachol relaxation 204
3.5.3 Combination of ischaemia components on carbachol relaxation 208
3.5.4 Acidosis and substrate depletion on carbachol relaxation 211
3.5.5 Hypoxia and acidosis on carbachol relaxation 214
3.5.6 Summary of ischaemia on relaxation in CSM 217
3.6 Results VI – The effect of low temperature on CSM contractile function
3.6.1 Generation of low temperature solutions 220
3.6.2 Low temperature on nerve contraction 220
3.6.3 Low temperature on EFS relaxation 228
3.6.4 Low temperature on PE contractures 231
3.6.5 Low temperature on carbachol relaxation 234
3.6.6 Low temperature on stiffness of CSM 235
3.6.7 Summary of reduced temperature on CSM function 238
4.0 Discussion
4.1 Experimental limitations 240
4.2 Results overview 242
4.2.1 Use of this preparation in these experiments 242
4.2.2 The effect of simulated ischaemia on CSM function 246
4.2.3 The effect of hypoxia on CSM function 252
4.2.4 The effect of acidosis on CSM function 254
4.2.5 The effect of effect of reduced temperature on CSM function 257
4.3 Conclusions and further research 260
5.0 Bibliography 262

10
LIST OF FIGURES
Fig. 1.1 - Cross-section of human penis at mid-shaft level 30
Fig. 1.2 - Arterial blood supply to the penis 31
Fig. 1.3 - Scanning electron micrograph of arterial supply to lacunar space 32
Fig. 1.4 - Venous drainage of the penis 33
Fig. 1.5 - Scanning electron micrograph of venous drainage of subtunical plexus 33
Fig. 1.6 - Diagram of penile nerve supply 35
Fig. 1.7 - Penile haemodynamic changes during erection and detumescence 38
Fig. 1.8 – Diagram of CSM contractile factors 43
Fig. 1.9 – Mechanism of CSM contraction 45
Fig. 1.10 – Nitric oxide generation from L-arginine 48
Fig. 1.11 – Diagram showing mechanisms of CSM relaxation by NO 49
Fig. 2.1 – Muscle strip experimental set-up 70
Fig. 2.2 - Experiment protocol for EFS contraction experiments 73
Fig. 2.3 - Method of measuring time-constant for phasic contractions 74
Fig. 2.4 - Experiment protocol for EFS relaxation experiments 75
Fig. 2.5 - Method for measuring tension remaining after EFS relaxation 76
Fig. 2.6 - Method of measuring time-constant of EFS relaxation 77
Fig. 2.7 - Experiment protocol for agonist-induced contraction and relaxation 78
Fig. 2.8 - Method of measuring agonist-induced contractures and relaxation 79
Fig. 2.9 - Method of measuring time-constants for tonic contractures 80
Fig. 2.10 – Stress/relaxation experimental set-up 82
Fig. 2.11 – Experiment protocol for estimation of stress/strain characteristics of CSM 84
Fig. 2.12 – Typical response to instantaneous stress 86
Fig. 2.13 – Isolated cell experimental set up 92

11
Fig. 2.14 - Fluorescence intensity spectra of Fura-2 detected at 510 nm at different [Ca2+] 94
Fig. 2.15 - Fluorescence emission spectra of Fura-2 at differing [Ca2+] 95
Fig. 2.16 - Process of fura-2 AM hydrolysis liberating the Ca2+ sensitive fluorophore 96
Fig. 2.17 – Typical emission signals and rationale behind accounting for background 98
Fig. 2.18 – Experiment protocol for isolated cell intervention 99
Fig. 2.19 – Sample Fura-2 calibration plot 102
Fig. 3.1 – Experiment tracing showing stability of EFS contraction 105
Fig. 3.2 – 1 µM TTX on EFS contraction in CSM 106
Fig. 3.3 – Recruitment curve showing tension developed at varying stimulation voltages 107
Fig. 3.4 – 100 µM nifedipine on PE contractures 109
Fig. 3.5 – Experimental tracing showing EFS relaxation 111
Fig. 3.6 – Normal Tyrode’s on EFS relaxation 112
Fig. 3.7 – Differing pre-contraction on EFS relaxation 113
Fig. 3.8 – 1 µM TTX on EFS relaxation 114
Fig. 3.9 – ODQ on EFS relaxation 115
Fig. 3.10 – Experimental tracing showing agonist contractures and relaxations 117
Fig. 3.11 – Differing pre-contraction on agonist relaxation 118
Fig.3.12 - Typical experimental tracing showing repeated stimulation of isolated CSM cell 120
Fig. 3.13 – PE-induced calcium transients in isolated CSM cells 120
Fig. 3.14 – Experimental tracing showing simulated ischaemia on EFS contraction 125
Fig. 3.15 - Simulated ischaemia on nerve contraction 125
Fig. 3.16 - Substrate depletion on nerve contraction 129
Fig. 3.17 – Acidosis on nerve contraction 134
Fig. 3.18 - Hypoxia and substrate depletion on nerve contraction 136
Fig. 3.19 - Hypoxia, acidosis and substrate depletion on nerve contraction 139

12
Fig. 3.20 - Acidosis and substrate depletion on nerve contraction 143
Fig. 3.21 – Hypoxia and acidosis on nerve contraction 147
Fig. 3.22 – Simulated ischaemia on peak PE contractures 152
Fig. 3.23 – Simulated ischaemia on plateau PE contractures 152
Fig. 3.24 – Simulated ischaemia on CSM contraction 153
Fig. 3.25 – Simulated ischaemia on PE contractures in the presence of nifedipine 154
Fig. 3.26 – Simulated ischaemia on calcium transients in isolated CSM cells 156
Fig. 3.26a – Typical experimental tracing of simulated ischaemia on CSM cells 156
Fig. 3.27 – Substrate depletion on CSM contraction 158
Fig. 3.28 - Substrate depletion on calcium transients in isolated CSM cells 159
Fig. 3.29 – Hypoxia on CSM contraction 160
Fig. 3.30 – Intra- and extracellular acidosis on calcium transients in isolated CSM cells 161
Fig. 3.30a – Intracellular acidification on CSM contraction 162
Fig. 3.31 - Experimental tracing showing intracellular acidification on Ca2+ transients 163
Fig. 3.32 – Intracellular acidification on calcium transients in isolated CSM cells 164
Fig. 3.33 – Extracellular acidosis on CSM contraction 165
Fig. 3.34a – Typical tracing of hypoxia and substrate depletion on CSM cells 168
Fig. 3.34b - Hypoxia and substrate depletion on calcium transients in isolated CSM cells 169
Fig. 3.35 – Combinations of elements of ischaemia on CSM contraction 171
Fig. 3.36 – Acidosis and substrate depletion on CSM contraction 174
Fig. 3.37 – Hypoxia and acidosis on CSM contraction 177
Fig. 3.38 – Simulated ischaemia on nerve relaxation 185
Fig. 3.39 – Typical experimental tracing showing effect of hypoxia on nerve relaxation 186
Fig. 3.40 – Hypoxia on nerve relaxation 187
Fig. 3.41 – Components of ischaemia on nerve relaxation 188

13
Fig. 3.42 – Combination of components of ischaemia on nerve relaxation 191
Fig. 3.43 – Acidosis and substrate depletion on nerve relaxation 194
Fig. 3.44 – Hypoxia and acidosis on nerve relaxation 197
Fig. 3.45 – Simulated ischaemia on carbachol relaxation 202
Fig. 3.46 – Hypoxia on carbachol relaxation 204
Fig. 3.47 – Components of ischaemia on carbachol relaxation 206
Fig. 3.48 – Combination of components of ischaemia on carbachol relaxation 209
Fig. 3.49 – Acidosis and substrate depletion on carbachol relaxation 212
Fig. 3.50 – Hypoxia and acidosis on carbachol relaxation 215
Fig. 4.1 - Typical experimental tracing of 21 °C Tyrode’s solution on nerve contraction 221
Fig. 4.2 – 21 °C Tyrode’s solution on nerve contraction 222
Fig. 4.3 – Typical experimental tracing of 13 °C Tyrode’s solution on nerve contraction 223
Fig. 4.4 –13 °C Tyrode’s solution on nerve contraction 224
Fig. 4.5 – 21 °C Tyrode’s solution on EFS32 Hz contraction at differing voltages 225
Fig. 4.6 – 13 °C Tyrode’s solution on EFS32 Hz contraction at differing voltages 226
Fig. 4.7 – 21 °C Tyrode’s solution on nerve relaxation 228
Fig. 4.8 – 13 °C Tyrode’s solution on nerve relaxation 230
Fig. 4.9 – Diagram of typical strip response to instantaneous stress 236
Fig. 5.1 – Response of CSM contractile function to simulated ischaemia 250
Fig. 5.2 – Time course of corporal blood gas changes during prolonged penile erection 250
Fig. 5.3 – Response of CSM contraction to the combination of hypoxia and acidosis 256

14
LIST OF TABLES
Table 1.1 - Typical cavernosal blood gas values 22
Table 1.2 – Causes of ischaemic priapism 24
Table 1.3 – Summary of shunt surgery used in the treatment of ischaemic priapism 28
Table 2.1 - Constituents of Tyrode’s and modified Tyrode’s solutions 67
Table 2.2 - Constituents of enzyme mixture added to buffered Ca-free Tyrode’s 93
Table 2.3 - Constituents of FURA-2 signal calibration solution 100
Table 2.4 - Concentration of free Ca2+ in calibrating solutions 101
Table 3.1 – Stability of EFS contractile responses in Tyrode’s solution 105
Table 3.2 - Stimulation voltage on EFS contractions 107
Table 3.3 - Stability of PE-induced contractile responses in Tyrode’s solution 108
Table 3.4 – Stability of EFS relaxation in Tyrode’s solution 111
Table 3.5 - Stability of carbachol-induced relaxatory responses in Tyrode’s solution 116
Table 3.6 - Repeated stimulation with PE on isolated CSM cells 119
Table 3.7 – Summary of basic tissue parameters 123
Table 3.8 - Simulated ischaemia on nerve contraction 126
Table 3.9 - 60 min. substrate depletion on nerve contraction 127
Table 3.10 - 120 min. substrate depletion on nerve contraction 128
Table 3.11 - Hypoxia on nerve contraction 130
Table 3.12 Acidosis on nerve contraction 131
Table 3.13 - Intracellular acidification on nerve contraction 132
Table 3.14 – Extracellular acidosis on nerve contraction 133
Table 3.15 - Hypoxia and substrate depletion on nerve contraction 135
Table 3.16 - Simulated ischaemia vs. hypoxia & substrate depletion on nerve contraction 136
Table 3.17 - Hypoxia, extracellular acidosis and substrate depletion on nerve contraction 137

15
Table 3.18 - Hypoxia, intracellular acidification and subs. depletion on nerve contraction 138
Table 3.19 - Acidosis and substrate depletion on nerve contraction 140
Table 3.20 - Extracellular acidosis and substrate depletion on nerve contraction 141
Table 3.21 - Intracellular acidification and substrate depletion on nerve contraction 142
Table 3.22 - Hypoxia and acidosis on nerve contraction 144
Table 3.23 - Hypoxia and extracellular acidosis on nerve contraction 145
Table 3.24 - Hypoxia and intracellular acidification on nerve contraction 146
Table 3.25 – Summary of effect of components of ischaemia on nerve contraction 150
Table 3.26 - Effect of simulated ischaemia on PE contractures 151
Table 3.27 - Simulated ischaemia on PE contractures in the presence of nifedipine 154
Table 3.28 - Simulated ischaemia on calcium transients in isolated CSM cells 157
Table 3.29 – Substrate depletion on calcium transients in isolated CSM cells 159
Table 3.30 – Acidosis on calcium transients in CSM cells 161
Table 3.31 - Intracellular acidification on calcium transients in isolated CSM cells 163
Table 3.32 – Components of ischaemia on PE contractures 166
Table 3.33 - Hypoxia and substrate depletion on calcium transients in isolated CSM cells 168
Table 3.34 – Combination of components of simulated ischaemia on PE contractures 172
Table 3.35 - Acidosis and substrate depletion on PE contractures 175
Table 3.36 - Hypoxia and acidosis on PE contractures 178
Table 3.37 – Summary of effect of ischaemia on calcium transients in isolated CSM 182
Table 3.38 – Summary of effect of components of ischaemia on contraction in CSM 183
Table 3.39 - Simulated ischaemia on EFS relaxation 184
Table 3.40 – Components of ischaemia on EFS relaxation 189
Table 3.41 – Combination of components of ischaemia on EFS relaxation 192
Table 3.42 – Acidosis and substrate depletion on EFS relaxation 195

16
Table 3.43 – Hypoxia and acidosis on EFS relaxation 198
Table 3.44 – Summary of components of ischaemia on nerve relaxation 201
Table 3.45 - Simulated ischaemia on carbachol relaxation 203
Table 3.46 – Components of ischaemia on carbachol relaxation 207
Table 3.47 – Combination of components of ischaemia on carbachol relaxation 210
Table 3.48 - Acidosis and substrate depletion on carbachol relaxation 213
Table 3.49 - Hypoxia and acidosis on carbachol relaxation 216
Table 3.50 – Summary of components of ischaemia on carbachol relaxation 219
Table 4.1 – Reduction to 21 °C on nerve contraction 221
Table 4.2 - Reduction to 13 °C on nerve contraction 223
Table 4.3 - Reduced temperature on time constants of nerve contraction 227
Table 4.4 - Reduction to 21 °C on nerve relaxation 229
Table 4.5 - Reduction to 13 °C on nerve relaxation 230
Table 4.6- Reduced temperature on time constants of nerve relaxation 231
Table 4.7 - Reduction to 21 °C on agonist contractures 232
Table 4.8 - Reduction to 13 °C on agonist contractures 232
Table 4.9 - Reduction to 21 °C on agonist contracture time-constants 233
Table 4.10 - Reduction to 13 °C on agonist contracture time-constants 233
Table 4.11 – Reduction to 21 °C on agonist-induced relaxation 234
Table 4.12 – Reduction to 13 °C on agonist relaxation 235
Table 4.13 – Stress/strain characteristics of CSM at reduced temperature 237
Table 4.14 – Summary of reduced temperature on CSM 239

17
ABBREVIATIONS
A acidosis α-AR α-adrenergic receptor Ach acetylcholine β-AR β-adrenergic receptor BCECF 2’7’bis(carboxyethyl)-5,6-carboxyfluorescein Ca2+ free ionised calcium [Ca2+] concentration of free ionised calcium [Ca2+]i intracellular concentration of free ionised calcium csa cross-sectional area CSM cavernosal smooth muscle DMSO dimethyl sulphoxide ET-1 endothelin 1 EGTA ethylene glycol tetraacetic acid eNOS endothelial nitric oxide synthase cGMP 3’,5’-cyclic guanosine monophosphate GTP guanosine triphosphate H hypoxia [H+] concentration of free ionised hydrogen I intra-cellular acidosis IA intra and extra-cellular acidosis IP3 inositol 1,4,5-triphosphate IP3R inositol 1,4,5-trisphosphate receptor KATP ATP sensitive potassium channels KCa calcium sensitive potassium channels Kd dissociation constant MLCK myosin light chain kinase MLCP myosin light chain phosphatase mRNA messenger ribonucleic acid NA noradrenaline NADPH nicotinamide adenine dinucleotide phosphate NADPHi intracellular nicotinamide adenine dinucleotide phosphate NANC non-adrenergic, non-cholinergic NO nitric oxide NOS nitric oxide synthase nNOS neuronal nitric oxide synthase ODQ 1H-[1,2,4]oxadiazolo-[4,3-a]quinoxalin-1-one PE phenylephrine pHi intracellular pH pHe extracellular pH PKA protein kinase A PKC protein kinase C PKG protein kinase G PMT photomultiplier tube pO2 partial pressure of oxygen S substrate depletion – absence of sodium pyruvate and glucose SR sarcoplasmic reticulum sGC soluble guanyl cyclase TTX tetrodotoxin

18
1.0 Introduction
1.1 Priapism
Priapism is defined as a pathological condition where penile erection persists beyond, or is
unrelated to sexual stimulation. Priapism often affects young men who frequently develop severe
erectile dysfunction as a consequence with its resultant effects on both physical and
psychological wellbeing. Priapism is a relatively uncommon condition with an incidence of 1.5 per
100,000 person-years rising to 2.9 per 100,000 person-years in men 40 years and older(1, 2). In
certain population groups the reported incidence is much higher. In an international multi-centre
study of men with sickle-cell anaemia, 35% of men questioned reported at least one episode of
priapism(3).
The term priapism is derived from the Greek demi-god Priapus. Priapus was cursed by the
goddess Hera to be impotent, ugly and of unpleasant personality whilst in the womb of his mother
Aphrodite. Born with a disproportionately enlarged phallus, Priapus became a symbol of the
vitality of the animal and plant kingdoms. Interestingly, Priapus was often frustrated by his
impotence, the subject of many songs and comedies. The first mention of Priapus in existence is
in the eponymous comedy Priapus, written in the 4th century BC by Xenarchus(4). “Gonorrhoea,
Satyriasi et Priapisme” by Petraens contains the earliest account of priapism in the medical
literature. Research into the condition in the 20th century consisted of personal case series of
patients with priapism where it was recognised as a difficult condition to treat.
Hinman in the early 20th century attempted to classify the disease into either mechanical or
nervous types and suggested an approach to management based on this(5). The mechanical
subtype was described as being related to thrombosis of the veins of the corpora. Conditions

19
associated with this condition included pelvic abscesses, penile tumours, perineal and genital
injuries and blood dyscrasias. The nervous subtype related to intracerebral disorders affecting the
erectile process such as syphilis, brain tumours, epilepsy and spinal cord injuries. Dysfunction of
venous outflow was hypothesised as the primary reason for failure of detumescence in priapism
by Hinman Jr.(6). He proposed that the dark viscous blood seen following aspiration or incision of
the corpus cavernosum during a bout of priapism had a reduced oxygen tension with elevated
carbon dioxide levels and that these factors enhanced blood viscosity, particularly in patients with
abnormal erythrocytes such as in sickle cell anaemia(6).
The contemporary view is that priapism encompasses two distinct clinical entities, high flow
arterial and low flow ischaemic priapism, both exhibiting the phenotype of prolonged penile
erection(7). The terms high and low flow describe the status of the blood flow in the penis; the
differing clinical presentation and treatments of these groups is outlined below.
1.1.1 High flow priapism
High flow priapism is due to unregulated arterial blood flow within the lacunar spaces of the
corpora cavernosae of the penis(8, 9). This results in a localised hyperdynamic circulation with
penile tumescence secondary to a pressure effect and release of localised relaxant factors. High
flow priapism occurs most commonly following penile or perineal trauma (‘saddle’ or ‘fall astride’
type injuries). This results in a cavernosal artery laceration which may present acutely or after
several days or weeks. Delayed presentation is postulated to occur due to the original injury
causing a localised area of arterial wall weakness which subsequently ‘gives way’ resulting in
unrestricted arterial flow within the penis(8). Microvascular trauma secondary to the injection

20
needle used in intracavernosal therapy for erectile dysfunction may also create an arterio-lacunar
fistula resulting in high flow priapism(9, 10).
High flow priapism has also been described in association with sickle cell anaemia(11),
cavernosal artery pseudoaneurysms(12) and Fabry’s disease(13, 14). Fabry’s disease is an
inherited disorder which results in an α-galactosidase A deficiency. This leads to a glycolipid
accumulation in vascular endothelium such as that lining the lacunar spaces of the penis. It is
postulated that this leads to derangement of the nitric-oxide pathway, especially when associated
with a concurrent glucose-6-phosphate dehydrogenase deficiency (15-17).
High flow priapism is typically painless; the penis is well oxygenated and not subject to the
localised ischaemia present in the low-flow subtype where smooth muscle damage and corporal
fibrosis predominate(7, 18). Erectile function is preserved in 77%-86% of patients on long term
follow up(8, 18). Corporal blood aspiration shows well oxygenated blood and colour Doppler
ultrasound shows good arterial penile blood flow. These diagnostic tests are interpreted with
caution as the simple act of inserting a needle into the corpus cavernosum of an ischaemic
priapism may produce a localised iatrogenic arteriovenous shunt. This can erroneously infer the
diagnosis of a safe high flow priapism in a patient who actually has an ischaemic priapism which
has a poorly oxygenated, acidotic microenvironment and is a surgical emergency(19, 20).
Conservative measures to treat high flow priapism have been reported with limited success.
These include observation, ice packs/baths and intracavernosal injection of methylene blue (a
monoamine oxidase inhibitor which may act as a non-selective inhibitor of nitric oxide
synthase)(18, 21, 22). The mainstay of current management is superselective internal pudendal
angiography. This modality allows confirmation of the diagnosis as well as intervention by means

21
of injection at the site of the lacunar fistula with either absorbable gelfoam or permanent metallic
coils(23-26). Metallic coils are no longer recommended due to their permanent nature being
implicated in long term erectile dysfunction in these patients. Although spontaneous resolution
can occur after observation, immediate embolisation is both successful and avoids the risk of long
term venous leakage(24). Open arterial ligation using intraoperative ultrasound to localise the
abnormality has also been described(27).
1.1.2 Ischaemic priapism
The commonest subtype, ischaemic priapism, is characterised by a prolonged painful penile
erection often lasting for more than 8 hours(28). The condition is a surgical emergency as it is a
form of compartment syndrome(10, 29, 30). The corpora cavernosae are turgid and painful with
dark ischaemic blood, the glans is characteristically soft as it is uninvolved in the pathophysiology
due to its differing blood supply. Blood is trapped within the lacunar spaces of the penis, with little
or no arterial inflow or venous outflow. As the priapism episode progresses, the cavernosal
microenvironment becomes progressively more ischaemic(31). Blood gas analysis of cavernosal
aspirates typically demonstrates hypoxia and acidosis, typical values are outlined in table 1.1(10,
32). A subtype of ischaemic priapism is termed ‘stuttering’ priapism. This is characterised by
recurrent short lived painful erections which may precede a full blown ischaemic priapism
episode(33, 34).

22
Table 1.1 – Typical cavernosal blood gas values. Adapted from (31, 35)
14 patients developed prolonged painful erections following prostaglandin E1 (PGE1) injection
administered in a hospital environment. Corporal aspiration and blood gas analysis demonstrated
a clear trend towards hypoxia, acidosis and hypercarbia with prolonged erections lasting between
105 and 342 minutes(31). In addition 6 patients with prolonged ischaemic priapism lasting 60-240
hours also demonstrated severe glucopenia on corporal blood aspirates(35).
Normal flaccid
penis
Normal erect
penis
High flow
priapism
Ischaemic
priapism
pH 7.35 7.35 7.4 <7.25
pO2 (mmHg) 40 100 60 -100 <30
pCO2 (mmHg) 50 40 40-50 >60
blood glucose (BM) 4-8 4-8 4-8 <4
There are several causes of ischaemic priapism with early therapy aimed at preventing
cavernosal smooth muscle necrosis and preserving long-term erectile function (Table 1.2). The
mechanisms underlying prolonged penile tumescence in this clinical scenario are unclear but are
thought to be a combination of both veno-occlusive and smooth muscle dysfunction.
Several haematological conditions are associated with priapism. Postulated mechanisms include
increased blood viscosity and abnormal erythrocyte function. Sickle cell anaemia is the
commonest blood dyscrasia associated with ischaemic priapism; 38-42% of patients report at
least one episode of priapism(3, 36). It is seen more commonly in homozygous patients and is
associated with sickle cell crises where abnormal deformation of red cells occur causing
occlusion of the microvasculature and localised ischaemia. There may also be chronic changes

23
within the cavernosum of these patients resulting in disordered contractile regulatory mechanisms
within the smooth muscle(27, 37). Other associated conditions include leukaemia, thalassemia,
polycythaemia, fat emboli and Fabry’s disease(38, 39).
Drug therapy is also associated with low flow ischaemic priapism (Table 1.2). This may be
secondary to α-adrenergic blockade resulting in impaired cavernosal smooth muscle contraction.
Intracavernosal agents utilised in erectile dysfunction and directly instilled into the corpora (e.g.
papaverine, prostaglandin E1 and phentolamine) are associated with low-flow priapism and
account for 0.5-6% of cases. Drug classes associated with priapism include α-adrenergic
blockers, serotonin agonists and dopamine antagonists(40-42).
Primary penile cancer, local invasion from adjacent organs and metastases from distant sites
have been reported as causing priapism. Local invasion occurs from the prostate, bladder and
urethra(43-48). Priapism associated with neurological disorders is well described. An imbalance
of parasympathetic and sympathetic outflow from the spinal cord is postulated as the underlying
pathology however this is far from clear. Examples include cauda equina syndrome, spinal cord
lesions and spinal stenosis(49-54). Amyloidosis, rabies and scorpion stings are rare conditions
described in case reports as causing ischaemic priapism(55-57).

24
Table 1.2 - Causes of ischaemic priapism
In Europe and the U.S.A the commonest cause of priapism is intra-cavernosal therapy for erectile
dysfunction. Worldwide sickle cell anaemia predominates(30).
Category Subtypes
Drug therapy for ED Intra-urethral prostaglandin E1 (MUSE)
Intra-cavernosal prostaglandin E1 (Caverject)
PDE-5 inhibitors (Sildenafil, Tadalafil, Vardenafil)
Intracavernosal phentolamine - α-AR antagonist
Papaverine – intracavernosal vasodilator
Haematological Sickle cell anaemia
Thrombophilia
Other Haemoglobinopathies inc. Thalassemia
Leukaemia
Myeloma
Pharmacotherapy and other drugs Phenothiazines
Selective Serotonin Reuptake Inhibitors (SSRIs)
Anticoagulants (heparin)
Anti-hypertensives
Alcohol
Marijuana
Cocaine
Solid Tumours Locally advanced bladder cancer
Locally advanced prostate cancer
Metastatic renal cancer
Systemic disease Hypertension
Diabetes
Rheumatoid Arthritis
Idiopathic
Others Total parenteral nutrition, amyloid, rabies, appendicitis

25
Regardless of the underlying cause, urgent treatment is indicated as smooth muscle death and
subsequent impairment of function are the inevitable sequelae of delayed or inappropriate
treatment(58, 59). This may leave young, previously fit men, with severe organic erectile
dysfunction and its’ associated physical and psychological morbidity. It is therefore essential that
the goals of any treatment regimen should not only take into account penile detumescence but
also preservation of long term sexual function(60).
Patients with recurrent ‘stuttering’ priapism describe the use of masturbation and ejaculation, cold
baths and ice packs in managing short lived episodes of priapism and avoiding presentation to
their medical practitioner(61). The primary medical treatment of ischaemic priapism involves
analgesia followed by aspiration of blood from the corpora and irrigation with 0.9 % NaCl solution
at room temperature should initial non-invasive measures fail. Aspiration of the stagnant blood
may be enough to re-establish penile blood flow and terminate the priapic episode with penile
detumescence(10, 28). The aspirate is typically dark and viscous and should be sent for blood
gas analysis to confirm the diagnosis. Aspiration and washout is often combined with the use of
ice-packs and cold compresses. There is no evidence for the use of these reduced temperature
interventions.
Should these measures be unsuccessful in effecting detumescence, α-adrenergic agonists
(usually phenylephrine) injected into the corpora cavernosae are recommended(60, 62). Careful
cardiovascular monitoring is instigated during treatment to monitor for the systemic effects of α-
agonists (cardiac arrythmias, hypertension). The aim of treatment is to cause contraction of the
cavernosal smooth muscle and helicine arteries. This then relieves pressure on the venous
outflow with the aim of re-establishing penile blood flow and penile detumescence(60, 62).
Alternative α-agonists have been described in the literature including epinephrine, norepinephrine

26
and metaraminol(32). Several other oral and intracavernosal agents have been described
although none has gained widespread use in the initial treatment of priapism. These include the
cyclic guanosine monophosphate (cGMP) inhibitor methylene blue (stains penis bright blue),
etilefrine (oral and intracavernous α-agonist) and intracavernosal thrombolysis(63-68). Oral
terbutaline has been reported to be successful although it does also have β-agonist effects(69,
70).
It is clear from clinical studies that intra-cavernosal injection of α-agonists becomes less
efficacious with increasing duration of ischaemia(35). Cavernosal smooth muscle biopsies from
patients with ischaemic priapism show evidence of apoptosis and necrosis(71, 72). In addition,
functional in vitro studies on this tissue have shown it to be increasingly resistant to
phenylephrine-induced contraction in a time-dependent manner(35).
Failure of intra-cavernosal therapy is considered when detumescence has not occurred despite
up to one hour of repeated intracavernosal injections in conjunction with systemic treatment
where indicated (e.g. intravenous fluid resuscitation and oxygen in sickle cell crisis)(62). Invasive
surgical intervention is indicated at this stage. The aim of shunt surgery is to create an iatrogenic
fistula between the corpora cavernosae and the systemic circulation, bypassing the dysfunctional
veno-occlusive mechanism and providing venous outflow for blood within the corpus
cavernosae(73). Shunts are indicated where there is a possibility of salvage of some degree of
long term erectile function. In prolonged cases of priapism (>72 hours) penile implant insertion is
the preferred option in the acute phase(74).
Various shunt procedures have been described and these are summarised in table 1.3(75-81).
Shunts are reported to effect detumescence in up to 50% of patients(28). However, long-term

27
erectile dysfunction is common in up to 80% of patients(73). When shunt surgery has failed the
placement of a penile prosthesis is considered in order to minimise penile shortening secondary
to fibrosis and preserve sexual function. Implant surgery may be considered at an earlier stage in
those with pre-existing erectile dysfunction or those who present at a late stage of their priapic
episode(74).
The mechanisms underlying priapism are unclear. An outline of penile anatomy, cavernosal
smooth muscle physiology and the normal mechanisms of penile erection and detumescence
follow.

28
Table 1.3 – Summary of shunt surgery

29
1.2 The penis
1.2.1 Macroscopic structure
The human penis acts as the common conduit for both urine and semen. In addition, when erect,
the penis is the male copulatory organ. Anatomically the penis is described when erect therefore
the dorsal aspect is the surface closest to the abdominal wall and the ventral surface that where
the urethra is palpable. It is predominately formed by 3 ‘tubes’. The paired corpora cavernosae
dorsally and the corpus spongiosum (surrounding the anterior urethra) ventrally. These three
erectile bodies are anchored proximally to both fasciae and bone within the superficial perineal
pouch (the ‘root’ of the penis). The two corpora cavernosae attach to the inferior pubic rami and
perineal membrane surrounded by the ischiocavernosus muscles. The single corpus spongiosum
is attached to the centre of the perineal membrane. From there it enlarges distally to incorporate
the bulbar urethra and is surrounded by the bulbospongiosus muscle. The corpus spongiosum
runs along the ventral aspect of the penis and expands distally to ‘cap’ the paired corpora
cavernosae as the glans penis, separated from them by the penile corona(29, 82-84).
The paired corpora cavernosae join in the midline beneath the pubis to form the major portion of
the penile body. These ‘pressure barrels’ are surrounded by the tunica albuginea, a thick
collagenous layer formed of inner circular and outer longitudinal fibres. These are elastic and
change orientation to accommodate the enclosed spongy tissue during penile erection. There is a
midline septum between the two cavernosae which is fenestrated, allowing free communication
between the two chambers. Each corpus cavernosum encloses a lacunar meshwork of smooth
muscle (50%) and connective tissue (45%)(72). The spaces within this spongy tissue are lined by
vascular endothelium which, in response to appropriate stimuli, releases vaso-active factors
30
resulting in smooth muscle relaxation and penile tumescence. The spongy network is
interspersed with collagen and elastin (fig. 1.1).
Figure 1.1 – Cross section of the human penis at the mid-shaft level
The corpus spongiosum and contiguous glans penis are similar in structure to the corpora
cavernosae. However, the vascular spaces within the smooth muscle meshwork are larger and
the surrounding tunica is thinner around the corpus spongiosum. This is due to an absent outer
tunical longitudinal layer and ensures a low pressure system in this part of the penis during
erection. The tunica is absent over the glans penis.
Bucks’ fascia surrounds all three penile corpora and extends proximally to join with fibres from the
anterior rectus sheath to form the fundiform ligament of the penis. Fibres arise from the pubis
itself and merge with the fundiform ligament to form the penile suspensory ligament. This acts to
hold the penis in an upright position during penile erection(82). Bucks’ fascia extends distally and
fuses with the penile corona, just proximal to the glans penis. Surrounding Bucks’ fascia is a
further superficial fascial layer just beneath the skin. This layer of dartos confers the mobility
required to accommodate the changes of penile size during tumescence. The blood supply to this
skin is independent to that of the erectile bodies(84).
Image removed

31
1.2.2 Blood supply of the penis
The penile artery is the terminal branch of the internal pudendal artery, itself arising from the
anterior branch of the internal iliac artery. The internal pudendal artery passes through the
perineum supplying the anus and scrotum. It then passes through Alcock’s canal as the penile
artery and forms three terminal branches. The bulbourethral artery supplies the urethra, corpus
spongiosum and glans penis. The cavernosal artery, responsible for cavernosal tumescence,
traverses the corpus cavernosum giving rise to many branches which supply the spongy corporal
tissue (fig. 1.2).
Figure 1.2 – Arterial blood supply to the penis (withealth.net)
The penis has an extensive arterial supply. It is important to note that the supply to the corpora
cavernosae differs from that of the glans and corpus spongiosum as well as the overlying skin.
The terminal helicine arteries of the cavernosal artery are intimally associated with the
trabeculated smooth muscle along with the terminal cavernosal nerves (fig 1.3)(84, 85). These
helicine arteries are tortuous in the flaccid state becoming straight during penile erection. The
dorsal artery of the penis, responsible for tumescence of the glans, runs along the dorsal aspect
of the penis with the dorsal vein and nerve below Buck’s fascia in the main neurovascular bundle
of the penis. This third artery gives rise to circumferential branches to the cavernosum,
Image removed

32
spongiosum and urethra. These branches take a direct route when piercing the tunica, resulting
in minimal occlusion during penile erection (fig. 1.1).
Figure 1.3 – Scanning electron micrograph of arterial supply to lacunar space Modified from(85)
The main venous drainage of the penis is via the deep dorsal penile vein (fig. 1.4). This arises
from several venous channels just proximal to the glans penis (the retro coronal venous plexus).
It traverses the ventral aspect of the penis with tributaries from the corpus spongiosum
(circumflex veins present in the distal two thirds of the penis). The vascular spaces of the corpora
cavernosae drain into venules which coalesce beneath the tunica to form the subtunical venous
plexus before exiting as the emissary veins (fig. 1.5)(84). These emissary veins follow an oblique
path between the layers of the tunica and drain into the circumflex veins dorsolaterally. This
oblique path changes orientation during penile erection resulting in venular occlusion and
contributing to penile erection. In the proximal one third of the penis, veins draining the cavernous
bodies, crura and penile bulb join the dorsal penile vein to drain into the internal pudendal veins.
Image removed

33
Figure 1.4 – Venous drainage of the penis (withealth.net)
Draining veins coalesce into a sub-tunical plexus such that as penile tumescence occurs, venular
compression occurs. This ‘traps’ blood within the penis and contributes to the veno-occlusive
mechanism of penile erection.
Figure 1.5 – Scanning electron micrograph of venous drainage of subtunical plexus(85)
Draining emissary veins pass through the tunica albuginea in an oblique fashion becoming
occluded as penile erection occurs.
Image removed
Image removed

34
1.2.3 Innervation of the penis
The penis has both autonomic (parasympathetic and sympathetic) and somatic (sensory and
motor) innervation. The autonomic nerve populations have been divided into three categories;
adrenergic, cholinergic and non-adrenergic, non-cholinergic (NANC)(86-88).
The parasympathetic pathway arises from the second to the fourth sacral spinal segments (fig.
1.6, S2-S4). Pre-ganglionic fibres travel via the pelvic nerves to the pelvic plexus. The
sympathetic pathway arises from eleventh thoracic to the second lumbar spinal segments (T11-
L2), passing through the white rami to the sympathetic chain ganglia. Fibres travel via the lumbar
splanchnic nerves to the inferior mesenteric and superior hypogastric plexuses. The hypogastric
nerves contribute to the pelvic plexus and together with the parasympathetic fibres, form the
cavernosal nerves (fig. 1.6). The cavernosal nerves supply the corpora to effect the
neurovascular events seen during erection and detumescence(29, 83, 84, 86).
The somatosensory pathway originates at the sensory receptors in the penile skin, glans, urethra
and within the corpora cavernosae. These free nerve endings are derived from both thin
myelinated Aδ fibres and unmyelinated C fibres. They converge to form the dorsal nerve of the
penis. This in turn merges with the perineal and inferior rectal nerves to form the pudendal nerve,
entering the spinal cord as the second, third and fourth sacral nerves (S2-S4). The dorsal nerve
also contains autonomic elements enabling it to regulate both erectile and ejaculatory function.
Somatomotor innervation arises from Onuf’s nucleus located in the ventral part (lamina IX) of the
anterior horn in the sacral region of the spinal cord (S2-S4). Fibres originating here travel as the
pudendal nerve, via the sacral nerves, to innervate the ischiocavernosus and bulbocavernosus

35
muscles. Contraction of these produces the rigid erection phase, with contraction of
bulbocavernosus required for ejaculation(83, 84, 86).
Fig. 1.6 – Diagrammatic representation of penile neural pathways. Adapted from(89)
PENIS
S2
S3
S4
Parasympathetic
Supply
T11
T12
L1
L2
Sympathetic
Supply
White
Rami
Sympathetic
chain ganglia
Inferior Mesenteric
Plexus
Superior Hypogastric
Plexus
Lumbar splanchnic
nerves
Hypogastric nerves
Pelvic
plexus
Cavernosal nerve
Somatosensory fibres travelling as perineal and inferior rectal nerves join to
form the pudendal nerve
Autonomic fibres arising in Onuf’s nucleus
travel via pudendal nerve innervating
bulbocavernosus and
ischiocavernosus

36
1.2.4 Central pathways involved in penile erection
Penile erection is a process which, in health, is initiated centrally at the level of the hypothalamus.
The predominant areas involved are the medial preoptic area (MPOA) and the paraventricular
nucleus (PVN)(90). Sensory stimuli originating at the somatosensory nerve terminals are
processed here and integrated with multiple other stimuli including audiovisual, cognitive,
olfactory and tactile sensation. Dopaminergic neurons arising from the caudal hypothalamus
synapse with oxytocinergic neurones within the PVN(91, 92). Stimuli are integrated within these
two centres and result in activation of the autonomic pathways which mediate penile erection.
Pro-erectile neurotransmitters include dopamine, adrenocorticotrophic hormone (ACTH) and
oxytocin. Those inhibiting penile erection are 5-Hydroxytryptamine (5-HT), γ-aminobutyric acid
(GABA), neuropeptide Y and prolactin(83, 84).
1.3 Mechanism of penile erection and detumescence
1.3.1 Corpora cavernosae
The state of the penis is predominantly influenced by the arteriolar and trabecular smooth muscle
tone. In the flaccid state, these muscles are tonically contracted, allowing enough penile blood
flow to maintain homeostasis. In response to appropriate stimuli, neurotransmitters are released
from the cavernous nerve terminals resulting in smooth muscle relaxation. Six phases in the cycle
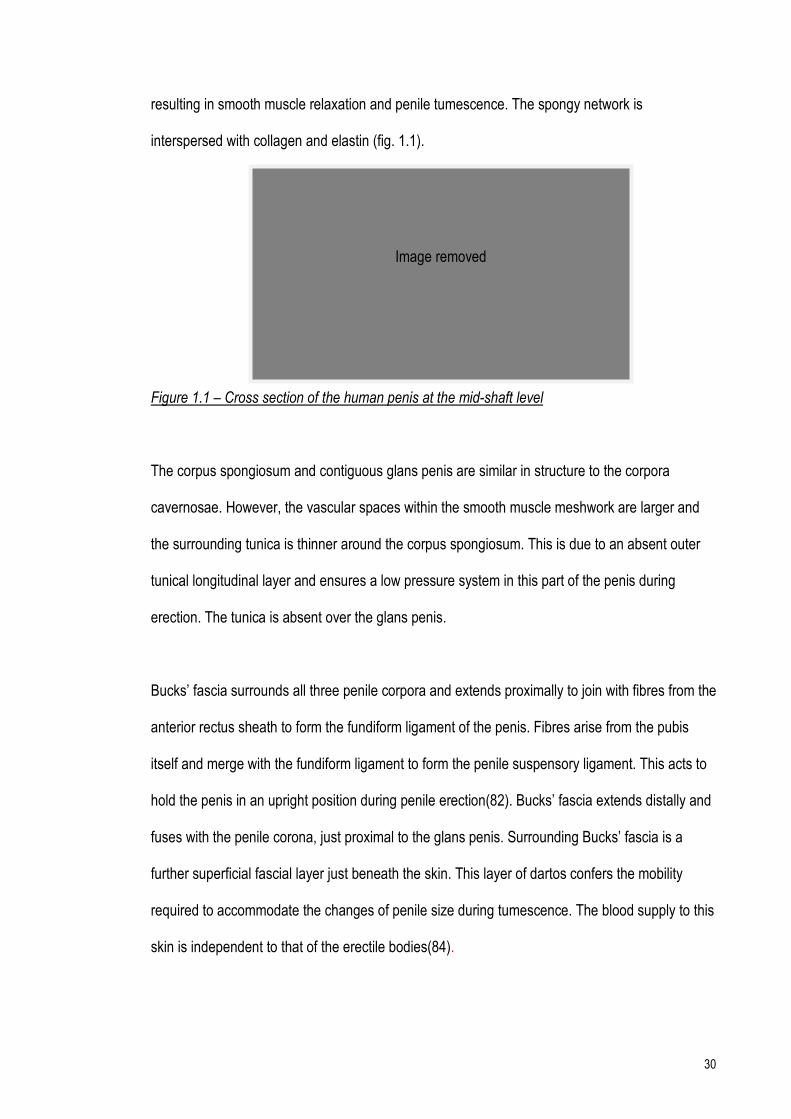
of penile erection and detumescence are described (fig. 1.7)(93, 94):
37
1. Flaccid phase
Minimal arterial and venous blood flow with cavernosal blood gas values similar to those
of venous blood. Flow rate 2.5-8 mL/100 g/min(95); 0.5-6.5 mL/100 g/min(94). Arteriolar
and cavernosal smooth muscle is tonically contracted due to basal release of NA from
sympathetic nerves and endothelin form the endothelium.
2. Latent (filling) phase
Arterial smooth muscle relaxation in the internal pudendal artery during both systolic and
diastolic phases results in increased blood flow into the penis. The lacunar spaces within
the corpora fill with blood and expand, facilitated by relaxation of the trabeculated smooth
muscle. Intracavernous pressure remains unchanged and there is some lengthening of
the penis.
3. Tumescent phase
As the trabecular meshwork expands the subtunical venular plexus is compressed
against the inner layer of the tunica albuginea resulting in decreased venous outflow.
Intracavernous pressure rises until full erection is achieved. The penis expands and
elongates. The arterial blood flow rate decreases as the pressure rises.
4. Full erection phase
As the tunica albuginea expands, the inner circular and outer longitudinal layers expand
in slightly differing directions secondary to the orientation of the connective tissue fibres.
The emissary veins which traverse the tunica in an oblique fashion are occluded as the
tunica expands, resulting in a further reduction in venous outflow. These changes result
in an increase in intracavernous pressure. In the adult this can rise to as much as 80-
90% of the systolic pressure (~100 mmHg). Pressure in the internal pudendal artery
increases but remains slightly below systemic pressure. Arterial blood flow is much less
than in the initial filling phase but is still higher than in the flaccid phase. Although the

38
venous channels are mostly compressed, the venous flow rate is slightly higher than
during the flaccid phase. Due to these pressure changes, blood flow occurs only in
systole. Cavernosal blood gas values approach those of arterial blood.
5. Rigid erection phase
As a result of contraction of the ischiocavernosus muscle (which surround the bony
attachment of the corpora cavernosae), the intracavernous pressure rises well above the
systolic pressure, resulting in rigid erection. During this phase, almost no blood flows
through the cavernous artery; however, the short duration prevents the development of
ischaemia or tissue damage.
6. Detumescent phase
After ejaculation or cessation of erotic stimuli, smooth muscle contraction occurs as a
result of increased sympathetic tone. This effectively diminishes the arterial flow to flaccid
levels. The penis returns to its flaccid length.
Figure 1.7 – Graph showing penile haemodynamic changes during erection and detumescence
Recordings made in monkeys with erections induced by neurostimulation.
Numbers along the top correlate with phases of penile erection.
Upper trace – pudendal arterial blood flow, Lower trace – intracavernosal pressure(93).
Image removed

39
Penile erection is thus a combination of arterial dilatation, sinusoidal relaxation and venous
compression(93).
1.3.2 Corpus spongiosum and glans penis
Arterial inflow to the glans and corpus spongiosum increases in a similar manner to that seen in
the corpora cavernosae. However, the absence of tunical covering of the glans and lack of tunical
longitudinal fibres over the spongiosum results in minimal venous occlusion and a lower pressure
system during erection (typically one third to one half that seen in the corpora cavernosae).
During erection, compression of the dorsal and circumflex veins contributes to engorgement of
the glans and spongiosum. In the rigid erection phase, contraction of the ischiocavernosus and
bulbocavernosus muscles compress the spongiosum and penile veins, increasing pressure within
the glans(96).
1.4 Mechanisms of cavernosal smooth muscle contraction
1.4.1 Cavernosal smooth muscle cell structure
Cavernosal smooth muscle fibres are spindle shaped and have the ability to both contract and
relax. The smooth muscle cells contain the proteins calmodulin, caldesmon and calponin. The
cytoskeleton consists of the intermediate filament proteins vimentin and desmin, along with actin
filaments. The actin filaments attach to the sarcolemma by focal adhesions. The contractile
proteins actin and myosin organise into zones along the long axis of the cell. The sarcolemma
possesses invaginations containing receptors (including muscarinic and adrenergic receptors), G
proteins (Rho A, G alpha), second messenger generators (adenylate cyclase, phopholipase C)

40
and ion channels (L-type calcium channels, ATP sensitive potassium channels - KATP, calcium
sensitive potassium channels - KCa)(86).
To maintain the trabeculated structure found within the corpora, cells are attached to one another
by adherens junctions. Because of this, contraction of one cell causes contraction of adjacent
cells simply by transmission of mechanical force. In addition, electrical activity within the corpus
cavernosum is coordinated, with cells behaving as a functional syncytium(86). Gap junctions
couple adjacent cells both chemically and electrically, facilitating propagation of smooth muscle
cell contraction and relaxation. Connexin 43 is the predominant gap junction protein found in
cavernosal tissue. These intercellular channels promote co-ordinated smooth muscle contraction
and relaxation(97).
1.4.2 Neurotransmitters involved in penile detumescence and maintenance of penile flaccidity
1.4.2.1 Noradrenaline
Penile flaccidity is achieved when corporal smooth muscle is tonically contracted. Α-adrenergic
nerve fibres and receptors present in the trabeculated cavernosal smooth muscle and cavernosal
arteries are thought to mediate this contraction. The α-adrenoceptor (α-AR) is ten times more
prevalent within the corporal smooth muscle than the β-adrenoceptor (β-AR) with around 650,000
α-AR binding sites per cell(98, 99). Both the α1–AR and α2–AR sub-types are present in CSM
however the former is functionally more important(100-104).
It is postulated that α1A-, α1B- and α1D-AR subtypes mediate smooth muscle contraction, the α1b
subtype conferring a degree of pre-synaptic modulation(103, 105, 106). Both phenylephrine and

41
noradrenaline contract human corpus cavernosum smooth muscle(107). Non-selective α-AR
antagonists abolished these contractions (phentolamine) as did the α1-AR antagonist
prazosin(107, 108). These same contractions were also sensitive to the L-type Ca2+ channel
antagonists nifedipine and rauwolscine(107, 108). Α1-adrenoceptor mediated contraction results
in the release of intracellular Ca2+ stores followed by the extracellular entry of Ca2+ for the
maintenance of tone (Fig. 1.8).
Receptor localisation studies have shown that α2-ARs are present on the helicine arterioles
supplying the cavernosal spaces(102, 109). In addition α2 -ARs have been demonstrated on the
autonomic nerves (pre-junctional) and smooth muscle itself (post-junctional)(100). Selective α2-
agonists elicit contraction of corpus cavernosum strips in vitro as well as inhibiting NO release
from autonomic nerves(102, 110). The role of these receptors in health and disease in the in vivo
setting are unclear.
Both β1 and β2 adrenoceptors are expressed in cavernosal smooth muscle(99). Both procaterol
(selective β2 adrenoceptor agonist) and isoprenaline (β1 and β2 adrenoceptor agonist) produce
relaxation in CSM strips pre-contracted with NA(107). Selective β-adrenergic stimulation
produces relaxation of both corporal and penile arteriolar vascular smooth muscle(107). This
effect was abolished in the presence of the β antagonist propranolol. These results suggest that
both β1 and β2 adrenoceptor activation cause relaxation of corporal smooth muscle. However, β
receptors are markedly outnumbered by α receptors on cavernosal smooth muscle and their
functional role in the maintenance of smooth muscle tone is still largely unknown(99).

42
1.4.2.2 Calcium sensitisation and maintenance of CSM tone
Tension generated for a given intracellular [Ca2+] ([Ca2+]i) is variable. For example, tension
generated in response to α-adrenoceptor stimulation is greater than that generated secondary to
membrane depolarisation (e.g. by KCl)(111). Force of contraction does not always correlate with
the degree of elevation in [Ca2+]i(112). This would suggest a possible calcium-sensitizing effect of
contractile-agonists. Simultaneous in vitro measurement of [Ca2+]i and tension in cavernosal
smooth muscle strips during α1-adrenoceptor stimulation showed increase in force to correlate
with both [Ca2+]i and sensitivity of the contractile apparatus(111). These sensitizing effects are
due to inhibition of myosin phosphatase via guanosine triphosphate (GTP) binding proteins that
generate protein kinase C or arachidonic acid(113). This reduction in phosphatase activity results
in a net increase of phosphorylated MLC20 and therefore smooth muscle contraction independent
of an increase in [Ca2+]i. The calcium sensitizing Rho-A/Rho-kinase pathway plays a role in
maintaining penile detumescence(114). In addition to inhibiting myosin phosphatase, Rho-A can
itself directly phosphorylate MLC20, resulting in an increase in activated myosin and therefore
CSM contraction(86). An additional pathway contributing to this calcium sensitisation involves
protein phosphatase-1 inhibitory protein (CPI-17)(111). This protein also inhibits myosin
phosphatase when phosphorylated by protein kinase C. Again an increase or maintenance of
tone can be seen independent of [Ca2+]i increase(111).
1.4.2.3 Endothelins
Endothelins are potent vasoconstrictors produced by vascular endothelium and contribute to
maintenance of the penis in the flaccid state. Endothelin-1 is not stored in vesicles, it is
synthesised directly from mRNA in response to stimuli such as hypoxia, ischaemia,

43
catecholamines, angiotensin II, thrombin or sheer stress. Human corpus cavernosum endothelial
cells express endothelin 1 (ET-1) mRNA and ET receptors (ETA and ETB) have been
demonstrated in penile vascular and trabecular CSM(115). ETA receptors are present in the
endothelium lining the lacunar spaces and appear to mediate relaxatory responses, possible via
the action of NO(116, 117). ETB receptors are localised to vascular endothelium and appear to
mediate vaso-constriction(116, 118). Despite these contrasting effects on stimulation of ETA and
ETB receptors, ET-1 itself induces slowly developing, long-lasting contractions in cavernosal
arteries and smooth muscle(115, 119, 120). The main role of endothelins in penile smooth
muscle physiology in health is to sustain smooth muscle tone and maintain penile
detumescence(121).
Fig. 1.8 – Diagram of CSM contractile factors
CORPORAL SMOOTH MUSCLE CELL
ENDOTHELIAL CELL
NERVE
Endothelin contracts CSM and maintains tone
α1A receptor
NA
α1B receptor
α2 receptor
NA contracts CSM via α1A receptor
α2 receptor inhibits NO release
α1B receptor modulates NA release
↓ O2 during flaccidity causes:
↓ NO synthesis
↓PGE synthesis

44
1.4.2.4 Oxygen tension and maintenance of penile flaccidity
There is also evidence to suggest that the corporal microenvironment itself may contribute to
maintenance of flaccidity. The oxygen tension (pO2) within the flaccid penis is around 25-43
mmHg(122, 123). This is similar to mixed venous blood. During penile erection, oxygen tension
increases to around 100 mmHg(123). Production of NO requires oxygen and the reduction in
PaO2 in the flaccid penis in itself inhibits the basal release of nitric oxide, the principal mediator of
CSM relaxation and penile tumescence(122-124). As penile tumescence begins, PaO2 increases
due to increased arterial flow, NO production becoming maximal at pO2 levels above 60
mmHg(122). Prostaglandin formation is also reduced at low oxygen tension. PGE2 contributes to
CSM relaxation and therefore reduction in production will help maintain detumescence(Fig.
1.8)(125).
1.4.3 Molecular mechanism of smooth muscle contraction
Contraction of human penile arteries and trabecular smooth muscle is largely mediated by the
stimulation of α1-ARs by circulating NA, NA release from autonomic nerves and endothelins from
endothelium (fig. 1.8)(103, 126, 127). Cavernosal smooth muscle contraction is brought about by
a sliding filament mechanism. Smooth muscle cell stimulation results in an increase in [Ca2+]i.
These calcium ions bind to calmodulin forming a calcium-calmodulin complex. This complex in
turn activates myosin light chain kinase (MLCK). Activated MLCK catalyses phosphorylation of
the regulatory light chain subunits of myosin (MLC20). Phosphorylated MLC20 activates myosin
ATPase. The myosin filaments then hydrolyse ATP to release energy. This enables the myosin
filament to undergo a conformational change. The globular heads protruding from the myosin
filament form crossbridges with the actin filaments. These myosin heads shift at the time of this
45
conformational change to slide along the actin filament. The heads then release and adopt their
original conformation prior to rebinding and shifting again should the stimulus for contraction
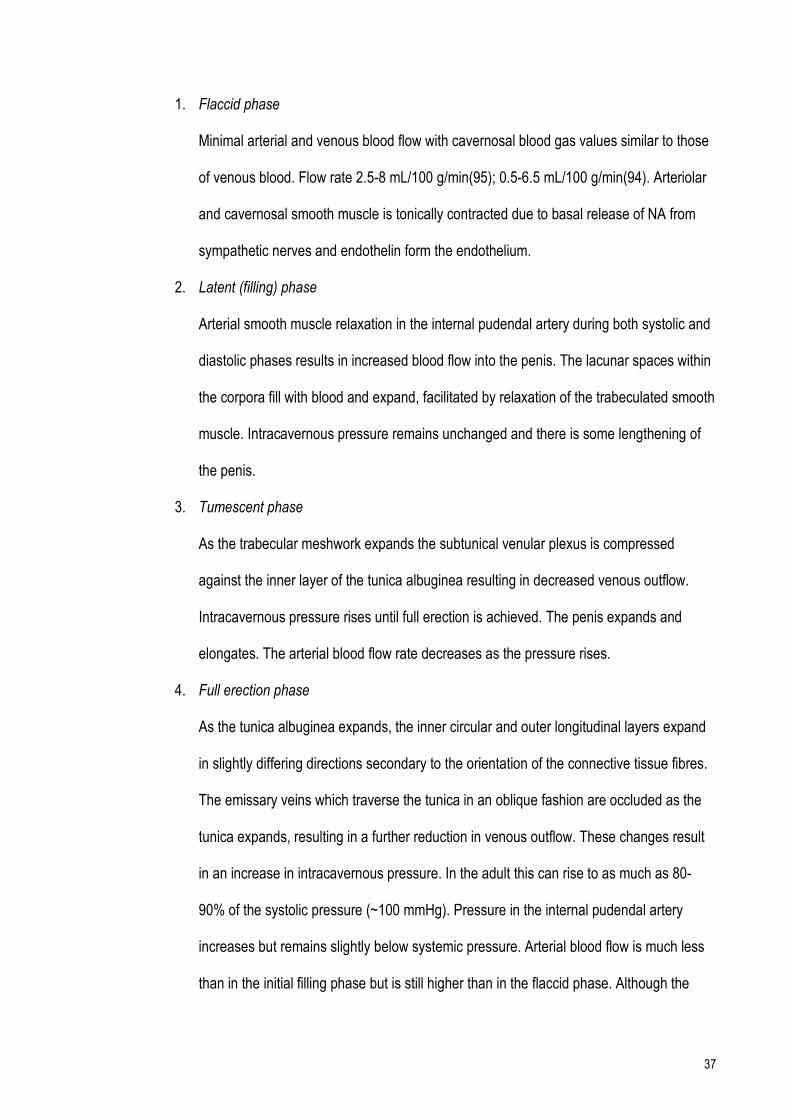
continue. This process is called crossbridge cycling (fig. 1.9)(128).
1.4.4 Energy consumption during smooth muscle contraction
Myosin light chain phosphorylation correlates well with the shortening velocity of smooth muscle.
This is accompanied by a rapid burst of energy as measured by oxygen consumption. Sustaining
this force of contraction is expensive in terms of energy and, soon after initiation, myosin light
chain phosphorylation decreases and the muscle relaxes. However, it is clear that in cavernosal
smooth muscle, a sustained level of smooth muscle tone is maintained to ensure that the penis
remains flaccid. This baseline tone may be attributed to slowly cycling de-phosphorylated myosin
Calcium-Calmodulin Complex
MLCK
MYOSIN MYOSIN - P X ACTIN
CROSS-BRIDGE CYCLING MLCP
Phosphorylation
Dephosphorylation
Fig. 1.9 – Mechanism of contraction of CSM
The Calcium-Calmodulin complex brings about myosin phosphorylation via MLCK. This
Myosin-P then hydrolyses ATP and undergoes a conformational change moving along the
actin filament. These cross bridges continue forming and releasing as long as the stimulus for
contraction continues. Slowly cycling cross bridges and actin polymerisation contribute to the
maintenance of tone at low energy cost to the cell.

46
crossbridges (‘latch-bridges’) and to actin polymerisation stiffening the cell. This type of
contraction maintains a degree of force at low energy costs(129-134).
Maintenance of penile flaccidity is therefore an active process. Noradrenaline-induced smooth
muscle contraction along with intrinsic myogenic activity and endothelium-derived contracting
factors such as endothelin all contribute.
1.5 Mechanisms of cavernosal smooth muscle relaxation
1.5.1 Neurotransmitters involved in penile detumescence
1.5.1.1 Acetylcholine
The penile vasculature and corporal smooth muscle receive a rich cholinergic innervation(129,
135, 136). Acetylcholine (Ach) acts on muscarinic receptors on both corporal smooth muscle and
endothelium. M1-M4 receptor subtypes have been demonstrated in human corpus cavernosum
with the M2 subtype predominating on the smooth muscle and the M3 subtype on the
endothelium(137, 138). Isolated CSM cells have ~45,000 binding sites for Ach, approximately 15
times fewer than the number of α-ARs(98). Muscarinic receptor agonists cause contraction of
isolated CSM. It is therefore postulated that the relaxant effects of ACh on CSM tissue are via
pre-synaptic inhibition of adrenergic neurones which mediate smooth muscle contraction and by
stimulation of the release of nitric oxide from endothelial cells(86, 107, 127, 135, 139, 140).

47
1.5.1.2 Nitric Oxide and the Guanyl Cyclase/cGMP pathway
Penile erection is a result of arteriolar and corporal smooth muscle relaxation. The principle
neurotransmitter mediating this process is nitric oxide (NO)(86, 141). NO is synthesised from the
terminal nitrogen atom of arginine by nitric oxide synthase (NOS) in the presence of NADPH and
oxygen (fig. 1.10). It is therefore an oxygen dependent mechanism. There are several forms of
NOS. Neuronal NOS (nNOS or NOS-1), is found in the cavernous nerves (postganglionic
parasympathetic nerve fibres) and penile arteries(142). nNOS has also been demonstrated in
pre-ganglionic parasympathetic nerves as well as pre-ganglionic sympathetic nerves(143-145).
Endothelial NOS (eNOS or NOS-3) is present in the cells lining the cavernous spaces and in
those lining the small intra-cavernosal helicine arteries(135, 142, 146, 147).
In response to stimuli from higher centres, electrical impulses are transmitted along efferent
‘nitrergic’ nerve fibres which terminate within the corporal bodies(148). The term ‘nitrergic’ applies
to nerves whose transmitter function depends on the release of NO or to transmission
mechanisms that are brought about by NO(149). This neuronal depolarisation causes the
production of NO via nNOS. In addition, endothelial production of NO via eNOS is directly
stimulated by acetylcholine as well as other neurotransmitters such as substance P and
bradykinin(150, 151). Acute increases in shear stress (the term used to describe pressure forces
exerted on endothelial cells by the flow of blood over them) act to drive rapid but limited amounts
of NO release by similar biochemical mechanisms(152, 153).
NO diffuses into corporal smooth muscle cells where it catalyses the conversion of GTP into
cyclic GMP (cGMP) and pyrophosphate via activation of the enzyme soluble guanyl cyclase
(sGC). Cyclic GMP in cavernosal smooth muscle is metabolised by the iso-enzyme

48
phosphodiesterase-5. Inhibition of this enzyme (by drugs such as sildenafil - ViagraTM) results in
potentiation of the relaxatory effects of cGMP and penile erection.
Figure 1.10 – Nitric oxide generation from L-arginine NO generation from L-arginine. Nitric oxide synthase (NOS), in the presence of O2 converts
arginine to NO, with the formation of citrulline.
1.5.2 Molecular mechanism of cavernosal smooth muscle relaxation
As previously outlined, NO produced as a result of stimulation of endothelium by Ach diffuses into
corporal smooth muscle cells. This catalyses the conversion of GTP into cGMP via activation of
the enzyme sGC. The increase in cGMP activates a cGMP-dependent protein kinase (protein
kinase G – PKG) and to a much lesser extent, protein kinase A (PKA). These activated protein
kinases bring about smooth muscle relaxation by several mechanisms:
• PKG activates myosin light chain phosphatase, dephosphorylating myosin light chains and
leading to smooth muscle relaxation.
L-Arginine L-Citrulline
NO
NOS
NADPH, O2

49
• PKA phosphorylates phospholamban, a protein that inhibits the Ca2+ pump of the SR. The
pump is therefore activated and intracellular Ca2+ is taken back into the SR, reducing
[Ca2+]i(154).
• Both cGMP and PKG activate K+ channels resulting in smooth muscle cell
hyperpolarisation. This closes membrane-bound voltage-dependent calcium channels
resulting in a decrease in [Ca2+]i(154, 155).
• cGMP may inhibit the L-type Ca2+ channel and thereby reduce [Ca2+]i(156).
Cellular hyperpolarisation may also be brought about by the direct effect of NO on membrane-
bound Na-K-ATPase channels, i.e. a cGMP independent pathway(157). The net effect of these
mechanisms is to reduce sarcoplasmic [Ca2+] and therefore cause CSM relaxation.
Fig. 1.11 – Line diagram showing methods by which NO causes CSM relaxation
NO
sGC
GTP cGMP L-type Ca2+ channel
Na-K-ATPase channel inhibits
inhibits
activates
activates
K+ channels
PKA Activates Ca2+ pump on SR
PKG MLCP
Myosin P
Myosin

50
1.5.3 Other endogenous mediators of CSM tone
Several other mediators of CSM tone have been identified in human CSM. They are thought to
have a modulatory effect rather than be the predominant mechanisms involved in effecting penile
erection and detumescence.
Immunohistochemical studies have identified vaso-active intestinal polypeptide (VIP) in human
cavernosal tissue biopsies(158). VIP in human cavernosal nerves has been co-localised with
NOS(159, 160). In addition, intracavernosal injection of VIP causes penile tumescence in some
patients(161). However, it has been difficult to show that VIP directly causes CSM relaxation.
Some studies have shown that an antagonist of VIP ameliorated EFS-mediated contractions in
rabbit CSM. The authors concluded that relaxation was dependent upon prostanoids and the
production of NO(162).
Intracavernosal injection of histamine produces a short lived penile erection. Histamine produced
dose dependent relaxation in human corpus cavernosum samples(163). However, not all studies
have shown consistent relaxatory effects. The predominant histamine receptor sub-type is the H1
receptor (H1-3 have been categorised). Stimulation of the H1 receptor elicits contraction in isolated
corpus cavernosum(164).
Stimulation of serotonin (5-hydroxytryptamine, 5-HT) type 1 and 2 subtypes mediates contraction
in rabbit CSM. 5-HT4 stimulation elicits relaxation in the same in vitro model(165). However,
further studies using human corpus cavernosum show an overall tendency towards smooth
muscle contraction(166). The physiological role of peripheral serotonin remains unclear.

51
The role of purines such as ATP and adenosine in CSM contraction are not established. Both
compounds produce relaxation in pre-contracted rabbit CSM and canine penile arteries(167). The
purinergic system is the focus of considerable interest at present and further developments may
reveal new therapeutic targets for the treatment of erectile dysfunction.
Vascular smooth muscle relaxation is mediated by endothelium-dependent mechanisms which
include NO(168). Relaxation still occurs in vascular tissue with intact endothelium despite
blockade of NOS and cyclo-oxygenase (inhibiting the NO-cGMP and prostaglandin pathways
respectively) and is thought to be mediated by endothelial cell hyperpolarisation. The alternative
endothelial derived hyperpolarising factors (EDHFs) involved in relaxation pathways may be
related to products of arachidonic acid metabolism or metabolites of P-450(169). EDHFs have an
important role in the relaxation of arteriolar smooth muscle as opposed to cavernosal smooth
muscle(170).
1.6 Cavernosal smooth muscle cell calcium regulation
Corporal smooth muscle contraction is a result of an increase in [Ca2+]i. Transient changes in
[Ca2+]i are critical to the contractile state of CSM. An outline of cellular Ca2+ regulation follows.
Ca2+ entry pathways
CSM cells exhibit a variety of voltage and ligand-gated ion channels that normally serve as the
principle Ca2+ entry pathway. At rest, sarcoplasmic free [Ca2+] is ~100 nM. Extracellular fluid
[Ca2+] is ~10,000 times higher than this (~1.5 to 2 mM). This concentration gradient is maintained
by the Ca2+ pump and Na+/Ca2+ exchanger, both located on the cell membrane. Channel
activation causes movement of Ca2+ down an electrochemical gradient and results in a 5-fold

52
increase in [Ca2+]i to ~550 – 700 nM(171). This results in myosin phosphorylation and smooth
muscle contraction.
The predominant voltage gated channel in CSM is the L-type Ca2+ channel. Cell membrabe
depolarisation due to an action potential opens these voltage-gated L-type Ca2+ channels,
resulting in Ca2+ influx along the concentration gradient into the cell. These channels may be
blocked by drugs such as nifedipine.
It is postulated that Transient receptor (TRP) channels are also present on the cell membrane,
TRPM8 (a subtype of TRP channel) having been shown in rat CSM(172). Transient receptor
(TRP) channels are present on the plasma membrane of many smooth muscles and are relatively
non-selectively permeable to cations including Ca2+.
Ca2+ release mechanisms
An important mechanism for [Ca2+]i elevation involves release of Ca2+ from intracellular stores.
These can increase [Ca2+]i with or without a change in membrane potential i.e. with or without an
influx of Ca2+ into the cell. The sarcoplasmic reticulum facilitates the storage and release of
Ca2+(173). Accumulation of Ca2+ into these stores is accomplished by a Ca2+ ATPase. Release of
these stores occurs secondary to release of inositol 1,4,5-trisphosphate (IP3)(174). The IP3
pathway is stimulated when noradrenaline binds to the α1-adrenoceptor which is coupled to
phosphoinositide-specific phospholipase C via GTP-binding proteins. Phospholipase C then
hydrolyses phosphatidylinositol 4,5-biphosphate (PIP2) to 1,2-diacylglycerol (this is membrane
bound and activates protein kinase C) and IP3. IP3 (which is soluble and diffuses through the cell)
binds to its receptor (IP3R) on the sarcoplasmic reticulum (SR). The SR concentration of Ca2+ is
around 1 mM. IP3 binding opens calcium channels in the SR resulting in Ca2+ efflux into the
53
sarcoplasm and subsequent smooth muscle contraction. This increase in Ca2+ activates the
ryanodine receptor-operated channel on the SR, leading to a further increase in sarcoplasmic
[Ca2+](i.e. calcium-induced calcium release-CICR)(84, 112, 128, 175-177). Caffeine may be used
to activate CICR in intact cells(178).
Ca2+ efflux pathways
To maintain homeostasis, Ca2+ influx must be balanced by efflux across the cell membrane. This
is accomplished via a Ca2+ ATPase (the calcium ‘pump’) and the Na+/Ca2+ exchanger. The former
may be sensitive to pH change whilst the latter is sensitive to amiloride(179).
1.7 Effect of ischaemia on cavernosal smooth muscle
As previously outlined, the process of penile erection and detumescence is secondary to
haemodynamic changes within the penis. During penile erection, there is a degree of reduced
blood flow within the penis secondary to the reduction in venous outflow (fig. 1.7 – penile
haemodynamic changes during erection and detumescence and detumescence, page 38). As the
duration of penile erection increases, the corporal microenvironment will change. Serial
cavernosal blood gases in men with pharmacologically induced penile erection demonstrate a
time-dependent decrease in oxygen tension and pH, and an increase in carbon dioxide
levels(31). In addition, corporal blood aspirates during priapism show a time dependent decrease
in blood glucose levels(31, 35, 93, 180, 181). Various researchers have examined the effect of
these metabolic changes in isolation and in combination on cavernosal smooth muscle with a
view to examining the effect of acute and chronic ischaemia on corporal smooth muscle.

54
1.7.1 The effect of hypoxia on CSM contraction
Broderick et al. subjected rabbit cavernosal smooth muscle strips to anoxia and examined the
effect of EFS-mediated and agonist-induced contraction and relaxation. Both aspects of CSM
function were severely affected; relaxatory responses were abolished in the absence of
oxygen(182). Kim et al. examined the effect of hypoxia on nerve-mediated and agonist-induced
contraction in an in vitro model of CSM(183). Noradrenaline (NA) and endothelin evoked
contractions were significantly attenuated after 180 min of hypoxia. Responses returned to
normal upon return to control conditions. Interestingly, EFS-mediated contractions appeared to be
augmented during hypoxia, an effect which was reversed when experiments were repeated in the
presence of the NOS inhibitor L-NOARG. Potassium induced tonic contraction was also
examined, with a sustained relaxation observed during up to 180 min of hypoxia. This was fully
reversible on return to control conditions. Additional experiments found similar responses
between muscle strips with intact vs. denuded endothelium as well as in the presence of
indomethacin (cyclo-oxygenase inhibitor) and methylene blue (guanyl cylcase inhibitor). This
paper concluded that ‘the effects of hypoxia are not restricted to a specific receptor pathway, but
that there is a failure of the contractile mechanism of the smooth muscle to respond to any
agonist or to the depolarisation that follows exposure to high [K+]’. The finding that EFS-mediated
contraction was increased during hypoxia was attributed to the differential effect of low oxygen
tension on the various nerve types present.
Kim et al. also examined the effect of hypoxia on relaxatory responses in an in vitro model of
CSM using both human and rabbit tissue samples(122). At oxygen tensions similar to that found
in the erect penis (~ 100 mmHg), Acetylcholine and electrical field stimulation elicited increasing
concentration-dependent and frequency-dependent relaxations in pre-contracted muscle strips

55
mounted in organ baths. Reduction in oxygen tension to that found in the flaccid penis (44-57
mmHg) resulted in significant amelioration of both Ach and EFS-mediated relaxation in the rabbit
CSM preparation. EFS-mediated relaxatory responses in human CSM were significantly reduced
under similar hypoxic conditions; however, more severe hypoxia was required to significantly
reduce Ach mediated responses. Responses returned to normal on return to normoxia.
Interestingly, during hypoxia, responses similar those seen at PO2 ~ 100 mmHg were observed in
response to exogenous NO.
1.7.2 The effect of acidosis on CSM contraction
Saenz de Tejada and co-workers examined the effect of acidosis on contraction in an in vitro
model of CSM(184). Smooth muscle strips equilibrated at pH 7.4 were exposed to 30 min. of
acidosis (pH 6.9) generated using a 25% O2/75% O2 gas mix. Responses to EFS, NA and [K+]
were recorded. Acidosis caused a right shift in the dose response curve to NA i.e. higher doses of
NA were required to elicit the same response under acidic conditions. The maximal response to
NA was unchanged. EFS mediated contractions were significantly suppressed throughout the
frequency response range at pH 6.9. Acidosis had no effect on the maximal contraction in
response to high [K+]. However, at [K+] less than maximal tension generated was reduced under
acidotic conditions. EFS and agonist mediated relaxation in tissue strips precontracted with a
non-maximal [K+] were relatively preserved under acidotic conditions. Moon et al. induced a
metabolic acidosis in anaesthetised cats using hyperventilation. Intracavernous pressure
measurements were reduced during stimulated penile erections indicating a degree of CSM
failure(185).

56
1.7.3 The effect of combined elements of ischaemia
In an in vitro model of low flow priapism, Muneer et al. examined the effect of elements of
ischaemia - hypoxia, acidosis and hypoglycaemia, individually and in combination on cavernosal
smooth muscle(71). The absence of glucose markedly reduced both nerve-mediated and agonist-
induced contractions when compared to the effects of acidosis and hypoxia alone. The
combination of hypoxia and glucopenia, with our without simultaneous acidosis, significantly
attenuated contractile function when compared to each factor in isolation. Hypoglycaemia during
the period of ischaemia also reduced the ability of the tissue to recover following a period of
reperfusion. In the same study it was found that nitrergic nerve-mediated relaxation was relatively
spared during ischaemia when compared to adrenergic nerve-mediated contraction, a finding that
could help explain the failure of detumescence in low flow priapism.
Munarriz et al. used an animal model to examine the effects of ischaemia and reperfusion on
cavernosal smooth muscle(186). Penile erection was induced in anaesthetised rabbits and
maintained using a penile clamp to mimic priapism. Varying periods of reperfusion were applied
by removal of the clamp prior to tissue fixation and removal for analysis. As expected, a time
dependent reduction in intracavernosal oxygen tension was noted during the priapic episode.
Interestingly, increases in myeloperoxidase activity and lipid peroxidation (markers of oxidative
injury) were noted with reperfusion. This would suggest that not only is corporal smooth muscle
injured during the ischaemic insult but that damage occurs on reperfusion with arterial blood.
Cavernosal blood aspirates during ischaemic episodes show evidence of metabolic depletion as
evidenced by low pO2, low pH and low glucose. CSM contractile failure is integral to the

57
mechanisms underlying ischaemic priapism. The relative contributions of these elements of
ischaemia to CSM dysfunction are not clearly defined.
1.8 Experimental models for the study of ischaemia on CSM
As described above, various animal models have been used to study the effects of ischaemia in
vitro and in vivo(187). The origin of tissue for experimentation is influenced by several variables
including availability and cost, as well as relevance to the condition being studied. Ideally, normal
human CSM would be used for experimentation as this would most closely resemble the
pathological condition. There are no operations during which normal human CSM may be
retrieved without causing a detrimental effect to the patient. Abnormal CSM may be retrieved
(with full ethical approval and patient consent) during implantation of penile prostheses(35, 72,
74). However, this tissue is abnormal due to the underlying processes causing the erectile
dysfunction prompting the implant insertion. These are usually conditions such as diabetes and
cardiovascular disease, both of which are associated with chronic corpus cavernosal ischaemic
change.
A second potential source of human tissue would be during penectomy for penile cancer. Again,
the patient group affected are elderly with multiple comorbidities often resulting in erectile
dysfunction. In addition, due to a trend towards penile preserving surgery where possible, only
small amounts of tissue are usually available. Finally penectomy during male to female gender
reassignment surgery would be an excellent source of tissue for experimentation, the volume of
tissue available is large and surgery is elective allowing for scheduling of experiments. However,
patients undergo surgery after a prolonged period of oestrogen administration, usually for several
years prior to penectomy. This in itself may induce cavernosal smooth muscle change(104).

58
Animal models have formed the usual basis for experiments examining CSM function. The
majority of studies utilise rabbit CSM for both muscle strip and single cell experiments, the
characteristics of this tissue source are well established(71, 122, 183, 184). Mouse and rat
models are also described. The advantage of these is their relative ease of use and cost as well
as steady supply for experimentation. In addition various pharmacological parameters are
comparable to human tissue (smooth muscle to collagen ratios, EC50 to contractile agonists).
However, within our own laboratory, guinea-pig tissue has been used for experiments on both
cardiac and lower urinary tract smooth muscle(188, 189). In order to maintain efficiency and
enable the large number of experiments proposed we decided to define a novel guinea-pig model
for examining the effect of ischaemia on CSM.
The mechanism by which researchers simulate ischaemia varies markedly. The components of
ischaemia will be considered in turn.
Glucopenia
Glucose is broken down in the cytoplasm by the process of glycolysis(190, 191). Pyruvate is
produced in a chain of events within the cytosol with the additional production of energy in the
form of two molecules of adenosine-triphosphate (ATP). In the presence of oxygen, mitochondria
are able to undergo aerobic respiration. Pyruvate drives the electron transport chain of the citric
acid (Krebs) cycle to create further ATP as part of oxidative phosphorylation(192). In the absence
of oxygen, the pyruvic acid produced by glycolysis undergoes lactic acid fermentation within the
cytoplasm. In terms of energy production, aerobic respiration is far more efficient, liberating 38
ATP from each glucose molecule compared to 2 ATP for anaerobic metabolism(193). Omission
of glucose (and Na pyruvate if present) from superfusing solutions during experimentation allows

59
the effect of prolonged glucopenia as well as the presence and effectiveness of glycogen stores
at maintaining contractile function to be examined(71).
Hypoxia
Oxygen is required by smooth muscle to generate energy via oxidative phosphorylation. Tissues
increasingly rely upon anaerobic metabolism during hypoxic interventions; this is expensive in
terms of glucose expenditure. In general researchers generate hypoxia by substituting nitrogen
for oxygen in gas mixtures used to perfuse solutions bathing tissue strips/isolated cell
preparations. It is methodologically difficult to conduct experiments in completely anoxic
conditions unless completely enclosed tissue chambers are used due to the diffusion of
atmospheric oxygen into the surface of liquids. This effect is increased with greater surface area
to volume ratios of fluid and reduced flow rates.
Acidosis
In health, extracellular acidosis induces intracellular acidification due to buffering and equilibration
of H+ across the cell membrane by both active and passive mechanisms(188, 194, 195). In broad
terms, researchers may generate a reduction in pH in one of two ways.
1. Increasing PaCO2 in the perfusing gas mixture. In solution this will generate an increase
in free [H+]. Changes in pH occur quickly and extracellular pH may be adjusted by
increasing the concentration of available buffer for H+ in solution(188, 194).
2. The use of weak acids (e.g butyrate) in perfusing solutions acts as a source of H+ ions
which will equilibrate across the cell membrane(195). This method allows pH to be
manipulated in both intra and extracellular compartments by altering the buffering solute
(bicarbonate) concentration. This mechanism typically produces smaller changes in pHi
than method 1.

60
1.9 Effect of low temperature on smooth muscle
Washout of the turgid corporal bodies with fluids is a recommended intervention in the
management of priapism(60, 62). These fluids are usually at room temperature and may be
combined with ice packs and cold compresses to help reduce the oedema and pain that
accompanies prolonged ischaemic priapism. However, there is no evidence for these reduced
temperature interventions in improving cavernosal smooth muscle contraction and therefore
facilitating detumesence.
In the respiratory tract reduced temperature appears to potentiate smooth muscle contraction. In
human nasal smooth muscle, nerve-mediated phasic contractions were prolonged although the
magnitude remained unchanged. Agonist-induced contractures mediated via α-adrenoceptors
were augmented in the same preparation (196). Tracheal smooth muscle demonstrated a left
shift in the nerve-mediated force-frequency relationship. Overall magnitude was not increased. In
addition, agonist-induced relaxation mediated via β-adrenoceptors was abolished (197). Small
intestine smooth muscle showed an increase in magnitude of contraction in response to
acetylcholine with no alteration on in the EC50 of the preparation. Researchers proposed these
changes to be secondary to increases in [Ca2+]i at low temperature(198). Vascular smooth
muscle also demonstrates augmentation of contraction at reduced temperature. An increase in
nerve-mediated contraction was noted in saphenous vein which was maintained in the presence
of the α1-adrenoceptor antagonist prazosin(199). Augmentation was abolished in the presence of
the α2-adrenoceptor rauwolscine supporting the hypothesis that this receptor mediates cold-
induced vasospasm in peripheral vessels.

61
Reduced temperature shows a marked effect in the lower urinary tract. Cooling from 37 °C to 5
°C in a stepwise fashion evoked contraction of rat bladder muscle strips. Responses were
postulated to be secondary to an increase in [Ca2+]i shown by the sensitivity of the recorded
response to the Ca-channel blocker nifedipine and to perfusion with Ca2+-free solution(200). Vas
deferens showed an increase in agonist-induced contraction with a left-shift of the force-
concentration relationship with a reduction in temperature. Contractions were elicited by the α1-
adrenoceptor agonist phenylephrine; augmentation at low temperature was abolished when
perfusing solution [Ca2+] was reduced by 50%(200).
Responses to cooling differ between species. Guinea-pig ureter showed a reduction in
magnitude of the agonist-induced contracture in addition to slowing of the response. The fast
sarcoplasmic reticulum related [Ca2+] changes appeared to be affected to a greater extent when
compared to the slower membrane bound mechanisms (Na/Ca2+ exchange and Ca2+ pump)(201).
Rat ureter by contrast showed an increase in force generated in response to stimulation during
reduced temperature interventions. This was attributed to an increase in the Ca2+ transient
secondary to a prolonged action potential(202). These differences were secondary to varying
contributions of ion channels to the action potential. Cooling appeared to potentiate Ca2+
activated Cl- currents (present in rat ureter, absent in guinea-pig ureter) with a resultant prolonged
plateau phase of the action potential. In the rat this augmented action potential was sufficient to
overcome kinetic lag. In addition and in contrast to other researchers, Ca2+ entry and SR release
of Ca2+ appeared to be relatively insensitive to cooling whereas MLCP activity was markedly
affected by reduced temperature therefore increasing the amount of phosphorylated myosin for
any given [Ca2+]i(202). Maintenance of smooth muscle tone at low energy costs is essential in
promoting penile detumescence. Smooth muscle may have a reduced capacity to maintain tone

62
during a reduction in temperature using slowly cycling cross-bridges (latch state). This has also
been postulated to be secondary to a reduction in myosin phosphorylation(134).
It is clear that cooling can modulate force production and has differing effects in varying smooth
muscles. The effect of a reduction in temperature on cavernosal smooth muscle has not been
reported. In addition to experiments examining the effect of ischaemia on CSM function, the effect
of cooling was recorded on various aspects of CSM function.
1.10 Aims and objectives of thesis
Hypothesis:
1 The combination of hypoxia, acidosis and glucopenia causes cavernosal smooth muscle
failure in a time-dependent manner. The contribution of the various elements of
ischaemia is variable however glucopenia is central to irreversible smooth muscle
dysfunction.
2 Low temperature washout fluids do not improve CSM contractile function.
Aims of the thesis:
The aim of this project was to investigate the role of the various elements of ischaemia on
cavernosal smooth muscle cell contractile function. The effect of hypoxia, acidosis and
glucopenia, individually and in combination, were investigated on the contractile activity of CSM
preparations. Both nerve-mediated and agonist-induced contraction and relaxation were
examined. Guinea-pig cavernosal smooth muscle strips and single cell preparations were used.

63
Objectives:
The following objectives were addressed through the experiments performed in this study, to
determine the effect of the various elements of ischaemia on CSM.
1. To establish the viability of guinea-pig CSM as a model for the study of corporal smooth
muscle function
2. To determine the effect of hypoxia, acidosis and glucopenia on nerve-mediated and
agonist-induced contractions and relaxations in guinea-pig CSM muscle strips. Intra- and
extra-cellular acidosis was examined as well as a reduction in pH in both compartments.
The elements of ischaemia were applied in isolation and in combination. The recovery of
preparations on return to normal conditions was also recorded.
3. The effect of the above conditions on [Ca2+]i was recorded in an isolated CSM cell
model.
4. The effect of a reduction in temperature on CSM function was also examined.

64
2.0 Materials and Methods
2.1 Solutions and chemicals
2.1.1 Tyrode’s solution
Tyrode’s physiological solution was used in all experiments to superfuse preparations. The
constituents of the solution and their concentrations are listed in Table 2.1. AnalaR® grade
reagents were added to de-ionised water (RO water - minimum 18 MΩ resistance, reverse
osmosis filter, Purite Ltd, UK) in their solid form (NaCl, NaHCO3, glucose and Na pyruvate) or
from 1 M stock solutions (KCl, MgCl2 and NaH2PO4) made up in the laboratory, with the exception
of CaCl2 which was obtained as a 1 M stock solution (BDH Ltd, UK). Solid compounds were
weighed using a fine balance (Sartorius Ltd, UK) and liquids measured using calibrated variable
volumetric pipettes. Tyrode’s solution was stored at 21°C for use on the day of production, or at
4°C if kept overnight for use the next day. A HEPES-buffered Ca-free Tyrode’s solution was used
for tissue storage and cell isolation (table 2.1). This Ca-free solution was adjusted to pH 7.4 with
1 M NaOH to compensate for the absence of CO2 gas perfusion.
2.1.2 Chemicals and drugs
All chemicals used in interventions were freshly made up daily to the required concentration in
Tyrode’s or modified Tyrode’s solution. The AnalaR® grade solid chemicals phenylephrine,
carbachol and tetrodotoxin (Sigma, UK) were made up in RO water. 1H-[1,2,4]oxadiazolo-[4,3-
a]quinoxalin-1-one (ODQ - Sigma, UK) and Fura-2 (Invitrogen Molecular Probes Inc, USA) were

65
dissolved in the organic solvent dimethyl sulphoxide (DMSO – BDH, UK). Stock solutions were
made up in the laboratory and stored at 4 °C or drawn up into aliquots and stored at -20 °C.
2.1.3 Simulation of ischaemia
Modification of Tyrode’s solution enabled the various components of ischaemia to be simulated.
All perfusing gases were stored at room temperature and sourced from BOC, UK. The various
components of simulated ischaemia are shown in Table 2.1 and are summarised here:
Hypoxia (H) The superfusate PO2 was reduced by gassing the solution with a N2/CO2 mixture,
rather than an O2/CO2 mixture. Samples were taken at the superfusion bath during experiments
to estimate the partial pressure of oxygen within the solution using an oxygen-electrode (PO2
from 10 kPa to 4 kPa)(203).
Substrate depletion (S) Glucose and sodium pyruvate were omitted from the solution.
Intracellular acidification and extracellular acidosis (IA) The pH was reduced as a result of
increasing superfusate PCO2 by using a 10% CO2 gas mixture rather than a 5% CO2 mixture.
Extracellular acidosis (A) A decrease of extracellular pH was achieved by reducing the [HCO3-] of
the superfusate (a reduction in concentration of [NaHCO3] from 24 mM to 9.6 mM). The [Na+] was
maintained by increasing the [NaCl] added (from 118 mM to 132.4 mM). The availability of free
Ca2+ was maintained by decreasing the [CaCl2] added (from 1.8 mM to 1.55 mM)(188).

66
Intracellular acidification (I) A decrease of intracellular pH, at constant extracellular pH, was
achieved by increasing the [HCO3-] and PCO2 in proportion. This was achieved by doubling the
[NaHCO3] added to the solution (from 24 mM to 48 mM) and using a 10% rather than a 5% CO2
gas mixture. The [CaCl2] was adjusted appropriately to maintain Ca2+ activity from 1.8 mM to 2.34
mM(188).
The above interventions were applied separately and in various combinations. A pH electrode
(BDH Ltd, UK) and pH meter (SE-500, Solex, Taiwan) were used to record superfusate pH at
various times during experiments; the pH electrode was calibrated on a daily basis. Oxygen
tension was estimated during experiments using an O2 electrode (Licox CMP, Integra
Neurosciences Ltd, UK).
2.2 Tissue collection and preparation
Cavernosal tissue was obtained from barrier maintained sexually mature male Dunkin-Hartley
guinea-pigs weighing 500-950 g (Bantin & Kingsman Universal Ltd, UK). Animals were humanely
killed by cervical dislocation according to UK Home Office guidelines. The penis was immediately
dissected and placed into a dissection dish containing Ca-free Tyrode’s solution. The penis was
immobilised with three 25 gauge syringe needles (Terumo, Belgium) and excess connective
tissue removed using straight nosed no. 5 micro-dissection forceps and fine scissors (INOX,
Switzerland). Cavernosal smooth muscle strips were then prepared for isometric tension
experiments (5 x 1 mm), or pieces of tissue obtained for isolated cell work (1mm3). Tissue was
stored in Ca-free Tyrode’s at 4°C prior to use.

67
Table 2.1 Constituents of Tyrodes

68
2.3 Isometric tension measurement
2.3.1 Equipment and set-up
A horizontal Perspex superfusion trough (4 mm x 4 mm cross-section) was used that allowed the
muscle strip to be immersed in a constant flow of solution (fig. 2.1). Flow speed was controlled
with a gate clamp around the solution delivery tube which was adjusted at the start of every
experiment to give a flow rate of 3 ml.min-1.
The muscle strip was secured between two stainless steel mounting hooks; one fixed into the
superfusion trough and a second connected to a force transducer (FT03, Grass Instrument Co,
USA). This force transducer was mounted on a micromanipulator (Prior instruments, UK) with a
Vernier scale on each plane of movement so that the transducer hook’s position relative to the
fixed hook could be recorded to give the length of the muscle strip. The system also permitted
muscle length to be adjusted to yield maximum contractile force. The force transducer was
connected to a variable gain Wheatstone bridge amplifier with a 5 Hz high frequency cut-off
(Model TBM4M, World Precision Instruments, USA). Output was both monitored and recorded on
a pen recording device with a low-pass filter of corner frequency 10 Hz (TA 240S, Gould
Instruments Ltd, UK) and oscilloscope (DSO 420, Gould, UK).
A pair of platinum electrodes were embedded within the walls of the superfusion trough to deliver
electrical field stimulation (EFS), and positioned such that the strip would lie between them. The
electrodes were connected to an electrical stimulator (model 200, Palmer Bioscience, UK) and
gating device (model 150, Palmer Bioscience, UK) which allowed reproducible manipulation of
stimulation parameters. The stimulator and gating device were calibrated using a signal generator

69
(model TWG-501, Feedback, UK) and digital oscilloscope (Easyscope 420, Gould Instruments
Ltd, UK) prior to use.
A water bath with a combined heater and pump (Thermoflow 471, Coniar Churchill Scientific
supplies Ltd, UK) was used to warm perfusing solutions to 37±0.5 °C. This was mounted 1.5 m
above the superfusion trough to enable warmed solution to be delivered to the trough under
gravity. Warmed solutions were delivered to the trough via circulating water-jacketed 1.5 mm
diameter tubing. After perfusing the tissue, solutions drained to waste. In experiments utilising low
temperature superfusion fluids, a separate water bath (containing ice water if required) and
delivery tubing system was used without a warming water jacket. Perfusing solution temperature
was monitored periodically at the superfusion trough with a digital thermometer (model 915-1,
Testo, UK). Solutions were bubbled with the appropriate gas mixture for at least 15 min prior to
use.
A specially constructed experimental table was used with several features to minimise
mechanical noise due to vibration. A welded steel frame with legs in buckets of sand was used
with a 20 mm plywood top. This in turn supported a 25 mm steel plate mounted on neoprene and
Teflon vibration absorbing pads (SK bearings, Cambridge, UK). Mounted on this was an
aluminium modular top that allowed equipment to be firmly clamped in place.
At the end of experiments, the wet weight of the muscle strips was measured using a fine balance
(model 205A, Precisa Balances Ltd, UK). This value along with the length of the strip was used to
estimate the cross-sectional area (csa) using the formula:
csa (mm2) = 1000 x mass (g)]/[[density (g/ ml-1)] x [length (mm)]]
o Density was taken as 1.05 g.ml-1.

70
Fig 2.1 Muscle strip experimental set up

71
2.3.2 Calibration of tension transducer
The orientation of the force transducer was manipulated such that small solder weights could be
hung from the mounting hook to enable calibration. The mass of weights were confirmed on the
fine balance and then each weight was suspended from the force transducer hook in turn.
Corresponding deflections were recorded on the pen recorder. The height (mm) of each
deflection above baseline (no weight) was plotted as a function of force (mN) calculated using the
formula:
Force (mN) = mass (g) x gravitational constant (m.s-2)
o The gravitational constant was taken as 9.81 m.s-2
2.3.3 Muscle strip preparation and mounting
6/0 sutures (Sutures Ltd, UK) were tied with non-slipping surgical knots to each end of a muscle
strip. The strip was then transferred to the superfusion trough with Tyrode’s solution at 37 °C,
flowing through at 3 ml.min-1. One end of the strip was tied to a fixed mounting point in the base
of the trough, and the other to the attachment hook of the tension transducer. The
micromanipulators were adjusted so that the tissue was immersed in the flowing Tyrode’s
solution. There was no slack in the strip and the position was adjusted so that it was equidistant
from each platinum electrode. Strip length was adjusted so that a stable baseline recording was
achieved and reproducible phasic contractions in response to electrical field stimulation (EFS –
see section 2.3.4) were obtained of a magnitude close to the maximum of the length-tension
relationship. Typical strip length and weight was 5.5 mm and 0.015 g. Estimated CSA from these
values was 2.5 mm2.

72
2.3.4 Electrical field stimulation (EFS) experiments
EFS contraction experiments
Phasic contractions were elicited by periodic exposure of the muscle strips to electrical field
stimulation (EFS). The optimum stimulation parameters in terms of stimulation voltage and
frequency, duration of stimulation train and period between stimulations was ascertained
experimentally and used for subsequent experiments.
All experiments commenced with 60 min. of periodic EFS to allow the muscle strip to equilibrate.
Preparations were stimulated every 90 s with a 3 s pulse train at 32 Hz, 0.1 ms pulse width and at
50 V. Stimulation parameters were confirmed using an oscilloscope (DSO 240, Gould, UK).
Tension in the strip was adjusted using the micromanipulators until a stable response was
attained.
Strips were stimulated every 90 s at 32 Hz throughout each experiment. At various points during
each experiment a force frequency relationship was determined by using stimulation frequencies
from 8 to 60 Hz incrementally. The force-frequency relationship at the end of the 60 min.
equilibration period acted as the control recording with similar force-frequency estimations being
carried out during the ischaemic interventions and after a period of reperfusion in normal Tyrode’s
solution (figure 2.2).

73
Figure 2.2 - Experimental protocol for EFS contraction experiments
Stimulation at 32 Hz every 90 s throughout the experiment enabled the time point at which
interventions had an effect to be determined whilst regular force/frequency estimations enabled
these effects to be characterised.
Recorded responses were measured using a 30 cm rule with 1 mm gradations to accuracy of ±
0.5 mm. Measurements were taken from baseline tension to the peak of each phasic contraction.
Using calibration data, measurements were converted to force and normalised to unit cross-
sectional area (csa) using the following equation:
Deflection (mm) / [gradient of calibration graph (mN.mm-1) x csa (mm2)] = force (mN.mm-2)
In certain experiments, the time constant of the phasic contraction was measured as well as the
maximum tension generated. To do this the pen recorder paper speed was increased from 2.5
mm.min-1 to 25 mm.s-1 for the final 60 Hz stimulation of each force-frequency estimation. The
time-constant (τ) for both the upstroke and downstroke of the phasic contraction were measured
as shown in fig. 2.3.
Periodic EFS at 32 Hz
throughout experiment
Reperfusion 60 min Tyrode’s
solution
Intervention 60 – 120 min
Modified Tyrode’s solution
= force/frequency estimation
Equilibration 60 min Tyrode’s
solution

74
Figure 2.3 - Method of measuring time-constant for phasic contractions
x = maximum height of response (mm), τcontraction = time constant of upstroke (s), τrelaxation = time constant of downstroke (s).
EFS relaxation experiments
All experiments commenced with 60 min. of periodic EFS to allow the muscle strip to equilibrate.
EFS was then stopped and a stable baseline measurement confirmed for 5 min. Phasic
relaxations were elicited by periodic exposure of pre-contracted muscle strips to electrical field
stimulation. Strips were pre-contracted by exposure to 15 µM phenylephrine (PE) in Tyrode’s
solution for 15 min. to elicit a tonic contracture. This concentration was chosen as being 10 times
the EC50 for phenylephrine in this preparation, ascertained experimentally by another investigator
in our laboratory (unpublished work). 15 min. PE allowed the preparation to reach a stable
plateau contracture. 15 µM PE was chosen as the proposed experiments involved ischaemic
interventions that may be detrimental to the force of contraction generated in response to PE in a
time-dependent manner. A single concentration (15 µM PE) was chosen to measure the effect of
these interventions rather than a dose response curve due to the time involved in conducting the
latter. It was postulated that the effect of ischaemia may differ at the start of recording the
response to a cumulative dose of PE compared to the end. As relaxatory responses were also
τcontraction
τrelaxation
x-x.e-1
x-x.e-1
x
1 mN
5 s

75
being examined a maximal contracture was generated in order to minimise experimental error
when measuring responses (10 times EC50) rather than EC50 or EC80. Once this contracture had
reached a plateau, a force frequency relationship was determined by using stimulation
frequencies from 4 to 24 Hz incrementally. The phenylephrine was then washed out with normal
Tyrode’s solution (figure 2.4).
Figure 2.4 - Experimental protocol for EFS relaxation experiments
Regular washout of phenylephrine during control and intervention was used to prevent muscle
fatigue. After 15 min. of PE preparations had reached a plateau. Phasic relaxations were then
elicited with an EFS stimulation train of 4-24 Hz.
Recorded responses were measured using a 30 cm rule and converted to force per unit csa as
previously described. The following measurements were taken from baseline tension (Fig. 2.5):
o The maximum tension of each tonic contracture (PE peak).
o The plateau tension of each tonic contracture (PE plateau). In cases where magnitude of
the contracture was changing, this was taken as the contracture height above baseline
after 16 min of phenylephrine.
Reperfusion 60 min Tyrode’s
Solution
Intervention 60 – 120 min
Modified Tyrode’s Solution
= 15 µM phenylephrine
= force/frequency estimation
Equilibration 60 min Tyrode’s
Solution

76
o The tension remaining above baseline after each EFS relaxation.
Tension remaining after EFS was expressed as a % of preceding PE plateau in all experiments
and plotted using the Kaleidagraph™ program to obtain estimated minimum tension remaining
(Ymin) and the frequency of stimulation resulting in half maximal relaxation (f½).
In certain experiments, the time constants of the relaxation were measured. These experiments
also involved pre-contracting the tissue with 15 µM PE after a period equilibration in Tyrode’s
solution at 37 °C. Once the contracture had reached a plateau, a single pulse train of EFS at 16
Hz (EFS16Hz) was used to elicit a relaxation. A typical trace and the method of estimating the time-
constants of the response are shown in fig 2.6.
Figure 2.5 - Method for measuring tension remaining after EFS-mediated relaxation
x –tension remaining after EFS stimulation at 4 Hz
y – tension remaining after EFS stimulation at 24 Hz
y
x
baseline
EFS stimulation 4 – 24 Hz

77
Figure 2.6 - Method of measuring time-constant of EFS-mediated relaxation
x = maximum height of downstroke (mm), y = maximum height of upstroke (mm),
τrelaxation = time constant of downstroke (s), τcontraction = time constant of upstroke (s).
2.3.5 Agonist-induced contracture and relaxation experiments
All experiments commenced with 60 min. of periodic EFS to allow the muscle strip to equilibrate.
EFS was then stopped and a stable baseline measurement confirmed for 5 min. Tonic
contractures were elicited by periodic exposure of the muscle strips to 15 µM phenylephrine.
Once this contracture had reached a plateau, agonist-induced relaxation was induced by
additional exposure of 1 µM carbachol to the pre-contracted muscle strips. The phenylephrine
and carbachol was then washed out with unmodified Tyrode’s solution (Fig. 2.7).
Tyrodes 15 µM PE 16 Hz EFS
0.5 mN
5 min
τrelaxation
y-y.e-1
x-x.e-1 x
Typical tracing
Magnified tracing
τcontraction
y

78
Figure 2.7 - Experimental protocol for agonist-induced contractions and relaxations
Agonist-induced contractures reached a plateau with 15 min. of PE. Perfusing solutions were
changed to PE and carbachol to examine the effect of the agonist-induced relaxation. 5 min. of
carbachol was sufficient to elicit a plateau response.
Recorded responses were measured using a 30 cm rule and converted to force per unit csa as
previously described. The following measurements were taken from baseline tension (fig. 2.8):
o The maximum tension of each tonic contracture (PE peak).
o The plateau tension of each tonic contracture (PE plateau). In cases where magnitude of
the contracture was changing, this was taken as the contracture height above baseline
after 16 min of phenylephrine (fig. 2.8a).
o The minimum tension remaining above baseline after application of carbachol (C nadir)
o The plateau tension remaining after application of carbachol (C plateau). In cases where
magnitude of the remaining contracture was changing, this was taken as the remaining
contracture height above baseline after 1 min of carbachol (fig. 2.8b).
Equilibration 60 min Tyrode’s
Solution
Reperfusion 60 min Tyrode’s
Solution
Intervention 60 – 120 min
Modified Tyrode’s Solution
phenylephrine
carbachol

79
Fig. 2.8a - Method of measuring agonist-induced contractures
PE peak = maximum height above baseline (mm), PE plateau = height above baseline after 16
min (mm).
Fig. 2.8b - Method of measuring agonist-induced relaxations
C Nadir = minimum height above baseline after application of carbachol (mm), C plateau = height
above baseline after 5 min of carbachol (mm).
In certain experiments, the time constants of the agonist-induced contracture were measured. A
typical trace and the method of estimating the time-constants of the response are shown in figure
2.9.
Tyrode’s 15 µM PE 1 µM Carbachol
Tyrode’s 15 µM PE 1 µM Carbachol
PE plateau PE peak
C Nadir C plateau
0.5 mN
0.5 mN
300 s
300 s

80
Fig. 2.9 - Method of measuring time-constants for tonic contractures
x = Peak PE contracture (mm), y = plateau PE contracture (mm), τcontraction = time constant of
upstroke (s), τrelaxation = time constant of downstroke (s).
2.3.6 Reduced temperature interventions
The effect of reduced temperature on CSM function was examined in several experiments. The
experimental protocols were similar to those described for the ischaemic interventions. The
effects of Tyrode’s solution at room temperature (21±1 °C) as well as chilled Tyrode’s (10±3 °C)
were recorded on the various aspects of CSM function described in sections 2.3.4 and 2.3.5. A
tubing system without a warming jacket was used to supply superfusate to the muscle strips at a
similar rate as the 37 °C Tyrode’s solution (3ml.min-1). Solution temperature was monitored at
regular intervals throughout experiments at the superfusion chamber level using a digital
thermometer (model 915-1, Testo, UK). Superfusate pH was monitored with a pH electrode (BDH
Ltd, UK) and pH meter (SE-500, Solex, Taiwan). Chilled solutions were maintained in a
polystyrene insulated water bath containing ice.
x
τrelaxation (s) τcontraction (s)
x-x.e-1 y-y.e-1
y
300 s
0.5 mN

81
2.4 Estimation of stress/relaxation characteristics
Changes seen in the contractile and relaxatory responses at reduced temperature were
postulated as being secondary to alterations in tissue biomechanics. In order to evaluate this,
estimation of stress/relaxation characteristics were recorded at low temperature.
2.4.1 Equipment and set-up
A similar set up to that used for isometric tension measurement (section 2.3.1, figure 2.1) was
used with the following the differences.
A solenoid arm with a stainless steel hook was used rather than a fixed mounting point. This
solenoid arm was attached to a solenoid (model 6800HP, Cambridge Technology Inc, USA)
mounted on a micromanipulator (Prior instruments, UK). A variable voltage supply and gating
device (model TWG501, Feedback, UK) supplied current to this solenoid via a lever arm system
(model 308B, Cambridge Technology Inc, USA). A change of voltage resulted in rotation of the
solenoid and horizontal displacement of the hook (figure 2.10). Tension transducer output and
solenoid output were connected to an a-d convertor (10 Hz sampling rate, Digidata 1200
interface, Axon Instruments Inc, USA), attached to a personal computer. The Clampex™ program
(v8.0, Axon Instruments Inc, USA) was used to record data.

82
Fig 2.10 Stress relaxation experimental set up

83
A muscle strip was mounted between the force transducer and solenoid arm and the
micromanipulators adjusted such that the strip was immersed in flowing Tyrode’s solution.
Tension in the strip was adjusted using the micromanipulators until the strip was taut. The ramp
function of the variable voltage supply was used to ensure tension in the strip was within the
linear region of the stress/strain relationship. The square wave function was used to examine the
stress/relaxation relationship (figure 2.12).
At the end of each experiment the micromanipulator Vernier scales were used to measure the
length and a fine balance used to estimate the mass of the strip. Cross-sectional area of each
strip was calculated as previously described.
2.4.2 Experimental protocol
CSM strips were mounted as described in section 2.4.1. The strip was allowed to equilibrate in
flowing Tyrode’s solution at 37 °C for 15 min. (control conditions, figure 2.11). During this
equilibration period, voltage supply to the solenoid was 0 V. The ramp function of the voltage
supply was then selected and voltage increased to bring about linear movement of the solenoid
arm hook and a cyclical increase and return to resting length of the tissue strip (length of
complete cycle 100 s). Tension transducer output was observed to ensure strip length changes
were within the linear portion of the length/tension relationship (fig. 2.12). The square wave
function was then selected at the same voltage and three cycles of stress/relaxation were
recorded. This process was repeated for another voltage on the same CSM strip.
The CSM strip was then allowed to equilibrate with Tyrode’s at 13 °C for 15 min. (intervention, fig.
2.11). The above protocol was repeated and voltage supply/tension transducer output recorded.

84
A similar procedure was followed for examining the effect of return to 37 °C on stress/relaxation
characteristics (reperfusion, fig. 2.11).
Figure 2.11 – Experimental protocol for estimation of stress/strain characteristics of CSM
The ramp function was selected on the voltage supply and responses observed to ensure strip
length changes were within the linear (Hookean) portion of the length/tension relationship
2.4.3 Calibration of equipment
These experiments required the calibration of both the force transducer and the solenoid arm.
Calibration of the force transducer was identical to that in isometric force measurements (section
2.3.2). The change in signal magnitude with each mass was plotted as a function of force and the
calibration slope calculated as previously described.
Calibration of the solenoid was carried out as follows. A dissection microscope and graticule
(Nikon, Japan) were calibrated using a 30 cm rule with 1 mm gradations such that the number of
graticule divisions per mm was known. The voltage across the solenoid was adjusted in 1 V
increments. The resulting displacement of the solenoid hook was measured using the
Control 37 °C Tyrode’s
Solution
Reperfusion 37 °C Tyrode’s
Solution
Intervention 13 °C Tyrode’s
Solution
Ramp
Square wave

85
microscope/graticule assembly. Change in length was plotted against change in variable voltage
supply output on the Clampex program.
2.4.4 Data Analysis
The Clampfit™ (v8.0, Axon Instruments Inc, USA), Kaleidagraph™ (v3.5, Synergy Software,
USA) and Excel™ (Microsoft, USA) programs were used to analyse recorded data. Typical output
data are shown in figure 2.12. Data were recorded and converted to length (solenoid variable
voltage output) and tension (tension transducer output) measurements using the calibration data
(section 2.4.3). Tension was normalised to csa. The following data were calculated.
o The instantaneous maximum stress due to an increase in length (l). This comprised the
sum of steady-state (fig. 2.12, C) and viscous components (figures 2.12, A) and was
expressed in Pascals (Pa).
o The stiffness of the viscous component (calculated as instantaneous stress due to
viscous component A / change in length l) expressed in Pa/mm.
o The stiffness of the steady-state component (figures 2.12, C/l) expressed in Pa/mm.
o The stiffness of the viscous component expressed as a proportion of the instantaneous
maximum stiffness (A/A+C) expressed as a percentage.
o The time-constant of the relaxation of the viscous component (figures 2.12, A) expressed
in seconds (k).
o Young’s modulus (e) for the tissue, a constant obtained as the gradient of a straight line
plot of steady state stress (figures 2.12, C) against strain (calculated as change in length
l / resting length L) for each individual tissue strip. The straight line was fitted to the data
using the least squares method.

86
1
2
Variable voltage supply Ramp function output
Tension transducer
output
Variable voltage supply square wave function
output
Tension transducer output
Magnified tension transducer output
3
C
A
Figure 2.12 – Typical output from variable voltage supply and tension transducer during estimation of stress/strain characteristics 1 – Ramp function of voltage supply used to ensure strip tension within linear (‘Hookean’) region of stress/strain relationship. 2 – Square wave function of voltage supply used to examine the stress/relaxation characteristics of the tissue (tension transducer output magnified in 3). 3 – Data used to estimate viscous (A) and steady state (C) stress/relaxation characteristics.

87
2.5 Isolated cell experiments (I)
2.5.1 Principles of epifuorescence microscopy
Epifuorescence microscopy was used to measure [Ca2+]i. The technique utilises the ability of
certain compounds to emit light (fluoresce) in an ion concentration-dependent manner, in
response to excitation by light of higher frequency. The emitted light has less energy and is
therefore of a longer wavelength and different colour when compared to the excitation light. This
phenomenon permits the use of light filters to isolate the emitted light and allow measurement of
its intensity. The fluorescent indicators chosen for this purpose had two important attributes.
Firstly, each was taken up by the cell in a non-invasive manner and predominantly localised in the
cytosol. Secondly the fluorescence of each was quantitatively related to the concentration of the
ion in question.
Cells were passively loaded with the lipid soluble acetoxymethyl ester (AM) of the indicator
(sections 2.6.2 and 2.7.2). Once inside the cell, this ester would be hydrolysed to the active
anionic indicator. Several factors were taken into account when choosing the method of
fluorescence measurement.
i. Compartmentalisation
The indicator (both the cell permeable ester and the anionic form) may accumulate within
intracellular organelles where they would fluoresce independent of cytosolic ion concentration.

88
ii. Incomplete AM ester hydrolysis
There may be residual AM ester in the extracellular space contributing to the detected
fluorescence (should the AM ester be fluorescent as in the case of Fura-2 AM). In addition there
may be incompletely hydrolysed indicator within the cell which would be insensitive to changes in
ion concentration but would again contribute to the measured cell fluorescence.
iii. Leakage and photobleaching
Anionic indicators may be actively removed from the cell by organic ion transporters, increasing
the extracellular fluorescence. In addition, repeated fluorophore excitation and light emission is
not a process that can go on indefinitely. Eventually the fluorophore will degrade, a process
known as photobleaching.
iv. Signal buffering
Indicators bind the ion of interest. If the intracellular indicator concentration is too high, the ion of
interest will be buffered thus attenuating the magnitude and rate of change of the signal(189).
In order to compensate for some of the above factors (mainly iii), a ratiometric method of
measurement was chosen. The indicators chosen exhibit an excitation spectral shift upon binding
the ion of interest. By using a ratio of the fluorescence intensities at two different wavelengths,
variations in the fluorescence signal itself (for the reasons listed above) can be cancelled out. The
ratio of two fluorescence intensities with opposite ion-sensitive responses gives the largest range
of ratio signals for a given indicator improving recording efficiency. By using a ratiometric method,
factors such as leakage and photobleaching and variable cell thickness were compensated for.

89
Calibration of the system was achieved by experimentally deriving the dissociation constant (Kd).
This would allow a given fluorescence signal in the same experimental system to be converted to
an ion concentration.
2.5.2 Equipment and set-up
i. Cell suspension chamber and microscope
Isolated cells were placed in a Perspex cell bath mounted on a microscope stage such that fine
manipulation of the chamber with respect to the objective lens could be achieved with adjustment
of the stage controls. The base of the cell bath was made of a borosilicate microscope cover slip
(thickness type 1, VWR, USA). The chamber was supplied with superfusing solution via 1mm
tubing from four glass chambers placed 50 cm above the microscope. The cell bath, tubing and
glass chambers were all water-jacketed and maintained at 37±0.5 °C using a water bath (model
M3, Lauda, Germany). Three-way taps and a gate clamp controlled and maintained superfusate
flow at 2ml.min-1 to the bath. The cell bath was drained by suction using a peristaltic pump
(Watson Marlow, UK) allowing a constant fluid level to be maintained. The cell bath was
illuminated from above via a removable red light filter (λ > 580 nm) and observed using an
inverted stage light microscope (Diaphot-TMD, Nikon Corporation, Japan). The apparatus was
mounted on a nitrogen pressurised air table (model MICRO-g, Technical Manufacturing Corp,
USA) and surrounded by a Faraday cage covered in a light-proof material (figure 2.13).
Experiments were conducted in a darkened room.

90
ii. Light source, transmission and collection
A 75 W xenon short-arc bulb (XBO, Osram Ltd, Germany) with an independent high voltage
power supply (Cairn research Ltd, UK) provided high-intensity broad-bandwidth light which was
filtered, prior to transmission via a quartz fibre-optic cable. Filtration was achieved in two stages;
polarisation with a static collimating filter followed by a motorised rotating wheel containing slots
for up to eight radially placed filters of fixed wavelengths (Cairn Research Ltd). Magnetic and
optical sensors within the filter housing enabled the central spectrophotometer unit (Cairn
Research Ltd) to control the speed at which this filter wheel span (32 Hz) and synchronised this
with the light detection mechanism.
Several mirrors, both plane and dichroic, were used to reflect the various light sources. The first
dichroic mirror reflected the filtered illuminating light up through the microscope objective (x40
quartz objective, numerical aperture 1.3, oil lens, Nikon, Japan) to the microscope stage and cell
bath where it was focussed on the cell in question. Emitted light passed back through this
objective lens to pass straight through the first dichroic down to the plane microscope mirror. This
reflected the emitted light to the collection system.
The microscope light source was positioned above the stage and filtered using a λ > 580 nm red
light filter. This light, used to position the cell, passed straight through the first dichroic mirror and
was reflected by the microscope mirror to the collection system. This light source was
extinguished during data acquisition.
The first stage of the collection system comprised a diaphragm which could be adjusted to reduce
the field size and therefore reduce background emission. A second dichroic mirror acted as a

91
beam splitter. Higher wavelengths passed through this dichroic to a digital camera (Jai-PULNiX,
USA) connected to a monitor (model 5512, Sanyo, USA). This image was used to observe the
cell and adjust the diaphragm. Lower wavelengths were reflected up to a photomultiplier tube
(PMT, Cairn Research Ltd) for signal detection.
iii. Signal detection and recording
The PMT provided a current output which was a function of the light intensity entering it. Adjusting
the voltage across the PMT enabled optimisation of the output with respect to the signal/noise
ratio. In all recordings, two filters of differing wavelengths were placed in the motorised wheel. A
high frequency internal clock within the spectrophotometer enabled rotation of each filter on the
wheel to be synchronised with one of two sample-and-hold amplifiers. As emitted light from
excitation at each filter frequency reached the PMT, the voltage output was integrated for the
duration of the filter sweep, and the peak amplitude sampled. An analogue division circuit within
the spectrophotometer enabled the signal from each amplifier to be converted to a signal ratio.
This ratio signal along with the two individual sample-and-hold amplifier signals were recorded on
a pen recorder (Gould TA 240S, UK) and a personal computer as well as displayed on a digital
oscilloscope (Gould DSO 420, UK).

92
Fig 2.13 Isolated cell set up

93
2.5.3 Cavernosal cell isolation
Cavernosal tissue was dissected as described in section 2.2. An enzyme solution (Sigma, UK
except collagenase Worthington, UK - table 2.2) was made up in the laboratory and aliquots
stored at -20 °C for subsequent use. 0.7 ml of the thawed enzyme solution was added to 0.7 ml
Ca-free HEPES buffered Tyrode’s solution in a 2 ml eppendorf tube. 8-10 pieces of cavernosal
tissue (1 mm3) were placed in the enzyme mixture and stored for 12-15 hours at 4 °C. Tissue
was then finely chopped with dissection scissors and the mixture transferred to a 7 ml screw top
Perspex container along with a 5mm magnetic stirrer bar. This was placed in a 250 ml beaker
containing water at 37.5 ± 0.5 °C on a stirrer for 6 min. Water temperature was monitored using a
digital thermometer (model 915-1, Testo, UK). The resulting cell suspension was stored at 4 °C
for subsequent use. All instruments and magnetic stirrers were soaked in a disinfecting solution
(Haztab, Guest Medical, UK) and then washed in RO water prior to use.
Table 2.2 - Constituents of enzyme mixture added to HEPES buffered Ca-free Tyrode’s solution
Compound Concentration (mg/ml) Source
Collagenase type I (256 units/mg) 20 Worthington, UK
Hyaluronidase type I-S 0.5
Hyaluronidase type III 0.5
Antitrypsin type II-S 0.9
Bovine albumin 5.0
Sigma, UK

94
2.6 Isolated cell experiments (II)
2.6.1 Measurement of [Ca2+]i by epiflourescence microscopy
The fluorescent indicator Fura-2 (Calbiochem-Novabiochem Corp, USA) was used as an index of
[Ca2+]i. Fura-2 has a Kd value that is close to typical basal Ca2+ levels in mammalian cells (~100
nM), and has a high selectivity for Ca2+ binding relative to Mg2+. The fluorescence excitation
spectrum of Fura-2 demonstrates an isoflourescence wavelength of 360 nm (fig. 2.14). As [Ca2+]i
increases, the spectrum shifts to the left resulting in:
i) The emission intensity at 340 nm excitation increasing and
ii) The emission intensity at 380 nm excitation decreasing.
Figure 2.14 - The fluorescence intensity spectra of Fura-2 detected at 510 nm at different [Ca2+]
(modified from Invitrogen Molecular Probes handbook).
Therefore, in these experiments 340 nm and 380 nm filters were placed in the filter wheel in the
UV light path. The emission spectrum of fura-2 is maximal above 510 nm; hence emitted light
was collected above this wavelength (fig 2.15). To achieve this, dichroic mirror 1 was a 410 nm
mirror (allowing light > 410 nm to pass through) and dichroic mirror 2 was a 510 nm mirror to
Image removed

95
reflect fluorescent light to the PMT tube (fig 2.13). The ratio of the 340/380nm emission was used
as an index of [Ca2+]i.
Figure 2.15 - The fluorescence emission spectra of Fura-2 at different [Ca2+] at 340 nm excitation
(modified from Invitrogen Molecular Probes handbook)
2.6.2 Intracellular loading of Fura-2
The acetoxymethylester of Fura-2 (Fura-2 AM, Calbiochem-Novabiochem Corp, USA) was
dissolved in DMSO to a concentration of 1 mM in the laboratory and stored at -20 °C. The lipid-
soluble AM ester is able to passively diffuse across the cell membrane and once inside the cell, is
cleaved by intracellular esterases to yield the charged cell-impermeant fluorescent Ca2+ indicator
(figure 2.16).
Image removed

96
Figure 2.16 - The process of fura-2 AM hydrolysis liberating the Ca2+ sensitive fluorophore
(Invitrogen Molecular Probes handbook)
Cells were loaded at room temperature by adding 5 µl of Fura-2 AM stock solution to 1 ml of cell
suspension resulting in an indicator concentration of 5 µM. Cells were stored at 4 °C for 30 min
to facilitate intracellular indicator loading.
2.6.3 Experimental procedure
The experimental rig was primed with oxygenated Tyrode’s solution and the cell bath was
washed with RO water and dried. Using a flamed-glass Pasteur pipette, two drops of loaded cell
suspension were placed in the cell bath. The preparation was left for 30 min to allow cell
adhesion to the base of the cell bath. The preparation was then superfused with Tyrode’s solution
Image removed

97
at a rate of 2 ml.min-1. Many cells were washed away at this point but due to the high yield (~ 100
cells per high power field) from the isolation method described, enough cells remained for
experimentation. Suitable cells were recognised as being spindle shaped with homogeneous
cytoplasm and a smooth cell membrane. Additionally the presence of a ‘halo’ around the cell
membrane under phase contrast illumination was seen as a favourable indicator of cell viability.
Once a suitable cell was identified, it was brought into focus and the stage adjusted to bring the
cell into the centre of the field. The microscope red light filter was then slotted in place and the
light collection diaphragm adjusted, guided by the monitor image, to optimise light collection from
the cell. The microscope cage was then blacked out and the room lights turned off.
The light source was switched on to allow the appropriate excitation wavelengths to be reflected
to the stage. The PMT voltage was adjusted to ensure full scale deflection of the 380 nm signal
on the oscilloscope screen. Recording of the individual and ratio signals on both the computer
and pen recorder were commenced. Once a stable signal was confirmed, background
fluorescence was recorded by moving the cell out of position using the stage controls for 10 s
without adjusting the size of the light collection diaphragm. The cell was then moved back into
position and the experimental interventions commenced. At the conclusion of the planned
interventions, background fluorescence was again recorded in a similar manner as previously
described (figure 2.17a, 2.17b and 2.18).

98
Figure 2.17a – Diagram of emission signals showing rationale behind accounting for background
emission.
A – Background emission included in emission signal, B – background emission removed from
recorded signal therefore isolating emitted light form the cell alone
Figure 2.17b – Typical emission signals showing changes recorded during cell stimulation
A good signal to noise ratio was a requirement for using a particular cell for experimentation.
Additonal signs used in selecting cells included spindle-like shape, homogenous loading of
FURA-2 and a ‘halo’ on phase microscopy.
PMT off
Background only in
diaphragm C
Cell in
diaphragm D
PMT on
380 nm excitation
signal
340 nm excitation
signal
B A
PMT
OFF PMT ON
340 nm excitation signal
380 nm excitation signal
Ratio
signal
A B

99
Figure 2.18 – Experimental protocol for isolated cell intervention
Reperfusion 20 min Tyrode’s
Solution
Intervention 20 min
Modified Tyrode’s Solution
↑ = 3 µM phenylephrine ↑ = 120 mM KCl
Equilibration 20 min Tyrode’s
Solution

100
2.6.4 Calibration of the Fura-2 signal
The ratio of Fura-2 fluorescence at two different excitation wavelengths was used as an index of
the [Ca2+]i. The purpose of calibration was to determine the fluorescence signals and ratio at
known concentrations of Ca2+ in the absence of cells. This in vitro calibration was performed in
conditions mimicking the intracellular environment (high [K+]) using ethylene glycol tetra-acetic
acid (EGTA) as a Ca2+ buffer to ensure [Ca2+] was within the physiological range (table 2.3).
Table 2.3 - Constituents of FURA-2 signal calibration solution
The purity of EGTA was 94% determined from previous experiments making the actual
concentration of EGTA 4.7 mM(204).
Aliquots of 1 M CaCl2 solution were added to this solution at 37 °C (table 2.4). Each solution was
titrated with KOH to a pH of 7.1 using a pH meter (BDH, UK). A 2M KOH stock solution was
made from solid KOH. This compound is supplied as solid pellets of ~85% purity. This was taken
into account when calculating the weight of compound to be dissolved in RO water. The [Ca2+]
was calculated using the following equation:
pCa = pKCa + log ([EGTA] / [Ca EGTA])
Compound Concentration (mM)
KCl 120
HEPES 20
NaCl 10
MgCl2 1.0
EGTA 5.0 (actual 4.7)

101
o pCa was the negative logarithm of [Ca2+]
o The pKCa of the apparent EGTA dissociation constant (KCa) was taken as 6.64(188).
o [EGTA] was the concentration of added EGTA.
o [Ca EGTA] was taken as the concentration of added CaCl2 when < 4.0 mM.
o The first solution had 0 mM added CaCl2 and was used to calculate Rmin.
o The last solution had 6 mM added CaCl2 to yield a solution with a [Ca2+]free > 1 mM. This
was used to calculate Rmax.
Table 2.4 - Concentration of free Ca2+ in calibrating solutions
[Ca EGTA]
(mM)
[EGTA]
(mM)
pCa [Ca2+]free
(nM)
0 0
0.5 4.2 7.56 27.3
1.0 3.7 7.21 61.9
2.0 2.7 6.77 169.7
2.5 2.2 6.58 260.3
3.0 1.7 6.39 404.3
4.0 0.7 5.88 1309.1
6.0 >1000
The dissociation constant of Fura-2 for Ca2+ in the system (Kd) was derived from the following
equation(205):
Kd = [Ca2+]free (Rmax-R) / β(R-Rmin)
o Kd is the dissociation constant of Fura-2 in the system.
o R is the ratio signal at a given [Ca2+]free.

102
o Rmin is the ratio signal at 0 mM [Ca2+]free.
o Rmax is the ratio signal at saturating [Ca2+]free, in practice a [Ca2+]free > 1 mM.
o β is the emission signal ratio due to excitation at 380 nm of saturating Ca2+ to 0 mM Ca2+
(F380max / F380min)
This equation was rearranged to yield a linear relationship for the estimation of Kd:
log β[(R-Rmin)/(Rmax-R)] = -pCa + pKd
log β[(R-Rmin)/(Rmax-R)] was plotted against –pCa and pKd estimated as the pCa at which the
log β[(R-Rmin)/(Rmax-R)] = 0 (figure 2.19).
-1.5
-1
-0.5
0
0.5
1
1.5
-8 -7.5 -7 -6.5 -6 -5.5
log ββββ*([R-Rmin]/[Rmax-R])
pCa
log Kd
x-intercept
Figure 2.19 – Sample Fura-2 calibration plot
The log [Ca2+]free at the x-intercept corresponds to the log Kd for Fura-2. Ischaemic interventions,
in particular alterations in pH, affect the dissociation constant (Kd) for Fura-2. Data are therefore
presented as ratio signals rather than [Ca2+]i for accuracy(206).

103
2.7 Statistical analysis
i) Data are expressed as the mean ± standard deviation of the data set. Several
interventions caused tension generated to drop to 0 mN.mm-2. These values are
included in the data sets presented.
ii) Data sets are the result of n experiments using tissue from N animals.
iii) The computer program Kaleidagraph™ (v3.5, Synergy Software, USA) was used to
parameterise straight lines and curves to fit experimental data using the least
squares analysis method.
iv) Straight lines were fitted using the equation:
y=mx + c
o m is the gradient of the straight line.
o c is the point at which the line intercepts the y axis.
v) Curves were fitted using the equation:
(ymax.xa)/(xa + (khalf)a)
o ymax is the maximum of the curve.
o a is the power of the curve.
o khalf is the value on the x axis corresponding to half ymax.
vi) For the purposes of statistical comparison between data sets, khalf values are
presented as log10 khalf (pkhalf) as previous studies on lower urinary tract smooth
muscle have shown this to be the normally distributed data set(188).
vii) Where parametric data were being analysed, statistical differences were tested using
Student’s t-tests. When data sets were compared to a single value (for example
100%), Mann-Whitney U tests were used to analyse variation. The null hypothesis
was rejected when p<0.05.

104
3.1 Results I – Basic tissue parameters
3.1.1 Isometric contractions elicited by electrical field stimulation (EFS)
3.1.1.1 EFS-mediated contraction with time
Isometric nerve-mediated contractions elicited by EFS (range 8-60 Hz) were recorded and
measured as described in section 2.3.4. Preparations were equilibrated in Tyrode’s solution for
60 min. at 37 °C. At the end of this period, the mean nerve-mediated tension at 32 Hz (EFS32Hz)
was 0.56±0.37 mN.mm-2 (N=4, n=6) and was 66±7% of the estimated maximal tension (Tmax)
from the force-frequency curves. The mean half-maximal frequency (f½) under these control
conditions was 22.2±3.7 Hz.
The maximum duration of proposed experiments was 240 min. including the equilibration period.
Preparations were periodically stimulated at 32 Hz and the force-frequency relationship measured
at set intervals during superfusion with Tyrode’s solution (NT) to ascertain the stability of the
preparation for the duration of the proposed experiments.
The force-frequency relationship as well as the mean EFS32Hz remained stable throughout the
240 min. of experimentation (figure 3.1). The large standard deviations reflect the variability in
tension generated between muscle strips. However within each preparation tension was stable
throughout the experimental period as shown by the Tmax and f½ values (table 3.1).

105
8 16 24 32 40 60 8 16 24 32 40 60 8 16 24 32 40 60 EFS (Hz)
60 min. 90 min. 120 min.
8 16 24 32 40 60 8 16 24 32 40 60 EFS (Hz)
180 min. 240 min.
Fig. 3.1 – Typical experimental tracing showing periodic force/frequency relationship over time in
Tyrode’s solution. EFS-mediated contractile responses were stable over the proposed time
course of experiemts (240 min.)
Table 3.1 – Stability of contractile (EFS) responses in Tyrode’s solution
NT = Normal Tyrode’s solution
N=4, n=6 60 min NT 90 min NT 120 min NT 180 min NT 240 min NT
EFS32Hz (mN.mm-2) 0.56±0.37 0.60±0.42 0.63±0.47 0.66±0.52 0.65±0.50
EFS32Hz as % control - 104±8 105±14 109±17 109±15
EFS32Hz as % of Tmax
(%)
66±7 63±7 66±3 69±4 68±5
f½ (Hz) 22.2±3.7 24.1±4.0 21.7±1.3 19.8±2.3 20.2±2.5
2 min.
1 mN
• • • • • • • • • • • • • • • • • •
• • • • • • • • • • • •

106
3.1.1.2 Effect of tetradotoxin on EFS-mediated contraction
To record the proportion of EFS-mediated contraction in the preparation that occurred via
embedded motor nerves, the effect of the neurotoxin tetrodotoxin (TTX 1 µM) was examined.
More than 95% of the phasic contraction in response to EFS (range 8-60 Hz) was reversibly
abolished in the presence of TTX (figure 3.2).
0.0
0.20
0.40
0.60
0 10 20 30 40 50 60 70
Tension (mN.mm-2
)
Frequency (Hz)
Figure 3.2 – Effect of 1 µM TTX on EFS-mediated contraction in CSM (N=8, n=12)
– control, – 1 µM TTX, – post-control, error bars show standard deviation of the mean
* significant reduction compared to control (p<0.05).
1 µM TTX abolished EFS-mediated responses indicating that phasic contractions in response to
electrical stimulation as described were mediated via intrinsic motor nerves.
3.1.1.3 Effect of stimulation voltage on EFS-mediated contraction
* * * * * *

107
To ascertain the proportion of embedded motor-nerve fibres stimulated with EFS, the effect of
increasing stimulation voltage was examined on the preparation (table 3.2 and fig 3.3).
Table 3.2 - Effect of stimulation voltage on EFS-mediated contractions
* p<0.05 compared to 50 V
There was no significant increase in force of contraction above 50 V throughout the range of
stimulation frequencies (8-60 Hz). In addition there was no difference in the f½ at the different
stimulation voltages. Subsequent EFS experiments were therefore carried out at 50 V.
N=4, n=7 40 V 50 V 60 V 70 V 80 V
EFS24Hz (mN.mm-2) 0.23±0.13* 0.27±0.13 0.33±0.16 0.32±0.20 0.39±0.26
EFS24Hz as % of EFS24Hz
at 50 V
82±11* - 124±22 118±31 151±68
f½ (Hz) 20.0±13.7 25.2±13.3 19.6±6.5 22.8±6.8 24.0±7.6
0
0.2
0.4
0.6
40 50 60 70 80
Tension (mN.mm-2
)
Voltage (V)
Fig. 3.3 – Recruitment curve showing tension in response to EFS24 Hz at varying stimulation
voltages * p<0.05 vs. 50 V
Findings were consistent throughout the frequency range (8-60 Hz). This indicates maximal
nerve-recruitment at 50 V and above.
*

108
3.1.2 Isometric contractures elicited by phenylephrine (PE)
3.1.2.1 PE-induced contractures with time
Isometric agonist-induced contractures were recorded and measured as described in section
2.3.5. Preparations were equilibrated in Tyrode’s solution for 60 min. at 37 °C. At the end of this
period, 15 µM PE was introduced and a contracture recorded. The mean peak tension in
response to PE was 0.50±0.35 mN.mm-2 and mean plateau tension was 0.42±0.29 mN.mm-2
(N=11, n=14). The maximum duration of experiments measuring PE-induced contractures was
240 min. To ascertain the stability of the preparation, separate contractures were elicited in
response to 15 µM PE for a similar time period (table 3.3).
Table 3.3 - Stability of phenylephrine-induced contractile responses in Tyrode’s solution
Peak and plateau PE responses remained stable throughout the experimental period. Plateau
responses were on average 86% of the peak PE response (range 70-100%).
Intervention Peak tension
(mN.mm-2)
Plateau tension
(mN.mm-2)
Plateau tension
as % of peak
tension
60 min Tyrode’s 0.50±0.35 0.42±0.29 83±8
90 min Tyrode’s 0.51±0.36 0.44±0.31 87±7
120 min Tyrode’s 0.49±0.36 0.43±0.31 91±7
180 min Tyrode’s 0.50±0.34 0.43±0.30 85±9
240 min Tyrode’s 0.52±0.37 0.44±0.33 85±9

109
3.1.2.2 Effect of nifedipine on phenylephrine-induced contractures
In order to examine the proportion of the phenylephrine-induced contracture which was due to
Ca2+ influx into the cells, the effect of the L-type calcium channel blocker nifedipine was
examined. Muscle strips were maximally contracted with 15 µM phenylephrine and the
contracture recorded as previously described. 100 µM nifedipine was then introduced into the
superfusate and a similar PE-induced contracture recorded. This dose of nifedipine was chosen
as it completely abolished the contracture seen in response to high KCl (100 mM).
The mean peak tension in response to PE was 1.60±0.90 mN.mm-2 and mean plateau tension
was 1.48±0.85 mN.mm-2 (N=6, n=7, fig. 3.4). Peak and plateau contractile responses to 15 µM
phenylephrine were significantly reduced in the presence of 100 µM nifedipine to 1.27±0.70
mN.mm-2 and 1.15±0.67 mN.mm-2 respectively (79±7% and 77±7% of control respectively).
0
20
40
60
80
100
PE PE + N PE PE + N
% of control PE contracture
Peak response Plateau response
Figure 3.4 – The effect of 100 µM nifedipine on PE-induced contractures.
PE – phenylephrine, N – nifedipine
* significant reduction compared to control PE contracture (p<0.05)
* *

110
These findings indicate that the majority of the agonist-induced contracture was independent of
calcium influx via the L-type calcium channel.
3.1.3 Isometric relaxations elicited by electrical field stimulation (EFS)
3.1.3.1 EFS-mediated relaxation with time
Isometric relaxations elicited by EFS (range 4-24 Hz) in CSM strips pre-contracted with 15 µM
PE were recorded and measured as described in section 2.3.4. Preparations were equilibrated in
Tyrode’s solution for 60 min. at 37 °C. At the end of this period, the mean tension remaining after
nerve-mediated relaxation at 24 Hz (EFS24Hz) was 0.37±0.15 mN.mm-2 (N=4, n=7) and was
57±16% of the preceding plateau PE contracture. The mean half-maximal frequency (f½) under
these control conditions was 5.9±2.1 Hz.
The maximum duration of proposed experiments was 240 min. including the equilibration period.
Preparations were periodically pre-contracted and a force-frequency relationship recorded (EFS
range 4-24) at set intervals during superfusion with Tyrode’s solution (NT) to ascertain the
stability of the preparation for the duration of the proposed experiments (figure 3.5). Increasing
frequency of stimulation elicited progressively larger relaxatory responses in the pre-contracted
strips.
However, in contrast to the EFS-mediated contractions (section 3.1.1), the EFS-relaxation force-
frequency relationship was not stable throughout the proposed experimental period. This is
shown by the left-shift of the force-frequency relationship with time (figure 3.6 and table 3.4). The
EFS24Hz was the most stable parameter and is therefore used as the variable in subsequent
experiments.

111
EFS (Hz) 4 8 16 24 4 8 16 24 4 8 16 24
60 min. 90 min. 120 min.
EFS (Hz) 4 8 16 24 4 8 16 24
180 min. 240 min.
Figure 3.5 – Typical experimental tracing showing EFS-mediated relaxatory responses over time
Consecutive contractures over 240 min. showing stability of 15 µM PE contracture with time.
Each stimulation train (EFS 4-24 Hz) elicited a progressively greater relaxatory response.
Tension remaining after the final 24 Hz stimulation was the most stable parameter.
Table 3.4 - Effect of Tyrode’s solution on EFS relaxation NT = Unmodified Tyrode’s solution
N=4, n=7 60 min NT 90 min NT 120 min NT 180 min NT 240 min NT
PE plateau
(mN.mm-2)
0.65±0.19 0.67±0.21 0.67±0.22 0.66±0.22 0.74±0.19
EFS24Hz (mN.mm-2) 0.37±0.15 0.34±0.12 0.33±0.14 0.30±0.12 0.32±0.15
EFS24Hz as %
preceding PE plateau
contracture
57±16 52±18 51±19 48±20 45±20
f½ (Hz) 5.9±2.1 4.2±3.0* 3.6±2.0* 2.5±2.2* 2.4±2.3*
5 min.
0.5 mN
• • • •
• • • •
• • • •
• • • •
• • • •
15 µM PE
15 µM PE

112
0
20
40
60
80
100
0 5 10 15 20 25
Tensionremaining (%)
Frequency (Hz)
Fig. 3.6 – Variation of EFS-mediated relaxation in CSM with time
– control, – 60 min NT, ◊ – 120 min NT, ∆ – 180 min NT, + - 240 min NT
Stimulation trains during each consecutive contracture elicited larger relaxatory responses.
3.1.3.2 EFS-mediated relaxation at differing levels of pre-contraction
Differing doses of PE were used to examine whether EFS-mediated relaxations were dependent
upon the level of pre-contraction. Isometric relaxations elicited by EFS (range 4-24 Hz) in CSM
strips pre-contracted with 15 µM PE or 1.5 µM PE were recorded and measured as described in
section 2.3.4. Preparations were equilibrated in Tyrode’s solution for 60 min. at 37 °C. At the end
of this period, the mean plateau tension after pre-contraction with 15 µM PE was 1.03±0.56
mN.mm-2 (N=3, n=6). A force-frequency relationship was subsequently recorded (EFS range 4-
24). Tension remaining after nerve-mediated relaxation at 24 Hz (EFS24Hz) was 0.68±0.47
mN.mm-2 and was 62±12% of the preceding plateau PE contracture. Experiments were repeated
using the same preparation pre-contracted with 1.5 µM PE. The mean plateau tension was

113
0.50±0.34 mN.mm-2 (N=2, n=6) which was 46±9% of the plateau 15 µM PE contracture. Tension
remaining after nerve-mediated relaxation at 24 Hz (EFS24Hz) was 0.18±0.18 mN.mm-2 and was
33±19% of the preceding plateau PE contracture (figure 3.7).
0
20
40
60
80
100
0 5 10 15 20 25
Tension remaining(% preceding PE contracture)
Frequency (Hz)
Figure 3.7 – Effect of differing levels of pre-contraction on tension remaining after EFS relaxation
– pre-contraction with 15 µM PE, – pre-contraction with 1.5 µM PE
* significant reduction compared to 15 µM PE (p<0.05)
Relaxation was proportionally greater with smaller PE pre-contraction.
* * * *

114
3.1.3.3 TTX on EFS-mediated relaxation
To record the proportion of EFS-mediated relaxation in the preparation that occurred via
embedded motor nerves, the effect of the neurotoxin tetrodotoxin (TTX 1 µM) was examined. On
average 88% (range 68-100%, N=4, n=7) of the phasic relaxation in response to EFS (range 4-24
Hz) was reversibly abolished in the presence of TTX (fig. 3.8).
0
20
40
60
80
100
0 5 10 15 20 25
Tension remaining(% preceding PE contracture)
Frequency (Hz)
Fig. 3.8 – Effect of 1 µM TTX on EFS mediated relaxation
– pre-control, – 1 µM TTX, ◊ – post-control
* significant reduction compared to control and compared to preceding plateau PE
contracture(p<0.05).
This TTX-resistant relaxation shows that there is an element of EFS-mediated relaxation which is
not mediated via embedded relaxatory nerves. This may be as a result of direct stimulation of the
endothelium or the muscle itself.
* * * *

115
3.1.3.4 ODQ on EFS-mediated relaxation
To record the proportion of EFS-mediated relaxation in the preparation that was secondary to
nitric oxide release, the effect of the highly selective inhibitor of soluble guanyl cyclase ODQ was
examined. On average 90% (range 72-100%, N=4, n=6) of the phasic relaxation in response to
EFS (range 4-24 Hz) was abolished in the presence of ODQ (figure 3.9).
0
20
40
60
80
100
0 5 10 15 20 25
Tension remaining(% preceding PE contracture)
Frequency (Hz)
Fig. 3.9 – Effect of ODQ on EFS mediated relaxation
– pre-control, – 10 µM ODQ, ◊ – post-control
* significant reduction compared to control and to the 100% PE contracture(p<0.05)
This shows that the majority of relaxation in response to EFS is mediated via a cGMP specific
pathway such as via nitric oxide production. Responses did not return to control values during the
time course of reperfusion in these experiments. In a similar manner to the TTX responses, a
proportion of relaxation persisted in the presence of ODQ and was significantly different from the
preceding PE contracture. This ODQ-resistant relaxation shows that there is an element of EFS-
mediated relaxation which is not mediated via a cGMP specific pathway.
* * * *

116
3.1.4 Isometric relaxations elicited by carbachol
3.1.4.1 Carbachol-induced relaxation with time
Isometric agonist-induced relaxations were recorded as described in section 2.3.5. Preparations
were equilibrated in Tyrode’s solution for 60 min. at 37 °C. At the end of this period, 15 µM
phenylephrine (PE) was introduced and a contracture recorded. Once this contracture had
reached a plateau, 1 µM carbachol was used to induce a relaxatory response in the pre-
contracted muscle strip. The mean nadir tension remaining after application of carbachol was
0.11±0.09 mN.mm-2 (N=7, n=7) and mean plateau tension remaining was 0.11±0.09 mN.mm-2
(figure 3.10 and table 3.5).
Table 3.5 - Stability of carbachol-induced relaxatory responses in Tyrode’s solution
NT = unmodified Tyrode’s solution, PE = phenylephrine
These responses were not significantly different from each other. Nadir and peak values were not
significantly different throughout the experimental period
Intervention Nadir tension
remaining
(mN.mm-2)
Nadir tension as
% preceding PE
contracture (%)
Plateau tension
remaining
(mN.mm-2)
Plateau as %
preceding PE
contracture (%)
60 min NT 0.11±0.09 61±17 0.11±0.09 63±14
90 min NT 0.11±0.12 55±21 0.12±0.12 57±19
120 min NT 0.10±0.11 50±22 0.11±0.12 54±21
180 min NT 0.09±0.10 40±25 0.09±0.10 44±23
240 min NT 0.08±0.10 41±24 0.10±0.10 49±23

117
60 min. 90 min.
120 min. 180 min.
240 min.
Fig. 3.10 – Typical experimental tracing showing stability of phenylephrine induced contractures
and carbachol-induced relaxations over time
3.1.4.2 Carbachol-induced relaxation at differing levels of pre-contraction
Different doses of PE were used to examine whether carbachol-induced relaxations were
dependent upon the level of pre-contraction. Relaxations elicited by 1 µM carbachol in CSM
strips pre-contracted with 15 µM PE or 1.5 µM PE were recorded and measured as described in
section 2.3.5. Preparations were equilibrated in Tyrode’s solution for 60 min. at 37 °C. At the end
of this period, the mean plateau tension after pre-contraction with 15 µM PE was 0.96±0.51
mN.mm-2 (N=3, n=6). The mean nadir tension remaining after application of carbachol was
0.67±0.42 mN.mm-2 and was 67±8% of the preceding plateau PE contracture. Mean plateau
5 min.
1 mN
15 µM PE
1 µM C
15 µM PE
1 µM C
15 µM PE
1 µM C

118
tension remaining after application of carbachol was 0.72±0.45 mN.mm-2 and was 72±9% of the
preceding plateau PE contracture.
The mean plateau tension after pre-contraction with 1.5 µM PE was 0.46±0.27 mN.mm-2 (N=3,
n=6) and was 46±9% of that generated after 15 µM PE. The mean nadir tension remaining after
application of carbachol was 0.24±0.24 mN.mm-2 and was 46±25% of the preceding plateau PE
contracture. Mean plateau tension remaining after application of carbachol was 0.28±0.26
mN.mm-2 and was 54±22% of the preceding plateau PE contracture (fig. 3.11).
0
20
40
60
80
100
C Nadir C Plateau
Tension remaining(% preceding PE plateau)
Fig. 3.11 – Effect of differing levels of pre-contraction on carbachol-induced relaxation
– 15 µM PE, – 1.5 µM PE
* significant reduction compared to responses with 15 µM PE pre-contraction (p<0.05)
In a similar manner to EFS relaxation, 1.5 µM carbachol elicited a proportionally larger relaxatory
response with a smaller PE pre-contracture.
* *

119
3.1.5 Effect of repeated applications of PE on calcium transients is isolated CSM cells
CSM cell isolation was performed on fresh tissue as outlined in sections 2.6.2 and 2.6.3. In
general, experimental protocols were as outlined in fig. 2.18. Cells were equilibrated in Tyrode’s
solution for 10 min. at 37 °C and constantly perfused with fresh solution during the course of the
interventions.
Background fluorescence was recorded at the start and end of the experimental protocol. The
mean ratio signal was 0.20±0.04 at the start and 0.23±0.03 at the end of the experiment ([Ca2+]
121±72 and 178±52 µM respectively). The mean PMT voltage required was 889±127 V. At the
end of this period, 3 µM PE was introduced for 1 min. and the response recorded. Unmodified
Tyrode’s solution at 37 °C was used to perfuse isolated cells for 10 min. between subsequent
stimulations as a ‘washout’ period. After a final washout period, 120 mM KCl was introduced and
the response recorded. The maximum duration of experiments measuring PE-induced responses
was 60 min. To ascertain the stability of the preparation, responses to 3 µM PE were recorded
over a similar time period (figures 3.12, 3.13 and table 3.6).
Table 3.6 - Effect of repeated stimulation with PE on isolated CSM cells
PE responses in isolated cells remained stable throughout the experimental period.
N=7, n=8 1st PE
response
2nd PE
response
3rd PE
response
4th PE
response
5th PE
Response
120 mM
KCl
Peak ratio
signal
0.31±0.05 0.30±0.03 0.31±0.04 0.32±0.04 0.31±0.02 0.28±0.05
∆ [Ca2+]
(nM)
327±90 308±59 318±72 336±68 325±42 275±89

120
----- ----- ----- 1 min. 3 µM PE
1st Ca2+ transient 2nd Ca2+ transient 3rd Ca2+ transient
----- 1 min. 3 µM PE ----- 1 min. 120 mM KCl
4th Ca2+ transient 5th Ca2+ transient
Fig. 3.12 – Experimental tracing showing Ca2+ transients in response to consecutive 3 µM PE
To ensure cell stability, two consecutive PE responses were elicited under control conditions and
subsequent interventions compared to the second.
0
20
40
60
80
100
120
1st 2nd 3rd 4th 5th KCl
% second peakratio response
PE stimulus
Fig. 3.13 – Effect of consecutive applications of PE on calcium transients in isolated CSM cells
The final KCl response was 91±12% of the preceding PE response.
380 nm
340 nm
ratio
380 nm
340 nm
ratio
380 nm
340 nm
ratio

121
3.1.6 Summary of basic tissue parameters
Dissection was straightforward after animals were sacrificed as outlined in section 2.2. No
differences were observed between samples used on day 1 or day 2 after storage at 4 °C
overnight in Ca2+-free Tyrodes solution.
EFS-mediated contraction was stable over 240 min. 95% of contraction was via embedded motor
nerves (TTX-sensitive). Maximal motor nerve recruitment was seen at 50 V.
Agonist-induced contractures were stable over 240 min. An initial peak response followed by a
plateau was observed upon addition of 15 µM phenylephrine to the superfusate. The plateau
contracture was on average 85% of the peak response. In addition, the majority of tension
generated (87% of peak and 84% of plateau PE contracture) was insensitive to the L-type
calcium channel blocker nifedipine. Alternative sources of calcium would be intracellular stores,
intracellular calcium sensitisation and non-specific cation channels. These could have been
investigated by using caffeine, Rho-kinase inhibitors and non-specific cation channel blockers
(flufenamic acid and ruthenium red) respectively.
The majority of EFS-mediated relaxation is TTX sensitive (88%). However, there is a TTX
insensitive proportion of EFS mediated relaxation which increased with increasing frequency of
stimulation. Similarly relaxations were sensitive to ODQ and again there was a small ODQ
insensitive proportion which increased with increasing frequency of stimulation. This may be
secondary to direct EFS of the endothelium and may represent a nitric-oxide independent
mechanism of relaxation.

122
EFS-mediated relaxation demonstrated a shift to the left of the force-frequency relationship over
240 min. EFS24Hz was stable when expressed as percentage of preceding PE contracture as long
as the preceding PE contracture remained stable. However, the magnitude of EFS-mediated
relaxation was dependent upon the level of pre-contraction. EFS-mediated relaxation had a
proportionally greater effect with lower levels of pre-contraction. During the proposed
experiments, it is postulated that the level of pre-contraction may be changing due to the
ischaemic micro environment. Therefore observations on the effect of interventions on EFS-
mediated relaxation can only be made when the normal relationship is altered. In summary this
normal relationship is comprised of two aspects:
• At similar levels of pre-contraction, EFS-relaxation increases with time
• During interventions where the level of pre-contraction is reduced, EFS-mediated relaxation
has a proportionally greater effect.
Carbachol-induced relaxation was stable over 240 min. However, the degree of relaxation in
response to 1 µM carbachol was dependent upon the level of pre-contraction. In a similar manner
to EFS-mediated relaxation, carbachol induced a proportionally greater relaxation at lesser levels
of pre-contraction. Therefore, in experiments where the levels of pre-contraction may be reduced
during the intervention, this relationship must be taken into account.
Isolated cell harvest was satisfactory with the protocol developed. PE-induced calcium transients
were stable for the duration of proposed experiments.

123
Table 3.7 – Summary of basic tissue parameters
Aspect of CSM function
examined
Comments
EFS-mediated contraction • Stable over 240 min.
• 95% of contraction via embedded motor nerves.
• Maximal nerve recruitment at 50 V and above.
PE-induced contraction • Stable over 240 min.
• Initial peak response followed by plateau.
• Majority of response not sensitive to L-type calcium channel
blockade.
EFS-mediated relaxation • Left shift of the force-frequency relationship over 240 min.
• Dependent upon level of pre-contraction
• 88% TTX sensitive, 90% ODQ sensitive
Carbachol-induced
relaxation
• Stable over 240 min.
• Dependent upon level of pre-contraction
Isolated cell contraction • PE-induced [Ca2+]i transients stable over 60 min.

124
3.2 Results II – The effect of simulated ischaemia on nerve-mediated contraction
3.2.1 Effect of simulated ischaemia (HIAS) on nerve-mediated contraction
Simulated ischaemia (HIAS) consisted of simultaneous hypoxia, intra & extracellular acidosis and
substrate depletion (absence of glucose and sodium pyruvate). This resulted in reduction of
superfusate from pH 7.43±0.03 to 6.98±0.02 and reduction in PO2 from 88.3±4.2 kPa to 7.8±1.6
kPa.
Isometric nerve-mediated contractions elicited by electrical field stimulation (EFS range 8-60 Hz)
were recorded as described in section 2.3.4. Preparations were equilibrated in Tyrode’s solution
for 60 min. at 37 °C. At the end of this period, the mean nerve-mediated tension at 32 Hz
(EFS32Hz) was 0.25±0.13 mN.mm-2 (N=5, n=6) and was 45±1% of the estimated maximal tension
(Tmax) from the force-frequency curves. The mean f½ under these control conditions was 34.6±1.5
Hz.
30 min. of HIAS significantly reduced the mean EFS32Hz to 0.14±0.15 mN.mm-2 (53±30% of
control). This significant reduction was present at stimulation frequencies above 32 Hz. Further
exposure reduced tension even more, until after 60 min. HIAS, EFS32Hz was significantly reduced
to 20±13% of control (figures 3.14 and 3.15, table 3.7). This reduction was significant throughout
the frequency range of stimulation. f½ was unchanged during simulated ischaemia. The EFS
response did not recover upon reperfusion; after 60 min. of normal Tyrode’s solution, EFS32Hz
remained at 0.09±0.09 mN.mm-2 (30±24% of control).

125
8 16 24 32 40 40 60 8 16 24 32 40 60 8 16 24 32 40 60 8 16 24 32 40 60
Control 30 min. HIAS 60 min. HIAS reperfusion
Figure 3.14 – Typical experimental tracing showing effect of 60 min. simulated ischaemia
followed by re-superfusion with normal Tyrode’s solution for 60 min. on nerve-mediated
contraction
Figure 3.15 - Effect of 60 min. simulated ischaemia (HIAS) and reperfusion with normal Tyrode’s
solution on nerve-mediated force-frequency response.
– control, - 30 min HIAS, – 60 min HIAS, – reperfusion
*significant reduction 30 min. HIAS compared to control (p<0.05), error bars omitted for clarity
Tension was significantly and irreversibly ameliorated by simulated ischaemia.
0
0.1
0.2
0.3
0.4
0.5
0.6
0.7
0 10 20 30 40 50 60 70
Tension (mN.mm-2
)
Frequency (Hz)
5 min.
1 mN
* *
*
• • • • • • •
• • • • • •
• • • • • •
• • • • • •

126
Table 3.8 - Effect of simulated ischaemia (HIAS) on nerve-mediated contraction
* p<0.05 compared to control
N=5, n=6 control 30 min HIAS 60 min HIAS re-superfusion
extracellular pH 7.43±0.03 6.98±0.02 7.43±0.03
EFS32Hz (mN.mm-2) 0.25±0.13 0.14±0.15* 0.05±0.06* 0.09±0.09*
EFS32Hz as % control - 53±30 * 20±14 * 30±24 *
Tmax (mN.mm-2) 0.56±0.29 0.28±0.28* 0.13±0.13* 0.49±0.29
f½ (Hz) 34.6±1.5 46.3±44.5 31.0±6.07 65.6±48.0
Simulated ischaemia (HIAS) had a marked effect on nerve-mediated contraction. The individual
effects of each component of simulated ischaemia were examined to try to elicit the most
important factors in mediating this loss of contractile function.

127
3.2.2 Effect of isolated components of ischaemia on nerve-mediated contraction
3.2.2.1 Effect of substrate depletion (S) on nerve-mediated contraction
The effect of omission of glucose and Na pyruvate (S) from the superfusate on nerve-mediated
contraction was examined. In the first set of experiments, the effect of 60 min. substrate depletion
was recorded. At the end of the equilibration period, the mean EFS32Hz was 0.28±0.25 mN.mm-2
(N=4, n=5) and was 38±15% of the Tmax. The mean f½ under these control conditions was
47.0±16.9 Hz (table 3.9).
Table 3.9 - Effect of 60 min. substrate depletion (S) on nerve-mediated contraction
60 min. of substrate depletion had no effect on nerve-mediated contraction. In addition,
parameters after 60 min. of re-superfusion with normal Tyrode’s were not significantly different
from control.
N=4, n=5 Control 60 min S 15 min
reperfusion
60 min
reperfusion
EFS32Hz (mN.mm-2) 0.28±0.25 0.32±0.25 0.34±0.27 0.27±0.22
EFS32Hz as % control - 127±17 111±22 106±18
f½ (Hz) 47.0±16.9 31.8±13.7 33.4±7.6 40.6±13.5
The next set of experiments examined the effect of 120 min. of substrate depletion (S). The mean
EFS32Hz at the end of the equilibration period was 0.53±0.16 mN.mm-2 (N=4, n=6) and was
53±15% of the estimated Tmax from the force-frequency curves. The mean f½ under these control
conditions was 33.3±19.4 Hz (figure 3.16).

128
120 min. of substrate depletion also had no effect on the mean EFS32Hz. However there was
significant depression of tension generated in response to EFS at frequencies higher than this
(EFS40Hz, EFS60Hz and EFS80Hz). This was reflected in a significant reduction in the Tmax after 120
min of substrate depletion (control Tmax, 1.05±0.33 mN.mm-2 to 120 min. S Tmax, 0.51±0.26
mN.mm-2) In addition, f½ was also significantly reduced during this period (table 3.10, figure 3.16).
Upon re-superfusion with normal Tyrode’s for 60 min., f½ returned to control values (table 3.10).
However, tension generated upon EFS did not recover. In fact nerve-mediated contractile
responses were reduced further throughout the frequency range upon re-superfusion when
compared to control contractions.
Table 3.10 - Effect of 120 min. substrate depletion (S) on nerve-mediated contraction
* p<0.05 compared to control
N=4, n=6 Control 60 min S 120 min S 15 min
reperfusion
60 min
reperfusion
EFS40Hz (mN.mm-2) 0.65±0.20 0.59±0.17* 0.44±0.22* 0.36±0.25* 0.30±0.22*
EFS40Hz % of control - 90±6 66±18* 42±31* 43±25*
EFS32Hz (mN.mm-2) 0.53±0.16 0.49±0.14 0.40±0.19 0.29±0.20* 0.25±0.19*
EFS32Hz % of control - 93±7 73±24 50±25* 44±25*
Tmax (mN.mm-2) 1.05±0.33 0.89±0.26* 0.51±0.26* 0.67±0.38 0.45±0.26*
f½ (Hz) 33.3±19.4 30.5±18.6 15.6±7.5* 44.4±20.4 31.9±9.8

129
Figure 3.16 - Effect of 120 min. substrate depletion (S) on nerve-mediated contraction
– control, - 60 min S, – 120 min S, Δ – 15 min reperfusion, – 60 min reperfusion
*significant reduction of 120 min. S compared to control (p<0.05), error bars omitted for clarity
Nerve-mediated contraction during substrate depletion (omission of glucose and Na pyruvate
from supefusate) exhibited an initial resistance (for up to 60 min) to any detrimental effects.
However, with increasing periods of substrate depletion (120 min.), it was not possible to maintain
the magnitude of higher frequency nerve-mediated contractions. In addition, when this reduction
of force occurred, reperfusion with normal Tyrode’s caused a further reduction of contractile
function throughout the frequency range.
The time course of tension reduction during simulated ischaemia (HIAS) was shorter, and the
magnitude of tension reduction greater, when compared to substrate depletion alone. This implies
that substrate depletion alone was not the sole factor mediating reduction of nerve-mediated
contractions during simulated ischaemia. The effects of the other components of simulated
ischaemia were therefore examined followed by combinations of interventions.
0
0.2
0.4
0.6
0.8
1
0 20 40 60 80
Tension (mN.mm-2
)
Frequency (Hz)
* * *
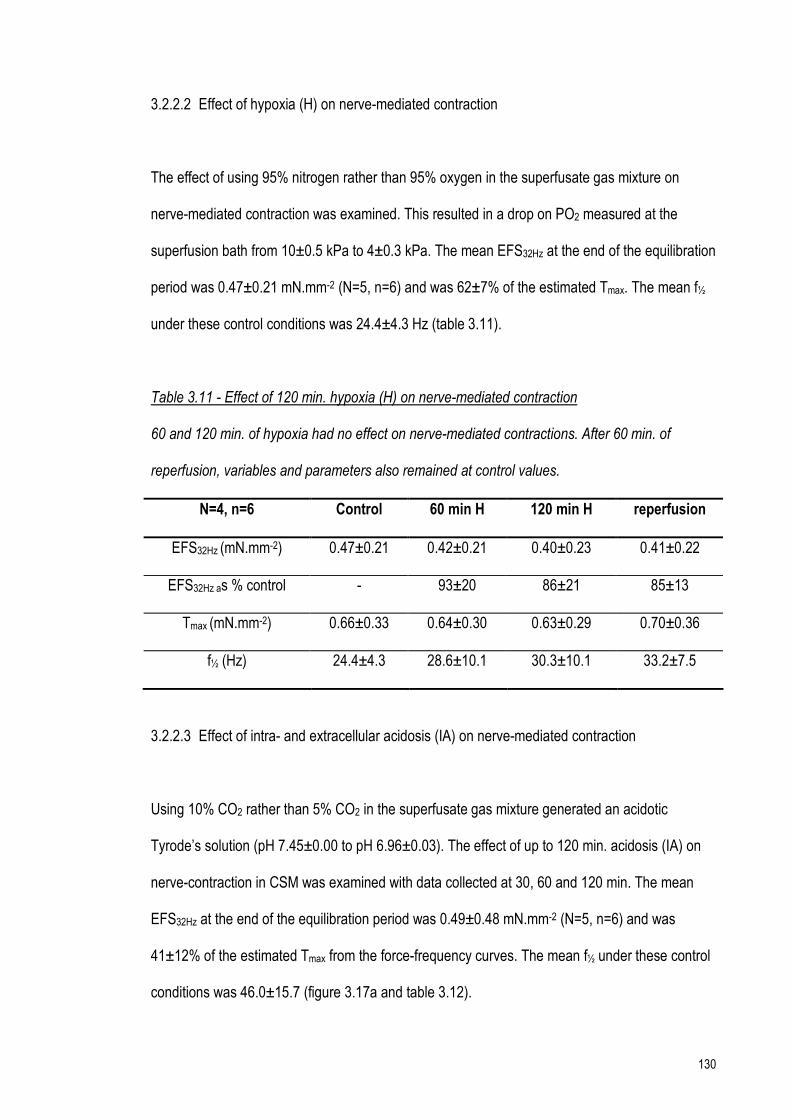
130
3.2.2.2 Effect of hypoxia (H) on nerve-mediated contraction
The effect of using 95% nitrogen rather than 95% oxygen in the superfusate gas mixture on
nerve-mediated contraction was examined. This resulted in a drop on PO2 measured at the
superfusion bath from 10±0.5 kPa to 4±0.3 kPa. The mean EFS32Hz at the end of the equilibration
period was 0.47±0.21 mN.mm-2 (N=5, n=6) and was 62±7% of the estimated Tmax. The mean f½
under these control conditions was 24.4±4.3 Hz (table 3.11).
Table 3.11 - Effect of 120 min. hypoxia (H) on nerve-mediated contraction
60 and 120 min. of hypoxia had no effect on nerve-mediated contractions. After 60 min. of
reperfusion, variables and parameters also remained at control values.
N=4, n=6 Control 60 min H 120 min H reperfusion
EFS32Hz (mN.mm-2) 0.47±0.21 0.42±0.21 0.40±0.23 0.41±0.22
EFS32Hz as % control - 93±20 86±21 85±13
Tmax (mN.mm-2) 0.66±0.33 0.64±0.30 0.63±0.29 0.70±0.36
f½ (Hz) 24.4±4.3 28.6±10.1 30.3±10.1 33.2±7.5
3.2.2.3 Effect of intra- and extracellular acidosis (IA) on nerve-mediated contraction
Using 10% CO2 rather than 5% CO2 in the superfusate gas mixture generated an acidotic
Tyrode’s solution (pH 7.45±0.00 to pH 6.96±0.03). The effect of up to 120 min. acidosis (IA) on
nerve-contraction in CSM was examined with data collected at 30, 60 and 120 min. The mean
EFS32Hz at the end of the equilibration period was 0.49±0.48 mN.mm-2 (N=5, n=6) and was
41±12% of the estimated Tmax from the force-frequency curves. The mean f½ under these control
conditions was 46.0±15.7 (figure 3.17a and table 3.12).

131
Table 3.12 - Effect of 120 min. IA on nerve-mediated contraction
120 min. of simultaneous intra- and extra-cellular acidosis had no effect on nerve-mediated
contraction. After 60 min. of reperfusion, parameters also remained at control values.
N=5, n=6 Control 30 min IA 60 min IA 120 min IA reperfusion
pH 7.45±0.00 6.96±0.03 7.45±0.00
EFS32Hz (mN.mm-2) 0.49±0.48 0.48±0.50 0.48±0.52 0.48±0.53 0.51±0.58
EFS32Hz as % control - 96±12 97±15 93±16 98±16
Tmax (mN.mm-2) 1.04±0.66 1.23±1.08 1.11±1.10 0.91±0.68 1.01±0.72
f½ (Hz) 46.0±15.7 46.4±10.4 38.6±5.7 38.5±12.0 41.8±13.4
3.2.2.4 Effect of intracellular acidification (I) on nerve-mediated contraction
As previously described, using 10% CO2 rather than 5% CO2 in the superfusate gas mixture
generated an acidotic Tyrode’s solution. By simultaneously increasing the amount of extracellular
buffer (HCO3-) it was possible to create an intracellular acidification at normal extracellular pH
(section 2.1.3). The effect of 120 min. intracellular acidification (I) on nerve-mediated contraction
was examined.
The mean EFS32Hz at the end of the equilibration period was 0.59±0.60 mN.mm-2 (N=5, n=6) and
was 54±12% of the estimated Tmax from the force-frequency curves. The mean f½ under these
control conditions was 30.3±7.2 (figure 3.17b and table 3.13).

132
Table 3.13 - Effect of 120 min. intracellular acidification (I) on nerve-mediated contraction
* p<0.05 compared to control
30 min. of intracellular acidification significantly augmented nerve-mediated contraction in CSM
and this effect was maintained at 60 and 120 min. intracellular acidification. Tmax and f½ were
unaltered during the intervention. Parameters returned to control values after 60 min. reperfusion
in Tyrode’s solution.
N=5, n=6 Control 30 min I 60 min I 120 min I reperfusion
pH 7.43±0.02 7.45±0.01 7.43±0.02
EFS32Hz (mN.mm-2) 0.59±0.60 0.67±0.64* 0.66±0.62* 0.62±0.61* 0.53±0.56
EFS32Hz as % control - 116±5* 115±6* 107±7* 89±9
Tmax (mN.mm-2) 1.00±0.75 1.14±0.76 1.06±0.74 1.01±0.69 0.89±0.67
f½ (Hz) 30.3±7.2 31.5±12.1 28.9±9.8 30.4±10.3 28.5±8.3
3.2.2.5 Effect of extracellular acidosis (A) on nerve-mediated contraction
By reducing the [HCO3-] in Tyrode’s solution, it was possible to reduce the pH of the extracellular
environment without a concomitant reduction in intracellular pH (pHe 7.39±0.03 to pHe
6.96±0.03)(186). The effect of up to 120 min. extracellular acidosis (A) on nerve-contraction in
CSM was examined.
The mean EFS32Hz at the end of the equilibration period was 1.09±1.00 mN.mm-2 (N=5, n=6) and
was 49±18% of the estimated Tmax. The mean f½ under these control conditions was 39.0±21.2
Hz (figure 3.17c and table 3.14).

133
Table 3.14 - Effect of 120 min. extracellular acidosis (A) on nerve-mediated contraction
* p<0.05 compared to control
30 min. of extracellular acidosis significantly depressed nerve-mediated contractions and this
effect was maintained at 120 min. extracellular acidosis. Parameters remained significantly
depressed after 60 min. re-superfusion in Tyrode’s solution.
N=5, n=6 Control 30 min A 60 min A 120 min A reperfusion
pH 7.39±0.03 6.96±0.03 7.39±0.03
EFS32Hz (mN.mm-2) 1.09±1.00 0.76±0.85* 0.75±0.86* 0.72±0.88* 0.94±1.04*
EFS32Hz as % control - 62±19* 58±18* 52±23* 76±18*
Tmax (mN.mm-2) 2.29±1.59 1.64±1.41 1.55±1.33* 1.49±1.33* 1.58±1.43
f½ (Hz) 39.0±21.2 39.2±12.6 35.2±8.1 36.7±6.4 29.2±6.5
Simultaneous intra- and extracellular acidosis had no effect on nerve-mediated contraction of
CSM. However acidosis in the individual compartments had opposite actions; intracellular
acidification augmented function whilst extracellular depressed it (figures 3.17a-c).
No single component in isolation mimicked the effect of simulated ischaemia (HIAS) on nerve-
mediated contraction (60 min. HIAS reduced EFS32Hz to 20±14% of control with no significant
recovery after 60 min. re-superfusion in normal Tyrode’s). The effects of various factors in
combination were therefore examined. Glucose and Na pyruvate omission from the superfusate
(S) had the most marked effect, and therefore the combination of this with hypoxia (H) was
recorded.

134
Fig. 3.17 – Acidosis on nerve contraction

135
3.2.3 Effect of combinations of components of simulated ischaemia on nerve-mediated
contraction
3.2.3.1 Effect of hypoxia and substrate depletion (HS)
At the end of the equilibration period, the mean EFS32Hz was 0.71±0.60 mN.mm-2 (N=7, n=7) and
was 54±13% of the estimated Tmax from the force-frequency curves. The mean f½ under these
control conditions was 30.9±9.2 Hz.
Hypoxia and substrate depletion (HS) for 60 min. significantly reduced the mean EFS32Hz to
0.06±0.05 mN.mm-2 (13±10% of control). The f½ was unchanged after 60 min. of HS depletion.
Nerve-mediated contractile responses did not recover upon re-superfusion; after 60 min. of
normal Tyrode’s solution, EFS32Hz remained at 0.09±0.07 mN.mm-2 (17±10% of control, table
3.15 and figure 3.18). There was no significant difference between the effect of HIAS compared
to simultaneous hypoxia and substrate depletion (HS) alone (table 3.16).
Table 3.15 - Effect of hypoxia and substrate depletion (HS) on nerve-mediated contraction
* p<0.05 compared to control
HS depletion significantly and irreversibly ameliorared nerve-mediated contraction.
N=7, n=9 Control 60 min HS 15 min
reperfusion
60 min
reperfusion
EFS32Hz (mN.mm-2) 0.71±0.60 0.06±0.05* 0.09±0.07* 0.09±0.07*
EFS32Hz as % control - 14±11* 18±12* 17±10*
Tmax (mN.mm-2) 1.20±0.77 0.12±0.11* 0.23±0.16* 0.21±0.13*
f½ (Hz) 30.9±9.2 31.8±8.8 35.7±8.0 32.4±8.8

136
Figure 3.18 - Effect of simultaneous hypoxia and substrate depletion (HS) on nerve contraction
– control, - 60 min HS, – 15 min reperfusion, – 60 min reperfusion
The depression of tension generated was present throughout the range of EFS.
Table 3.16 - Effect of simulated ischaemia (HIAS) compared to simultaneous hypoxia & substrate
depletion (HS) on nerve-mediated contraction * p<0.05 compared to control
These results showed that the combination of hypoxia and substrate depletion (HS) could be
responsible for the depression of nerve-mediated contractile function seen during simulated
ischaemia (HIAS).
Intervention HIAS
N=5, n=6
HS
N=7, n=7
30 min intervention 53±30* -
60 min intervention 20±14* 14±11*
As % of control
(%) 60 min reperfusion 30±24* 17±10*
0
0.4
0.8
1.2
1.6
0 10 20 30 40 50 60 70
Tension (mN/mm2)
Frequency (Hz)

137
In order to examine further the effect of intracellular acidification on nerve contraction, the effect
of intra- or extracellular acidosis in the presence of hypoxia and substrate depletion was
examined.
3.2.3.2 Effect of hypoxia, extracellular acidosis and substrate depletion (HAS)
At the end of the equilibration period, the mean EFS32Hz was 0.60±0.40 mN.mm-2 (N=5, n=6) and
was 51±8% of the estimated Tmax from the force-frequency curves. The mean f½ under these
control conditions was 31.9±4.9 Hz (table 3.17 and fig 3.19c).
Table 3.17 - Hypoxia, extracellular acidosis and substrate depletion (HAS) on nerve-contraction
Hypoxia, extracellular acidosis and substrate depletion (HAS) for 30 min. significantly reduced the
mean EFS32Hz to 29±16% of control. The reduction in tension generated persisted at 60 min. f½
was unchanged during the intervention. The EFS response recovered partially upon reperfusion;
after 60 min., EFS32Hz increased to 50±19% of control. However, tension generated remained
significantly less than control values.
N=5, n=6
* p<0.05 compared to control
Control 30 min HAS 60 min HAS 60 min
reperfusion
pH 7.40±0.02 7.00±0.04 7.40±0.02
EFS32Hz (mN.mm-2) 0.60±0.40 0.13±0.05* 0.10±0.03* 0.27±0.13*
EFS32Hz as % control - 28.6±15.7* 23.6±14.4* 49.7±19.0*
Tmax (mN.mm-2) 1.14±0.66 0.30±0.13* 0.24±0.08* 0.61±0.09*
f½ (Hz) 31.9±4.9 28.1±8.5 38.9±11.1 27.8±2.2

138
3.2.3.3 Effect of hypoxia, intracellular acidification and substrate depletion (HIS)
At the end of the equilibration period, the mean EFS32Hz was 0.57±0.40 mN.mm-2 (N=6, n=6) and
was 49±8 % of the estimated Tmax. The mean half-maximal frequency (f½) under these control
conditions was 33.7±5.4 Hz (table 3.18, fig. 3.19b).
Table 3.18 - Hypoxia, intracellular acidification and substrate depletion (HIS) on nerve-contraction
* p<0.05 compared to control. Hypoxia, intracellular acidification and substrate depletion (HIS) for
30 min. significantly reduced the mean EFS32Hz to 23±29% of control. f½ was unchanged after 60
min. of HIS depletion. The EFS response did not recover upon reperfusion; after 60 min. of
normal Tyrode’s, EFS32Hz remained at 26±23% of control.
N=6, n=6 Control 30 min HIS 60 min HIS reperfusion
pH 7.45±0.01 7.50±0.01
EFS32Hz (mN.mm-2) 0.57±0.40 0.08±0.07* 0.04±0.05* 0.11±0.08*
EFS32Hz as % control - 22.5±28.6 11.5±19.6 25.6±22.9
Tmax (mN.mm-2) 1.11±0.65 0.19±0.22* 0.09±0.12* 0.27±0.23*
f½ (Hz) 33.7±5.4 25.9±30.7 21.2±17.7 37.3±13.6
In summary, the detrimental effect of hypoxia and substrate depletion (HS) on nerve-mediated
contraction was similar to the effect of simulated ischaemia. Intra- or extracellular acidosis did not
limit the reduction in tension although simultaneous extracellular acidosis did significantly
increase tension upon reperfusion albeit not to control values (figures 3.19a-c). This may be due
to inactivation of the mechanisms by which intracellular acidification augments nerve-mediated
contractile function (section 3.2.2.4) by either hypoxia or substrate depletion. The effect of
acidosis in combination with either hypoxia or substrate depletion was therefore examined.

139
Fig 3.19 Hypoxia, acidosis and substrate depletion on nerve-contraction

140
3.2.4 Effect of combinations of intracellular and extracellular acidosis and substrate
depletion on nerve-mediated contraction in CSM
3.2.4.1 Effect of acidosis and substrate depletion (IAS)
At the end of the equilibration period, the mean EFS32Hz was 0.32±0.20 mN.mm-2 (N=6, n=6) and
was 43±12 % of the estimated Tmax. The mean half-maximal frequency (f½) under these control
conditions was 38.8±14.7 Hz (figure 3.20a and table 3.19).
Table 3.19 - Effect of intracellular and extracellular acidosis and substrate depletion (IAS) on
nerve-mediated contraction * p<0.05 compared to control
30 min acidosis and substrate depletion (IAS) significantly reduced the mean EFS32Hz to 73±16 %
of control. However, the estimated Tmax during the intervention was unchanged when compared
to control values. This is in contrast to the lack of effect recorded with 60 min. substrate depletion
(S) alone. At 60 min. of IAS depletion, EFS32Hz had returned to control values.
N=6, n=6 Control 30 min IAS 60 min IAS Reperfusion
pH 7.43±0.02 6.98±0.01 7.43±0.02
EFS32Hz (mN.mm-2) 0.32±0.20 0.22±0.15* 0.24±0.14 0.32±0.22
EFS32Hz as % control - 72.7±15.5 81.1±19.2 100.1±12.4
Tmax (mN.mm-2) 0.77±0.45 0.64±0.44 0.55±0.28 0.70±0.28
f½ (Hz) 38.8±14.7 38.3±5.6 33.8±3.8 37.3±9.2

141
3.2.4.2 Effect of extracellular acidosis and substrate depletion (AS)
At the end of the equilibration period, the mean EFS32Hz was 0.63±0.41 mN.mm-2 (N=6, n=6) and
was 51±9 % of the estimated Tmax. The mean half-maximal frequency (f½) under these control
conditions was 31.8±6.7 Hz (figure 3.20b and table 3.20).
Table 3.20 - Effect of extracellular acidosis and substrate depletion (AS) on nerve contraction
* = p<0.05 compared to control
Extracellular acidosis and substrate depletion (AS) for 30 min. significantly reduced the mean
EFS32Hz to 67±19 % of control. This depression of nerve-mediated function was maintained at 60
min. AS depletion. Again this is in contrast to the lack of effect seen with 60 min. substrate
depletion (S) in isolation. Parameters returned to control values upon reperfusion.
N=6, n=6 Control 30 min AS 60 min AS Reperfusion
pH 7.40±0.02 6.94±0.02 7.40±0.02
EFS32Hz (mN.mm-2) 0.63±0.41 0.43±0.31* 0.46±0.32* 0.59±0.34
EFS32Hz as % control - 67.4±19.1 71.3±20.6 96.5±10.4
Tmax (mN.mm-2) 1.28±0.85 0.93±0.58 0.91±0.56* 1.19±0.75
f½ (Hz) 31.8±6.7 33.9±5.5 31.4±4.5 31.4±4.8
3.2.4.3 Effect of intracellular acidification and substrate depletion (IS)
At the end of the equilibration period, the mean EFS32Hz was 0.55±0.34 mN.mm-2 (N=5, n=6) and
was 55±8 % of the estimated Tmax. The mean f½ under these control conditions was 38.6±4.7 Hz
(figure 3.20c and table 3.21).

142
Table 3.21 - Effect of intracellular acidification and substrate depletion (IS) on nerve-contraction
* = p<0.05 compared to control
30 min. intracellular acidification and substrate depletion (IS) significantly increased the mean
EFS32Hz to 112±7 % of control. This increase of nerve-mediated function was maintained at 60
min. Substrate depletion alone had no effect over a similar time course. Parameters returned to
control values upon reperfusion.
N=6, n=6 Control 30 min IS 60 min IS Reperfusion
pH 7.44±0.01 7.50±0.01 7.44±0.01
EFS32Hz (mN.mm-2) 0.55±0.34 0.61±0.37* 0.63±0.37* 0.60±0.37
EFS32Hz as % control - 111.8±6.7 118.5±11.5 110.1±7.8
Tmax (mN.mm-2) 0.96±0.55 0.99±0.52 1.01±0.54 1.04±0.53
f½ (Hz) 28.6±4.7 28.2±10.2 26.7±8.6 31.0±10.1
These experiments show that substrate depletion does not affect the mechanism by which
intracellular acidification augments and extracellular acidosis depresses nerve-mediated
contraction in CSM. In addition, when both intra- and extracellular acidosis was combined with
substrate depletion, an initial reduction in force of contraction at 30 min. followed by return to
control values at 60 min. was recorded during the intervention. The mechanism(s) by which
intracellular acidification maintains contractile function in the presence extracellular acidosis are
therefore time-dependent. The effect of the combination of hypoxia and acidosis was examined
next.

143
Fig 3.20 Acidosis and substrate depletion on nerve contraction

144
3.2.5 Combinations of hypoxia and acidosis on nerve-mediated contraction in CSM
3.2.5.1 Effect of hypoxia and intracellular and extracellular acidosis (HIA)
At the end of the equilibration period, the mean EFS32Hz was 0.31±0.08 mN.mm-2 (N=4, n=6) and
was 56±9 % of the estimated Tmax. The mean f½ under these control conditions was 29.5±6.3 Hz.
(figure 3.21a and table 3.22).
Table 3.22 - Effect of hypoxia and acidosis (HIA) on nerve-mediated contraction
* p<0.05 compared to control
30 min. hypoxia, intracellular and extracellular acidosis (HIA) significantly decreased the mean
EFS32Hz to 88±11 % of control. This depression of nerve-mediated function was maintained at 60
min. HIA depletion. Parameters returned to control values upon reperfusion
N=4, n=6 Control 30 min HIA 60 min HIA Reperfusion
pH 7.45±0.01 7.42±0.02 7.45±0.01
EFS32Hz (mN.mm-2) 0.31±0.08 0.28±0.09* 0.25±0.07* 0.31±0.10
EFS32Hz as % control - 88.0±11.3 78.0±8.2 98.7±9.5
Tmax (mN.mm-2) 0.57±0.14 0.43±0.11* 0.40±0.10* 0.56±0.13
f½ (Hz) 29.5±6.3 23.9±3.7 25.5±2.8 28.3±4.5

145
3.2.5.2 Effect of hypoxia and extracellular acidosis (HA)
At the end of the equilibration period, the mean EFS32Hz was 0.36±0.38 mN.mm-2 (N=6, n=8) and
was 53±8 % of the estimated Tmax. The mean f½ under these control conditions was 29.3±4.4 Hz
(table 3.23 and figure 3.21c).
Table 3.23 - Effect of hypoxia and extracellular acidosis (HA) on nerve-mediated contraction
* p<0.05 compared to control
Hypoxia and extracellular acidosis (HA) for 60 min. had no significant effect on mean EFS32Hz.
However the Tmax was significantly reduced during the ischaemic intervention with a reduction of
f½ at 30 min. All variables returned to control values after 60 min. reperfusion.
N=6, n=8 Control 30 min HA 60 min HA Reperfusion
pH 7.42±0.02 6.99±0.01
EFS32Hz (mN.mm-2) 0.36±0.38 0.32±0.38 0.30±0.38 0.40±0.44
EFS32Hz as % control - 87.6±20.2 79.2±21.6 115.5±19.7
Tmax (mN.mm-2) 0.62±0.59 0.47±0.46* 0.46±0.49* 0.68±0.71
f½ (Hz) 28.6±4.7 21.3±3.4* 24.2±3.6 27.7±3.8

146
3.2.5.3 Effect of hypoxia and intracellular acidification (HI)
At the end of the equilibration period, the mean EFS32Hz was 0.34±0.43 mN.mm-2 (N=5, n=6) and
was 50±5 % of the estimated Tmax. The mean half-maximal frequency (f½) under these control
conditions was 25.1±4.0 Hz (table 3.24 and figure 3.21b).
Table 3.24 - Effect of hypoxia and intracellular acidification (HI) on nerve-mediated contraction
* = significant reduction compared to control, # = significant increase compared to control, p<0.05
Hypoxia and intracellular acidification (HI) for 60 min. had no significant effect on mean EFS32Hz.
However the f½ was significantly reduced during the ischaemic intervention. All variables returned
to control values after 60 min. reperfusion.
N=5, n=6 Control 30 min HI 60 min HI Reperfusion
pH 7.40±0.00 7.48±0.02
EFS32Hz (mN.mm-2) 0.34±0.43 0.35±0.38 0.34±0.36 0.33±0.40
EFS32Hz as % control - 115.5±20.9 113.3±19.0 102.7±10.4
Tmax (mN.mm-2) 0.56±0.68 0.50±0.50 0.47±0.47 0.59±0.62
f½ (Hz) 25.1±4.0 20.6±3.7* 19.8±3.8* 29.3±3.9#
During simultaneous intra and extracellular acidosis, it appears that intracellular acidification
protects against reduction in tension seen with extracellular acidosis (section 3.2.2.3). The
mechanism by which intracellular acidification augments nerve-mediated contractile function is
sensitive to hypoxia. The above findings support this hypothesis. During simultaneous hypoxia
and intracellular acidification, no augmentation of function was seen. Findings during
simultaneous hypoxia, intra and extracellular acidosis (HIA) vs. hypoxia and extracellular acidosis
were similar.

147
Fig 3.21 Hypoxia and acidosis on nerve contraction

148
3.2.6 Summary of results for nerve-mediated contraction in CSM
Simulated ischaemia (the combination of hypoxia, intra- and extracellular acidosis and substrate
depletion) caused a significant, immediate and irreversible reduction in tension generated in
response to EFS (HIAS - EFS32Hz 20±14% of control after 60 min. intervention). A similar
response was seen in the presence of hypoxia and substrate depletion alone (HS - EFS32Hz
14±11% of control after 60 min. intervention). No further differences from HS values were seen
when hypoxia and substrate depletion were combined with either intra- or extracellular acidosis
(HAS - EFS32Hz 12±20% of control, HIS - EFS32Hz 13±11% of control after 60 min. intervention).
Looking at the individual elements of simulated ischaemia, 120 min. of hypoxia had no effect on
nerve-mediated tension (H - EFS32Hz 93±20% of control). Simultaneous intra- and extracellular
acidosis also had no effect (IA - EFS32Hz 97±15% of control after 120 min. intervention). However,
intra- or extracellular acidosis in isolation had opposite effects. Intracellular acidification
significantly and reversibly augmented nerve-mediated tension whereas extracellular acidosis
significantly and irreversibly depressed it (I - EFS32Hz 115±6% of control, A - EFS32Hz 58±20% of
control after 120 min. intervention).
Intracellular acidification was combined with other elements of simulated ischaemia to examine
this increase in nerve-mediated tension. Augmentation of nerve-mediated tension was again seen
when combining intracellular acidification with substrate depletion (IS - EFS32Hz 119±12% of
control after 60 min. intervention). A similar period of substrate depletion alone had no effect on
tension generated (although longer periods of substrate depletion significantly and irreversibly
depressed nerve-mediated tension, EFS32Hz 74±24% of control after 120 min. S). In contrast to
the inotropic effect of IS depletion, extracellular acidosis and substrate depletion depressed

149
tension generated (AS - EFS32Hz 71±21% of control after 60 min. intervention). Acidosis in both
compartments in combination with substrate depletion initially depressed function followed by a
return to control values at 60 min. of the intervention (IAS - EFS32Hz 73±16% and 81±19% of
control after 30 min. and 60 min. of intervention respectively). This would suggest that the
mechanism(s) by which intracellular acidification maintains contractile function in the presence
extracellular acidosis are time-dependent.
Intracellular acidification was combined with hypoxia to further examine the augmentation seen
with this component of ischaemia. No significant increase in tension was seen with this
combination (HI - EFS32Hz 113±19% of control after 60 min. intervention). A reduction in tension
to 79±22% of control was seen after 60 min. of both hypoxia and extracellular acidosis (HA). A
similar reduction was seen with extracellular acidosis alone. Hypoxia and acidosis in both
compartments resulted in a reduction in nerve-mediated tension (HIA - EFS32Hz 78±8% of control
after 60 min. intervention). Again this was similar to the reduction in tension seen with
extracellular acidosis alone, further evidence that hypoxia inactivates the mechanism by which
intracellular acidification increases nerve-mediated tension. The effect of simulated ischaemia on
nerve-mediated contraction in CSM is summarised in Table 3.25.
The next stage of investigation was to examine the effect of the various components of ischaemia
on direct agonist-induced contraction of CSM. Subsequent experiments followed a similar format
as that presented thus far on nerve-mediated contraction. The effect of simulated ischaemia on
PE-induced contractures was recorded, followed by the individual components of ischaemia in
turn; combinations of interventions were used to explore further the effects of simulated
ischaemia. For presentation purposes data have been tabulated and presented in grapical form
where appropriate.

150
Table 3.25 - Effect of components of ischaemia applied in various combinations on nerve-
mediated contraction in CSM
* = significant reduction compared to control, # = significant increase compared to control, p<0.05
Intervention EFS32Hz after 60 min
intervention (% control)
f½ Reperfusion
HIAS 20±14* no change no recovery
HIAS had a rapid irreversible detrimental effect.
HS 14±11* no change no recovery
HAS 13±11* no change no recovery
HIS 12±20* no change no recovery
Detrimental effect of HIAS due to combined effect of hypoxia and substrate depletion (HS).
H 93±20 shifted right after reperfusion no change
IA 97±15 no change no change
A 58±20* no change some recovery
I 115±6# no change back to control
Intracellular acidification rapidly augments contraction with no change in f½.
60 min. S 93±7* no change no change
120 min. S 74±24* shifted left after 120 min deterioration
Tmax suppressed during intervention. Reperfusion caused a further deterioration of function
IAS 81±19 no change no change
AS 71±21* no change back to control
IS 119±12# no change back to control
Intracellular acidification limited detrimental effect of extracellular acidosis with substrate
depletion
HIA 78±8 no change back to control
HA 79±22 initially shifted to left back to control
Tmax significantly suppressed during intervention, similar effect to extracellular acidosis
HI 113±19 shifted to left back to control
Augmentation of function by intracellular acidification is sensitive to hypoxia

151
3.3 Results III – The effect of ischaemia on agonist-induced contraction
3.3.1 Effect of simulated ischaemia (HIAS) on agonist-induced contraction in CSM
Isometric contractures in response to 15 µM phenylephrine (PE) were recorded as described in
section 2.3.5. Preparations were equilibrated in Tyrode’s solution for 60 min. at 37 °C. At the end
of this period, PE was added to the superfusing solution and the resulting contracture recorded.
The effect of 60 min. of simulated ischaemia was examined on both the peak and plateau PE
contracture (Table 3.26).
Table 3.26 - Effect of simulated ischaemia (HIAS) on PE contractures
* p<0.05 compared to control
N=6, n=6 Control 30 min HIAS 60 min HIAS Reperfusion
Peak PE contracture (mN.mm-2)
0.74±0.53 0.55±0.42 0.21±0.11* 0.70±0.48
Peak PE contracture as % of control (%)
- 83±31 35±19* 99±23
Plateau PE contracture (mN.mm-2)
0.70±0.53 0.18±0.17* 0.16±0.08* 0.60±0.43
Plateau PE contracture as % of control (%)
- 36±35* 29±16* 92±23
Simulated ischaemia (HIAS) caused a significant reduction in the size of the PE contracture
which recovered completely upon reperfusion. This reduction was time-dependent - the peak
contracture at 30 min. of simulated ischaemia was preserved whilst the steady state value was
reduced to that remaining at 60 min, indicating some metabolic reserve prior to contractile failure
(compare figs. 3.22 and 3.23). However, in contrast to the effect of HIAS on nerve-mediated
contraction (section 3.2.1), PE contractures recovered completely upon reperfusion. The effect of
HIAS on nerve-mediated contraction and PE contractures are summarised in fig. 3.24.

152
0
20
40
60
80
100
120
60 min NT 30 min HIAS 60 min HIAS reperfusion
% controlcontracture
Intervention
Fig. 3.22 – The effect of simulated ischaemia (HIAS) on peak PE contractures
* significant reduction compared to control (p<0.05)
The peak PE contracture was initially preserved.
0
20
40
60
80
100
120
60 min NT 30 min HIAS 60 min HIAS reperfusion
% controlcontracture
Intervention
Fig. 3.23 – The effect of simulated ischaemia (HIAS) on plateau PE contractures
* significant reduction compared to control (p<0.05)
Plateau PE contracture was significantly ameliorated throughout the intervervention.
* *
*

153
0
20
40
60
80
100
120
60 min NT 30 min HIAS 60 min HIAS reperfusion
% control
Intervention
Fig. 3.24 – The effect of simulated ischaemia (HIAS) on CSM contraction
red hatched bars peak PE contractures, blue hatched bars EFS32Hz
* significant reduction compared to control (p<0.05)
Agonist-induced contractures recovered completely upon reperfusion whereas nerve-mediated
contractions did not.
3.3.2 Effect of simulated ischaemia (HIAS) on agonist-induced contractures in the presence of
nifedipine
Under control conditions, peak and plateau contractile responses to 15 µM phenylephrine were
significantly reduced in the presence of 100 µM nifedipine to 79±7% and 77±7% of control
respectively (section 3.1.2.2, page 98). Therefore around 20% of the agonist-induced contracture
was dependent on Ca2+ influx via the L-type Ca2+channel under control conditions. To further
examine the effect of simulated ischaemia, PE-contractures in the presence of the L-type
Ca2+channel blocker nifedipine were recorded (table 3.27 and fig. 3.25).
* * * *

154
Table 3.27 - Simulated ischaemia (HIAS) on PE contractures in presence of 100 µM nifedipine
* p<0.05 compared to control
N=5, n=7 control NT 30 min HIAS 60 min HIAS Reperfusion
in the presence of 100 µM nifedipine
Peak PE contracture (mN.mm-2)
1.27±0.70 1.18±0.68 0.78±0.51 1.42±0.98
Peak PE contracture as % of control (%)
- 93±9 68±27 107±17
Plateau PE contracture (mN.mm-2)
1.15±0.67 0.84±0.67 0.67±0.42* 1.31±0.92
Plateau PE contracture as % of control (%)
- 77±21 66±31 110±21
0
20
40
60
80
100
120
60 min NT 30 min HIAS 60 min HIAS reperfusion
% control
Interventions
Fig. 3.25 – Simulated ischaemia (HIAS) on agonist contractures in the presence of nifedipine
plateau PE contractures plateau PE contractures in presence of 100 µM nifedipine
*significant reduction compared to control (p<0.05)
The detrimental effect of simulated ischaemia was significantly ameliorated in the presence of
nifedipine. This suggests that the Ca2+ channel is labile to the effects of ischaemia.
* *

155
3.3.3 Effect of simulated ischaemia (HIAS) on Ca2+transients in isolated CSM cells
Simulated ischaemia caused a significant reduction in PE induced contractures, an effect that
appeared to be time dependent on agonist induced contractions. The L-type Ca2+channel is labile
to the effects of simulated ischaemia with the detrimental effects of this intervention ameliorated
by the presence of nifedipine. To examine the effect of ischaemia on [Ca2+]i the following
experiments were carried out.
CSM cell isolation was performed on fresh tissue as outlined in sections 2.6.2 and 2.6.3. Cells
were equilibrated in Tyrode’s solution for 10 min. at 37 °C and constantly perfused with fresh
solution during the course of the interventions.
Background fluorescence was recorded at the start and end of the experimental protocol. The
mean ratio signal was 0.18±0.02 at the start and 0.20±0.03 at the end of the experiment ([Ca2+]
97±37 nM and 127±45 nM respectively). The mean PMT voltage required was 817±46 V. At the
end of this period, two responses with 3 µM PE were recorded, the second acting as the control
calcium transient for comparison with simulated ischaemia exposures. 3 µM PE was determined
experimentally as eliciting a maximal calcium transient. Unmodified Tyrode’s solution at 37 °C
was used to perfuse isolated cells for 10 min. between each intervention as a ‘washout’ period.
The isolated cell was then subjected to 20 min. of simulated ischaemia (the combination of
hypoxia, intra- and extracellular acidosis and substrate depletion). Two further PE responses
were recorded during this intervention. 20 min. of intervention was used (in contrast to 30 min.
and 60 min. responses in the muscle strip experiments) due to experimental limitations with cell
stability over prolonged periods of experimentation. In addition the effect of interventions in the
muscle strip experiments was apparent, in general, within 5-10 min. Unmodified Tyrode’s solution

156
was then re-introduced for a period of 10 min. and a PE response recorded to examine the effect
of reperfusion. A final response to 120 mM KCl was recorded at the end of the experiment (fig.
3.26, fig. 3.26a and table 3.28).
0
20
40
60
80
100
120
control HIAS 1 HIAS 2 reperfusion KCl
% initial peakratio response
PE stimulus
Fig. 3.26 – Effect of simulated ischaemia (HIAS) on calcium transients in isolated CSM cells
PE responses were not significantly different from control values during the ischaemic
intervention. These findings suggest that the decline in the PE contracture during simulated
ischaemia is unrelated to changes in [Ca2+]i.
Control 1st 2nd reperfusion
HIAS depletion
Fig. 3.26a – Typical experimental tracing demonstrating the effect of HIAS on isolated CSM cells
340 nm 380 nm
ratio
3 min
[Ca2+] 75 µM

157
Table 3.28 - Effect of simulated ischaemia on PE-induced Ca2+ transients in isolated CSM cells
N=4, n=6 Control 1st HIAS response
2nd HIAS Response
Reperfusion 120 mM KCl
Peak ratio signal
0.32±0.07 0.34±0.06 0.35±0.08 0.33±0.08 0.26±0.01
∆ [Ca2+] (nM)
349±133 390±122 409±168 375±165 228±23
In a similar manner to preceding experiments, the effect of the separate components of
ischaemia on agonist-induced contractures was examined.

158
3.3.4 Effect of isolated components of ischaemia on agonist-induced contraction
3.3.4.1 Effect of substrate depletion (S) on agonist-induced contraction in CSM
The effect of 120 min. omission of Na pyruvate and glucose (S) from the superfusate was
examined on both the peak and plateau PE contracture (figure 3.27 and table 3.32).
0
20
40
60
80
100
120
140
160
60 min NT 60 min S 120 min S reperfusion
% control
Intervention
Fig. 3.27 – The effect of substrate depletion (S) on CSM contraction
plateau PE contractures, EFS40Hz
* significant reduction compared to control, # significant increase compared to control (p<0.05)
Substrate depletion had no effect on the magnitude of the PE response. On reperfusion for 60
min., both peak and plateau responses were greater than control. This is in contrast to the time-
dependent detrimental effect of S on nerve-mediated contraction.
* * #

159
3.3.4.2 Effect of substrate depletion (S) on isolated CSM cells
Background fluorescence was recorded at the start and end of the experimental protocol. The
mean ratio signal was 0.17±0.01 at the start and 0.19±0.01 at the end of the experiment ([Ca2+]
72±18 and 114±15 nM respectively). The mean PMT voltage required was 792±40 V. At the end
of this period, two responses with 3 µM PE were recorded using the same protocol as in section
3.3.2. The isolated cell was then subjected to 20 min. of substrate depletion. Two further PE
responses were recorded during this intervention. Unmodified Tyrode’s solution was then re-
introduced for a period of 10 min. and a PE response recorded to examine the effect of
reperfusion. A final response to 120 mM KCl was recorded at the end of the experiment (fig. 3.28
and table 3.29). Ca2+ transients were unaffected by substrate depletion. Due to time constraints,
the number of experiments was small and conclusions cannot be drawn from these findings (N=2,
n=3).
Control 1st 2nd reperfusion
S depletion
Fig. 3.28 – Typical experimental tracing demonstrating the effect of S on isolated CSM cells
Ca2+ transients were not significantly different during the intervention.
Table 3.29 - Effect of substrate depletion on PE-induced transients in isolated CSM cells
N=2, n=3 Control 1st S Response
2nd S Response
Reperfusion 120 mM KCl
Peak ratio signal
0.44±0.09 0.40±0.07 0.39±0.06 0.42±0.07 0.29±0.10
340 nm 380 nm
ratio 3 min
[Ca2+]
75 µM

160
3.3.4.3 Effect of hypoxia (H) on agonist-induced contraction in CSM
The effect of up to 120 min. hypoxia (H) was examined on peak and plateau PE contractures (fig.
3.29 and table 3.32).
0
20
40
60
80
100
120
140
60 min NT 30 min H 60 min H 120 min H reperfusion
% control
Intervention
Fig. 3.29 – The effect of hypoxia (H) on CSM contraction
peak PE contractures, plateau PE contractures, EFS32Hz
* significant reduction compared to control (p<0.05)
In a similar manner to the effect of HIAS, there appeared to be some early preservation of the
peak PE response at 30 min. of hypoxia, with a significant effect on the peak response at 60 and
120 min. of the hypoxic intervention. Hypoxia significantly suppressed the plateau response at
each interval. This is in contrast to the lack of effect of hypoxia on nerve-mediated contraction.
* * * * *

161
3.3.4.4 Effect of intracellular and extracellular acidosis (IA) on agonist-contraction in CSM
The effects of 120 min. intra- and extra-cellular acidosis (IA) were examined on both peak and
plateau PE contractures (Table 3.32).
IA had no effect on the magnitude of the PE response in a similar manner to the lack of effect of
IA seen on nerve-mediated contraction.
3.3.4.5 Effect of acidosis (IA) on isolated CSM cells
Background fluorescence was recorded at the start and end of the experimental protocol. The
mean ratio signal was 0.17±0.02 at the start and 0.21±0.02 at the end of the experiment ([Ca2+]
77±30 and 138±38 nM respectively). The mean PMT voltage required was 810±44 V (fig. 3.30
and table 3.30).
Control 1st 2nd reperfusion
IA depletion
Fig. 3.30 – Typical experimental tracing demonstrating the effect of IA on isolated CSM cells
Intra- and extracellular acidosis had no significant effect on calcium transients.
Table 3.30 - Effect of intra- and extracellular acidosis on calcium transients in isolated CSM cells
N=5, n=9 Control 1st IA response
2nd IA Response
Reperfusion 120 mM KCl
Peak ratio signal
0.35±0.11 0.38±0.15 0.38±0.15 0.36±0.12 0.28±0.08
∆ [Ca2+] (nM) 426±267 502±393 498±402 447±288 273±156
340 nm 380 nm
ratio 3 min
[Ca2+]
75 µM

162
3.3.4.6 Effect of intracellular acidification (I) on agonist-induced contraction in CSM
The effect of 120 min. intracellular acidification (I) was examined on both peak and plateau PE
contractures (table 3.32 and fig. 3.30a).
0
20
40
60
80
100
120
140
60 min NT 30 min I 60 min I 120 min I reperfusion
% control
Intervention
Fig. 3.30a – The effect of intracellular acidification (I) on CSM contraction
peak PE contractures, plateau PE contractures, EFS32Hz
* significant increase compared to control
Intracellular acidification significantly increased the magnitude of the PE contracture. This effect
was transient, at 60 and 120 min. the increase was not maintained. This contrasts with the effect
of intracellular acidification on nerve-mediated contraction, where the increase occurred
throughout the 120 min. intervention. Responses returned to normal upon reperfusion.
* * * * *

163
3.3.4.7 Effect of intracellular acidification (I) on isolated cells
Background fluorescence was recorded at the start and end of the experimental protocol. The
mean ratio signal was 0.18±0.02 at the start and 0.21±0.03 at the end of the experiment ([Ca2+]
93±32 and 150±49 µM respectively). The mean PMT voltage required was 799±61 V. At the end
of this period, two responses with 3 µM PE were recorded. The isolated cell was then subjected
to 20 min. of intracellular acidification and two further PE responses were recorded (figs. 3.31,
3.32 and table 3.31).
Table 3.31 - Effect of intracellular acidification on calcium transients in isolated CSM cells
* p<0.05 compared to control
Calcium transients were significantly and reversibly augmented during the period of intervention.
N=5, n=8 Control 1st I response
2nd I response
Reperfusion 120 mM KCl
Peak ratio signal
0.34±0.07 0.41±0.09* 0.41±0.09* 0.34±0.07 0.29±0.08
∆ [Ca2+] (nM) 388±148 555±231 542±236 401±159 293±163
Control 1st 2nd reperfusion
Intracellular acidification
Fig. 3.31 – Typical experimental tracing demonstrating the effect of intracellular acidification on
isolated CSM cells
340 nm 380 nm
ratio
3 min
[Ca2+]
75 µM

164
0
20
40
60
80
100
120
140
control I 1 I 2 reperfusion KCl
% initial peakratio response
PE stimulus
Fig. 3.32 – Effect of intracellular acidification on Ca2+ transients in isolated CSM cells
*significant increase compared to control (p<0.05)
Increase in tension recorded during intracelleular acidification was secondary to a rise in [Ca2+]i.
* *

165
3.3.4.8 Effect of extracellular acidosis (A) on agonist-induced contraction in CSM
The effect of 120 min. extracellular acidosis (A) was recorded on both peak and plateau PE
contractures (table 3.32 and figure 3.33).
0
20
40
60
80
100
120
60 min NT 60 min A 120 min A reperfusion
% control
Intervention
Fig. 3.33 – The effect of extracellular acidosis (A) on CSM contraction
plateau PE contractures, EFS32Hz
* significant reduction compared to control
Extracellular acidosis had no effect on the magnitude of either the peak or plateau PE
contracture. This is in contrast to the significant reversible depression of nerve-mediated
contraction seen with extracellular acidosis.
In a similar manner to nerve-mediated contraction, the effects of the components of simulated
ischaemia in various combinations were investigated on PE-induced contractures.
* * *

166
Table 3.32 Components of ischaemia on PE contractures

167
3.3.5 Effect of combinations of components of simulated ischaemia on agonist-induced
contractions in CSM
3.3.5.1 Effect of hypoxia and substrate depletion on agonist-induced contraction in CSM
Combinations of interventions exerted a significant effect over a shorter time-frame than
individual components of ischaemia in isolation. Due to the deleterious effects on muscle strip
preparations, interventions were applied for a maximum of 60 min., in order to usefully record the
effects of reperfusion. The effect of 60 min. hypoxia and substrate depletion (HS) was recorded
on both peak and plateau PE contractures (Table 3.34).
HS depletion caused a significant reduction in the size of the PE contracture which recovered
completely upon reperfusion. In a similar manner to the effect of HIAS, the effect was time-
dependent as shown by the fact that the peak contracture at 30 min. of HS was not reduced.
Again, in contrast to the effect of HS on nerve-mediated contraction, PE contractures recovered
completely upon reperfusion (fig. 3.35a).
3.3.5.2 Effect of hypoxia and substrate depletion (HS) on isolated CSM cells
Background fluorescence was recorded at the start and end of the experimental protocol. The
mean ratio signal was 0.15±0.04 at the start and 0.19±0.01 at the end of the experiment ([Ca2+]
54±55 and 109±23 nM respectively). The mean PMT voltage required was 766±15 V. At the end
of this period, two responses with 3 µM PE were recorded. The isolated cell was then subjected
to 20 min. combined hypoxia and substrate depletion. Two further PE responses were recorded
during this intervention. Unmodified Tyrode’s solution was then re-introduced for a period of 10

168
min. and a PE response recorded to examine the effect of reperfusion. A final response to 120
mM KCl was recorded at the end of the experiment (table 3.33 and figs. 3.34a and b).
Table 3.33 - Effect of hypoxia and substrate depletion on calcium transients in isolated CSM cells
* = significant reduction compared to control p<0.05
The second PE response was significantly depressed during HS depletion.
N=4, n=7 Control 1st HS Response
2nd HS Response
Reperfusion 120 mM KCl
Peak ratio signal
0.33±0.08 0.32±0.07 0.28±0.08* 0.29±0.09 0.24±0.03
∆ [Ca2+] (nM) 361±157 346±137 277±144 289±177 189±54
Control 1st 2nd reperfusion
Hypoxia and substrate depletion
Fig. 3.34a – Typical tracing showing effect of HS depletion on isolated CSM cell
340 nm 380 nm
ratio
3 min
[Ca2+] 75 µM

169
0
20
40
60
80
100
120
control HS 1 HS 2 reperfusion KCl
% initial peakratio response
PE stimulus
Fig. 3.34b – Effect of hypoxia and substrate depletion on calcium transients in isolated CSM cells
*significant reduction compared to control (p<0.05)
3.3.5.3 Effect of hypoxia, extracellular acidosis and substrate depletion on PE contraction
The effect of 60 min. hypoxia, extracellular acidosis and substrate depletion (HAS) was recorded
on both peak and plateau PE contractures (Table 3.34).
The effect of HAS on agonist-induced contraction was similar to the effect of HS depletion
(section 3.3.5.1). HAS depletion caused a significant reduction in the PE contracture, however,
the peak PE response at 30 min. was relatively preserved. Contractures recovered completely
upon reperfusion in contrast to EFS responses (fig. 3.35b).
*

170
3.3.5.4 Effect of hypoxia, intracellular acidification and substrate depletion (HIS) on agonist
contraction
The effect of 60 min. hypoxia, intracellular acidification and substrate depletion (HIS) was
recorded on both peak and plateau PE contractures (Table 3.34).
HIS depletion caused a similar pattern of responses to HS and HAS interventions which
recovered completely upon reperfusion. This is in contrast to the effect of HIS on nerve-mediated
contraction (section 3.2.3.3) where tension did not recover after the HIS exposure (fig. 3.35c). It
can be seen when comparing figures 3.35 a-c that the depression of function seen during HIS
depletion was not as severe as that seen during either HS or HAS depletion.

171
Figure 3.35 – Combinations of elements of ischaemia on CSM contraction

172
Table 3.34 – combinations of components of simulated ischaemia on PE contractures

173
3.3.6 Combinations of acidosis and substrate depletion on PE-contractures
The effect of various combinations of intra- and extracellular acidosis and substrate depletion for
60 min. were recorded on both peak and plateau PE contractures (Table 3.35).
3.3.6.1 Effect of acidosis and substrate depletion (IAS)
No change in PE contracture was seen during the intervention. Upon reperfusion, a significant
increase in tension was noted in the peak PE contracture (fig. 3.36a).
3.3.6.2 Effect of extracellular acidosis and substrate depletion (AS)
A significant reduction in tension was observed on peak PE responses at both 30 and 60 min. AS
depletion. A trend in reduction was observed in the plateau PE contracture that was significant
when tension was expressed as a percentage of control values. Responses returned to normal
upon reperfusion. This is similar to the response of nerve-mediated contraction to extracellular
acidosis and substrate depletion with a significant reversible amelioration of tension recorded (fig.
3.36b).
3.3.6.3 Effect of intracellular acidification and substrate depletion (IS)
No significant change in tension generated in response to PE was observed during the
intervention. However, upon reperfusion, both peak and plateau responses were significantly
augmented when compared to control. Nerve-mediated contraction was significantly increased in
the presence of intracellular acidification. Agonist-induced contraction showed a trend towards
increasing but did not reach significance (fig. 3.36c).

174
Figure 3.36 – Acidosis and substrate depletion on CSM contraction

175
Table 3.35 - Acidosis and substrate depletion on PE contractures

176
3.3.7 Effect of combinations of hypoxia and acidosis on agonist-induced contraction
The effect of various combinations of hypoxia, intracellular and extracellular acidosis for 60 min.
were recorded on both peak and plateau PE contractures (Table 3.36).
3.3.7.1 Effect of hypoxia and acidosis (HIA)
No significant change in tension generated in response to PE was recorded however a trend in
reduction in tension during the intervention was observed. Responses remained at control levels
upon reperfusion. A significant small reversible reduction in nerve-mediated contraction was
noted during similar interventions (fig. 3.37a).
3.3.7.2 Effect of hypoxia and extracellular acidosis (HA)
A significant reduction of the PE contracture was recorded with some preservation of the initial
peak PE contracture. Responses returned to control levels upon reperfusion. A significant
reversible reduction in nerve-mediated contraction was noted during similar interventions. This
reduction in tension in nerve-mediated contraction was not as marked as that seen with agonist-
induced contractures (fig. 3.37b).
3.3.7.3 Effect of hypoxia and intracellular acidification (HI)
A trend towards a time-dependent reduction in the PE contracture was noted during the
intervention with some preservation of the initial peak PE contracture. However, this did not reach
significance. Responses remained at control levels upon reperfusion. No significant effect was
noted with nerve-mediated contraction during similar interventions (fig. 3.37c).

177
Figure 3.37 – Hypoxia and acidosis on CSM contraction

178
Table 3.36 – Hypoxia and acidosis on PE contractures

179
3.3.8 Summary of results for agonist-induced contraction in CSM
Simulated ischaemia (the combination of hypoxia, intra- and extracellular acidosis and substrate
depletion - HIAS) caused a significant and marked reduction in agonist-induced contraction
(plateau PE30 response 35±19%, plateau PE60 response 29±16% of control). The degree of
depression was similar to that seen in nerve-mediated contraction although there appeared to be
some metabolic reserve as shown by early preservation of the peak PE response (peak PE30
response 83±31%, peak PE60 response 36±35% of control). Ca2+ transients in isolated cells
during similar interventions showed no difference from control values. However, the time-course
of isolated cell procedures was much shorter and correlated with the period of preservation of
peak PE responses during HIAS depletion. Nerve-mediated contraction did not recover upon
reperfusion whereas agonist-induced contraction demonstrated a complete recovery.
Experiments carried out in the presence of the Ca2+-channel blocker nifedipine showed
significantly less depression of agonist-induced contraction during simulated ischaemia (plateau
PE30 response 68±27%, plateau PE60 response 66±31% of control).
As with nerve-mediated contractions, the combination of hypoxia and substrate depletion (HS)
produced similar responses to simulated ischaemia (plateau PE30 response 28±19%, plateau
PE60 response 30±20% of control). A significant reversible reduction in tension generated was
recorded with initial preservation of the peak PE response (peak PE30 response 89±23%, peak
PE60 response 28±19% of control). In a similar fashion, PE-induced Ca2+ transients demonstrated
an initial resistance with significant depression of the second PE-induced calcium transient during
HS depletion. Again, in contrast to nerve-mediated contraction, complete recovery was observed
upon reperfusion. Combined hypoxia, extracellular acidosis and substrate depletion (HAS) had a
similar effect to hypoxia and substrate depletion (HS). Combined hypoxia, intracellular

180
acidification and substrate depletion (HIS) also had a similar effect however the initial
preservation of the peak PE response was more marked (peak PE30 response 102±4%, peak
PE60 response 52±24%, plateau PE30 response 66±42%, plateau PE60 response 55±25% of
control). All interventions demonstrated complete recovery upon reperfusion.
Similar to the effect on nerve-mediated contraction, simultaneous intra- and extracellular acidosis
had no overall effect on agonist-induced contractures, with no change upon reperfusion.
Intracellular acidification caused a significant and reversible increase in nerve-mediated
contraction and also augmented the PE contracture at 30 min. although then returned to control
at 60 and 120 minutes. Intracellular acidification induced a significant and reversible increase in
PE-induced Ca2+ transients. Interestingly, the significant depression of nerve-mediated
contraction observed with extracellular acidosis was not observed on PE-contractures.
Substrate depletion (omission of glucose and Na pyruvate) caused significant and irreversible
depression of nerve-mediated contraction. No effect of this intervention was observed on agonist-
induced contraction or PE-induced Ca2+ transients in isolated cells. When combined with both
intra- and extracellular acidosis (IAS) no change was observed on the PE contracture.
Interestingly, the combination of extracellular acidosis and substrate depletion (AS) significantly
reduced peak PE responses during the intervention with a trend in reduction of plateau responses
also observed. This would suggest that there was some inotropic effect of intracellular
acidification in agonist-induced contraction. No significant increase in contraction was observed
during combined intracellular acidification and substrate depletion (IS). However, there was a
significant increase in agonist-induced contraction upon reperfusion when compared to control.

181
Hypoxia caused a significant reduction in the PE contracture although some preservation of the
initial peak PE response was recorded. This is in contrast to the lack of effect seen in nerve-
mediated contractions. It is hypothesised that the reduction is a consequence of the increased
energy required to generate the agonist-induced contracture as opposed to the nerve-mediated
phasic contraction. When hypoxia was combined with both intra- and extracellular acidosis, a
trend in reduction of the PE contracture was observed. This was not significant and returned to
normal upon reperfusion. The combination of hypoxia and extracellular acidosis caused a marked
reversible reduction in tension which was greater in magnitude than that seen with a similar
intervention in nerve-mediated contraction. These findings are further evidence of the detrimental
effect of hypoxia on agonist-induced contraction. The combination of hypoxia and intracellular
acidification showed a trend towards reduction during the ischaemic intervention. This was not as
marked as that seen with hypoxia and extracellular acidosis and again was not significant. This
also lends evidence to the contraction enhancing effects of intracellular acidification in this
preparation.
Table 3.37 summarises the effect of simulated ischaemia on calcium transients in isolated CSM
cells. Both nerve-mediated and agonist-induced contraction in cavernosal smooth muscle strips is
summarised in Table 3.38. Subsequent experiments examined the effect of simulated ischaemia
on EFS-mediated relaxation.

182
Table 3.37 - Summary of effect of ischaemia on Ca2+ transients in isolated CSM
* = significant reduction compared to control, # = significant increase compared to control, p<0.05
Intervention Peak ratio signal
Control 1st response 2nd response Reperfusion 120 mM KCl
Simulated
ischaemia
(HIAS)
0.32±0.07
0.34±0.06
0.35±0.08
0.33±0.08
0.26±0.01
Hypoxia &
substrated
depletion
(HS)
0.33±0.08
0.32±0.07
0.28±0.08*
0.29±0.09
0.24±0.03
Substrate
depletion
(S)
0.44±0.09
0.40±0.07
0.39±0.06
0.42±0.07
0.29±0.10
Intra- and
extracellular
acidosis (IA)
0.35±0.11
0.38±0.15
0.38±0.15
0.36±0.12
0.28±0.08
Intracellular
acidification
(I)
0.34±0.07
0.41±0.09#
0.41±0.09#
0.34±0.07
0.29±0.08

183
Table 3.38 - Effect of components of ischaemia in various combinations on contraction in CSM
* = significant reduction compared to control, # = significant increase compared to control, p<0.05
Intervention EFS32Hz after 60 min intervention
(% control)
Plateau PE after 60 min intervention
(% control)
HIAS 20±14* 29±16*
Rapid detrimental effect. Irreversible in EFS-mediated, reversible in PE-induced contraction.
HS 14±11* 30±20*
HAS 13±11* 21±3*
HIS 12±20* 55±25*
Detrimental effect of HIAS due to combined effect of hypoxia and substrate depletion (HS)
IA 97±15 102±8
A 58±20* 103±11
I 115±6# 112±11
Intracellular acidification reversibly augments contraction. Extracellular acidosis irreversibly
inhibits nerve-mediated contraction
S 74±24* 99±16
Substrate depletion caused an irreversible reduction in nerve-mediated contraction
IAS 81±19 92±14
AS 71±21 78±9
Extracellular acidosis and substrate depletion in isolation had no effect on PE-contracture, in
combination, significant detrimental effect
IS 119±12# 103±17
Intracellular acidification limited detrimental effect of substrate depletion
H 93±20 55±15*
Hypoxia had marked reversible effect on PE contracture
HIA 78±8 76±29
HA 79±22 35±17*
Extracellular acidosis augmented detrimental effect of hypoxia on contractile function
HI 113±19 76±13
Augmentation of function by intracellular acidification is sensitive to hypoxia. Intracellular
acidification limited the detrimental effect of extracellular acidosis in the presence of hypoxia

184
3.4 Results IV – The effect of ischaemia on nerve-mediated relaxation
3.4.1 Effect of simulated ischaemia (HIAS) on nerve-mediated relaxation in CSM
Isometric nerve-mediated relaxations elicited by EFS (range 4-24 Hz) in CSM strips pre-
contracted with 15 µM PE were recorded and measured as described in section 2.3.4.
Preparations equilibrated in Tyrode’s solution for 60 min. at 37 °C. At the end of this equilibration
period, the mean plateau PE response was 0.74±0.21 mN.mm-2. The plateau PE contracture was
significantly reduced during the intervention (plateau PE30 min 53±29 % and plateau PE60 min
44±22 % of control). Tension remaining after nerve-mediated relaxation at 24 Hz (EFS24Hz) was
48±15 % of the preceding PE contracture (table 3.39 and fig. 3.38).
Table 3.39 - Effect of simulated ischaemia (HIAS) on EFS-mediated relaxation
* = significant reduction compared to control
30 min. of simulated ischaemia (HIAS) ameliorated nerve-mediated relaxation. This effect
appeared more marked at 60 min. Responses returned to normal upon reperfusion.
N=5, n=6 control 30 min HIAS 60 min HIAS Reperfusion
Plateau PE contracture
(mN.mm-2)
0.74±0.21 0.37±0.22* 0.31±0.17* 0.73±0.19
Tension remaining after
EFS24Hz (mN.mm-2)
0.35±0.12 0.19±0.17 0.18±0.16 0.28±0.19
EFS24Hz as % preceding
PE plateau contracture
48±15 45±14 52±23 38±20

185
0
20
40
60
80
100
0 5 10 15 20 25
Tensionremaining (%)
Frequency (Hz)
Fig. 3.38 – Effect of simulated ischaemia on EFS-mediated relaxation in CSM
– control, – 30 min HIAS, ◊ – 60 min HIAS, ∆ – reperfusion
Simulated ischaemia (HIAS) ameliorated nerve-mediated relaxation throughout the range of EFS
stimulation. Responses returned to normal upon reperfusion. Nerve-mediated contractile
responses were also ameliorated during simulated ischaemia (HIAS). However, contractile
responses did not recover upon reperfusion whereas relaxatory responses did during the time
course of these experiments.
In a similar manner to preceding experiments, the effects of the components of ischaemia on
EFS-mediated relaxation were examined.

186
3.4.2 Effect of isolated components of ischaemia on nerve-mediated relaxation
3.4.2.1 Effect of substrate depletion (S) on nerve-mediated relaxation
The plateau PE contracture was stable during the intervention. 60 min. of substrate depletion had
no effect on nerve-mediated relaxation (table 3.40 and fig. 3.41a).
3.4.2.2 Effect of hypoxia (H) on nerve-mediated relaxation
The plateau PE contracture was significantly reduced during the intervention. 30 min. of hypoxia
ameliorated nerve-mediated relaxation. At 60 min. relaxation was almost abolished with tension
remaining similar to that recorded after EFS stimulation in the presence of ODQ (table 3.40, fig.
3.39-40).
Control 30 min. hypoxia
60 min. hypoxia reperfusion
Fig. 3.39 – Typical experimental tracing showing effect of hypoxia on nerve-mediated relaxation
5 min.
1 mN
15 µM PE
15 µM PE
EFS (Hz) 4 8 16 24 4 8 16 24
EFS (Hz) 4 8 16 24 4 8 16 24
• • • •
• • • •
• • • •
• • • •

187
0
20
40
60
80
100
0 5 10 15 20 25
Tensionremaining (%)
Frequency (Hz)
Fig. 3.40 – Effect of hypoxia on EFS-mediated relaxation in CSM
– control, – 30 min H, ◊ – 60 min H, ∆ – reperfusion
3.4.3.2 Effect of acidosis (IA) on nerve-mediated relaxation
The plateau PE contracture was stable during the intervention. 60 min. of intra- and extracellular
acidosis had no effect on nerve-mediated relaxation (table 3.40 and fig. 3.41b).
3.4.3.2 Effect of intracellular acidification (I) on nerve-mediated relaxation
The plateau PE contracture was stable during the intervention. 60 min. of intracellular acidification
appeared to augment nerve-mediated relaxation. Relaxatory responses appeared to return to
normal upon reperfusion (table 3.40 and fig. 3.41c).
3.4.3.3 Effect of extracellular acidosis (A) on nerve-mediated relaxation
The plateau PE contracture was stable during the intervention. 60 min. of extracellular acidosis
had no effect on nerve-mediated relaxation. This is in contrast to the detrimental and irreversible
effect similar interventions had upon nerve-mediated relaxation (table 3.40 and fig. 3.41d).
Figure 3.41 – Components of ischaemia on nerve relaxation

188

189
Table 3.40 – Components of ischaemia on EFS relaxation

190
3.4.3 Combinations of components of ischaemia on nerve-mediated relaxation in CSM
3.4.3.1 Effect of hypoxia and substrate depletion (HS) on nerve-mediated relaxation in CSM
The plateau PE contracture was significantly reduced during the intervention. 60 min. of hypoxia
and substrate depletion ameliorated nerve-mediated relaxation in a time-dependent fashion in a
similar manner to the effect of simulated ischaemia (table 3.41 and fig. 3.42a).
3.4.3.2 Effect of hypoxia, extracellular acidosis and substrate depletion (HAS) on nerve-mediated
relaxation in CSM
The plateau PE contracture was significantly reduced during the intervention. 60 min. of hypoxia,
extracellular acidosis and substrate depletion ameliorated nerve-mediated relaxation. Responses
returned to normal upon reperfusion (table 3.41 and fig. 3.42b).
3.4.3.3 Effect of hypoxia, intracellular acidification and substrate depletion (HIS) on nerve-
mediated relaxation in CSM
The plateau PE contracture was significantly reduced during the intervention. 60 min. of hypoxia,
intracellular acidification and substrate depletion also ameliorated nerve-mediated relaxation.
Responses returned to normal upon reperfusion (table 3.41 and fig. 3.42c).

191
Figure 3.42 – Combination of components of ischaemia on nerve relaxation

192
Table 3.41 – Combination of components of ischaemia on EFS relaxation

193
3.4.4 Effect of combinations of acidosis and substrate depletion on nerve-relaxation
3.4.4.1 Effect of intra- and extracellular acidosis and substrate depletion (IAS)
The plateau PE contracture was stable during the intervention. 60 min. of intra- and extracellular
acidosis with substrate depletion ameliorated EFS-mediated relaxation at the lower end of the
frequency range (4 and 8 Hz). Higher frequency stimulation (16 and 24 Hz) resulted in a normal
relaxatory response (table 3.42 and fig. 3.43a).
3.4.4.2 Effect of extracellular acidosis and substrate depletion (AS)
The plateau PE contracture was significantly suppressed at 60 min. of the intervention. 60 min. of
extracellular acidosis and substrate depletion appeared to augment nerve-mediated relaxation.
This maybe artefactual and secondary to the fact that the preceding PE contracture was
significantly reduced (table 3.42 and fig. 3.43b).
3.4.4.3 Effect of intracellular acidification and substrate depletion (IS)
The plateau PE contracture was stable during the intervention. 60 min. of intracellular acidification
and substrate depletion augmented nerve-mediated relaxation. Responses returned to normal
upon reperfusion (table 3.42 and fig. 3.43c).

194
Figure 3.43 – Acidosis and substrate depletion on EFS relaxation

195
Table 3.42 – Acidosis and substrate depletion on nerve relaxation

196
3.4.5 Effect of combinations of hypoxia and acidosis on nerve-relaxation in CSM
3.4.5.1 Effect of hypoxia and acidosis (HIA)
The plateau PE contracture was significantly suppressed during the intervention. 60 min. of
hypoxia, intra- and extracellular acidosis ameliorated nerve-mediated relaxation. Responses
returned to normal upon reperfusion (table 3.43 and fig. 3.44a).
3.4.5.2 Effect of hypoxia and extracellular acidosis (HA)
The plateau PE contracture was significantly suppressed during the intervention. 60 min. of
hypoxia and extracellular acidosis ameliorated nerve-mediated relaxation. Responses returned to
normal upon reperfusion (table 3.43 and fig. 3.44b).
3.4.5.3 Effect of hypoxia and intracellular acidification (HI)
The plateau PE contracture was stable during the intervention. 60 min. of hypoxia and
intracellular acidification ameliorated nerve-mediated relaxation. Responses returned to normal
upon reperfusion (table 3.43 and fig. 3.44c).

197
Figure 3.44 - Hypoxia and acidosis on EFS relaxation

198
Table 3.43 – Hypoxia and acidosis on EFS relaxation

199
3.4.6 The effect of ischaemia on nerve relaxation summary
Simulated ischaemia (the combination of hypoxia, intra- and extracellular acidosis and substrate
depletion - HIAS) markedly reduced EFS-mediated relaxation. This is similar to the effect of HIAS
depletion on nerve-mediated contraction. Interestingly, EFS-mediated relaxation recovered upon
reperfusion whereas nerve-mediated contraction did not during the time course of these
experiments. The combination of hypoxia and substrate depletion produced a similar response to
simulated ischaemia (HIAS) on nerve-mediated relaxation and was again reversible upon
reperfusion. No difference was seen when hypoxia and substrate depletion were combined with
either intra- or extracellular acidosis. In summary, the combination of hypoxia and substrate
depletion, with or without acidosis, markedly reduced the effect of nerve-mediated relaxation.
Similar interventions severely and irreversibly reduced nerve-mediated contractile responses.
Combined intra- and extracellular acidosis had no effect on EFS-mediated relaxatory responses.
Extracellular acidosis again had no effect. Intracellular acidification augmented the effect of
nerve-mediated relaxation. This is similar to the effect of intracellular acidification on nerve-
mediated contraction. The augmentation of response seen was reversible upon reperfusion.
30 min. of hypoxia markedly reduced nerve-mediated relaxation. At 60 min., relaxatory responses
were almost abolished with residual relaxation in response to EFS similar to that seen during EFS
relaxation in the presence of the soluble guanyl cyclase inhibitor ODQ. Simultaneous acidosis
(intra- and extracellular acidosis in isolation and combination) did not ameliorate the inhibitory
effect of hypoxia on nerve-mediated relaxation. All responses on nerve-mediated relaxation were
reversible upon reperfusion with normoxic Tyrode’s solution.

200
60 min. of substrate depletion had no effect on EFS-mediated relaxation. Longer periods of
intervention were not examined. Simultaneous intra-and extracellular acidosis ameliorated
relaxation in response to low frequency EFS, sparing responses to higher frequency stimulation.
Extracellular acidosis and substrate depletion (AS) appeared to augment relaxation. However,
this observation may be artefactual as the preceding PE contracture during AS depletion was
significantly decreased. EFS-mediated contraction in sub-maximally precontracted muscle strips
caused a proportionally increased EFS-mediated relaxatory response (EFS-relaxation in strips
precontracted with 15 µM vs. 1.5 µM PE). In a similar manner to nerve-mediated contraction, the
augmentation of relaxatory responses seen during intracellular acidification persisted in the
presence of substrate depletion.
The effect of simulated ischaemia on nerve-mediated relaxation in CSM is summarised in Table
3.44. Following this the effect of ischaemia on agonist-induced relaxation was examined.

201
Table 3.44 - Effect of components of ischaemia applied in various combinations on nerve-
mediated relaxation in CSM
Intervention Nerve-mediated contraction Nerve-mediated relaxation
HIAS suppressed, irreversible suppressed, reversible
Rapid detrimental effect. Irreversible in nerve contraction, reversible in nerve relaxation
HS suppressed, irreversible suppressed, reversible
HAS suppressed, irreversible suppressed, reversible
HIS suppressed, irreversible suppressed, reversible
Detrimental effect of HIAS due to combined effect of hypoxia and substrate depletion (HS). Effect
on nerve-mediated relaxation reversible
IA no effect no effect
A suppressed, irreversible no effect
I augmented, reversible augmented, reversible
Intracellular acidification reversibly augments nerve-mediated responses. Extracellular acidosis
irreversibly inhibits nerve-mediated contraction
S suppressed, irreversible no effect
Substrate depletion caused an irreversible reduction in nerve-mediated contraction
IAS suppression at low frequency,
reversible
suppression at low frequency,
reversible
AS suppression, reversible ? augmented,? no effect
Extracellular acidosis and substrate depletion suppressed nerve-mediated contraction
IS augmented, reversible augmented, reversible
Intracellular acidification limited detrimental effect of substrate depletion. Mechanism of
augmentation not sensitive to substrate depletion
H no effect abolished, reversible
Hypoxia had marked reversible effect on relaxation
HIA suppressed, reversible suppressed, reversible
HA suppressed, reversible suppressed, reversible
HI no effect suppressed, reversible
Augmentation of nerve-mediated function by intracellular acidification is sensitive to hypoxia.

202
3.5 Results V – The effect of ischaemia on agonist-induced relaxation
3.5.1 Effect of simulated ischaemia on agonist-induced relaxation
Isometric relaxation in response to 1 µM carbachol (C) muscle strips pre-contracted with 15 µM
phenylephrine (PE) were recorded as described in section 2.3.5. Preparations equilibrated in
Tyrode’s solution for 60 min. at 37 °C. At the end of this period, PE was added to the superfusing
solution and the resulting contracture recorded. Once this had reached a plateau, relaxation in
response to carbachol was examined. The effect of 60 min. of simulated ischaemia was
examined on both the nadir and plateau C relaxation. The plateau PE contracture was
significantly reduced during the intervention (plateau PE30 min 36±35 % and plateau PE60 min
29±16 % of control). Tension was derived from height above baseline of the contracture
remaining after the intervention (table 3.45 and fig. 3.45).
0
20
40
60
80
100
60 min NT 30 min HIAS 60 min HIAS reperfusion
% preceding plateauPE contracture
Intervention
Fig. 3.45 – The effect of simulated ischaemia (HIAS) on carbachol-induced relaxation in CSM
nadir carbachol relaxation, plateau carbachol relaxation,
* significant increase compared to control
* * * *

203
Table 3.45 - Effect of simulated ischaemia (HIAS) on agonist-induced relaxation
# = p<0.05 compared to control
Simulated ischaemia (HIAS) abolished the relaxatory effect of carbachol. This effect recovered
completely upon reperfusion.
N=6, n=6 Control 30 min HIAS 60 min HIAS Reperfusion
Plateau PE contracture
(mN.mm-2)
0.70±0.53 0.18±0.17* 0.16±0.08* 0.60±0.43
Nadir C relaxation (mN.mm-2) 0.45±0.41 0.16±0.14 0.15±0.08 0.30±0.22
Nadir C relaxation as % of
preceding PE contracture
64±25 93±7# 92±10# 55±27
Plateau C relaxation
(mN.mm-2)
0.52±0.43 0.18±0.13 0.16±0.09 0.37±0.25
Plateau C relaxation as % of
preceding PE contracture
74±16 91±6# 96±10# 63±20
In a similar manner to preceding experiments, the effects of the individual components of
ischaemia on agonist-induced relaxation were examined.

204
3.5.2 Effect of isolated components of ischaemia on agonist-induced relaxation
The effects of the components of simulated ischaemia for 120 min. were recorded on both the
nadir and plateau C relaxation.
3.5.2.1 Effect of substrate depletion (S) on agonist-induced relaxation in CSM
The plateau PE contracture was stable during the intervention. Substrate depletion had no effect
on the agonist-induced relaxation (table 3.46 and fig. 3.47a).
3.5.3.1 Effect of hypoxia (H) on agonist-induced relaxation in CSM
The plateau PE contracture was significantly ameliorated during the intervention. 30 min. of
hypoxia abolished agonist-induced relaxation. This effect persisted at 120 min. of the intervention.
Carbachol-induced relaxation recovered completely upon reperfusion (table 3.46 and fig. 3.46).
0
20
40
60
80
100
60 min NT 30 min H 60 min H 120 min H reperfusion
% preceding plateauPE contracture
Intervention
Fig. 3.46 – The effect of hypoxia (H) on carbachol-induced relaxation in CSM
nadir C relaxation, plateau C relaxation
* significant increase compared to control
* * * * * *

205
3.5.2.2 Effect of acidosis (IA) on agonist-induced relaxation in CSM
The plateau PE contracture was stable during the intervention. Combined intra- and extracellular
acidosis had no effect on agonist-induced relaxation (table 3.46 and fig. 3.47b).
3.5.2.3 Effect of extracellular acidosis (A) on agonist-induced relaxation in CSM
The plateau PE contracture was stable during the intervention. Extracellular acidosis had no
effect on agonist-induced relaxation (table 3.46 and fig. 3.47c).
3.5.2.4 Effect of intracellular acidification (I) on agonist-induced relaxation in CSM
The plateau PE contracture was significantly augmented at 30 min. but not at 60 or 120 min.
Intracellular acidification had no effect on agonist-induced relaxation (table 3.46 and fig. 3.47d).

206
Figure 3.47 – Components of ischaemia on carbachol relaxation

207
Table 3.46 - Components of ischaemia on carbachol relaxation

208
3.5.3 Effect of combinations of components of ischaemia on agonist-induced relaxation
The effects of ischaemia component combinations for 60 min. were recorded on both the nadir
and plateau C relaxation.
3.5.3.1 Effect of hypoxia and substrate depletion on agonist-induced relaxation in CSM
The plateau PE contracture was significantly ameliorated during the intervention. Hypoxia and
substrate depletion ameliorated agonist-induced relaxation at 30 min. although this effect was not
significant. At 60 min. relaxation was abolished under these conditions. Responses returned to
normal upon reperfusion (table 3.47 and fig. 3.48a).
3.5.3.2 Effect of hypoxia, extracellular acidosis and substrate depletion on agonist-relaxation
The plateau PE contracture was significantly ameliorated during the intervention. The
combination of hypoxia, extracellular acidosis and substrate depletion abolished agonist-induced
relaxation at 30 min. and 60 min. Responses recovered completely upon reperfusion (table 3.47
and fig. 3.48b).
3.5.3.3 Effect of hypoxia, intracellular acidification and substrate depletion on agonist-relaxation
The plateau PE contracture was significantly ameliorated during the intervention. Hypoxia,
intracellular acidification and substrate depletion ameliorated agonist-induced relaxation during
the intervention. This effect was not significant (table 3.47 and fig. 3.48c).

209
Figure 3.48 – Combination of components of ischaemia on carbachol relaxation

210
Table 3.47 - Combination of components of ischaemia on carbachol relaxation

211
3.5.4 Combinations of acidosis and substrate depletion on agonist-induced relaxation
The effects of combinations of acidosis and substrate depletion for 60 min. were recorded on both
the nadir and plateau C relaxation.
3.5.4.1 Effect of acidosis and substrate depletion (IAS)
The plateau PE contracture was stable during the intervention. 60 min. of simultaneous intra- and
extracellular acidosis with substrate depletion had no effect on agonist-induced relaxation (table
3.48 and fig. 3.49a).
3.5.4.2 Effect of extracellular acidosis and substrate depletion (AS)
The plateau PE contracture was stable during the intervention. Extracellular acidosis and
substrate depletion had no effect on agonist-induced relaxation (table 3.48 and fig. 3.49b).
3.5.4.3 Effect of intracellular acidification and substrate depletion (IS)
The plateau PE contracture was stable during the intervention and demonstrated a significant
increase upon reperfusion. Intracellular acidification and substrate depletion had no effect upon
agonist-induced relaxation (table 3.48 and fig. 3.49c).

212
Figure 3.49 – Acidosis and substrate depletion on carbachol relaxation

213
Table 3.48 - Acidosis and substrate depletion on carbachol relaxation

214
3.5.5 Effect of combinations of hypoxia and acidosis on agonist relaxation in CSM
The effects of combinations of hypoxia and acidosis for 60 min. were recorded on both the nadir
and plateau C relaxation.
3.5.5.1 Effect of hypoxia and acidosis (HIA)
The plateau PE contracture was stable during the intervention. Intra- and extracellular acidosis
ameliorated the detrimental effect of hypoxia on agonist-induced relaxation (table 3.49 and fig.
3.50a).
3.5.5.2 Effect of hypoxia and extracellular acidosis (HA)
The plateau PE contracture was significantly depressed during the intervention. Hypoxia and
extracellular acidosis had no significant effect on agonist-induced relaxation (table 3.49 and fig.
3.50b).
3.5.5.3 Effect of hypoxia and intracellular acidification (HI)
The plateau PE contracture was stable during the intervention. Intracellular acidification did not
limit the detrimental effect of hypoxia; relaxation was abolished with this combination of
interventions (table 3.49 and fig. 3.50c).

215
Figure 3.50 – Hypoxia and acidosis on carbachol relaxation

216
Table 3.49 - Hypoxia and acidosis on carbachol relaxation

217
3.5.6 Summary of the effect of ischaemia on CSM relaxation
Simulated ischaemia (the combination of hypoxia, intra- and extracellular acidosis and substrate
depletion - HIAS) markedly reduced EFS-mediated relaxation and abolished agonist-induced
responses. These detrimental effects were completely reversible upon return to normoxic
Tyrodes solution. The effect on nerve-mediated contraction was secondary to the combination of
hypoxia and substrate depletion (HS). However, agonist-induced relaxation was initially
preserved with HS depletion with only a trend towards reduced relaxation at 30 min. Relaxation
was abolished at 60 min. of this intervention. Hypoxia, intracellular acidification and substrate
depletion (HIS) again showed a trend towards reduction of the carbachol relaxation during the
intervention which was not significant. When hypoxia and substrate depletion were combined with
extracellular acidosis, similar observations were made to those during simulated ischaemia
(HIAS) with relaxation reversibly abolished at 30 and 60 min. In summary, the combination of
hypoxia and substrate depletion, with or without acidosis, markedly reduced the effect of nerve-
mediated relaxation. Agonist-induced relaxation was similarly affected by the combination of
hypoxia, extracellular acidosis and substrate depletion.
Combined intra- and extracellular acidosis had no effect on EFS-mediated relaxatory responses.
Extracellular acidosis again had no effect. Intracellular acidification reversibly augmented the
effect of nerve-mediated relaxation. None of these interventions had any effect on agonist-
induced relaxation.
30 min. of hypoxia markedly reduced nerve-mediated relaxation. At 60 min., relaxatory responses
were almost abolished with residual relaxation in response to EFS similar to that seen during EFS
relaxation in the presence of the soluble guanyl cyclase inhibitor ODQ. Agonist-induced relaxation
was abolished at 30 min. and 60 min. of hypoxia. Simultaneous acidosis (intra- and extracellular

218
acidosis in isolation and combination) did not ameliorate the inhibitory effect of hypoxia on nerve-
mediated relaxation. However, agonist-induced relaxation in the presence of similar interventions
was affected. Simultaneous intra-and extracellular acidosis with hypoxia (HIA) ameliorated the
effect of hypoxia on relaxatory responses. Carbachol relaxation during HIA depletion was similar
to control. Experiments conducted in the presence of hypoxia and extracellular acidosis or
intracellular acidification showed this preservation of relaxation in the presence of hypoxia to be
secondary to a reduction of pH in the extracellular compartment.
60 min. of substrate depletion had no effect on EFS-mediated or agonist-induced relaxation. In a
similar manner to nerve-mediated contraction, the augmentation of nerve-mediated relaxatory
responses seen during intracellular acidification persisted in the presence of substrate depletion.
Simultaneous substrate depletion with intra- and/or extracellular acidosis had no effect on
agonist-induced relaxation.
The effect of simulated ischaemia on relaxation in CSM is summarised in table 3.50.

219
Table 3.50 - Effect of components of ischaemia applied in various combinations on CSM
relaxation
Intervention Nerve-mediated relaxation Agonist-induced relaxation
HIAS suppressed, reversible abolished, reversible
Rapid detrimental effect. Reversible upon reperfusion
HS suppressed, reversible 30 min suppressed, 60 min abolished
HAS suppressed, reversible abolished, reversible
HIS suppressed, reversible suppressed, reversible
Detrimental effect of HIAS due to combined effect of hypoxia, extracellular acidosis and substrate
depletion (HAS). Effect reversible upon reperfusion
IA no effect no effect
A no effect no effect
I augmented, reversible no effect
Intracellular acidification reversibly augments nerve-mediated responses
S no effect no effect
IAS suppression at low frequency,
reversible
no effect
AS ? augmented,? no effect no effect
Extracellular acidosis and substrate depletion suppressed nerve-mediated contraction
IS augmented, reversible no effect
Intracellular acidification limited detrimental effect of substrate depletion on contraction.
Mechanism of augmentation not sensitive to substrate depletion
H abolished, reversible abolished, reversible
Hypoxia had marked reversible effect on relaxation
HIA suppressed, reversible no effect
HA suppressed, reversible no effect
HI suppressed, reversible abolished, reversible
Extracellular acidosis limited effect of hypoxia on carbachol-induced relaxation

220
3.6 Results VI – The effect of low temperature on CSM contractile function
3.6.1 Generation of low temperature solutions
The effect on CSM contractile function of reducing the superfusing solution to 21±1.0 °C (room
temperature Tyrode’s) or 10±3 °C (chilled Tyrode’s) was recorded (section 2.3.6). Tyrode’s
solution at 37 °C was gassed with a 95% O2/5% CO2 mixture (pH 7.39±0.01). This solution at
reduced temperature was acidotic (21 °C Tyrode’s – pH 7.20±0.01, 13 °C Tyrode’s pH
6.95±0.04). Reduced temperature interventions were therefore compared to similar experiments
at 37 °C in acidotic Tyrode’s solution (Tyrode’s gassed with a 90% O2/10% CO2 mixture - pH
6.96±0.03). This was chosen as the comparator due to time constraints. The alternative would be
to alter extracellular buffer concentration to compensate for increased CO2 solubility.
3.6.2 Effect of low temperature on nerve-mediated contractions
Isometric nerve-mediated contractions elicited by EFS (range 8-60 Hz) were recorded as
described in section 2.3.4. Preparations were equilibrated in Tyrode’s solution for 60 min. at
37°C. At the end of this period, the mean nerve-mediated tension at 32 Hz (EFS32Hz) was
0.46±0.24 mN.mm-2 (N=6, n=10) and was 58±11% of the estimated maximal tension (Tmax) from
the force-frequency curves. The mean half-maximal frequency (f½) under these control conditions
was 27.7±8.3 Hz. The effect of temperature reduction to 21 °C on nerve-mediated contraction
was examined (figs. 4.1 and 4.2 and table 4.1). For comparison, combined intra- and extracellular
acidosis at 37 °C had no effect on the parameters measured during a similar time course (section
3.2.2.3).

221
Table 4.1 - Effect of temperature reduction to 21 °C on nerve-mediated contraction
* p<0.05 compared to control.
Reduction of superfusate temperature to 21 °C for 30 min. significantly reduced both the mean
EFS32Hz to 56±14% and f½ to 14.7±2.0 Hz. Parameters returned to control values upon
reperfusion with Tyrode’s solution at 37 °C for 60 min.
N=5, n=5 Control 30 min 21°C 60 min 21°C Reperfusion
pH 7.39±0.01 7.20±0.01 7.39±0.01
EFS32Hz
(mN.mm-2)
0.42±0.24 0.25±0.18 * 0.26±0.17 *
0.40±0.24
EFS32Hz
As % control
- 56±14 * 61±14 * 95±21
EFSf½ as % of
control (%)
- 35 33 114
f½ (Hz) 31.6±9.6 14.7±2.0 * 14.3±1.6 * 40.9±31.6
8 16 24 32 40 60 8 16 24 32 40 60 8 16 24 32 40 60 8 16 24 32 40 60
Control (37 °C) 30 min at 21°C 60 min 21°C Reperfusion
Fig. 4.1 - Typical experimental tracing temperature reduction to 21 °C on nerve-mediated
contraction (EFS 8-60 Hz)
1 mN
2 min
• • • • • • • • • • • • • • • • • • • • • • • •

222
0
0.1
0.2
0.3
0.4
0.5
0.6
0 10 20 30 40 50 60 70
Tension
(mN/mm2)
Frequency (Hz)
Fig. 4.2 – Effect of temperature reduction to 21 °C on nerve-mediated contraction
– control, - 30 min 21 °C , ◊ – 60 min 21 °C , ∆ – reperfusion
* significant reduction compared to control (p<0.05)
When expressed as a percentage of EFSf½ under control conditions, EFSf½ after 30 min. of
reduced temperature was significantly reduced at 21 °C to 35%.
Similar experiments were carried out examining the effect of temperature reduction to 13 °C on
nerve-mediated contraction (figs. 4.3 and 4.4 and table 4.2).
* * * *

223
Table 4.2 - Effect of temperature reduction to 13 °C on nerve-mediated contraction
* = p<0.05 compared to control
Reduction of superfusate temperature to 13 °C for 30 min. significantly reduced both the mean
EFS32Hz to 52±6% and f½ to 10.5±2.4 Hz. Parameters returned to control values upon reperfusion
with Tyrode’s solution at 37 °C for 60 min.
N=5, n=5 Control 30 min 13°C 60 min 13°C Reperfusion
pH 7.38±0.01 6.95±0.04 7.38±0.01
EFS32Hz
(mN.mm-2)
0.50±0.27 0.26±0.15 * 0.25±0.17 *
0.49±0.29
EFS32Hz
As % control
- 52±6 * 51±9 * 99±15
EFSf½ as % of
control (%)
-
38 35 98
f½ (Hz) 23.8±4.9 10.5±2.4 * 11.2±2.7 * 23.5±8.0
8 16 24 32 40 60 8 16 24 32 40 60 8 16 24 32 40 60 8 16 24 32 40 60
Control (37 °C) 30 min at 13°C 60 min 13°C Reperfusion
Fig. 4.3 – Typical experimental tracing of effect of temperature reduction to 13 °C on nerve-
mediated contraction (EFS 8-60 Hz)
1 mN
2 min
• • • • • • • • • • • • • • • • • • • • • • • •

224
0
0.1
0.2
0.3
0.4
0.5
0.6
0.7
0 10 20 30 40 50 60 70
Tension
(mN/mm2)
Frequency (Hz)
Fig. 4.4 – Effect of temperature reduction to 13 °C on nerve-mediated contraction
– control, - 30 min 13 °C , ◊ – 60 min 13 °C , ∆ – reperfusion
* significant reduction compared to control (p<0.05)
When expressed as a percentage of EFSf½ under control conditions, EFSf½ after 30 min. of
reduced temperature was significantly reduced at 13 °C to 38%.
* * * *

225
It was postulated that the amelioration of tension generated in response to EFS at reduced
temperature could be secondary to reduced motor nerve recruitment. To investigate this
possibility the effect of increasing voltage on EFS contractions was recorded. At 37 °C,
increasing voltage (40-80 V) increased force of TTX-sensitive contraction. However, above 50 V,
this increase in contractile force was not significant (section 3.1.1.3).
0
20
40
60
80
100
40 50 60 70 80
% control EFS32Hz
Voltage (V)
Fig. 4.5 – Effect of reduced temperature to 21°C on EFS32Hz contraction at differing voltages
(N=4, n=6), Voltage range 40-80 V.
A reduction to 21 °C for 30 min. depressed the EFS response (8-60 Hz) in a consistent manner
from 40 V to 80 V. EFS32Hz at 40 V were significantly reduced to 69±17% of control, at 50 V to
68±18% of control with EFS returning to normal upon reperfusion. Recordings were similar
throughout the frequency range at 60 V, 70 V and 80 V. These findings are consistent with nerve
recruitment not contributing to the reduced magnitude of EFS contractions at 21 °C.
Experiments were repeated at 13 °C.

226
0
20
40
60
80
100
45 50 55 60 65 70 75
% control EFS32Hz
Voltage (V)
Fig. 4.6 – Effect of reduced temperature to 13°C on EFS32 Hz contraction at differing voltages
(N=4, n=6), Voltage range 50-70 V.
13 °C for 30 min. consistently reduced the EFS response between 50 V and 70 V. EFS32Hz at 50
V were significantly reduced to 35.4±13.5% of control with similar results recorded at 60 V and 70
V. All responses returned to normal upon reperfusion with Tyrode’s at 37 °C. These findings are
consistent with nerve recruitment not contributing to the reduced magnitude of EFS contractions
at 13 °C.
To assess whether low temperature affected the time course of the phasic contraction, the paper
speed was increased to 25 mm.s-1 for the final 60 Hz stimulation of each force-frequency
estimation in these voltage experiments. The time-constant (τ) was measured as described in
section 2.3.4 (Table 4.3).

227
Table 4.3 - Effect of reduced temperature to 13°C on time constants of nerve-mediated
contraction
* p<0.05 compared to control
At 50 V, the time-constant of the relaxatory phase (τrelaxation) at 13°C almost doubled. significantly
prolonged from 5.5±0.7 s to 9.9±3.0 s. At 60 V and 70 V both the time-constant of the contractile
phase (τcontraction) and τrelaxation were significantly prolonged. The time-constant of the relaxatory
phase was proportionately more prolonged compared to that of the contractile phase (60 V
τcontraction 130±11% control, τrelaxation 173±53% control). All responses returned to control values
upon reperfusion.
N=5, n=5 Control
37 °C
Intervention
13 °C
Reperfusion
37 °C
τcontraction (s) 2.6±0.4 2.7±0.6 2.3±0.2 50 V
τrelaxation (s) 5.5±0.7 9.9±3.0 * 5.9±1.0
τcontraction (s) 2.3±0.2 3.0±0.4 * 2.3±0.2 60 V
τrelaxation (s) 6.0±0.7 10.3±2.8 * 6.5±0.8
τcontraction (s) 2.4±0.4 3.3±0.5 * 2.4±0.4 70 V
τrelaxation (s) 6.6±0.6 10.1±2.5 * 6.8±0.8
These findings may be due to changes in the biomechanical properties of the tissue and/or
molecular mechanisms mediating contraction and relaxation. This was further explored in section
3.6.6. Subsequent experiments examined the effect of reduced temperature on nerve-mediated
relaxation.

228
3.6.3 Effect of low temperature on nerve-mediated relaxation
Isometric nerve-mediated relaxations were elicited in response to EFS (range 4-24 Hz) in pre-
contracted muscle strips as described in section 2.3.4. Preparations equilibrated in Tyrode’s
solution for 60 min. at 37 °C. At the end of this equilibration period, the mean plateau PE
response was 0.44±0.20 mN.mm-2. The plateau PE contracture was stable during the
intervention. Tension remaining after nerve-mediated relaxation at 24 Hz (EFS24Hz) was
0.26±0.15 mN.mm-2 (58±21 % of the preceding PE contracture). Reduction in superfusate
temperature to 21°C on nerve-mediated relaxation was examined (table 4.4 and fig. 4.7).
0
20
40
60
80
100
0 5 10 15 20 25
Tensionremaining (%)
Frequency (Hz)
Fig. 4.7 – Effect of reduced temperature to 21 °C on nerve-mediated relaxation
– control, - 30 min 21 °C , ◊ – 60 min 21 °C , ∆ – reperfusion
The trend for nerve-mediated relaxation was to increase in magnitude with time (section 3.1.3.1).
Reduction in superfusate temperature to 21 °C suppressed this trend; relaxatory responses
remained at control values for the duration of the intervention. Return to 37 °C brought about a
return to the normal trend.

229
Table 4.4 - Effect of reduced temperature to 21°C on nerve-mediated relaxation
N=7, n=8 Control
37 °C
30 min
21 °C
60 min
21°C
Reperfusion
37 °C
Plateau PE contracture
(mN.mm-2)
0.44±0.20 0.50±0.24 0.42±0.20 0.47±0.24
Tension remaining after EFS24Hz
(mN.mm-2)
0.26±0.15 0.29±0.16 0.25±0.14 0.23±0.17
EFS24Hz as % preceding PE
plateau contracture
58±21 56±24 57±26 46±24
A reduction of superfusate temperature to 13°C was subsequently examined (fig. 4.8 and table
4.5).
Preparations were equilibrated in Tyrode’s solution for 60 min. at 37 °C. At the end of this
equilibration period, the mean plateau PE response was 0.64±0.28 mN.mm-2. The plateau PE
contracture was stable during the intervention. Tension remaining after nerve-mediated relaxation
at 24 Hz (EFS24Hz) was 0.41±0.16 mN.mm-2 (65±7 % of the preceding PE contracture). The
effect of reduction to 13°C on nerve-mediated relaxation was recorded. In comparison, 60 min of
intra- and extracellular acidosis (IA) had no effect on nerve-mediated relaxation (section 3.4.2.3,
page 171).

230
Table 4.5 - Effect of reduction to 13°C on nerve-mediated relaxation
Amelioration of EFS relaxation was more marked than that noted during a reduction of Tyrode’s
to 21°C.
N=7, n=8 Control
37 °C
30 min
13 °C
60 min
13°C
Reperfusion
37 °C
Plateau PE contracture
(mN.mm-2)
0.64±0.28 0.66±0.35 0.59±0.34 0.67±0.29
Tension remaining after EFS24Hz
(mN.mm-2)
0.41±0.16 0.50±0.25 0.44±0.22 0.39±0.18
EFS24Hz as % preceding PE
plateau contracture
65±7 77±10 77±9 58±11
0
20
40
60
80
100
0 5 10 15 20 25
Tensionremaining (%)
Frequency (Hz)
Fig. 4.8 – Effect of reduced temperature to 13°C on nerve-mediated relaxation
– control, - 30 min 13 °C , ◊ – 60 min 13 °C , ∆ – reperfusion

231
Reduction in superfusate temperature to 13 °C significantly depressed nerve-mediated
relaxation. Responses returned to normal upon reperfusion at 37 °C.
Low temperature superfusate reduced the magnitude of nerve-mediated relaxation in CSM. In
addition, the time course of EFS relaxation appeared to be markedly affected at these reduced
temperatures. To examine this, a similar set of experiments were conducted as described in
section 2.3.4. These also involved pre-contracting the tissue with 15 µM PE after a period
equilibration in Tyrode’s solution at 37 °C. Once the contracture had reached a plateau, a single
pulse train of EFS at 16 Hz was used to elicit a relaxation (EFS16Hz). This protocol was repeated
at low temperature and upon reperfusion (table 4.6).
Table 4.6 - Effect of reduced temperature to 13°C on time constants of EFS16 Hz relaxations
* p<0.05 compared to control
The time-constant of relaxation (τrelaxation) was unaffected by low temperature superfusion fluids.
However, contraction following EFS mediated relaxation was significantly prolonged at 13 °C and
returned to control values upon reperfusion.
N=4, n=6 Control
37 °C
Intervention
13 °C
Reperfusion
37 °C
τrelaxation (s) 11.0±1.1 16.0±7.7 12.7±3.7
τcontraction (s) 64.7±14.2 125.3±33.4 * 54.0±12.8
3.6.4 Effect of low temperature on agonist-induced contractures
Isometric agonist-induced contractures were recorded as described in section 2.3.5. At the end of
the equilibration period, mean peak tension achieved was 0.57±0.22 mN.mm-2 and mean plateau
tension was 0.48±0.18 mN.mm-2 (N=6, n=6). The effect of a reduction in superfusate temperature

232
to 21 °C for 60 min was recorded (table 4.7). In comparison up to 120 min. of intra- and
extracellular acidosis on PE-contractures had no effect on the magnitude of PE contractures
(section 3.3.4.4 - page 165 and table 3.32 - page 166).
Table 4.7 - Effect of reduction of temperature to 21°C on agonist-induced contractures
A reduction of temperature to 21°C had no effect on the magnitude of the PE contracture.
Intervention Peak tension (mN.mm-2) Plateau tension (mN.mm-2)
60 min 37 °C Tyrodes 0.57±0.22 0.48±0.18
30 min 21 °C Tyrodes 0.59±0.23 0.54±0.24
60 min 21 °C Tyrodes 0.52±0.21 0.51±0.22
Reperfusion at 37 °C 0.58±0.21 0.52±0.20
The effect of a reduction to 13 °C was also examined. The mean peak tension achieved after
equilibration was 0.59±0.21 mN.mm-2 (N=5, n=5) and mean plateau tension was 0.51±0.21
mN.mm-2 (table 4.8).
Table 4.8 - Effect of reduction of temperature to 13°C on agonist-induced contractures
A reduction to 13 °C for 60 min had no effect on the magnitude of the PE contracture.
Intervention Peak tension (mN.mm-2) Plateau tension (mN.mm-2)
60 min 37 °C Tyrodes 0.59±0.21 0.51±0.21
30 min 21 °C Tyrodes 0.64±0.25 0.58±0.27
60 min 21 °C Tyrodes 0.56±0.27 0.55±0.27
Reperfusion at 37 °C 0.70±0.27 0.58±0.26

233
To examine whether low temperature had an effect on the duration of these agonist-induced
contractures, the time-constants were measured as shown in section 2.3.5 and fig. 2.9 (page 80).
Table 4.9 - Effect of reduction of temperature to 21 °C on tonic contracture time-constants
* p<0.05 compared to control
Both the time-constant of the contractile phase (τcontraction) and that of the relaxatory phase
(τrelaxation) were significantly prolonged during superfusion with Tyrode’s solution at 21 °C with the
former parameter more severely affected. Time-constants of agonist-induced contractures during
simultaneous intra- and extracellular acidosis were unaffected.
N=5, n=5 37 °C 30 min 21 °C 60 min 21 °C reperfusion
τcontraction (s) 83±41 120±41 * 195±62 * 173±218
τrelaxation (s) 270±56 413±135 * 405±97 * 263±113
Table 4.10 - Effect of reduction of temperature to 13 °C on tonic contracture time-constants
* p<0.05 compared to control
Again both the time-constant of the contractile phase (τcontraction) and that of the relaxatory phase
(τrelaxation) were significantly prolonged during superfusion with reduced temperature Tyrode’s
solution with the former parameter more severely affected.
N=5, n=5 37 °C 30 min 13 °C 60 min 13 °C 37 °C
τcontraction (s) 68±31 105±17 * 165±57 * 68±31
τrelaxation (s) 270±41 420±81 * 435±98 * 263±53

234
3.6.5 Effect of low temperature on agonist-induced relaxation
Isometric relaxation in response to 1 µM carbachol (C) muscle strips pre-contracted with 15 µM
phenylephrine (PE) were recorded as described in section 2.3.5. Preparations equilibrated in
Tyrode’s solution for 60 min. at 37 °C. At the end of this period, PE was added to the superfusing
solution and the resulting contracture recorded. Once this had reached a plateau, relaxation in
response to carbachol was recorded. The effect of 60 min. of reduction to 21 °C and 13 °C was
examined on both the nadir and plateau C relaxation (tables 4.11 and 4.12). For comparison,
simultaneous intra- and extracellular acidosis at 37 °C had no effect on carbachol relaxation
(section 3.5.2.3 and table 3.46 – page 207).
Table 4.11 – Effect of reduced temperature to 21°C on agonist-induced relaxation
The plateau PE contracture was stable during the intervention. No change in agonist-induced
relaxation was observed during reduction of superfusate temperature to 21 °C.
N=6, n=6 Control
37 °C
30 min
21 °C
60 min
21 °C
Reperfusion
37 °C
Plateau PE contracture
(mN.mm-2)
0.48±0.18 0.54±0.24
0.51±0.22 0.52±0.20
Nadir C relaxation (mN.mm-2) 0.30±0.14 0.29±0.13 0.30±0.14 0.29±0.15
Nadir C relaxation as % of
preceding PE contracture
63±22 56±18 62±23 57±24
Plateau C relaxation
(mN.mm-2)
0.33±0.15 0.29±0.13 0.30±0.14 0.31±0.15
Plateau C relaxation as % of
preceding PE contracture
69±19 57±19 63±24 63±23

235
Table 4.12 – Effect of reduced temperature to 13°C on agonist-induced relaxation
The plateau PE contracture was stable during the intervention. No change in agonist-induced
relaxation was observed during reduction of superfusate temperature to 13 °C.
N=5, n=5 Control
37 °C
30 min
13 °C
60 min
13 °C
Reperfusion
37 °C
Plateau PE contracture (mN.mm-2) 0.59±0.21 0.64±0.25 0.56±0.27 0.70±0.27
Nadir C relaxation (mN.mm-2) 0.34±0.17 0.34±0.22 0.34±0.23 0.30±0.19
Nadir C relaxation as % of preceding
PE contracture
65±15 57±18 57±21 49±19
Plateau C relaxation (mN.mm-2) 0.34±0.17 0.35±0.21 0.34±0.23 0.33±0.19
Plateau C relaxation as % of
preceding PE contracture
66±16 58±18 58±23 54±18
3.6.6 Effect of low temperature on stiffness of CSM
In order to examine whether the changes in CSM function identified were due to changes in the
biomechanical properties of the tissue at low temperature, the stress / strain characteristics in
chilled Tyrode’s were compared as described in section 2.4.2.
Strips were placed under similar strains during control, intervention and reperfusion phases of the
experiments (0.5±0.8 %, 0.5±0.7 % and 0.6±0.9 % respectively). During each phase of the
experiment a linear relationship between stress and strain was confirmed as described in section
2.4.2. A diagrammatic representation of a typical strip response to an instantaneous stress is
shown in fig. 4.9.

236
The viscous component of instantaneous stress (fig. 4.9 – A) was significantly reduced at low
temperature (control 37 °C, 26.9±10.4 kPa/mm vs. intervention 13 °C, 24.7±9.9 kPa/mm)
returning to control values upon reperfusion (table 4.13). The time-constant of the relaxation to
steady-state stress (fig. 4.9 – k) was unaffected by low temperature and remained at control
values upon reperfusion.
The steady-state component of stress (fig. 4.9 – C) was significantly increased at low temperature
(control 37 °C, 47.8±38.5 kPa/mm vs. intervention 13 °C, 53.4±43.5 kPa/mm) returning to control
values upon reperfusion.
When A was expressed as a percentage of the total instantaneous stress (A+C), no difference
was seen during intervention or upon reperfusion (table 4.13).
C
A
Fig. 4.9 – Diagram of typical strip response to instantaneous stress A – Magnitude of viscous component of strain. C – Magnitude of steady-state component of
strain. k – time-constant of relaxation following instantaneous stress.
2 kPa
30 s
k

237
Young’s modulus (e) was increased at cold temperature and returned towards control values
upon reperfusion. However these changes were not statistically significant (control 37 °C,
57.0±6.4, intervention 13 °C, 71.6±17.2, reperfusion 37 °C, 45.4±20.2).
Table 4.13 – Stress/strain characteristics of CSM at low temperature, 13°C
* p<0.05 compared to control
These findings indicate that CSM becomes stiffer at low temperature and that this increase in
stiffness is matched by a concurrent reduction in the viscous component of the tissue. The time-
constant of relaxation at reduced temperatures is unchanged; changes in contraction and
relaxation characteristics seen in sections 3.6.2, 3.6.3 and 3.6.4 cannot be explained by changes
in the biomechanical properties of the tissue at reduced temperatures.
N=6, n=12 Control
37 °C
Intervention
13 °C
Reperfusion
37 °C
Strain (%) 0.5±0.8 0.5±0.7 0.6±0.9
viscous component
instantaneous stress - A
(kPa/mm)
26.9±10.4 24.7±9.9* 27.3±11.3
steady-state component stress -
C (kPa/mm)
47.8±38.5 53.4±43.5* 43.4±36.4
A / (A+C) (%) 26±10 23±9 29±12
Young’s modulus – e 57.0±6.4 71.6±17.2 45.4±20.2
Time-constant stress-relaxation
– k (s)
10.3±3.7 9.6±3.5 9.6±3.5

238
3.6.7 Effect of reduced temperature on CSM function – results summary
Modification of the experimental set-up was straightforward and enabled low temperature
solutions to be delivered to the superfusion chamber in a reliable and reproducible manner. A
reduction in pH occurred because of the increased solubility of perfusing gas mixture CO2 in the
reduced temperature superfusate. Low temperature interventions were therefore compared to the
effect of acidosis on CSM. The findings summarised below were more marked at 13 °C when
compared to 21 °C.
Reduction in superfusate temperature significantly suppressed nerve-mediated contraction. This
was not due to reduced recruitment of nerve fibres at low temperature. In addition, the time-
course of phasic nerve-mediated contractions was prolonged, slowing responses significantly.
This was not due to changes in the biomechanical parameters measured at 21 °C or 13 °C. In
contrast, the magnitude of agonist-induced contraction was unaltered by reduction in
temperature. However, there was a significant reduction in the speed of the response with both
the contractile and relaxatory components of the PE-contracture affected.
Nerve-mediated relaxation was significantly ameliorated at low temperatures. The phasic
relaxation was also prolonged with the ‘contractile’ aspect (the return to pre-contracted tension
following EFS-mediated relaxation) slowed to a greater degree than the initial relaxatory
response. No change in magnitude of agonist-induced relaxation was observed.
This prolongation of responses at reduced temperature was not due to a change in the
biomechanical properties of the tissue. The time-constant of the instantaneous stress/relaxation
relationship remained constant at reduced temperatures. Although CSM became stiffer at low

239
temperature, this was matched by a concurrent reduction in the viscous component of the tissue.
The effects of reduced temperature on CSM are summarised in table 4.14.
Table 4.14 - The effect of reduced temperature on CSM
Parameter Effect of reduced temperature
Nerve-mediated contraction
Force-frequency relationship Significant reversible depression of magnitude of
nerve-mediated contraction. Reversible shift of f½
to the left.
Force-voltage relationship Depression of nerve-mediated contraction not
attributable to decreased nerve recruitment
Time-constants Time-constants prolonged at low-temperature
Nerve-mediated relaxation
Force-frequency relationship Reversible depression of nerve-mediated
relaxation
Time-constants Time-constants prolonged at low-temperature
Agonist-induced contraction
Magnitude of peak and plateau responses No effect
Time-constants Time-constants prolonged at low temperature
Agonist-induced relaxation
Magnitude of nadir and plateau responses No effect
Stress/strain characteristics
Viscous component Reduced in magnitude, no change in stress-
relaxation time-constants

240
4.0 Discussion
4.1 Experimental limitations
Experiments utilising muscle strips used small tissue preparations of approximately 1 mm in width
and 4-6 mm in length. Adequate superfusion of the tissue was ensured by using such small
samples. This was particularly important when examining the effect of the elements of ischaemia
as any inadvertent metabolic depletion secondary to suboptimal superfusion may have affected
the results recorded. There was considerable variability in tension generated between muscle
strips from the same animal. This may be a consequence of the amount of connective tissue in
the sample(207, 208). However, tension generated during interventions was compared to control
and reperfusion responses within the same muscle strip, utilising a method of internal control.
Relaxatory responses were dependent upon the level of pre-contraction of the specimen(193).
During interventions that affected this level of pre-contraction, changes to the relaxatory response
had to be commented upon with care. During control experiments in unmodified Tyrode’s
solution, carbachol-induced relaxation was stable in magnitude. EFS-mediated relaxation
invariably demonstrated a shift to the left of the relaxation-frequency relationship with increasing
time. Responses during interventions were therefore compared to the trends seen during control
experiments. For example if an intervention abolished or ameliorated relaxation whereas during
control experiments these relaxations were increased with time, this intervention was interpreted
to have had an effect. Therefore, subtle changes to CSM relaxatory function were difficult to
elucidate. Other researchers postulated that this shift to the left of the relaxation/frequency
relationship may be secondary to inducible NOS (iNOS) production. However, in our own study
this left shift was not seen with carbachol induced relaxation. The decision was therefore made to

241
use the methodology described rather than attempt to manipulate iNOS production. However
future experiments may include investigation of the mechanism of this progressive augmentation
of nerve-mediated relaxation (with the addition of aminoguanidine for example)(71).
Several other researchers added additional chemicals to perfusing solutions to suppress aspects
of contraction or relaxation that were not being examined. These include:
• L-NAME and L-NOARG inhibit nitric oxide synthase
• Indomethacin inhibit cycloxygenase, preventing prostanoid production
• Scopolamine inhibit acetylcholine
• Guanethidine inhibit NA release from adrenergic nerves
In these experiments the decision was made not to use these agents. The effect of ischaemia
was examined on overall CSM function; blocking various mechanisms may have deleterious
effects that were not translatable to the clinical condition.
CSM cell isolation proved to be time-consuming. The technique in this type of smooth muscle had
not been established and required attempts with various protocols before a consistently useful
method was found. Functioning cell harvest was excellent with 20-30 cells per high-powered field
being available for subsequent experiments. Unfortunately, proposed examination of the effect of
interventions on intracellular pH (BCECF loading) and NADP+/NADPH ratios (autofluorescence)
was not carried out due to time constraints.
Isolated cell experiments were undertaken on a modified microscope stage with a warmed
perfusion chamber. The surface area of the chamber was large and the depth of superfusing fluid

242
thin. This raises the possibility of significant diffusion of room air into the superfusing solution
during interventions. Hypoxic interventions on isolated cells may not be directly comparable to
muscle strip experiments because of this. Due to the small amounts of fluid on the microscope at
any one time, measurement of PO2 was not possible.
4.2 Results overview
The aim of this thesis was to ascertain the contribution of the various components of ischaemia to
contractile failure in cavernosal smooth muscle and to characterise the cellular mechanisms
underlying this failure. Observations made during these experiments were in five main areas:
1. The use of this preparation to examine the effect of ischaemia
2. The effect of simulated ischaemia on cavernosal smooth muscle and the components
contributing to contractile failure
3. The effect of hypoxia on relaxatory responses
4. The effect of acidosis on contractile function
5. The effect of reduced temperature on CSM function
The following discussion will focus on each of these areas in turn.
4.2.1 Validity of using guinea-pig CSM
Initial experiments were to establish whether this preparation could be used to study the effects of
ischaemia. In the first instance it was important to examine whether the preparation was stable
over the time course of the experiments proposed.
243
For EFS-mediated isometric tension experiments, stimulation parameters used (preparations
were stimulated every 90 s with a 3 s pulse train at 8-60 Hz, 0.1 ms pulse width and at 50 V)
provided a stable preparation over 240 minutes. In addition, over 95% of the tension generated
using these stimulation parameters was via embedded motor nerves rather than direct muscle
stimulation. However, there were marked differences in absolute tension values generated by
different muscle strips, even if they were from the same animal. This may have been due to
differences in smooth muscle content or embedded nerve density(207, 208). The former is more
likely as similar differences were noted during PE contracture experiments. Over 700 muscle strip
experiments were carried out, the findings of which form the bulk of this body of work. Very little
spontaneous activity was recorded in muscle strips during this time, a possible advantage over
other animal models described(182).
In order to contrast with experiments examining nerve-mediated contraction, direct muscle the
proposed duration of experiments (240 min). Responses consisted of an initial peak response
followed by a plateau contracture, typically 85% of the initial peak recorded. The majority of this
PE-induced contracture is postulated as utilising intracellular Ca2+ stores rather than influx of
extracellular Ca2+ as demonstrated by the large proportion of nifedipine-resistant tension
generated in response to PE. Both the peak and plateau response were ameliorated to a similar
degree by nifedipine. This is similar to findings in rabbit and human CSM. Sparwasser et al. used
CSM retrieved during penile implant insertion for erectile dysfunction(176, 177). After incubation
in Ca2+-free solution, phenylephrine-induced contractures were reduced to 64±6 % of control.
Ryanodine further ameliorated PE-contractures to 30±6 % of control with the addition of caffeine
further reducing contraction to 11 %. Further experiments on agonist-induced contraction in
guinea-pig CSM could explore the following with a view to defining the underlying mechanisms of
contraction:

244
1. Alternative routes of calcium entry
a. Use of Ca2+-free superfusate
b. Non-specific cation channel antagonists (flufenamic acid and ruthenium red)
c. Na+/Ca2+ exchanger antagonists
2. Calcium sensitisation
a. Rho-kinase inhibitors
3. Intracellular calcium stores
a. Caffeine
b. TMB-8, a putative intracellular Ca2+ release inhibitor(209).
Nerve mediated relaxation was examined by subjecting pre-contracted muscle strips to EFS.
Strips were periodically contracted as opposed to continuously superfused with phenylephrine in
order to minimise fatigue in the strip due to prolonged periods in a maximally contracted state.
Increasing frequency of stimulation elicited progressively larger relaxations in the pre-contracted
strips. This relaxation was largely abolished in the presence of TTX indicating that the relaxation
was nerve-mediated. In addition, ODQ produced a similar reduction in EFS-mediated relaxation
indicating that the relaxation was mediated via nitric oxide. Interestingly there was a degree of
relaxation that persisted in the presence of ODQ. The mechanism of this ODQ resistant
relaxation was not elucidated. Sources of nitric oxide independent relaxation include the
endothelial 15-lipoxygenase-1 (15-LO-1) metabolites of arachidonic acid(210).
The force-frequency relationship was not stable over the time course of experiments examining
EFS-mediated relaxation (240 min). The curve shifted to the left with time indicating that the
relaxatory mechanisms became more sensitive to EFS over time. Inducible nitric oxide synthase
(iNOS) has implicated in this augmentation of relaxation with time. However, Nangle et al. saw no

245
increase in the maximal EFS mediated relaxation in mice lacking the iNOS gene when compared
to wild type(211). The magnitude of relaxation was dependent upon the level of pre-
contraction(212). Several interventions examined in these experiments augmented or suppressed
this level of pre-contraction. Therefore interpretation of the effect of interventions on relaxatory
responses was more complex than those made on nerve-mediated and agonist-induced
contraction. Tension remaining after stimulation at 24 Hz was the most stable parameter and was
therefore used in subsequent experiments to examine the effect of ischaemia on this aspect of
CSM function. In addition, the effect of interventions were compared to the trend in EFS
relaxation observed under normal conditions, i.e. that the frequency response relationship
demonstrated a left shift and increase in maximal relaxation with time.
Relaxation in cavernosal smooth muscle is mediated via both cavernosal nerves and the
endothelium lining the lacunar spaces within the corporal bodies(86). To examine the effect of
ischaemia on the overall relaxatory system, the cholinergic agonist carbachol was used. The
response of pre-contracted strips was stable over the proposed time course of these experiments
(240 min). Again responses were dependent upon the level of pre-contraction. As pre-contraction
increased, carbachol relaxation was proportionately smaller in magnitude.
Single cell harvest was satisfactory with over 90% of cells selected for intervention responding to
agonists in a stable manner. As outlined in experimental limitations (section 4.1), hypoxia may not
have been as reproducible as in muscle strip experiments due to diffusion of room air into the
superfusing fluid on the microscope stage.

246
4.2.2 The effect of simulated ischaemia and the components contributing to contractile failure
Simulated Ischaemia
Simulated ischaemia (the combination of hypoxia, acidosis and substrate depletion - HIAS)
significantly reduced the magnitude of both nerve-mediated and agonist-induced contraction. In
addition, the effect on nerve-mediated contraction was irreversible upon reperfusion over the time
course of the experimental protocol.
The effect on nerve-mediated contraction was immediate (fig. 3.15, 30 min HIAS EFS32Hz -
53±30% control) and increased with longer periods of ischaemia (60 min HIAS EFS32Hz - 20±13%
control). This was similar to the significant effect of HIAS on the plateau agonist-induced
contracture (tension generated 36±35% control after 30 min HIAS; 29±16% control after 60 min
HIAS). By contrast, the peak agonist contracture was relatively preserved initially (tension
generated 83±30% control after 30 min HIAS; 35±19% control after 60 min HIAS). This indicates
that the muscle has, at least initially, some metabolic reserve and/or mechanism of limiting
contractile failure secondary to simulated ischaemia.
This concept was further explored by examining the effect of ischaemia on agonist-induced
contraction in the presence of the L-type Ca2+-channel blocker nifedipine. Intracellular stores
contributed to the majority of the PE contracture under normal conditions (peak PE response
87±12% and plateau PE response 84±13% of control in the presence of nifedipine). Contractile
responses were relatively preserved in the presence of nifedipine during the period of ischaemia
(plateau PE response after 30 min HIAS 77±21% and plateau PE response after 60 min HIAS
66±31% of control in the presence of nifedipine). This raises the possibility that dysfunction of the
L-type Ca2+-channel contributes to the contractile failure seen during ischaemia. De Jongh et al.

247
postulated that receptor dysfunction was secondary to the production of reactive oxygen species
(ROS) and showed that contraction in porcine detrusor strips was ameliorated in the presence of
cumene hydroperoxide (CHP)(213). However, other researchers have shown that localised
production of ROS may enhance L-type Ca2+-channel activity. Amberg et al. used cerebral artery
myocytes and co-localised L-type Ca2+-channel sparklet activity with endogenous ROS
production(214).
The initial preservation of peak PE response during ischaemia (which was preserved in the
presence of nifedipine) would infer a degree of metabolic reserve. The concentration of high-
energy phosphates (e.g. ATP) is reduced in CSM when compared to bladder detrusor for
example(215). The normal cycle of penile erection and detumescence creates a closed
compartment in the penis, CSM may be adapted to function more effectively whilst utilising
anaerobic respiration than other smooth muscles. In addition, alternative mechanisms of
increasing [Ca2+]i may be utilised by cavernosal smooth muscle, at least initially, as shown by
preservation of the peak PE response(176, 177, 216, 217).
At the end of 60 min reperfusion, nerve-mediated responses demonstrated no significant
recovery in tension generated. In contrast, the agonist-induced response recovered completely
after a similar period. This would infer that ischaemia induced some degree of nerve damage
during the course of the experiment. It is difficult to say whether this was during the ischaemic
episode or a reperfusion type injury. The fact that the peak-PE contracture was preserved at 30
min HIAS whereas the nerve-mediated response was significantly impaired at this time point
would infer that the damage occurs during the ischaemic episode (fig. 5.1). Pessina et al.
examined the effect of combined hypoxia and substrate depletion of human, monkey and guinea-
pig detrusor strips(218, 219). Glycogen stores measured biochemically were reduced during

248
ischemic interventions. In addition, nerve-mediated contraction was irreversibly ameliorated
during the course of experiments before any reduction in agonist-induced contraction was noted.
The irreversible nerve damage was most marked in the guinea-pig model which had the lowest
glycogen reserve of the three tissue sources studied. Glycogen stores were localised in the
smooth muscle but not in intramural nerve ganglia. Juan et al. showed a significant reduction in
nerve density following an ischaemic insult with some recovery noted 14 days post injury(220).
Our own experimental findings support a differential effect of ischaemia, with nerves being the
most susceptible initially with smooth muscle damage occurring later in the ischaemic episode.
Simulated ischaemia had a similar deleterious effect on relaxatory responses. Nerve-mediated
relaxation was significantly reduced during the ischaemic intervention (fig. 3.38). However, in
contrast to nerve-mediated contraction, relaxation recovered completely upon reperfusion(71).
This suggests that relaxatory nerves are more resistant to ischaemic damage, a finding which
would contribute to the pathogenesis of ischaemic priapism and the contractile failure observed in
this condition(71). These findings are similar to those of Muneer et al. using a rabbit model of
priapism. Relaxatory mechanisms were more resistant to ischaemia than CSM contraction.
Agonist relaxation was similarly affected with responses significantly and reversibly reduced
during simulated ischaemia.
Hypoxia and substrate depletion
Identical responses to those outlined above were seen when muscle strips were subjected to the
combination of hypoxia and substrate depletion (HS depletion). It appears that the ability of CSM
to contract and relax is severely affected by hypoxia and absence of glucose and Na pyruvate
from the superfusate(218, 221). The exception to this finding was agonist-induced relaxation,
which was initially preserved in the presence of HS depletion. The combination of hypoxia,

249
substrate depletion and extracellular acidosis did mimic simulated ischaemia in this aspect of
CSM function. The presence of these conditions in corporal blood aspirates from men with low-
flow priapism is well documented(35). However, they do not occur simultaneously during the
ischaemic episode. Substrate depletion is a late finding, with undetectable blood glucose usually
seen after 6-12 hours of priapism (fig. 5.2 - time course of blood gas changes in corporal
aspirates during prolonged penile erection)(35). This would help to explain why response to
current treatments for priapism are much improved early in the disease process prior to reduction
in CSM response to PE and irreversible contractile nerve damage has occurred (usually during
the first 6 hours)(222).
Simulated ischaemia had no effect on isolated CSM cells. However, the combination of hypoxia
and substrate depletion significantly suppressed the second Ca2+ transient during the ischaemic
intervention. The differences observed between muscle strip and single cell experiments may be
secondary to the longer intervention time in the muscle strip vs. isolated cell experiments (20 min.
vs. 60 min.). In addition, the degree of hypoxia may have been less in single cell experiments due
to differences in the experimental set-up as previously discussed. The reduction in [Ca2+]i can
also be attributed to utilisation of intracellular glycogen stores. Less ATP is liberated during
anaerobic respiration which would reduce the amount of myosin-phosphorylation and therefore
decrease force of contraction.

250
Fig. 5.1 – Response of cavernosal smooth muscle contractile function to simulated ischaemia
Green arrows – no effect, red arrows – significant depression compared to control
Fig. 5.2 - Blood gas changes in corporal aspirates during prolonged penile erection
adapted from Muneer et al (71)
DURATION OF ISCHAEMIC PRIAPISM
pO2
pH
glucose
Peak PE response
Plateau PE response
Nerve-mediated response
60 min NT
30 min HIAS
60 min HIAS
Reperfusion

251
Substrate depletion
60 min. of substrate depletion in isolation had no effect on EFS-mediated contraction with tension
remaining at control levels upon reperfusion. 120 min. of the same intervention resulted in a
significant reduction in higher frequency nerve-mediated contraction (significant suppression of
tension generated in response to EFS40Hz and above). In addition, reperfusion resulted in a
further deterioration in EFS mediated contractile function throughout the frequency range(221).
Interestingly, a similar finding was not seen on agonist-induced contraction, with tension
remaining at control levels during 120 min. of the intervention and upon reperfusion. This would
infer that absence of glucose and Na pyruvate has a specific effect on contractile nerves rather
than the smooth muscle itself. This effect is not immediate as shown by preservation of
responses at 60 min. of intervention and after reperfusion. This would imply that this is a
metabolic effect rather than disruption of excitation-contractile coupling due to the absence of
glucose and Na pyruvate(223). No similar effect was noted on nerve-mediated relaxation
although only 60 min. of this intervention was examined. 120 min. of substrate depletion had no
effect on agonist-induced relaxation.
Hypoxia
120 min. of hypoxia had no effect on EFS-mediated contraction. A similar period of hypoxia had a
significant reversible deleterious effect on the PE contracture (plateau PE contracture at 30 min.
57±12%, 60 min. 55±15% and 120 min. 54±18% of control). In a similar manner to the effect of
HIAS depletion, peak responses demonstrated some initial preservation of tension generated
(peak PE contracture at 30 min. 89±20%, 60 min. 51±16% and 120 min. 55±27% of control). It is
postulated that the agonist-induced contracture requires more energy than nerve-mediated
phasic contractions (figs. 3.1 and 3.10)(133, 223).

252
When examining experimental recordings, with tension on the y axis and time along the x axis, it
can be seen that the area under the experimental tracing would be a function of energy
expenditure. Agonist-induced contractures are more expensive in terms of energy expenditure;
this may explain the differential effect of hypoxia on nerve and agonist contraction. Metabolic
reserves are depleted at a faster rate with agonist-induced contraction or are unable to be
replenished at the same rate; hypoxia therefore exhibits its deleterious effects at an earlier stage
than is observed in nerve-mediated contraction.
It is hypothesised that the combination of hypoxia and substrate depletion exacerbates this
depletion of metabolic reserves and therefore is the key change in the corporal micro-
environment contributing to contractile failure seen in ischaemic priapism(71, 218). These
findings are similar to those reported by Kim et al. when examining the effect of hypoxia on CSM
contractile responses (183). Noradrenaline- and endothelin-evoked contractions were significantly
attenuated after 180 min of hypoxia. Responses returned to normal upon return to control
conditions. Tone induced by a high-K solution was also measured, with a sustained relaxation of
tone observed during up to 180 min of hypoxia. This was fully reversible on return to control
conditions. It was hypothesised that contractile failure was a result of inhibition of oxidative
phosphorylation (reduction in ATP/ADP ratio) resulting in loss of homeostasis of Ca2+(183).
4.2.3 The effect of hypoxia on CSM relaxation
Hypoxia reversibly abolished relaxation in CSM. When examining the effect on carbachol-induced
relaxation, the deleterious effect was evident at both 30 min. and 60 min. of the intervention.
Responses returned to control upon reperfusion. EFS-mediated relaxation demonstrated a
significant reduction at 30 min. Nerve-mediated responses were abolished at 60 min. of EFS

253
stimulation in pre-contracted muscle strips demonstrating similar responses to those recorded in
response to EFS-stimulation in the presence of ODQ. This compound is a highly selective and
irreversible inhibitor of sGC. Soluble guanyl cyclase activated by NO, catalyses the production of
cGMP from GTP. Inhibition of sGC (with ODQ) effectively blocks the action of nitric oxide. These
findings show that hypoxia inhibits NO-mediated relaxation. A possible mechanism would be the
fact that oxygen is a substrate in the production of nitric oxide from the semi-essential amino acid
arginine (fig. 1.5). The fact there was some initial preservation of relaxation with nerve-mediated
responses may indicate that this mechanism of relaxation is more efficient in terms of nitric oxide
requirements.
This hypothesis is supported by work by Kim et al (section 1.6.1)(122). In summary this group of
investigators measured intracavernosal pO2 in both flaccid and the erect penis from human
volunteers. Oxygen tension was similar to venous blood in the flaccid state (25-43 mmHg) and
increased rapidly during penile erection to levels in excess of 100 mmHg. In vitro experiments on
both rabbit and human CSM (from patients undergoing penile implant insertion for erectile
dysfunction) showed a progressive inhibition of EFS-mediated and agonist-induced relaxation in
the presence of decreasing pO2 levels. Relaxation in response to exogenous NO was preserved
in the presence of hypoxia. In addition, NOS activity and production of cGMP was reduced in the
presence of hypoxia.
Simultaneous hypoxia and acidosis made no difference to the deleterious effect of hypoxia alone
on nerve-mediated relaxation. However, the same combination ameliorated the deleterious effect
of hypoxia on agonist-induced relaxation. This effect was attributable to the simultaneous
presence of hypoxia and extracellular acidosis.

254
4.2.4 The effect of acidosis on CSM function
Acidosis generated by changing the superfusate gas mixture to 10% CO2 rather than 5% CO2
results in a reduction of pH in both the intra and extra-cellular compartments. 120 min of acidosis
generated in this manner had no overall effect on nerve-mediated or peak/plateau agonist-
induced contraction. In addition no effect was observed on nerve-mediated or agonist induced
relaxation. This lack of effect is in contrast to that reported by other investigators(71, 184, 188).
On scrutinising experimental technique it became apparent that other researchers often
generated either intracellular acidification or extracellular acidosis. The effects of these two
conditions were therefore examined independently.
Intracellular acidification was generated by again changing the superfusate gas mixture to 10%
CO2 rather than 5% CO2 as well as increasing the amount of the extracellular buffer [HCO3-](188).
The [CaCl2] was adjusted appropriately to maintain Ca2+ activity. Intracellular acidification
immediately and significantly increased tension in response to EFS (EFS32Hz at 30, 60 and 120
min. to 116±5%, 115±6% and 107±7% respectively). In addition, this occurred throughout the
frequency range with no change in the estimated frequency of contraction to achieve half
maximal contraction (f½ at control, 30, 60, and 120 min. - 30±7Hz, 32±12Hz, 29±10Hz, 30±10Hz
respectively). This represents a true increase in tension rather than a shift to the left of the force-
frequency relationship (figs. 3.17)(188, 195). Tension returned to control values upon reperfusion.
Agonist-induced contraction was also augmented in the presence of intracellular acidification. At
30 min. peak and plateau PE contracture significantly increased to 120±12% and 117±9% of
control respectively. Similarly at 60 min. the plateau PE was significantly increased to 112±11%
of control. This augmentation of contractile function was not sustained, peak 60 min. response
and the 120 min. PE contracture were no different to control values. The similar effect on both

255
nerve and muscle implies that the augmentation of function is an effect on the muscle itself(188,
195).
A decrease of extracellular pH was achieved by reducing the [HCO3-] of the superfusate(188). In
contrast to intracellular acidification, extracellular acidosis significantly decreased the magnitude
of nerve-mediated contraction (tension in response to EFS32Hz at 30, 60 and 120 min. of
extracellular acidosis was significantly reduced to 62±19%, 58±18% and 52±23% of control
respectively)(194). This change in tension during the intervention occurred throughout the
frequency range with no change in f½ (f½ at control, 30, 60, and 120 min. - 39±21Hz, 39±12Hz,
35±8Hz, 37±6Hz respectively). Some recovery was seen upon reperfusion with normal Tyrode’s
with EFS32Hz increasing to 76±18% of control. However this was again significantly less than
control levels. Extracellular acidosis had no effect on agonist-induced contraction. This differential
effect of extracellular acidosis on nerve and muscle implies that the effect is on the nerve or on
the neuro-muscular junction rather than the smooth muscle itself(188).
In summary, intracellular acidification augmented contraction by an effect on the smooth muscle
itself and extracellular acidosis depressed it, possibly by an effect on the nerve or neuro-muscular
junction. The fact that these contrasting effects on CSM contractile function cancel each other out
(the lack of effect seen with combined intra-and extracellular acidosis) implies that the underlying
mechanisms are different. To further explore this, the effect of acidosis in either compartment
combined with other components of simulated ischaemia was examined.
The combination of hypoxia and acidosis resulted in a significant reduction in nerve-mediated
contraction whereas hypoxia or acidosis in isolation had no effect on nerve-mediated contraction
(fig. 5.3a). Further examination of hypoxia in combination with either intra- or extracellular

256
acidosis demonstrated that the augmentation of CSM function seen with intracellular acidification
was inactivated in the presence of hypoxia (figs. 5.3b and c). Experiments on the combination of
acidosis and substrate depletion showed that the absence of glucose and sodium pyruvate from
the superfusate did not ameliorate the augmentation in function seen with intracellular
acidification. These findings mirrored those seen when examining the effect of hypoxia and
acidosis on PE contractures. The augmentation of contraction seen with intracellular acidification
was therefore an oxygen dependent mechanism.
Fig. 5.3 – Response of CSM contractile function to the combination of hypoxia and acidosis
arrows represent effect of intervention:
blue - no effect, green – significant increase, red – significant decrease compared to control
Baxter et al. demonstrated an increase in rat coronary artery contraction in response to a
reduction in pHi without a concurrent increase in [Ca2+]i. An increase in myofilament sensitivity to
Ca2+ was postulated as the underlying mechanism(224). Wu et al. found an increase in agonist
evoked [Ca2+]i transients during a decrease in pHi in guinea-pig detrusor smooth muscle(188).
They suggested that the increase in carbachol and caffeine induced Ca2+ transients was
secondary to an enhancement of Ca2+ uptake into intracellular stores as a result of raised resting
Hypoxia Intra- and extracellular acidosis
Intracellular acidification
Extracellular acidosis
Hypoxia, intra- and
extracellular acidosis
Hypoxia and intracellular acidification
Hypoxia and extracellular acidosis
Hypoxia
Hypoxia
a
b
c

257
[Ca2+]i. Althought this could certainly explain the increase in contraction noted in our own
experiments, an increase in resting Ca2+ was not seen.
4.2.5 The effect of reduced temperature on CSM function
A recognised treatment of ischaemic priapism is the use of ice packs on the penis and washout of
the corporal bodies with fluids used for intravenous infusion, typically normal saline (0.9%
NaCl)(30, 60, 62). These fluids are invariably cold or at room temperature. There is no evidence
within the literature to support the use of these measures. Cavernosal smooth muscle function
was examined at low temperatures to test the hypothesis that these conditions are actually
detrimental to CSM function.
Carbon dioxide solubility is inversely related to temperature(225, 226). Cooled Tyrode’s solution
resulted in an increase in dissolved CO2 and a reduction of solution pH. CSM responses at low
temperature were compared to those in an acidotic Tyrode’s solution at 37 °C to ensure that any
changes seen were not attributable to this reduction in pH. An alternative methodology would
have been to adjust the pH of perfusing solutions at low temperature with NaOH using a pH
meter.
The magnitude of nerve-mediated contraction was almost immediately suppressed at both 21 °C
and 13 °C as compared to responses at 37 °C. This effect was dependent upon the frequency of
stimulation and was completely reversible on return to 37 °C. Ebong et al. reported a significant
reduction in force of contraction in rat vas deferens at similar temperatures(227). Contractions
were completely inhibited by the α-adrenergic antagonist phentolamine. In this same study,
agonist-induced contraction was augmented at room temperature. It was postulated that

258
reduction in EFS-mediated contraction was via a pre-synaptic mechanism. Burdyga et al.
reported the effect of cooling on both rat and guinea-pig ureter(202). Differences were noted in
the response of ureteric cooling between species. In the rat a significant increase in force of
contraction was secondary to an increase in the Ca2+ transient, in turn secondary to a
prolongation of the action potential. Cooling in guinea-pig ureter significantly reduced force of
contraction. Differences were attributed to discrepancies in ion channel distribution. In particular
the Ca2+-activated Cl- current, present in rat but not guinea-pig, was affected by reduced
temperature.
In contrast to responses at 37°C, increasing frequency of stimulation did not produce an increase
in nerve-mediated tension above f½ at 37°C(228). The inference is that reduction in nerve-
mediated contraction was not secondary to a reduction in nerve recruitment as shown by the
effect of increasing voltage on tension generated. At 37°C, tension generated was found to be
optimal at 50 V. At reduced temperatures, increasing the stimulation voltage above this level did
not elicit any increased response to EFS at reduced temperature. Acidosis for a similar time
period had no effect on the contractile response to EFS.
At low temperatures, the time-course of nerve-mediated phasic contractions was prolonged. This
effect was more marked during the return to baseline tension as opposed to the upstroke of the
contractile response, although both were significantly increased. The duration of contractile
responses returned to control values upon reperfusion with Tyrode’s at 37°C. Mitsui et al. showed
that both myosin light chain kinase (MLCK) and myosin light chain phosphatase (MLCP) activity
was significantly reduced at low temperature; the latter being affected to a greater degree. This in
turn resulted in a larger proportion of MLC phosphorylation and slowing of relaxation(229).

259
The trend measured for nerve-mediated relaxation under control conditions at 37°C was to
increase in magnitude with time. Experiments conducted at low temperature suppressed this
trend; nerve-mediated relaxation remained at control values throughout the low temperature
intervention. As with nerve-mediated contraction, the effect was greater at 13°C as compared to
21°C. Relaxatory responses to EFS at low temperatures were prolonged compared to those at
37°C(230, 231). This effect was significant during the ‘contractile’ phase of relaxation, i.e. the
return to the pre-contracted state of the muscle strip. Again, alterations in MLCK/MLCP kinetics
could explain this change(202).
In summary, a reduction in temperature reduced both the magnitude of nerve-mediated
responses and increased the time course of these responses. These effects were greater during
tissue contraction than relaxation. In order to examine whether these effects were mediated via
the nerve or were a direct muscle effect, similar experiments at low temperature were conducted
on the PE and carbachol induced contractures and relaxations respectively.
A reduction to 21°C or 13°C had no effect on the magnitude of agonist-induced contraction. A
reduction in temperature had no effect on the magnitude of agonist-induced relaxation. Due to
experimental limitations it was not possible to accurately measure the time course of these
relaxatory responses. These observations would imply that the significant reduction seen in
nerve-mediated contraction is secondary to some action on the nerves themselves or the
neuromuscular junction(232). This effect is not secondary to a reduction in nerve recruitment at
low temperatures.
The time course of PE-induced contractures was significantly prolonged at low temperature. Both
the rise to peak tension and return to baseline upon washout of PE were significantly affected.

260
This is a similar finding to that during EFS contraction and would imply that this is an effect of low
temperature on the muscle itself(233). To further explore this finding, experiments were
conducted to examine the biomechanical properties of CSM at low temperature. These found that
the viscous component of stress was reduced at low temperature for a given strain. In addition
the steady state stress at low temperature was significantly increased, indicating that the tissue
became stiffer at low temperature. However, the time course for the stress relaxation that
occurred after an instantaneous strain was placed upon the muscle strip remained unchanged
during the low temperature intervention, indicating that the mechanical ability of the tissue to relax
was unaffected at low temperature(234). The slowing of both nerve-mediated function and
agonist-induced contractures cannot be explained by changes in the biomechanical properties
measured here. These may be due to alterations in CSM mechanism of contraction at low
temperature(201, 202).
4.3 Conclusions and further research
Contractile failure in cavernosal smooth muscle during ischaemia is secondary to the combination
of hypoxia and reduction in availability of the energy substrates glucose and sodium pyruvate.
This depression of function is irreversible on the contractile nerves at an earlier stage than on
relaxatory nerves and the smooth muscle itself and results in a decrease of [Ca2+]i. This would
propagate any ischaemic priapic state. Reversal of these conditions should form part of any
treatment regime for patients who have ischaemic priapism.
Intracellular acidification augments CSM contractile function in an oxygen-dependent mechanism
that results in an increase in [Ca2+]i. Extracellular acidosis depresses contractile function. The site

261
of action of this depression is the nerve or the neuromuscular junction. Hypoxia alone depresses
relaxatory responses. This can be limited by simultaneous extracellular acidosis.
Overall this thesis provides evidence for the two hypotheses proposed. Substrate depletion is
central to the contractile failure seen in cavernosal smooth muscle during ischaemia. Prolonged
ischaemia is detrimental to contractile function before relaxatory responses. In addition, nerve-
mediated contraction is irreversibly affected before a similar effect on relaxatory nerves.
Low temperature interventions do not improve CSM function with nerve-mediated function
significantly reduced at low temperature as well as slowing CSM contractile responses. It may be
beneficial to use oxygenated washout fluids at body temperature which contain energy substrates
such as glucose and Na pyruvate to treat ischaemic priapism.
This is the first study to characterise the use of guinea-pig samples to study CSM function. Both
the muscle strip and single cell models of ischaemic priapism can be used to further elucidate the
mechanisms by which the combination of hypoxia and substrate depletion exerts its deleterious
effects. The augmentation of contractile function by intracellular acidification is also extremely
interesting and may yield a therapeutic target in the treatment of priapism should agents that
mimic these effects be identified. In addition, the mechanism of ODQ resistant relaxation may
provide a therapeutic target for men with erectile dysfunction.

262
5.0 Bibliography
1. Eland IA, van der Lei J, Stricker BH, Sturkenboom MJ. Incidence of priapism in the
general population. Urology. 2001;57(5):970-2. Epub 2001/05/19.
2. Kulmala RV, Lehtonen TA, Tammela TL. Priapism, its incidence and seasonal
distribution in Finland. Scandinavian journal of urology and nephrology. 1995;29(1):93-6. Epub
1995/03/01.
3. Adeyoju AB, Olujohungbe AB, Morris J, Yardumian A, Bareford D, Akenova A, et al.
Priapism in sickle-cell disease; incidence, risk factors and complications - an international
multicentre study. BJU international. 2002;90(9):898-902. Epub 2002/12/04.
4. Parker RCT. Priapus2003.
5. Hinman F. Priapism: Report of Cases and a Clinical Study of the Literature with
Reference to Its Pathogenesis and Surgical Treatment. Annals of surgery. 1914;60(6):689-716.
Epub 1914/12/01.
6. Hinman F, Jr. Priapism; reasons for failure of therapy. The Journal of urology.
1960;83:420-8. Epub 1960/04/01.
7. Pautler SE, Brock GB. Priapism. From Priapus to the present time. The Urologic clinics of
North America. 2001;28(2):391-403. Epub 2001/06/14.
8. Bastuba MD, Saenz de Tejada I, Dinlenc CZ, Sarazen A, Krane RJ, Goldstein I. Arterial
priapism: diagnosis, treatment and long-term followup. The Journal of urology. 1994;151(5):1231-
7. Epub 1994/05/01.
9. Witt MA, Goldstein I, Saenz de Tejada I, Greenfield A, Krane RJ. Traumatic laceration of
intracavernosal arteries: the pathophysiology of nonischemic, high flow, arterial priapism. The
Journal of urology. 1990;143(1):129-32. Epub 1990/01/01.
10. Lue TF, Hellstrom WJ, McAninch JW, Tanagho EA. Priapism: a refined approach to
diagnosis and treatment. The Journal of urology. 1986;136(1):104-8. Epub 1986/07/01.
11. Ramos CE, Park JS, Ritchey ML, Benson GS. High flow priapism associated with sickle
cell disease. The Journal of urology. 1995;153(5):1619-21. Epub 1995/05/01.
12. Engin G, Tunaci M, Acunas B. High-flow priapism due to cavernous artery
pseudoaneurysm: color Doppler sonography and magnetic resonance imaging findings.
European radiology. 1999;9(8):1698-9. Epub 1999/10/20.
13. Foda MM, Mahmood K, Rasuli P, Dunlap H, Kiruluta G, Schillinger JF. High-flow priapism
associated with Fabry's disease in a child: a case report and review of the literature. Urology.
1996;48(6):949-52. Epub 1996/12/01.

263
14. Garcia-Consuegra J, Padron M, Jaureguizar E, Carrascosa C, Ramos J. Priapism and
Fabry disease: a case report. European journal of pediatrics. 1990;149(7):500-1. Epub
1990/04/01.
15. Burnett AL, Bivalacqua TJ. Glucose-6-phosphate dehydrogenase deficiency: an etiology
for idiopathic priapism? The journal of sexual medicine. 2008;5(1):237-40. Epub 2007/11/01.
16. Finley DS. Glucose-6-phosphate dehydrogenase deficiency associated stuttering
priapism: report of a case. The journal of sexual medicine. 2008;5(12):2963-6. Epub 2008/10/01.
17. Backenroth R, Landau EH, Goren M, Raas-Rothschild A. Fabry disease and G6PD in
three family members with priapism: is the nitric oxide pathway to blame? The journal of sexual
medicine. 2010;7(4 Pt 1):1588-91. Epub 2010/01/28.
18. Ilkay AK, Levine LA. Conservative management of high-flow priapism. Urology.
1995;46(3):419-24. Epub 1995/09/01.
19. Park JK, Jeong YB, Han YM, Kim HJ. High-flow priapism caused by injury of the bilateral
cavernosal artery after needle trauma in a patient with low-flow priapism. BJU international.
2003;92 Suppl 3:e7-e8. Epub 2003/12/01.
20. Wallis CJ, Hoag N, Pommerville PJ, Huk ME. Recurrent idiopathic high-flow priapism
treated with selective arterial embolization after repeated initial treatments for low-flow priapism.
Canadian Urological Association journal = Journal de l'Association des urologues du Canada.
2009;3(1):60-3. Epub 2009/03/19.
21. deHoll JD, Shin PA, Angle JF, Steers WD. Alternative approaches to the management of
priapism. International journal of impotence research. 1998;10(1):11-4. Epub 1998/05/30.
22. Steers WD, Selby JB, Jr. Use of methylene blue and selective embolization of the
pudendal artery for high flow priapism refractory to medical and surgical treatments. The Journal
of urology. 1991;146(5):1361-3. Epub 1991/11/11.
23. Gujral S, MacDonagh RP, Cavanagh PM. Bilateral superselective arterial microcoil
embolisation in delayed post-traumatic high flow priapism. Postgraduate medical journal.
2001;77(905):193-4. Epub 2001/02/27.
24. Hatzichristou D, Salpiggidis G, Hatzimouratidis K, Apostolidis A, Tzortzis V, Bekos A, et
al. Management strategy for arterial priapism: therapeutic dilemmas. The Journal of urology.
2002;168(5):2074-7. Epub 2002/10/24.
25. Kress O, Heidenreich A, Klose KJ, Wagner HJ, Alfke H. Superselective embolization with
coils in high-flow priapism. Cardiovascular and interventional radiology. 2002;25(4):326-9. Epub
2002/09/27.

264
26. Volkmer BG, Nesslauer T, Kuefer R, Kraemer S, Goerich J, Gottfried HW. High-flow
priapism: a combined interventional approach with angiography and colour Doppler. Ultrasound in
medicine & biology. 2002;28(2):165-9. Epub 2002/04/09.
27. Brock G, Breza J, Lue TF, Tanagho EA. High flow priapism: a spectrum of disease. The
Journal of urology. 1993;150(3):968-71. Epub 1993/09/01.
28. Pohl J, Pott B, Kleinhans G. Priapism: a three-phase concept of management according
to aetiology and prognosis. British journal of urology. 1986;58(2):113-8. Epub 1986/04/01.
29. A. J. Wein LRK, A. C. Novick, A. W. Partin, and C. A. Peters. Campbell-Walsh Urology.
9th ed: Saunders-Elsevier; 2007.
30. Kumar P MS, Ralph DJ. The Surgical Management of Priapism. Current Sexual Health
Reports. 2007;1(4):125-8.
31. Broderick GA, Harkaway R. Pharmacologic erection: time-dependent changes in the
corporal environment. International journal of impotence research. 1994;6(1):9-16. Epub
1994/03/01.
32. Bochinski DJ, Deng DY, Lue TF. The treatment of priapism--when and how? International
journal of impotence research. 2003;15 Suppl 5:S86-90. Epub 2003/10/11.
33. Adogu AA. Stuttering priapism in sickle cell disease. British journal of urology.
1991;67(1):105-6. Epub 1991/01/01.
34. Muneer A, Minhas S, Arya M, Ralph DJ. Stuttering priapism--a review of the therapeutic
options. International journal of clinical practice. 2008;62(8):1265-70. Epub 2008/05/16.
35. Muneer A, Minhas S, Freeman A, Kumar P, Ralph DJ. Investigating the effects of high-
dose phenylephrine in the management of prolonged ischaemic priapism. The journal of sexual
medicine. 2008;5(9):2152-9. Epub 2008/05/10.
36. Bennett N, Mulhall J. Sickle cell disease status and outcomes of African-American men
presenting with priapism. The journal of sexual medicine. 2008;5(5):1244-50. Epub 2008/03/04.
37. Champion HC, Bivalacqua TJ, Takimoto E, Kass DA, Burnett AL. Phosphodiesterase-5A
dysregulation in penile erectile tissue is a mechanism of priapism. Proceedings of the National
Academy of Sciences of the United States of America. 2005;102(5):1661-6. Epub 2005/01/26.
38. Schreibman SM, Gee TS, Grabstald H. Management of priapism in patients with chronic
granulocytic leukemia. The Journal of urology. 1974;111(6):786-8. Epub 1974/06/01.
39. Wilson SK, Klionsky BL, Rhamy RK. A new etiology of priapism: Fabry's disease. The
Journal of urology. 1973;109(4):646-8. Epub 1973/04/01.
40. Greenberg WM. Mechanism of neuroleptic-associated priapism. The American journal of
psychiatry. 1988;145(3):393-5. Epub 1988/03/01.

265
41. Sadeghi-Nejad H, Jackson I. New-onset priapism associated with ingestion of terazosin
in an otherwise healthy man. The journal of sexual medicine. 2007;4(6):1766-8. Epub
2007/04/25.
42. Stimmel GL, Gutierrez MA. Counseling patients about sexual issues. Pharmacotherapy.
2006;26(11):1608-15. Epub 2006/10/27.
43. Guvel S, Kilinc F, Torun D, Egilmez T, Ozkardes H. Malignant priapism secondary to
bladder cancer. Journal of andrology. 2003;24(4):499-500. Epub 2003/06/27.
44. Hettiarachchi JA, Johnson GB, Panageas E, Drinis S, Konno S, Das AK. Malignant
priapism associated with metastatic urethral carcinoma. Urologia internationalis. 2001;66(2):114-
6. Epub 2001/02/27.
45. Kvarstein B. Bladder cancer complicated with priapism. A case report. Scandinavian
journal of urology and nephrology Supplementum. 1996;179:155-6. Epub 1996/01/01.
46. Lomaga MA, Hayter C. Priapism as a possible acute side effect of radical radiotherapy
for prostate cancer. The Canadian journal of urology. 2004;11(2):2205-6. Epub 2004/06/09.
47. Sonmez NC, Coskun B, Arisan S, Guney S, Dalkilic A. Early penile metastasis from
primary bladder cancer as the first systemic manifestation: a case report. Cases journal.
2009;2:7281. Epub 2010/02/27.
48. Weitzner S. Secondary carcinoma in the penis. Report of three cases and literature
review. The American surgeon. 1971;37(9):563-7. Epub 1971/09/01.
49. Baba H, Maezawa Y, Furusawa N, Kawahara N, Tomita K. Lumbar spinal stenosis
causing intermittent priapism. Paraplegia. 1995;33(6):338-45. Epub 1995/06/01.
50. Coraddu M, Floris F, Corrias A, Nurchi GC, Lobina GF, Dettori P. Spontaneous priapism
produced by stenosis of the lumbar canal. Acta neurologica. 1989;11(6):428-33. Epub
1989/12/01.
51. Cuenca PJ, Tulley EB, Devita D, Stone A. Delayed traumatic spinal epidural hematoma
with spontaneous resolution of symptoms. The Journal of emergency medicine. 2004;27(1):37-
41. Epub 2004/06/29.
52. Gordon SA, Stage KH, Tansey KE, Lotan Y. Conservative management of priapism in
acute spinal cord injury. Urology. 2005;65(6):1195-7. Epub 2005/05/26.
53. Ravindran M. Cauda equina compression presenting as spontaneous priapism. Journal
of neurology, neurosurgery, and psychiatry. 1979;42(3):280-2. Epub 1979/03/01.
54. Vaidyanathan S, Watt JW, Singh G, Hughes PL, Selmi F, Oo T, et al. Management of
recurrent priapism in a cervical spinal cord injury patient with oral baclofen therapy. Spinal cord.
2004;42(2):134-5. Epub 2004/02/07.

266
55. el-Amin EO. Issues in management of scorpion sting in children. Toxicon : official journal
of the International Society on Toxinology. 1992;30(1):111-5. Epub 1992/01/01.
56. Lapan DI, Graham AR, Bangert JL, Boyer JT, Conner WT. Amyloidosis presenting as
priapism. Urology. 1980;15(2):167-70. Epub 1980/02/01.
57. Talaulicar PM. Persistent priapism in rabies. British journal of urology. 1977;49(6):462.
Epub 1977/11/01.
58. Bochinski DJ, Dean RC, Lue TF. Erectile dysfunction and priapism. Nature clinical
practice Urology. 2004;1(1):49-53; quiz 1 p following Epub 2006/02/14.
59. Costa WS, Felix B, Cavalcanti AG, Medeiros J, Jr., Sampaio FJ. Structural analysis of
the corpora cavernosa in patients with ischaemic priapism. BJU international. 2010;105(6):838-
41; discussion 41. Epub 2009/09/16.
60. Pryor J, Akkus E, Alter G, Jordan G, Lebret T, Levine L, et al. Priapism. The journal of
sexual medicine. 2004;1(1):116-20. Epub 2006/01/21.
61. Mulhall JP, Honig SC. Priapism: etiology and management. Academic emergency
medicine : official journal of the Society for Academic Emergency Medicine. 1996;3(8):810-6.
Epub 1996/08/01.
62. Montague DK, Jarow J, Broderick GA, Dmochowski RR, Heaton JP, Lue TF, et al.
American Urological Association guideline on the management of priapism. The Journal of
urology. 2003;170(4 Pt 1):1318-24. Epub 2003/09/23.
63. Gibel LJ, Reiley E, Borden TA. Intracorporeal cavernosa streptokinase as adjuvant
therapy in the delayed treatment of idiopathic priapism. The Journal of urology.
1985;133(6):1040-1. Epub 1985/06/01.
64. Hubler J, Szanto A, Konyves K. Methylene blue as a means of treatment for priapism
caused by intracavernous injection to combat erectile dysfunction. International urology and
nephrology. 2003;35(4):519-21. Epub 2004/06/17.
65. Janetschek G, Promegger R, Weimann S. Local fibrinolysis and perfusion in the
treatment of priapism of the corpora cavernosa and corpus spongiosum. Scandinavian journal of
urology and nephrology. 1993;27(4):545-7. Epub 1993/01/01.
66. Martinez Portillo F, Hoang-Boehm J, Weiss J, Alken P, Junemann K. Methylene blue as
a successful treatment alternative for pharmacologically induced priapism. European urology.
2001;39(1):20-3. Epub 2001/02/15.
67. Okpala I, Westerdale N, Jegede T, Cheung B. Etilefrine for the prevention of priapism in
adult sickle cell disease. British journal of haematology. 2002;118(3):918-21. Epub 2002/08/16.

267
68. Teloken C, Ribeiro EP, Chammas M, Jr., Teloken PE, Souto CA. Intracavernosal
etilefrine self-injection therapy for recurrent priapism: one decade of follow-up. Urology.
2005;65(5):1002. Epub 2005/05/11.
69. Govier FE, Jonsson E, Kramer-Levien D. Oral terbutaline for the treatment of priapism.
The Journal of urology. 1994;151(4):878-9. Epub 1994/04/01.
70. Lowe FC, Jarow JP. Placebo-controlled study of oral terbutaline and pseudoephedrine in
management of prostaglandin E1-induced prolonged erections. Urology. 1993;42(1):51-3;
discussion 3-4. Epub 1993/07/01.
71. Muneer A, Cellek S, Dogan A, Kell PD, Ralph DJ, Minhas S. Investigation of cavernosal
smooth muscle dysfunction in low flow priapism using an in vitro model. International journal of
impotence research. 2005;17(1):10-8. Epub 2004/04/09.
72. Spycher MA, Hauri D. The ultrastructure of the erectile tissue in priapism. The Journal of
urology. 1986;135(1):142-7. Epub 1986/01/01.
73. Nixon RG, O'Connor JL, Milam DF. Efficacy of shunt surgery for refractory low flow
priapism: a report on the incidence of failed detumescence and erectile dysfunction. The Journal
of urology. 2003;170(3):883-6. Epub 2003/08/13.
74. Ralph DJ, Garaffa G, Muneer A, Freeman A, Rees R, Christopher AN, et al. The
immediate insertion of a penile prosthesis for acute ischaemic priapism. European urology.
2009;56(6):1033-8. Epub 2008/10/22.
75. Brant WO, Garcia MM, Bella AJ, Chi T, Lue TF. T-shaped shunt and intracavernous
tunneling for prolonged ischemic priapism. The Journal of urology. 2009;181(4):1699-705. Epub
2009/02/24.
76. Burnett AL, Pierorazio PM. Corporal "snake" maneuver: corporoglanular shunt surgical
modification for ischemic priapism. The journal of sexual medicine. 2009;6(4):1171-6. Epub
2009/02/12.
77. Ebbehoj J. A new operation for priapism. Scandinavian journal of plastic and
reconstructive surgery. 1974;8(3):241-2. Epub 1974/01/01.
78. Ercole CJ, Pontes JE, Pierce JM, Jr. Changing surgical concepts in the treatment of
priapism. The Journal of urology. 1981;125(2):210-1. Epub 1981/02/01.
79. Grayhack JT, McCullough W, O'Conor VJ, Jr., Trippel O. Venous Bypass to Control
Priapism. Investigative urology. 1964;1:509-13. Epub 1964/03/01.
80. R Q. Cure d'un cas de priapisme par anastomose cavernospongieuse. Acta Urol Belg
1964;32:5-13.

268
81. Winter CC. Cure of idiopathic priapism: new procedure for creating fistula between glans
penis and corpora cavernosa. Urology. 1976;8(4):389-91. Epub 1976/10/01.
82. H E. Clinical anatomy: Blackwell Scientific Publications; 1992.
83. TF L. Sexual function and dysfunction. In: Walsh PC RA, Vaughan ED, Wein AJ, editor.
Campbell's Urology. 8th ed: Saunders; 2002. p. 1589-604.
84. Minhas S PJ, Ralph DJ. Male Sexual Function. In: Mundy AR FJ, Neal DE, George NJR,
editor. The Scientific Basis of Urology: Taylor & Francis Ltd; 2004. p. 343-65.
85. Sexual Medicine. Sexual Dysfunctions in Men and Women. Paris: Health Publications;
2004.
86. Andersson KE, Wagner G. Physiology of penile erection. Physiological reviews.
1995;75(1):191-236. Epub 1995/01/01.
87. Pickard RS, Powell PH, Zar MA. The effect of inhibitors of nitric oxide biosynthesis and
cyclic GMP formation on nerve-evoked relaxation of human cavernosal smooth muscle. British
journal of pharmacology. 1991;104(3):755-9. Epub 1991/11/01.
88. Sathananthan AH, Adaikan PG, Lau LC, Ho J, Ratnam SS. Fine structure of the human
corpus cavernosum. Archives of andrology. 1991;26(2):107-17. Epub 1991/03/01.
89. Steers WD. Neural pathways and central sites involved in penile erection: neuroanatomy
and clinical implications. Neuroscience and biobehavioral reviews. 2000;24(5):507-16. Epub
2000/07/06.
90. Giuliano F, Rampin O. Central neural regulation of penile erection. Neuroscience and
biobehavioral reviews. 2000;24(5):517-33. Epub 2000/07/06.
91. Skagerberg G, Bjorklund A, Lindvall O, Schmidt RH. Origin and termination of the
diencephalo-spinal dopamine system in the rat. Brain research bulletin. 1982;9(1-6):237-44. Epub
1982/07/01.
92. Skagerberg G, Lindvall O. Organization of diencephalic dopamine neurones projecting to
the spinal cord in the rat. Brain research. 1985;342(2):340-51. Epub 1985/09/09.
93. Lue TF, Takamura T, Schmidt RA, Palubinskas AJ, Tanagho EA. Hemodynamics of
erection in the monkey. The Journal of urology. 1983;130(6):1237-41. Epub 1983/12/01.
94. Shirai M, Ishii N, Mitsukawa S, Matsuda S, Nakamura M. Hemodynamic mechanism of
erection in the human penis. Archives of andrology. 1978;1(4):345-9. Epub 1978/09/01.
95. Wagner G, Metz P. Impotence (erectile dysfunction) due to vascular disorders. An
overview. Journal of sex & marital therapy. 1980;6(4):223-33. Epub 1980/01/01.
96. Lue TF. Erectile dysfunction. The New England journal of medicine. 2000;342(24):1802-
13. Epub 2000/06/15.

269
97. Christ GJ, Spray DC, el-Sabban M, Moore LK, Brink PR. Gap junctions in vascular
tissues. Evaluating the role of intercellular communication in the modulation of vasomotor tone.
Circulation research. 1996;79(4):631-46. Epub 1996/10/01.
98. Costa P, Soulie-Vassal ML, Sarrazin B, Rebillard X, Navratil H, Bali JP. Adrenergic
receptors on smooth muscle cells isolated from human penile corpus cavernosum. The Journal of
urology. 1993;150(3):859-63. Epub 1993/09/01.
99. Levin RM, Wein AJ. Adrenergic alpha receptors outnumber beta receptors in human
penile corpus cavernosum. Investigative urology. 1980;18(3):225-6. Epub 1980/11/01.
100. Andersson KE. Pharmacology of penile erection. Pharmacological reviews.
2001;53(3):417-50. Epub 2001/09/08.
101. Traish AM, Gupta S, Toselli P, de Tejada IS, Goldstein I, Moreland RB. Identification of
alpha 1-adrenergic receptor subtypes in human corpus cavernosum tissue and in cultured
trabecular smooth muscle cells. Receptor. 1995;5(3):145-57. Epub 1995/01/01.
102. Traish AM, Moreland RB, Huang YH, Goldstein I. Expression of functional alpha2-
adrenergic receptor subtypes in human corpus cavernosum and in cultured trabecular smooth
muscle cells. Receptors & signal transduction. 1997;7(1):55-67. Epub 1997/01/01.
103. Traish AM, Netsuwan N, Daley J, Padman-Nathan H, Goldstein I, Saenz de Tejada I. A
heterogeneous population of alpha 1 adrenergic receptors mediates contraction of human corpus
cavernosum smooth muscle to norepinephrine. The Journal of urology. 1995;153(1):222-7. Epub
1995/01/01.
104. El-Gamal OM, Sandhu DP, Terry T, Elliott RA. alpha-Adrenoceptor subtypes in isolated
corporal tissue from patients undergoing gender re-assignment. BJU international.
2006;97(2):329-32. Epub 2006/01/25.
105. Dausse JP, Leriche A, Yablonsky F. Patterns of messenger RNA expression for alpha1-
adrenoceptor subtypes in human corpus cavernosum. The Journal of urology. 1998;160(2):597-
600. Epub 1998/07/29.
106. Hieble JP, Bylund DB, Clarke DE, Eikenburg DC, Langer SZ, Lefkowitz RJ, et al.
International Union of Pharmacology. X. Recommendation for nomenclature of alpha 1-
adrenoceptors: consensus update. Pharmacological reviews. 1995;47(2):267-70. Epub
1995/06/01.
107. Hedlund H, Andersson KE. Comparison of the responses to drugs acting on
adrenoreceptors and muscarinic receptors in human isolated corpus cavernosum and cavernous
artery. Journal of autonomic pharmacology. 1985;5(1):81-8. Epub 1985/03/01.

270
108. Kerfoot WW, Park HY, Schwartz LB, Hagen PO, Carson CC, 3rd. Characterization of
calcium channel blocker induced smooth muscle relaxation using a model of isolated corpus
cavernosum. The Journal of urology. 1993;150(1):249-52. Epub 1993/07/01.
109. Andersson KE, Hedlund P, Alm P. Sympathetic pathways and adrenergic innervation of
the penis. International journal of impotence research. 2000;12(S1):S5-S12. Epub 2000/06/13.
110. Simonsen U, Prieto D, Hernandez M, Saenz de Tejada I, Garcia-Sacristan A.
Prejunctional alpha 2-adrenoceptors inhibit nitrergic neurotransmission in horse penile resistance
arteries. The Journal of urology. 1997;157(6):2356-60. Epub 1997/06/01.
111. Takahashi R, Nishimura J, Hirano K, Naito S, Kanaide H. Modulation of Ca2+ sensitivity
regulates contractility of rabbit corpus cavernosum smooth muscle. The Journal of urology.
2003;169(6):2412-6. Epub 2003/05/29.
112. Somlyo AP, Somlyo AV. Signal transduction and regulation in smooth muscle. Nature.
1994;372(6503):231-6. Epub 1994/11/17.
113. Karaki H, Ozaki H, Hori M, Mitsui-Saito M, Amano K, Harada K, et al. Calcium
movements, distribution, and functions in smooth muscle. Pharmacological reviews.
1997;49(2):157-230. Epub 1997/06/01.
114. Kimura K, Ito M, Amano M, Chihara K, Fukata Y, Nakafuku M, et al. Regulation of myosin
phosphatase by Rho and Rho-associated kinase (Rho-kinase). Science. 1996;273(5272):245-8.
Epub 1996/07/12.
115. Saenz de Tejada I, Carson MP, de las Morenas A, Goldstein I, Traish AM. Endothelin:
localization, synthesis, activity, and receptor types in human penile corpus cavernosum. The
American journal of physiology. 1991;261(4 Pt 2):H1078-85. Epub 1991/10/01.
116. Bell CR, Sullivan ME, Dashwood MR, Muddle JR, Morgan RJ. The density and
distribution of endothelin 1 and endothelin receptor subtypes in normal and diabetic rat corpus
cavernosum. British journal of urology. 1995;76(2):203-7. Epub 1995/08/01.
117. Dai Y, Pollock DM, Lewis RL, Wingard CJ, Stopper VS, Mills TM. Receptor-specific
influence of endothelin-1 in the erectile response of the rat. American journal of physiology
Regulatory, integrative and comparative physiology. 2000;279(1):R25-30. Epub 2000/07/18.
118. Parkkisenniemi UM, Klinge E. Functional characterization of endothelin receptors in the
bovine retractor penis muscle and penile artery. Pharmacology & toxicology. 1996;79(2):73-9.
Epub 1996/08/01.
119. Holmquist F, Kirkeby HJ, Larsson B, Forman A, Alm P, Andersson KE. Functional
effects, binding sites and immunolocalization of endothelin-1 in isolated penile tissues from man

271
and rabbit. The Journal of pharmacology and experimental therapeutics. 1992;261(2):795-802.
Epub 1992/05/01.
120. Holmquist F, Persson K, Garcia-Pascual A, Andersson KE. Phospholipase C activation
by endothelin-1 and noradrenaline in isolated penile erectile tissue from rabbit. The Journal of
urology. 1992;147(6):1632-5. Epub 1992/06/01.
121. Christ GJ, Lerner SE, Kim DC, Melman A. Endothelin-1 as a putative modulator of
erectile dysfunction: I. Characteristics of contraction of isolated corporal tissue strips. The Journal
of urology. 1995;153(6):1998-2003. Epub 1995/06/01.
122. Kim N, Vardi Y, Padma-Nathan H, Daley J, Goldstein I, Saenz de Tejada I. Oxygen
tension regulates the nitric oxide pathway. Physiological role in penile erection. The Journal of
clinical investigation. 1993;91(2):437-42. Epub 1993/02/01.
123. Sattar AA, Salpigides G, Vanderhaeghen JJ, Schulman CC, Wespes E. Cavernous
oxygen tension and smooth muscle fibers: relation and function. The Journal of urology.
1995;154(5):1736-9. Epub 1995/11/01.
124. Burnett AL, Lowenstein CJ, Bredt DS, Chang TS, Snyder SH. Nitric oxide: a physiologic
mediator of penile erection. Science. 1992;257(5068):401-3. Epub 1992/07/17.
125. Moreland RB, Albadawi H, Bratton C, Patton G, Goldstein I, Traish A, et al. O2-
dependent prostanoid synthesis activates functional PGE receptors on corpus cavernosum
smooth muscle. American journal of physiology Heart and circulatory physiology.
2001;281(2):H552-8. Epub 2001/07/17.
126. Khan MA, Calvert RC, Sullivan ME, Thompson CS, Mumtaz FH, Morgan RJ, et al.
Normal and pathological erectile function: the potential clinical role of endothelin-1 antagonists.
Current drug targets. 2000;1(3):247-60. Epub 2001/07/24.
127. Saenz de Tejada I, Kim N, Lagan I, Krane RJ, Goldstein I. Regulation of adrenergic
activity in penile corpus cavernosum. The Journal of urology. 1989;142(4):1117-21. Epub
1989/10/01.
128. Somlyo AP, Somlyo AV. Smooth muscle: excitation-contraction coupling, contractile
regulation, and the cross-bridge cycle. Alcoholism, clinical and experimental research.
1994;18(1):138-43. Epub 1994/02/01.
129. Hedlund P, Alm P, Andersson KE. NO synthase in cholinergic nerves and NO-induced
relaxation in the rat isolated corpus cavernosum. British journal of pharmacology.
1999;127(2):349-60. Epub 1999/06/29.

272
130. Levin RM, Hypolite J, Broderick GA. Comparative studies on intracellular calcium and
NADH Fluorescence of the rabbit corpus cavernosum. Neurourology and urodynamics.
1994;13(5):609-18. Epub 1994/01/01.
131. Paul RJ. Smooth muscle energetics and theories of cross-bridge regulation. The
American journal of physiology. 1990;258(2 Pt 1):C369-75. Epub 1990/02/01.
132. Rhee AY, Brozovich FV. Force maintenance in smooth muscle: analysis using sinusoidal
perturbations. Archives of biochemistry and biophysics. 2003;410(1):25-38. Epub 2003/02/01.
133. Wendt IR, Paul RJ. Energy cost of contraction in rat urinary bladder smooth muscle
during anoxia. Clinical and experimental pharmacology & physiology. 2003;30(8):565-9. Epub
2003/08/02.
134. Kim YD, Cho MH, Kwon SC. Myoplasmic [ca], crossbridge phosphorylation and latch in
rabbit bladder smooth muscle. The Korean journal of physiology & pharmacology : official journal
of the Korean Physiological Society and the Korean Society of Pharmacology. 2011;15(3):171-7.
Epub 2011/08/24.
135. Hedlund P, Ny L, Alm P, Andersson KE. Cholinergic nerves in human corpus
cavernosum and spongiosum contain nitric oxide synthase and heme oxygenase. The Journal of
urology. 2000;164(3 Pt 1):868-75. Epub 2000/08/23.
136. Saenz de Tejada I, Goldstein I, Krane RJ. Local control of penile erection. Nerves,
smooth muscle, and endothelium. The Urologic clinics of North America. 1988;15(1):9-15. Epub
1988/02/01.
137. Traish AM, Carson MP, Kim N, Goldstein I, Saenz de Tejada I. Characterization of
muscarinic acetylcholine receptors in human penile corpus cavernosum: studies on whole tissue
and cultured endothelium. The Journal of urology. 1990;144(4):1036-40. Epub 1990/10/01.
138. Traish AM, Palmer MS, Goldstein I, Moreland RB. Expression of functional muscarinic
acetylcholine receptor subtypes in human corpus cavernosum and in cultured smooth muscle
cells. Receptor. 1995;5(3):159-76. Epub 1995/01/01.
139. Cartledge JJ, Minhas S, Eardley I, Morrison JF. Endothelial and neuronal-derived nitric
oxide mediated relaxation of corpus cavernosal smooth muscle in a rat, in vitro, model of erectile
function. International journal of impotence research. 2000;12(4):213-21. Epub 2000/11/18.
140. Sjostrand NO, Klinge E. What function have cholinergic nerves in the smooth muscle of
the male genital tract? Acta physiologica Scandinavica Supplementum. 1977;452:89-91. Epub
1977/01/01.
141. Burnett AL. Priapism pathophysiology: clues to prevention. International journal of
impotence research. 2003;15 Suppl 5:S80-5. Epub 2003/10/11.

273
142. Burnett AL, Tillman SL, Chang TS, Epstein JI, Lowenstein CJ, Bredt DS, et al.
Immunohistochemical localization of nitric oxide synthase in the autonomic innervation of the
human penis. The Journal of urology. 1993;150(1):73-6. Epub 1993/07/01.
143. Ceccatelli S, Lundberg JM, Zhang X, Aman K, Hokfelt T. Immunohistochemical
demonstration of nitric oxide synthase in the peripheral autonomic nervous system. Brain
research. 1994;656(2):381-95. Epub 1994/09/12.
144. Hohler B, Olry R, Mayer B, Kummer W. Nitric oxide synthase in guinea pig sympathetic
ganglia: correlation with tyrosine hydroxylase and neuropeptides. Histochemistry and cell biology.
1995;104(1):21-8. Epub 1995/07/01.
145. Song ZM, Brookes SJ, Gibbins IL, Costa M. NADPH-diaphorase and other neuronal
markers in nerves and ganglia supplying the guinea-pig vas deferens. Journal of the autonomic
nervous system. 1994;48(1):31-43. Epub 1994/06/01.
146. Bloch W, Klotz T, Sedlaczek P, Zumbe J, Engelmann U, Addicks K. Evidence for the
involvement of endothelial nitric oxide synthase from smooth muscle cells in the erectile function
of the human corpus cavernosum. Urological research. 1998;26(2):129-35. Epub 1998/06/19.
147. Stanarius A, Uckert S, Machtens SA, Stief CG, Wolf G, Jonas U. Immunocytochemical
distribution of nitric oxide synthase in the human corpus cavernosum: an electron microscopical
study using the tyramide signal amplification technique. Urological research. 2001;29(3):168-72.
Epub 2001/08/03.
148. Burnett AL. Nitric oxide regulation of penile erection: biology and therapeutic implications.
Journal of andrology. 2002;23(5):S20-6. Epub 2002/09/19.
149. Moncada S, Higgs A, Furchgott R. International Union of Pharmacology Nomenclature in
Nitric Oxide Research. Pharmacological reviews. 1997;49(2):137-42. Epub 1997/06/01.
150. Azadzoi KM, Kim N, Brown ML, Goldstein I, Cohen RA, Saenz de Tejada I. Endothelium-
derived nitric oxide and cyclooxygenase products modulate corpus cavernosum smooth muscle
tone. The Journal of urology. 1992;147(1):220-5. Epub 1992/01/01.
151. Burnett AL, Chang AG, Crone JK, Huang PL, Sezen SE. Noncholinergic penile erection
in mice lacking the gene for endothelial nitric oxide synthase. Journal of andrology.
2002;23(1):92-7. Epub 2002/01/10.
152. Burnett AL. Role of nitric oxide in the physiology of erection. Biology of reproduction.
1995;52(3):485-9. Epub 1995/03/01.
153. Busse R, Fleming I. Pulsatile stretch and shear stress: physical stimuli determining the
production of endothelium-derived relaxing factors. Journal of vascular research. 1998;35(2):73-
84. Epub 1998/05/20.

274
154. Cornwell TL, Pryzwansky KB, Wyatt TA, Lincoln TM. Regulation of sarcoplasmic
reticulum protein phosphorylation by localized cyclic GMP-dependent protein kinase in vascular
smooth muscle cells. Molecular pharmacology. 1991;40(6):923-31. Epub 1991/12/01.
155. Archer SL, Huang JM, Hampl V, Nelson DP, Shultz PJ, Weir EK. Nitric oxide and cGMP
cause vasorelaxation by activation of a charybdotoxin-sensitive K channel by cGMP-dependent
protein kinase. Proceedings of the National Academy of Sciences of the United States of
America. 1994;91(16):7583-7. Epub 1994/08/02.
156. Lincoln TM. Cyclic GMP and mechanisms of vasodilation. Pharmacology & therapeutics.
1989;41(3):479-502. Epub 1989/01/01.
157. Furukawa K, Ohshima N, Tawada-Iwata Y, Shigekawa M. Cyclic GMP stimulates
Na+/Ca2+ exchange in vascular smooth muscle cells in primary culture. The Journal of biological
chemistry. 1991;266(19):12337-41. Epub 1991/07/05.
158. Lincoln J, Crowe R, Blacklay PF, Pryor JP, Lumley JS, Burnstock G. Changes in the
VIPergic, cholinergic and adrenergic innervation of human penile tissue in diabetic and non-
diabetic impotent males. The Journal of urology. 1987;137(5):1053-9. Epub 1987/05/01.
159. Hedlund P, Alm P, Ekstrom P, Fahrenkrug J, Hannibal J, Hedlund H, et al. Pituitary
adenylate cyclase-activating polypeptide, helospectin, and vasoactive intestinal polypeptide in
human corpus cavernosum. British journal of pharmacology. 1995;116(4):2258-66. Epub
1995/10/01.
160. Hedlund P, Larsson B, Alm P, Andersson KE. Distribution and function of nitric oxide-
containing nerves in canine corpus cavernosum and spongiosum. Acta physiologica
Scandinavica. 1995;155(4):445-55. Epub 1995/12/01.
161. Ottesen B, Wagner G, Virag R, Fahrenkrug J. Penile erection: possible role for
vasoactive intestinal polypeptide as a neurotransmitter. British medical journal. 1984;288(6410):9-
11. Epub 1984/01/07.
162. Kim YC, Kim JH, Davies MG, Hagen PO, Carson CC, 3rd. Modulation of vasoactive
intestinal polypeptide (VIP)-mediated relaxation by nitric oxide and prostanoids in the rabbit
corpus cavernosum. The Journal of urology. 1995;153(3 Pt 1):807-10. Epub 1995/03/01.
163. Cara AM, Lopes-Martins RA, Antunes E, Nahoum CR, De Nucci G. The role of histamine
in human penile erection. British journal of urology. 1995;75(2):220-4. Epub 1995/02/01.
164. Kim YC, Davies MG, Lee TH, Hagen PO, Carson CC, 3rd. Characterization and function
of histamine receptors in corpus cavernosum. The Journal of urology. 1995;153(2):506-10. Epub
1995/02/01.

275
165. Furukawa K, Nagao K, Ishii N, Uchiyama T. Responses to serotonin (5HT) in isolated
corpus cavernosum penis of rabbit. International journal of impotence research. 2003;15(4):267-
71. Epub 2003/08/23.
166. Hayes ES, Adaikan PG. The effects of 5HT(1) agonists on erection in rats in vivo and
rabbit corpus cavernosum in vitro. International journal of impotence research. 2002;14(4):205-
12. Epub 2002/08/02.
167. Tong YC, Broderick G, Hypolite J, Levin RM. Correlations of purinergic, cholinergic and
adrenergic functions in rabbit corporal cavernosal tissue. Pharmacology. 1992;45(5):241-9. Epub
1992/01/01.
168. Simonsen U, Garcia-Sacristan A, Prieto D. Penile arteries and erection. Journal of
vascular research. 2002;39(4):283-303. Epub 2002/08/21.
169. Cohen RA, Vanhoutte PM. Endothelium-dependent hyperpolarization. Beyond nitric
oxide and cyclic GMP. Circulation. 1995;92(11):3337-49. Epub 1995/12/01.
170. Angulo J, Cuevas P, Fernandez A, Gabancho S, Videla S, Saenz de Tejada I. Calcium
dobesilate potentiates endothelium-derived hyperpolarizing factor-mediated relaxation of human
penile resistance arteries. British journal of pharmacology. 2003;139(4):854-62. Epub 2003/06/19.
171. Sato M, Kawatani M. Effects of noradrenaline on cytosolic concentrations of Ca(2+) in
cultured corpus cavernosum smooth muscle cells of the rabbit. Neuroscience letters.
2002;324(2):89-92. Epub 2002/05/04.
172. Yang Z, Wang X, Zhu G, Zhou Z, Wang Y, Chen D, et al. Effect of surgical castration on
expression of TRPM8 in urogenital tract of male rats. Molecular biology reports. 2012;39(4):4797-
802. Epub 2011/09/29.
173. Pietrobon D, Di Virgilio F, Pozzan T. Structural and functional aspects of calcium
homeostasis in eukaryotic cells. European journal of biochemistry / FEBS. 1990;193(3):599-622.
Epub 1990/11/13.
174. Levin RM, Hypolite JA, Broderick GA. Evidence for a role of intracellular-calcium release
in nitric oxide-stimulated relaxation of the rabbit corpus cavernosum. Journal of andrology.
1997;18(3):246-9. Epub 1997/05/01.
175. Gregoire G, Loirand G, Pacaud P. Ca2+ and Sr2+ entry induced Ca2+ release from the
intracellular Ca2+ store in smooth muscle cells of rat portal vein. The Journal of physiology.
1993;472:483-500. Epub 1993/12/01.
176. Sparwasser C, Drescher P, Eckert R, Madsen PO. Ryanodine-sensitive intracellular
Ca2+ stores in isolated rabbit penile erectile tissue. Urological research. 1995;22(6):393-8. Epub
1995/01/01.

276
177. Sparwasser C, Schmelz HU, Drescher P, Eckert R, Madsen PO. Role of intracellular
Ca2+ stores in smooth muscle of human penile erectile tissue. Urological research.
1998;26(3):189-93. Epub 1998/08/07.
178. Friel DD, Tsien RW. Phase-dependent contributions from Ca2+ entry and Ca2+ release
to caffeine-induced [Ca2+]i oscillations in bullfrog sympathetic neurons. Neuron. 1992;8(6):1109-
25. Epub 1992/06/01.
179. Eisner DA, Lederer WJ. Na-Ca exchange: stoichiometry and electrogenicity. The
American journal of physiology. 1985;248(3 Pt 1):C189-202. Epub 1985/03/01.
180. Juenemann KP, Lue TF, Abozeid M, Hellstrom WJ, Tanagho EA. Blood gas analysis in
drug-induced penile erection. Urologia internationalis. 1986;41(3):207-11. Epub 1986/01/01.
181. Kim JJ, Moon DG, Koh SK. The role of nitric oxide in vivo feline erection under hypoxia.
International journal of impotence research. 1998;10(3):145-50; discussion 51. Epub 1998/10/27.
182. Broderick GA, Gordon D, Hypolite J, Levin RM. Anoxia and corporal smooth muscle
dysfunction: a model for ischemic priapism. The Journal of urology. 1994;151(1):259-62. Epub
1994/01/01.
183. Kim NN, Kim JJ, Hypolite J, Garcia-Diaz JF, Broderick GA, Tornheim K, et al. Altered
contractility of rabbit penile corpus cavernosum smooth muscle by hypoxia. The Journal of
urology. 1996;155(2):772-8. Epub 1996/02/01.
184. Saenz de Tejada I, Kim NN, Daley JT, Royai R, Hypolite J, Broderick GA, et al. Acidosis
impairs rabbit trabecular smooth muscle contractility. The Journal of urology. 1997;157(2):722-6.
Epub 1997/02/01.
185. Moon DG, Lee DS, Kim JJ. Altered contractile response of penis under hypoxia with
metabolic acidosis. International journal of impotence research. 1999;11(5):265-71. Epub
1999/12/20.
186. Munarriz R, Park K, Huang YH, Saenz de Tejada I, Moreland RB, Goldstein I, et al.
Reperfusion of ischemic corporal tissue: physiologic and biochemical changes in an animal model
of ischemic priapism. Urology. 2003;62(4):760-4. Epub 2003/10/11.
187. Kumar P MS, Ralph DJ. Models for the study of priapism. Curr Sex Health Reports.
2006;3(4):151-3.
188. Wu C, Fry CH. The effects of extracellular and intracellular pH on intracellular Ca2+
regulation in guinea-pig detrusor smooth muscle. The Journal of physiology. 1998;508 ( Pt
1):131-43. Epub 1998/06/06.

277
189. Wu C, Fry CH. Na(+)/Ca(2+) exchange and its role in intracellular Ca(2+) regulation in
guinea pig detrusor smooth muscle. American journal of physiology Cell physiology.
2001;280(5):C1090-6. Epub 2001/04/05.
190. Lynch RM, Paul RJ. Energy metabolism and transduction in smooth muscle. Experientia.
1985;41(8):970-7. Epub 1985/08/15.
191. Paul RJ, Krisanda JM, Lynch RM. Vascular smooth muscle energetics. Journal of
cardiovascular pharmacology. 1984;6 Suppl 2:S320-7. Epub 1984/01/01.
192. Krebs HA. The citric acid cycle and the Szent-Gyorgyi cycle in pigeon breast muscle. The
Biochemical journal. 1940;34(5):775-9. Epub 1940/05/01.
193. Barron JT, Kopp SJ, Tow J, Parrillo JE. Fatty acid, tricarboxylic acid cycle metabolites,
and energy metabolism in vascular smooth muscle. The American journal of physiology.
1994;267(2 Pt 2):H764-9. Epub 1994/08/01.
194. Liston TG, Palfrey EL, Raimbach SJ, Fry CH. The effects of pH changes on human and
ferret detrusor muscle function. The Journal of physiology. 1991;432:1-21. Epub 1991/01/01.
195. Burdyga TV, Taggart MJ, Wray S. An investigation into the mechanism whereby pH
affects tension in guinea-pig ureteric smooth muscle. The Journal of physiology. 1996;493 ( Pt
3):865-76. Epub 1996/06/15.
196. Chu YH, Wu CC, Wang HW. Effect of cooling on electrical field stimulation and
norepinephrine-induced contraction in isolated hypertrophic human nasal mucosa. American
journal of rhinology. 2006;20(5):471-5. Epub 2006/10/27.
197. Gonzalez O, Santacana GE. Effect of low temperature on tracheal smooth muscle
contractile and relaxing responses evoked by electrical field stimulation. Puerto Rico health
sciences journal. 2001;20(3):237-44. Epub 2002/01/05.
198. Sabeur G. Effect of temperature on the contractile response of isolated rat small intestine
to acetylcholine and KCl: calcium dependence. Archives of physiology and biochemistry.
1996;104(2):220-8. Epub 1996/01/01.
199. Harker CT, Bowman CJ, Taylor LM, Jr., Porter JM. Cooling augments human saphenous
vein reactivity to electrical stimulation. Journal of cardiovascular pharmacology. 1994;23(3):453-7.
Epub 1994/03/01.
200. Mustafa SM, Thulesius O. Cooling-induced bladder contraction: studies on isolated
detrusor muscle preparations in the rat. Urology. 1999;53(3):653-7. Epub 1999/03/30.
201. Burdyga TV, Magura IS. Effects of temperature and Na0+ on the relaxation of phasic and
tonic tension of guinea-pig ureter muscle. General physiology and biophysics. 1988;7(1):3-15.
Epub 1988/02/01.

278
202. Burdyga TV, Wray S. On the mechanisms whereby temperature affects excitation-
contraction coupling in smooth muscle. The Journal of general physiology. 2002;119(1):93-104.
Epub 2002/01/05.
203. Cooklin M, Wallis WR, Sheridan DJ, Fry CH. Conduction velocity and gap junction
resistance in hypertrophied, hypoxic guinea-pig left ventricular myocardium. Experimental
physiology. 1998;83(6):763-70. Epub 1998/10/23.
204. Fry CH LS. Calibration of Ion-selective electrodes. Ion-selective electrodes for biological
systems: Harwood academic publishers; 2001. p. 55-75.
205. Grynkiewicz G, Poenie M, Tsien RY. A new generation of Ca2+ indicators with greatly
improved fluorescence properties. The Journal of biological chemistry. 1985;260(6):3440-50.
Epub 1985/03/25.
206. Lattanzio FA, Jr., Bartschat DK. The effect of pH on rate constants, ion selectivity and
thermodynamic properties of fluorescent calcium and magnesium indicators. Biochemical and
biophysical research communications. 1991;177(1):184-91. Epub 1991/05/31.
207. Maia RS, Babinski MA, Figueiredo MA, Chagas MA, Costa WS, Sampaio FJ.
Concentration of elastic system fibers in the corpus cavernosum, corpus spongiosum, and tunica
albuginea in the rabbit penis. International journal of impotence research. 2006;18(2):121-5. Epub
2005/10/15.
208. Pinheiro AC, Costa WS, Cardoso LE, Sampaio FJ. Organization and relative content of
smooth muscle cells, collagen and elastic fibers in the corpus cavernosum of rat penis. The
Journal of urology. 2000;164(5):1802-6. Epub 2000/10/12.
209. Takahara A, Yoshida K, Suzuki-Kusaba M, Hisa H, Satoh S. Effects of nifedipine and
TMB-8 on angiotensin II-induced mesenteric vasoconstriction in dogs. Archives internationales de
pharmacodynamie et de therapie. 1994;328(3):288-96. Epub 1994/11/01.
210. Aggarwal NT, Gauthier KM, Campbell WB. Endothelial nitric oxide and 15-lipoxygenase-
1 metabolites independently mediate relaxation of the rabbit aorta. Vascular pharmacology.
2012;56(1-2):106-12. Epub 2011/12/27.
211. Nangle MR, Cotter MA, Cameron NE. An in vitro study of corpus cavernosum and aorta
from mice lacking the inducible nitric oxide synthase gene. Nitric oxide : biology and chemistry /
official journal of the Nitric Oxide Society. 2003;9(4):194-200. Epub 2004/03/05.
212. Michel MC, Sand C. Effect of pre-contraction on beta-adrenoceptor-mediated relaxation
of rat urinary bladder. World journal of urology. 2009;27(6):711-5. Epub 2009/05/19.

279
213. de Jongh R, Haenen GR, van Koeveringe GA, Dambros M, De Mey JG, van Kerrebroeck
PE. Oxidative stress reduces the muscarinic receptor function in the urinary bladder.
Neurourology and urodynamics. 2007;26(2):302-8. Epub 2006/09/26.
214. Amberg GC, Earley S, Glapa SA. Local regulation of arterial L-type calcium channels by
reactive oxygen species. Circulation research. 2010;107(8):1002-10. Epub 2010/08/28.
215. Levin RM, Hypolite JA, Longhurst PA, Gong C, Briscoe J, Broderick GA. Metabolic
studies on the rabbit corpus cavernosum. Journal of andrology. 1993;14(5):329-34. Epub
1993/09/01.
216. Rivera L, Brading AF. The role of Ca2+ influx and intracellular Ca2+ release in the
muscarinic-mediated contraction of mammalian urinary bladder smooth muscle. BJU
international. 2006;98(4):868-75. Epub 2006/09/19.
217. Sward K, Josefsson M, Lydrup ML, Hellstrand P. Effects of metabolic inhibition on
cytoplasmic calcium and contraction in smooth muscle of rat portal vein. Acta physiologica
Scandinavica. 1993;148(3):265-72. Epub 1993/07/01.
218. Pessina F, McMurray G, Wiggin A, Brading AF. The effect of anoxia and glucose-free
solutions on the contractile response of guinea-pig detrusor strips to intrinsic nerve stimulation
and the application of excitatory agonists. The Journal of urology. 1997;157(6):2375-80. Epub
1997/06/01.
219. Pessina F, Solito R, Maestrini D, Gerli R, Sgaragli G. Effect of anoxia-glucopenia and re-
superfusion on intrinsic nerves of mammalian detrusor smooth muscle: importance of glucose
metabolism. Neurourology and urodynamics. 2005;24(4):389-96. Epub 2004/12/18.
220. Juan YS, Chuang SM, Kogan BA, Mannikarottu A, Huang CH, Leggett RE, et al. Effect of
ischemia/reperfusion on bladder nerve and detrusor cell damage. International urology and
nephrology. 2009;41(3):513-21. Epub 2008/11/11.
221. Corbett AD, Lees GM. Depressant effects of hypoxia and hypoglycaemia on neuro-
effector transmission of guinea-pig intestine studied in vitro with a pharmacological model. British
journal of pharmacology. 1997;120(1):107-15. Epub 1997/01/01.
222. Munarriz R, Wen CC, McAuley I, Goldstein I, Traish A, Kim N. Management of ischemic
priapism with high-dose intracavernosal phenylephrine: from bench to bedside. The journal of
sexual medicine. 2006;3(5):918-22. Epub 2006/09/01.
223. Wendt IR. Effects of substrate and hypoxia on smooth muscle metabolism and
contraction. The American journal of physiology. 1989;256(4 Pt 1):C719-27. Epub 1989/04/01.
224. Baxter KA, Laher I, Church J, Hsiang YN. Acidosis augments myogenic constriction in rat
coronary arteries. Annals of vascular surgery. 2006;20(5):630-7. Epub 2006/10/03.

280
225. Bradley AF, Severinghaus JW, Stupfel M. Variations of serum carbonic acid pK with pH
and temperature. Journal of applied physiology. 1956;9(2):197-200. Epub 1956/09/01.
226. Bradley AF, Severinghaus JW, Stupfel M. Effect of temperature on PCO2 and PO2 of
blood in vitro. Journal of applied physiology. 1956;9(2):201-4. Epub 1956/09/01.
227. Ebong OO. Influence of lowered temperature upon the response of prostatic and
epididymal portion of the rat isolated vas deferens to field stimulation. Clinical and experimental
pharmacology & physiology. 1986;13(1):9-16. Epub 1986/01/01.
228. Stjarne L, Alberts P. Influence of temperature on stimulus-secretion coupling in the
sympathetic nerves and on neuromuscular transmission, in guinea-pig vas deferens. Acta
physiologica Scandinavica. 1985;125(2):181-94. Epub 1985/10/01.
229. Mitsui T, Kitazawa T, Ikebe M. Correlation between high temperature dependence of
smooth muscle myosin light chain phosphatase activity and muscle relaxation rate. The Journal
of biological chemistry. 1994;269(8):5842-8. Epub 1994/02/25.
230. Cooke JP, Shepherd JT, Vanhoutte PM. The effect of warming on adrenergic
neurotransmission in canine cutaneous vein. Circulation research. 1984;54(5):547-53. Epub
1984/05/01.
231. Vanhoutte PM, Cooke JP, Lindblad LE, Shepherd JT, Flavahan NA. Modulation of
postjunctional alpha-adrenergic responsiveness by local changes in temperature. Clinical
science. 1985;68 Suppl 10:121s-3s. Epub 1985/01/01.
232. Foldes FF, Kuze S, Vizi ES, Deery A. The influence of temperature on neuromuscular
performance. Journal of neural transmission. 1978;43(1):27-45. Epub 1978/01/01.
233. Jaworowski A, Arner A. Temperature sensitivity of force and shortening velocity in
maximally activated skinned smooth muscle. Journal of muscle research and cell motility.
1998;19(3):247-55. Epub 1998/05/16.
234. Stephens NL, Cardinal R, Simmons B. Mechanical properties of tracheal smooth muscle:
effects of temperature. The American journal of physiology. 1977;233(3):C92-8. Epub
1977/09/01.