
The Effect of Investment Banking Relationships on Financial Analysts' Earnings Forecasts and...
31
The Effect of Investment Banking Relationships on Financial Analysts' Eamings Forecasts and Investment Recommendations* AMITABH DUGAR Northeastern University SIVA NATHAN Georgia State University AJmraci. This study shows that financial analysts of brokerage firms that provide invest- ment brsrsking services to a company (investment banker analysts) are optimistic, relative io oihcr (noninvestment banker) analysts, in their earnings forecasts and investment recommendations. Returns earned by foiiovv'ing the investment recommendations of invcsimens banker analysts, however, are not significantly different from those of non- invesiiriep.t banker analysts. Given that information regarding the investment banking relationships of brokerage firms is publicly available, we find evidence that capital niarke! participants rely relatively less on the investment banker analysts in forming their earnings expectations. Although we find a significant capital market reaction around the noninvestment banker ana!y>5ls' research report dates and not around the investment banker analyst?" research report dates, the difference between the two market reactions is no; siat'sticaMy significant. Finally, we find that investment banker analysts' earnings :"oiecasts are, on average, as accurate as those of noninvestment banker analysts. .Reti<me .Les auteurs meltent en evidence le fait que ies analystes financiers des maisons cic couitage qui offrent des services de prise ferme aux entreprises (ies analystes de courtiers preneurs fenne) sont optirnistes dans ieurs previsions de benefices et leurs recoiTimandations de placemeiUs. par comparsison aux autres analystes (c'est-a-dire aux 3na':ystcs de courtiers qui ne sont pas preneurs ferrne). Les rendements obtenus par les Itivestisseurs qui observent ies recommandations de placements des analystes de courtiers prensjrs fsniiie ne sont cependa.nt pas sensiblemeni differents de ceux qu'obtiennent les invcstis-seurs qus se fient aux. analysies des counters qui ne sont pas preneurs ferme. Compte tenu du fait que i'informalion relative aux relations qu'entretiennent les maisons de courtage en maliere de prise ferme est du domaine public, les constatations des auteurs confirmenl que les participants au marche financier .s appuient relativement moins sur le verdict des anaiystes des courtiers preneurs ferme dans le calcul de leur esperance de gams. Bie.n que les auteurs observent une reaction marqu6e du marche financier & prox- imrte des dates de publication des rapporfs de recherche des analystes des courtiers qui ne sont pas preneurs ferme, ce qui n'est pas le cas a proximite des dates de publication des iapports de recherche des anaiystes des courtiers preneurs ferme, ia difference entre ces deux reactions n est pas statistiquement significative. Enfin, les auteurs constatent que les previsions de benefices des anaiystes dss courtiers preneurs ferme sont, en moyenne, asjii: exacies que celles des analystes des courtiers qui ne sont pas preneurs ferme. * Accepted by Lane Daley. This research was supported by grants from the McNair/SROP program and the Accounting Department at Michigan State University. We are gr<aeful for comments from two anonymous reviewers, the editor, and workshop participants at the following universities: Emory, Georgia State, Maryland, Michigan, Michigan State, Purdue, and SUNY-Buffaio. We also thank Marie Archambault, Janell Blazovich, Susheela MjJianti, and Dave Qi for providing research assistance, and Faye Backie for assistance in obtaining the data. We are grateful to Investexl, Inc. for providing analysts' research reports at a discounted price. AH errors are the responsibility of the authors. Contemporary Accounting ResearchV o\.\2Ho.\ (Fall 1995) pp. 131-160 ©CAAA
Transcript of The Effect of Investment Banking Relationships on Financial Analysts' Earnings Forecasts and...
The Effect of Investment Banking Relationshipson Financial Analysts' Eamings Forecasts and
Investment Recommendations*
AMITABH DUGAR Northeastern University
SIVA NATHAN Georgia State University
AJmraci. This study shows that financial analysts of brokerage firms that provide invest-ment brsrsking services to a company (investment banker analysts) are optimistic, relativeio oihcr (noninvestment banker) analysts, in their earnings forecasts and investmentrecommendations. Returns earned by foiiovv'ing the investment recommendations ofinvcsimens banker analysts, however, are not significantly different from those of non-invesiiriep.t banker analysts. Given that information regarding the investment bankingrelationships of brokerage firms is publicly available, we find evidence that capitalniarke! participants rely relatively less on the investment banker analysts in forming theirearnings expectations. Although we find a significant capital market reaction around thenoninvestment banker ana!y>5ls' research report dates and not around the investmentbanker analyst?" research report dates, the difference between the two market reactions isno; siat'sticaMy significant. Finally, we find that investment banker analysts' earnings:"oiecasts are, on average, as accurate as those of noninvestment banker analysts.
.Reti<me .Les auteurs meltent en evidence le fait que ies analystes financiers des maisonscic couitage qui offrent des services de prise ferme aux entreprises (ies analystes decourtiers preneurs fenne) sont optirnistes dans ieurs previsions de benefices et leursrecoiTimandations de placemeiUs. par comparsison aux autres analystes (c'est-a-dire aux3na':ystcs de courtiers qui ne sont pas preneurs ferrne). Les rendements obtenus par lesItivestisseurs qui observent ies recommandations de placements des analystes de courtiersprensjrs fsniiie ne sont cependa.nt pas sensiblemeni differents de ceux qu'obtiennent lesinvcstis-seurs qus se fient aux. analysies des counters qui ne sont pas preneurs ferme.Compte tenu du fait que i'informalion relative aux relations qu'entretiennent les maisonsde courtage en maliere de prise ferme est du domaine public, les constatations des auteursconfirmenl que les participants au marche financier .s appuient relativement moins sur leverdict des anaiystes des courtiers preneurs ferme dans le calcul de leur esperance degams. Bie.n que les auteurs observent une reaction marqu6e du marche financier & prox-imrte des dates de publication des rapporfs de recherche des analystes des courtiers qui nesont pas preneurs ferme, ce qui n'est pas le cas a proximite des dates de publication desiapports de recherche des anaiystes des courtiers preneurs ferme, ia difference entre cesdeux reactions n est pas statistiquement significative. Enfin, les auteurs constatent que lesprevisions de benefices des anaiystes dss courtiers preneurs ferme sont, en moyenne,asjii: exacies que celles des analystes des courtiers qui ne sont pas preneurs ferme.
* Accepted by Lane Daley. This research was supported by grants from the McNair/SROPprogram and the Accounting Department at Michigan State University. We are gr<aeful forcomments from two anonymous reviewers, the editor, and workshop participants at thefollowing universities: Emory, Georgia State, Maryland, Michigan, Michigan State, Purdue,and SUNY-Buffaio. We also thank Marie Archambault, Janell Blazovich, Susheela MjJianti,and Dave Qi for providing research assistance, and Faye Backie for assistance in obtaining thedata. We are grateful to Investexl, Inc. for providing analysts' research reports at a discountedprice. AH errors are the responsibility of the authors.
Contemporary Accounting ResearchV o\.\2Ho.\ (Fall 1995) pp. 131-160 ©CAAA
132 Contemporary Accounting Research
Most studies on analysts' earnings forecasts and investment recommendationshave focused on the statistical properties and/or the information content of theforecasts and recommendations.' Relatively little, however, is known about theincentives that analysts face in forming the opinions contained in their researchreports.^ Extant research on analysts has assumed (explicitly or implicitly) thatanalysts have incentives to issue the most accurate earnings forecasts and tomake investment recommendations that will maximize retums for their investorclients. If there are other incentives faced by analysts, this assumption will nothold. This study focuses on incentives facing analysts when the brokerage firmemploying them also provides investment banking services to the (client) com-pany about which the analyst issues research reports.
Most financial analysts are employed by brokerage firms (also called multi-service securities firms) that operate investment banking and investor servicesdepartments. Financial analysts work in the investor services department (whichalso performs brokerage services) and issue research reports on companies andindustries they are assigned to cover (Hazen 1990). The investment bankingdepartment performs investment banking services (mergers and acquisitions,underwriting, etc.) for client companies. A potential conflict of interest occurswhen a firm's investment banking department provides services to a client, andits financial analyst (in the investor services department) issues research reportson the same client. There can be direct or indirect pressure on the financial ana-lyst to portray client companies in a favorable light. The business press providesanecdotal evidence that a brokerage firm's analyst tends to issue optimistic earn-ings forecasts and investment recommendations about the firm's clients, relativeto other firms' analysts (Laderman, Hawkins, and Recio 1990; Schultz 1990;Siconolfi 1992).' Brokerage firms are required to have a "Chinese Wall"between their investment banking and investor services departments to preventtransmission of information from one department to the other and to prevent theinvestment banking department from exerting undue influence on the investorservices department. Although the Investment Advisers Act of 1940 does notexplicitly require a Chinese Wall in a brokerage firm, the concept has been sup-ported and endorsed by the Securities and Exchange Commission (SEC) throughcase law interpretations of the 1940 Act and rules promulgated by the SECunder the Securities Act of 1933 and Securities Exchange Act of 1934 (seeHazen 1990, Chapter 10, Section 10.2.4 for details). The Code of Ethics and theStandards of Professional Conduct of the Financial Analysts Federation recom-mends a similar Chinese Wall. It also requires financial analysts to deal fairlywith their investor clients and not to make earnings forecasts or investmentrecommendations without a reasonable basis. The Investment Advisers Act of1940 and The Code of Ethics also require that, if a firm provided investmentbanking services to a client company, the financial analyst of that firm must dis-close this information in the research reports the firm issues relating to that client.
The results of our study Show that analysts who issue research reports oncompanies that are also investment banking clients of their brokerage firm(investment banker analysts) tend to be more optimistic in their earnings fore-

The Effect of Investment Banking Relationships on Forecasts & Recommendations 133
casts relative to other analysts (noninvestment banker analysts). We also findthat, on average, investment banker analysts are more optimistic in their invest-ment recommendations, relative to noninvestment banker analysts. However, wealso find that the returns earned by following the investment recommendationsof the investment banker analysts are not significantly different from returnsearned by following the noninvestment banker analysts' recommendations.Regression analysis of the relation between stock returns and earnings forecasterrors shows that capital market participants tend to rely relatively more on thenoninvestment banker analysts to form their earnings expectations. Although wefind that there is a significant market reaction around noninvestment banker ana-lysts' research report dates and not around investment banker analysts' researchreport dates, the difference between the two market reactions is not statisticallysignificant. Finally, we show that earnings forecasts of investment bankeranalysts are, on average, as accurate as those of noninvestment banker analysts.
Our study is primarily descriptive and serves to document scientifically aphenomenon that has been discussed extensively in the business press and forwhich there is considerable anecdotal evidence. Our study leaves unansweredthe question of why this phenomenon would exist in an equilibrium setting.Specifically, given the evidence in our paper that the market is not misled by theoptimistic earnings forecasts of the investment banker analysts, it is not clearwhat benefits the managers receive from these optimistic forecasts. Severalexplanations are possible. First, although the market is not misled by the optim-ism of the investment banker analysts, the managers may believe (albeit, irra-tionally) that these analysts' optimism can drive up the stock price or mitigatethe damaging stock price effects of unfavorable investment recommendations(e.g., Francis and Philbrick 1993). Analysts will oblige in order to maintain goodreiations with these managers, because managers are a valuable source of infor-mation for analysts. Second, managers can receive some (unspecified) benefitother than higher stock price from the optimistic earnings forecasts of invest-ment banker analysts, which researchers cannot observe or are unaware of, givencurrent institutional knowledge. For example, Krishnan and Sivaramakrishnan(1994) show that (all) analysts issue optimistic earnings forecasts to extractinformation from matiagement. Management discloses information to the ana-lyst because the proprietary cost of disclosing information is reduced when theatialyst is optimistic. Although their mode! cannot explain why a particular ana-lyst (e.g., an investment banker analyst) will tend to be more optimistic thanother analysts, it provides a starting point for understanding analysts' behavior.Third, investment banker analysts can suffer from a "winner's curse" problem.This applies especially to underwriting, in that, the investment bank that is mostoptimistic about the company procures the underwriting contract. However, wenoted very few instances (5.6 percent of the sample) in which the investmentbanker analyst's firm performed underwriting services for the client. Moreover,exclusioH of these observations from the sample did not have a material effecton the reported results. Hence, this too seems an unlikely explanation for ourfindings.''

134 Contemporary Accounting Research
Our research is related to a study by Lin and McNichols (1993). They reportthat analysts employed by brokerage firms that served as an underwriter for acompany are optimistic in their earnings forecasts and investment recommenda-tions for that company, relative to other analysts. Their study is transaction-oriented and focuses on only one transaction, that is, underwriting commonstock offerings. However, underwriting relationships are short-term and lastonly for the duration of the transaction (Eccles and Crane 1988). In contrast, ourstudy is relationship-oriented and focuses on nonunderwriting services thatinvestment bankers perform for their clients (endnote 7 provides a list of suchservices). Because our study focuses on the long-term relationship between abrokerage firm and its client, our sample differs from that of Lin and McNichols.As discussed earlier, the primary research design advantage of this difference isthat our sample is less prone to a winner's curse problem.
The remainder of the paper is organized as follows. The next sectiondescribes financial analysts' incentives, the third section describes the data andmethodology, the fourth section presents the results, and the last section presentsthe conclusions of the study.
Incentives of Financial AnalystsFinancial analysts employed by brokerage firms are called sell-side analysts.Those employed by money management firms, pension funds, mutual funds, andthe investment department of insurance companies are called buy-side analysts.Although both buy-side and sell-side analysts make investment recommenda-tions, it is primarily the sell-side analysts who make earnings forecasts. Usuallybuy-side analysts use sell-side analysts' research reports as input for their invest-ment recommendations. The employers of the buy-side analysts are usuallyclients of the investor services department of the brokerage firms, which, in turn,employ the sell-side analyst.
The focus of this study is on the incentives faced by sell-side analysts. Weposit that these incentives are shaped by the sell-side analysts' desire to maxi-mize their long-term compensation. Evidence from surveys (Dorfman 1991)suggests that sell-side analysts' compensation depends on a variety of factors,including the volume of trading (i.e., brokerage commissions) generated by theirresearch reports, the evaluations they receive from their firm's brokerage salesforce, the success of their buy/sell recommendations, their reputation as mea-sured by their standing in the Institutional Investor polls, and their ability tosecure and retain investment banking clients for their firm. In the remainder ofthis section, we discuss the likely impact of these factors on sell-side analysts'forecasting behavior.
For brokerage firms, analyst research is overhead and generates little directprofit (Eccles and Crane 1988). It is estimated that the research function (per-formed in the investor services department) in an average brokerage firm costssomewhere between $30 million and $40 million (Donnelly 1991a). Brokeragefirms usually provide research reports free of cost to institutional investorclients. Thus, the research function is required to generate revenue for the other

The Effect of Investment Banking Relationships on Forecasts & Recommendations 135
aci vi'ies of a brokerage firm (Eccles and Crane 1988; Siconolfi 1992). Oneso :rce of revenue is brokerage commissions generated on trades executed'.hrough the investor services department of the firm. When a sell-side analystissues as'! optimistic earnings forecast and a buy recommendation on a company,the nrm s broker can call all his investor clients to urge them to buy the stock,rcsdlting in brokerage commissions for the firm (Konrad and Greising 1989).5-\ir a pessimistic earnings forecast and a sell recommendation, however, thebroker can call only those investors who already own the stock. Furthermore, for.sel;-side analysts, access to company management is essential, because companyrntnagernent is a key source of information for analysts. Sell-side analysts whoissue pessimistic earnings forecasts or sell recommendations on a company can="ali oui. of favor with the management of the company and so lose access to.-;o:npany management (Laderman et al. 1990; Berg 1990; Schipper 1991).
The need to generate brokerage commissions and to be on good terms withcompany management creates an incentive for sell-side analysts to be optimisticMl ;heii- research reports for all the companies they cover. Extant empirical evi-der;ce is consistent with analysts being (on average) optimistic in their earningsror'icasts (e.g., Lys and Sohn 1990; Abarbanel! 1991; Affleck-Graves, Davis,anc Mendenhal! 1990). Similarly, studies have shown that sell-side analysts tend..(: issus a significantly higher percentage of buy recommendations than sell rec-oinsnendations (Lloyd Davies and Canes 1978; Beneish 1991).'' If a company isa c-;ieni of the investment banking department of a brokerage firm, the financialanalys; of thai firm (working in the investor services department) is likely tovAz?, additional pressure to be optimistic about the prospects of that client com-pariy.''' This additional pressure most often comes directly or indirectly from thehivestment banking department of the firm and is driven by the apprehensioniha: the client company will terminate its investment banking relationship if thediifiyst 'ssues an unfavorable research report. Such pressure can also comedirectly i'rom the management of the client company (see endnote 3). This pres-:iuri io be optimi.stic about the prospects of the firm's investment banking clienth in addition to the pressure faced by the analyst to be optimistic in order togererate brokerage commissions and to retain access to the management of thecor.ipeny. The analyst, aware that his firm's profit is influenced by the nature ofhjs ressarch report, has an incentive to issue optimistic reports about the clientcompany.
Countervailing forces can mitigate the optimism of analysts for their firms'irvsstment banking clients. These include reduced credibility for the firms' ana-)ys;.'? resulting in loss of investor clients and the possibility of lawsuits from dis-siiiisried investors.'' We expect, however, that the countervailing forces will onlynp.-r the magnitude of the relative optimism of analysts for their investment
banking clients. Thus, we predict that eamings forecasts and investment recom-mendations issusd on a company by investment banker analysts will be moreopl^rnslic than the forecasts and recommendations issued on that company byiior.irtvesni'.ent banker analysts.
W.5 study both earnings forecasts and investment recommendations because

136 Contemporary Accounting Research
they are the two main outputs of an analyst's research effort. Francis and Soffer(1994) discuss three important differences between these two signals. First, anearnings forecast can be directly used by an investor in a valuation model; theprecise manner in which an investor evaluates qualitative information, such asan investment recommendation, is unclear. Second, an analyst's recommenda-tion ranges over a discrete five-point scale, whereas an earnings forecast isessentially a continuous variable. For this reason, earnings forecasts may beused to distinguish between companies that receive identical recommendations,and the weight placed on an earnings forecast can vary by type of recommenda-tion. Finally, because actual earnings are eventually released by a company, theanalyst can be directly evaluated based on his earnings forecast. This can temperanalysts' incentives to be optimistic. However, it is less clear how to evaluate ananalyst based on investment recommendations, because the magnitude of returnsto be earned and the time period over which to measure returns is unclear.Hence, accountability for investment recommendations is lower, and analysts'incentives to be optimistic are also likely to be lower. Because earnings fore-casts and investment recommendations are not perfectly correlated, and Francisand Soffer (1994) provide evidence that both variables (incrementally) explainsignificant portions of the abnormal returns around dissemination of analysts'research reports, it is interesting to study both earnings forecasts and investmentrecommendations.
Earnings forecasts can be compared to actual earnings numbers to deter-mine the extent of an analyst's optimism. However, as discussed previously, asimilar comparison cannot be made for investment recommendations. Therefore,in addition to examining the distribution of investment recommendations for theinvestment and noninvestment banker analysts, we also examine the returns thatwould be earned by following the recommendations of the two sets of analysts.If investment banker analysts' recommendations are more optimistic because ofthe investment banking relationship, and not because of more favorable informa-tion, we should expect the returns earned by following the investment bankeranalysts' recommendations to be lower than the returns earned by following thenoninvestment banker analysts' recommendations.
Because federal law requires, and the analysts' Code of Ethics recommends,that sell-side analysts' research reports disclose the firm's investment bankingrelation (if any) with the client company, this information is publicly available.If the capital market is semi-strong (efficient), we expect investors to discountinvestment banker analysts' earnings forecasts and rely more on earnings fore-casts issued by noninvestment banker analysts. Therefore, noninvestment bankeranalysts' earnings forecasts are likely to be a better proxy for the market'sexpectation of earnings than investment banker analysts' earnings forecasts.Thus, we predict that the capital market reaction to an earnings announcementwill have a stronger relationship with the noninvestment banker analyst's earn-ings forecast error than with the investment banker analyst's earnings forecasterror. For the same reason, we predict that the market reaction around the releaseof the investment banker analyst's research report will be weaker than the mar-

The Effect of Investment Banking Relationships on Forecasts & Recommendations 137
ket reaction around the release of the noninvestment banker analyst's researchreport. However, the power of the latter test can be diminished because therelease of the information in an analyst's research report occurs over an extend-ed period of time (this is discussed later in detail).
If investment banker analysts are relatively optimistic in earnings forecastsfor their firms' clients, they are sacrificing the accuracy of their earnings fore-casts. Therefore, it is possible that investment banker analysts' earnings fore-casts will be less accurate than the earnings forecasts of noninvestment bankeranalysts for the same company. However, if the investment banking departmenthas private information about the client company that is available to the firm'sanalyst (albeit, in violation of the Chinese Wall) or if the analyst has betteraccess to company management because of the firm's investment banking rela-tionship, then the loss in accuracy due to optimism can be mitigated by use ofsuperior information. Because brokerage firms rarely use accuracy in earningsforscasts as an explicit factor in determining an analyst's compensation (Ecclesand Crane 1988; Dorfman 1991), it is unclear whether the incentive to be opti-mistic will override the incentive to be accurate (by using private information).Further, if noninvestment banker analysts' earnings forecasts are used byinformed investors as a monitoring device, investment banker analysts will biastheir forecasts only so far as the expected accuracy of their forecasts equals thatof noninvestment banker analysts. Thus, whether investment banker analysts'earnings forecasts are more accurate or less accurate than those of noninvest-ment banker analysts is an empirical question.
Data, and MethodologyThe time period for this study is 1983 through 1988. For each year, we identifiedthe investment banker of a company from the Corporate Finance Bluebook{CFB).^ CFB is an annual publication that lists the names of the investmentbankers for about 400 companies traded mainly on the New York or AmericanStock Exchanges. CFB obtains information through an annual questionnaire sentto each company. We obtained from Corporate and Industry Research Reports(CIRR) and Investext, Inc. research reports issued by investment banker analystsfor each of the years their firm served as the investment banker for a company.We also obtained from (either of) the same two sources a research report issuedby a noninvestment banker analyst for the same company, issued on a date closeto (either before or after) the date of the investment banker analyst's researchreport for that company. If an investment banker analyst issued more than oneresearch report in a year, we used the last report for that fiscal year and the cor-responding noninvestment banker analyst's research report. Using the last repottwill bias our tests towards the null, for past studies have shown that analyststend to become less optimistic in their earnings forecasts the closer the forecastdate is to the fiscal year end (O'Brien 1988; Brown, Foster, and Noreen 1985;Brous 1992; Brous and Kini 1993). We used the criteria of the closest availabledate to maximize the possibility that the investment banker analyst's researchreport and the noninvestment banker analyst's research report used the same

138 Contemporary Accounting Research
publicly available information.Only companies with December 31 fiscal year ends were used in the study
because CFB is published on a calendar-year basis and lists the investmentbanker for a company for each calendar year. CIRR was our first choice for theresearch reports because it was available free of charge. Research reports forbrokerage firms not covered by CIRR were purchased from Investext. Machinereadable databases such as the International Brokers Estimate System (IBES)and Zacks Investment Research are not suitable for our study because they donot identify the brokerage firm and do not contain investment recommendations.Value Line Irivestment Survey research reports were not used as a benchmark(i.e., as noninvestment banker analysts), because their publisher. Value Line,Inc., is not a brokerage firm. We wished to compare an investment banker ana-lyst's earnings forecast and investment recommendation on a company to thoseof an analyst working for a brokerage firm that did not provide investment bank-ing services to that company. In addition. Value Line is issued at specific inter-vals during the year for companies in each industry. Because our study isdesigned such that the dates of issue of the investment banker analyst's and non-investment banker analyst's research reports are close to each other, using ValueLine would have resulted in substantial differences between those dates. Othernecessary data for the study were obtained from the Center for Research inSecurity Prices (CRSP) and COMPUSTAT tapes. We had 250 company-year obser-vations (102 companies) for which data were available on all the necessary vari-ables. Approximately 80 percent of the loss of observations was due to nonavail-ability of investment banker analysts' research reports. About 10 percent of theobservations were lost because the CFB did not list the company's investmentbanker for some years. The remaining observations were lost because data wasunavailable on CRSP and/or COMPUSTAT.
Industries ranging from two-digit SIC codes 10 to 87 were represented inthe sample. SIC code 49 (Electric, Gas, and Sanitary Service) had the largestnumber of observations (42), followed by SIC code 35 (Industrial and Commer-cial Machinery), which had 20 observations. The number of companies appear-ing once through six times (years) in the sample are 37, 22, 19, 13, 6, and 5,respectively. The number of years a company appears in our sample is not anindication of whether the investment banking relation is short term or long term,for substantial numbers of observations were lost due to nonavailability ofinvestment banker analysts' research reports. For the 102 companies in our sam-ple, no investment banking relation lasted less than four years (although theymight not be in the sample all four years), and no company changed its invest-ment banker. The number of observations for each of the years 1983 through1988 are 38, 42, 43, 45, 39, and 43, respectively. Investment banker analystsemployed by 18 different brokerage firms were represented in the sample. Ofthese 18, two are publicly traded, 12 are privately held, three are subsidiaries ofa U.S. company, and one is a subsidiary of a foreign company. The noninvest-ment banker analysts in the sample were employed by an additional 33 broker-age firms.

The Effect of Investment Banking Relationships on Forecasts & Recommendations 139
The difference, in calendar days, between the investment banker analyst'sresearch report date and the noninvestment banker analyst's research report datehas a mean of -13 days and a median of -7 . A negative (positive) number forthis variable indicates that the investment banker analyst's research report wasreieased before (after) the corresponding noninvestment banker analyst'sresearch report. For this variable, the 25th percentile was -43 days, the 75th per-cenlile was 18, the minimum was -84, and the maximum was 76. Because thesigned difference in dates can understate the true difference (because of offset-ting positive and negative differences), we also examine the unsigned differencebetween the two dates. The mean (median) unsigned difference was 37 (29)days, with a 25th percentile of nine, a 75th percentile of 72, a minimum of zero,and a maximum of 84. On average, the investment banker analysts' and nonin-vestment banker analysts' research reports were issued 170 days and 157 days,respectively, prior to the earnings announcement dates (the medians were 137and 128, respectively) and 13i and 118 days, respectively, prior to the fiscalyear end (with medians of 101 and 94, respectively). For all these variables, thedescriptive statistics were stable across years.
Because information about underwriting services provided by a brokeragefirm is publicly available, we investigated the extent of underwriting in our sam-ple to compare our sample to that of Lin and McNichols (1993). We found that32 companies had issued securities in the year in which those companiesappeared in our sample. Surprisingly, in only 14 of these cases was the under-writing brokerage firm the same as the brokerage firm listed as company'sinvestment banker in CFB. This indicates that brokerage firms listed as invest-ment bankers In CFB tend to be those with which the company has long-termrelationships, and not those with which it has short-term relationships character-ized by anderwriting. Thus, there is very little overlap between our sample andthe Lin and McNichols sample.'-'
For each observation, we calculated the (signed) earnings forecast error forthe iavestment banker analyst as the actual earnings per share minus the invest-ment banker analyst's earnings per share forecast, divided by share price of thecompany as of the beginning of the fiscal year. We also calculated the (signed)earnings forecast error for the noninvestment banker analyst in a similar manner,using the noninvestment banker analyst's earnings per share forecast. For thispurpose, both forecast and actual earnings were defined as the primary annualearnings per share before extraordinary items and discontinued operations.Adjustments were made for any stock splits or stock dividends announcedbetween the forecast date and the earnings announcement date. To ensure thatboth forecasts were based on the same number of outstanding shares, we alsoadjusted for stock splits and stock dividends announced between the investmentbanker analyst's research report date and the noninvestment banker analyst'sresearch report date.
We used signed earnings forecast errors to test for optimism in earningsforecasts. We examined this variable for potential outliers. Some outliers wereobserved, arid based on previous research using earnings forecast errors (with

140 Contemporary Accounting Research
share price as the deflator), we truncated these outliers at the largest one percent,two percent, and three percent of the absolute values of all observations for eachset of analysts."' The results were similar for all three truncation methods and forwhen the earnings forecast errors were not truncated. Deletion (as opposed totruncation) of the largest one percent, two percent, and three percent of theabsolute values of all observations for each set of analysts also had no signifi-cant impact on the results. For the sake of brevity, we report results only for thetwo-percent truncation rule.
To test for accuracy, we used the mean squared earnings forecast error forboth sets of analysts (investment banker and noninvestment banker). Meansquared error is defined as the square of the difference between the actual earn-ings per share and the analyst's eamings per share forecast, divided by shareprice of the company as of the beginning of the fiscal year. The influence ofoutliers was mitigated in the same manner as the signed earnings forecast errors,and results reported are for the two-percent truncation rule. We also conductedthe accuracy tests using mean absolute error, and the results were similar tothose of the mean squared error.
Most sell-side analysts use a five-point scale (1 = Strong Buy, 2 = Buy,3 = Hold, 4 = Sell, 5 = Strong Sell) for their investment recommendations.However, we found 28 (34) research reports in our sample, where the invest-ment banker analyst (noninvestment banker analyst) bad issued a qualitativeinvestment recommendation. In' addition, for seven observations, both theinvestment banker and the corresponding noninvestment banker analysts' rec-ommendations were qualitative. We read these 76 (28 -i- 34 -f- 7 -f- 7) researchreports and converted the qualitative investment recommendations into quantita-tive recommendations on the five-point scale. For most of the research reports,the classifications were fairly straightforward (e.g., "source of funds" can clearlybe classified as a "sell" recommendation). In cases where the appropriate classi-fication was not immediately obvious, we based our decisions on the additionalinformation and analysis in the research reports. To ensure unbiased decisions,the classifications were made without the authors having knowledge as towhether the qualitative recommendation was issued by an investment bankeranalyst or a noninvestment banker analyst. The list of qualitative investment rec-ommendations encountered in the sample and their classifications on the five-point scale are provided in the Appendix. The sensitivity of the results to inclu-sion or exclusion of observations containing qualitative recommendations is dis-cussed in the next section.
To measure the market reaction to earnings announcements, we used thecumulative abnormal return, generated using the market model, for the periodstarting from the (investment banker or noninvestment banker) analyst'sresearch report date and ending at the earnings announcement date. The para-meters of the market model were calculated using retums from 100 days beforethe analyst's research report date. We used the cumulative abnormal return start-ing from the research report date (instead of the returns around the earningsannouncement date) because the earnings forecast error measures new informa-

The Effect of Investment Banking Relationships on Forecasts & Recommendations 141
tion arriving in the market from the research report date to the earningsannouncement date; hence, the abnormal returns must be measured over thesame time period. We used the following regression to test the relation betweenthe capital market reaction to eamings announcements and the analyst's earningsforecast error:
CRj{RRDT,EADT] ^0^ + a^EFEj + ariDj-EFEj) + ayDj + e, (1)
where CR[RRDT,EADT] is the cumulative abnormal return from the analyst'sresearch report date (RRDT) up to the earnings announcement date (EADT).EFE is the signed eamings forecast error, as defined previously. The subscript,/indicates whether the observation pertains to an investment banker analyst (IB)or a noninvestment banker analyst (NIB). D is a dummy variable that takes thevalue of one, if j = IB, and a value of zero, if; - NIB.
The dummy variable (D) and the interaction term (D-EFE) capture the dif-ference in the intercept and slope coefficients, respectively, between the two setsof forecasts (IB and NIB), aj + aj is the slope coefficient for the investmentbanker analyst's earnings forecast error, and ttj is the slope coefficient for thenoninvestment banker analyst's earnings forecast error. If the relation betweenthe abaonnal return and the earnings forecast error is stronger for the noninvest-ment banker analyst's earnings forecast than for the investment banker analyst'searnings forecast, then (assuming positive slope coefficients) ai should begreater than tti + a2. This in turn implies that aj should be negative.
Pooling across analysts in the manner described previously may result incon-elated residuals and overstated degrees of freedom, because essentially thesame values of the dependent variable are included twice. Therefore, we alsoestimate the following regression separately for each type of analyst:
CR'iRRDT, EADT] = Po + p, -fFE + e (2)
We then test for the difference in R^ values between the two sets of analystsusing the formulae developed in Cramer (1987) for the expectation and varianceof i?2." if the relation between the abnormal return and the earnings forecasterror is stronger for the noninvestment banker analyst's earnings forecast, the R^from regression (2) should be greater for the noninvestment banker analyst thanfor the investment banker analyst.
Differences in the capital market's perception of the investment banker ana-lysts' and the noninvestment banker analysts' research reports can also bereflected in the market reaction around the research report dates. Therefore, weanalyze the squared standardized abnormal returns averaged over the three-dayperiod centered on the date of release of the research reports (hereafter, theannourscement period). We use a nondirectional test to abstract from difficultiesinvolving the measurement of earnings expectations at the time of release of theresearch reports. We use a methodology similar to that of Frost and Pownall(1994). Denoting the abnormal returns from the market model for each observa-tion j on day t of the announcement period (A) as Uj, and the variance of theabnormal return over the 100 day market model estimation period as Oy , the

142 Contemporary Accounting Research
average return around the investment banker analyst's (IB) research report datefor each observation j is calculated as:
r=+I
(3)
If the abnormal returns are not independently and normally distributed, theexpected value of the above statistic will not equal one. Therefore, we use theabnormal return during a nonannouncement period (NA) as a benchmark forcomparison. The nonannouncement period statistic is computed as:
/3 (4)^=-I0
I.r=-8
The difference between ARJA(IB) and ARp/^IB) [denoted by DIFj(IB)] hasan expected value of zero under the null hypothesis that there is no market reac-tion around the time of release of the investment banker analysts' researchreports. To compare the market reaction around the release of the investmentbanker analyst's research report with that of the noninvestment banker analyst's(NIB) research report, we compute a similar measure DIFj(NlB) to measure themarket reaction around the noninvestment banker analyst's research reportdates. If there is no differential market reaction, the expected value of DIFj(IB) -DIFj(NIB) should be equal to zero.
ResultsPrimary ResultsAfter truncating the outliers, we found, using the Kolmogorov-Smirnov test, thatneither the signed earnings forecast errors nor the difference in the forecast errorsbetween the two sets of analysts was normally distributed. Hence, the WilcoxonMatched Pairs Signed Rank Test is used to test for optimism in earnings fore-casts. Table 1 presents results for the test of relative optimism in investmentbanker analysts' earnings forecast errors. The mean, median, and standard devia-tion for the investment banker analyst's signed earnings forecast error are-0.0404, -0.0024, and 0.1230, respectively. The corresponding values for thenoninvestment banker analyst's signed earnings forecast error are -0.0280,-0.0013, and 0.0873. Negative means and medians for the investment banker andnoninvestment banker analysts' earnings forecast errors indicate that, on average,both sets of analysts are optimistic in their earnings forecasts. This is consistentwith prior enipirical research, which has documented that, on average, analystsare optimistic in their earnings forecasts. However, investment banker analystsare more optimistic on average than noninvestment banker analysts. The Z statis-tic from the Wilcoxon Test is -3.906, a finding which rejects the hypothesis (atthe one-percent level of significance) that the two sets of analysts are equallyoptimistic. Thus, the results are consistent with our prediction that the earningsforecasts of investment banker analysts are more optimistic than noninvestment

The Effect of Investment Banking Relationships on Forecasts & Recommendations 143
banker analysts.-^ Furthermore, a closer examination of the data revealed the fol-lowing: for 139 (55.6 percent) of the 250 observations, the investment bankeranalyst's earnings forecast was higher than that of the noninvestment banker ana-lyst; for 83 (33.2 percent) observations, the investment banker analyst's forecasstwas lower; and for 28 (11.2 percent) observations, the two forecasts were equal.
Examination of the mean and median forecast errors for each set of analystsin Table 1 suggests that the distributions of the aforementioned variables areskewed. Because skewness in the data can, in some cases, lead to inferenceproblems for the Wilcoxon Test, we also conducted the nonparametric BootstrapTest, which is robust to skewness.'-^ To conduct the Bootstrap Test, we used themethodology and the computer algorithms described in Noreen (1989). Resultsfor the Bootstrap Tests were similar to those of the Wilcoxon Test, and hence,are not reported.
To examine the economic significance of the difference in earnings fore-casts, we calculated the difference between the two forecasts, divided by thenoninvestment banker analyst's forecast. After adjusting for outliers (employingprocedures similar to those used for signed earnings forecast errors), the invest-ment banker analyst's forecast was, on average, 5.5 percent higher than the non-investment banker analyst's forecast (the median was 1.1 percent). In monetaryterms, the mean (median) raw difference between the two earnings per shareforecasts was $0,057 ($0,032). To assess the likely upper bound on the valuationimplications of this difference, we calculated a variable defined as the product ofthe difference in the earnings per share forecast between the two analysts, theprice-to-earnings ratio of the company, and the number of shares outstanding.After adjusting for outliers, the mean (median) for this variable was $60 ($8.4)million. In other words, if investors were to use a simple stock valuation modelbased on P/E ratios, the market value of the sample companies would be, onaverage, $60 million higher if they based their valuation on the investmentbanker analysts' earnings forecasts than if they based it on the noninvestmentbanker analyst's earnings forecasts.
TABLE 1Test for difference in signed earnings forecast errors
N = 250 N = 250Investment Banker Analyst's Noninvestment Banker Analyst's
Earnings Forecast Error* Earnings Forecast Error* Z Statistict
Mean Median Std. Dev. Mean Median Std. Dev._0.0404 -0.0024 0.1230 -0.0280 -0.0013. 0.0873 -3.906|
Investment Banker Analyst's Earnings Forecast Error (Noninvestment Banker Analyst'sEarnings Forecast Error) is the actual earnings per share for a company, minus the earnings pershare forecast by an analyst whose firm provides (does not provide) investment bankingservices to that company, divided by share price of the company at the end of the previousfisca! year.
This is the Z statistic from the Wilcoxon Matched Pairs Signed Rank Test.
indicates significance at the one-percent Save!, one-tailed.

144 Contemporary Accounting Research
TABLE 2Difference in investment recommendations
Panel A: Frequency distribution of investment recommendations
Recommendations
1 (Strong Buy)2 (Buy)3 (Hold)4 (Sell)5 (Strong Sell)
Investment Banker Analyst*
Freq. >
3812870140
Cum. Freq
38166236250250
. Cum. %
15.266.494.4
100.0100.0
Noninvestment Banker Analyst*
Freq.
2011391260
Cum.Freq.
20133224250250
Cum. %
8.053.289.6
100.0100.0
Panel B: Test for difference in investment recommendations
N = 250 N = 250
Investment Banker Noninvestment BankerAnalyst's Recommendation* Analyst's Recommendation* Wilcoxon Zf
Mean Median Std. Dev. Mean Median Std. Dev.2.240 2 0.773 2.489 2 0.788 -3.488|
* Investment Banker Analyst's (Noninvestment Banker Analyst's) Recommendation is theinvestment recommendation on a company's stock by an analyst whose firm provides (does notprovide) investment banking services to that company.
t Wilcoxon Z is the Z statistic from the Wilcoxon Matched Pairs Signed Rank Test.
i indicates significance at the one-percent level, one-tailed.
Table 2 presents a description of the investment recommendations. In PanelA, the frequency distributions show that 166 (66.4 percent) of the investmentbanker analysts' recommendations are either Strong Buy or Buy recommenda-tions, whereas only 135 (53.2 percent) of the noninvestment banker analysts'recommendations fall into these categories. Panel A also shows that neither setof anaiysts issued any Strong Sell recommendations. Panel B shows that themean investment banker analyst's recommendation is 2.240, whereas the meanfor the noninvestment banker analyst's recommendation is 2.489. This indicatesthat both groups of analysts tend to be optimistic in their recommendations, buton average, investment banker analysts are more optimistic than noninvestmentbanker analysts. The Z statistic from the Wilcoxon Matched Pairs Signed RankTest rejects at the one-percent level the hypothesis that the investment bankeranalyst's recommendation is (on average) equal to the noninvestment bankeranalyst's recommendation. This is consistent with our prediction.'" A closerexamination of the investment recommendations revealed the following: for 99(39.6 percent) of the 250 observations, the investment banker analyst's recom-mendation was more optimistic than the noninvestment banker analyst's recom-mendation; for 58 (23.2 percent) observations, the investment banker analyst'srecommendation was more pessimistic; and for 93 (37.2 percent) observations.

Tne Effect of Investment Banking Relationships on Forecasts & Recommendations 145
boih analysts issued the same recommendation.Por the 69 observations where either the investment banker analyst's
:X.S';£irch report, the noninvestment banker analyst's research report, or both, hadquti'iitative recommendations, the mean investment banker analyst's recom-mendation was 2.36, and the mean noninvestment banker analyst's recommen-dation was 2.59. The Z statistic from the Wilcoxon Test was -2.17, which is sig-nii'xant at the nve-percent level. For these 69 observations, the investment'^ankc! (noninvestment bat)ker) analysts had 9(3) Strong Buys, 34(29) Buys.,18(30) Holds, and 8(7) Sells. Thus, the results of the qualitative recommenda-.icns i'jbsarnple are consistent with those of the entire sample.
Because results in Tables 1 and 2 showed that, for both earnings forecastsand iffvestrnent recommendations, the investment banker analysts are moreonUmistic than noninvestment banker analysts, we examined whether there wasa correlation between the relative optimism in earnings forecasts and relativeoptimism in investment recommendations. We measured relative optimism inrecorriniendations as the difference between the investment banker analyst's rec-ommendation and the noninvestment banker analyst's recommendation. We
d relative optimism in earnings forecasts as the difference in earningsbetween the two sets of analysts deflated by share price. Using multi-
logic, we found that the relationship is not statistically significant (resultsare noi reported). ••'
Next, v'c examine the returns earned by following the recommendations ofrhs I vvo sets of analysts. One problem encountered in examining this issue is the'ntcrprctation of a Hold recommendation. We assumed two alternative interpre-iai'ons for a Hold recommendation. First, we assumed that the investor currentlyo«.':is ihe stock that has received a Hold recommendation. In this case, the Hold;cc:imrTiejidation is equivalent to a Buy recommendation. Second, we assumed{•!£;.. t(:e investor does not currently own the stock that has received a Holdreorninendation. In this case, if the investor follows the Hold recommendation,lie Investor would neither buy nor short sell the stock. Thus, under this assump-ticL; ihe reiorn on this stock is equal to zero. We examine the retums separatelyiof eich type of recommendation and across all recommendations. For a Sellrecfjmrnendation. we multiply the returns earned on a stock by - 1 . We examinebcvn short and long holding periods, ranging from 30 to 360 calendar days, and\r> addition, a holding period extending to the earnings announcement date. Thebeginning of the cumulation periods is the analyst's research report date.'*
Panel h in Table 3 shows the abnormal returns earned by following theinvestment recommendations of the two sets of analysts with Hold recommenda-;.:oirK treated as equivalent to Buy recommendations. Recall from Table 2 that,>:ViT;;!ijicariy, there are no Strong Sell recommendations in our sample. Panel Asho'vs ihat the abnonnal returns eamed by following both the investment bankerana v' Ls' recommendations and noninvestment banker analysts' recommenda-lioi;? are insignificantly different from zero for all holding periods for each typet f rKccirirncndation. The mean differences in abnormal returns are also not sig-?'ifi:?.r:tly different from zero for any of the holding periods. The results are

146 Contemporary Accounting Research
CO
•ac
So
-H-Cj^'^ 00 r^ o\ <N o OO —"4J ••— ^ O 00 O »—• O V^ O <T) O O^ O ^ O t^
^ d d d d d d ^ d d ^ d d d d d d
ES-^cS r3 5 c r o 5 ^ 8 0 o ' ~ ^ ^ c s • " - " " r - ^Z c t o II p—^ ^ ^ p r - . p T l P T I p p O * ^
<C :^ 'Z d d d d d d d d d d d—^ d d
2.0 ^ ^ OS CS Ov vo t ^ COm — -ts CS ^ ' ^ r o . — v c o , . . ^ — ^ ^ c s . . . - - , v o ^ - v v o ^ ^. _ « i 3 u o v o o v o O f - o c s 0 0 o - > * o t ~ -
C t n 11 O r o p r - ; Q ' * . ' ^ ' ^ ' ^ ^ ^ ' ^ * — ! ' ^
S Q ^
T l^—.. Ov .—^00 O —p p c~l
vo 00T) .-^ Ov ^-<.CS vo — COp rr; p rod d d d
p CS
d d
oOO ^~.CM voO (N
^ pd d d d
p rod d
00 ^~.CS r -O vo
d d
COp CN
d dpd d
vo00p t~d d
o d d "p CS
d ^
" ^ ov COo m o — \O '—' O
o — o ^00 00 00
-H-C j - ' ^ r < O *O C l O Tf4 > . « c a — < O O ' O O O N O C O — ' • ^ C S T ) '—«Tt
" ^ Q E/5 O ^ O —' Ov Ot— Ot^ O ON O " ^^ o o o o ^ o o o 0 0 0 0 0 0 0
rQ ^ ' ^ S * ^ ^ "" ^ ^ "^ ^s ' ^ *3 ^ O(N o o \ o < N -'—' CO T—. ^ — ; ^ o i/^^^ C M 11 3 '""' CS CD C!!5 O^ ^3 '~" CD f" ^D '"" O "'4"
<C -^ "Z. 0 0 00^ 00 O'-' C > O _ C > ; — ^ O O _
^ O ^ 0 0 00 .— t n O^ W^ \D
£9'c3i3 "TT 0 0 00 O'—' O ^ o o o ' o r ^ o ^C c/3 " O t^ O CO 00 O C 5 O C N O O J O '—'
<^2 : cjp 0 0 00 cio 0 0 c j o o c Di i - - ^ ! l I! 111! I!
<
£9 '^ S
0378
0
00
s
0092
<->
66)
0
68)
25)
0
0216
?
0267
0
005!
17)
1
0CS
44)
0
0240
=?
0298
0
0058
(-1
80)
?
31)
32)
0
0049
?
0028
0
0021
(01
0,
08)
0633
0
0394
0239
03)
98)
0
vo<-i
0964
0
0338
0626
50)
I)
73)
^
56)
^^
Ov
0 M
0 —
0456
84)
0563
44)
0 —
2•3
• 0
0-a0vo
•0-0000
CST3
0r-CN
-§0voro

The Effect of Investment Banking Relationships on Forecasts & Recommendations 147
2"53
OSJ5.
2"3
J O
g5
"Ss
I
o•c.<D
a
oldi
;g Q ^
— 00 r~ >o. . — , — . - ^ /--, oo -, CN|O Q O O O C ^ O — ' — •
P Pd d
p ~d d P "1d d P °d d
SO CT;do
Oo ^O "^do
o>n
Z c a II p cj< i, Z d d
S" "o o
en<N ...-.O NO
P ^d d d d
— o — o • *
1.5 r4 C00 —
I
ooo
?? o o ??S N-« o cs
gS l l p r ^ p p p " p p< i > Z d d d " d ~ d—:
E: 8 -(N
0p a\d d
op —d —
NONO ^-^O 00
d d
<npd
00 cn ONO N ^-N cn .-v 00" fn r-I >n CJO cn O M O O en
13 s
5 "
I 5 tt
oo o o oo oo oo oow ^^ ^.^ ^^ ' d ' J..
Ch cn — O 00 NO
O "^d d
'— o .—P ^ Pd d doo oo, oo oo oo oo,• ^ ON O N c
O ^-^cn - *p "1d d
ON ON m ON ON
C^ ^^ ^^ ^t" "^ ON cn '—" .-.< NO """ ^ 3
p r p c i o^n or^ O'—' o*—o™' o™ d~ dd dd dd
c~ ' ^ cn w-i 00 tn»n.^N ^^^^v ON..-^ ON.—, C N . ^ ^ t^^.-v~CNI —ON — Tj- Q — O O C N I O N•ri poo p— p"* o ^ P°°d o d d d ^ d o d d do
" fe; "^ oojj3 >>.„.— ^ ,..^is "M .3 ,. O NO/ ; c w " p cn
< i Z d d
o ^ o ~O —' O >n
"*(N
NO
O O Ti- O NO
o o ^ 9 o c op, op, p oI
ffi "« S' 7<
00
Z d ?
^ OJ ON —'
oo Ow~i p— r— t— o^ O ' ^ '—•COO ^ ^ f ^ 00\ Ow^ OOJ O*O
oo oo oo oo c5o oo'
K j _ ^ O 0 0 . " O O OS CO -et ON
( D ™ ^ rOvO C- r C IO O ^ ^ f i i c ^ O s O ' O ^^ Q O T '--?'^ O-™ OoO O' - ' O O Ov^ —(in
^ d o 9 ™ . o c ^ Q o o ™ d ^ O : £"^ •—^ O \ o r - 0 0 0 0 ' ^ 0 0 NO
t 2 . . C ' j - i < ^ 0 0 . . - V N O . — ^ o ^ , - ^ r ^ . . - N O N ^ - ^ c n ^ — , > n ^ - vK K 3 . S n o i o o t N w - i r ^ i . — O O c n o o c n c n ' ^ t ' ^^ C2 1/5 O ^ O O Oco O--" OON Of^ O 00
'^w d p dr4 d-—' d d dp d d d d
S - ^ S M — 00 — ON NO cn> s j ^ c n o . — ^ m . ' ^ i n ^ - . c N r — , c n . . - v C 4 . - ^ N O ^ - . s
S M S II o « n o - ^ t O t N o o o c N O NONo >n-=tc W5 o CN o "^ o m o o o NO o *n o "*d""^ -^ '^ d d d d d d d d d d d " d—
pa
T3OOO
3:- oC3 C
i .2
•S
ii
! -fi - a •=
H rE
8 £
•S E=5 g
' .2 .5
i''? gi l l fS

148 Contemporary Accounting Research
similar for Panel B, where a Hold recommendation is assumed to result in a zeroretum. These findings can be interpreted in two ways. First, if investment bankeranalysts were not justified in issuing relatively optimistic recommendations, thereturns from following their recommendations would be significantly lower thanthe returns from following the recommendations of noninvestment bankeranalysts. Because investors earn essentially similar returns in either case, it isreasonable to conclude that the relatively favorable recommendations of invest-ment banker analysts (documented in Table 2) are reasonable given their infor-mation set (i.e., they are not driven by investment banking relationships). On theother hand, it is possible to argue that if investment banker analysts werejustified in their relatively optimistic recommendations, following their recom-mendations would have resulted in a higher rate of return for the investor.Because this is not borne out by the empirical findings in Table 3, it is appropri-ate to conclude that the relative optimism in the recommendations of investmentbanker analysts is not justified on the basis of the information set used by themin forming their investment recommendations. Summarizing the results ofTables 2 and 3, it appears that, although investment banker analysts issue moreoptimistic recommendations than noninvestment banker analysts, it is not clearwhether the relative optimism of investment banker analysts is driven by morefavorable infonnation or the pressures of the investment banking relationship.
We then examine how the capital market perceives the earnings forecasts ofthe two sets of analysts. Results from estimation of regression equation (1) arepresented in Panel A of Table 4. Both a, and a, + a j , the slope coefficients forthe noninvestment banker analyst's and the investment banker analyst's earningsforecast errors, respectively, are positive, a finding consistent with previousresearch on the relation between market reaction to earnings announcements andearnings forecast errors. Consistent with our prediction, the slope coefficient, a2,is negative (-0.3219) and significantly different from zero at the five-percentlevel of significance (f = -2.034). This indicates that the strength of the relation-ship between the capital market reaction to earnings announcements and theearnings forecast error is greater for the noninvestment banker analyst's earningsforecast error than it is for the investment banker analyst's earnings forecasterror. As discussed previously, pooling across analysts in this manner may resultin correlated residuals and overstated degrees of freedom, leading to a falserejection of the null hypothesis. To address this concern, we estimate regression(2) separately for each set of analysts. The results, appearing in Panel B of Table4, show that the adjusted R^, and hence, the strength of the relation betweenabnormal returns and earnings forecast errors, is greater for noninvestmentbanker analysts. The Z statistic, calculated using the Cramer (1987) methodolo-gy, which tests for the difference between the two adjusted R^s is equal to 1.83and is significant at the five-percent level. Overall, the results in Table 4 suggestthat investors are aware of the conflict of interest problem associated with theinvestment banker analyst and rely more on the noninvestment banker analyst'sforecast to form their earnings expectations. Although this is consistent with ourprediction, it is important to note that our results are also consistent with market

The Effect of Investment Banking Relationships en Forecasts & Recommendations 149
TABLE 4Regression analysis of the relation between cumulative abnormal retums from analysts'research report dates to eamings announcement dates and analysts' eamings forecast errors
Panel At Combined regression for investment banker and noninvestment bankeranalysts with dummy variable for analyst type
Regression*t: CRj[RRDT,EADT] = a,, + a^EFEj + OiiDyEFEj) + a^Dj + £,(t statistics in parentheses)
N = 500
g,) Of Oj a, Adj. R^
0.0249 L0432 -0.3219 -0.0036 0.1996
(2.112)t (8.083)§ (-2.034)1 (-0.215)
Panel B: Separate regressions for investment banker and noninvestment bankeranalysts
0.0213(1.738)1:
0.0249(2.198)t
0.7213(7.590)§
1.0432(8.4!3)§
0.1852
0.2189
Regression*: CR[RRDT,EADT] = % +
(t statistics in parentheses)
N = 250 Investment Banker
Analyst (/5)
N = 250 Noninvestment Banker
Analyst (MB)
Z = 1.8'3 i,S?g::iificEnt aS the 5 percent level) for test of whether Adj. R^IB) < Adj.
* CR [liRDT, EADT] is the cumulative abnorma! retum from the analyst's research report date(R!iE>T) up {<:, the eamings an'iciincement date (EADT). EFEis the eamings forecast errordenned as ths: Kciuai earnings per share for a company, minus the analyst's earnings per shareforec.'is':. divided by ihe share price of the company at the end of the previous fiscal year.
• "he subsci ip! / indicaies whether the observation pertains to an analyst whose firm providesj.-ivesimen: banking services to ihat company (IB) or does not provide such services to thecompany (NIB). The dumsr.y variable D takes on a value of one if; = !B and zero if J = NIB.
;. indicates signir!ca.rice at the five-percent level, one-tailed.
;;- iiiaictiirs significance al the one-percent level, one-taiied.
pri'. es ie.flccting only the beliefs oi informed investors. Because the disclosure oftj-!'; jnvestrneni. banking relationship occurs in the investment banker analyst'sre:';{:arch report, fhe investors who do not receive the research report (or receiveon!;' selected portions of it) and the investors who do not read the report in itsentirety can be unaware of the investment banking relationship."
An alternative method of investigating how the capital market perceives theariaiysts' research reports is to examine the company's stock returns around theanaiysis' research report dates. We calculate squared standardized abnormalreturn for the announcement period as per equation (3) and subtract from it thes-quaxetl standaidiz.ed abnormal returns for the nonannouncement period as pereCjV-.iiion (4). These measures are calculated for the investment banker analyst

150 Contemporary Accounting Research
TABLE 5Market reaction around analysts' research report dates
Squared StandardizedAbnormal Return*
= 250 N = 250
Investment BankerAnalyst (IB)
Non-Investment BankerAnalyst (NIB)
Difference(IB - NIB)
AnnouncementPeriod
1.106
1.313
NonannouncementPeriod
1.032
1.049
Diff.t
0.074
0.264
-0.190
t stat.t
0.57
1.98§
-0.98
* These columns show the mean of the squared standardized abnormal return averaged over a three-day interval, oJcuIated as per equations (3) and (4) in the text. The announcement period isdefined as days-1,0, and+1, relative to the analysts' research report dates. The nonannouncementperiod is defined as days -8 , -9 , and -10, relative to tiie analysts' research report dates.
'<• The first two rows of this column show the mean difference in squared standardized abnormalreturns between the announcement periods and the nonannounceraent periods for the two sets ofanalysts. The last row in this column shows the mean of the difference between those numbers.
? This column shows the t statistics for the numbers shown in the previous column.
§ indicates significance at the five-percent level, one-tailed.
and the noninvestment banker analyst. Table 5 shows that for the investmentbanker analyst, the difference in squared returns between the announcementperiod and the nonannouncement period is 0.074, and not significantly differentfrom zero (f = 0.57). The corresponding number for the noninvestment bankeranalyst is 0.264 with a t statistic of 1.98, which is significant at the five-percentlevel. Thus, the results indicate that, whereas there appears to be no significantcapital market reaction around the investment banker analyst's research reportdate, there is a significant market reaction around the noninvestment banker ana-lyst's research report date. Again, this result confirms that market participantsseem to be aware of the effect of investment banking relationships on analysts'incentives and discount the optimism in the investment banker analyst's researchreport more heavily. However, Table 5 also shows that the difference betweenthe two reactions of-0.189 is not significantly different from zero (t = -0.98).
Several prior studies have implied that brokerage firm analysts first releasetheir research reports to their favored investor clients, then to their other investorclients, and finally to the general public (Abdel-Khalik and Ajinkya 1982; LloydDavies and Canes 1978; Beneish 1991; Donnelly 1991b). Furthermore, the evi-dence in Francis and Soffer (1994) is consistent with brokerage firms' institu-tional customers receiving the research reports prior to their retail customers.Francis and Soffer also state that only the institutional customers receive theresearch reports on a consistent and timely basis, whereas retail customersreceive only selected reports or selected information in the reports at the

The Effect of investment Banking Relationships on Forecasts & Recommendations 151
discretion of the broker. If the research report date represents the date on whichthe favored investor clients receive the report, the impact of the report on theprice of the stock is likely to be dispersed over an extended period beginning onor about that date. On the other hand, if the research report date represents thedata on which the general public receives the reports, the impact of the report onstock price is likely to be dispersed over an extended period prior to that date.For the reasons described above, we also examined the squared abnormal returnsfor periods ranging from -5 to +5 relative to the report date, and the results weresimilar to those reported in Table 5. The time period of dispersion can also varycross-sectionally across client companies and across brokerage firms (LloydDavies and Ganes 1978). These factors make it difficult to capture the capitalmarket effects of the release of (investment banker and noninvestment banker)analysts' research reports and can be responsible for the lack of statistically sig-nificant results in Table 5.'^
Table 6 presents results for the test of difference in accuracy betweeninvestment banker analysts' and noninvestment banker analysts' earnings fore-casts. The format is similar to Table 1, except that mean squared earnings fore-cast errors are used to test for accuracy, whereas signed earnings forecast errorswere used to test for optimism. Similar to the signed earnings forecast errors, themean squared earnings forecast errors and the difference in mean squared earn-ings forecast errors between the two sets of analysts were not normally distrib-uted and had a skewed distribution. Thus, similar to the tests for optimism, botha Wilcoxon Matched Pairs Signed Rank Test and a Bootstrap Test were con-ducted. Panel A in Table 6 shows that the mean, median, and standard deviationof the mean squared earnings forecast error for the investment banker analysts
TABLE 6Test for difference in mean squared earnings forecast errors
= 250
Mean Squared Earnings Forecast Error*
Investment Banker Analysts
Noninvestment BankerAnalysts
Z Statistic^
Mean
0.1952
0.1299
Median
0.0012
0.0018
0.5824
Std. Dev.
0.6759
0.4184
Times MoreAccuratet
106
107
Mean Squared Earnings Forecast Error is the square of the difference between actual earningsper share for a company and the earnings per share forecast of the analyst, divided by the sharewice. Investment Banker Analyst (Noninvestment Banker Analyst) is the analyst whose firmprovides (does not provide) investment banking services to that company.
The total of this column does not equa! l.'iO, because, in 37 cases, both analysts were equallyaccurate.
This is the Z statistic froiti the Wilcoxon Matched Pairs Signed Rank Test.

152 Contemporary Accounting Research
are 0.1952, 0.0012, and 0.6759, respectively. The corresponding values for thenoninvestment banker analysts are 0.1299,0.OOI 8, and 0.4184, respectively. TheZ statistic from the Wilcoxon Test is 0.5824, which is not significant at conven-tional levels. Results for the Bootstrap Test were similar and are not reported.Thus, the results in Table 6 indicate that the earnings forecasts of investmentbanker analysts and noninvestment banker analysts arc equally accurate.
The accuracy results of Table 6 are in contrast to the bias results reported inTable 1, which showed that investment banker analysts' earnings forecasts aremore optimistic than those of noninvestment banker analysts. One explanationfor these results is that in some situations investment banker analysts have supe-rior private infonnation, either due to better access to client management or dueto the transfer of proprietary client company information from the investmentbanking department to the firm's analyst. Depending upon the availability andquality of this private information and its use by investment banker analysts,their earnings forecasts for these situations are more accurate than those of non-investment banker analysts. In other situations where they do not have access tosuperior private information, the investment banker analysts issue relativelyopfimistic forecasts to please company management, a practice which results inless accurate forecasts. Thus, for the sample as a whole, the two forecasts areequally accurate. The last column in Table 6 shows that, for 106 (107) observa-tions, the investment banker analysts' eamings forecasts are more (less) accuratethan those of noninvestment banker analysts and that, for 37 observations, thetwo forecasts are equally accurate.
The results reported in Table 6 appear to be at odds with the results reportedin Table 4. Although, on average, noninvestment banker analysts are not moreaccurate in their earnings forecasts than investment banker analysts (Table 6),the capital market appears to rely more on the noninvestment banker analysts'earnings forecasts (Table 4). One explanation for the seemingly inconsistentresults is that ex ante, investors (being aware of the conflict of interest problemsassociated with the investment banker analyst) play it "safe" by relying moreheavily on the noninvestment banker analysts' earnings forecasts, even though,ex post, the two forecasts are equally accurate. However, if we expect thatinvestors learn from the historical accuracy of the two forecasts, this behavior isnot ex post rational for investors.
Sensitivity AnalysisAlthough our study is designed such that the dates of the two research reports areclose to each other, an alternative explanation for the reported results is thatinvestment banker analysts' and noninvestment banker analysts' research reportsare based on different public information sets. The descriptive statistics for thelead/lag between the two dates were provided earlier. We conducted two tests toexamine the sensitivity of the results to the difference in dates. First, we repeatedthe entire analysis using two portfolios based on whether the investment bankeranalyst's research report was issued before or after the noninvestment bankeranalyst's report. The results for both portfolios were consistent with the full sam-

The Effect of Investment Banking Relationships on Forecasts & Recommendations 153
pie results reported in Tables 1 through 6. '' Secotid, we divided the sample intothree equally sized portfolios based on the lead/lag between the two dates. Thethree portfolios consisted of observations where the investment banker analyst'sresearch report date was 27 days or more before (33rd percentile), 26 days beforeto four days after (66th percentile), and more than four days after the noninvest-ment banker analyst's research report date. The results for all three portfolioswere similar to the results reported in Tables 1 through 6,
For each of the two sets of analysts, we examined whether the relationbetween the abnormal returns and the earnings forecast errors (results reportedin Table 4) was sensitive to the number of days between the research reportdates and the earnings announcement date. The descriptive statistics for thesetwo variables were provided earlier. We formed two equally sized portfolios(split at median) based on the number of days between the investment bankeranalyst's research report date and the earnings announcement date. We alsoformed two similar portfolios based on the noninvestment banker analyst'sresearch report date. For these four subsamples, the results were similar to thosereported in Table 4.
We also examined whether the accuracy results reported in Table 6 are dif-ferent for cases where investment banker analysts underpredict earnings versuscases where they overpredict. For these two subsamples, the investment bankeranalysts and noninvestment banker analysts were equally accurate in their fore-casts, which is consistent with the results reported in Table 6. Next, we investi-gated whether the results reported in Tables 1 through 6 were being driven bythe cases where the brokerage firm performed underwriting services for the com-pany. We excluded the 14 observations that met this criteria and found that theresults for the remaining 236 observations were consistent with the full sampleresults reported earlier.
We also investigated whether the results were dependent on client companysize. We measured size as the market value of equity as of the end of the previ-ous fiscal year. The mean (median) market value of equity for our sample was$2.8 billion ($1.6 billion). We formed two equally sized portfolios based onmarket value of equity. Results for both large and small companies were similarto the full sample results reported earlier. Finally, we investigated the possibilitythat the results were driven by one particular brokerage firm with the largest fre-quency in the sample, either as an investment banker analyst or as a noninvest-ment banker analyst. First Boston appeared 71 times (28 percent of the sample)as an investment banker analyst (28 times as a noninvestment banker analyst);Duff and Phelps appears 32 times (13 percent of the sample) as a noninvestmentbanker analyst (24 times as an investment banker analyst). We repeated all thetests eliminating those observations that had First Boston as the investmentbanker analyst. We also repeated all the tests eliminating those observations thathad Duff and Phelps as the noninvestment banker analyst. In both cases, theresults were consistent with those reported earlier for the entire sample.

154 Contemporary Accounting Research
ConclusionsThe primary objective of this paper was to study whether financial analysts ofmultiservice securities firms (brokerage firms) that provide investment bankingservices to a company are optimistic, relative to other analysts, regarding thefuture prospects of their firms' investment banking clients. Our results show thatsuch analysts (investment banker analysts) are indeed optimistic relative to otheranalysts, both in terms of their eamings forecasts and their investment recom-mendations. Because there are no significant differences between the returnsearned by following the investment recommendations of the two sets of analysts,we cannot unambiguously conclude whether the relative optimism of investmentbanker analysts is due to more favorable information or due to the investmentbanking relationship. Capital market participants appear to be aware of the con-flict of interest problems of the investment banker analyst and rely more on thenoninvestment banker analyst to form their earnings expectations. There is a sig-nificant market reaction around the noninvestment banker analyst's researchreport date, but not around the investment banker analyst's research report date.However, the difference between the two market reactions is not statistically sig-nificant. One explanation for the latter result is that the release of the informa-tion in the research report occurs over an extended period of time, making it dif-ficult to detect market reaction to the report. Finally we find that, in spite of theirrelative optimism, investment banker analysts' earnings forecasts are, onaverage, as accurate as those of noninvestment banker analysts. Our study is pri-marily descriptive and does not address the issue of why investment banker ana-lysts would be optimistic, relative to other analysts, in an equilibrium setting,especially given the evidence in our paper that the market is not misled by theoptimism.
Financial analysts' research reports are an important source of informationfor capital markets, and it is important to understand the incentives of analysts.This study examined only one incentive, whereas analysts are influenced byseveral different incentives. A better understanding of analysts' incentives willhelp explain analyst behavior, some of which appears "irrational" on the surface.For example, Butler and Lang (1991) show that individual analysts have a ten-dency to be systematically optimistic or pessimistic about a company in theireamings forecasts. Abarbanell (1991) documents that analysts do not use allinformation in prior price changes to revise their earnings forecasts. DeBondtand Thaler (1990) find that analysts' forecasts of eamings changes tend to be tooextreme, relative to ultimate realizations of earnings changes, which is consis-tent with analyst overreaction. However, Abarbanell and Bernard (1992) findthat analysts' earnings forecasts underreact to recent earnings information.Kang, O'Brien, and Sivaramakrishnah (1994) provide evidence that analysts'earnings forecasts are not strictly rational and that the forecasts appear to beinduced by noninformational factors. A better understanding of analysts' incen-tives can help explain the results of these studies. Understanding the incentivesof analysts will also be useful to accounting and finance researchers becausethey frequently use analysts' earnings forecasts in their empirical work. It has
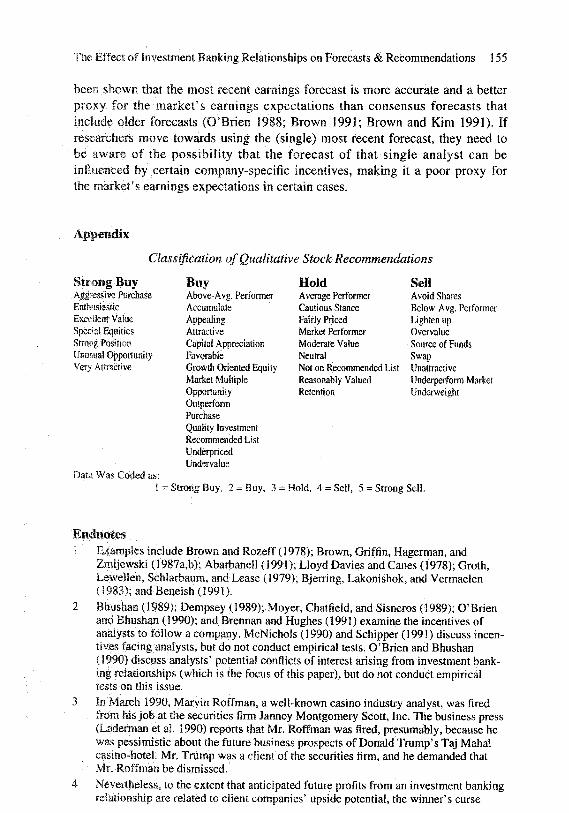
The Effect of investment Banking Relationships on Forecasts & Recommendations 155
been shown that the most recent earnings forecast is more accurate and a betterproxy for the market's earnings expectations than consensus forecasts thatinclude older forecasts (O'Brien 1988; Brown 1991; Brown and Kim 1991). Ifresearchers move towards using the (single) most recent forecast, they need tobe aware of the possibility that the forecast of that single analyst can beinfluenced by certain company-specific incentives, making it a poor proxy forthe market's earnings expectations in certain cases.
Appendix
Classification of Qualitative Stock Recommendations
Strong BayAggressive PurchaseEnthusiasticExcellent ValueSpecial EquitiesSti"OBg PositionUnusual OpporsunityVery Attractive
BuyAbove-Avg. PerformerAccumulateAppealingAttractiveCapital AppreciationFavorableGrowth Oriented EquityMarket MultipleOpportunityOutperformPurchaseQuality InvestmentRecommended ListUnderpricedUndervalue
HoldAverage PerformerCautious StanceFairly PricedMarket PerformerModerate ValueNeiitra!Not on Recommended ListReasonably ValuedRetention
SellAvoid SharesBelow..Avg. PerformerLighten upOvervalueSource of FundsSwap
UnattractiveUnderperform MarketUnderweight
Data Was Coded as:i = Strong Buy, 2 = Buy, 3 = Hold, 4 = Sell, 5 = Strong Seli.
Endnotes! Examples include Brown and Rozeff (1978); Brown, Griffin, Hagerman, and
Zmijewski (1987a,b); Abarbanell (1991); Lloyd Davies and Canes (1978); Groth,Lewelien, Schlarbaum, and Lease (1979); Bjerring, Lakonishok, and Vermaelen(1983); and Beneish (1991).
2 Bhushan (1989); Dempsey (1989); Moyer, Chatfieid, and Sisneros (1989); O'Brienand Bhushan (1990); and Brennan and Hughes (1991) examine the incentives ofanalysts to follow a company. McNichols (1990) and Schipper (199!) discuss incen-tives facing analysts, but do not conduct empirical tests. O'Brien and Bhushan(1990) discuss analysts' potential conflicts of interest arising from investment bank-ing relationships (which is the focus of this paper), but do not conduct empiricaltests on this issue.
3 In March 1990, Marvin Roffman, a well-known casino industry analyst, was firedfrom his job at the securities firm Janney Montgomery Scott, Inc. The business press(Laderman et al. 1990) reports that Mr. Roffman was fired, presumably, because hewas pessimistic about the future business prospects of Donald Trump's Taj Mahalcasino-hotel. Mr. Trump was a client of the securities firm, and he demanded thatMr. Roffman be dismissed.
4 Nevertheless, to the extent that anticipated future profits from an investment bankingrelationship are related to client companies' upside potential, the winner's curse

156 Contemporary Accounting Research
problem can exist.5 Observing a higher proportion of buys than sells does not necessarily imply that ana-
lysts are overly optimistic. First, because the expected return on stocks is positive,analysts will tend to issue more buys than sells. Second, if analysts fee! pessimisticabout a stock, they will tend to refrain from issuing a research report, rather thanissuing one with a sell recommendation.
6 The sell-side analyst also faces other company-specific incentives. Analysts fre-quently trade on their personal account in the stocks that they cover. The brokeragefirm's investment portfolio often consists of stocks and bonds of companies coveredby their analyst. The firm can be a specialist or a market-maker for a stock coveredby their analysts. Articles on these potential conflict of interest problems frequentlyappear in the business press (Dorfman 1992a,b). However, these company-specificincentives are not studied in this paper. Furthermore, this study assumes that theanalyst's decision (incentive) to follow a company is exogenous.
7 It is common for investors to bring claims against their brokerage firms, especiallywhen the analysts' recommendations turn sour (Konrad and Greising 1989; Dorfman)992a). Claims are usually filed under the antifraud provisions of Section ]0(b) ofthe Securities Exchange Act of 1934. Most of these claims are settled out of court,with the brokerage firm compensating the investor for the losses allegedly suffered.Claims not settled in this manner are usually decided by an arbitration panel of thestock exchange where the security is traded, or if traded over the counter, by an arbi-tration pane! of the National Association of Securities Dealers. Thus, very fewclaims against analysts end up in court.
8 CFB started publication in 1983 and provides only the name of the investmentbanker for each company. It does not provide any information about the nature ofthe services rendered by the investment banker to each specific company. Weattempted to acquire this information from other sources, but concluded that thisinformation is not publicly available, except for underwriting services for whichdocuments have to be filed with the SEC. Based on Eccles and Crane (1988) andarticles in the business press, we identified some of the services that investmentbankers perform (the list is by no means exhaustive): underwriting the issue of pub-licly traded securities, consultations on mergers and acquisitions invo!ving pub!ic]ytraded companies, valuation of fixed assets for sale or purchase, spinoffs or divesti-tures of divisions or subsidiaries, disposal of business segments, acquisition of pri-vate cornpanies, underwriting of private placement securities (usually debt), andconsultations on share repurchase, early bond refundings, renegotiation of debt con-tracts, obtaining bank loans, setting up executive compensation plans, joint ventures,financial strategy, asset financing, and dissuading corporate raiders. Investmentbankers are also frequently hired on a retainer basis for routine consultations (similarto attorneys). Occasionally, CFB listed more than one investment banker for a com-pany, but none of these companies appeared in our sample.
9 For the 14 companies where the underwriting firm was listed as the investmentbanker on CFB, it is quite likely that other services were performed by the invest-ment banker for that company in the same year. Each of these 14 companiesappeared at least two other years in our sample, listing the same brokerage firm asthe investment banker, but no underwriting services were performed in those years.For the 18 companies that did not list their underwriting firm as their investmentbanker (on CFB), we verified that the underwriting firm's analyst was not used asthe noninvestment banker analyst.
10 An examination of the source of outliers revealed that they were primarily caused bylarge numerators (difference between the actual and the forecasted earnings pershare), rather than small denominators (share price). The lowest share price in the

The Effect of Investment Banking Relationships on Forecasts & Recommendations 157
data was $1,625.1 i Haixis, Lang, and MSller (1994) have used this methodology in an accounting con-
text to compare the eamings response coefficients of U.S. and German companies.12 The signed earnings forecast errors were also measmed using the (absolute value of)
actual earnings per share as the deflator, instead of share pdce. Some outliers wereobserved in this measure, most of them due to large numerators and a few due tosmall denominators (actual earnings per share less than $0.10 per share). Based onprevious researchers' use of truncation rules for this measure, we truncated theerrors at ±1, ±2 and ±3. The results were similar for all three truncation rules and fordeletion of outlier observations. For the ±2 truncation rule, the mean, median, andstandard deviation for the investment banker analyst's earnings forecast error were-0.2662, -0.0227. and 0.5781, respectively. The corresponding values for the nonin-vestment banker analyst's earnings forecast error were -0.2069, -0.0150, and0.5972. The Wilcoxon Test rejected (at the one-percent level) the null hypothesisthat the two forecast errors are equal.
! 3 The Bootstrap Method of hypothesis testing involves derivation of the sampling dis-tribution of the chosen test statistic (in this case, the mean), assuming that the empir-ical distribution is representative of the true (population) distribution. The samplingdistribution is estimated by drawing simulated random samples (bootstrap samples)from the given sample. The significance level of the test is essentially the proportionof bootstrap samples for which the value of the test statistic (i.e., the mean) is atleast as large as for the original sample. See Efron (1979) for further details on theBootstrap Method, and Marais (1984) for application of this method to accountingresearch.
14 The nonparametdc test is used because the recommendations and the difference inrecommendations are not normally distdbuted.
15 Several explanations are possible for this result. First, investment recommendationspertain to a long-term horizon, whereas earnings forecasts pertain to the current fis-cal year. Second, analysts may use infonnation in earnings forecasts that are notused in investment recommendations, and vice versa. Third, the pressure to be opti-mistic can differ between investment recommendations and earnings forecasts.Because actual earnings are eventually reported, the analyst's forecast accuracy canbe measured unambiguously, whereas the criteria to evaluate an analyst's invest-ment recommendation are not very clear.
16 To exclude the effects of the market reaction around the analyst's research reportdate, we replicated the analysis by excluding from the cumulation period the twodays immediately after the research report date and obtained results similar to thosein Table 3. The abnormal returns are generated by using 100 days before the begin-ning of the holding pedod as the estimation pedod for the market model. We alsoconducted the analysis using raw returns, market-adjusted retums, and mean-adjust-ed returns and obtained similar results.
17 For our entire sample, we verified that the investment banking relationship was dis-closed in the investment banker analyst's research report. Thus, this infonnation ispublicly available and brokerage firms do not appear to violate the requirements ofthe Investment Advisers Act of 1940 or the recommendations of The Code of Ethics,with regard to disclosure of this relationship. In all cases, however, we found thatthe existence of the relationship was disclosed at the end of the research report.
! 8 Our results are in contrast to that of Francis and Soffer (1994) who find that revi-sions in analysts' earnings forecasts and changes in investment recommendationsexplain significant portions of the variation in abnormal returns around the analysts'research report dates. However, their sample is not random, but consists mainly ofcompanies that had an 80 percent or greater change in their earnings relative to the

158 Contemporary Accounting Research
previous year. Thus, by choosing companies that had large earnings changes, theymaximized the possibility of detecting market reactions to an analyst's researchreport.
19 For brevity's sake, details of the sensitivity analysis are not reported.
ReferencesAbarbanell, J. Do Analysts Earnings Forecasts Incorporate Information in Prior Stock
Price Changes? Journal of Accounting and Economics (June 1991), 147-166.——, and V. Bernard. Tests of Analysts' Overreaction/Underreaction to Earnings
Information as an Explanation for Anomalous Stock Price Behavior. Journal ofFinance (July 1992), i 181-1207.
Abdel-khalik, A. R., and B. Ajinkya. Returns to Informational Advantages: The Case ofAnalysts' Forecast Revisions. The Accounting Review (October 1982), 661-680.
Affleck-Graves, J., L. Davis, and R. Mendenhall. Forecasts of Earnings Per Share:Possible Sources of Analyst Superiority and Bias. Contemporary AccountingResearch (Spring 1990), 501-517.
Beneish, M. Stock Prices and the Dissemination of Analysts' Recommendations. Journalof Business, (Vol.64, No.3, 1991), 393-416.
Berg, E. Risks for the Analysts Who Dare to Say Sell. New York Times (May 15,1990).Bhushan, R. Firm Characteristics and Analyst Following. Journal of Accounting and
Economics (July 1989), 255-274.Bjening, J., J. Lakonishok, and T. Vermaelen. Stock Prices and Financial Analysts'
Recommendations. Journal of Finance (March 1983), 187-204.Brennan, M., and P. Hughes. Stock Prices and the Supply of Information. yo«r«a/ of
Finance (December 1991), 1665-1691.Brous, P. Common Stock Offerings and Earnings Expectations: A Test of the Release of
Unfavorable Information. Journal of Finance (September 1992), 1517-1536., and O. Kini. A Reexamination of Analysts' Earnings Forecasts for TakeoverTargets. Journal of Financial Economics {AprW 1993), 201-225.
Brown, L. Forecast Selection When All Forecasts Are Not Equally Recent. InternationalJournal of Forecasting (November 1991), 349-356.. An Evaluation of Alternative Proxies for the Market's Assessment of UnexpectedEarnings. Journal of Accounting and Economics (July 1987b), 117-41., and M. Rozeff. The Superiority of Analyst Forecasts as Measures of Expectations:Evidence from Earnings, Journal of Finance (March 1978), 1-16., P. Griffin, R. Hagerman, and M. Zmijewski. Security Analyst Superiority Relativeto Univariate Time-Series Models in Forecasting Quarterly Earnings. Journal ofAccounting and Economics {April 1987a), 61-87., and K. Kim. Timely Aggregate Analyst Forecasts as Better Proxies for MarketEarnings Expectations. Journal of Accounting Research (Autumn 1991), 382-385.
Brown, P., G. Foster, and E. Noreen. Security Analysts' Multi-Year Earnings Forecastsand the Capita! Market. Studies in Accounting Research No.21. AmericanAccounting Association, 1985.
Butler, K., and L. Lang. The Forecast Accuracy of Individual Analysts: Evidence ofSystematic Optimism and Pessimism. Journal of Accounting Research (Spring1991), 150-156.
Corporate Finance Bluebook. Zehdng Publications (New York, NY) and Silver PlatterInformation, Inc. (Boston, MA).Corporate and Industry Research Reports. JA Micropublishing, Bastchester, NY.

The Effect of Investment Banking Relationships on Forecasts & Recommendations 159
Cramer, J. Mean and Variance of R^ in Small and Moderate Samples. Journal ofEconometrics (July 1987), 253-266.
DeBondt, 'W., and R. Thaler. Do Security Analysts Overreact? American EconomicReview (May 1990), 52-57.
Dempsey> S. Predisdosure Information Search Incentives, Analyst Following andEamings Announcement Price Response. Tlie Accounting Review (October 1989),748-757.
Donnelly, B. Tough Times for Research Directors. The Wall Street Journal (May 28,1991a).. Street Squabble: Who Controls Research? The Wall Street Journal (June 11,1991b).
Dorfman, J. Analysts Devote More Time to Selling as Firms Keep Scorecard onPerformance. The Wall Street Journal (October 29, 1991).. Analysts Frequently Own Stocks They Tout. The Wall Street Journal (January 14,1992a).. Analyst Cheered Cascade But Sold Stock. The Wall Street Journal (March 11,1992b).
Eccies, R. G., and D. B. Crane. Doing Deals: Investment Banks at Wort HarvardBusiness School Press, 1988.
Efron, B. Bootstrap Methods: Another Look at the Jackknife. Annals of Statistics(January 1979), 1-26.
Fin.3ncial Analysts Federation. The Code of Ethics and the Standards of Professional
Conduct, 1988.Francis, 1, and D. Phiibrick. Analysts' Decisions as Products of a Multi-Task
Environment. Journal of Accounting Research (Autumn 1993), 216-230., and L. Soffer. The Relative Informativeness of Analysts' Stock Recommendationsand Earnings Forecast Revisions. Working Paper. Graduate School of Business,University of Chicago, August 1994.
Frost, C , aad G. Pownall. A Comparison of the Stock Price Response to EarningsDisclosures in the United States and the United Kingdom. ContemporaryAccoui%ting Research (Summer 1994), 59-83.
Groth, J., W. Lewellen, G. Schiarbaum, and R.Lease. An Analysis of Brokerage HouseSecurities Recommendations. Financial Analysts Journal (January-February 1979),16-27.
Harris, T., M. Lang, and H. P. Molier. The Value Relevance of German AccountingMeasures: An Empirical Analysis. Journal of Accounting Research (Autumn 1994),187-209.
Hazen, T. L. Treatise on the Law of Securities Regulation. Second Edition, Volumes 1and 2, West Publishing Company, 1990.
Investment Advisers Act of 1940. Code of Federal Regulations. Federal Law Reporter.Title 17, Fart 275.
Kang, S., J. O'Brien, and K. Sivaramakrishnan. Analysts' Interim Earnings Forecasts:Evidence on the Forecasting Process. Journal of Accounting Research (Spring1994), 103-112.
Konrad, W., and D. Greising. Are Analysts Putting Their Mouths Where the Money Is?The Wall Street Journal (December 18,1989).
Krishnan, M., and K. Sivaramakrtshnan. A Theory of Analyst Forecast Bias. WorkingPaper. Graduate School of Industrial Administration, Camegie Mellon University,.!anuary 1994.

160 Contemporary Accounting Research
Laderman, L., C. Hawkins, and I. Recio. How Much Should You Trust Your Analyst?Business Week (July 23,1990), 54-56.
Lin, H., and M. McNichols. Underwriting Relationships and Analysts' Research Reports.Working Paper. Graduate School of Business, Stanford University, January 1993.
Lloyd Davies, P., and J. Canes. Stock Prices and the Publication of Second-HandInformation. Journal of Business (November 1978), 43-56.
Lys, T., and S. Sohn. The Association between Revisions of Financial Analysts' EarningsForecasts and Security-Price Changes. Journal of Accounting and Economics(December 1990), 341-363.
Marais, L. An Application of the Bootstrap Method to the Analysis of Squared,Standardized Market Model Prediction Errors. Journal of Accounting Research(Supplement 1984), 34-54.
McNichols, M. Discussion of Analyst Following and Institutional Ownership. Journal ofAccounting Research (Supplement 1990), 77-82.
Moyer, R., R. Chatfieid, and P. Sisneros. Security Analyst Monitoring Activity: AgencyCosts and Information Demands. Journal of Financial and Quantitative Analysis(December 1989), 503-512.
Noreen, E. Computer Intensive Methods for Testing Hypotheses: An Introduction. JohnWiley and Sons, 1989.
O'Brien, P. Analysts' Forecasts as Earnings Expectations. Journal of Accounting andEconomics (January 1988), 53-83.-, and R. Bhushan. Analyst Following and Institutional Ownership. Journal ofAccounting Research (Supplement 1990), 55-76.
Schipper, K. Analysts' Forecasts: A Commentary. Accounting Horizons (December1991), 105-121.
Schultz, E. Analysts Who Write Lukewarm Reports Sometimes Get Burned. The WallStreet Journal iApn\ 23, 1990).
Siconolfi, M. At Morgan Stanley, Analysts were Urged to Soften Harsh Views. The WallStreet Journal (My 14, 1992).