AVIO: Detecting Atomicity Violations via Access-Interleaving Invariants
Upload
khangminh22Category
view
0download
0
Security Code Violations, Analysts’ Forecast Quality, and
Corporate Culture
Joseph Pacelli∗
January 2015
Abstract
Using a hand-collected sample of U.S. security code violations enforced by the Financial Industry
Regulatory Authority, I show that violations occurring outside of financial institutions’ equity
research divisions are positively associated with the forecast errors produced by analysts in financial
institutions’ equity research divisions. Further, I find that security violations are also associated
with more upwardly biased forecasts following recent equity underwritings, more downwardly biased
forecasts for firms that narrowly “meet or beat” consensus forecast estimates, and less informative
analyst reports. The association between security code violations and forecast errors appears to be
less pronounced for forecasts produced by All-Star analysts, who have higher levels of reputational
capital to preserve. Overall, these findings provide evidence consistent with a common profit-
oriented corporate culture influencing employee behavior across a multitude of business activities
within financial institutions.
Key words: Equity Analysts, Corporate Culture, Securities Regulation, Global Settlement
JEL classification: G14, G21, G24, G28, M14.
∗This paper is based on my dissertation work at the Samuel Curtis Johnson School of Management, CornellUniversity ([email protected]). I am grateful to my dissertation committee: Sanjeev Bhojraj (co-chair), Eric Yeung(co-chair), Rob Bloomfield and Roni Michaely. I have benefited from comments and suggestions received from VicAnand, John Donovan, Janet Gao, Jacquelyn Gillette, Yadav Gopalan, Allison Nicoletti and Ken Merkley. Allremaining errors are my own.

I. Introduction
It might sound surprising to a skeptical public, but culture was always a vital part of Goldman
Sachs’ success. It revolved around teamwork, integrity, a spirit of humility and always doing
right by our clients. The culture was the secret sauce that made this place great and allowed
us to earn our clients’ trust for 143 years.
–Greg Smith, Goldman Sachs (3/4/2012)
Modern financial institutions are complex intermediaries that must balance the demands of a
diverse set of stakeholders (e.g., shareholders, depositors, individual investors). Brokerage clients
want their trades to be executed faithfully and efficiently. Research clients want accurate and objec-
tive investment advice about potential investment opportunities. Depositors want their deposits to
be safe, and society wants to minimize systemic risk in the banking system. Because fulfilling these
demands often comes at the expense of generating profits for their shareholders, financial institu-
tions are subject to a host of regulations designed to protect these other stakeholders. In particular,
the securities regulations enforced by the Financial Industry Regulatory Authority (FINRA) repre-
sent an important and longstanding regulatory effort to protect financial institutions’ clients (i.e.,
individual investors) and maintain the integrity and stability of capital markets.1
Violations of security regulations can offer important insights to the quality of research that
financial institutions generate. Significant regulatory efforts (e.g., Global Settlement, NASD 2711,
NYSE 472) have been made to ensure that research divisions operate more independently, and
recent studies suggest that, in general, these efforts have been successful (e.g., Barber, Lehavy,
McNichols, and Trueman (2006); Ertimur, Sunder, and Sunder (2007); Chen and Chen (2009);
Barniv, Hope, Myring, and Thomas (2009)). However, regulators have warned that security code
violations can be indicative of more persistent and broader cultural problems within financial
institutions that are difficult to address with regulation. In this study, I seek to shed light on
this cultural phenomenon by examining whether and to what extent security code violations are
associated with the quality of earnings forecasts generated by financial institutions’ equity research
departments.
Consistent with corporate culture theories (e.g., Kreps (1990); Schein (1990)), I view security
code violations as an indicator for how profit-oriented the culture within the financial institution
is. Corporate culture is an intangible asset designed to meet unforeseen contingencies as they
arise (Kreps (1990)) and consists of the shared assumptions, values, and beliefs that inform how
employees behave within a firm (Schein (1990); Guiso, Sapienza, and Zingales (2014)). Compliance
with securities regulation depends heavily on the trade-offs employees make when considering the
interests of the institutions’ shareholders, who demand short-term profits, and the interests of
individual investors, who should receive high quality investment products as financial institutions’
customers. Since these trade-offs are likely to manifest themselves in the day-to-day choices that
1Financial institutions are also required to comply with banking regulation, in which the primary objectives are toprotect creditors/depositors and prevent systemic risk (Allen and Herring (2001)). For recent studies and discussionson banking regulation and its effectiveness, see Laeven (2013); Laeven and Levine (2009); Beltratti and Stulz (2009);Ongena, Popov, and Udell (2013).
2
employees make, culture is an important force that can facilitate coordination when employees face
choices that are difficult to regulate ex ante (O’Reilly (1989); Kreps (1990)). Moreover, contracts
are likely an insufficient mechanism for enforcing appropriate behavior within the firm since the
consequences of security code violations (i.e., reputational damage, litigation costs) are slow-moving
and difficult to detect in advance (Williamson (1975); Hermalin (2000)) while employee tenures are
typically low in the financial services industry.2 Thus, security code violations are consistent with
a profit-oriented corporate culture.
The association between financial institutions’ security code violations and the quality of earn-
ings forecasts issued by their analysts deserves better understanding because it could reveal an
important and unexplored determinant of their forecast quality (i.e., firm-level culture). Corporate
culture is latent and unobservable and identifying its effects empirically is challenging. Examining
the association between outcomes observed outside of the equity research division that appear to
be unrelated to equity research (e.g., unrelated security code violations in the investment bank-
ing division) and direct outcomes of the equity research division (i.e., earnings forecast quality)
allows me to alleviate some of this challenge by focusing on common behaviors observed across
operationally unrelated activities within the firm. This approach is similar to recent studies that
have identified cultural forces as an important explanation for common behaviors observed across
different business activities within a firm (e.g., Hoi, Wu, and Zhang (2013); Gao, Lisic, and Zhang
(2014)).
Earnings forecasts provide a useful output for examining the effects of corporate culture since
employees make similar stakeholder tradeoffs when producing earnings forecasts as they do when
considering compliance decisions. Similar to complying with securities regulations, producing high
quality earnings forecasts is potentially costly for financial institutions, since equity research de-
partments are not funded directly based on the quality of their earnings forecasts. Instead, the
institutional clients of the research division that ultimately fund research services, exhibit a low
demand for earnings forecast accuracy and, in more severe instances, may place pressure on ana-
lysts to bias their forecasts (upwards or downwards). Thus, the emphasis that analysts place on
producing high quality forecasts is a result of the trade-offs they make when considering share-
holders’ demands for profits and individual investors’ demands for high quality earnings forecasts.
Since equity research is difficult to regulate and monitor internally, the norms and values within the
organization are likely to play an important role in influencing the emphasis that analysts place on
producing high quality forecasts.3 Thus, it follows that producing low quality forecasts is consistent
2For example, median employee tenures at JPMorgan Chase & Co and Goldman Sachs Group were approximately2.6 years according to a recent survey (http://www.payscale.com/data-packages/employee-loyalty/full-list).
3In a frictionless market, analysts and financial institutions will associate by mutual choice. That is, analysts willseek jobs from financial institutions in which employees have similar values and financial institutions will try to hireanalysts that have similar values. In some instances, frictions can arise that may result in analysts being temporarilyemployed by an institution that has inconsistent values. In such instances, the culture of the institution can influenceanalysts’ behavior. If an analyst initially places a high emphasis on forecast quality, a shareholder-focused corporateculture can influence her to produce less accurate forecasts. Likewise, if an analyst does not initially place a highemphasis on forecast quality, a stakeholder-focused corporate culture can influence her to produce higher qualityforecasts.
3

with a profit-oriented corporate culture. Accordingly, financial institutions’ security code violations
should be positively associated with forecast errors.
There are, however, several counteracting forces that can justify a null result. First, analysts
are individual agents in the market that face strong economic incentives to produce high quality
forecasts. An analyst depends heavily on being perceived credible by market participants and has
strong incentives to build a reputation for providing accurate and objective forecasts (e.g., Hong,
Kubik, and Solomon (2000); Mehran and Stulz (2007)). Thus, even if a financial institution fosters
a profit-oriented culture, analysts may be unwilling to liquidate their personal reputational capi-
tal unless faced with a sufficiently valuable short-term payoff. Second, the profit-oriented culture
suggested by security code violations may not affect equity research departments if these depart-
ments have developed distinct subcultures that contain their own set of values and norms (Hofstede
(1998)). For example, the financial services industry has experienced widespread consolidation and
acquisitions over the past decade and often these acquisitions have resulted in “culture clashes”
between the parent firm and the new divisions.4 It is likely that many of the norms and values that
were established in the acquired divisions persist for several years after the acquisition. Third, one
might take the view that financial institutions view compliance with securities regulations simply
as a checklist of policies and procedures they must follow and fail to take an “enterprise-level”
approach that strives to provide value for all stakeholders across all of the firms’ business activ-
ities.5 Since analysts’ forecast quality is not directly regulated, security code violations should
not be correlated with forecast quality if institutions fail to integrate the objectives of compliance
into their overall corporate culture. Ultimately, it is an empirical question as to whether financial
institutions’ security code violations are associated with forecast accuracy.
I measure security code violations using a hand-collected sample of violations of all major
U.S. Security Codes enforced by the Financial Industry Regulatory Authority (FINRA) and its
affiliates (i.e., Nasdaq and NYSE). When financial institutions violate securities regulations, FINRA
issues a fine and creates a disclosure event that is published on BrokerCheck, an online tool that
allows investors to collect information about the financial institutions they transact with. My
primary empirical measures of security code violations consist of the frequency (i.e., total number
of disclosure events), severity (i.e., total dollar value of fines) and scope (i.e., number of unique
security codes violated) of all annual security code violations occurring between 2005 and 2012.6
To alleviate potential endogeneity concerns, my measures consist of only security code violations
related to activities outside of the research department. Thus, any association between security
code violations in non-research business activities and research quality can only be explained by
4For example, anecdotal evidence suggests significant culture clashes in the Merrill Lynch and Bank of Americamerger (http://online.wsj.com/news/articles/SB122662188273026611). Prior literature has also acknowledged “lackof cultural fit” as an important reason for why mergers and acquisitions fail (e.g., Weber, Shenkar, and Raveh (1996);Nahavandi and Malekzadeh (1988)).
5For example, see COSO Risk Management Summary. Practitioners have also discussedthe importance of enterprise-level approaches in moving towards a “culture of compliance”:(http://deloitte.wsj.com/cfo/2013/06/07/toward-a-culture-of-compliance-eight-initiatives-ccos-can-lead/).
6My main results are robust to scaling these measures by financial institution size and complexity.
4
common enterprise-level forces (i.e., corporate culture) in the financial institution.
I begin my analysis by testing the validity of my measures of security code violations. I first val-
idate the link between security code violations and corporate culture. Consistent with security code
violations being associated with cultural forces that are stable and slow to change, I find that secu-
rity code violations are also persistent. For example, after splitting my sample into terciles based
on all three proxies of security code violations, I find that 60-70% of institutions in the lowest (high-
est) tercile of violations remain in the lowest (highest) tercile of violations in the subsequent year.
Next, I also establish the connection between security code violations and stakeholder tradeoffs,
by examining its association with proxies for stakeholder protection and shareholder protection.
Consistent with security code violations being associated with poor stakeholder protection, I find
that security code violations are negatively associated with product quality scores from the Kinder,
Lydenberg and Domini (KLD) corporate social responsibility database. To test the association
between security code violations and shareholder protection, I construct proxies for shareholder
protection using the level of institutional holdings, the Gompers index and the number of insid-
ers sitting on the institution’s board.7 Consistent with security code violations being associated
with more shareholder protection, I find that security code violations are positively associated with
institutional holdings and negatively associated with both the Gompers index and the number of
insiders sitting on the institution’s board. Taken together, these results add credence to the notion
that security code violations reflect a cultural force that has an impact on stakeholder tradeoffs.
My main empirical analysis examines the relationship between security code violations and the
accuracy of the earnings forecasts produced by the analysts employed by these financial institutions.
My results indicate statistically significant positive associations between measures of security code
violations and relative forecast errors produced by financial institutions’ analysts. The results also
appear to be economically significant. A one-standard-deviation increase in the level of events,
dollar value of fines, or number of unique security code violations an institution incurs is associated
with an increase of approximately 2% to 4% in relative forecast errors. Overall, the results of this
test provide evidence consistent with the notion that cultural forces affect employee behavior in
operationally unrelated activities within financial institutions.
I conduct several robustness tests to strengthen my claim that the positive association between
security code violations and analysts’ forecast errors is indicative of broad cultural forces within
financial institutions. First, I consider scenarios in which it is unlikely that brokerage or investment
banking divisions of the financial institution will have any incentive to exert significant pressure
on equity research divisions. The absence of such incentives increases the plausibility that business
activities in the two divisions are unrelated and strengthens my claim that corporate culture drives
the association. Accordingly, I find that my results continue to hold for subsamples of forecasts
issued for thinly traded stocks (i.e., below the median trading volume) as well as forecasts that have
no investment banking affiliation (i.e., no initial public offering or seasoned equity offering in the
7Prior studies have established that higher levels of institutional holdings are generally associated with strongershareholder protection whereas lower levels on the Gompers index and fewer insiders are generally associated withstronger shareholder protection (Gompers, Ishii, and Metrick (2001); Larcker, Richardson, and Tuna (2007)).
5

prior twelve months). Second, I examine whether other visible channels (e.g., contracting, controls,
etc.) can explain the association between violations and forecast errors. I find that the main results
continue to hold after controlling for a number of other financial institution characteristics including
financial constraints, internal control quality, compensation schemes, and corporate governance
mechanisms. Taken together, the results from these analyses indicate that the positive association
between security code violations and forecast errors is driven by indirect, enterprise-level forces
that cannot be easily explained by investment banking influences and contracting or governance
mechanisms.
I conduct three sets of additional analyses to provide further insight on the association between
security code violations and forecast quality. My first set of additional analyses examines the
extent to which security code violations are associated with more strategic forecast biases. Under
certain scenarios, analysts face pressures to bias their forecasts (either upwards or downwards) and
I expect a profit-oriented corporate culture to increase analysts’ susceptibility to such pressures.
Accordingly, I consider two scenarios in which analysts are most likely to feel such pressures.
First, I examine investment banking affiliation as a setting that is likely to intensify pressures
to issue upwardly biased forecasts. Second, I consider forecasts for firms that narrowly “meet or
beat” consensus earnings forecasts as a setting in which managers are likely to pressure analysts
to “lowball” forecasts and issue downwardly biased forecasts. Consistent with my expectations, I
provide evidence that financial institutions with high levels of security code violations issue more
upwardly biased forecasts for firms having undergone an equity offering in the prior 12 months and
issue more downwardly biased forecasts for firms that just meet or beat the consensus earnings
forecast by 1 cent than they do for the other firms they cover. I also find that pressures to bias
forecasts upwards around recent equity offerings are particularly pronounced among junior analysts,
corroborating recent survey evidence by Brown, Call, Clement, and Sharp (2014) that suggests that
junior analysts are most susceptible to such pressures.
My second additional analysis examines the ability of analysts’ personal reputation, as measured
by All-Star rankings, to moderate the association between security code violations and forecast
accuracy. As discussed above, the effects of corporate culture are likely to be muted if analysts
have high levels of personal reputational capital to preserve. Consistent with this notion, I find
that the positive association between security code violations and forecast errors is significantly less
pronounced for analysts with All-Star status, suggesting that economic forces such as reputation
can lessen the effects of culture on individual behavior.
My third additional analysis examines whether security code violations have consequences for
the overall informativeness of analysts’ reports. Analysts’ reports do not necessarily bring new
information to the market and often contain repackaged or retransmitted information that is not
incrementally useful to individual investors (Lang and Lundholm (1996); Frankel, Kothari, and
Weber (2006)). Security code violations can reduce the informativeness of analysts’ reports because
they are associated with a culture in which analysts choose to focus more heavily on providing
soft services to their institutional clients and less on producing useful research reports for smaller
6
clients who cannot directly benefit from soft services (i.e., individual investors). Consistent with
this notion, my results indicate significantly negative associations between measures of security
code violations and report informativeness.
My study contributes to the literature across several dimensions. First, I contribute to the
literature examining the effects of sell-side analyst regulations and conflicts of interest. Prior
studies provide evidence that Global Settlement and related regulations were generally effective
in increasing the independence and objectivity of research divisions (e.g., Barber et al. (2006);
Ertimur et al. (2007); Chen and Chen (2009); Barniv et al. (2009); Kadan, Madureira, Wang, and
Zach (2009)). My findings suggest that, even in the presence of stricter divisional barriers within
financial institutions, broad cultural forces can still compromise analysts’ objectivity and lead to
lower quality research.
Second, I contribute to the literature examining the effects of corporate culture. My analysis of
security code violations allows me to shed important insight on how cultural forces within financial
institutions can affect stakeholder tradeoffs made across a multitude of business lines and ultimately
impact capital markets participants. In doing so, I contribute to a recent but growing literature
examining how corporate culture can affect firm behavior and policy choices (Hoi et al. (2013); Gao
et al. (2014); Popadak (2013); Guiso et al. (2014)), and demonstrate the effects of culture on the
quality of security analysts’ forecasts, which can have important implications for valuation.
Third, I contribute to the literature on the determinants of analysts’ forecast quality. Prior
studies consider financial institution characteristics such as size, business type, colleague quality
and reputation to be important determinants of forecast accuracy (Clement (1999); Jacob, Lys, and
Neale (1999); Cowen, Groysberg, and Healy (2006); Groysberg and Lee (2008); Fang and Yasuda
(2009)). I contribute to this literature by providing indirect evidence that corporate culture is an
important, unexplored financial institution-level characteristic that explains systematic differences
in forecast quality across different financial institutions.
More broadly, my study has implications for regulators and practitioners, as well as academics
that have begun to question the effectiveness of various compliance programs and risk management
approaches (Kaplan (2011); Cassar and Gerakos (2013)). Documenting an association between un-
related business activities in financial institutions provides indirect evidence to support regulators’
and practitioners’ suggestions that “enterprise-level” interventions that encourage ethical behavior
across all business activities (i.e., fostering a “culture of compliance”) can be an effective approach
to improving compliance within financial institutions.
This study proceeds as follows. Section II discusses the related literature and hypothesis devel-
opment. Section III describes the sample selection and security code data. Section IV provides the
baseline forecast accuracy results. Section V considers the robustness of my results to alternative
explanations. Section VI examines additional analyses. Finally, Section VII concludes.
7

II. Related Literature & Hypothesis Development
This section begins by summarizing the prior literature on corporate culture and discussing
its effects on stakeholder tradeoffs within financial institutions. Next, I provide background on
securities regulation and forecast quality and discuss the nature of stakeholder tradeoffs in these
areas. Finally, I generate testable hypotheses that follow from these literature reviews.
A. Prior Literature on Corporate Culture
Prior studies in economics and organizational behavior have offered several definitions for cor-
porate culture. Within the economics literature, corporate culture is often viewed as a substitute
for costly explicit communication that can help to improve coordination within the firm (Hermalin
(2000)). For example, Kreps (1990) defines corporate culture as an intangible asset designed to
meet unforeseen contingencies as they arise. Similarly, Cremer (1993) defines corporate culture
as the unspoken code of communication among members of an organization. Within the orga-
nizational behavior literature, corporate culture is generally viewed as a form of “social control”
that complements traditional control systems, such as incentives (Guiso et al. (2014)). Within this
literature, corporate culture is defined as a set of assumptions, beliefs, values and norms shared
by employees throughout the organization that informs which behaviors are appropriate (OReilly
and Chatman (1996); Schein (1990)). One common implication offered across the various defini-
tions of culture is that culture becomes important because employees “face choices that cannot be
properly regulated ex ante” (Guiso et al. (2014)). These choices are likely to manifest themselves
in day-to-day activities in which contracting is not feasible.
Identifying corporate culture empirically is challenging for at least two reasons. First, since
corporate culture is latent and unobservable, it is difficult to observe in archival data. While some
studies attempt to directly measure culture by developing proxies for employees’ beliefs using survey
instruments and employee job reviews (e.g., Guiso et al. (2014); Popadak (2013)), other studies
must rely on indirectly inferring the effects of corporate culture (e.g., Fahlenbrach, Prilmeier, and
Stulz (2012); Hoi et al. (2013); Gao et al. (2014)). For example, Fahlenbrach et al. (2012) observe
similar stock price performance among banks across two financial crises and interpret this finding
as indirect evidence of culture influencing banks’ risk-taking. Similarly, Hoi et al. (2013) examine
the association between irresponsible corporate social responsibility (CSR) acts and tax avoidance
and attribute the association to corporate culture influencing both policies in the firm. Likewise,
Gao et al. (2014) examine the relationship between CSR and insider trading and offer corporate
culture as a possible explanation for the association. I adopt a similar approach to these studies
by inferring the effects of corporate culture through the association between employee behaviors in
operationally unrelated activities of the firm.
The second challenge to identifying corporate culture relates to its multi-dimensional nature.
Prior studies have identified a number of dimensions of corporate culture including adaptabil-
ity, collaboration, teamwork, customer-orientation, detail-orientation, integrity, transparency, etc.
8
(O’Reilly, Chatman, and Caldwell (1991)). Although it is likely that each firm has its own unique
corporate culture with respect to all of these dimensions, one would not expect each of these di-
mensions to directly affect all policies within the firm. For example, observing employees taking
coffee breaks together may be indicative of a corporate culture that fosters “teamwork,” but this
should not necessarily have any direct effects on how “customer-oriented” or “results-oriented”
the culture is. Thus, it is critical for researchers to identify ex ante the particular dimension of
corporate culture that they expect to be relevant to the outcome variables of interest.
This study focuses on one particular dimension of corporate culture (i.e., profit-oriented) and
its effects on employee behavior within financial institutions. Since firms interact with a multitude
of stakeholders (e.g., customers, suppliers, shareholders, etc.), profit-oriented corporate cultures
are likely to have important effects for the trade-offs firms make when considering the competing
demands of these stakeholders. Firms that foster profit-oriented corporate cultures which place
a high emphasis on short-term profit generation are likely to take actions that are beneficial for
shareholders in the short run but damaging for stakeholder value (and potentially long term share-
holder value). For example, Popadak (2013) finds that corporate cultures that focus on profits and
results neglect other stakeholders, ultimately leading to long-term value deterioration for share-
holders. Similarly, Guiso et al. (2014) show that corporate cultures that foster integrity, or a
commitment not to engage in economic calculations, have stronger future performance, but weaker
shareholder governance mechanisms in place. Ultimately, how profit-oriented a firm’s culture is will
likely play an important role in regulating how employees deal with choices that involve competing
stakeholders’ interests.
B. Background on Securities Regulations
Securities regulation is designed with the objective of protecting individual investors’ welfare.
Since individual investors’ welfare is often at odds with generating short-term profits for sharehold-
ers, financial institutions have to balance the competing demands of these two stakeholders. On the
one hand, complying with securities regulations is costly and pressures from shareholders can lead
financial institutions to ignore regulations. For example, the SEC has warned that financial institu-
tions’ focus on short-term immediate profits often leads to compliance failures.8 In a similar vein,
academics have suggested that weaknesses in risk management and an overemphasis on shareholder
value may have contributed to many of the recent scandals occurring within financial institutions
(Laeven (2013); Ellul and Yerramilli (2013)). On the other hand, individual investors, who are often
at an informational disadvantage with respect to the financial institutions they transact with, rely
on financial institutions to exhibit a “high standard of care” and can be harmed when institutions
fail to comply with securities regulations.9 Noncompliance can exacerbate conflicts of interests
8https://www.sec.gov/news/speech/spch042303lar.htm9More specifically, broker-dealers are subject to a suitability standard when transacting with individual investors.
The SEC mandates the following: “In recommending to a customer the purchase, sale or exchange of any security, amember shall have reasonable grounds for believing that the recommendation is suitable for such customer upon thebasis of the facts, if any, disclosed by such customer as to his other security holdings and as to his financial situation
9
and lead financial institutions to recommend unsuitable products or fail to provide their clients
with objective and reliable investment advice, for example. Noncompliance also increases the risk
of future litigation costs and reputational damage and can ultimately hurt long-term profitability.
Thus, financial institutions must carefully consider the interests of competing stakeholders when
making compliance decisions.
Corporate culture can have important effects for financial institutions’ compliance because it
likely affects the stakeholder trade-offs employees make in their day-to-day activities. Employees
face choices relevant to compliance each day that are impossible to regulate ex ante and culture
can help to communicate the norms and values that are considered acceptable within the firm.
Consistent with this notion, regulators and practitioners have stressed the importance of culture
in affecting subtle day-to-day compliance decisions. For example, the Basel Committee on Bank-
ing Supervision notes that compliance should be ingrained within the culture of the organization
(Basel §6) and effective compliance requires institutions to place a strong emphasis on promoting
standards of honesty and integrity across all of their activities (Basel §2). Further, practitioners
have recommended enterprise-level approaches to compliance that treat compliance as a “cultural
ethic that should function like any other business asset that reaches across an organization.”10
Moreover, the SEC has also stressed the important effects that an institution’s culture can have on
compliance:
A culture of compliance [is] a culture of doing not only what is within the strict pa-rameters of the law, but also what is right - whether or not a regulator or anyone elseis looking. This culture underpins your business and the decisions and choices thatyou make every day, about small and not so small issues. For example, when you areconfronted with decisions about how to handle a customer’s complaint, how to correcta minor error in pricing or in net asset value, and how you deal with a disclosure issue- your decisions are made in the context of your firm’s compliance culture. It is criticalthat firms establish a strong culture of compliance that guides and reinforces employeesas they make decisions and choices each day. (SEC Speech, April 23, 2003)11
Overall, stakeholder tradeoffs are prevalent in the compliance decisions employees make within a
financial institution and culture is likely to play an important role in communicating the appropriate
course of action.
C. Background on Research Quality
Analyst research is an important service provided by financial institutions that is also subject
to significant stakeholder tradeoffs. On the one hand, analysts provide an important service to
individual investors as they help to serve an informational intermediary role in capital markets and
reduce information asymmetries between investors and the firms they invest in. A long literature
in accounting has demonstrated the impact that analysts’ forecasts can have on market prices
and needs.” (http://www.sec.gov/answers/suitability.htm)10http://deloitte.wsj.com/cfo/2013/06/07/toward-a-culture-of-compliance-eight-initiatives-ccos-can-lead/11https://www.sec.gov/news/speech/spch042303lar.htm
10

and information content (e.g., Lang and Lundholm (1996); Gleason and Lee (2003); Frankel et al.
(2006)). In addition, producing accurate forecasts has long-run benefits for financial institutions as
it allows them to generate a reputation for credibility and generate more revenues from investment
banking and brokerage businesses (Mehran and Stulz (2007); Ljungqvist, Marston, and Wilhelm
(2006)). Thus, producing accurate research is beneficial to the individual investors who rely on
analyst research when making investment decisions and can have long-term benefits for the financial
institution.
On the other hand, analyst research is largely funded by institutional clients that exhibit a
low demand for high-quality earnings forecasts. For example, Institutional Investor rankings con-
sistently rank “earnings forecast accuracy” among the lowest items of importance for institutional
clients, while softer services and skills such as “management access” and “accessibility” rank among
the highest (Bradshaw (2011)).12 Thus, shareholder pressures to maximize short-run profits may
lead analysts to neglect their earnings forecasts. By neglecting their earnings forecasts, analysts
are better able to focus their attention and efforts on meeting the more immediate demands of
institutional clients. In practice, this might require analysts to spend a large amount of their time
discussing investment strategies or performing ad hoc analyses for these clients, and less effort on
producing accurate earnings estimates. In addition, a focus on short-term profits can also increase
the likelihood that analysts bias their forecasts upwards or downwards, which also leads to less accu-
rate research. For example, investment bankers might pressure analysts to issue optimistic forecasts
to promote recent underwritings (Lin and McNichols (1998); Michaely and Womack (1999)). An-
alysts may also face pressures from firm management to bias their forecasts downwards to create
easily beatable earnings targets (Ke and Yu (2006); Hilary and Hsu (2013)). Since institutional
clients value access to management, these pressures are likely to be intensified within institutions
that place a high emphasis on short-term profits. Overall, the importance analysts place on their
earnings forecasts is likely to be a result of the trade-offs they make when considering competing
stakeholders’ interests.
Earnings forecasts provide a useful setting for examining the effects of corporate culture for sev-
eral reasons. First, unlike other products produced by financial institutions, earnings forecasts are
difficult to regulate. Although regulatory guidance urges analysts to provide “objective and reliable
research,” enforcing forecast quality is difficult since regulators are unable to determine the extent
to which analysts neglect their forecasts, intentionally bias their forecasts to mislead investors, or
are simply inaccurate due to low ability or chance.13 Similarly, even if financial institutions wanted
to set a high standard for forecast quality, it would be difficult to enforce and regulate analysts’
12Similarly, recent studies suggest that forecast accuracy is an insignificant determinant of analysts’ compensation(Brown et al. (2014); Groysberg, Healy, and Maber (2011)). Using survey data, Brown et al. (2014) finds thatequity analysts ranked forecast accuracy as the least important determinant of their compensation. Further, usingproprietary data obtained from a high-status investment bank, Groysberg et al. (2011) find that while investmentbanking contributions are strongly correlated with compensation, there is no evidence to support accuracy influencinganalysts’ compensation. The director of research at one large financial institution remarked that clients “pay for theservices of an analyst” and that it is not important that “they get earnings, or for that matter, stock prices, right”(Groysberg et al. (2011), p.985).
13http://finra.complinet.com/en/display/display main.html?rbid=2403&element id=7200
11
forecasts.14 Thus, market forces and traditional control systems are likely to be weak deterrents
in preventing analysts from acting opportunistically when generating earnings forecasts. Instead,
elevating forecast quality to a level of a “value” or “norm” within the financial institution might be
a more effective way of enforcing appropriate behavior. Second, prior studies examining determi-
nants of forecast quality have noted substantial cross-sectional differences in forecast quality across
different financial institutions (Clement (1999); Jacob et al. (1999); Cowen et al. (2006); Groysberg
and Lee (2008)). For example, these studies have identified financial institution characteristics
such as size, business type, and colleague quality to be important determinants of forecast quality.
Corporate culture can be an important unexplored financial institution-level characteristic that
explains systematic differences in forecast quality across different institutions. Third, Global Set-
tlement and other significant regulatory efforts have been made in the research industry to increase
analysts’ objectivity. While creating divisional lines (i.e., the “Chinese Wall”) between research
divisions and investment banking/brokerage divisions has generally improved research quality (e.g.,
Ertimur et al. (2007); Chen and Chen (2009); Barniv et al. (2009); Kadan et al. (2009)), culture
may be a powerful force that limits the effectiveness of these regulations.
D. Hypothesis Development
Taken together, the preceding arguments imply that if a profit-oriented corporate culture affects
stakeholder tradeoffs in a financial institution, security code violations are likely to be positively
associated with analysts’ forecast errors. As discussed above, profit-oriented corporate cultures will
encourage analysts to spend less time on producing accurate earnings forecasts and potentially also
allow biases to influence analysts’ forecasts. Accordingly, this leads to my first hypothesis:
Hypothesis 1: Financial institutions’ security code violations are positively associated with abso-
lute forecast errors.
Hypothesis 1 does not distinguish between analysts exerting less effort on their forecasts or
being more susceptible to pressures to bias their forecasts. My second set of hypotheses examines
the extent to which analysts’ forecasts exhibit intentional bias. As discussed earlier, analysts face
pressures to bias their forecasts upward or downward from different parties, which may result in
forecasts that are overall less accurate but exhibit no sign of strategic bias, on average. Thus,
identifying strategic biases in their forecasts requires identifying specific settings in which these
biases are more likely to appear.
To identify strategic biases in analysts’ forecasts, I consider two unique settings in which analysts
are likely to face pressures to bias their forecasts. The first setting relates to a scenario in which
analysts are likely to face pressures to issue upwardly biased forecasts. Analysts generally face such
pressures in the period following recent equity offerings. In this period, analysts are often expected
14On the other hand, regulators and firm management have had more success at regulating other components of theanalyst report such as recommendations. Following Global Settlement, most financial institutions began to carefullymonitor the percentage of buy/sell/hold recommendations to meet regulatory requirements (Kadan et al. (2009)).
12
to issue optimistic forecasts for recent investment banking clients in order to promote the firms (e.g.,
Lin and McNichols (1998); Michaely and Womack (1999)). Accordingly, Hypothesis 2A predicts
increased levels of upwardly biased forecasts around equity offerings for financial institutions that
have more security code violations. Specifically:
Hypothesis 2A: The relation between financial institutions’ security code violations and upwardly
biased forecasts is more positive following recent underwriting activity.
The second setting relates to a scenario in which analysts are likely to face pressures to issue
downwardly biased forecasts. Analysts may face such pressures from managers of firms who are at
risk of not meeting or beating earnings estimates. Managers of such firms may pressure analysts
to “lowball” forecasts to increase the likelihood that they can meet the earnings threshold (e.g.,
Bhojraj, Hribar, Picconi, and McInnis (2009); Hilary and Hsu (2013)). Accordingly, Hypothesis
2B predicts increased levels of downwardly biased forecasts for firms that just meet or beat the
consensus earnings forecast when those forecasts are produced by analysts at financial institutions
with more security code violations. Specifically:
Hypothesis 2B: The relation between financial institutions’ security code violations and down-
wardly biased forecasts is more positive for firms that narrowly “meet or beat” consensus earnings
forecasts.
My third hypothesis examines the ability of economic forces to counteract the effects of corporate
culture. The effects of corporate culture on stakeholder tradeoffs in research divisions may be
lessened if analysts have strong external incentives to produce high quality forecasts. Prior studies
have shown that analysts depend heavily on being perceived credible by market participants and
have incentives to build a reputation for providing accurate and objective forecasts (e.g., Hong et al.
(2000); Mehran and Stulz (2007)). Fang and Yasuda (2009) also show that analysts’ reputational
concerns are stronger than institution-level reputational concerns in disciplining analyst behavior.
Thus, analysts who have developed strong reputations for producing accurate forecasts may be
less likely to adhere to norms that are damaging to individual investors. Accordingly, my third
hypothesis examines the ability of All-Star Analyst rankings, an important indicator of analysts’
reputational capital, to moderate the association between security code violations and forecast
errors.
Hypothesis 3: The relation between financial institutions’ security code violations and absolute
forecast errors is less positive for forecasts produced by All-Star Analysts.
My fourth and final hypothesis examines whether and to what extent security code violations
have consequences for market participants, in terms of analysts’ report informativeness. Analysts
do not necessarily always bring new information to the market, and prior studies have demon-
strated that analysts often repackage or retransmit information that is not incrementally useful
to individual investors (Lang and Lundholm (1996); Frankel et al. (2006)). Further, analysts’
13
incentives to intentionally misinform individual investors through biased forecasts also limits the
ability of their reports to enhance informational efficiency. Consistent with this notion, regulators
have warned that poor compliance can prevent clients from making fully-informed investment deci-
sions.15 Accordingly, if security code violations have negative consequences for market participants,
they should be associated with less informative reports, leading to my fourth hypothesis:
Hypothesis 4: Financial institutions’ security code violations are negatively associated with report
informativeness.
III. Data & Sample Selection
This section discusses the security code data used throughout the study. I begin by discussing
the sample selection and the measures of security code violations. Next, I discuss key characteristics
of security code violations and FINRA BrokerCheck disclosure events. Finally, I validate that
the measures of security code violations are consistent with the claim that cultural forces affect
stakeholder tradeoffs made within financial institutions.
A. Sample Selection
I start my sample selection by obtaining a list of financial conglomerates with U.S. security
subsidiaries from the Federal Reserve.16 This initial sample consists of 80 security subsidiaries
across 59 financial institutions. The financial institutions in this sample are among the largest and
most complex financial conglomerates in the world and collectively hold the vast majority of U.S.
banking assets. For each of the security subsidiaries in the initial sample, I collect SEC registration
numbers from the SEC website, to ensure an accurate match to security code data.17 Several of
the institutions in the sample, such as Wells Fargo & Company, are a result of large mergers and
acquisitions.18 For these institutions, I exclude their observations prior to the merger date.
My sample is further restricted by the availability of analyst forecast data. For each of the
financial institutions in the sample, I hand-collect financial institution names from I/B/E/S (using
the 2007 broker translation file). To be included in the sample, I require the financial institution
to employ at least one analyst covering a firm that is covered by at least one other institution in
the sample. This facilitates relative comparisons of analysts’ forecasts across financial institutions
within my sample. Table I, Panel A presents the final sample of financial institutions, including
their SEC numbers and Central Registration Depository (CRD) numbers (obtained from FINRA).
The sample consists of 48 security subsidiaries across 29 financial institutions and includes 204
financial institution-years.
15http://www.sec.gov/News/Speech/Detail/Speech/1370539960588#.U78p IdV8e16http://www.federalreserve.gov/bankinforeg/suds.htm17http://www.sec.gov/about/offices/oia/oia regstat.htm18Wells Fargo & Company merged with Wachovia Corporation near the end of 2008.
14
For each of the security subsidiaries in the sample, I download and collect BrokerCheck reports
from FINRA’s website using the web tool outlined in Appendix A. The BrokerCheck report is a tool
that FINRA provides to allow investors to research the regulatory history of any financial institution
or individual broker. This data also contains information regarding the types of businesses these
financial institutions engage in. Table I, Panel B provides the distribution of the “Business Type”
as reported by FINRA. Although my sample focuses on large financial conglomerates, there still
exists some heterogeneity across the business lines in which these institutions engage in. All of
the financial institutions in the sample are an underwriter or selling group participant of securities
(n = 29 financial institutions) and many institutions deal common products such as corporate
equity securities (n = 25 financial institutions). Far fewer institutions participate in more exotic
businesses such as real estate syndication (n = 3 financial institutions) or sales of oil and gas
interests (n = 4 financial institutions).
The primary data for security code violations used throughout the study comes from the “Dis-
closure Events” section of the FINRA BrokerCheck reports. These events contain all relevant
information related to disciplinary events, as reported by securities regulators. Table II outlines
the sample selection procedure for this data. In the sample, I include all completed (i.e., not
pending) disclosure events with non-missing case numbers issued between 2005 and 2012, so as to
reduce the influence of Global Settlement and other related regulatory actions on my results and
ensure that research divisions are operationally independent. I delete disclosure events with missing
(or duplicate) case numbers, as well as disclosure events with no fines indicated in the allegations
section of the report. I retain only disclosure events issued by major regulatory agencies (FINRA,
NASD, and NYSE) and exclude disclosure events issued by state agencies to avoid double counting
events, as many of these events are redundant. Finally, to alleviate potential endogeneity concerns,
I exclude events related to research department activities. Specifically, I delete 20 observations in
which the allegations mention the word “Research” or contain violations of NASD Code 1050 or
NASD Code 2711, which regulate equity research. As discussed in Section II, these violations are
likely rare because research quality is difficult to regulate. Nonetheless, removing these observa-
tions allows me to cleanly examine the association between employee behavior in one division of
the financial institution (e.g., brokerage or investment banking divisions) and behavior in another
division of the institution (i.e., research division), which I posit is driven by an overall corporate
culture within the financial institution. The final sample consists of 472 disclosure events issued
between 2005 and 2012.
B. Measures of Security Code Violations
I create three measures of security code violations using data obtained from the “Disclosure
Events” section of the BrokerCheck reports. The first is the number of disclosure events (To-
talEvents) the financial institution experiences in a year. The second is the total dollar value of
fines (TotalFines) sanctioned against the financial institution in a year. The third variable is the
total number of unique security code violations (TotalCodes) a financial institution experiences in
15
a year. TotalEvents proxies for the frequency of security code violations, while TotalFines better
captures the severity of security code violations. TotalCodes captures the scope of security code
violations within the financial institution, but is potentially a noisier measure as a substantial
number of disclosure events fail to indicate the particular security code violated.19 All variable
definitions are also provided in Appendix B.
Figure 1 provides examples of several disclosure events. In Example 1, the financial institution
was fined approximately $1,000,000 for violating short-sale regulations around five IPOs, by selling
certain securities short prior to the pricing of the public offerings (to artificially depress the price)
and then repurchasing them. In Example 2, the financial institution was fined $375,000 for violating
NASD Rules 2110, 2210 and 3010 by selling collateralized mortgage obligation securities to unso-
phisticated investors.20 Both examples are consistent with violations reflecting a profit-oriented
corporate culture in which employees take actions that appear to be geared towards generating
short-term profits at the expense of other stakeholders’ welfare.
One potential limitation of this data is that the date of the actual violation is rarely refer-
enced. Instead, FINRA only reports the date that the institution is sanctioned. The reports that
do disclose event dates vary substantially, with some events occurring recently (e.g., prior year)
and others occurring many years earlier. Thus, my financial institution-year measures of security
code violations rely on the year reported within the “sanction date” and assume that compliance
problems remain relatively constant between the event date and the sanction date. However, to the
extent that compliance is driven by cultural forces in the firm, this assumption is consistent with
prior studies that suggest that culture within firms is persistent and slow to change (e.g., Tayler
and Bloomfield (2011)). I test the validity of this assumption in Section III.E.
C. Security Code Violation Characteristics
As illustrated in the examples in Figure 1, disclosure events are often bundled with a number
of security code violations, likely due to the fact that FINRA frequently conducts cycle audits. In
order to gain a better understanding of the nature of these violations, I manually count, read and
hand-collect the types of violations referred to in the “Allegations” section of all of the BrokerCheck
reports. Across the 472 disclosure events, there are 1,108 unique security code violations.
Table III presents key characteristics of the security code violations in the sample. Panel A
presents the frequency of disclosure events by the number of violations reported. The majority
of the disclosure events have between 1-3 violations (12%+24%+16% = 52%). About 24% of the
events do not identify a particular violation, and 7% of the events have more than 5 security code
violations. These differences may be related to the level of effort that the agent reporting the
violation exerts when recording the incident.21
19In subsequent analyses, I construct variables of interest based on the natural log of these three variables (i.e.,LogFines, LogFines, and LogCodes) to reduce the influence of extreme observations on correlation and regressioninferences. To ease interpretation, I refer to the raw variables when discussing the summary statistics.
20The allegations section of this report is truncated to preserve space.21For example, the disclosure events that disclose more security code violations also appear to have more detailed
16
In general, FINRA regulation covers a wide array of market activities, ranging from broad
rules such as FINRA 2010, which relates to poor business conduct and a general lack of “just
and equitable” trading practices to more specific rules such as FINRA 3300, a rule designed to
prevent money laundering. Table III, Panel B lists the top 10 most frequently occurring securities
code violations that occur in the sample. Disclosure events in the sample often contain a violation
of NASD 2110 (42% of events) and its successor rule, FINRA Rule 2010 (12% of events), both
of which are related to violations of “Standards of Commercial Honor and Principles of Trade.”
Other violations are more specific. For example, 6% of events violate NASD Rule 2320 “Order Data
Transmission Requirements,” which requires reasonable due diligence in routing customer trades
and 10% of events violate NASD Rule 6130 “Trade Report Input,” which requires the institutions
to submit accurate trade information. The codes I document as occurring most frequently are also
consistent with the codes that FINRA warns are most frequently violated.22
Developing a consistent categorization of the violations is challenging since FINRA is the result
of consolidation of major enforcement operations of the NASD and NYSE. Thus, the rule books
have changed and evolved over time and many older rules have simply been renumbered under
the new regime (e.g., NASD 2110, the former business conduct rule, appears to be equivalent to
FINRA Rule 2010 now). To facilitate the analysis, I develop a framework to categorize violations
by manually mapping each each of the violations in the sample to one of the major categories
(i.e., 4-digit level) in the current FINRA handbook. This mapping scheme is presented in Ap-
pendix C.23 In Table III, Panel C, I present the frequency of violations using this mapping scheme.
The most frequently occurring violations are related to “Duties & Conflicts” (60% of events) and
“Supervision and Responsibilities Relating to Associated Persons” (42% of events). These viola-
tions generally represent instances in which financial institutions failed to act in the best interests
of their stakeholders.
D. Disclosure Event Characteristics
Table IV displays key characteristics of the disclosure events data. Panel A presents the fre-
quency of disclosure events by year. In general, TotalEvents and TotalCodes appear to be cyclical,
peaking in 2007 and 2010. In 2010, the largest number of disclosure events occur (n = 77), perhaps
indicating heightened regulatory response to the financial crisis. TotalF ines also appears to by
cyclical, and has relative peaks in 2007 and 2011. The peak in TotalF ines in 2005 is attributed to
a one time fine of $250 million sanctioned upon one financial institution in the sample for illegal
allegation summaries and are less likely to have spelling errors.22For example, FINRA also warns that NASD Rule 2110, 3010, 6955, 6130 and 3110 are frequently violated
(http://www.finra.org/Investors/ToolsCalculators/BrokerCheck/P015177).23I also use this mapping scheme to create additional measures that relate to the specific security code violation
related to the event. Specifically, I create indicator variables for events that contain trading rule violations thatfall under the major categories outlined in Appendix C. ClearTrade, DutyConflict, FinOps, InvSanct, Application,TransReport, SecOffer and Supervision are coded 1 if the event contains at least one security code violation relatingto the type, and 0 otherwise.
17

mutual fund activity.24 Interestingly, the average fine per disclosure event also appears to have
declined in recent years. Prior to 2008, average fines were greater than $1 million. However, in
recent years, fines are much smaller, ranging from about $100,000 to $700,000 each.
Table IV, Panel B presents the disclosure event frequency by anonymized financial institution.
Nearly all of the institutions (25 out of 29) within the sample receive a violation during the sample
period.25 The data also suggests some important differences in the nature of the disclosure events.
For example, Financial Institution 1 receives the largest number of fines over the sample period
(∼$260 million), but Financial Institution 6 receives the largest number of disclosure events (62
events) and substantially less fines (∼$10 million). Thus, the disclosure events, on average, appear
to be much more severe for Financial Institution 1 than for Financial Institution 6. In untabulated
analyses, I find that many of the disclosure events for Financial Institution 6 are related to poten-
tially smaller trading issues categorized in Appendix C (i.e., ClearTrade or TransReport), while
the disclosure events for Financial Institution 1 are related to supervisory failures (Supervision)
that appear to be more serious. Interestingly, many financial institutions are sanctioned with
no security code violations identified (e.g., Financial Institutions 12-14), perhaps suggesting that
agents have some discretion over how they report the allegations. Overall, the trends suggest that
TotalEvents, TotalF ines and TotalCodes capture different dimensions of security code violations.
Table IV, Panel C presents the correlation of fines and violations within disclosure events. The
correlations suggest several interesting relationships. First, the positive correlation between the
natural log of total fines (LogFines) and the natural log of total security code violations (LogCodes)
is 0.319, suggesting that larger fines tend to have more security code violations. Further, LogFines
is positively correlated with DutyConflict (= 0.330) and Supervision (= 0.373), suggesting that
the most heavily fined disclosure events often contain at least one violation related to a conflict of
interest, breach of “duty of care,” or supervisory failure. Moreover, “bundling” of security code
violations also appears to be common in the sample period. For example, LogCodes is highly
correlated with DutyConflict (= 0.784) and Supervision (= 0.593), suggesting that it is common
for regulators to bundle a number of other security code violations with these particular violations.
This is not surprising given that FINRA often conducts cycle examinations and files a number of
complaints against a financial institution at once. In terms of the type of bundling, the positive
correlation between DutyConflict and Supervision (= 0.457) suggests that “Duties & Conflicts”
violations are often bundled with a “Supervisory” violation related to management’s failure to
prevent employee misconduct.
Overall, the discussions in Sections III.C and III.D provide preliminary descriptive evidence on
the nature of securities regulation and common types of violations. In particular, the analyses show
that while securities regulations are designed to govern a wide range of market activities, they share
the common intention of protecting investor welfare. Violations of these regulations are consistent
with financial institutions’ failing to act in the best interest of these investors.
24Inferences from regressions results are also similar if I exclude this observation.25My main inferences remain unchanged if I exclude the four institutions that did not receive any violations from
the analysis.
18

E. Measure Validity
My hypotheses stem from the notion that security code violations are consistent with cultural
forces affecting stakeholder tradeoffs that employees within financial institutions make. In this
section, I attempt to validate this claim by examining the links between security code violations
and culture and stakeholder/shareholder tradeoffs.
I first validate the link between security code violations and culture. Following prior studies
that suggest that culture within firms is stable and slow to change (e.g., Tayler and Bloomfield
(2011); Popadak (2013)), I examine the persistence of the three security code violation measures.
In Table V Panel A, I examine the correlation of all three proxies for security code violations with
up to three lags of each measure. The correlations range from about 50% to 75%, suggesting
that violations are highly persistent. In Panel B, I construct transition matrices that measure the
probability of an institution experiencing a certain level of TotalEvents, TotalF ines or TotalCodes
in period t+ 1, conditional on its level in period t. The transition matrices also suggest that these
security code violations are rather persistent throughout the sample period. About 60-70% of
financial institution-years that are in the lowest (highest) tercile of TotalEvents, TotalF ines or
TotalCodes in the current period remain in the lowest (highest) tercile in the following period.
These analyses add further support to my claim that security code violations are consistent with
persistent cultural forces in the firm.
I next validate the link between security code violations and stakeholder/shareholder tradeoffs.
To do so, I construct proxies for stakeholder protection and shareholder protection and examine
their association with all three measures of security code violations. First, I construct a proxy for
stakeholder protection based on product quality ratings (KLDProduct) obtained from the Kinder,
Lydenberg, and Domini (KLD) corporate social responsibility database. KLD evaluates firms across
seven dimensions and awards firms points for their strengths, deducts points for their weaknesses,
and constructs a net measure as the difference between the firm’s strengths and weaknesses. Firms
are awarded points for producing high quality, innovative, and socially beneficial products and
points are deducted for firms that produce unsafe and poorly marketed products. If security code
violations are consistent with financial institutions producing unsuitable investment products for
their clients, there should be a negative association between proxies for security code violations and
KLDProduct.
Second, following prior studies (e.g., Larcker et al. (2007)), I also consider three proxies for
the quality of shareholder protection afforded by financial institutions using hand-collected data
from RiskMetrics, Capital IQ and Factset. First, InstHoldings is measured as the percentage
of shares held by institutional investors. Second, Gompers is a composite index that proxies for
managerial power and is based on the last available Gompers index constructed in 2006. Third,
Insiders is the percentage of insiders sitting on the board. Higher levels of institutional holdings
are generally associated with stronger shareholder protection whereas lower levels on the Gompers
index and fewer insiders are generally associated with stronger shareholder protection. If security
code violations are consistent with profit-oriented financial institutions fostering a culture that
19

caters towards the demands of shareholders, there should be a positive association between proxies
for security code violations and InstHoldings and negative associations between proxies for security
code violations and Gompers and Insiders.
Table V, Panel C presents the correlation between proxies for security code violations and
proxies for stakeholder/shareholder protection (bolded values are significant at the 10% level).
While there are 204 financial institution-year observations in the full sample, data availability
varies extensively across the four stakeholder/shareholder protection measures, potentially limiting
the generalizability of these associations. Regardless, the correlations for the available data are
consistent with my expectations. First, I find negative and significant correlations between my
proxy for stakeholder protection (KLDProduct) and all three measures of security code violations.
Second, I also find evidence consistent with the notion that financial institutions with high levels of
security code violations have stronger shareholder protection. I find a positive association between
InstHoldings and all three proxies for security code violations and a negative association between
both Gompers and Insiders and all three proxies for security code violations. Taken together,
these results add support to my claim that financial institutions that violate securities regulations
appear to neglect individual investors and afford better protections to their shareholders.
IV. Forecast Sample & Regression Results
A. Research Design
My main analysis examines the association between security code violations and the forecast
accuracy of reports produced by financial institutions’ equity research departments. To measure
forecast accuracy, I construct a measure of relative forecast error (RFError) similar to prior studies
(e.g., Clement (1999); Cowen et al. (2006)) examining relative forecast properties:
RFErrori,j,t =AFEi,j,t −AFEj,t
AFEj,t
(1)
where AFEi,j,t is the absolute forecast error for analyst i’s forecast for firm j in year t and AFEj,t
is the mean absolute forecast error for firm j in year t across all analysts providing forecasts in the
sample. Consistent with the prior literature, forecast errors are calculated using the last forecast
issued in the first 11 months of the fiscal year. By construction, RFError controls for important
firm-year differences, and prior studies provide evidence that this approach is more effective than
forecast level regressions that include firm and year fixed effects as separate controls (Clement
(1999)).
To examine the relationship between security code violations and relative forecast errors, I
employ the following regression model:
20

RFErrori,j,t = β0 + β1V iolationsf,t + β2AnalystControlsi,j,t
+ β3FIControlsf,t +∑t
Y eart + εi,j,t.(2)
where i denotes analyst, j denotes firm, t denotes time, and f denotes the financial institution
(for which analyst i is employed in year t). Proxies for Violations include LogEvents, LogFines
and LogCodes. LogEvents is the natural log of one plus the total number of disclosure events a
financial institution receives in a year, LogFines is the natural log of one plus the dollar value of
total fines sanctioned against a financial institution in a year, and LogCodes is the natural log of
one plus the total number of unique security code violations a financial institution receives in a
year.
AnalystControls is a vector that includes important analyst characteristics that can potentially
correlate with measures of security code violations and forecast accuracy. RExp is the relative fore-
cast experience of the analyst providing the forecast (in terms of the number of years she has
covered the firm). RHorizon is the relative forecast horizon (in terms of the number of days until
the nearest earnings announcement). RFirmsCovered is the relative number of firms covered by the
analyst. To control for important differences across firm-years, RExp, RHorizon and RFirmsCov-
ered are relative to the firm-year and are constructed similarly to RFError (i.e., by differencing
out and scaling by the the firm-year mean of each measure).
The model also includes a vector of FIControls that are likely to influence the quality of
research products. FIPrestige, a proxy for reputation, is an indicator variable that takes the
value of 1 if the financial institution is one of the top 10 Institutional Investor-Ranked financial
institutions (as indicated on the Institutional Investor website), and 0 otherwise. FIComplexity
is the natural log of one plus the total number of business lines in the financial institution (as
observed in the FINRA BrokerCheck report). FISize is the natural log of the total number of
analysts employed at the financial institution in the period. All continuous variables are winsorized
at the 1st and 99th percentiles.
I also consider a modification of the baseline model that includes a set of financial institution
fixed effects. As discussed earlier, security code violations are persistent and slow to change,
consistent with violations representing steady cultural forces within the firm. However, it is still
possible that there exist time-invariant differences in the sensitivity of financial institutions’ research
activities to their established corporate cultures, thus making the inclusion of financial institution
fixed effects appropriate. The modified model is the same as the baseline model, except that I
remove non-time-varying financial institution characteristics (i.e., FIPrestige and FIComplexity)
from the model and replace these characteristics with financial institution fixed effects.
Finally, all models include year fixed effects and standard errors are clustered by financial
institution and year; however, clustering by analyst instead of financial institution does not alter
my main inferences. If security code violations are positively associated with absolute forecast
errors, β1 should be positive.
21
Table VI describes the forecast sample in more detail. Panel A provides the descriptive statistics.
The first quartile, median and third quartile of RFError are very similar to the reported values
in Clement (1999). Not surprisingly, the financial institutions in the sample appear to be larger
and more complex financial institutions. The mean forecast in the sample is issued by an analyst
employed by a financial institution with nearly 100 analysts and 21 unique business lines. Moreover,
the mean level of FIPrestige is 0.523, suggesting that many of the forecasts appear to be issued
by financial institutions that are typically regarded as prestigious and reputable by traditional
rankings.
Panel B of Table VI presents the correlation among the variables of interest (bolded values
indicate significance at the 1% level). Consistent with Hypothesis 1, all three measures of security
code violations are positively associated with RFError in the univariate correlations. The corre-
lation between RFError and LogEvents, LogFines and LogCodes are 0.047, 0.034, and 0.032,
respectively. Interestingly, the proxies for security code violations are also negatively correlated
with RExp and positively correlated with RHorizon and RFirmsCovered, suggesting that finan-
cial institutions with more security code violations hire less experienced analysts that cover more
firms, but issue forecasts much earlier in the fiscal year.
B. Regression Results
Table VII presents the regression results from estimates of Equation 2. Panel A presents the
results when the security code violations proxy is LogEvents. Panel B presents the results when
security code violations are measured as LogFines. Panel C presents the results when security
code violations are measured as LogCodes. In Column 1, I first examine the association between
LogEvents and RFError without control variables. Consistent with my prediction, the coef-
ficient on LogEvents is positive and significant (p < .01). In Column 2, I include the set of
AnalystControls and FIControls as well as year fixed effects and find similar results (p < .01).
In Column 3, I remove FIPrestige and FIComplexity and include a set of financial institution
fixed effects and also generate similar results (p < .01). In addition to being statistically signif-
icant, the results also appear to be economically meaningful. A one-standard-deviation increase
in LogEvents (σ=0.6633) is associated with a 3.5% (0.6633 × 0.0528) increase in relative forecast
errors, based on the coefficient estimates in Column 2.
In Panels B and Panel C, I repeat this analysis using LogFines and LogCodes as my measures
of security code violations and generate similar results. In Panel B, LogFines is positively and
significantly correlated with RFError in Column 1 (p < .01), and remains significant after adding
a full set of controls in Column 2 (p < .01) and after controlling for financial institution fixed
effects in Column 3 (p < .10). In Panel C, LogCodes is also positively and significantly correlated
with RFError, as indicated in Column 1 (p < .05). The effect persists with the inclusion of
controls in Column 2 (p < .01), but loses significance when I include financial institution fixed
effects in Column 3. However, this measure is potentially noisy as some financial institutions
receive no allegations with specified security code violations. In terms of economic significance,
22
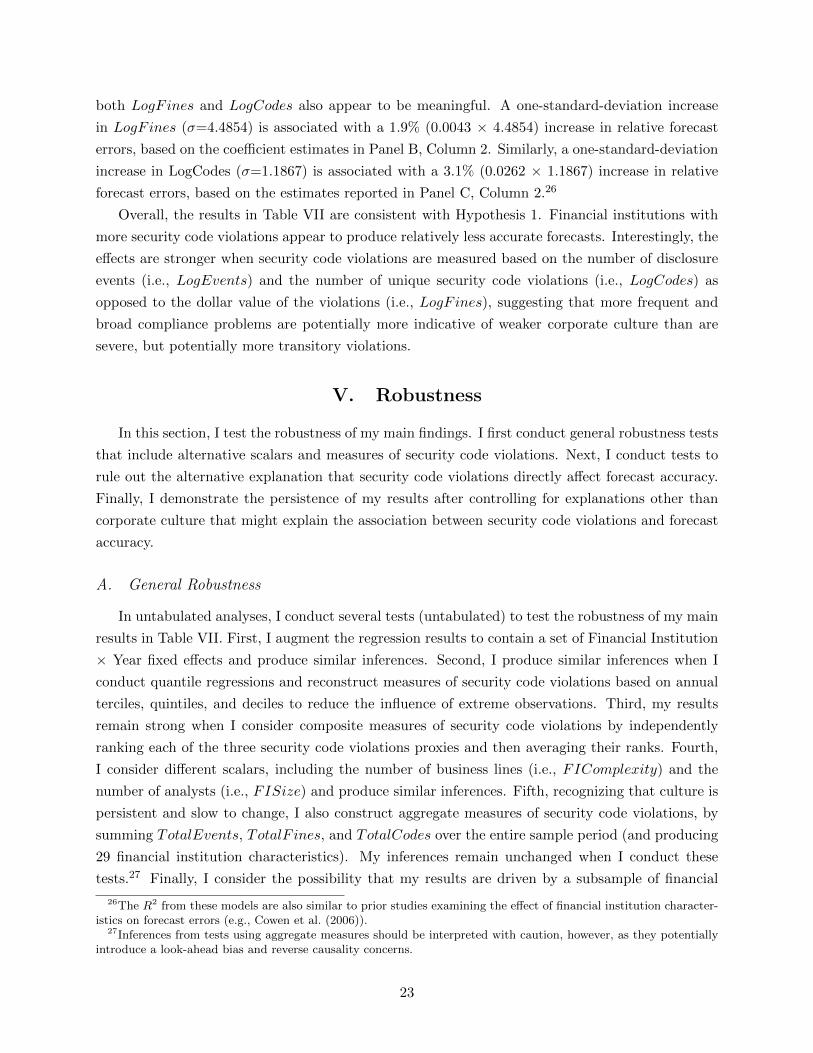
both LogFines and LogCodes also appear to be meaningful. A one-standard-deviation increase
in LogFines (σ=4.4854) is associated with a 1.9% (0.0043 × 4.4854) increase in relative forecast
errors, based on the coefficient estimates in Panel B, Column 2. Similarly, a one-standard-deviation
increase in LogCodes (σ=1.1867) is associated with a 3.1% (0.0262 × 1.1867) increase in relative
forecast errors, based on the estimates reported in Panel C, Column 2.26
Overall, the results in Table VII are consistent with Hypothesis 1. Financial institutions with
more security code violations appear to produce relatively less accurate forecasts. Interestingly, the
effects are stronger when security code violations are measured based on the number of disclosure
events (i.e., LogEvents) and the number of unique security code violations (i.e., LogCodes) as
opposed to the dollar value of the violations (i.e., LogFines), suggesting that more frequent and
broad compliance problems are potentially more indicative of weaker corporate culture than are
severe, but potentially more transitory violations.
V. Robustness
In this section, I test the robustness of my main findings. I first conduct general robustness tests
that include alternative scalars and measures of security code violations. Next, I conduct tests to
rule out the alternative explanation that security code violations directly affect forecast accuracy.
Finally, I demonstrate the persistence of my results after controlling for explanations other than
corporate culture that might explain the association between security code violations and forecast
accuracy.
A. General Robustness
In untabulated analyses, I conduct several tests (untabulated) to test the robustness of my main
results in Table VII. First, I augment the regression results to contain a set of Financial Institution
× Year fixed effects and produce similar inferences. Second, I produce similar inferences when I
conduct quantile regressions and reconstruct measures of security code violations based on annual
terciles, quintiles, and deciles to reduce the influence of extreme observations. Third, my results
remain strong when I consider composite measures of security code violations by independently
ranking each of the three security code violations proxies and then averaging their ranks. Fourth,
I consider different scalars, including the number of business lines (i.e., FIComplexity) and the
number of analysts (i.e., FISize) and produce similar inferences. Fifth, recognizing that culture is
persistent and slow to change, I also construct aggregate measures of security code violations, by
summing TotalEvents, TotalF ines, and TotalCodes over the entire sample period (and producing
29 financial institution characteristics). My inferences remain unchanged when I conduct these
tests.27 Finally, I consider the possibility that my results are driven by a subsample of financial
26The R2 from these models are also similar to prior studies examining the effect of financial institution character-istics on forecast errors (e.g., Cowen et al. (2006)).
27Inferences from tests using aggregate measures should be interpreted with caution, however, as they potentiallyintroduce a look-ahead bias and reverse causality concerns.
23

institutions that may be more likely to be targeted by regulators or a specific time period in
which there is heightened regulatory pressure. I produce similar results among subsamples split
on financial institution prestige, complexity, size and time period. Overall, the results of these
analyses provide consistent evidence to support a strong positive association between measures of
security code violations and the relative forecast errors produced by financial institutions’ equity
research departments.
B. Direct Effects of Security Code Violations on Forecast Accuracy
The results in Table VII provide strong evidence of an association between security code viola-
tions and forecast accuracy. Since security code violations and forecast accuracy are outcomes of
operationally unrelated activities in the financial institution, I interpret this finding as providing
indirect evidence consistent with an overall corporate culture influencing activities across multiple
areas within the institution. One alternative explanation for this finding is that security code vi-
olations directly affect forecast accuracy. This direct effect can occur if violations are a result of
brokerage divisions or investment banking divisions directly influencing analysts’ forecast quality.
For example, trading commissions in the brokerage division might lead employees to pressure ana-
lysts to issue less objective forecasts (Cowen et al. (2006); Jackson (2005)). Similarly, investment
banking commissions might also lead employees to pressure analysts to issue biased forecasts (Lin
and McNichols (1998); Michaely and Womack (1999)).
To examine the extent to which forecast quality is directly influenced by violations in non-
research divisions, I re-examine the baseline regression (i.e., Equation 2) for observations in which
incentives to directly influence analysts are likely to be low. I consider two such scenarios. First,
I examine forecasts issued for stocks below the median level of trading volume, since pressures
are likely to be lower for thinly traded stocks that generate less brokerage commissions. Second,
I examine a subsample of forecasts issued for stocks which appear to have no recent investment
banking affiliation (i.e., no initial public offering or seasoned equity offering in the prior 12 months),
and are thus less likely to face pressures from investment banking divisions to issue less objective
forecasts.
Table VIII provides the regression results from these subsample tests. Panel A presents the
subsample of forecasts issued for firms with low trading volume. Panel B presents the subsample
of forecasts issued for firms with no affiliation.28 The association between proxies for security code
violations and forecast errors remains positive in all regressions and is significant in all except one
test. Thus, even in scenarios where pressures for divisions to directly influence analysts’ forecasts
are likely to be low, there appears to be a significant association between security code violations
and forecast quality, suggesting that indirect forces (i.e., corporate culture) are likely to explain
this association.
28This subsample is relatively large since only 2,456 forecasts are “Affiliated” in the sample.
24

C. Alternative Explanations
Academics and regulators have offered numerous explanations for compliance failures within fi-
nancial institutions, including culture, poor internal control systems, flawed compensation schemes,
poor governance, etc. (e.g., Kashyap, Rajan, and Stein (2008); Ellul and Yerramilli (2013)). Thus,
it is possible that the association I document between security code violations and forecast accuracy
is driven by other visible forces within the firm that may not be related to culture. In this section,
I consider the ability of these alternative explanations to explain the association between security
code violations and relative forecast errors.
To consider these alternative explanations, I re-examine the baseline regression (i.e., Equa-
tion 2) and include controls for other factors that may drive the association between security code
violations and forecast accuracy. First, I consider general characteristics of the financial institution,
including Size, measured as the natural log of assets, and Profitability, measured as net income
divided by total assets. Larger and less profitable financial institutions might find it more difficult
to comply with regulations if they are constrained and may also hire less experienced analysts that
command lower salaries. Second, I consider internal control quality (ICW ), an indicator variable
that takes the value of 1 if the financial institution has a material weakness or significant deficiency
in its internal controls, and 0 otherwise. Poor internal control systems can increase the probability
that employees violate compliance protocol and may also result in analysts producing less accurate
forecasts. Third, I also consider whether short-term compensation schemes within financial institu-
tions directly motivate employees to violate regulations and neglect their forecasts. STCompMix
is a proxy for how short-term focused compensation contracts are within the firm and is constructed
by taking the ratio of the CEO’s total annual compensation divided by total calculated compensa-
tion, including stock awards and non-cash compensation. Finally, I consider corporate governance
mechanisms, or specific policies and procedures within the financial institution to protect stake-
holders and shareholders. My proxy for stakeholder protection is KLDProduct, and my proxies
for shareholder protection are InstHoldings, Gompers, and Insiders (as defined in Section III.E).
Table IX provides the results from regressions of forecast accuracy on security code violations
including controls for alternative explanations. Data for additional financial characteristics is col-
lected from a variety of sources including Capital IQ, Factset, AuditAnalytics, and KLD and its
availability varies across the various measures. Column 1 adds controls for general financial in-
stitution characteristics. Column 2 controls for internal control quality. Column 3 controls for
compensation schemes. Columns 4-8 control for various corporate governance mechanisms to pro-
tect stakeholders and shareholders. Column 9 includes all controls. For brevity, I display the
results for SecCodeRank, a composite measure of the three proxies for security code violations,
constructed by individually ranking the three security code violation measures into quintiles and
then averaging their ranks. However, inferences are similar when I consider the three proxies sep-
arately. Throughout all of the models, the results provide strong evidence to suggest that the
association between security code violations and forecast accuracy cannot be easily explained by
the alternative explanations proposed. In each test, SecCodeRank continues to load positive and
25

significantly (p < .01), consistent with Hypothesis 1. These findings add additional support to
the argument that corporate culture explains the association between security code violations and
forecast accuracy.
VI. Additional Analysis
In this section, I conduct three sets of additional analyses to add further insight on the associ-
ation between security code violations and forecast quality. The first set of analyses examines the
extent to which security code violations are associated with upwardly biased forecasts around recent
equity offerings and downwardly biased forecasts for firms who narrowly “meet or beat” consensus
forecasts. The second analysis examines the ability of personal reputation, as measured by All-Star
rankings, to moderate the association between security code violations and forecast accuracy. The
third analysis examines the market consequences of security code violations on analysts’ report
informativeness.
A. Pressures to Strategically Bias Forecasts
The results from Table VII indicate a strong association between security code violations and
forecast accuracy, which I posit is driven by an overall profit-oriented culture within the finan-
cial institution that neglects individual investors’ welfare. As discussed earlier, this culture leads
analysts to neglect their forecasts through either allocating their time and efforts to meet the im-
mediate demands of institutional clients (and exerting less effort on producing accurate forecasts)
or by increasing the probability that analysts will be susceptible to pressures to bias their forecasts
(upwards or downwards). In this section, I examine the effects of culture on intensifying the biases
that arise in analysts’ forecasts.
In order to consider the effects of culture on forecast biases, I consider two unique settings
in which analysts are likely to face pressures to bias their forecasts. The first setting relates
to a scenario in which analysts are likely to face pressures to issue upwardly biased forecasts.
Specifically, I examine the period following recent equity offerings as analysts are often expected to
issue optimistic forecasts for recent investment banking clients in order to promote the firms (e.g.,
Lin and McNichols (1998); Michaely and Womack (1999)). Accordingly, Hypothesis 2A predicts
that the association between security code violations and upwardly biased forecasts should be more
positive following recent underwriting activity.
To test this hypothesis, I examine the following fully-interacted regression of upward forecast
bias on security code violations interacted with analysts’ investment banking affiliation:
26
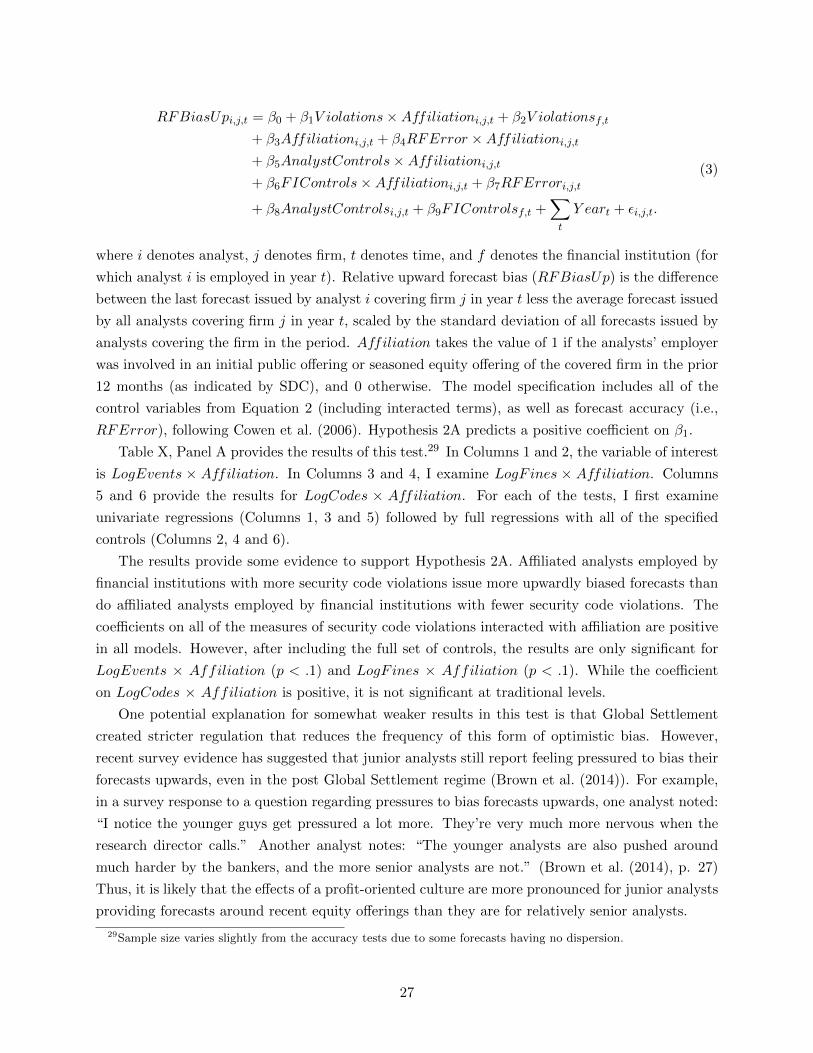
RFBiasUpi,j,t = β0 + β1V iolations×Affiliationi,j,t + β2V iolationsf,t
+ β3Affiliationi,j,t + β4RFError ×Affiliationi,j,t+ β5AnalystControls×Affiliationi,j,t+ β6FIControls×Affiliationi,j,t + β7RFErrori,j,t
+ β8AnalystControlsi,j,t + β9FIControlsf,t +∑t
Y eart + εi,j,t.
(3)
where i denotes analyst, j denotes firm, t denotes time, and f denotes the financial institution (for
which analyst i is employed in year t). Relative upward forecast bias (RFBiasUp) is the difference
between the last forecast issued by analyst i covering firm j in year t less the average forecast issued
by all analysts covering firm j in year t, scaled by the standard deviation of all forecasts issued by
analysts covering the firm in the period. Affiliation takes the value of 1 if the analysts’ employer
was involved in an initial public offering or seasoned equity offering of the covered firm in the prior
12 months (as indicated by SDC), and 0 otherwise. The model specification includes all of the
control variables from Equation 2 (including interacted terms), as well as forecast accuracy (i.e.,
RFError), following Cowen et al. (2006). Hypothesis 2A predicts a positive coefficient on β1.
Table X, Panel A provides the results of this test.29 In Columns 1 and 2, the variable of interest
is LogEvents × Affiliation. In Columns 3 and 4, I examine LogFines × Affiliation. Columns
5 and 6 provide the results for LogCodes × Affiliation. For each of the tests, I first examine
univariate regressions (Columns 1, 3 and 5) followed by full regressions with all of the specified
controls (Columns 2, 4 and 6).
The results provide some evidence to support Hypothesis 2A. Affiliated analysts employed by
financial institutions with more security code violations issue more upwardly biased forecasts than
do affiliated analysts employed by financial institutions with fewer security code violations. The
coefficients on all of the measures of security code violations interacted with affiliation are positive
in all models. However, after including the full set of controls, the results are only significant for
LogEvents × Affiliation (p < .1) and LogFines × Affiliation (p < .1). While the coefficient
on LogCodes × Affiliation is positive, it is not significant at traditional levels.
One potential explanation for somewhat weaker results in this test is that Global Settlement
created stricter regulation that reduces the frequency of this form of optimistic bias. However,
recent survey evidence has suggested that junior analysts still report feeling pressured to bias their
forecasts upwards, even in the post Global Settlement regime (Brown et al. (2014)). For example,
in a survey response to a question regarding pressures to bias forecasts upwards, one analyst noted:
“I notice the younger guys get pressured a lot more. They’re very much more nervous when the
research director calls.” Another analyst notes: “The younger analysts are also pushed around
much harder by the bankers, and the more senior analysts are not.” (Brown et al. (2014), p. 27)
Thus, it is likely that the effects of a profit-oriented culture are more pronounced for junior analysts
providing forecasts around recent equity offerings than they are for relatively senior analysts.
29Sample size varies slightly from the accuracy tests due to some forecasts having no dispersion.
27

Table X, Panel B revisits the above forecast bias analysis (Equation 3), but splits the sample
based on analysts’ seniority. Columns 1-3 examine the full model (with controls) for analysts
with less than 2 years of general experience (i.e., JuniorAnalysts), while Columns 4-6 examine the
results for analysts with more than 2 years of general experience (i.e., SeniorAnalysts). Consistent
with the survey evidence, the results indicate strong support for Hypothesis 2A among the pool
of junior analysts. The association between RFBiasUp and measures of security code violations
interacted with affiliation are positive and significant for junior analysts (p < .05). On the other
hand, there is little evidence to support Hypothesis 2A among the pool of senior analysts. Thus, it
appears as if the effects of culture on optimistic forecast biases are more pronounced among junior
analysts.
The second forecast bias setting I consider relates to a scenario in which analysts are likely to
face pressures to issue downwardly biased forecasts. Specifically, I consider forecasts issued for firms
that narrowly “meet or beat” the annual consensus earnings forecast. Analysts often face pressures
from managers to issue downwardly biased forecasts (i.e., “lowball”) to increase the likelihood that
managers meet earnings targets (e.g., Hilary and Hsu (2013); Bhojraj et al. (2009)). Managers are
most likely to pressure analysts to “lowball” forecasts when they are most at risk of not meeting
the earnings target. Accordingly, Hypothesis 2B predicts that the association between security
code violations and downwardly biased forecasts should be more positive for firms that just meet
or narrowly beat the consensus earnings forecast.
To test this hypothesis, I examine the following fully-interacted regression of downward forecast
bias on security code violations interacted with “LowBall” pressures:
RFBiasDowni,j,t = β0 + β1V iolations× LowBalli,j,t + β2V iolationsf,t
+ β3LowBallj,t + β4RFError × LowBalli,j,t+ β5AnalystControls× LowBalli,j,t+ β6FIControls× LowBalli,j,t + β7RFErrori,j,t
+ β8AnalystControlsi,j,t + β9FIControlsf,t +∑t
Y eart + εi,j,t.
(4)
where i denotes analyst, j denotes firm, t denotes time, and f denotes the financial institution
(for which analyst i is employed in year t). Relative downward forecast bias (RFBiasDown) is
equal to minus 1 times RFBiasUp. LowBall takes the value of 1 if the firm narrowly meets or
beats (by 1 cent) the consensus earnings forecast based on the end of the year consensus forecast,
and 0 otherwise. The model specification includes all of the control variables from Equation 3.
Hypothesis 2B predicts a positive coefficient on β1.
Table XI provides the results of this test. In Columns 1 and 2, the variable of interest is
LogEvents × LowBall. In Columns 3 and 4, I examine LogFines × LowBall. Columns 5 and
6 provide the results for LogCodes × LowBall. For each of the tests, I first examine univariate
regressions (Columns 1, 3 and 5) followed by full regressions with all of the specified controls
(Columns 2, 4 and 6).
28
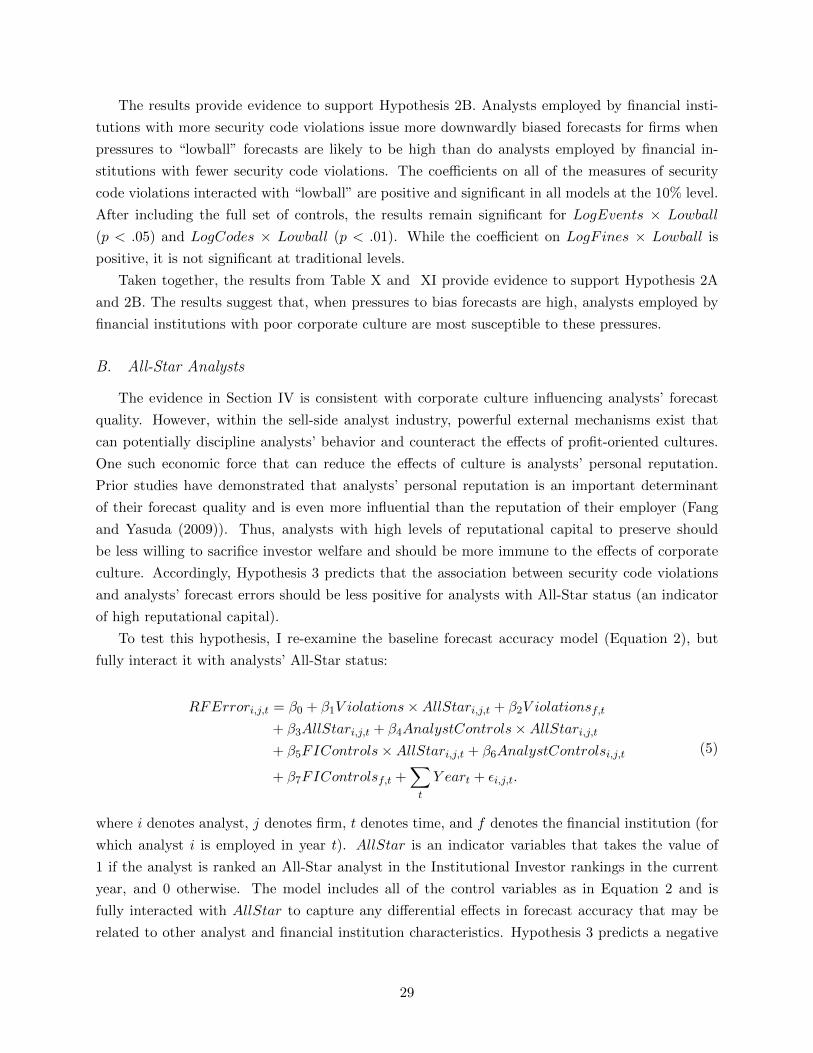
The results provide evidence to support Hypothesis 2B. Analysts employed by financial insti-
tutions with more security code violations issue more downwardly biased forecasts for firms when
pressures to “lowball” forecasts are likely to be high than do analysts employed by financial in-
stitutions with fewer security code violations. The coefficients on all of the measures of security
code violations interacted with “lowball” are positive and significant in all models at the 10% level.
After including the full set of controls, the results remain significant for LogEvents × Lowball
(p < .05) and LogCodes × Lowball (p < .01). While the coefficient on LogFines × Lowball is
positive, it is not significant at traditional levels.
Taken together, the results from Table X and XI provide evidence to support Hypothesis 2A
and 2B. The results suggest that, when pressures to bias forecasts are high, analysts employed by
financial institutions with poor corporate culture are most susceptible to these pressures.
B. All-Star Analysts
The evidence in Section IV is consistent with corporate culture influencing analysts’ forecast
quality. However, within the sell-side analyst industry, powerful external mechanisms exist that
can potentially discipline analysts’ behavior and counteract the effects of profit-oriented cultures.
One such economic force that can reduce the effects of culture is analysts’ personal reputation.
Prior studies have demonstrated that analysts’ personal reputation is an important determinant
of their forecast quality and is even more influential than the reputation of their employer (Fang
and Yasuda (2009)). Thus, analysts with high levels of reputational capital to preserve should
be less willing to sacrifice investor welfare and should be more immune to the effects of corporate
culture. Accordingly, Hypothesis 3 predicts that the association between security code violations
and analysts’ forecast errors should be less positive for analysts with All-Star status (an indicator
of high reputational capital).
To test this hypothesis, I re-examine the baseline forecast accuracy model (Equation 2), but
fully interact it with analysts’ All-Star status:
RFErrori,j,t = β0 + β1V iolations×AllStari,j,t + β2V iolationsf,t
+ β3AllStari,j,t + β4AnalystControls×AllStari,j,t+ β5FIControls×AllStari,j,t + β6AnalystControlsi,j,t
+ β7FIControlsf,t +∑t
Y eart + εi,j,t.
(5)
where i denotes analyst, j denotes firm, t denotes time, and f denotes the financial institution (for
which analyst i is employed in year t). AllStar is an indicator variables that takes the value of
1 if the analyst is ranked an All-Star analyst in the Institutional Investor rankings in the current
year, and 0 otherwise. The model includes all of the control variables as in Equation 2 and is
fully interacted with AllStar to capture any differential effects in forecast accuracy that may be
related to other analyst and financial institution characteristics. Hypothesis 3 predicts a negative
29

coefficient on β1.
Table XII provides the result from this test.30 In Columns 1 and 2, the variable of interest
is LogEvents × AllStar. In Columns 3 and 4, I examine LogFines × AllStar. Columns 5 and
6 provide the results for LogCodes × AllStar. For each of the tests, I first examine univariate
regressions (Columns 1, 3 and 5) followed by full regressions with all of the specified controls
(Columns 2, 4 and 6).
The coefficients on both LogEvents × AllStar and LogFines × AllStar are negative and sig-
nificant (p < .01), suggesting that analysts working at financial institutions with more security
code violations produce relatively more accurate forecasts when they have All-Star status. The
coefficients on measures of security code violations based on the number of security code violations
(LogCodes×AllStar) are also negative, but not significant. In general, these results are consistent
with Hypothesis 3 and demonstrate that reputation can play an important role in counteracting
the negative effects of corporate culture.
C. Report Informativeness
The evidence in the prior analyses suggest that corporate culture can influence analyst behav-
ior, but do not offer any insight regarding whether this has consequences for market participants.
In my final analysis, I shed light on this by examining the effects of security code violations on
analysts’ report informativeness. Prior studies indicate significant variation in the amount of new
information that analysts bring to the market, and regulators have expressed concern that poor
compliance may impede investors’ abilities to make fully-informed investment decisions. Accord-
ingly, if profit-oriented cultures have negative effects on investors’ ability to make fully-informed
investment decisions, one would expect security code violations to be associated with less infor-
mative reports. Accordingly, Hypothesis 4 predicts a negative association between security code
violations and report informativeness.
To test this hypothesis, I examine the following regression of analyst informativeness on proxies
for security code violations using an out-of-sample analysis consisting of all forecast revisions:
INFOi,j,t = β0 + β1V iolationsf,t + β2Experiencei,t + β3FirmsCoveredi,t + β4FISizef,t
+ β5FIPrestigef + β6FIComplexityf + β7NumReportsAnalysti,j,t
+ β8NumReportsF irmj,t + β9FirmRetj,t + β10MktRett + β11SigmaRett
+ ψTimeTrend+ εi,j,t.
(6)
where i denotes analyst, j denotes firm, t denotes time, and f denotes the financial institution (for
which analyst i is employed in year t). INFO is calculated as the absolute value of the sum of
size adjusted returns around earnings forecast revision dates. I include control variables for ana-
lyst characteristics and market conditions following prior studies examining analyst informativeness
(Francis, Schipper, and Vincent (2002); Kadan et al. (2009)) as well as controls for financial institu-
30The sample size differs from that in Table VII since I currently only have All-Star data available through 2010.
30
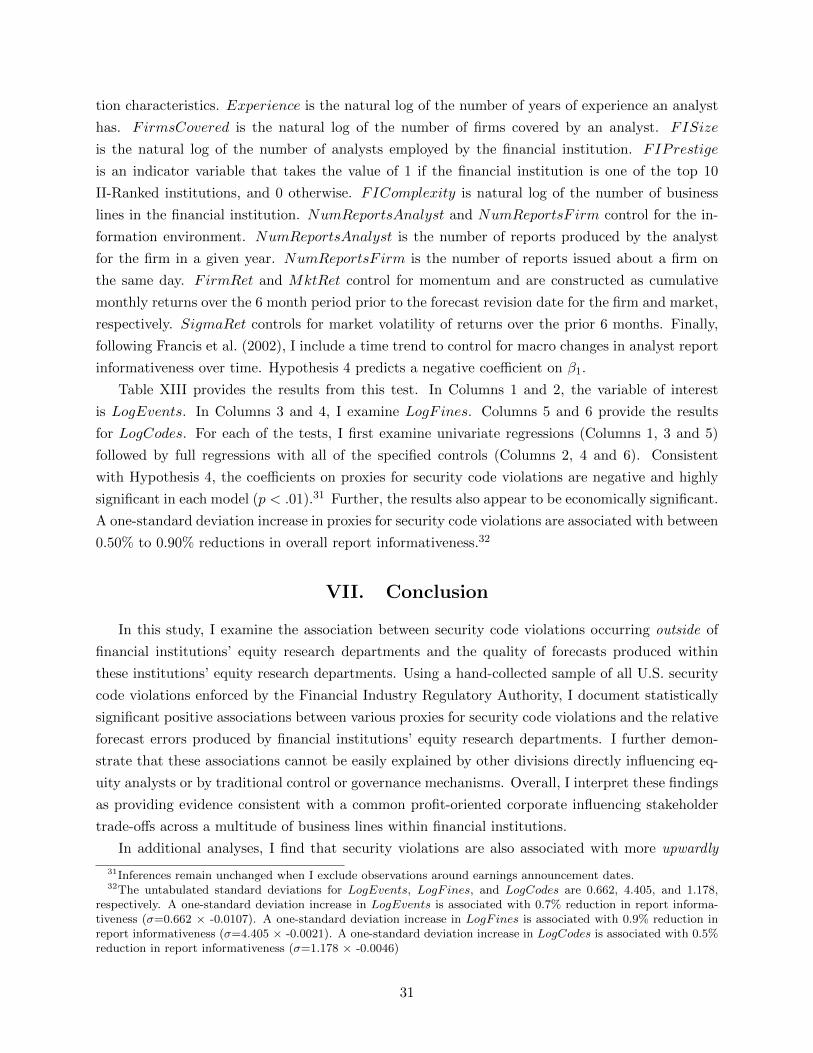
tion characteristics. Experience is the natural log of the number of years of experience an analyst
has. FirmsCovered is the natural log of the number of firms covered by an analyst. FISize
is the natural log of the number of analysts employed by the financial institution. FIPrestige
is an indicator variable that takes the value of 1 if the financial institution is one of the top 10
II-Ranked institutions, and 0 otherwise. FIComplexity is natural log of the number of business
lines in the financial institution. NumReportsAnalyst and NumReportsF irm control for the in-
formation environment. NumReportsAnalyst is the number of reports produced by the analyst
for the firm in a given year. NumReportsF irm is the number of reports issued about a firm on
the same day. FirmRet and MktRet control for momentum and are constructed as cumulative
monthly returns over the 6 month period prior to the forecast revision date for the firm and market,
respectively. SigmaRet controls for market volatility of returns over the prior 6 months. Finally,
following Francis et al. (2002), I include a time trend to control for macro changes in analyst report
informativeness over time. Hypothesis 4 predicts a negative coefficient on β1.
Table XIII provides the results from this test. In Columns 1 and 2, the variable of interest
is LogEvents. In Columns 3 and 4, I examine LogFines. Columns 5 and 6 provide the results
for LogCodes. For each of the tests, I first examine univariate regressions (Columns 1, 3 and 5)
followed by full regressions with all of the specified controls (Columns 2, 4 and 6). Consistent
with Hypothesis 4, the coefficients on proxies for security code violations are negative and highly
significant in each model (p < .01).31 Further, the results also appear to be economically significant.
A one-standard deviation increase in proxies for security code violations are associated with between
0.50% to 0.90% reductions in overall report informativeness.32
VII. Conclusion
In this study, I examine the association between security code violations occurring outside of
financial institutions’ equity research departments and the quality of forecasts produced within
these institutions’ equity research departments. Using a hand-collected sample of all U.S. security
code violations enforced by the Financial Industry Regulatory Authority, I document statistically
significant positive associations between various proxies for security code violations and the relative
forecast errors produced by financial institutions’ equity research departments. I further demon-
strate that these associations cannot be easily explained by other divisions directly influencing eq-
uity analysts or by traditional control or governance mechanisms. Overall, I interpret these findings
as providing evidence consistent with a common profit-oriented corporate influencing stakeholder
trade-offs across a multitude of business lines within financial institutions.
In additional analyses, I find that security violations are also associated with more upwardly
31Inferences remain unchanged when I exclude observations around earnings announcement dates.32The untabulated standard deviations for LogEvents, LogF ines, and LogCodes are 0.662, 4.405, and 1.178,
respectively. A one-standard deviation increase in LogEvents is associated with 0.7% reduction in report informa-tiveness (σ=0.662 × -0.0107). A one-standard deviation increase in LogF ines is associated with 0.9% reduction inreport informativeness (σ=4.405 × -0.0021). A one-standard deviation increase in LogCodes is associated with 0.5%reduction in report informativeness (σ=1.178 × -0.0046)
31
biased forecasts following recent equity underwritings, more downwardly biased forecasts for firms
that narrowly “meet or beat” consensus forecast estimates, and less informative analyst reports,
on average. Moreover, the association between security code violations and forecast errors ap-
pears to be less pronounced for forecasts produced by All-Star analysts, who have higher levels of
reputational capital to preserve.
Overall, this study provides important implications regarding the behavior of security analysts
and the role of securities regulation in the financial services industry. In particular, my findings
suggest that cultural forces are an important indicator of how financial institutions make stakeholder
trade-offs and can have important consequences for market participants.
32
REFERENCES
Allen, Franklin, and Richard Herring, 2001, Banking regulation versus securities market regulation,The Wharton School–University of Pennsylvania 1, 1–58.
Barber, Brad M, Reuven Lehavy, Maureen McNichols, and Brett Trueman, 2006, Buys, holds, andsells: The distribution of investment banks’ stock ratings and the implications for the profitabilityof analysts’ recommendations, Journal of Accounting and Economics 41, 87–117.
Barniv, Ran, Ole-Kristian Hope, Mark J Myring, and Wayne B Thomas, 2009, Do analysts practicewhat they preach and should investors listen? Effects of recent regulations, The AccountingReview 84, 1015–1039.
Beltratti, Andrea, and Rene M Stulz, 2009, Why did some banks perform better during the creditcrisis? A cross-country study of the impact of governance and regulation, Technical Reportw15180, National Bureau of Economic Research.
Bhojraj, Sanjeev, Paul Hribar, Marc Picconi, and John McInnis, 2009, Making sense of cents: Anexamination of firms that marginally miss or beat analyst forecasts, The Journal of Finance 64,2361–2388.
Bradshaw, Mark Thomas, 2011, Analysts’ forecasts: What do we know after decades of work?,Available at SSRN 1880339 1–55.
Brown, Lawrence D, Andrew C Call, Michael B Clement, and Nathan Y Sharp, 2014, Inside the“black box” of sell-side financial analysts, Available at SSRN 2228373 1–67.
Cassar, Gavin, and Joseph Gerakos, 2013, Does risk management work? 13, 1–50.
Chen, Chih-Ying, and Peter F Chen, 2009, Nasd rule 2711 and changes in analysts’ independencein making stock recommendations, The Accounting Review 84, 1041–1071.
Clement, Michael B, 1999, Analyst forecast accuracy: Do ability, resources, and portfolio complex-ity matter?, Journal of Accounting and Economics 27, 285–303.
Cowen, Amanda, Boris Groysberg, and Paul Healy, 2006, Which types of analyst firms are moreoptimistic?, Journal of Accounting and Economics 41, 119–146.
Cremer, Jacques, 1993, Corporate culture and shared knowledge, Industrial and Corporate Change2, 351–386.
Ellul, Andrew, and Vijay Yerramilli, 2013, Stronger risk controls, lower risk: Evidence from USbank holding companies, The Journal of Finance 68, 1757–1803.
Ertimur, Yonca, Jayanthi Sunder, and Shyam V Sunder, 2007, Measure for measure: the relationbetween forecast accuracy and recommendation profitability of analysts, Journal of AccountingResearch 45, 567–606.
Fahlenbrach, Rudiger, Robert Prilmeier, and Rene M Stulz, 2012, This time is the same: Usingbank performance in 1998 to explain bank performance during the recent financial crisis, TheJournal of Finance 67, 2139–2185.
Fang, Lily, and Ayako Yasuda, 2009, The effectiveness of reputation as a disciplinary mechanismin sell-side research, Review of Financial Studies 22, 3735–3777.
33

Francis, Jennifer, Katherine Schipper, and Linda Vincent, 2002, Earnings announcements andcompeting information, Journal of Accounting and Economics 33, 313–342.
Frankel, Richard, SP Kothari, and Joseph Weber, 2006, Determinants of the informativeness ofanalyst research, Journal of Accounting and Economics 41, 29–54.
Gao, Feng, Ling Lei Lisic, and Ivy Xiying Zhang, 2014, Commitment to social good and insidertrading, Journal of Accounting and Economics 57, 149–175.
Gleason, Cristi A, and Charles MC Lee, 2003, Analyst forecast revisions and market price discovery,The Accounting Review 78, 193–225.
Gompers, Paul A, Joy L Ishii, and Andrew Metrick, 2001, Corporate governance and equity prices,Technical report, National bureau of economic research.
Groysberg, Boris, Paul M Healy, and David A Maber, 2011, What drives sell-side analyst compen-sation at high-status investment banks?, Journal of Accounting Research 49, 969–1000.
Groysberg, Boris, and Linda-Eling Lee, 2008, The effect of colleague quality on top performance:the case of security analysts, Journal of Organizational Behavior 29, 1123–1144.
Guiso, Luigi, Paola Sapienza, and Luigi Zingales, 2014, The value of corporate culture, Journal ofFinancial Economics In Press.
Hermalin, Benjamin E, 2000, Economics and corporate culture, University of California, Berkeley1–50.
Hilary, Gilles, and Charles Hsu, 2013, Analyst forecast consistency, The Journal of Finance 68,271–297.
Hofstede, Geert, 1998, Identifying organizational subcultures: An empirical approach, Journal ofManagement Studies 35, 1–12.
Hoi, Chun Keung, Qiang Wu, and Hao Zhang, 2013, Is corporate social responsibility (CSR)associated with tax avoidance? Evidence from irresponsible CSR activities, The AccountingReview 88, 2025–2059.
Hong, Harrison, Jeffrey D Kubik, and Amit Solomon, 2000, Security analysts’ career concerns andherding of earnings forecasts, The Rand Journal of Economics 121–144.
Jackson, Andrew R, 2005, Trade generation, reputation, and sell-side analysts, The Journal ofFinance 60, 673–717.
Jacob, John, Thomas Z Lys, and Margaret A Neale, 1999, Expertise in forecasting performance ofsecurity analysts, Journal of Accounting and Economics 28, 51–82.
Kadan, Ohad, Leonardo Madureira, Rong Wang, and Tzachi Zach, 2009, Conflicts of interest andstock recommendations: The effects of the global settlement and related regulations, Review ofFinancial Studies 22, 4189–4217.
Kaplan, Robert S, 2011, Accounting scholarship that advances professional knowledge and practice,The Accounting Review 86, 367–383.
34

Kashyap, Anil, Raghuram Rajan, and Jeremy Stein, 2008, Rethinking capital regulation, Main-taining stability in a changing financial system 431–471.
Ke, Bin, and Yong Yu, 2006, The effect of issuing biased earnings forecasts on analysts’ access tomanagement and survival, Journal of Accounting Research 44, 965–999.
Kreps, David M, 1990, Corporate culture and economic theory, Perspectives on positive politicaleconomy 90, 109–10.
Laeven, Luc, 2013, Corporate governance: What’s special about banks?, Annu. Rev. Financ. Econ.5, 63–92.
Laeven, Luc, and Ross Levine, 2009, Bank governance, regulation and risk taking, Journal ofFinancial Economics 93, 259–275.
Lang, Mark H, and Russell J Lundholm, 1996, Corporate disclosure policy and analyst behavior,The Accounting Review 71, 467–492.
Larcker, David F, Scott A Richardson, and Irem Tuna, 2007, Corporate governance, accountingoutcomes, and organizational performance, The Accounting Review 82, 963–1008.
Lin, Hsiou-wei, and Maureen F McNichols, 1998, Underwriting relationships, analysts’ earningsforecasts and investment recommendations, Journal of Accounting and Economics 25, 101–127.
Ljungqvist, Alexander, Felicia Marston, and William J Wilhelm, 2006, Competing for securitiesunderwriting mandates: Banking relationships and analyst recommendations, The Journal ofFinance 61, 301–340.
Mehran, Hamid, and Rene M Stulz, 2007, The economics of conflicts of interest in financial insti-tutions, Journal of Financial Economics 85, 267–296.
Michaely, Roni, and Kent L Womack, 1999, Conflict of interest and the credibility of underwriteranalyst recommendations, Review of Financial Studies 12, 653–686.
Nahavandi, Afsaneh, and Ali R Malekzadeh, 1988, Acculturation in mergers and acquisitions,Academy of Management Review 13, 79–90.
Ongena, Steven, Alexander Popov, and Gregory F Udell, 2013, When the cat’s away the mice willplay: Does regulation at home affect bank risk-taking abroad?, Journal of Financial Economics108, 727–750.
O’Reilly, Charles, 1989, Corporations, culture, and, California Management Review 31, 9.
O’Reilly, Charles A, Jennifer Chatman, and David F Caldwell, 1991, People and organizationalculture: A profile comparison approach to assessing person-organization fit, Academy of Man-agement Journal 34, 487–516.
OReilly, Charles A, and Jennifer A Chatman, 1996, Culture as social control: Corporations, cults,and commitment, Research In Organizational Behavior 18, 157–200.
Popadak, Jillian, 2013, A corporate culture channel: How increased shareholder governance reducesfirm value, Available at SSRN 2345384 .
Schein, Edgar H, 1990, Organizational culture., volume 45 (American Psychological Association).
35

Tayler, William B, and Robert J Bloomfield, 2011, Norms, conformity, and controls, Journal ofAccounting Research 49, 753–790.
Weber, Yaakov, Oded Shenkar, and Adi Raveh, 1996, National and corporate cultural fit in merg-ers/acquisitions: An exploratory study, Management Science 42, 1215–1227.
Williamson, Oliver E, 1975, Markets and hierarchies, New York 26–30.
36
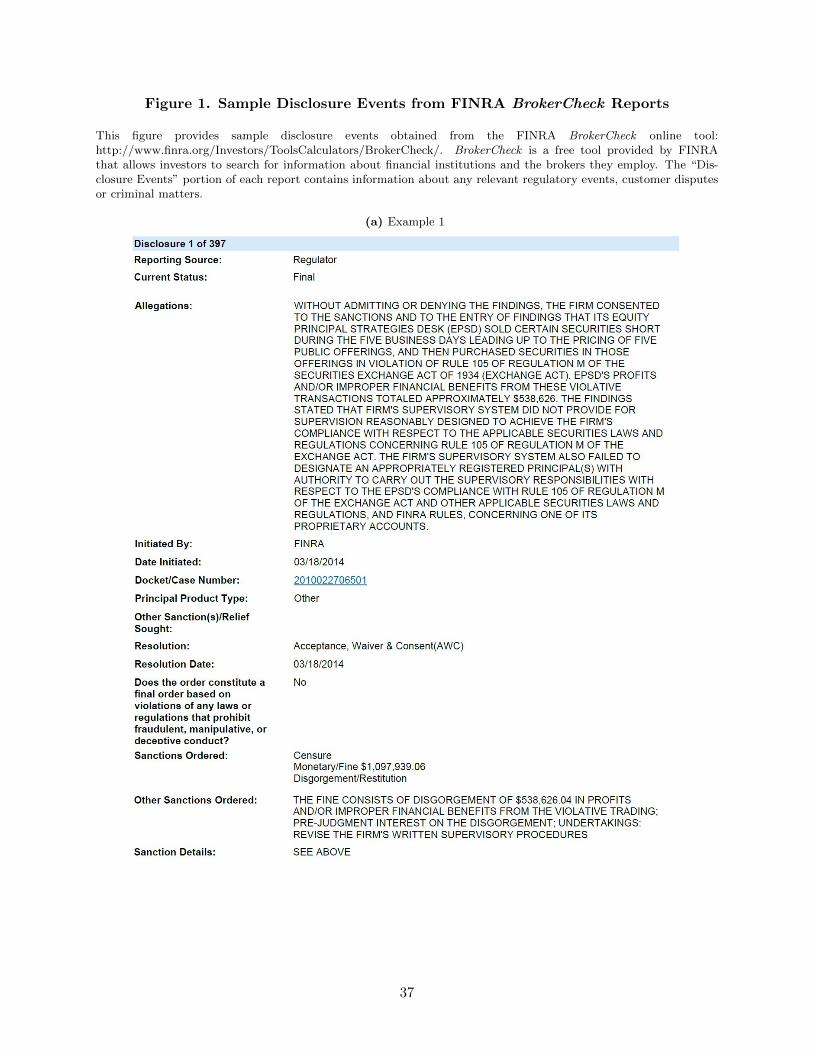
Figure 1. Sample Disclosure Events from FINRA BrokerCheck Reports
This figure provides sample disclosure events obtained from the FINRA BrokerCheck online tool:http://www.finra.org/Investors/ToolsCalculators/BrokerCheck/. BrokerCheck is a free tool provided by FINRAthat allows investors to search for information about financial institutions and the brokers they employ. The “Dis-closure Events” portion of each report contains information about any relevant regulatory events, customer disputesor criminal matters.
(a) Example 1
37
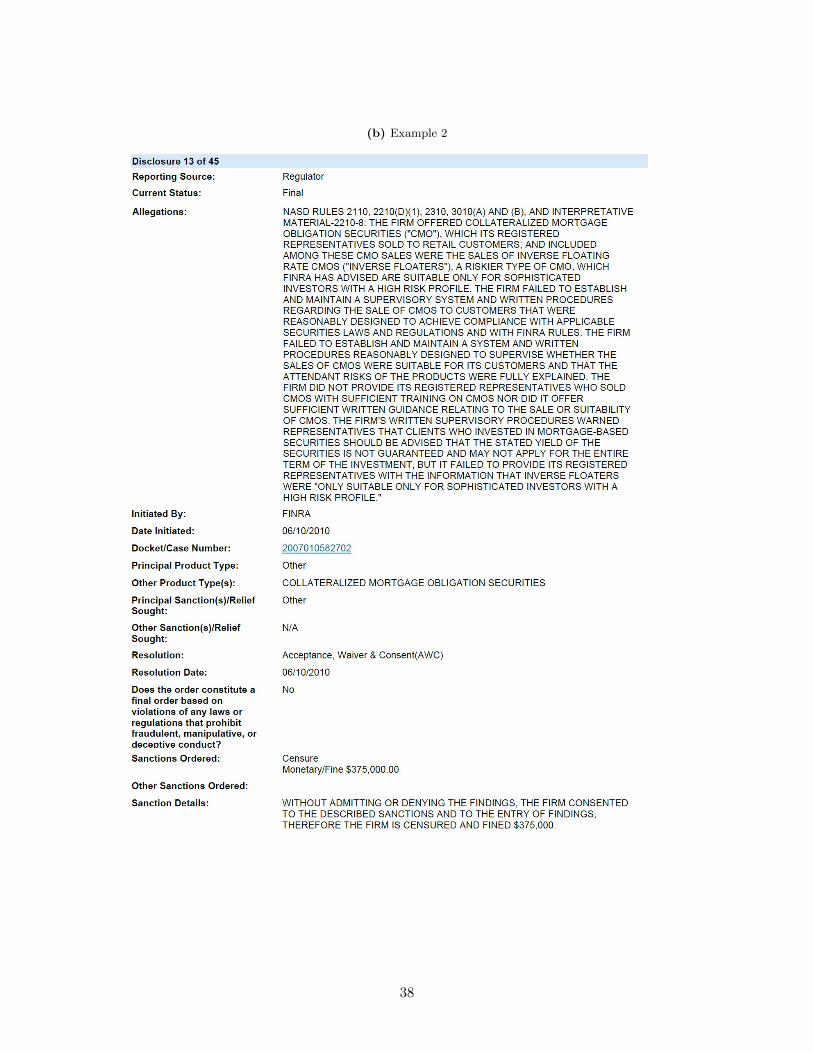
(b) Example 2
38

Table I: Sample of Financial Institutions
This table describes the sample of Financial Institutions included in the sample. The initial sam-ple of financial institutions and security subsidiaries is obtained from the Federal Reserve’s website(http://www.federalreserve.gov/bankinforeg/suds.htm) and SEC numbers are obtained from the SEC’s website(http://www.sec.gov/about/offices/oia/oia regstat.htm). CRD Numbers are obtained from the BrokerCheck onlinetool, provided by FINRA (http://www.finra.org/Investors/ToolsCalculators/BrokerCheck/). A financial institutionis included in the sample if data is available to identify the institution in the I/B/E/S database. Panel A provides thelist of financial institutions and security subsidiaries included in the sample. Panel B describes the type of businessesthat the institutions in the sample engage in (obtained from the BrokerCheck report).
Panel A: List of Financial Institutions and their Security Subsidiaries
Financial Institution Security Subsidiary SEC Number CRD Number
Allianz SE Commerz Markets LLC 8-49647 41957BNP Paribas BNP Paribas Investment Services, LLC 8-50745 44598BNP Paribas BNP Paribas Securities Corp. 8-32682 15794BPCE Natixis Bleichroeder LLC 8-719 1101BPCE Natixis Securities North America, Inc. 8-43912 28722Banco Santander Santander Investment Securities, Inc. 8-47664 37216Banco Santander Santander Securities Corp. 8-49571 41791Bank of Montreal BMO Capital Markets Corp. 8-34344 16686Bank of Nova Scotia Scotia Capital (USA), Inc. 8-3716 2739Canadian Imperial Bank of Commerce CIBC World Markets Corp. 8-18333 630Capital One Financial Corp. Capital One Southcoast, Inc. 8-50561 44158Cera Ancora VZW KBC Financial Products USA, Inc. 8-51529 46709Citigroup, Inc. Citigroup Global Markets, Inc. 8-8177 7059Citigroup, Inc. Morgan Stanley Smith Barney, LLC 8-68191 149777Credit Suisse Group Credit Suisse Securities (USA), LLC 8-422 816DZ Bank AG DZ Financial Markets, LLC 8-51687 47098Deutsche Bank AG Deutsche Bank Securities, Inc. 8-17822 2525DnB NOR ASA DnB NOR Nor Markets, Inc. 8-66024 127605Goldman, Sachs Group Epoch Securities, Inc. 8-52373 103899Goldman, Sachs Group Goldman Sachs Execution & Clearing, L.P. 8-526 3466Goldman, Sachs Group Goldman Sachs JBWere Inc. 8-26346 10117Goldman, Sachs Group Goldman, Sachs and Company 8-129 361HSBC Holdings PLC Capital Financial Services, INC. 8-25203 8408HSBC Holdings PLC HSBC Securities (USA), Inc. 8-41562 19585JPMorgan Chase & Co. Chase Investment Services Corp. 8-41840 25574JPMorgan Chase & Co. J.P. Morgan Securities, Inc. 8-35008 79Keycorp KeyBanc Capital Markets 8-30177 566Morgan Stanley Morgan Stanley & Co. Incorporated 8-15869 8209National Bank of Canada National Bank of Canada Financial, Inc. 8-39947 22698Rabobank Nederland Rabo Securities USA, Inc. 8-65525 122657Regions Financial Corp. Morgan, Keegan & Company, Inc. 8-15001 4161Royal Bank of Canada RBC Capital Markets Corp. 8-45411 31194Societe Generale Newedge USA, LLC 8-47023 36118Societe Generale SG Americas Securities, LLC 8-66125 128351Stifel Financial Corp. Stifel Nicolaus & Company, Inc. 8-1447 793Stifel Financial Corp. Thomas Weisel Partners LLC 8-51354 46237SunTrust Banks, Inc. SunTrust Investment Services, Inc. 8-35355 17499SunTrust Banks, Inc. SunTrust Robinson Humphrey, Inc. 8-17212 6271Toronto-Dominion Bank, The TD Ameritrade Clearing, Inc. 8-16335 5633Toronto-Dominion Bank, The TD Ameritrade Inc. 8-23395 7870Toronto-Dominion Bank, The TD Securities (USA), LLC 8-36747 18476UBS AG UBS Financial Services, Inc. 8-16267 8174UBS AG UBS Securities, LLC 8-22651 7654Wells Fargo & Company H.D. Vest Investment Securities, Inc. 8-29533 13686Wells Fargo & Company Wells Fargo Advisors Financial Network, LLC 8-28721 11025Wells Fargo & Company Wells Fargo Advisors, LLC 8-37180 19616Wells Fargo & Company Wells Fargo Institutional Securities, LLC 8-16600 5958Wells Fargo & Company Wells Fargo Securites, LLC 8-65876 126292
39
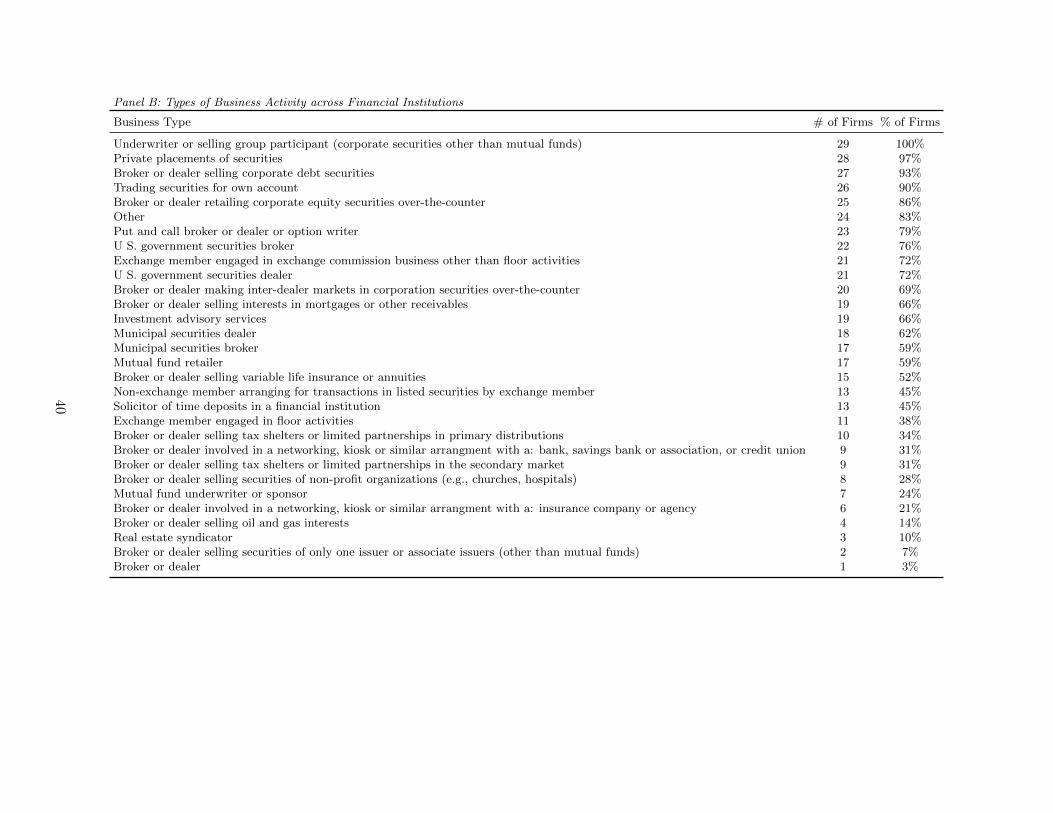
Panel B: Types of Business Activity across Financial Institutions
Business Type # of Firms % of Firms
Underwriter or selling group participant (corporate securities other than mutual funds) 29 100%Private placements of securities 28 97%Broker or dealer selling corporate debt securities 27 93%Trading securities for own account 26 90%Broker or dealer retailing corporate equity securities over-the-counter 25 86%Other 24 83%Put and call broker or dealer or option writer 23 79%U S. government securities broker 22 76%Exchange member engaged in exchange commission business other than floor activities 21 72%U S. government securities dealer 21 72%Broker or dealer making inter-dealer markets in corporation securities over-the-counter 20 69%Broker or dealer selling interests in mortgages or other receivables 19 66%Investment advisory services 19 66%Municipal securities dealer 18 62%Municipal securities broker 17 59%Mutual fund retailer 17 59%Broker or dealer selling variable life insurance or annuities 15 52%Non-exchange member arranging for transactions in listed securities by exchange member 13 45%Solicitor of time deposits in a financial institution 13 45%Exchange member engaged in floor activities 11 38%Broker or dealer selling tax shelters or limited partnerships in primary distributions 10 34%Broker or dealer involved in a networking, kiosk or similar arrangment with a: bank, savings bank or association, or credit union 9 31%Broker or dealer selling tax shelters or limited partnerships in the secondary market 9 31%Broker or dealer selling securities of non-profit organizations (e.g., churches, hospitals) 8 28%Mutual fund underwriter or sponsor 7 24%Broker or dealer involved in a networking, kiosk or similar arrangment with a: insurance company or agency 6 21%Broker or dealer selling oil and gas interests 4 14%Real estate syndicator 3 10%Broker or dealer selling securities of only one issuer or associate issuers (other than mutual funds) 2 7%Broker or dealer 1 3%
40
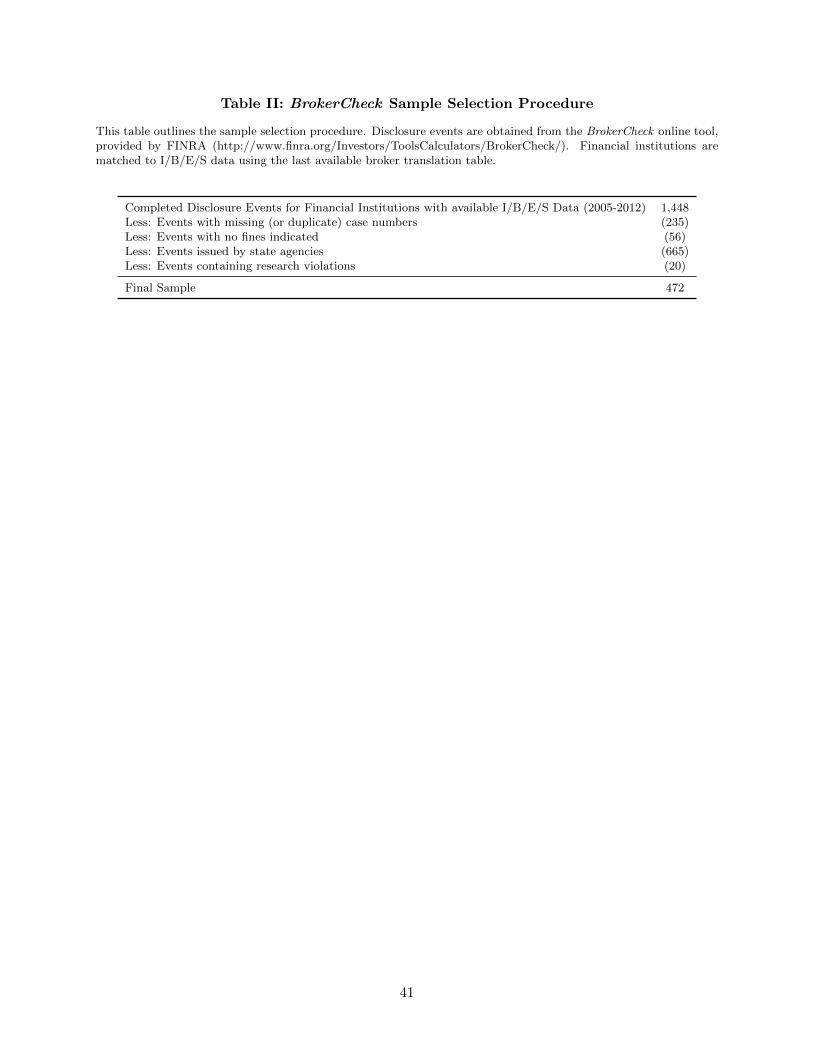
Table II: BrokerCheck Sample Selection Procedure
This table outlines the sample selection procedure. Disclosure events are obtained from the BrokerCheck online tool,provided by FINRA (http://www.finra.org/Investors/ToolsCalculators/BrokerCheck/). Financial institutions arematched to I/B/E/S data using the last available broker translation table.
Completed Disclosure Events for Financial Institutions with available I/B/E/S Data (2005-2012) 1,448Less: Events with missing (or duplicate) case numbers (235)Less: Events with no fines indicated (56)Less: Events issued by state agencies (665)Less: Events containing research violations (20)
Final Sample 472
41

Table III: Security Code Violation Characteristics
This table provides descriptive statistics for security code violations identified in FINRA BrokerCheck reports. PanelA reports the frequency of security code violations identified across disclosure events. Panel B reports the top 10most frequently occurring security code violations in the sample. Panel C presents the distribution of security codeviolations based on the framework detailed in Appendix C.
Panel A: Frequency of Security Code Violations
TotalCodes TotalEvents %TotalEvents
0 or None Identified 115 24%1 59 12%2 113 24%3 74 16%4 54 11%5 26 6%>5 31 7%
Total 472 100%
Panel B: Top 10 Most Frequent Security Code Violations
Rule Type of Violation TotalEvents %TotalEvents
NASD Rule 2110 Standards of Comm. Honor and Principles of Trade 198 42%NASD Rule 3010 Supervision of Employees 147 31%NASD Rule 6955 Order Data Transmission Requirements 58 12%FINRA Rule 2010 Standards of Comm. Honor and Principles of Trade 55 12%NYSE Rule 342 Offices - Approval, Supervision and Control 49 10%NASD Rule 6130 Trade Report Input 46 10%NASD Rule 3110 Books and Records 38 8%NASD Rule 6230 Transaction Reporting 32 7%NASD Rule 2320 Best Execution and Interpositioning 26 6%MSRB Rule 14 Reports of Sales or Purchases 26 6%
Panel C: Frequency of Violations by Category
Violation Category TotalEvents %TotalEvents
Clearing, Transaction, and Order Data Requirements & Facility Charges 71 14%Duties & Conflicts 294 60%Financial and Operational Rules 17 3%Investigations & Sanctions 6 1%Member Application & Associated Person Registration 24 5%Quotation and Transaction Reporting Facilities 89 18%Securities Offering and Trading Standards and Practices 43 9%Supervision and Responsibilities Relating to Associated Persons 206 42%
42

Table IV: Disclosure Event Characteristics
This table provides descriptive statistics for disclosure events identified in FINRA BrokerCheck reports. PanelA reports the frequency of disclosure events by year. Panel B reports the frequency of disclosure events byanonymous financial institution (in descending order of fine sanctioned). Panel C presents the correlation matrix ofcharacteristics within disclosure events. All variables are defined in Appendix B.
Panel A: Frequency by Year
Year TotalEvents TotalFines TotalCodes Avg. Fine/Event
2005 51 $280,589,500 114 $5,501,7552006 47 $63,694,454 98 $1,355,2012007 69 $71,638,250 154 $1,038,2362008 48 $6,991,500 92 $145,6562009 56 $10,462,000 147 $186,8212010 77 $19,919,000 170 $258,6882011 59 $38,365,500 162 $650,2632012 65 $18,889,900 171 $290,614
Total 472 $510,550,104 1,108 $1,081,674
Panel B: Frequency by Financial Institution
Financial Institution TotalEvents TotalFines TotalCodes Avg. Fine/Event
Financial Institution 1 34 $259,648,200 101 $7,636,712Financial Institution 2 48 $81,196,000 158 $1,691,583Financial Institution 3 50 $77,542,000 163 $1,550,840Financial Institution 4 34 $21,832,200 97 $642,124Financial Institution 5 28 $12,830,954 100 $458,248Financial Institution 6 62 $9,760,000 128 $157,419Financial Institution 7 21 $9,362,500 0 $445,833Financial Institution 8 12 $6,816,000 30 $568,000Financial Institution 9 25 $5,697,000 83 $227,880Financial Institution 10 18 $4,775,000 56 $265,278Financial Institution 11 3 $4,540,000 9 $1,513,333Financial Institution 12 13 $3,470,250 0 $266,942Financial Institution 13 22 $3,228,500 0 $146,750Financial Institution 14 21 $2,898,000 0 $138,000Financial Institution 15 3 $2,016,000 7 $672,000Financial Institution 16 14 $1,073,500 34 $76,679Financial Institution 17 11 $1,045,500 37 $95,045Financial Institution 18 13 $762,500 26 $58,654Financial Institution 19 10 $687,000 0 $68,700Financial Institution 20 8 $582,500 29 $72,813Financial Institution 21 9 $384,000 25 $42,667Financial Institution 22 4 $220,000 10 $55,000Financial Institution 23 4 $117,500 5 $29,375Financial Institution 24 4 $60,000 10 $15,000Financial Institution 25 1 $5,000 0 $5,000Financial Institution 26 0 $0 0 NAFinancial Institution 27 0 $0 0 NAFinancial Institution 28 0 $0 0 NAFinancial Institution 29 0 $0 0 NA
Total 472 $510,550,104 1,108 $1,081,674
43
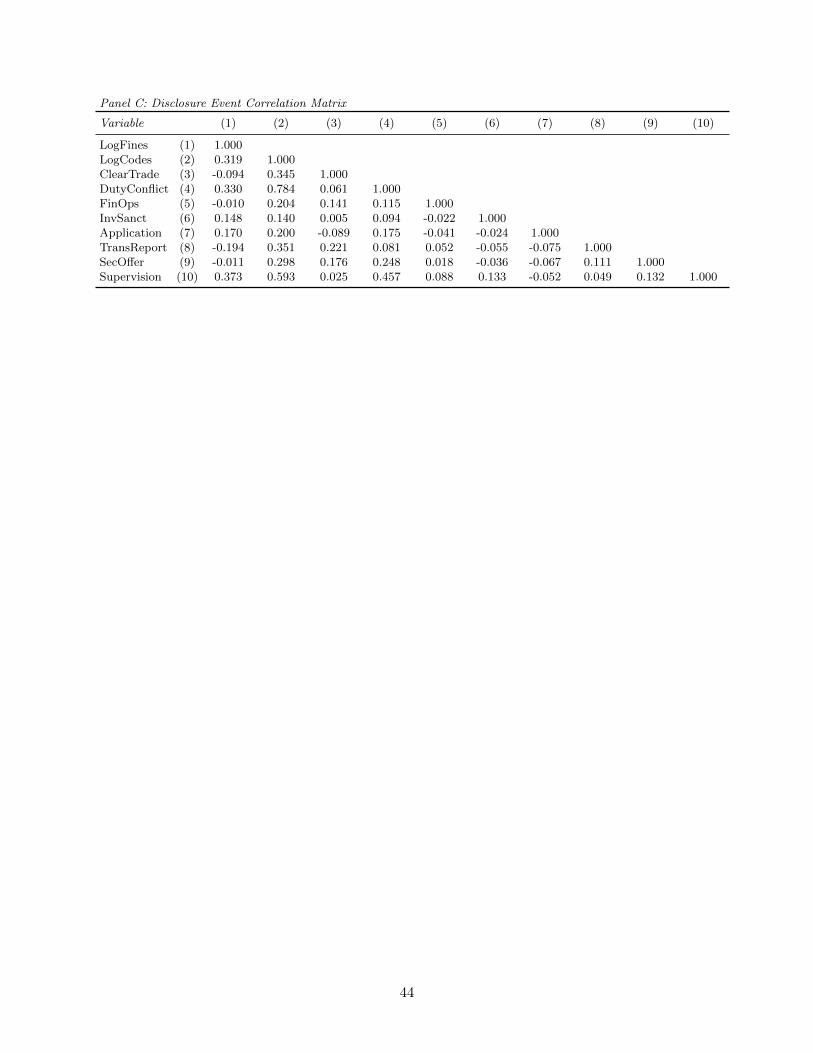
Panel C: Disclosure Event Correlation Matrix
Variable (1) (2) (3) (4) (5) (6) (7) (8) (9) (10)
LogFines (1) 1.000LogCodes (2) 0.319 1.000ClearTrade (3) -0.094 0.345 1.000DutyConflict (4) 0.330 0.784 0.061 1.000FinOps (5) -0.010 0.204 0.141 0.115 1.000InvSanct (6) 0.148 0.140 0.005 0.094 -0.022 1.000Application (7) 0.170 0.200 -0.089 0.175 -0.041 -0.024 1.000TransReport (8) -0.194 0.351 0.221 0.081 0.052 -0.055 -0.075 1.000SecOffer (9) -0.011 0.298 0.176 0.248 0.018 -0.036 -0.067 0.111 1.000Supervision (10) 0.373 0.593 0.025 0.457 0.088 0.133 -0.052 0.049 0.132 1.000
44

Table V: Validity of Security Code Violations Measures
This table examines the validity of measures of security code violations. Panel A provides the correlation coefficientsfor each measure of security code violations with up to 3 lags of the measure. Panel B presents transition matricesfor measures of security code violations, with values indicating the number (and percentage) of financial institution-year observations in each tercile of compliance violations in year t+ 1, conditional on initial tercile location in year t.Panel C provides correlation coefficients for measures of security code violations with proxies for stakeholder tradeoffs.Bolded values are significant at the 10% level or higher. All variables are defined in Appendix B.
Panel A: Correlation of Security Code Violations Measures with Lags
Security Code Violation Measures=
LogEvents LogFines LogCodes Obs.
Security Code Violations (Lag 1) 0.545 0.477 0.668 172Security Code Violations (Lag 2) 0.621 0.553 0.749 147Security Code Violations (Lag 3) 0.655 0.524 0.762 121
Panel B: Transition Matrix of Security Code Violations Measures
Security Code Violation Measure=
TotalEvents TotalFines TotalCodesTo/From Low Medium High Low Medium High Low Medium High
Low 35 17 5 33 18 4 63 13 7(61%) (30%) (9%) (60%) (33%) (7%) (76%) (16%) (8%)
Medium 18 27 17 17 24 19 11 10 10(29%) (44%) (27%) (28%) (40%) (32%) (36%) (32%) (32%)
High 6 17 30 6 15 36 7 10 41(11%) (32%) (57%) (11%) (26%) (63%) (12%) (17%) (71%)
Panel C: Security Code Violations & Stakeholder Tradeoffs
VARIABLES LogEvents LogFines LogCodes Obs.
Individual Investor ProtectionKLDProduct -0.519 -0.441 -0.617 70Shareholder ProtectionInstHoldings 0.080 0.025 0.057 179Gompers -0.404 -0.396 -0.479 80Insiders -0.080 -0.075 -0.080 179
45
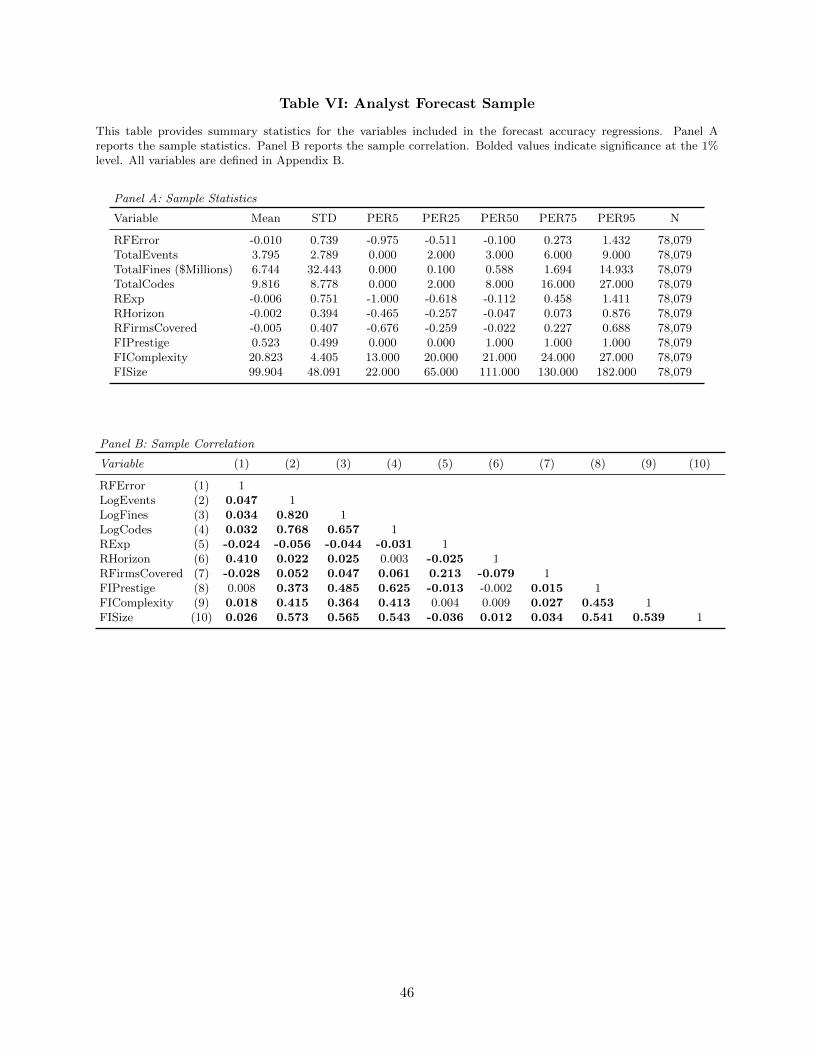
Table VI: Analyst Forecast Sample
This table provides summary statistics for the variables included in the forecast accuracy regressions. Panel Areports the sample statistics. Panel B reports the sample correlation. Bolded values indicate significance at the 1%level. All variables are defined in Appendix B.
Panel A: Sample Statistics
Variable Mean STD PER5 PER25 PER50 PER75 PER95 N
RFError -0.010 0.739 -0.975 -0.511 -0.100 0.273 1.432 78,079TotalEvents 3.795 2.789 0.000 2.000 3.000 6.000 9.000 78,079TotalFines ($Millions) 6.744 32.443 0.000 0.100 0.588 1.694 14.933 78,079TotalCodes 9.816 8.778 0.000 2.000 8.000 16.000 27.000 78,079RExp -0.006 0.751 -1.000 -0.618 -0.112 0.458 1.411 78,079RHorizon -0.002 0.394 -0.465 -0.257 -0.047 0.073 0.876 78,079RFirmsCovered -0.005 0.407 -0.676 -0.259 -0.022 0.227 0.688 78,079FIPrestige 0.523 0.499 0.000 0.000 1.000 1.000 1.000 78,079FIComplexity 20.823 4.405 13.000 20.000 21.000 24.000 27.000 78,079FISize 99.904 48.091 22.000 65.000 111.000 130.000 182.000 78,079
Panel B: Sample Correlation
Variable (1) (2) (3) (4) (5) (6) (7) (8) (9) (10)
RFError (1) 1LogEvents (2) 0.047 1LogFines (3) 0.034 0.820 1LogCodes (4) 0.032 0.768 0.657 1RExp (5) -0.024 -0.056 -0.044 -0.031 1RHorizon (6) 0.410 0.022 0.025 0.003 -0.025 1RFirmsCovered (7) -0.028 0.052 0.047 0.061 0.213 -0.079 1FIPrestige (8) 0.008 0.373 0.485 0.625 -0.013 -0.002 0.015 1FIComplexity (9) 0.018 0.415 0.364 0.413 0.004 0.009 0.027 0.453 1FISize (10) 0.026 0.573 0.565 0.543 -0.036 0.012 0.034 0.541 0.539 1
46
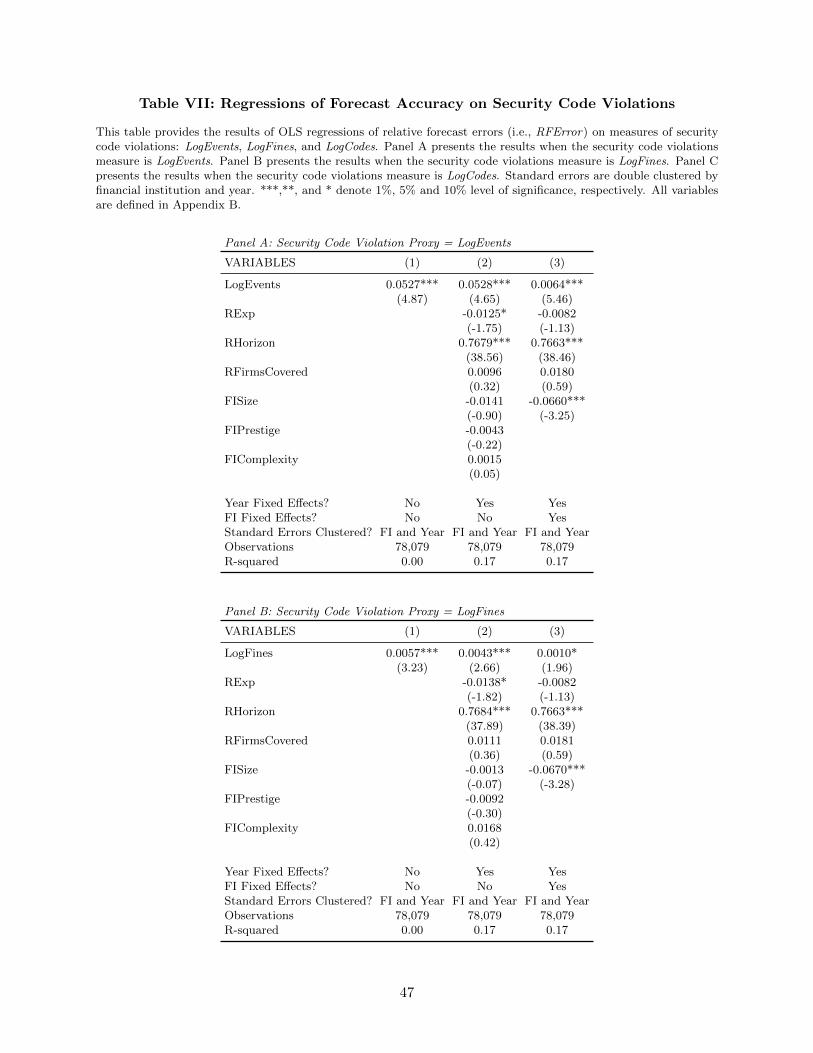
Table VII: Regressions of Forecast Accuracy on Security Code Violations
This table provides the results of OLS regressions of relative forecast errors (i.e., RFError) on measures of securitycode violations: LogEvents, LogFines, and LogCodes. Panel A presents the results when the security code violationsmeasure is LogEvents. Panel B presents the results when the security code violations measure is LogFines. Panel Cpresents the results when the security code violations measure is LogCodes. Standard errors are double clustered byfinancial institution and year. ***,**, and * denote 1%, 5% and 10% level of significance, respectively. All variablesare defined in Appendix B.
Panel A: Security Code Violation Proxy = LogEvents
VARIABLES (1) (2) (3)
LogEvents 0.0527*** 0.0528*** 0.0064***(4.87) (4.65) (5.46)
RExp -0.0125* -0.0082(-1.75) (-1.13)
RHorizon 0.7679*** 0.7663***(38.56) (38.46)
RFirmsCovered 0.0096 0.0180(0.32) (0.59)
FISize -0.0141 -0.0660***(-0.90) (-3.25)
FIPrestige -0.0043(-0.22)
FIComplexity 0.0015(0.05)
Year Fixed Effects? No Yes YesFI Fixed Effects? No No YesStandard Errors Clustered? FI and Year FI and Year FI and YearObservations 78,079 78,079 78,079R-squared 0.00 0.17 0.17
Panel B: Security Code Violation Proxy = LogFines
VARIABLES (1) (2) (3)
LogFines 0.0057*** 0.0043*** 0.0010*(3.23) (2.66) (1.96)
RExp -0.0138* -0.0082(-1.82) (-1.13)
RHorizon 0.7684*** 0.7663***(37.89) (38.39)
RFirmsCovered 0.0111 0.0181(0.36) (0.59)
FISize -0.0013 -0.0670***(-0.07) (-3.28)
FIPrestige -0.0092(-0.30)
FIComplexity 0.0168(0.42)
Year Fixed Effects? No Yes YesFI Fixed Effects? No No YesStandard Errors Clustered? FI and Year FI and Year FI and YearObservations 78,079 78,079 78,079R-squared 0.00 0.17 0.17
47
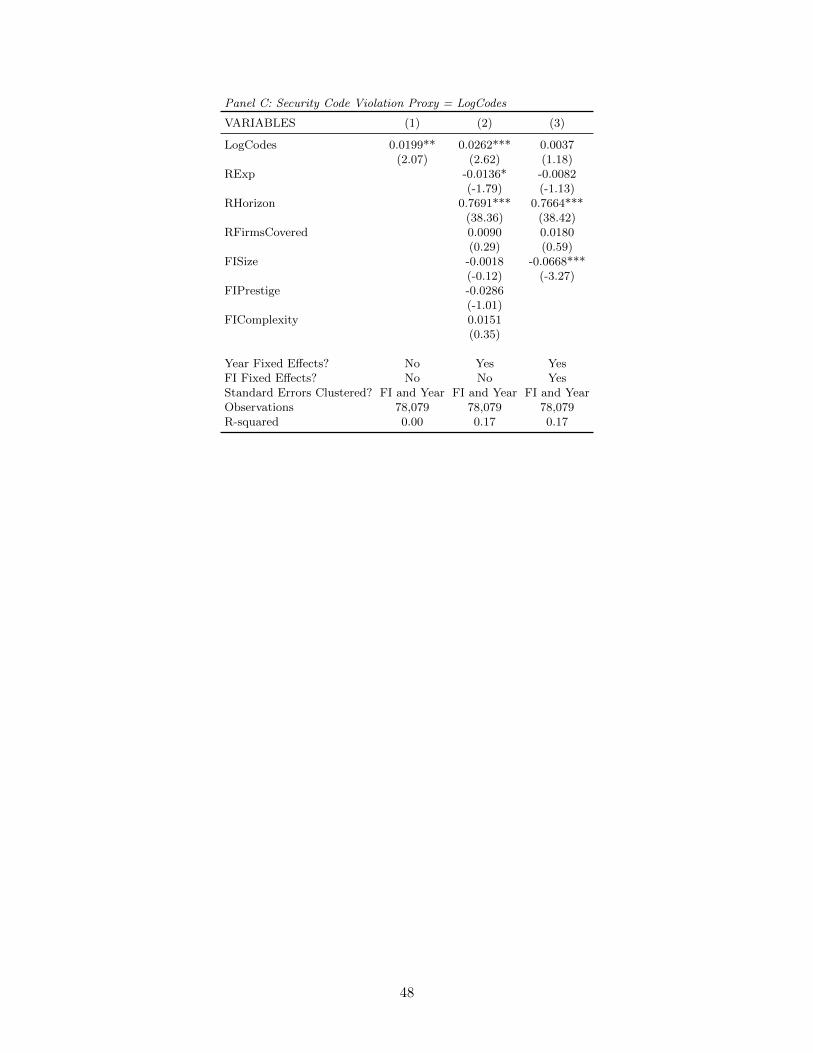
Panel C: Security Code Violation Proxy = LogCodes
VARIABLES (1) (2) (3)
LogCodes 0.0199** 0.0262*** 0.0037(2.07) (2.62) (1.18)
RExp -0.0136* -0.0082(-1.79) (-1.13)
RHorizon 0.7691*** 0.7664***(38.36) (38.42)
RFirmsCovered 0.0090 0.0180(0.29) (0.59)
FISize -0.0018 -0.0668***(-0.12) (-3.27)
FIPrestige -0.0286(-1.01)
FIComplexity 0.0151(0.35)
Year Fixed Effects? No Yes YesFI Fixed Effects? No No YesStandard Errors Clustered? FI and Year FI and Year FI and YearObservations 78,079 78,079 78,079R-squared 0.00 0.17 0.17
48
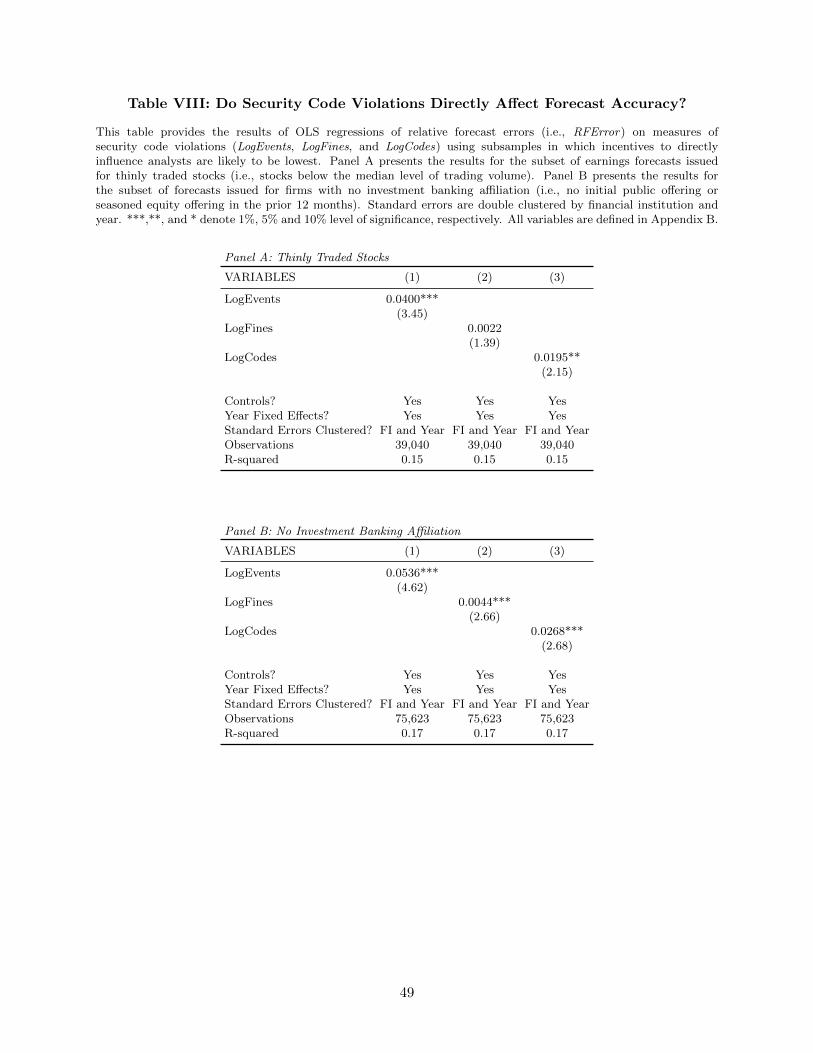
Table VIII: Do Security Code Violations Directly Affect Forecast Accuracy?
This table provides the results of OLS regressions of relative forecast errors (i.e., RFError) on measures ofsecurity code violations (LogEvents, LogFines, and LogCodes) using subsamples in which incentives to directlyinfluence analysts are likely to be lowest. Panel A presents the results for the subset of earnings forecasts issuedfor thinly traded stocks (i.e., stocks below the median level of trading volume). Panel B presents the results forthe subset of forecasts issued for firms with no investment banking affiliation (i.e., no initial public offering orseasoned equity offering in the prior 12 months). Standard errors are double clustered by financial institution andyear. ***,**, and * denote 1%, 5% and 10% level of significance, respectively. All variables are defined in Appendix B.
Panel A: Thinly Traded Stocks
VARIABLES (1) (2) (3)
LogEvents 0.0400***(3.45)
LogFines 0.0022(1.39)
LogCodes 0.0195**(2.15)
Controls? Yes Yes YesYear Fixed Effects? Yes Yes YesStandard Errors Clustered? FI and Year FI and Year FI and YearObservations 39,040 39,040 39,040R-squared 0.15 0.15 0.15
Panel B: No Investment Banking Affiliation
VARIABLES (1) (2) (3)
LogEvents 0.0536***(4.62)
LogFines 0.0044***(2.66)
LogCodes 0.0268***(2.68)
Controls? Yes Yes YesYear Fixed Effects? Yes Yes YesStandard Errors Clustered? FI and Year FI and Year FI and YearObservations 75,623 75,623 75,623R-squared 0.17 0.17 0.17
49
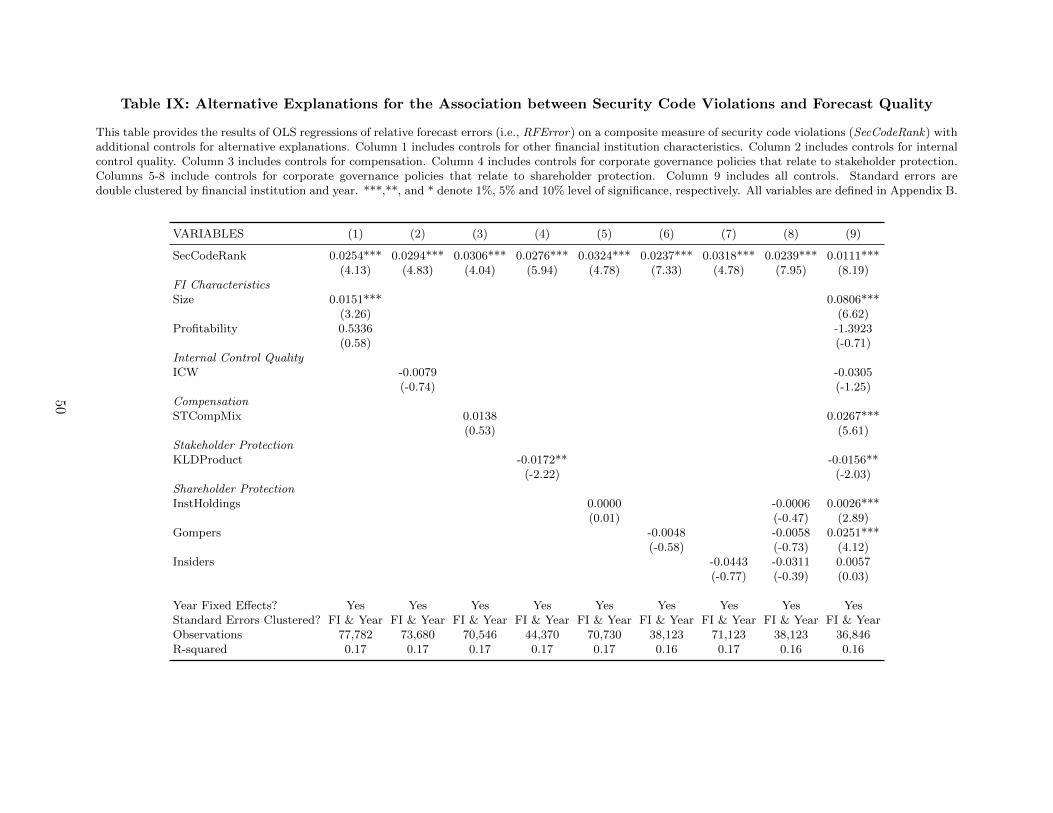
Table IX: Alternative Explanations for the Association between Security Code Violations and Forecast Quality
This table provides the results of OLS regressions of relative forecast errors (i.e., RFError) on a composite measure of security code violations (SecCodeRank) withadditional controls for alternative explanations. Column 1 includes controls for other financial institution characteristics. Column 2 includes controls for internalcontrol quality. Column 3 includes controls for compensation. Column 4 includes controls for corporate governance policies that relate to stakeholder protection.Columns 5-8 include controls for corporate governance policies that relate to shareholder protection. Column 9 includes all controls. Standard errors aredouble clustered by financial institution and year. ***,**, and * denote 1%, 5% and 10% level of significance, respectively. All variables are defined in Appendix B.
VARIABLES (1) (2) (3) (4) (5) (6) (7) (8) (9)
SecCodeRank 0.0254*** 0.0294*** 0.0306*** 0.0276*** 0.0324*** 0.0237*** 0.0318*** 0.0239*** 0.0111***(4.13) (4.83) (4.04) (5.94) (4.78) (7.33) (4.78) (7.95) (8.19)
FI CharacteristicsSize 0.0151*** 0.0806***
(3.26) (6.62)Profitability 0.5336 -1.3923
(0.58) (-0.71)Internal Control QualityICW -0.0079 -0.0305
(-0.74) (-1.25)CompensationSTCompMix 0.0138 0.0267***
(0.53) (5.61)Stakeholder ProtectionKLDProduct -0.0172** -0.0156**
(-2.22) (-2.03)Shareholder ProtectionInstHoldings 0.0000 -0.0006 0.0026***
(0.01) (-0.47) (2.89)Gompers -0.0048 -0.0058 0.0251***
(-0.58) (-0.73) (4.12)Insiders -0.0443 -0.0311 0.0057
(-0.77) (-0.39) (0.03)
Year Fixed Effects? Yes Yes Yes Yes Yes Yes Yes Yes YesStandard Errors Clustered? FI & Year FI & Year FI & Year FI & Year FI & Year FI & Year FI & Year FI & Year FI & YearObservations 77,782 73,680 70,546 44,370 70,730 38,123 71,123 38,123 36,846R-squared 0.17 0.17 0.17 0.17 0.17 0.16 0.17 0.16 0.16
50

Table X: Regressions of Upwardly Biased Forecasts on Security Code Violations andInvestment Banking Affiliation
This table provides the results of OLS regressions of upward forecast bias (i.e., RFBiasUp) on measures of securitycode violations (LogEvents, LogFines, and LogCodes) interacted with investment banking affiliation. Panel A presentsthe results for all analysts. Panel B presents the results for subsamples of analysts based on seniority. Columns 1-3present the results for Junior Analysts (i.e., less than 2 years of experience). Columns 4-6 present the results for Se-nior Analysts (i.e., more than 2 years of experience). Standard errors are double clustered by financial institution andyear. ***,**, and * denote 1%, 5% and 10% level of significance, respectively. All variables are defined in Appendix B.
Panel A: All Analysts
VARIABLES (1) (2) (3) (4) (5) (6)
LogEvents × Affiliation 0.0412* 0.0468*(1.69) (1.88)
LogFines × Affiliation 0.0127*** 0.0114*(3.68) (1.77)
LogCodes × Affiliation 0.0134 0.0120(1.54) (0.78)
LogEvents -0.0142 -0.0182*(-1.32) (-1.69)
LogFines -0.0014 -0.0025*(-1.03) (-1.88)
LogCodes -0.0055 -0.0107*(-0.82) (-1.94)
Affiliation -0.0886*** -0.0487 -0.1984*** -0.1307 -0.0532*** -0.1277(-4.21) (-0.19) (-4.35) (-0.67) (-3.51) (-.59)
Controls? No Yes No Yes No YesControls×Affiliation? No Yes No Yes No YesYear Fixed Effects? No Yes No Yes No YesStandard Errors Clustered? FI and Year FI and Year FI and Year FI and Year FI and Year FI and YearObservations 77,415 77,415 77,415 77,415 77,415 77,415R-squared 0.00 0.01 0.00 0.01 0.00 0.01
Panel B: Subsamples based on Analyst Seniority
Junior Analysts Senior Analysts
VARIABLES (1) (2) (3) (4) (5) (6)
LogEvents × Affiliation 0.2115** 0.0055(2.47) (0.16)
LogFines × Affiliation 0.0620*** 0.0018(2.71) (0.19)
LogCodes × Affiliation 0.1066** -0.0169***(1.99) (-2.73)
LogEvents -0.0235 -0.0175(-1.12) (-1.53)
LogFines -0.0028* -0.0024(-1.72) (-1.47)
LogCodes -0.0169** -0.0096(-2.00) (-1.64)
Affiliation 0.7742 0.2350 0.4757 -0.3201 -0.3183 -0.3758**(1.16) (0.35) (0.80) (-1.60) (-1.41) (-2.54)
Controls? Yes Yes Yes Yes Yes YesControls×Affiliation? Yes Yes Yes Yes Yes YesYear Fixed Effects? Yes Yes Yes Yes Yes YesStandard Errors Clustered? FI and Year FI and Year FI and Year FI and Year FI and Year FI and YearObservations 12,340 12,340 12,340 65,075 65,075 65,075R-squared 0.01 0.01 0.01 0.01 0.01 0.01
51
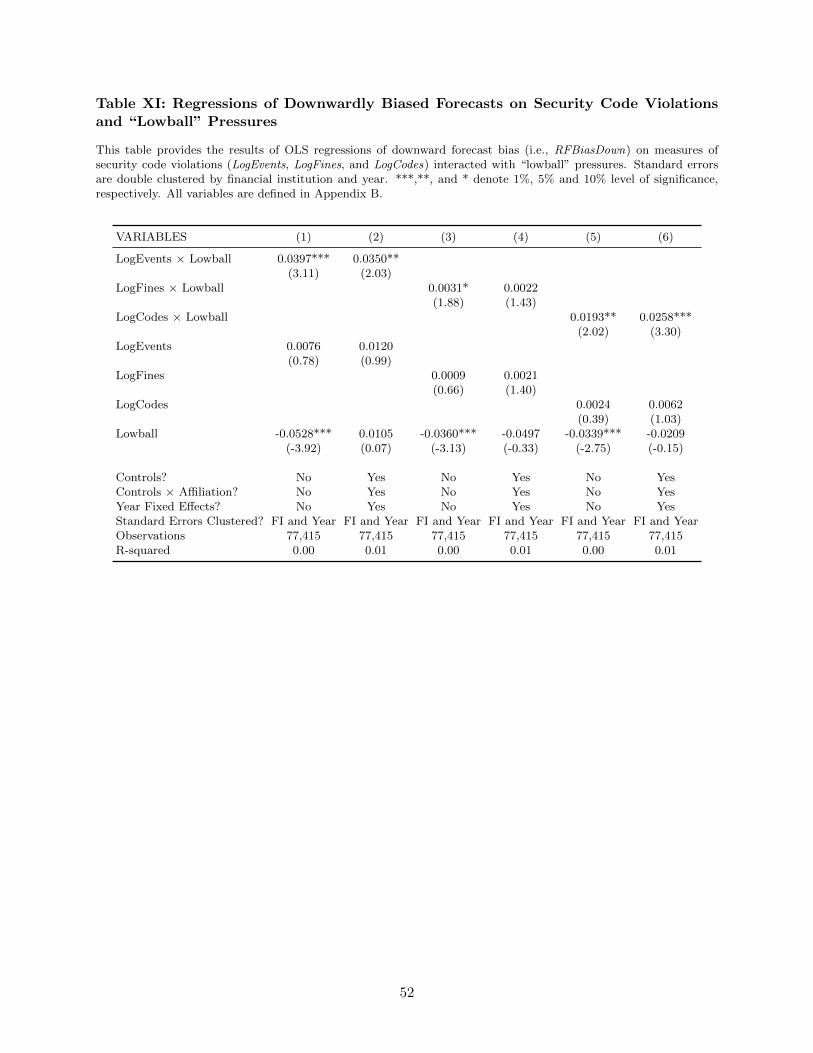
Table XI: Regressions of Downwardly Biased Forecasts on Security Code Violationsand “Lowball” Pressures
This table provides the results of OLS regressions of downward forecast bias (i.e., RFBiasDown) on measures ofsecurity code violations (LogEvents, LogFines, and LogCodes) interacted with “lowball” pressures. Standard errorsare double clustered by financial institution and year. ***,**, and * denote 1%, 5% and 10% level of significance,respectively. All variables are defined in Appendix B.
VARIABLES (1) (2) (3) (4) (5) (6)
LogEvents × Lowball 0.0397*** 0.0350**(3.11) (2.03)
LogFines × Lowball 0.0031* 0.0022(1.88) (1.43)
LogCodes × Lowball 0.0193** 0.0258***(2.02) (3.30)
LogEvents 0.0076 0.0120(0.78) (0.99)
LogFines 0.0009 0.0021(0.66) (1.40)
LogCodes 0.0024 0.0062(0.39) (1.03)
Lowball -0.0528*** 0.0105 -0.0360*** -0.0497 -0.0339*** -0.0209(-3.92) (0.07) (-3.13) (-0.33) (-2.75) (-0.15)
Controls? No Yes No Yes No YesControls × Affiliation? No Yes No Yes No YesYear Fixed Effects? No Yes No Yes No YesStandard Errors Clustered? FI and Year FI and Year FI and Year FI and Year FI and Year FI and YearObservations 77,415 77,415 77,415 77,415 77,415 77,415R-squared 0.00 0.01 0.00 0.01 0.00 0.01
52

Table XII: Regressions of Forecast Accuracy on Security Code Violations and All-StarStatus
This table provides the results of OLS regressions of relative forecast errors (i.e., RFError) on measures of securitycode violations (LogEvents, LogFines, and LogCodes) interacted with All-Star status. Standard errors are doubleclustered by financial institution and year. ***,**, and * denote 1%, 5% and 10% level of significance, respectively.All variables are defined in Appendix B.
VARIABLES (1) (2) (3) (4) (5) (6)
LogEvents × AllStar -0.0535*** -0.0456***(-4.29) (-2.62)
LogFines × AllStar -0.0128** -0.0090***(-2.45) (-3.38)
LogCodes × AllStar -0.0219 -0.0170(-1.38) (-1.42)
LogEvents 0.0698*** 0.0618***(4.73) (4.88)
LogFines 0.0081*** 0.0054**(3.83) (3.32)
LogCodes 0.0295** 0.0307**(2.13) (2.59)
AllStar 0.0196*** -0.0330 0.1144 -0.0114 -0.0117 0.0368(4.08) (-0.12) (1.51) (-0.04) (-0.49) (0.12)
Controls? No Yes No Yes No YesControls × AllStar? No Yes No Yes No YesYear Fixed Effects? No Yes No Yes No YesStandard Errors Clustered? FI and Year FI and Year FI and Year FI and Year FI and Year FI and YearObservations 65,428 65,428 65,428 65,428 65,428 65,428R-squared 0.00 0.18 0.00 0.17 0.00 0.18
53
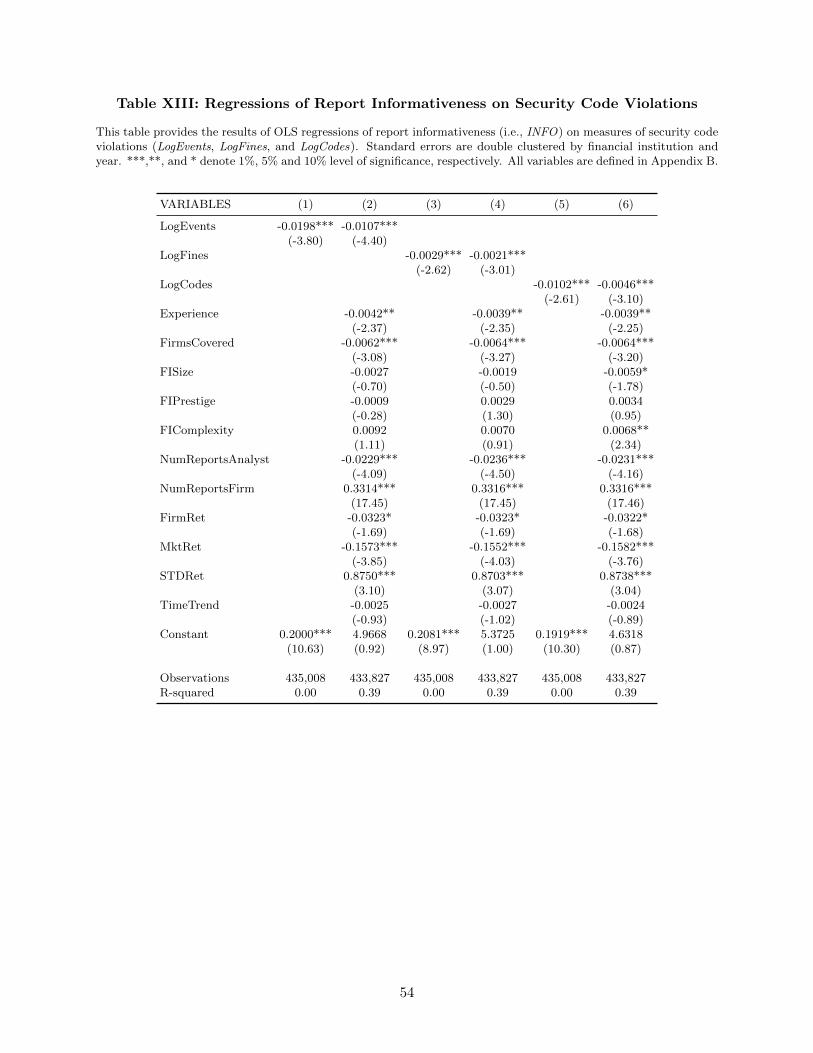
Table XIII: Regressions of Report Informativeness on Security Code Violations
This table provides the results of OLS regressions of report informativeness (i.e., INFO) on measures of security codeviolations (LogEvents, LogFines, and LogCodes). Standard errors are double clustered by financial institution andyear. ***,**, and * denote 1%, 5% and 10% level of significance, respectively. All variables are defined in Appendix B.
VARIABLES (1) (2) (3) (4) (5) (6)
LogEvents -0.0198*** -0.0107***(-3.80) (-4.40)
LogFines -0.0029*** -0.0021***(-2.62) (-3.01)
LogCodes -0.0102*** -0.0046***(-2.61) (-3.10)
Experience -0.0042** -0.0039** -0.0039**(-2.37) (-2.35) (-2.25)
FirmsCovered -0.0062*** -0.0064*** -0.0064***(-3.08) (-3.27) (-3.20)
FISize -0.0027 -0.0019 -0.0059*(-0.70) (-0.50) (-1.78)
FIPrestige -0.0009 0.0029 0.0034(-0.28) (1.30) (0.95)
FIComplexity 0.0092 0.0070 0.0068**(1.11) (0.91) (2.34)
NumReportsAnalyst -0.0229*** -0.0236*** -0.0231***(-4.09) (-4.50) (-4.16)
NumReportsFirm 0.3314*** 0.3316*** 0.3316***(17.45) (17.45) (17.46)
FirmRet -0.0323* -0.0323* -0.0322*(-1.69) (-1.69) (-1.68)
MktRet -0.1573*** -0.1552*** -0.1582***(-3.85) (-4.03) (-3.76)
STDRet 0.8750*** 0.8703*** 0.8738***(3.10) (3.07) (3.04)
TimeTrend -0.0025 -0.0027 -0.0024(-0.93) (-1.02) (-0.89)
Constant 0.2000*** 4.9668 0.2081*** 5.3725 0.1919*** 4.6318(10.63) (0.92) (8.97) (1.00) (10.30) (0.87)
Observations 435,008 433,827 435,008 433,827 435,008 433,827R-squared 0.00 0.39 0.00 0.39 0.00 0.39
54
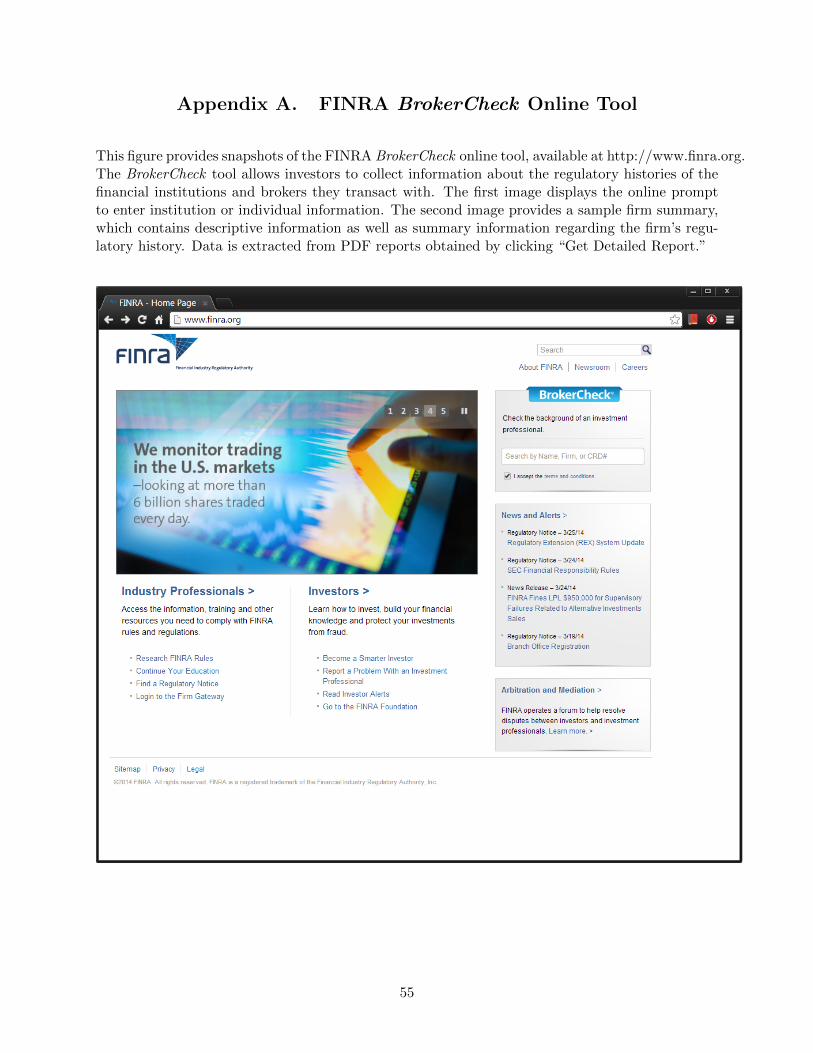
Appendix A. FINRA BrokerCheck Online Tool
This figure provides snapshots of the FINRA BrokerCheck online tool, available at http://www.finra.org.The BrokerCheck tool allows investors to collect information about the regulatory histories of thefinancial institutions and brokers they transact with. The first image displays the online promptto enter institution or individual information. The second image provides a sample firm summary,which contains descriptive information as well as summary information regarding the firm’s regu-latory history. Data is extracted from PDF reports obtained by clicking “Get Detailed Report.”
55
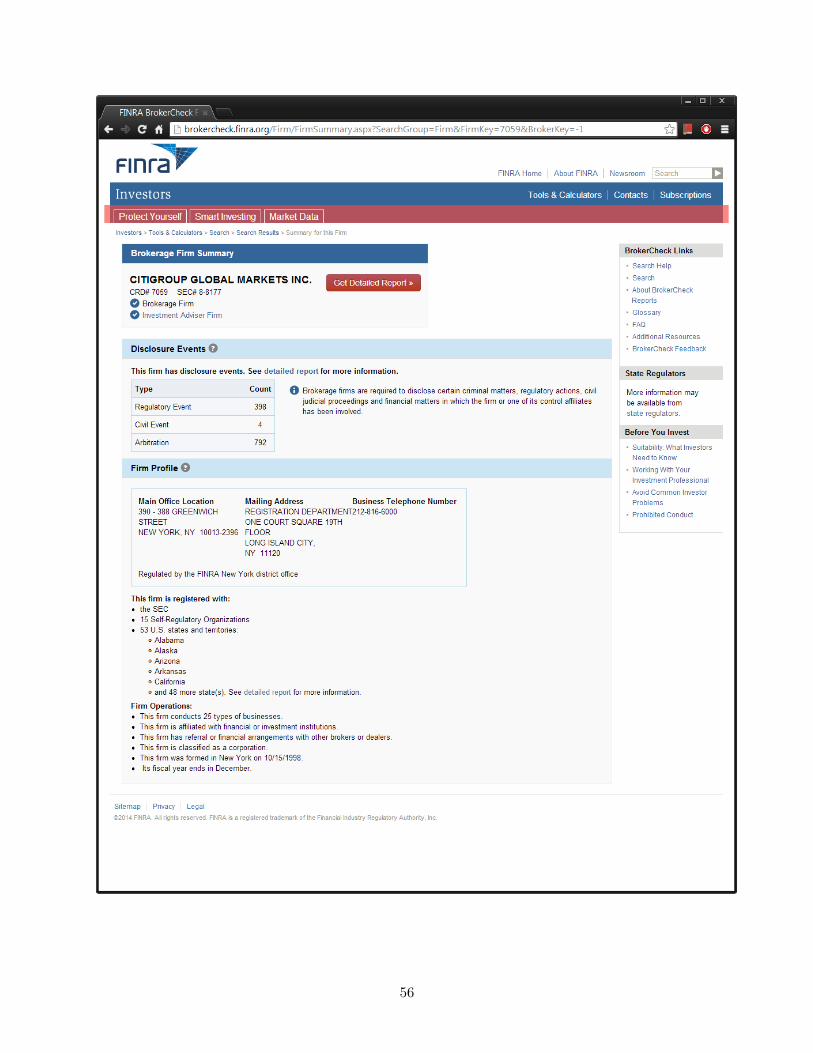
56
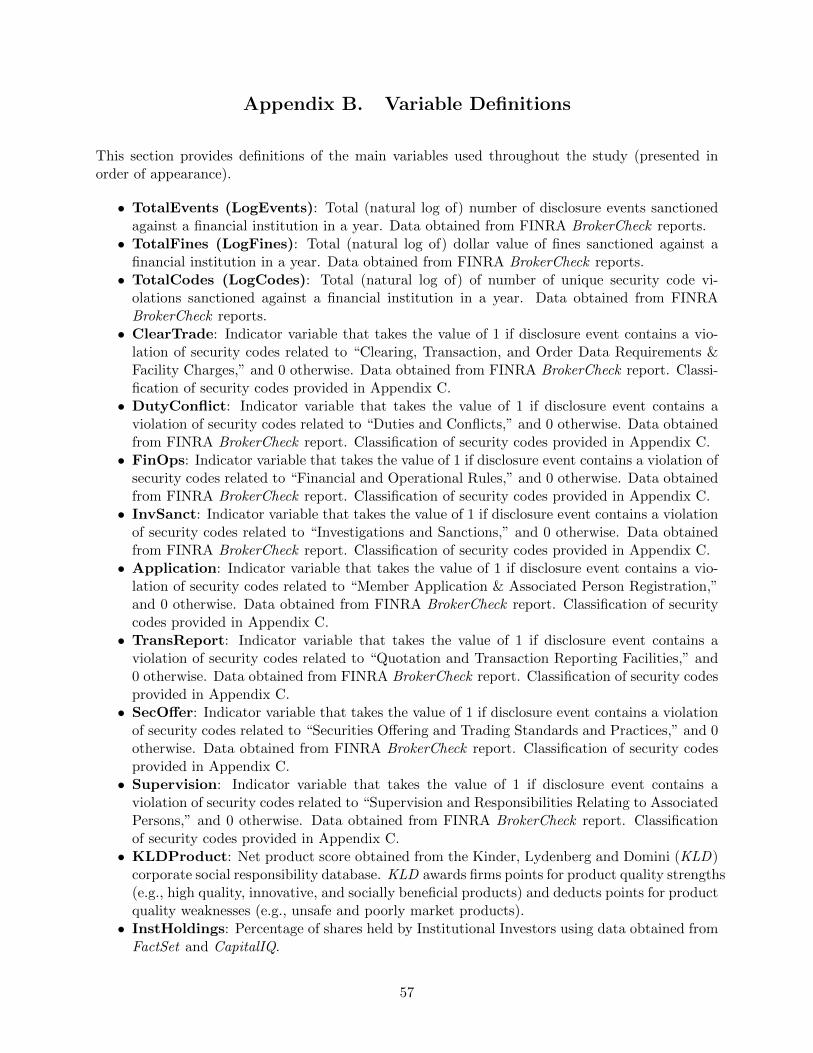
Appendix B. Variable Definitions
This section provides definitions of the main variables used throughout the study (presented inorder of appearance).
• TotalEvents (LogEvents): Total (natural log of) number of disclosure events sanctionedagainst a financial institution in a year. Data obtained from FINRA BrokerCheck reports.• TotalFines (LogFines): Total (natural log of) dollar value of fines sanctioned against a
financial institution in a year. Data obtained from FINRA BrokerCheck reports.• TotalCodes (LogCodes): Total (natural log of) of number of unique security code vi-
olations sanctioned against a financial institution in a year. Data obtained from FINRABrokerCheck reports.• ClearTrade: Indicator variable that takes the value of 1 if disclosure event contains a vio-
lation of security codes related to “Clearing, Transaction, and Order Data Requirements &Facility Charges,” and 0 otherwise. Data obtained from FINRA BrokerCheck report. Classi-fication of security codes provided in Appendix C.• DutyConflict: Indicator variable that takes the value of 1 if disclosure event contains a
violation of security codes related to “Duties and Conflicts,” and 0 otherwise. Data obtainedfrom FINRA BrokerCheck report. Classification of security codes provided in Appendix C.• FinOps: Indicator variable that takes the value of 1 if disclosure event contains a violation of
security codes related to “Financial and Operational Rules,” and 0 otherwise. Data obtainedfrom FINRA BrokerCheck report. Classification of security codes provided in Appendix C.• InvSanct: Indicator variable that takes the value of 1 if disclosure event contains a violation
of security codes related to “Investigations and Sanctions,” and 0 otherwise. Data obtainedfrom FINRA BrokerCheck report. Classification of security codes provided in Appendix C.• Application: Indicator variable that takes the value of 1 if disclosure event contains a vio-
lation of security codes related to “Member Application & Associated Person Registration,”and 0 otherwise. Data obtained from FINRA BrokerCheck report. Classification of securitycodes provided in Appendix C.• TransReport: Indicator variable that takes the value of 1 if disclosure event contains a
violation of security codes related to “Quotation and Transaction Reporting Facilities,” and0 otherwise. Data obtained from FINRA BrokerCheck report. Classification of security codesprovided in Appendix C.• SecOffer: Indicator variable that takes the value of 1 if disclosure event contains a violation
of security codes related to “Securities Offering and Trading Standards and Practices,” and 0otherwise. Data obtained from FINRA BrokerCheck report. Classification of security codesprovided in Appendix C.• Supervision: Indicator variable that takes the value of 1 if disclosure event contains a
violation of security codes related to “Supervision and Responsibilities Relating to AssociatedPersons,” and 0 otherwise. Data obtained from FINRA BrokerCheck report. Classificationof security codes provided in Appendix C.• KLDProduct: Net product score obtained from the Kinder, Lydenberg and Domini (KLD)
corporate social responsibility database. KLD awards firms points for product quality strengths(e.g., high quality, innovative, and socially beneficial products) and deducts points for productquality weaknesses (e.g., unsafe and poorly market products).• InstHoldings: Percentage of shares held by Institutional Investors using data obtained from
FactSet and CapitalIQ.
57
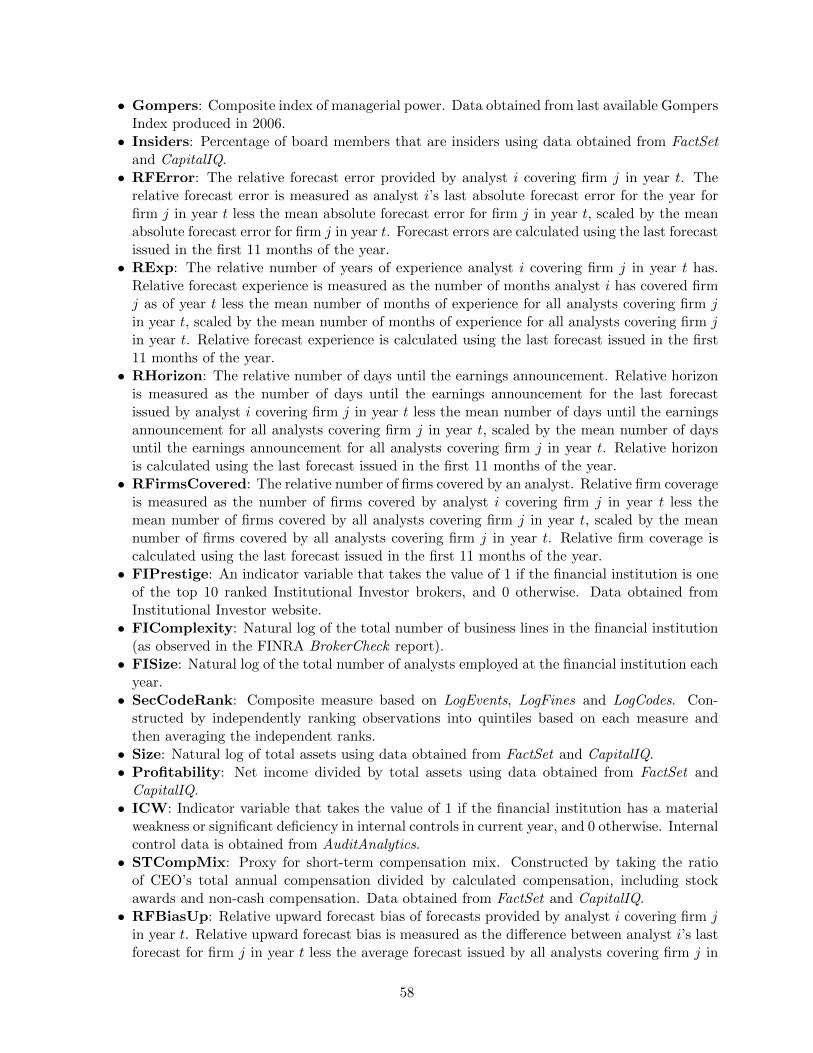
• Gompers: Composite index of managerial power. Data obtained from last available GompersIndex produced in 2006.• Insiders: Percentage of board members that are insiders using data obtained from FactSet
and CapitalIQ.• RFError: The relative forecast error provided by analyst i covering firm j in year t. The
relative forecast error is measured as analyst i’s last absolute forecast error for the year forfirm j in year t less the mean absolute forecast error for firm j in year t, scaled by the meanabsolute forecast error for firm j in year t. Forecast errors are calculated using the last forecastissued in the first 11 months of the year.• RExp: The relative number of years of experience analyst i covering firm j in year t has.
Relative forecast experience is measured as the number of months analyst i has covered firmj as of year t less the mean number of months of experience for all analysts covering firm jin year t, scaled by the mean number of months of experience for all analysts covering firm jin year t. Relative forecast experience is calculated using the last forecast issued in the first11 months of the year.• RHorizon: The relative number of days until the earnings announcement. Relative horizon
is measured as the number of days until the earnings announcement for the last forecastissued by analyst i covering firm j in year t less the mean number of days until the earningsannouncement for all analysts covering firm j in year t, scaled by the mean number of daysuntil the earnings announcement for all analysts covering firm j in year t. Relative horizonis calculated using the last forecast issued in the first 11 months of the year.• RFirmsCovered: The relative number of firms covered by an analyst. Relative firm coverage
is measured as the number of firms covered by analyst i covering firm j in year t less themean number of firms covered by all analysts covering firm j in year t, scaled by the meannumber of firms covered by all analysts covering firm j in year t. Relative firm coverage iscalculated using the last forecast issued in the first 11 months of the year.• FIPrestige: An indicator variable that takes the value of 1 if the financial institution is one
of the top 10 ranked Institutional Investor brokers, and 0 otherwise. Data obtained fromInstitutional Investor website.• FIComplexity: Natural log of the total number of business lines in the financial institution
(as observed in the FINRA BrokerCheck report).• FISize: Natural log of the total number of analysts employed at the financial institution each
year.• SecCodeRank: Composite measure based on LogEvents, LogFines and LogCodes. Con-
structed by independently ranking observations into quintiles based on each measure andthen averaging the independent ranks.• Size: Natural log of total assets using data obtained from FactSet and CapitalIQ.• Profitability: Net income divided by total assets using data obtained from FactSet and
CapitalIQ.• ICW: Indicator variable that takes the value of 1 if the financial institution has a material
weakness or significant deficiency in internal controls in current year, and 0 otherwise. Internalcontrol data is obtained from AuditAnalytics.• STCompMix: Proxy for short-term compensation mix. Constructed by taking the ratio
of CEO’s total annual compensation divided by calculated compensation, including stockawards and non-cash compensation. Data obtained from FactSet and CapitalIQ.• RFBiasUp: Relative upward forecast bias of forecasts provided by analyst i covering firm j
in year t. Relative upward forecast bias is measured as the difference between analyst i’s lastforecast for firm j in year t less the average forecast issued by all analysts covering firm j in
58
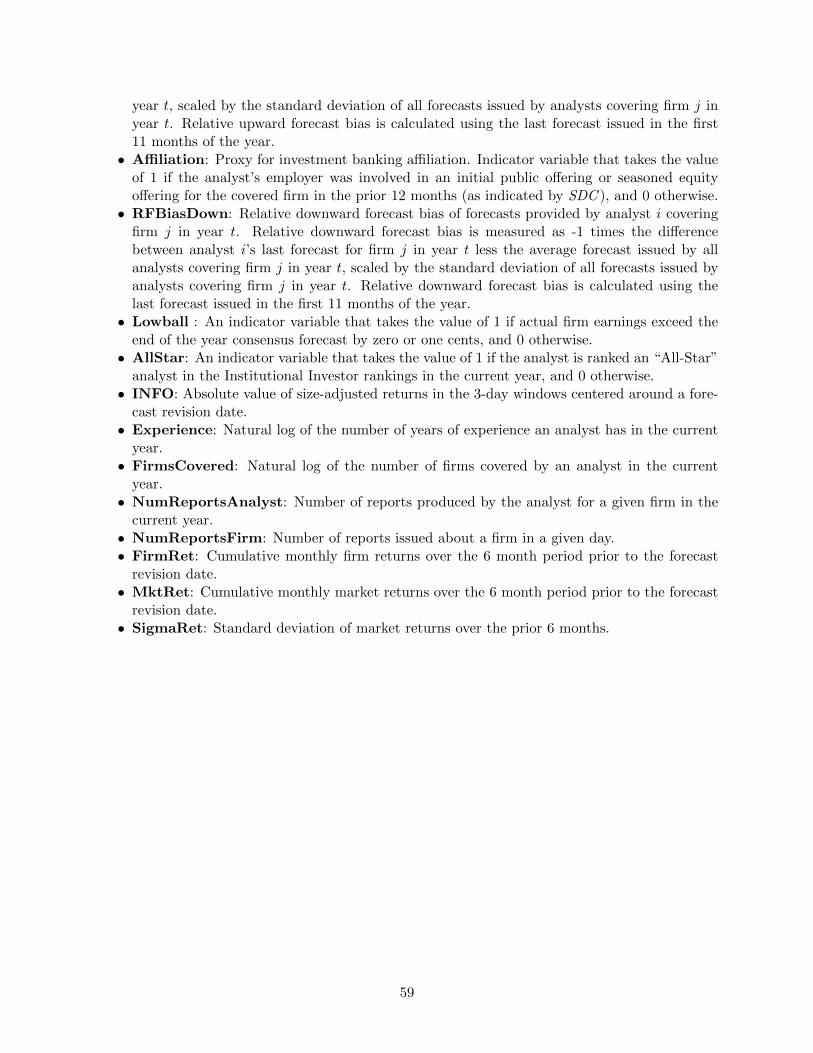
year t, scaled by the standard deviation of all forecasts issued by analysts covering firm j inyear t. Relative upward forecast bias is calculated using the last forecast issued in the first11 months of the year.• Affiliation: Proxy for investment banking affiliation. Indicator variable that takes the value
of 1 if the analyst’s employer was involved in an initial public offering or seasoned equityoffering for the covered firm in the prior 12 months (as indicated by SDC ), and 0 otherwise.• RFBiasDown: Relative downward forecast bias of forecasts provided by analyst i covering
firm j in year t. Relative downward forecast bias is measured as -1 times the differencebetween analyst i’s last forecast for firm j in year t less the average forecast issued by allanalysts covering firm j in year t, scaled by the standard deviation of all forecasts issued byanalysts covering firm j in year t. Relative downward forecast bias is calculated using thelast forecast issued in the first 11 months of the year.• Lowball : An indicator variable that takes the value of 1 if actual firm earnings exceed the
end of the year consensus forecast by zero or one cents, and 0 otherwise.• AllStar: An indicator variable that takes the value of 1 if the analyst is ranked an “All-Star”
analyst in the Institutional Investor rankings in the current year, and 0 otherwise.• INFO: Absolute value of size-adjusted returns in the 3-day windows centered around a fore-
cast revision date.• Experience: Natural log of the number of years of experience an analyst has in the current
year.• FirmsCovered: Natural log of the number of firms covered by an analyst in the current
year.• NumReportsAnalyst: Number of reports produced by the analyst for a given firm in the
current year.• NumReportsFirm: Number of reports issued about a firm in a given day.• FirmRet: Cumulative monthly firm returns over the 6 month period prior to the forecast
revision date.• MktRet: Cumulative monthly market returns over the 6 month period prior to the forecast
revision date.• SigmaRet: Standard deviation of market returns over the prior 6 months.
59

Appendix C. Classification of Security Code Violations
This table presents a classificaiton scheme of all violations identified in FINRA BrokerCheck reports.All identified security code violations are matched to the current FINRA rulebook based on majorcategory headings. The rulebook is available online at: http://www.finra.org/Industry/Regulation/.
Major Category Security Codes
Clearing, Transaction, and Order Data FINRA Codes 6130, 6230, 7230, 7330, 7410, 7440,Requirements & Facility Charges 7450; NASD Codes 6951, 6954, 6955
Duties & Conflicts
FINRA Codes 2010, 2020, 2110, 2111, 2210, 2220,2232, 2251, 2264, 2265, 2310, 2320, 2360, 5280;MSRB Codes A-13, 2, 21, 30, 32;NASD Codes 2110, 2120, 2210, 2211,2220, 2230, 2260, 2310, 2341, 2420, 2440, 2711,2810, 2820, 2830, 2860; NYSE Codes 97, 104,115, 116, 301, 304, 311, 341, 451, 460,722, 5190, 1100, 123, 132, 134, 2010, 203, 320,325, 342, 345, 346, 351, 401, 405, 407, 408, 409,410, 411, 416, 421, 440, 445, 452, 472, 80, 90, 92
Financial and Operational RulesFINRA Codes 4210, 4311, 4320, 4370, 4511, 4530,4560, 4632, 4650, 2520, 3070, 3210, 3230, 3360, 3510
Investigations & SanctionsFINRA Codes 8210, 8211, 8213;NASD Codes 8210, 8211, 8213
Member Application & Associated Person RegistrationFINRA 1122; NASD 1021, 1022, 1031, 1032, 1050;NYSE 10; MSRB 3
Quotation and Transaction Reporting FacilitiesFINRA 6182, 6279, 6380, 6440, 6622, 6624, 6633,6634, 6730, 6740, 6760, 6830, 6955; MSRB 14; NASD4613, 4632, 6230, 6240, 6620, 6640, 6732, 6740, 6760
Securities Offering and Trading Standards and PracticesFINRA 5121, 5210, 5220, 5260, 5310, 5320, 5330;NASD 2111, 2320, 2720, 3220, 3310, 3320, 3340
Supervision and Responsibilities Relating to Associated PersonsFINRA 3010, 3240, 3310; MSRB 27, 41, 8;NASD 2370, 3010, 3011, 3012, 3040, 3050, 3110,3350, 3370; NYSE 476
60
Copyright © 2022 FDOKUMEN