The Effect of Illuminant Rotation on Texture Filters: Lissajous's Ellipses
15
The Effect of Illuminant Rotation on Texture Filters: Lissajous’s Ellipses M. Chantler 1 , M. Schmidt 2 , M. Petrou 3 , and G. McGunnigle 1 1 Texture Lab., Heriot-Watt University, Edinburgh,Scotland, [email protected] http://www.cee.hw.ac.uk/texturelab/ 2 Darmstadt University of Technology, Germany, 3 Department of Electronic and Electrical Engineering, University of Surrey, Guildford, Surrey, GU2 7XH, United Kingdom [email protected] http://www.ee.surrey.ac.uk/Personal/M.Petrou Abstract. Changes in the angle of illumination incident upon a 3D surface texture can significantly change its appearance. These changes can affect the output of texture features to such an extent that they cause complete misclassification. We present new theory and experi- mental results that show that changes in illumination tilt angle cause texture clusters to describe Lissajous’s ellipses in feature space. We focus on texture features that may be modelled as a linear filter followed by an energy estimation process e.g. Laws filters, Gabor filters, ring and wedge filters. This general texture filter model is combined with a linear approximation of Lambert’s cosine law to predict that the outputs of these filters are sinusoidal functions of illuminant tilt. Experimentation with 30 real textures verifies this proposal. Furthermore we use these results to show that the clusters of distinct textures describe different el- liptical paths in feature space as illuminant tilt varies. These results have significant implications for illuminant tilt invariant texture classification. Keywords: Texture, illumination, texture features 1 Introduction It has been shown that changes in the angle of illumination incident upon a 3D surface texture can change its appearance significantly as illustrated in Fig. 1. Such changes in image texture can cause complete misclassification of surface textures [1]. Essentially the problem is that side-lighting, as used for instance in Brodatz’s texture album [2], enhances the appearance of surface texture but produces an image which is a directionally filtered version of the surface height function. Furthermore as the theory developed by Kube and Pentland [3] pre- dicts, the axis of this filter is a function of the illumination’s tilt angle 1 . This is 1 In the axis system we use, the camera axis is parallel to the z-axis, illuminant tilt is the angle the illuminant vector makes with the x-axis when it is projected into the A. Heyden et al. (Eds.): ECCV 2002, LNCS 2352, pp. 289–303, 2002. c Springer-Verlag Berlin Heidelberg 2002
Transcript of The Effect of Illuminant Rotation on Texture Filters: Lissajous's Ellipses
The Effect of Illuminant Rotation on TextureFilters: Lissajous’s Ellipses
M. Chantler1, M. Schmidt2, M. Petrou3, and G. McGunnigle1
1 Texture Lab., Heriot-Watt University, Edinburgh,Scotland,[email protected]
http://www.cee.hw.ac.uk/texturelab/2 Darmstadt University of Technology, Germany,
3 Department of Electronic and Electrical Engineering, University of Surrey,Guildford,
Surrey, GU2 7XH, United [email protected]
http://www.ee.surrey.ac.uk/Personal/M.Petrou
Abstract. Changes in the angle of illumination incident upon a 3Dsurface texture can significantly change its appearance. These changescan affect the output of texture features to such an extent that theycause complete misclassification. We present new theory and experi-mental results that show that changes in illumination tilt angle causetexture clusters to describe Lissajous’s ellipses in feature space. Wefocus on texture features that may be modelled as a linear filter followedby an energy estimation process e.g. Laws filters, Gabor filters, ring andwedge filters. This general texture filter model is combined with a linearapproximation of Lambert’s cosine law to predict that the outputs ofthese filters are sinusoidal functions of illuminant tilt. Experimentationwith 30 real textures verifies this proposal. Furthermore we use theseresults to show that the clusters of distinct textures describe different el-liptical paths in feature space as illuminant tilt varies. These results havesignificant implications for illuminant tilt invariant texture classification.
Keywords: Texture, illumination, texture features
1 Introduction
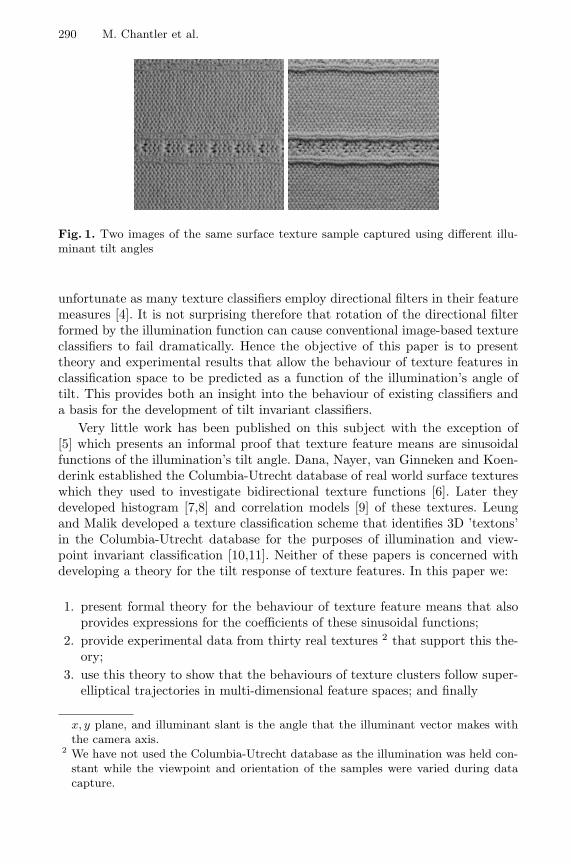
It has been shown that changes in the angle of illumination incident upon a 3Dsurface texture can change its appearance significantly as illustrated in Fig. 1.Such changes in image texture can cause complete misclassification of surfacetextures [1]. Essentially the problem is that side-lighting, as used for instancein Brodatz’s texture album [2], enhances the appearance of surface texture butproduces an image which is a directionally filtered version of the surface heightfunction. Furthermore as the theory developed by Kube and Pentland [3] pre-dicts, the axis of this filter is a function of the illumination’s tilt angle 1 . This is1 In the axis system we use, the camera axis is parallel to the z-axis, illuminant tilt isthe angle the illuminant vector makes with the x-axis when it is projected into the
A. Heyden et al. (Eds.): ECCV 2002, LNCS 2352, pp. 289–303, 2002.c© Springer-Verlag Berlin Heidelberg 2002
290 M. Chantler et al.
Fig. 1. Two images of the same surface texture sample captured using different illu-minant tilt angles
unfortunate as many texture classifiers employ directional filters in their featuremeasures [4]. It is not surprising therefore that rotation of the directional filterformed by the illumination function can cause conventional image-based textureclassifiers to fail dramatically. Hence the objective of this paper is to presenttheory and experimental results that allow the behaviour of texture features inclassification space to be predicted as a function of the illumination’s angle oftilt. This provides both an insight into the behaviour of existing classifiers anda basis for the development of tilt invariant classifiers.
Very little work has been published on this subject with the exception of[5] which presents an informal proof that texture feature means are sinusoidalfunctions of the illumination’s tilt angle. Dana, Nayer, van Ginneken and Koen-derink established the Columbia-Utrecht database of real world surface textureswhich they used to investigate bidirectional texture functions [6]. Later theydeveloped histogram [7,8] and correlation models [9] of these textures. Leungand Malik developed a texture classification scheme that identifies 3D ’textons’in the Columbia-Utrecht database for the purposes of illumination and view-point invariant classification [10,11]. Neither of these papers is concerned withdeveloping a theory for the tilt response of texture features. In this paper we:
1. present formal theory for the behaviour of texture feature means that alsoprovides expressions for the coefficients of these sinusoidal functions;
2. provide experimental data from thirty real textures 2 that support this the-ory;
3. use this theory to show that the behaviours of texture clusters follow super-elliptical trajectories in multi-dimensional feature spaces; and finally
x, y plane, and illuminant slant is the angle that the illuminant vector makes withthe camera axis.
2 We have not used the Columbia-Utrecht database as the illumination was held con-stant while the viewpoint and orientation of the samples were varied during datacapture.
The Effect of Illuminant Rotation on Texture Filters: Lissajous’s Ellipses 291
4. show experimental results in 2D feature space that support the conjecturethat changes in illumination tilt cause texture clusters to follow behavioursthat may be described by Lissajous’s ellipses.
We focus on the group of texture features classified as ’filtering approaches’ byRanden [4] such as Gabor, Laws, and ring/wedge filters. These features maybe described as a linear filter followed by an energy estimation function. Thisgeneral feature model is combined with a linearised version of Lambert’s cosinelaw due to Kube and Pentland [3]. The result is theory that may be used topredict the behaviour of texture features as a function of illuminant tilt. Thistheory is presented in the next section, after which we describe results derivedfrom experiments with 30 textures.
2 Theory
This section derives an expression for the mean value of a texture filter as a func-tion of the illumination’s tilt angle. The features are modelled simply as a linearfilter followed by an energy estimation process as described in the introduction.First, however, we give a short derivation of the linear illumination model thatis necessary for the development of the theory.
2.1 A Linearised Model of Lambert’s Cosine Law
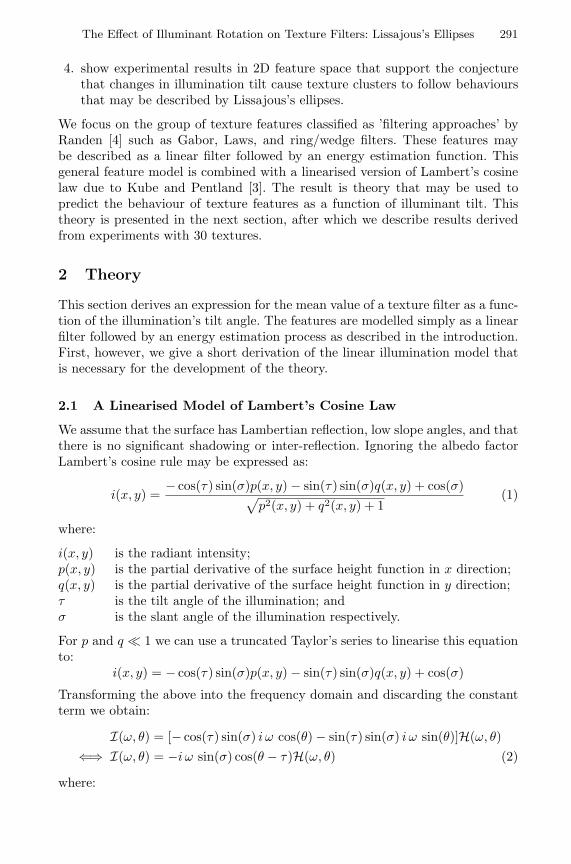
We assume that the surface has Lambertian reflection, low slope angles, and thatthere is no significant shadowing or inter-reflection. Ignoring the albedo factorLambert’s cosine rule may be expressed as:
i(x, y) =− cos(τ) sin(σ)p(x, y) − sin(τ) sin(σ)q(x, y) + cos(σ)√
p2(x, y) + q2(x, y) + 1(1)
where:
i(x, y) is the radiant intensity;p(x, y) is the partial derivative of the surface height function in x direction;q(x, y) is the partial derivative of the surface height function in y direction;τ is the tilt angle of the illumination; andσ is the slant angle of the illumination respectively.
For p and q 1 we can use a truncated Taylor’s series to linearise this equationto:
i(x, y) = − cos(τ) sin(σ)p(x, y) − sin(τ) sin(σ)q(x, y) + cos(σ)
Transforming the above into the frequency domain and discarding the constantterm we obtain:
I(ω, θ) = [− cos(τ) sin(σ) i ω cos(θ) − sin(τ) sin(σ) i ω sin(θ)]H(ω, θ)⇐⇒ I(ω, θ) = −i ω sin(σ) cos(θ − τ)H(ω, θ) (2)
where:

292 M. Chantler et al.
I(ω, θ) is the Fourier transform of the image intensity function;H(ω, θ) is the Fourier transform of the surface height function; and(ω, θ) are polar frequency coordinates.
In this paper it is more convenient to express equation 2 in its power spectrumform:
I(ω, θ) = ω2cos2(θ − τ)sin2(σ)H(ω, θ) (3)
where:
I(ω, θ) is the image power spectrum; andH(ω, θ) is the surface power spectrum.
Equations 2 and 3 are similar to the model first expressed by Kube & Pentlandin [3]. In the context of this paper the most important feature of this model is thecos(θ − τ) factor, which predicts that the imaging function acts as a directionalfilter of the surface height function.
2.2 The Output of Linear Texture Filters and Their Features
We define a Linear Texture Feature as a linear filter followed by a varianceestimator[4]. The process formed by applying such a feature to an image is asshown in Fig. 2. Since the model of the illumination process (equation 3) isalso linear we may exchange it with the linear filter (Fig. 3). We use A(ω, θ) torepresent the notional power spectrum of the output of the linear texture filterapplied directly to the surface height function.
SurfaceH(ω, θ)
Illumination
IlluminatedImageI(ω, θ)
LinearFilter
F(ω, θ)
FilteredImageO(ω, θ)
VarianceEstimation
featureoutputf(τ)
feature generation
Fig. 2. Feature generation
SurfaceH(ω, θ)
LinearFilter
F(ω, θ)
FilteredSurfaceA(ω, θ)
Illumination
FilteredImageO(ω, θ)
VarianceEstimation
featureoutputf(τ)
Fig. 3. The feature generation model with illumination and linear filter processesinterchanged
The Effect of Illuminant Rotation on Texture Filters: Lissajous’s Ellipses 293
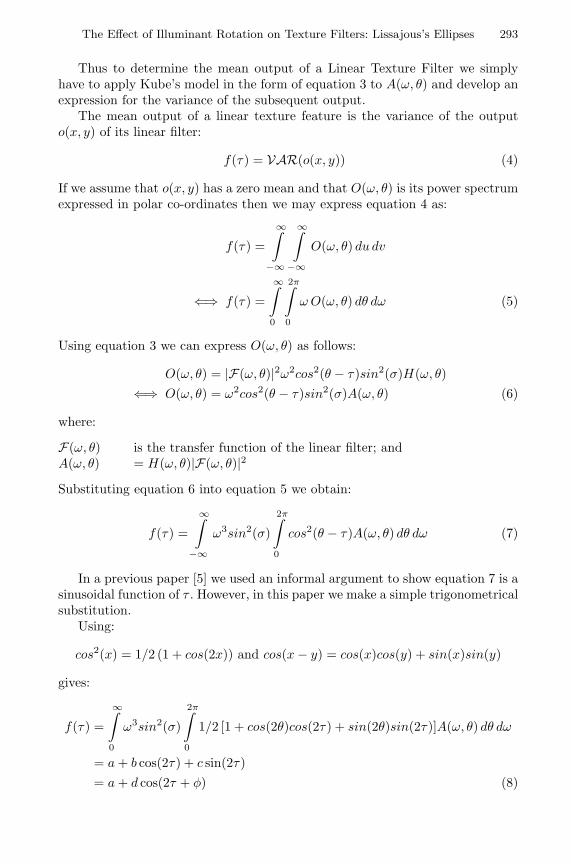
Thus to determine the mean output of a Linear Texture Filter we simplyhave to apply Kube’s model in the form of equation 3 to A(ω, θ) and develop anexpression for the variance of the subsequent output.
The mean output of a linear texture feature is the variance of the outputo(x, y) of its linear filter:
f(τ) = VAR(o(x, y)) (4)
If we assume that o(x, y) has a zero mean and that O(ω, θ) is its power spectrumexpressed in polar co-ordinates then we may express equation 4 as:
f(τ) =
∞∫−∞
∞∫−∞
O(ω, θ) du dv
⇐⇒ f(τ) =
∞∫
0
2π∫
0
ω O(ω, θ) dθ dω (5)
Using equation 3 we can express O(ω, θ) as follows:
O(ω, θ) = |F(ω, θ)|2ω2cos2(θ − τ)sin2(σ)H(ω, θ)⇐⇒ O(ω, θ) = ω2cos2(θ − τ)sin2(σ)A(ω, θ) (6)
where:
F(ω, θ) is the transfer function of the linear filter; andA(ω, θ) = H(ω, θ)|F(ω, θ)|2
Substituting equation 6 into equation 5 we obtain:
f(τ) =
∞∫−∞
ω3sin2(σ)
2π∫
0
cos2(θ − τ)A(ω, θ) dθ dω (7)
In a previous paper [5] we used an informal argument to show equation 7 is asinusoidal function of τ . However, in this paper we make a simple trigonometricalsubstitution.
Using:
cos2(x) = 1/2 (1 + cos(2x)) and cos(x − y) = cos(x)cos(y) + sin(x)sin(y)
gives:
f(τ) =
∞∫
0
ω3sin2(σ)
2π∫
0
1/2 [1 + cos(2θ)cos(2τ) + sin(2θ)sin(2τ)]A(ω, θ) dθ dω
= a + b cos(2τ) + c sin(2τ)= a + d cos(2τ + φ) (8)

294 M. Chantler et al.
where:
a = 1/2 sin2(σ)
∞∫
0
ω3
2π∫
0
A(ω, θ) dθ dω
b = 1/2 sin2(σ)
∞∫
0
ω3
2π∫
0
cos(2θ)A(ω, θ) dθ dω
c = 1/2 sin2(σ)
∞∫
0
ω3
2π∫
0
sin(2θ)A(ω, θ) dθ dω
d =√
b2 + c2, φ = arctan(c/b)
The above parameters (a, b etc.) are all functions of illuminant slant (σ) andA(ω, θ), which is itself a function of the surface height function and the lineartexture filter. None of them is a function of illuminant tilt (τ). Thus equation 8predicts that the output of a texture feature based on a linear filter is a sinusoidalfunction of illuminant tilt 3 with a period π radians.
2.3 Behaviour in a Multi-dimensional Feature Space
As texture classifiers normally exploit the output of several features it is im-portant to investigate the behaviour of texture features in multi-dimensionaldecision space.
If two different features are derived from the same surface texture, the resultscan be plotted in a two-dimensional x, y feature space. Using our sinusoidalprediction we obtain the general behaviour:
x = f1(τ) = a1 + b1 cos(2τ + φ1)
y = f2(τ) = a2 + b2 cos(2τ + φ2)
Since the frequency of the two cosines is the same these two equations form twosimple harmonic motion components. Therefore the trajectory in 2D featurespace is in general a Lissajous ellipse.
There are two special cases. If the surface is isotropic and the two filtersare identical except for a difference in direction of 90, the mean value and theoscillation amplitude of the two features are the same and the phase differencebecomes 180. Thus we predict that the scatter plot for isotropic textures andtwo identical but orthogonal filters is a straight line.3 In the case of A(ω, θ) being isotropic (for instance if both the surface and the filterare isotropic) the response will degenerate to a sinusoid of zero amplitude, i.e. it willbe a constant (straight-line) function of τ . However, if an isotropic filter is appliedto a directional surface then A(ω, θ) will not be isotropic and the tilt response willbe a sinusoidal function of tilt.
The Effect of Illuminant Rotation on Texture Filters: Lissajous’s Ellipses 295
If the surface is isotropic and the two filters are identical except a differencein direction of 45, the mean value and the oscillation amplitude of the twofeatures are again the same but the phase difference is now 90. In this case wepredict that the scatter plot is a circle.
The line and the circle are the two special cases of all possible curves. In thegeneral case of two or more filters the result is an ellipse or super-ellipse.
2.4 Summary of Theory
In this section we derived a formula of the behaviour of texture features as asinusoidal function of illuminant tilt. The parameters of this equation f(τ) =a+ d cos(2τ + φ) are dependent on the height map of the surface and the lineartexture filter. We also predicted that the resulting figure in a multi-dimensionalfeature space is a super-ellipse.
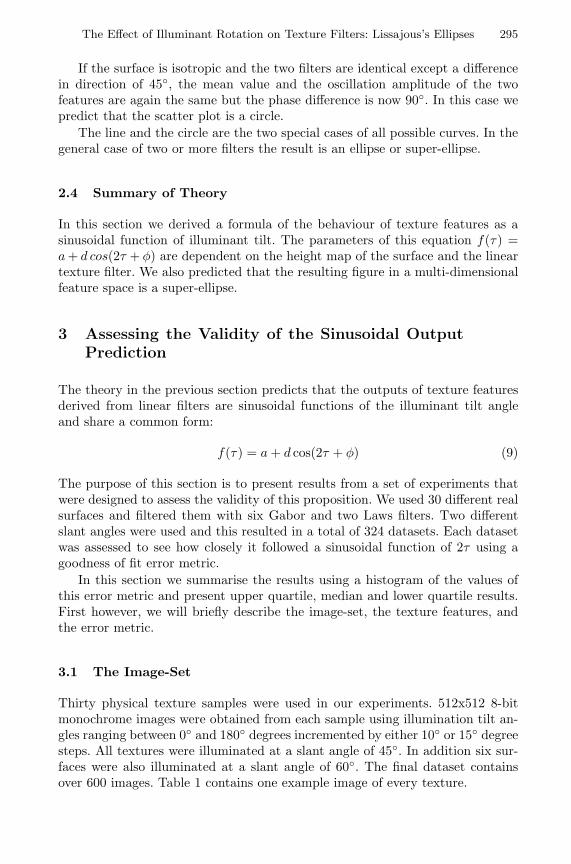
3 Assessing the Validity of the Sinusoidal OutputPrediction
The theory in the previous section predicts that the outputs of texture featuresderived from linear filters are sinusoidal functions of the illuminant tilt angleand share a common form:
f(τ) = a + d cos(2τ + φ) (9)
The purpose of this section is to present results from a set of experiments thatwere designed to assess the validity of this proposition. We used 30 different realsurfaces and filtered them with six Gabor and two Laws filters. Two differentslant angles were used and this resulted in a total of 324 datasets. Each datasetwas assessed to see how closely it followed a sinusoidal function of 2τ using agoodness of fit error metric.
In this section we summarise the results using a histogram of the values ofthis error metric and present upper quartile, median and lower quartile results.First however, we will briefly describe the image-set, the texture features, andthe error metric.
3.1 The Image-Set
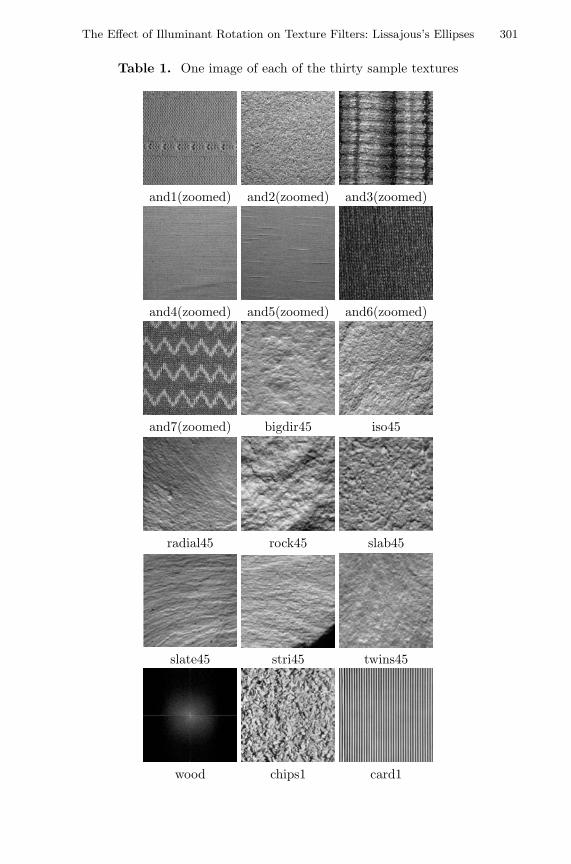
Thirty physical texture samples were used in our experiments. 512x512 8-bitmonochrome images were obtained from each sample using illumination tilt an-gles ranging between 0 and 180 degrees incremented by either 10 or 15 degreesteps. All textures were illuminated at a slant angle of 45. In addition six sur-faces were also illuminated at a slant angle of 60. The final dataset containsover 600 images. Table 1 contains one example image of every texture.

296 M. Chantler et al.
3.2 The Texture Features
Gabor filters [12] have been very popular in the literature so we have used sixtexture features of this type. In addition two Laws filters [13] were also used asthey are extremely simple to implement, are very effective, and were one of thefirst sets of filters to be used for texture classification.
Gabor Filters. We use the notation typeFΩAΘ to denote a Gabor filter witha centre frequency of Ω cycles per image-width, a direction of Θ degrees, andof type complex or real. Five complex Gabor filters (comF25A0, comF25A45,comF25A90, comF25A135, comF50A45) together with one real Gabor filter (re-alF25A45) were implemented. All of the Gabor filters were implemented in thefrequency domain.
Laws Filters. Laws [13] developed a set of two-dimensional FIR filters derivedfrom three simple one-dimensional spatial domain masks.
L3 = (1,2,1) =⇒ “level detection”E3 = (-1,0,1) =⇒ “edge detection”S3 = (-1,2,-1) =⇒ “spot detection”
Laws reported that the most useful filters were a set of 5x5 filters which heobtained by convolving, and transposing his 3x1 masks. We have used two here:L5E5 and E5L5.
L5E5 = L5T ∗ E5 = (L3 ∗ L3)T ∗ (L3 ∗ E3) =
−1 −2 0 2 1−4 −8 0 8 4−6 −12 0 12 6−4 −8 0 8 4−1 −2 0 2 1
The E5L5 mask is simply the transpose of L5E5. These filters were implementedin the spatial domain and post-processed with a 31x31 variance estimator.
3.3 The Error Metric
The output of each filter/texture combination was plotted against illuminanttilt angle τ . According to the preceding theory each of these graphs should bea sinusoidal function of 2τ (equation 9). As we do not have the surface heightfunctions we cannot directly calculate the parameters of these equations. Wetherefore compute the best fit sinusoid for each graph using Fourier analysis forthe angular frequency 2 radians/radian 4 . To determine how close a datasetis to our theoretical prediction we calculate an error metric: the mean squareddifference between the experimental data and their corresponding best-fit esti-mates.4 As the x-axis is the tilt angle which may be measured in either radians or degrees,the period may be expressed as either π radians or 180. Corespondingly the angularfrequency may be expressed as fracπ90 radiansdegree or as 2 radiansradian.
The Effect of Illuminant Rotation on Texture Filters: Lissajous’s Ellipses 297
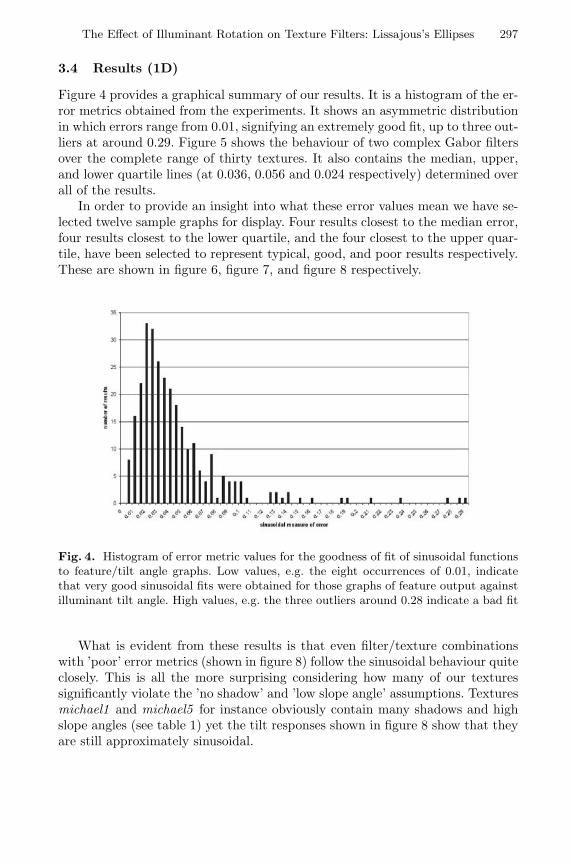
3.4 Results (1D)
Figure 4 provides a graphical summary of our results. It is a histogram of the er-ror metrics obtained from the experiments. It shows an asymmetric distributionin which errors range from 0.01, signifying an extremely good fit, up to three out-liers at around 0.29. Figure 5 shows the behaviour of two complex Gabor filtersover the complete range of thirty textures. It also contains the median, upper,and lower quartile lines (at 0.036, 0.056 and 0.024 respectively) determined overall of the results.
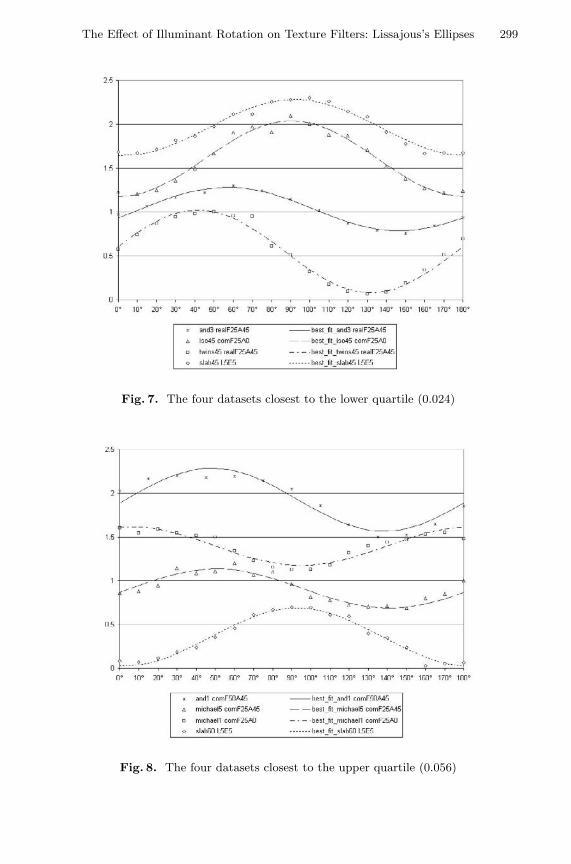
In order to provide an insight into what these error values mean we have se-lected twelve sample graphs for display. Four results closest to the median error,four results closest to the lower quartile, and the four closest to the upper quar-tile, have been selected to represent typical, good, and poor results respectively.These are shown in figure 6, figure 7, and figure 8 respectively.
Fig. 4. Histogram of error metric values for the goodness of fit of sinusoidal functionsto feature/tilt angle graphs. Low values, e.g. the eight occurrences of 0.01, indicatethat very good sinusoidal fits were obtained for those graphs of feature output againstilluminant tilt angle. High values, e.g. the three outliers around 0.28 indicate a bad fit
What is evident from these results is that even filter/texture combinationswith ’poor’ error metrics (shown in figure 8) follow the sinusoidal behaviour quiteclosely. This is all the more surprising considering how many of our texturessignificantly violate the ’no shadow’ and ’low slope angle’ assumptions. Texturesmichael1 and michael5 for instance obviously contain many shadows and highslope angles (see table 1) yet the tilt responses shown in figure 8 show that theyare still approximately sinusoidal.
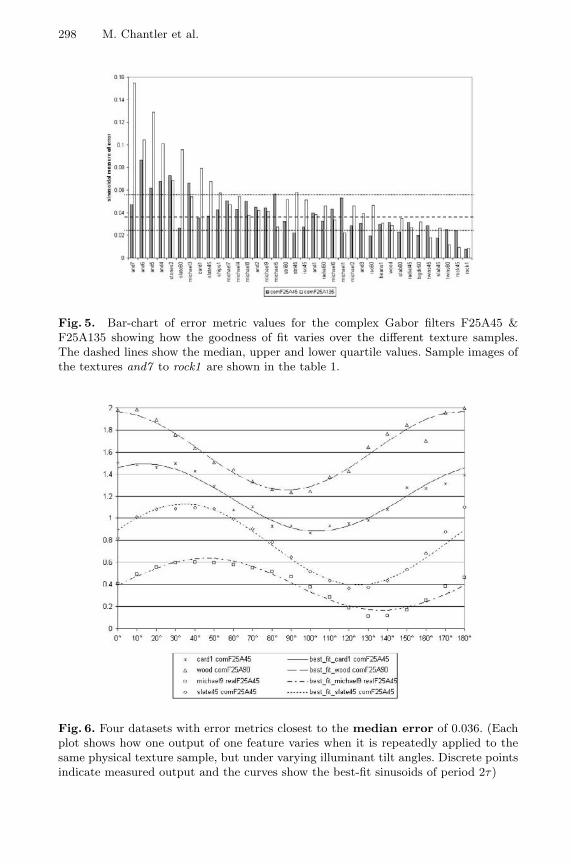
298 M. Chantler et al.
Fig. 5. Bar-chart of error metric values for the complex Gabor filters F25A45 &F25A135 showing how the goodness of fit varies over the different texture samples.The dashed lines show the median, upper and lower quartile values. Sample images ofthe textures and7 to rock1 are shown in the table 1.
Fig. 6. Four datasets with error metrics closest to the median error of 0.036. (Eachplot shows how one output of one feature varies when it is repeatedly applied to thesame physical texture sample, but under varying illuminant tilt angles. Discrete pointsindicate measured output and the curves show the best-fit sinusoids of period 2τ)
The Effect of Illuminant Rotation on Texture Filters: Lissajous’s Ellipses 299
Fig. 7. The four datasets closest to the lower quartile (0.024)
Fig. 8. The four datasets closest to the upper quartile (0.056)
300 M. Chantler et al.
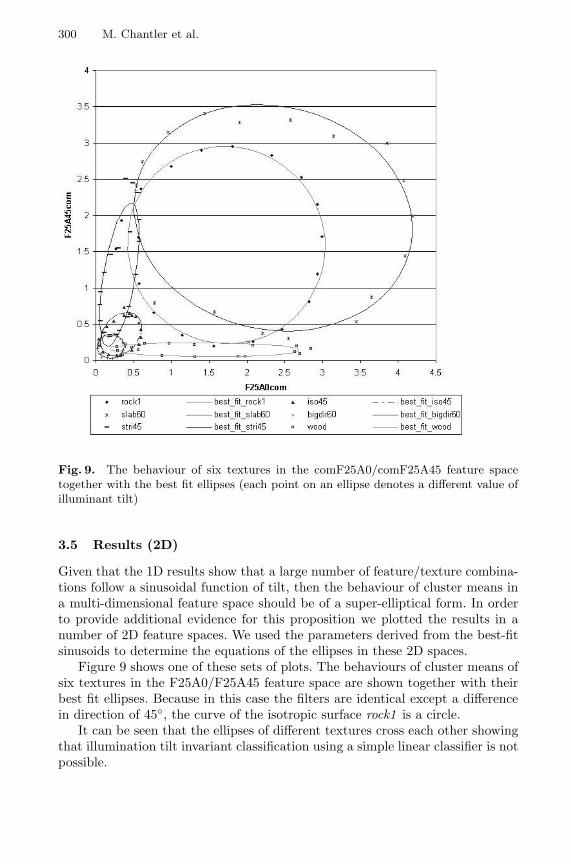
Fig. 9. The behaviour of six textures in the comF25A0/comF25A45 feature spacetogether with the best fit ellipses (each point on an ellipse denotes a different value ofilluminant tilt)
3.5 Results (2D)
Given that the 1D results show that a large number of feature/texture combina-tions follow a sinusoidal function of tilt, then the behaviour of cluster means ina multi-dimensional feature space should be of a super-elliptical form. In orderto provide additional evidence for this proposition we plotted the results in anumber of 2D feature spaces. We used the parameters derived from the best-fitsinusoids to determine the equations of the ellipses in these 2D spaces.
Figure 9 shows one of these sets of plots. The behaviours of cluster means ofsix textures in the F25A0/F25A45 feature space are shown together with theirbest fit ellipses. Because in this case the filters are identical except a differencein direction of 45, the curve of the isotropic surface rock1 is a circle.
It can be seen that the ellipses of different textures cross each other showingthat illumination tilt invariant classification using a simple linear classifier is notpossible.
The Effect of Illuminant Rotation on Texture Filters: Lissajous’s Ellipses 301
Table 1. One image of each of the thirty sample textures
and1(zoomed) and2(zoomed) and3(zoomed)
and4(zoomed) and5(zoomed) and6(zoomed)
and7(zoomed) bigdir45 iso45
radial45 rock45 slab45
slate45 stri45 twins45
wood chips1 card1
302 M. Chantler et al.
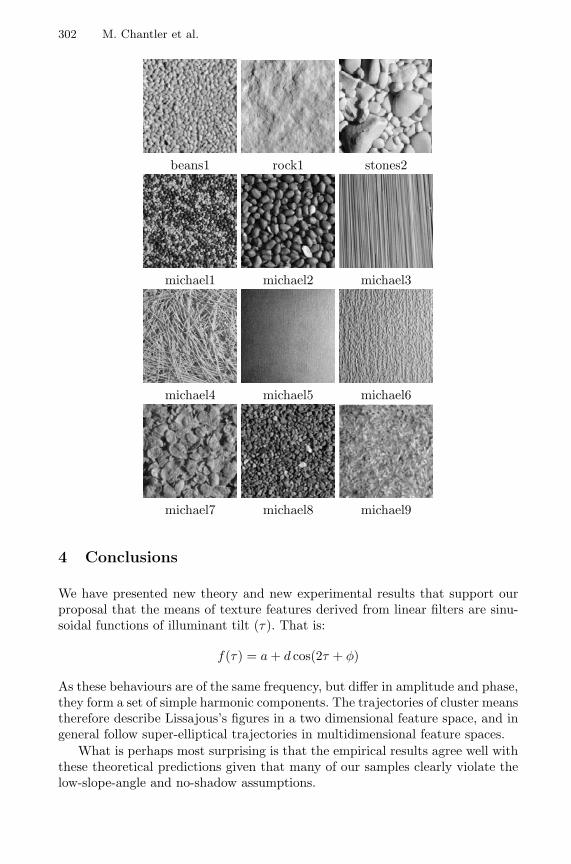
beans1 rock1 stones2
michael1 michael2 michael3
michael4 michael5 michael6
michael7 michael8 michael9
4 Conclusions
We have presented new theory and new experimental results that support ourproposal that the means of texture features derived from linear filters are sinu-soidal functions of illuminant tilt (τ). That is:
f(τ) = a + d cos(2τ + φ)
As these behaviours are of the same frequency, but differ in amplitude and phase,they form a set of simple harmonic components. The trajectories of cluster meanstherefore describe Lissajous’s figures in a two dimensional feature space, and ingeneral follow super-elliptical trajectories in multidimensional feature spaces.
What is perhaps most surprising is that the empirical results agree well withthese theoretical predictions given that many of our samples clearly violate thelow-slope-angle and no-shadow assumptions.
The Effect of Illuminant Rotation on Texture Filters: Lissajous’s Ellipses 303
These results explain why texture classifiers can fail when the tilt angle ischanged and suggest that, given suitable training data, this behaviour may beexploited for the design of tilt invariant texture classifiers.
References
1. M.J. Chantler. Why Illuminant Direction is Fundamental to Texture Analysis,IEE Proceedings on Vision, Image and Signal Processing, Vol. 142”, No.4, August,1995 pages 199-206
2. P. Brodatz. Textures: a photographic album for artists and designers. Dover, NewYork, 1966.
3. P.R. Kube and A.P. Pentland. On the imaging of fractal surfaces. IEEE Trans.on Pattern Analysis and Machine Intelligence, 10(5):704–707, September 1988.
4. T. Randen and J.H. Husoy. Filtering for texture classification: A comparativestudy. IEEE Trans. on Pattern Analysis and Machine Intelligence, 21(4):291–310,April 1999.
5. M.J. Chantler and G. McGunnigle. The Response of Texture Features to Illumi-nant Rotation Proceedings of IEEE Conference on Computer Vision and PatternRecognition Vol III: pages 955–958, 2000.
6. K.J. Dana, S.K. Nayar, B. van Ginneken, and J.J. Koenderink. Reflectance andtexture of real-world surfaces. In Proceedings of IEEE Conference on ComputerVision and Pattern Recognition, pages 151–157, 1997.
7. K.J. Dana and S.K. Nayar. Histogram model for 3d textures. In Proceedings ofIEEE Conference on Computer Vision and Pattern Recognition, pages 618–624,1998.
8. B. van Ginneken, J.J. Koenderink, and K.J. Dana. Texture histograms as a functionof irradiation and viewing direction. International Journal of Computer Vision,31(2/3):169–184, April 1999.
9. K.J. Dana and S.K. Nayar. Correlation model for 3d texture. In Proceedings ofICCV99: IEEE International Conference on Computer Vision, pages 1061–1067,1999.
10. T. Leung and J. Malik. Recognizing surfaces using three-dimensional textons.In Proceedings of ICCV99: IEEE International Conference on Computer Vision,pages 1010–1017, 1999.
11. T. Leung and J. Malik. Representing and recognizing the visual appearance of ma-terials using three-dimensional textons. International Journal of Computer Vision,43(1):29–44, June 2001.
12. A.K. Jain and F. Farrokhnia. Unsupervised texture segmentation using gaborfilters. Pattern Recognition, 24(12):1167–1186, December 1991.
13. K.I. Laws. Textured Image Segmentation. PhD thesis, Electrical Engineering,University of Southern California, 1980.