Understanding protein lids: structural analysis of active hinge mutants in triosephosphate isomerase
Upload
khangminh22Category
view
1download
0
Archi
ve o
f SID
Iranian Journal of Science & Technology, Transaction B, Engineering, Vol. 32, No. B5, pp 451-470 Printed in The Islamic Republic of Iran, 2008 © Shiraz University
THE EFFECT OF ELEMENT SIZE AND PLASTIC HINGE CHARACTERISTICS ON NONLINEAR
ANALYSIS OF RC FRAMES *
A. KHEYRODDIN** AND A. R. MORTEZAEI Dept. of Civil Engineering, Engineering Faculty, Semnan University, Semnan, I. R. of Iran
Email: [email protected]
Abstract– This paper presents the results of nonlinear finite element analysis of reinforced concrete (RC) frame structures, including the complete behavior of these systems from zero load to the ultimate load. Presented also are the details and results of a corroborative test program involving a large-scale frame model. The effects of the finite element size and tension-stiffening on the nonlinear responses of three RC frames are investigated. In addition, the program is used to carry out a "plastic" analysis of the frame to define the mechanism of failure, the plastic hinge rotations, and the yielding and the plastic hinge lengths. The capability and accuracy of the nonlinear finite element analysis program in predicting the nonlinear response of RC frame structures is verified, along with a comparison between the analytical and the corresponding experimental results. The different behavioral aspects including cracking, yielding and ultimate loads, load-displacement and load-strain characteristics for concrete and reinforcing steel and plastic hinge deformations are studied. The analytical and experimental results indicate that the computed response of RC frame structures is strongly influenced by the finite element size. The finer meshes give lower values of the ultimate load and vice versa for the coarser meshes. With an increase in the number of elements, the structure is slightly more flexible than for the case for the coarse mesh idealization, and the frame tends to be less ductile. An empirical equation has been proposed to eliminate this drawback. The calculated plastic hinge rotations show good agreement with the experimental results. For example, the maximum deviation between the analytical and the experimental values of the plastic hinge rotations is approximately 13%, while the minimum deviation is 4%.
Keywords– Element size effect, nonlinear finite element, reinforced concrete frames, tension-stiffening, plastic hinge rotation
1. INTRODUCTION
Earlier experimental investigations to study the nonlinear behavior of reinforced concrete (RC) frames structures can now be advantageously supplemented, or partially replaced by detailed nonlinear finite element analyses of their behavior. It is now becoming possible, at a comparatively low cost and effort, to obtain a complete survey of the deformations of the concrete and the reinforcing steel along the frame structure, and to study the effect of different variables at all stages of loading until the ultimate load.
Cranston [1] tested a series of single bay, single story RC frames. This was followed by Gunnin et al. [2], Darvall [3], El-Metwally and Chen [4], Ahmad [5], Lee and Haldar [6,7], Coronelli et al. [8] and others. Extensive reviews of the analytical and experimental investigations on nonlinear behavior of RC frames have been reported by Palermo and Vecchio [9].
Kim and Lee [10] used the displacement control method and the combined layered and modified stiffness approach to investigate the nonlinear behavior of RC frames up to failure. The spurious sensitivity to the chosen element size in the analysis results due to the strain-softening of the concrete were overcome by ∗Received by the editors April 30, 2007; Accepted March 16, 2008. ∗∗Corresponding author
www.SID.ir

Archi
ve o
f SID
A. Kheyroddin and A. R. Mortezaei
Iranian Journal of Science & Technology, Volume 32, Number B5 October 2008
452
modifying the rigidities and the curvatures for each element based on the concept of concentrated inelastic rotations at a plastic hinge. Mo [11] investigated the material and geometric nonlinearities of RC frame structures using a trilinear moment-curvature relationship for the entire loading history. It was noted that the ultimate curvatures at the critical sections were reduced by the presence of axial loads. When a plastic hinge formed in a column, the buckling strength of the column was reduced. The analytical results based upon these assumptions were in good agreement with the experimental results. Rasheed and Dinno [12] developed a numerical method for the analysis of RC plane frames. Vecchio [13] developed constitutive models for reinforced concrete subjected to reverse cyclic based on the smeared rotating crack assumption. The algorithm adopted was based on a total-load secant stiffness approach incorporating the compatibility, equilibrium, and constitutive relationships of the Modified Compression Field Theory (MCFT). Economic and exact formulations for section analysis and the frame element modeling, together with a suitable solution strategy and techniques, were adopted to construct an accurate and efficient analysis algorithm.
2. RESEARCH SIGNIFICANCE A survey of the literature shows that more analytical work is needed to investigate the yielding and equivalent plastic hinge lengths and rotations in RC portal frames. The yielding length is defined as the member length over which the steel tensile strain exceeds the yield strain. The present study is an extension of the previous studies carried out to examine the effect of finite element size (mesh dependency phenomenon) and tension-stiffening on the nonlinear response of the RC frames. This paper examines the complete nonlinear response of three RC single-bay portal frames, FP1, FP2, and FP3, tested under monotonically increasing vertical and lateral loads using the nonlinear layered finite element approach. In addition, the program is used to carry out a "plastic" analysis of the frame to define the mechanism of failure, the plastic hinge rotations, and the yielding and the plastic hinge lengths.
3. NONLINEAR FINITE ELEMENT PROGRAM The frames are analyzed using the nonlinear finite element analysis program, NONLACS2 (NONLinear Analysis of Concrete and Steel Structures), modified by Kheyroddin [14], from the earlier version of the NONLACS program developed by Nofal [15]. The NONLACS2 program utilizes the basic structure of the NONLACS program with the same finite element formulation, but differs from the previous programs in terms of its versatility to analyze both normal and high-strength concrete systems, to eliminate the element size effect (mesh size dependency) using both fracture mechanics and strength-based approaches, to utilize different models for concrete in compression and tension, and to determine the ultimate concrete tensile and compressive strain, εtu and εcu, respectively.
The program can be used to predict the nonlinear behavior of any plain, reinforced or prestressed concrete steel structure that is composed of thin plate members with plane stress conditions. This includes beams, slabs, shells, girders, shear walls, or any combination of these structural elements. Time-dependent effects such as creep and shrinkage can also be considered. a) Concrete properties
As shown in Fig. 1a, the ascending branch of the concrete uniaxial stress-strain curve up to the peak compressive strength is represented by the Saenz equation [16]:
εε
εε
εσ
max
2
maxsc
0
0
+ 2 - E
E + 1
E = (1)
www.SID.ir

Archi
ve o
f SID
The effect of element size and plastic hinge…
October 2008 Iranian Journal of Science & Technology, Volume 32, Number B5
453
where E0 is the initial modulus of elasticity of the concrete, Esc is the secant modulus of the concrete at the peak stress, σ is the stress, ε is the strain, and εmax is the strain at peak stress. For high-strength concrete, the compressive stress-strain response is modeled using a modified form of the Popovics' equation [14].
Fig. 1. Uniaxial stress-strain curves [14]
For analysis of most plane stress problems, concrete is assumed to behave as a stress-induced orthotropic material. In this study the orthotropic constitutive relationship developed by Darwin and Pecknold [17] is used for modelling the concrete using the smeared cracking idealization. The constitutive matrix, D, is given by:
)EE2-E+E(4
100
0EEE
0EEE
)-(1
1 = D
2121
221
211
2
ν
ν
ν
ν (2)
www.SID.ir
Archi
ve o
f SID
A. Kheyroddin and A. R. Mortezaei
Iranian Journal of Science & Technology, Volume 32, Number B5 October 2008
454
in which, E1 and E2 are the tangent moduli in the directions of the material orthotropy, and v is the Poisson's ratio. The orthotropic material directions coincide with the principal stress directions for the uncracked concrete and these directions are parallel and normal to the cracks for the cracked concrete. The concept of the "equivalent uniaxial strain" developed by Darwin and Pecknold [17] is utilized to relate the increments of stress and strain in the principal directions. Therefore, stress-strain curves similar to the uniaxial stress-strain curves can be used to formulate the required stress-strain curves in each principal direction.
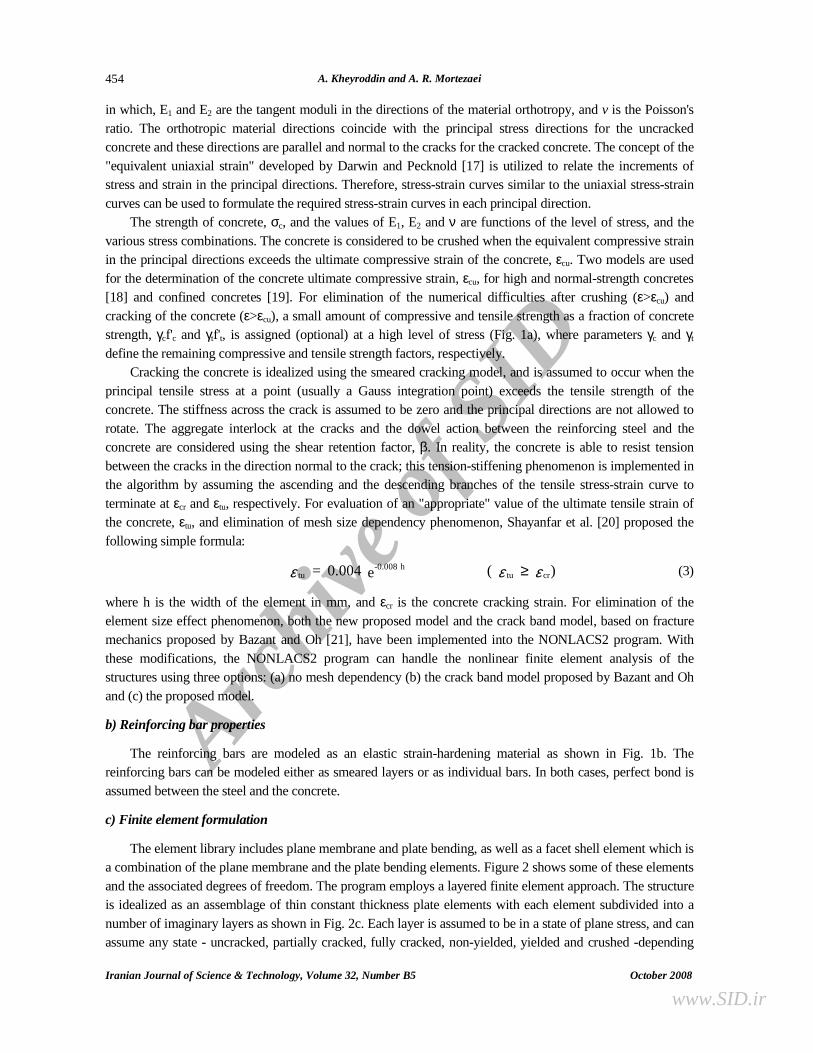
The strength of concrete, σc, and the values of E1, E2 and ν are functions of the level of stress, and the various stress combinations. The concrete is considered to be crushed when the equivalent compressive strain in the principal directions exceeds the ultimate compressive strain of the concrete, εcu. Two models are used for the determination of the concrete ultimate compressive strain, εcu, for high and normal-strength concretes [18] and confined concretes [19]. For elimination of the numerical difficulties after crushing (ε>εcu) and cracking of the concrete (ε>εcu), a small amount of compressive and tensile strength as a fraction of concrete strength, γcf'c and γtf't, is assigned (optional) at a high level of stress (Fig. 1a), where parameters γc and γt define the remaining compressive and tensile strength factors, respectively.
Cracking the concrete is idealized using the smeared cracking model, and is assumed to occur when the principal tensile stress at a point (usually a Gauss integration point) exceeds the tensile strength of the concrete. The stiffness across the crack is assumed to be zero and the principal directions are not allowed to rotate. The aggregate interlock at the cracks and the dowel action between the reinforcing steel and the concrete are considered using the shear retention factor, β. In reality, the concrete is able to resist tension between the cracks in the direction normal to the crack; this tension-stiffening phenomenon is implemented in the algorithm by assuming the ascending and the descending branches of the tensile stress-strain curve to terminate at εcr and εtu, respectively. For evaluation of an "appropriate" value of the ultimate tensile strain of the concrete, εtu, and elimination of mesh size dependency phenomenon, Shayanfar et al. [20] proposed the following simple formula:
) ( e 0.004 = crtuh -0.008
tu εεε ≥ (3) where h is the width of the element in mm, and εcr is the concrete cracking strain. For elimination of the element size effect phenomenon, both the new proposed model and the crack band model, based on fracture mechanics proposed by Bazant and Oh [21], have been implemented into the NONLACS2 program. With these modifications, the NONLACS2 program can handle the nonlinear finite element analysis of the structures using three options: (a) no mesh dependency (b) the crack band model proposed by Bazant and Oh and (c) the proposed model. b) Reinforcing bar properties
The reinforcing bars are modeled as an elastic strain-hardening material as shown in Fig. 1b. The reinforcing bars can be modeled either as smeared layers or as individual bars. In both cases, perfect bond is assumed between the steel and the concrete. c) Finite element formulation
The element library includes plane membrane and plate bending, as well as a facet shell element which is a combination of the plane membrane and the plate bending elements. Figure 2 shows some of these elements and the associated degrees of freedom. The program employs a layered finite element approach. The structure is idealized as an assemblage of thin constant thickness plate elements with each element subdivided into a number of imaginary layers as shown in Fig. 2c. Each layer is assumed to be in a state of plane stress, and can assume any state - uncracked, partially cracked, fully cracked, non-yielded, yielded and crushed -depending
www.SID.ir

Archi
ve o
f SID
The effect of element size and plastic hinge…
October 2008 Iranian Journal of Science & Technology, Volume 32, Number B5
455
on the stress or strain conditions. Analysis is performed using an incremental-iterative tangent stiffness approach, and the element stiffness is obtained by adding the stiffness contributions of all layers at each Gauss quadrature point.
Fig. 2. Some typical finite elements in NONLACS2 program [14]
4. EXPERIMENTAL INVESTIGATION
An experimental investigation was undertaken to corroborate the analytical work and lend further insight
into the nature of finite element size and tension-stiffening in frame structures. The test models chosen for
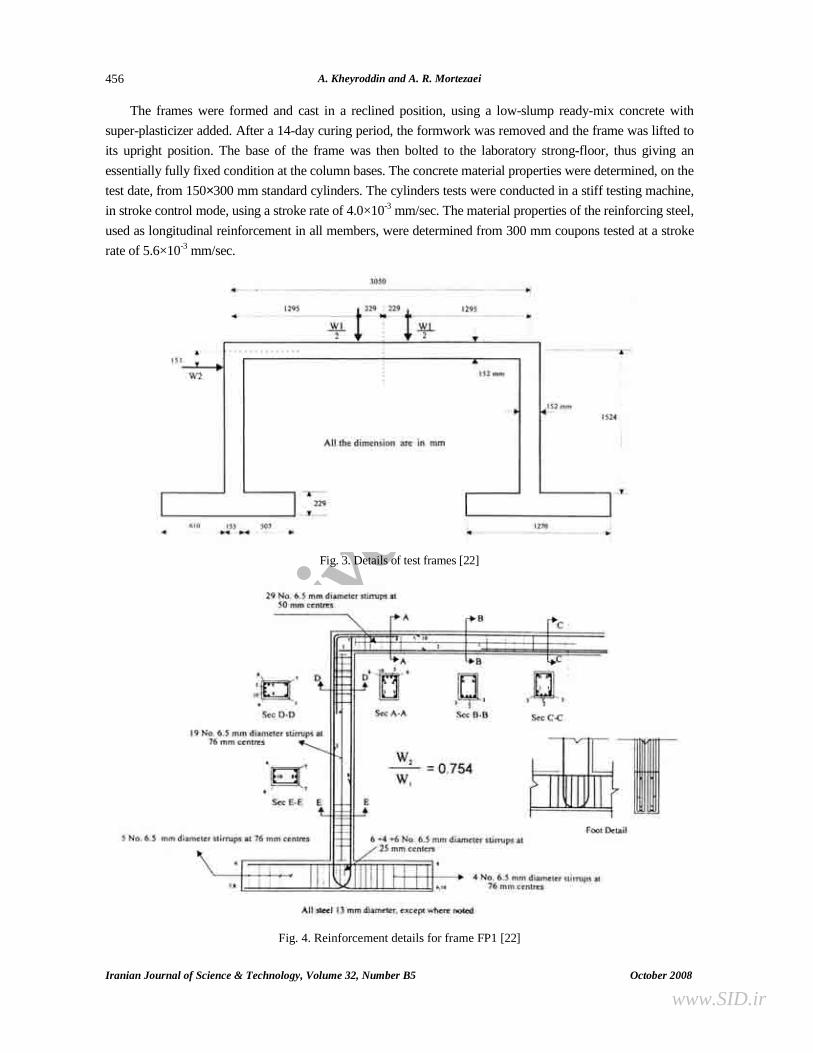
study were the large-scale, one-span, one-story plane frames [22]. The dimensions of the frames and details of
the loading are shown in Fig. 3. Each frame has two fixed supports; the beam span is 3050 mm (120 in), and
the column height is 1524 mm (60 in), while the cross-section of the frame is constant throughout at 153 mm
(6 in) deep by 102 mm (4 in) wide. The frame footing has a cross-section 102 mm (4 in) wide, 229 mm (9 in)
deep, and 1270 mm (50 in) long. Provision was made for the application of both vertical (W1) and lateral (W2)
loads, with a constant ratio W2/W1, and the vertical load W1 being applied as two equal concentrated loads
placed symmetrically about the centerline of the frame. The frames were built integral with a large, heavily
reinforced concrete base.
The details of reinforcement layout for the frames FP1, FP2, and FP3 are shown in Figs. 4, 5 and 6,
respectively. The major variables are the percentage and layout of the longitudinal reinforcement. The beam
and the corner sections of frame FP3 were reinforced with 2.8% tension reinforcement and 1.9% compression
reinforcement, while for frame FP2, the beam and the corner sections were reinforced with 3.7% tension
reinforcement and 1.9% compression reinforcement. The mid-span of the beam and the corner sections of
frame FP1 were markedly over-reinforced, with 6.0% tension reinforcement and 2.0% compression
reinforcement. Note that the longitudinal reinforcement was anchored at all ends of the members by welding
the bars to stiff bearing plates.
www.SID.ir
Archi
ve o
f SID
A. Kheyroddin and A. R. Mortezaei
Iranian Journal of Science & Technology, Volume 32, Number B5 October 2008
456
The frames were formed and cast in a reclined position, using a low-slump ready-mix concrete with
super-plasticizer added. After a 14-day curing period, the formwork was removed and the frame was lifted to
its upright position. The base of the frame was then bolted to the laboratory strong-floor, thus giving an
essentially fully fixed condition at the column bases. The concrete material properties were determined, on the
test date, from 150×300 mm standard cylinders. The cylinders tests were conducted in a stiff testing machine,
in stroke control mode, using a stroke rate of 4.0×10⁻³ mm/sec. The material properties of the reinforcing steel,
used as longitudinal reinforcement in all members, were determined from 300 mm coupons tested at a stroke
rate of 5.6×10⁻³ mm/sec.
Fig. 3. Details of test frames [22]
Fig. 4. Reinforcement details for frame FP1 [22]
www.SID.ir

Archi
ve o
f SID
The effect of element size and plastic hinge…
October 2008 Iranian Journal of Science & Technology, Volume 32, Number B5
457
Fig. 5. Reinforcement details for frame FP2 [22]
Fig. 6. Reinforcement details for frame FP3 [22]
The concrete and the steel material properties are summarized in Table 1. The overall load-deformation response of the test frames are plotted in the next sections.
www.SID.ir

Archi
ve o
f SID
A. Kheyroddin and A. R. Mortezaei
Iranian Journal of Science & Technology, Volume 32, Number B5 October 2008
458
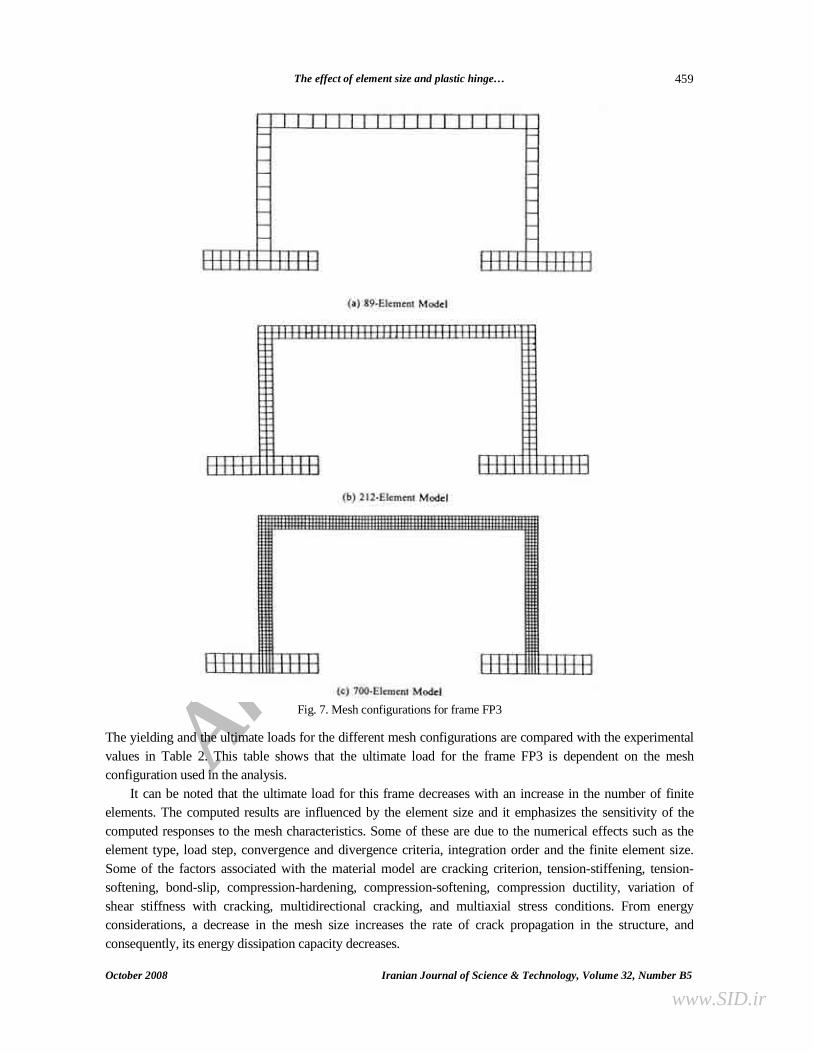
5. EFFECT OF FINITE ELEMENT SIZE Three frames, FP1, FP2, and FP3 are analyzed using the NONLACS2 program in the present research
program. To investigate the influence of mesh size on the results of the finite element analysis of the frame
structure, three types of mesh configurations with 89, 212 and 700 elements are used to analyze the frame
FP3, as shown in Fig 7. The frames with these meshes are analyzed using the NONLACS2 program with no
provision to account for the mesh size dependency (MDEP=1 or "no mesh dependency analysis"). In this case
the value of εtu is given as an input value by the user. The ultimate tensile strain, εtu, is assumed to be constant
and equal to 0.0021 for all mesh sizes. The computed results are influenced by the element size. Due to the
unsymmetric loading on the frame, the entire frame is modeled for the finite element analysis. Since both the
size of the element and the load increments have a significant effect on the computed results, the same load
steps are used for the different mesh configurations. The analytical results are used only for the preliminary
analysis. The total load is applied to the structure in 30 load steps. The experimental results for the load-
displacement curves and the ultimate loads are compared with the corresponding computed values. In each
case, it is shown that the computed response and the ultimate load for these structures depend on the size and
the number of elements.
Table 1. Material properties used in the test frames [22]
Frame fc (MPa) Ec (MPa) f t (MPa) εcr εcu* ν*
FP3 25.5 22,160 3.10 0.00014 0.007 0.17
FP2 28.5 25,275 3.30 0.00013 0.007 0.17
FP1 18.9 18,980 2.70 0.00014 0.007 0.17
Frame fy (MPa) Es (MPa) E*s (MPa) εsu
* εsy fy (stirrups) (MPa)
FP3 440 200,000 6,200 0.15 0.0022 310
FP2 440 200,000 6,200 0.15 0.0022 310
FP1 440 200,000 6,200 0.15 0.0022 310
* Assumed values The bending of the various sections of these frames can be considered to be a plane stress problem; therefore,
the concrete is modeled using one layer only. The longitudinal reinforcing bars are lumped in a single bar at
the reference surface as a bar element. The stirrups are modeled as smeared steel layers and they are placed at
their respective distances from the element reference surface.
The load-sideway deflection curve for the frame FP3 is shown in Fig. 8, which presents the results for the
models with three types of meshes. The coarser mesh of 89-element (152 mm × 152 mm) gives an ultimate
load value of 49 kN, which is very close to the experimental ultimate load of 48 kN, while the medium size
mesh of 212-element (76 mm × 76 mm) results in an ultimate load of 39.4 kN, and the finer mesh of 700-
element (38 mm × 38 mm) underestimates the ultimate load (35.6 kN) by about 74 percent. When a coarse
mesh is used, the structure exhibits a stiffer behavior compared with the experimental response. As can be
seen in Fig. 8, with an increase in the number of elements, the structure is slightly more flexible than for the
case with coarse mesh idealization, and the frame tends to be less ductile. In fact, the deflection at the ultimate
load decreases with a decrease in the element size. The pre-cracking behavior and the cracking load are the
same and equal to 6.67 kN for the different mesh configurations.
www.SID.ir
Archi
ve o
f SID
The effect of element size and plastic hinge…
October 2008 Iranian Journal of Science & Technology, Volume 32, Number B5
459
Fig. 7. Mesh configurations for frame FP3
The yielding and the ultimate loads for the different mesh configurations are compared with the experimental values in Table 2. This table shows that the ultimate load for the frame FP3 is dependent on the mesh configuration used in the analysis.
It can be noted that the ultimate load for this frame decreases with an increase in the number of finite elements. The computed results are influenced by the element size and it emphasizes the sensitivity of the computed responses to the mesh characteristics. Some of these are due to the numerical effects such as the element type, load step, convergence and divergence criteria, integration order and the finite element size. Some of the factors associated with the material model are cracking criterion, tension-stiffening, tension-softening, bond-slip, compression-hardening, compression-softening, compression ductility, variation of shear stiffness with cracking, multidirectional cracking, and multiaxial stress conditions. From energy considerations, a decrease in the mesh size increases the rate of crack propagation in the structure, and consequently, its energy dissipation capacity decreases.
www.SID.ir

Archi
ve o
f SID
A. Kheyroddin and A. R. Mortezaei
Iranian Journal of Science & Technology, Volume 32, Number B5 October 2008
460
Fig. 8. Load- deflection curves for different mesh sizes for frame FP3
Table 2. The yielding and ultimate loads of frame FP3 for different meshes
Number of elements
Size of element (mm × mm)
Cracking load (kN)
Yielding load (kN)
Ultimate load (kN)
Pu (Anl.) / Pu (Exp.)
89 152 × 152 6.67 47.3 49 1.02
212 76 × 76 6.67 39.25 39.4 0.82
700 38 × 38 6.67 31.5 35.6 0.74
Experimental result
--- --- 44.2 48 ---
Since the mesh configuration with 700 elements grossly under-estimates the response of the frame and
needs large storage requirements and computational time, it was decided to discontinue its further use in this study.
6. RESPONSE OF REINFORCED CONCRETE FRAME FP3 To achieve closer agreement between the computed results and the experimental values, smaller load
increments are used in the analysis for the medium-size mesh configuration with 212 elements. The results
include the load-deflection, load-concrete compressive strain, load-tensile steel strain curves and the crack
patterns. The ultimate deformation characteristics such as plastic hinge length and rotations for this model are
also discussed. For the elimination of mesh dependency drawback and the determination of the concrete
ultimate tensile strain, εtu, the proposed Eq. (1) is utilized.
www.SID.ir
Archi
ve o
f SID
The effect of element size and plastic hinge…
October 2008 Iranian Journal of Science & Technology, Volume 32, Number B5
461
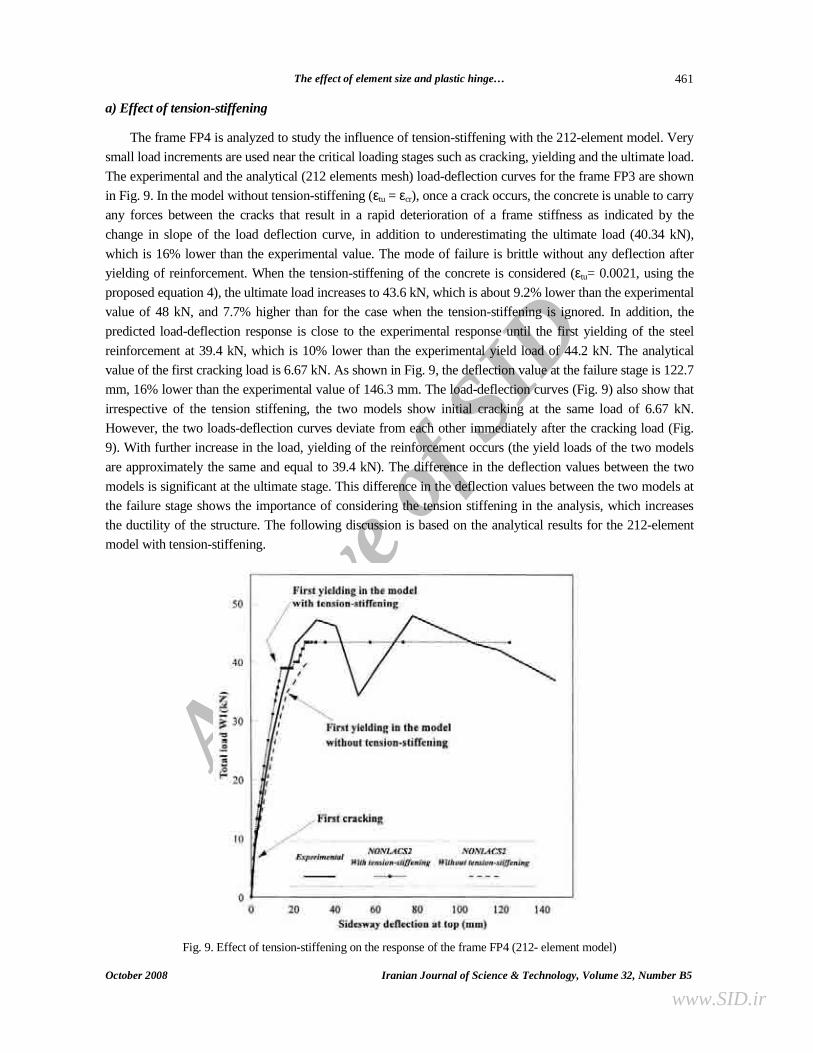
a) Effect of tension-stiffening
The frame FP4 is analyzed to study the influence of tension-stiffening with the 212-element model. Very
small load increments are used near the critical loading stages such as cracking, yielding and the ultimate load.
The experimental and the analytical (212 elements mesh) load-deflection curves for the frame FP3 are shown
in Fig. 9. In the model without tension-stiffening (εtu = εcr), once a crack occurs, the concrete is unable to carry
any forces between the cracks that result in a rapid deterioration of a frame stiffness as indicated by the
change in slope of the load deflection curve, in addition to underestimating the ultimate load (40.34 kN),
which is 16% lower than the experimental value. The mode of failure is brittle without any deflection after
yielding of reinforcement. When the tension-stiffening of the concrete is considered (εtu= 0.0021, using the
proposed equation 4), the ultimate load increases to 43.6 kN, which is about 9.2% lower than the experimental
value of 48 kN, and 7.7% higher than for the case when the tension-stiffening is ignored. In addition, the
predicted load-deflection response is close to the experimental response until the first yielding of the steel
reinforcement at 39.4 kN, which is 10% lower than the experimental yield load of 44.2 kN. The analytical
value of the first cracking load is 6.67 kN. As shown in Fig. 9, the deflection value at the failure stage is 122.7
mm, 16% lower than the experimental value of 146.3 mm. The load-deflection curves (Fig. 9) also show that
irrespective of the tension stiffening, the two models show initial cracking at the same load of 6.67 kN.
However, the two loads-deflection curves deviate from each other immediately after the cracking load (Fig.
9). With further increase in the load, yielding of the reinforcement occurs (the yield loads of the two models
are approximately the same and equal to 39.4 kN). The difference in the deflection values between the two
models is significant at the ultimate stage. This difference in the deflection values between the two models at
the failure stage shows the importance of considering the tension stiffening in the analysis, which increases
the ductility of the structure. The following discussion is based on the analytical results for the 212-element
model with tension-stiffening.
Fig. 9. Effect of tension-stiffening on the response of the frame FP4 (212- element model)
www.SID.ir

Archi
ve o
f SID
A. Kheyroddin and A. R. Mortezaei
Iranian Journal of Science & Technology, Volume 32, Number B5 October 2008
462
b) Load -strain curves for concrete and steel
Figure 10 illustrates the load-strain curve for the compression zone at the top of the mid-span of the beam in the frame. The initial crack forms in the concrete frame at the bottom of the mid-span section of the beam at a load level of 6.67 kN. At this stage, the neutral axis shifts from the mid-height of the section toward the compressive zone near the top. As the neutral axis approaches the compressive zone, the steel strain increases at a faster rate than the concrete strain. The concrete strain continues to increase at a constant rate until the initial yielding of the reinforcing steel, when the first hinge forms at the top right hand of the column. An increase in the concrete strain under constant load accompanies the formation of the second hinge at the right foot of the frame. This is indicated at the end of the plateau as shown in the Fig. 10. Because of the tension- stiffening, the concrete is capable of resisting more loads. However, increasing the load results in further yielding of the steel reinforcement around the mid-span of the beam. This leads to the formation of the third hinge under the left concentrated load on the beam. The last hinge is formed at the left foot of the frame at a load of 43.6 kN, with a corresponding concrete strain value of 0.007. At this stage, the concrete at the critical sections becomes fully crushed with a considerable loss in stiffness and complete yielding of the reinforcing steel, leading to the collapse of the frame.
Fig. 10. Load-steel and concrete strain curves at the mid-span of the beam in the frame FP3
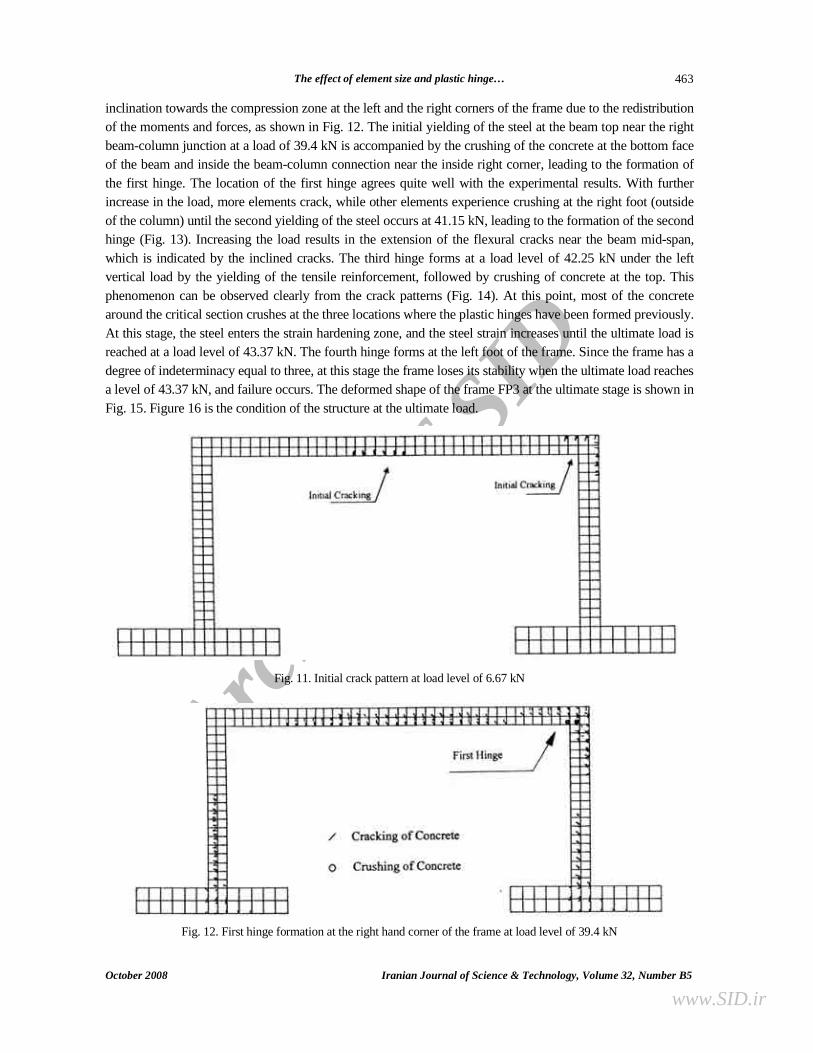
c) Cracking pattern and formation sequence of plastic hinges
In this section, the ability of the one mesh configuration (212-elements) to reproduce the crack propagation in Frame FP3 is presented. The cracking patterns for the other meshes have a similar trend. The propagation of the cracks along with the crushing of concrete and the sequence of plastic hinge formations are presented in Figs. 11-14. In the following figures, the cracking of concrete is indicated by solid lines and the crushing of concrete is represented by small circles. The experimental crack patterns are available for comparison with the computed crack patterns [23].
Generally, the configuration of the cracks consists of flexural cracks (normal to the member axis) and flexural shear cracks (inclined cracks), at a load level of 6.67 kN as shown in Fig. 11. The first crack appears with a slight inclination, forming around the bottom mid-span of the beam and the outer tension fibres of the right corner of the frame (beam and column). Further loading causes the cracking to spread at an increased
www.SID.ir
Archi
ve o
f SID
The effect of element size and plastic hinge…
October 2008 Iranian Journal of Science & Technology, Volume 32, Number B5
463
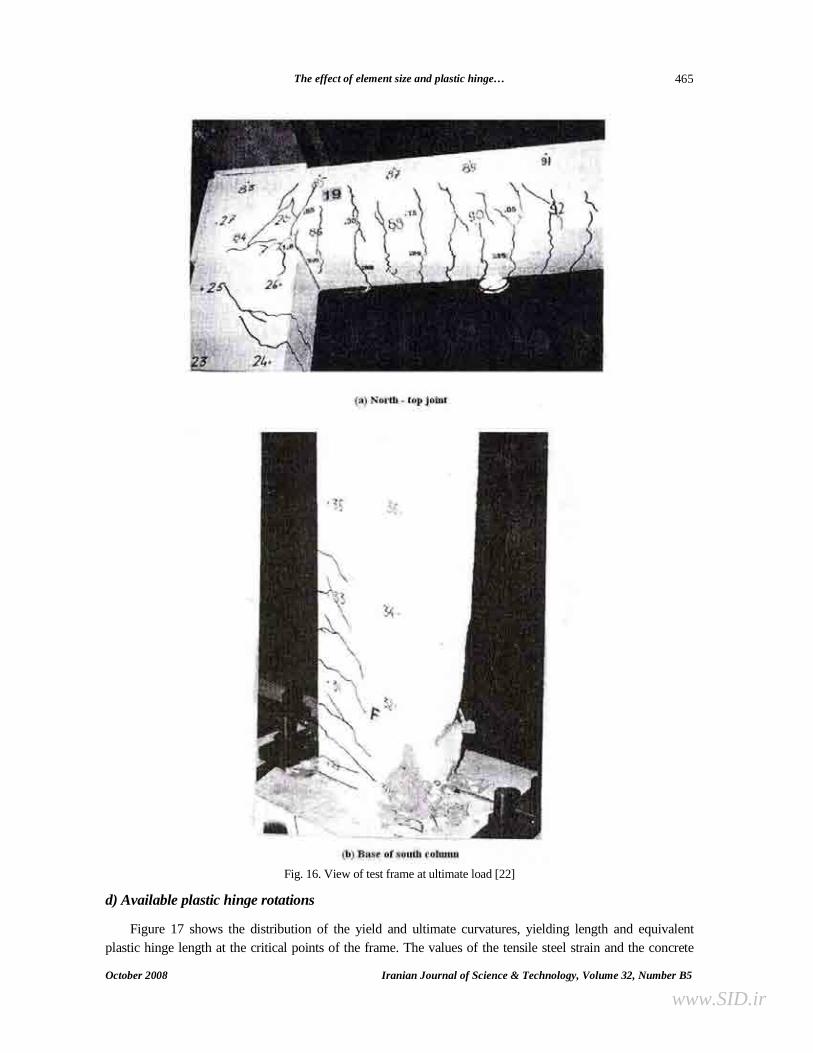
inclination towards the compression zone at the left and the right corners of the frame due to the redistribution of the moments and forces, as shown in Fig. 12. The initial yielding of the steel at the beam top near the right beam-column junction at a load of 39.4 kN is accompanied by the crushing of the concrete at the bottom face of the beam and inside the beam-column connection near the inside right corner, leading to the formation of the first hinge. The location of the first hinge agrees quite well with the experimental results. With further increase in the load, more elements crack, while other elements experience crushing at the right foot (outside of the column) until the second yielding of the steel occurs at 41.15 kN, leading to the formation of the second hinge (Fig. 13). Increasing the load results in the extension of the flexural cracks near the beam mid-span, which is indicated by the inclined cracks. The third hinge forms at a load level of 42.25 kN under the left vertical load by the yielding of the tensile reinforcement, followed by crushing of concrete at the top. This phenomenon can be observed clearly from the crack patterns (Fig. 14). At this point, most of the concrete around the critical section crushes at the three locations where the plastic hinges have been formed previously. At this stage, the steel enters the strain hardening zone, and the steel strain increases until the ultimate load is reached at a load level of 43.37 kN. The fourth hinge forms at the left foot of the frame. Since the frame has a degree of indeterminacy equal to three, at this stage the frame loses its stability when the ultimate load reaches a level of 43.37 kN, and failure occurs. The deformed shape of the frame FP3 at the ultimate stage is shown in Fig. 15. Figure 16 is the condition of the structure at the ultimate load.
Fig. 11. Initial crack pattern at load level of 6.67 kN
Fig. 12. First hinge formation at the right hand corner of the frame at load level of 39.4 kN
www.SID.ir

Archi
ve o
f SID
A. Kheyroddin and A. R. Mortezaei
Iranian Journal of Science & Technology, Volume 32, Number B5 October 2008
464
Fig. 13. Development of the second hinge at the right foot at load level of 41.15 kN
Fig. 14. Development of the third hinge before the collapse at load level of 42.25 kN
Fig. 15. Deformed shape of frame FP4 at failure ( Pu = 43.37 kN )
www.SID.ir
Archi
ve o
f SID
The effect of element size and plastic hinge…
October 2008 Iranian Journal of Science & Technology, Volume 32, Number B5
465
Fig. 16. View of test frame at ultimate load [22]
d) Available plastic hinge rotations
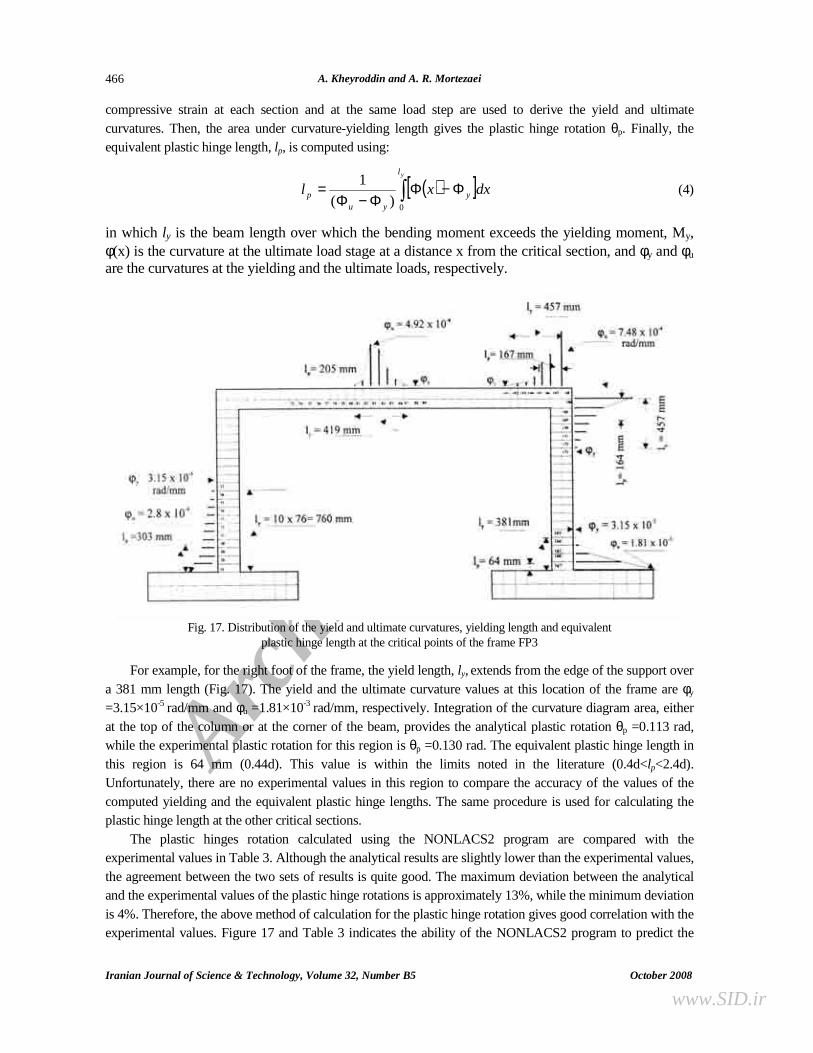
Figure 17 shows the distribution of the yield and ultimate curvatures, yielding length and equivalent plastic hinge length at the critical points of the frame. The values of the tensile steel strain and the concrete
www.SID.ir
Archi
ve o
f SID
A. Kheyroddin and A. R. Mortezaei
Iranian Journal of Science & Technology, Volume 32, Number B5 October 2008
466
compressive strain at each section and at the same load step are used to derive the yield and ultimate curvatures. Then, the area under curvature-yielding length gives the plastic hinge rotation θp. Finally, the equivalent plastic hinge length, lp, is computed using:
( )[ ]∫ Φ−ΦΦ−Φ
=yl
yyu
p dxxl0)(
1 (4)
in which ly is the beam length over which the bending moment exceeds the yielding moment, My, φ(x) is the curvature at the ultimate load stage at a distance x from the critical section, and φy and φu are the curvatures at the yielding and the ultimate loads, respectively.
Fig. 17. Distribution of the yield and ultimate curvatures, yielding length and equivalent
plastic hinge length at the critical points of the frame FP3
For example, for the right foot of the frame, the yield length, ly, extends from the edge of the support over a 381 mm length (Fig. 17). The yield and the ultimate curvature values at this location of the frame are φy =3.15×10⁻⁵ rad/mm and φu =1.81×10⁻³ rad/mm, respectively. Integration of the curvature diagram area, either at the top of the column or at the corner of the beam, provides the analytical plastic rotation θp =0.113 rad, while the experimental plastic rotation for this region is θp =0.130 rad. The equivalent plastic hinge length in this region is 64 mm (0.44d). This value is within the limits noted in the literature (0.4d<lp<2.4d). Unfortunately, there are no experimental values in this region to compare the accuracy of the values of the computed yielding and the equivalent plastic hinge lengths. The same procedure is used for calculating the plastic hinge length at the other critical sections.
The plastic hinges rotation calculated using the NONLACS2 program are compared with the experimental values in Table 3. Although the analytical results are slightly lower than the experimental values, the agreement between the two sets of results is quite good. The maximum deviation between the analytical and the experimental values of the plastic hinge rotations is approximately 13%, while the minimum deviation is 4%. Therefore, the above method of calculation for the plastic hinge rotation gives good correlation with the experimental values. Figure 17 and Table 3 indicates the ability of the NONLACS2 program to predict the
www.SID.ir

Archi
ve o
f SID
The effect of element size and plastic hinge…
October 2008 Iranian Journal of Science & Technology, Volume 32, Number B5
467
plastic hinge rotation, equivalent plastic hinge and yielding lengths, which are quite difficult to obtain in any experimental work without advanced instrumentation.
Table 3. Comparison of experimental and analytical plastic hinge rotations
Sequence and location of plastic hinge Plastic hinge rotation, θp (rad) θp (Anl) / θp (Exp) Sequence Location Experimental NONLACS2
First hinge Right corner 0.13 0.120 0.923 Second hinge Right foot 0.13 0.113 0.87
Third hinge Left vertical concentrated
load 0.09 0.0945 1.05
Last Hinge Left foot 0.08 0.0754 0.94
Figure 18 shows a comparison between the position of the plastic hinges obtained in the experimental and the analytical work using the NONLACS2 program. The location of the analytical plastic hinges are exactly the same as in the experimental findings. The failure mechanism obtained experimentally (shown in Fig. 18) is in good agreement with the results obtained from the NONLACS2 program. In the case of RC members in which the strength varies with the curtailment of reinforcement, it is possible for hinges to occur at other points along the length of members.
Fig. 18. Experimental and analytical location of plastic hinge for frame FP3
7. RESPONSE OF RC FRAMES FP1 AND FP2
Because of space limitation, only the load-deflection curves for frame FP1 and FP2 are plotted here. Figure 19 shows the analytical and experimental load-deflection curves for frame FP2. The computed response is stiffer in comparison with the experimental findings, especially at the higher load levels. However, the computed ultimate load of the frame agrees with the experimental value of 66.24 kN, with a difference of only 3.6 percent.
As can be seen from the load-deflection curve for the frame FP1 (Fig. 20), the analytical cracking load, using the NONLACS2 program, is 5.00 kN, while the values of yielding load and ultimate load are Py=50.26 kN and Pu=62.20 kN, respectively. The experimental yielding and ultimate loads for this frame are Py=57.8 kN and Pu=64.27 kN, respectively. The computed load-deflection curve follows the experimental curve quite
www.SID.ir

Archi
ve o
f SID
A. Kheyroddin and A. R. Mortezaei
Iranian Journal of Science & Technology, Volume 32, Number B5 October 2008
468
closely. The model using the NONLACS2 program underestimates the ultimate load of the structure by 11.8 percent and behaves in a relatively less ductile manner.
Fig. 19. Comparison of analytical and experimental load-deflection curves for frame FP2
Fig. 20. Comparison of analytical and experimental load-deflection curves for frame FP1
www.SID.ir

Archi
ve o
f SID
The effect of element size and plastic hinge…
October 2008 Iranian Journal of Science & Technology, Volume 32, Number B5
469
8. CONCLUSION The analytical results, based on not taking into account for the mesh size dependency (MDEP=1), show that the computed response and the ultimate load for frame FP3 depend on the size and the number of elements. The finer meshes give lower values of the ultimate load and vice versa for the coarser meshes. With an increase in the number of elements, the structure is slightly more flexible than for the case for the coarse mesh idealization, and the frame tends to be less ductile. For example, the coarser mesh of 89-elements gives an ultimate load value of 49 kN, which is very close to the experimental ultimate load of 48 kN, while the medium size mesh of 212-element results in an ultimate load 39.4 kN, and the finer mesh of 700-element underestimates the ultimate load (35.6 kN) by about 74 percent. The pre-cracking behavior and the cracking load are the same for the different mesh configurations. The proposed model gives reasonable results for a model with 212 elements, however, more analytical work is needed for the frame with a very fine mesh (700-element model).
For the frame FP3, the model without tension-stiffening (εtu= εcr) exhibits a softer response than that of the experimental findings, and the mode of failure is brittle without any ductility. The difference in the deflection values between the two models at the failure stage shows the importance of considering the tension-stiffening in the analysis in increasing the ductility of the structure.
The locations of the plastic hinges obtained for the frame FP3 using the NONLACS2 program agree with those obtained by the experimental work. Although the analytical plastic hinge rotation values are slightly lower than the experimental values, the agreement between the two sets of results is very good. For example, the maximum deviation between the analytical and the experimental values of the plastic hinge rotations is approximately 13%, while the minimum deviation is 4%. The NONLACS2 program has been shown to be sufficiently powerful in adequately predicting the complete load-deformational responses of the three frames up to failure including the load-deflection and strain characteristics, failure mechanism, the location of plastic hinges and their rotations, equivalent plastic hinge and yielding.
REFERENCES 1. Cranston, W. B. (1965). A computer method for inelastic analysis of plane frames. TRA 386, Cement and Concrete
Association, London.
2. Gunnin, B., Rad, F. & Furling, R. (1977). A general nonlinear analysis of concrete structures and comparison with
frame tests. Computers and Structures, Vol. 7, pp. 257-265.
3. Darvall, P. L. (1984). Critical softening of hinges in portal frames. ASCE Journal of Structural Engineering, Vol.
110, No. 1, pp. 157-162.
4. El-Metwally, S. E. & Chen, W. F. (1989). Nonlinear behavior of RC frames. Computers & Structures, Vol. 32, No.
6, pp. 1209-1989.
5. Ahmad, H. (1996). Nonlinear finite element analysis of a RC portal frame. M. Eng. Project, Department of Civil
Engineering and Applied Mechanics, McGill University, Montreal, 1996.
6. Lee, S. Y. & Haldar, A. (2003). Reliability analysis of frame and shear wall structural systems–static loading, J.
Struct. Eng. Div. ASCE, Vol. 129, pp. 224–232.
7. Lee, S. Y. & Haldar, A. (2003). Reliability analysis of frame and shear wall structural systems–dynamic loading,
J. Struct. Eng. Div. ASCE, Vol. 129, pp. 233–240.
8. Coronelli, D., Martinelli, L. & Mulas, M. G. (2005). Modelling and analysis issues in assessing the performance
of RC frames, Engineering Structures, Vol. 23, No. 8, pp. 911-925.
9. Palermo, D. & Vecchio, F. J. (2003). Compression field modeling of reinforced concrete subjected to reversed
loading: formulation. ACI Structural Journal, Vol. 100, No. 5, pp. 616-625.
www.SID.ir
Archi
ve o
f SID
A. Kheyroddin and A. R. Mortezaei
Iranian Journal of Science & Technology, Volume 32, Number B5 October 2008
470
10. Kim, J. K. & Lee, T. G. (1993). Failure of reinforced concrete frames by the combined layered and nonlayered
method. Computers & Structures, vol. 48, No. 5, pp. 819-825.
11. Mo, Y. L. (1992). Investigation of reinforced concrete frame behaviour-theory and tests. Magazine of Concrete
Research, Vol. 44, No. 160, pp. 163-173.
12. Rasheed, H. A. S. & Dinno, K. S. (1994). An improved nonlinear analysis of reinforced concrete frames. Computers
& Structures, Vol. 53, No. 3, pp. 625-636.
13. Vecchio, F. J., Disturbed stress field model for reinforced concrete: formulation. Journal of Structural
Engineering, ASCE, Vol. 126, No. 9, pp. 1070-1077.
14. Kheyroddin, A. (1996). Nonlinear finite element analysis of flexure-dominant reinforced concrete structures. Ph.D.
Thesis, Department of Civil Engineering and Applied Mechanics, McGill University, Montreal, Canada, p. 290.
15. Nofal, M. E. (1988). Inelastic load distribution of composite concrete-steel slab-on-girder bridges, an analytical and
experimental study. M. Eng. Thesis, Department of Civil Engineering, Carleton University, Ottawa.
16. Saenz, L. P. (1965). Equation for the stress-strain curve of concrete in uniaxial and biaxial compression of concrete.
ACI Journal, vol. 61, No. 9, pp. 1229-1235.
17. Darwin, D. & Pecknold, D. A. (1977). Nonlinear biaxial stress-strain law for concrete. ASCE Journal of the
Engineering Mechanics Division, vol. 103, No. EM4, pp. 229-241.
18. Pastor, J. A. (1986). High-strength concrete beams. Ph.D. Thesis, Cornell University, New York, Ithaca.
19. Scott, B. D., Park, R. & Priestly, M. J. N. (1982). Stress-strain behavior of concrete confined by overlapping hoops at
low and high strain rates, ACI Journal, Vol. 79, No. 1, pp. 13-27.
20. Shayanfar, M. A., Kheyroddin, A. & Mirza, M. S. (1996). Element size effects in nonlinear analysis of reinforced
concrete members, computers & structures. London, U.K.
21. Bazant, Z. P. & Oh, B. H. (1983). Crack band theory for fracture of concrete. Material and Structures, Vol. 16, No.
93, pp. 155-177.
22. Cranston, W. B. & Cracknell, J. A. (1969). Tests on reinforced concrete frames 2: portal frames with fixed feet.
Cement and Concrete Association, London, TRA/420.
23. Kheyroddin, A. & Naderpour, H. (2008). Nonlinear finite element analysis of composite RC shear walls. Iranian
Journal of Science and Technology, Transaction B: Engineering, Vol. 32, No. B2, pp. 79-89.
www.SID.ir
Copyright © 2022 FDOKUMEN