Advanced Unsaturated Soil Mechanics and Engineering Charles & Bruce
Upload
uomustansiriyahCategory
view
4download
0
Malaysian Polymer Journal, Vol. 6, No. 2, p 135-146, 2011
Available online at www.cheme.utm.my/mpj
*Corresponding author: Mahasin F. Hadi Al-Kadhemy, Email: [email protected]
The Effect of Carbon Black- Bp2000 on the Electrical Conductivity of Unsaturated Polyester
ASRAR ABDULMUNIM, MAHASIN F. HADI AL-KADHEMY*
Physics Department, College of Science,
Al-Mustansiriyah University, Baghdad, Iraq
ABSTRACT: Carbon black (BP-2000) plays an important role in improving the electrical conductivity of unsaturated polyester. The purpose of this work was to prepare polymeric composite materials with different contents of carbon on electrical properties of these materials. Five specimens were prepared using casting method. Composites with polyester as a matrix and with (10, 15, 20, and 30 wt. %) of carbon as a filler were casted. The idea of the test was to define electrical resistivity with different content of conductive component (carbon). The experimental results demonstrated that addition of carbon black to polyester caused change of volume resistivity of these materials. Also, addition of (15-30wt. %) of carbon black to polyester caused limited, almost linear decrease of resistivity. Estimated theoretical equation is sigmoid function was achieved by making fitting curve for all practical data using (Table Curve 2D, version 5.01) software. This help us to estimate mathematical model for the shape behavior of (conductivity- temperature) curve, and to find any value of electrical conductivity for any weight percentage that is not taken experimentally. Also, statistical properties of (conductivity- temperature) curve were discussed in this work. Keywords: - Polyester, Carbon Black, Electrical Conductivity, Theoretical Model, statistical properties.
1. INTRODUCTION
The electrical conductivity of the polymers was improved by introducing conductive materials such as (carbon black, graphite, metallic powder, and superconductivity material) to create a composite [1]. The degree to which the physical properties are changed depends to a great extend upon many properties. The most important of these properties which enhance the electrical conductivity are the particle size and the volume fraction of the conductors in the polymers, the method of preparation and the extent of homogeneity of the composites as well as the intrinsic physical properties of the polymer [2-5].
The addition of conductive filler into polymers generally enhances the electrical properties of the latter. Conductive particle filled into polymers have been used in many applications such as electrochemical displays, sensors, catalysis and redox capacitors etc. [6-7].
Exfoliated graphite is generally produced from various intercalation compounds subjected to a thermal shock. Commercially prepared graphite uses flaky particles of sulphuric acid- based complexes by exposure to the flame of burner [8]. Different types of carbon based additives have been added to enhance the electrical, mechanical, structural, and thermal properties of a polymer. Most commonly additives used are carbon blacks, carbon nano-tubes and carbon fiber.
Malaysian Polymer Journal, Vol. 6, No. 2, p 135-146, 2011
136
Recently, Chand and Nigrawal [9] have reported the DC conductivity behavior of milled carbon fiber reinforced polymer composite. They found that DC conductivity of these composites increased on increasing the filler content. Electrical and thermal properties of carbon filled polyester have also been reported by other researches. It has been reported that sharp increase in the conductivity emerged when the filler content reached at the critical concentration [10]. Exfoliated graphite or expanded graphite with low density, and its special characteristics of absorbing heat by expansion, has its application as a fire retardant. Exfoliated graphite possesses both a surface with a remarkable homogeneity and a large surface area. Graphite being highly conducting and flaky in shape leads to very low percolation threshold this characteristic helps in the development of high energy density and powerful batteries [11, 12].
The study of physical properties of the composites such as electrical conductivity and their dependence on temperature and composition provides the first main challenge to theories of the solid state and give scientists more information on solids and their electronic applications. Therefore, this work was designed to prepare new composite polymer and to investigate their structure and electrical properties experimentally and theoretically. Also, we demonstrated the statistical properties of the (conductivity- temperature) curve for pure polyester and composite in all percentage weight of black carbon.
2. MATERIALS AND METHODS
2-1 Preparation of unsaturated polyester
In a round bottom flask, equipped with mechanical stirrer, the appropriate weight of additive carbon black pearls 2000 with different concentration (10, 15, 20. and 30wt %) and the resin were dissolved in a few amount of methanol. The mixture was stirred for about 30 minutes until the additive dissolve completely and become homogeneous, and then methanol was removed under vacuum for at least 48 hours and then kept in a vacuum desiccators and the mixture was cooled to room temperature.
To a beaker, the mixture, 1wt% of methyl ethyl keton peroxide (MEKP was used as an initiator catalyst. It was available as 50wt% solution in dimethylphthalate, it was supplied by (Aldrich corporation) and 0.5 wt. % of cobalt octoate (Cobalt octoate was used as accelerator), were added. The mixture was stirred and degassed by centrifuging (300 cycle/min.) and then cast between two glass sheet treated with wax and PVA solution (Polyvinyl alcohol) as a releasing agents.
Great care was taken in the casting process to avoid introducing air bubbles. The composite sheets were fabricated using casting method. According to the weight content; a fixed quantity of carbon black was well dispersed in methanol by an ultrasonic stirring. Then the unsaturated polyester was poured into the carbon-methanol solution and stirred well with a glass rod. Moreover, the filled carbon mixture was ultrasonicated at room temperature for 3 hours. In order to remove the methanol solution by evaporation, the composite solutions were heated in a furnace at 80 ̊C for 4 hours. After that, the hardening agent was poured and a sheet with 1mm thickness was modeled under heat treatment of 100 C̊ for 1 hour. The specimens were made in the form of rectangular bar (30x5x1 mm). The sheets were cutted to get the final shape, using a wheel saw cutter to minimize the deformation of the specimen during the cutting process.
Malaysian Polymer Journal, Vol. 6, No. 2, p 135-146, 2011
137
Carbon Black Bp-2000 used in this work has particle size 15nm, surface area is 1475m2/g and electrical conductivity is very high.
2.2 Electrical Conductivity Measurements
There are different methods for determination of DC volume resistivity of insulating materials. According to ASTM recommendations [13] for measurement of electrical resistance of insulating materials, three electrodes cell or (guard ring electrode method) was used to study the effect of the filler addition and the temperature on volume resistivity of polymer composite.
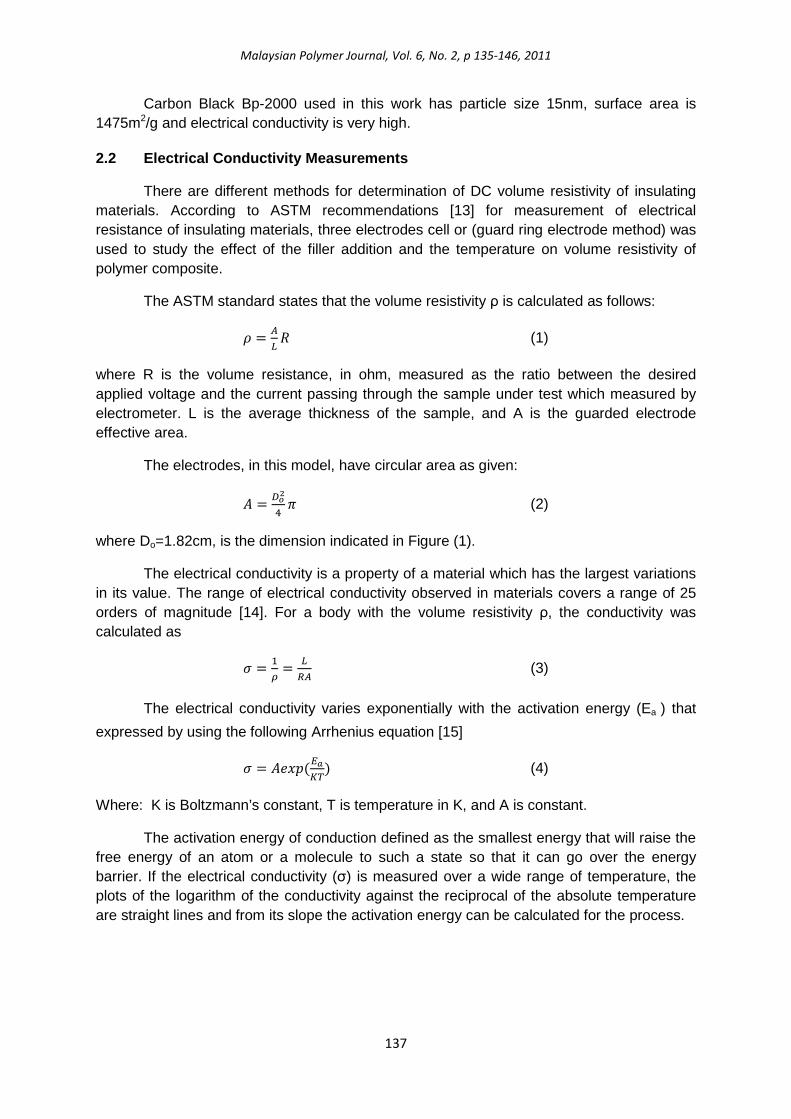
The ASTM standard states that the volume resistivity ρ is calculated as follows:
� = �� � (1)
where R is the volume resistance, in ohm, measured as the ratio between the desired applied voltage and the current passing through the sample under test which measured by electrometer. L is the average thickness of the sample, and A is the guarded electrode effective area.
The electrodes, in this model, have circular area as given:
� = �� � (2)
where Do=1.82cm, is the dimension indicated in Figure (1).
The electrical conductivity is a property of a material which has the largest variations in its value. The range of electrical conductivity observed in materials covers a range of 25 orders of magnitude [14]. For a body with the volume resistivity ρ, the conductivity was calculated as
� = � = �
�� (3)
The electrical conductivity varies exponentially with the activation energy (Ea ) that
expressed by using the following Arrhenius equation [15]
� = ����(����) (4)
Where: K is Boltzmann’s constant, T is temperature in K, and A is constant.
The activation energy of conduction defined as the smallest energy that will raise the free energy of an atom or a molecule to such a state so that it can go over the energy barrier. If the electrical conductivity (σ) is measured over a wide range of temperature, the plots of the logarithm of the conductivity against the reciprocal of the absolute temperature are straight lines and from its slope the activation energy can be calculated for the process.

Malaysian Polymer Journal, Vol. 6, No. 2, p 135-146, 2011
138
Figure 1: Scheme diagram of electrode.
A suitable measuring system is used to study and measured the effect of the applied electric field on the electrical properties. A schematic diagram for the apparatus is shown in Figure 2. The electrodes are made of copper metal, and a uniform pressure on the specimen was applied by four adjustable screws. The electrical input was provided by DC power supply (Philip Harris Limited) which provide an output voltage (0- 3000)volt, and the output current was measured by using Keithlaye 616 digital solid state electrometer, which provides direct reading current up to 10-15 ampere full scale.
Figure 2: Scheme diagram for the DC volume resistivity measurements.
The test sample was in the form of a disc, the samples were covered with aluminum electrodes by vacuum evaporation on both faces of the sample to minimize the contact resistance. The sample was placed between the two electrodes and the desired test voltage is selected from the voltage supply, then the current passing through the bulk of the test sample, at selected temperature, is measured by the electrometer.

Malaysian Polymer Journal, Vol. 6, No. 2, p 135-146, 2011
139
The measurement of volume resistivity were preformed in the temperature range between 30 – 100°C by using temperature controlled oven (Hereaus- Electronic) which was shielded against external electromagnetic field.
2.3 Estimates Theoretical Modeling
The theoretical modeling of effect of variation of weight percentage of carbon black BP2000 on the electrical conductivity of unsaturated polyester was taken by using “Table Curve 2D, version 5.01”.
3. RESULTS AND DISCUSSIONS
3.1 Practical Part
The effect of temperature on the electrical conductivity(lnσ) of polyester- Carbon Black in different concentration of carbon in polymer (10. 15, 20, and 30)wt% is illustrated in Figure(3). Increasing concentration of carbon black in polymer led to increase the electrical conductivity. Moreover, it was found that the lower concentration of carbon black in a sample, the lowest in conductivity value. The conductivity data are summarized in table (1).
Figure 3: Relationship between temperature and electrical -conductivity of unsaturated polyester with different weight percentage of Carbon Black BP-2000
-30.00
-25.00
-20.00
-15.00
-10.00
-5.00
0.00
2.00 2.20 2.40 2.60 2.80 3.00 3.20 3.40 3.60
lnσ
(oh
m-1
cm-1
)
1000/T (K-1)
Po(Polymer) Po+10Wt.%BP Po+15Wt.%BP
Po+20Wt.%BP Po+30Wt.%BP

Malaysian Polymer Journal, Vol. 6, No. 2, p 135-146, 2011
140
Table 1: DC- Conductivity data for investigated polyester and its composites
Compound σ*(ohm-1cm-1) Ea (ev) Temperature (K)
Pure polymer 4.7×10⁻¹⁰ 0.15 300- 360 0.6 360- 425
Po+10wt% 2.2×10⁻⁶ 0.13 300- 410 Po+15wt% 3.21×10⁻⁵ 0.14 300- 410 Po+20wt% 4.4×10⁻⁵ 0.15 300- 410 Po+30wt% 5.1×10⁻⁴ 0.11 300- 410
For specimens of pure polymer, two stages of activation energy for electrical conduction are indicated; the first stage with low activation energy (0.15eV) and the second stage with higher activation energy (0.6eV). This suggests two different activation processes, the band conduction and the conduction by hopping [16].
At higher concentration of carbon black (30wt. %), the activation energy is even smaller (0.11eV), which can be attributed to a possible increase in the number of conduction paths created in the specimens. At higher filler concentration, the temperature independence of the electrical conductivity is attributed to the tendency of CB particles to form aggregation which acts as direct pathway for the charge carriers, i.e.; the charge carriers will have no trouble travelling within the pathway that has been formed by carbon aggregations. The same conclusion has been reported in different experiments on polymer- metal composites [16].
The properties of a pellet sample by pressing is uniaxial and produces particle- particle contacts in the pressing direction and form a percolation path, because the die wall prevents the particle from spreading out and avoiding each other.
If the carbon black aggregates are randomly distributed, then reordering of the composite will destroy percolation paths and form new one. According to the distribution of the conduction filler are constant, and then the probability of the same number of percolation path is unchanged. This will cause no loss of conductivity as illustrated in our results.
The distribution of the filler in the polyester depends upon the size of the particle. So that, few particles of large size are required to make up the same volume percent conductive filler, and smaller numbers of particles decrease the opportunity to create a percolation path after polymer chain motion was destroyed.
The presence of enough particles in the matrix causes a die and reborn percolative paths to be in equilibrium. This may explain why more percolation paths in high concentration of carbon filler are destroyed by polymer chain motion rather than being created due to the large size of the particles and their smaller number [16].
3.2 Theoretical Part
For these experimental curves, fitting curves was taken by use ((Table Curve 2D)) program as illustrated in Figures (4- a, b, c, and d) for pure polymer and with different weight
Malaysian Polymer Journal, Vol. 6, No. 2, p 135-146, 2011
141
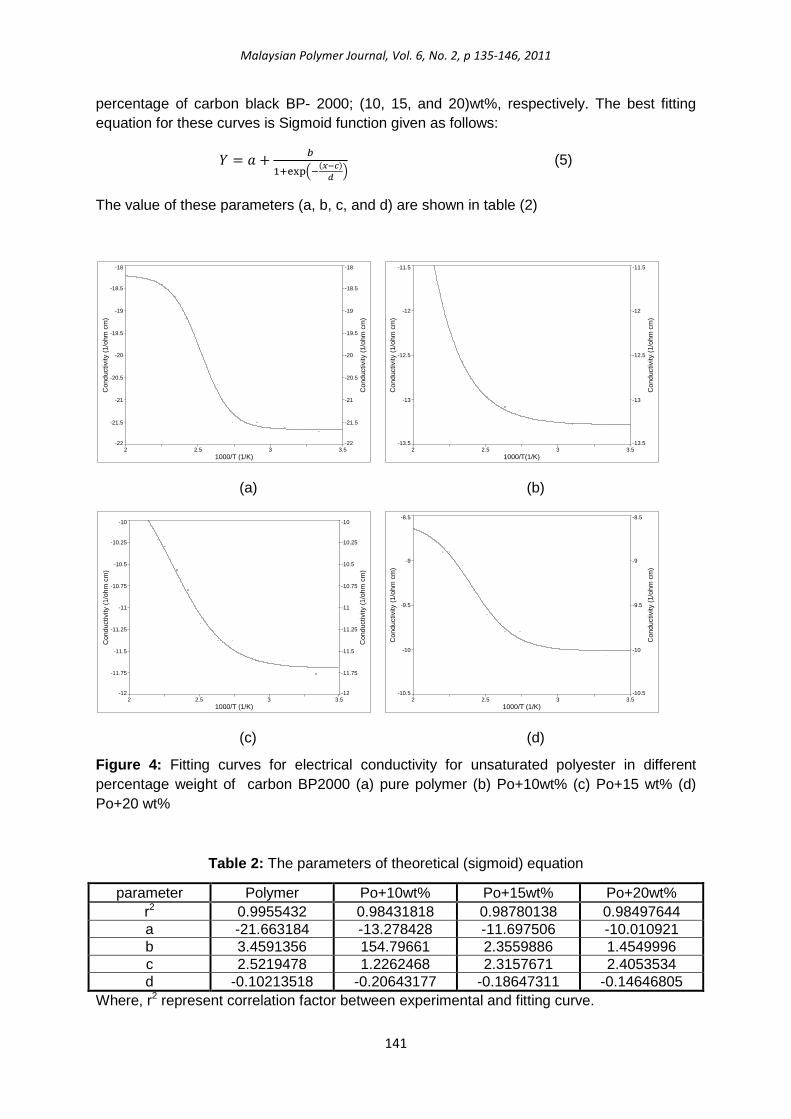
percentage of carbon black BP- 2000; (10, 15, and 20)wt%, respectively. The best fitting equation for these curves is Sigmoid function given as follows:
� = � + � ��� !"(#$%)
& ' (5)
The value of these parameters (a, b, c, and d) are shown in table (2)
(a) (b)
(c) (d)
Figure 4: Fitting curves for electrical conductivity for unsaturated polyester in different percentage weight of carbon BP2000 (a) pure polymer (b) Po+10wt% (c) Po+15 wt% (d) Po+20 wt%
Table 2: The parameters of theoretical (sigmoid) equation
parameter Polymer Po+10wt% Po+15wt% Po+20wt% r2 0.9955432 0.98431818 0.98780138 0.98497644 a -21.663184 -13.278428 -11.697506 -10.010921 b 3.4591356 154.79661 2.3559886 1.4549996 c 2.5219478 1.2262468 2.3157671 2.4053534 d -0.10213518 -0.20643177 -0.18647311 -0.14646805
Where, r2 represent correlation factor between experimental and fitting curve.
2 2.5 3 3.51000/T (1/K)
-22
-21.5
-21
-20.5
-20
-19.5
-19
-18.5
-18
Con
duct
ivity
(1/
ohm
cm
)
-22
-21.5
-21
-20.5
-20
-19.5
-19
-18.5
-18
Con
duct
ivity
(1/
ohm
cm
)
2 2.5 3 3.51000/T(1/K)
-13.5
-13
-12.5
-12
-11.5
Con
duct
ivity
(1/
ohm
cm
)
-13.5
-13
-12.5
-12
-11.5
Con
duct
ivity
(1/
ohm
cm
)
2 2.5 3 3.51000/T (1/K)
-12
-11.75
-11.5
-11.25
-11
-10.75
-10.5
-10.25
-10
Con
duct
ivity
(1/
ohm
cm
)
-12
-11.75
-11.5
-11.25
-11
-10.75
-10.5
-10.25
-10
Con
duct
ivity
(1/
ohm
cm
)
2 2.5 3 3.51000/T (1/K)
-10.5
-10
-9.5
-9
-8.5
Con
duct
ivity
(1/
ohm
cm
)
-10.5
-10
-9.5
-9
-8.5
Con
duct
ivity
(1/
ohm
cm
)

Malaysian Polymer Journal, Vol. 6, No. 2, p 135-146, 2011
142
A sigmoid curve is produced by a mathematical function having an “S” shape and refers to the special case of the logistic function. Figures (5-8) describes the varia tion between each parameter of sigmoid theoretical equation with variation of weight percentage of Carbon black BP2000. Also, we take fitting curve for each curve, and the fitting equation is illustrated above the curve.
) = −21.613373 + 1.4455653� − 0.19350961� .5 )" = 0.27591715 − 0.014001003� + 0.003575408�7.5
To calculate the final parameter of sigmoid theoretical equation (eq.(4)), we choose weight percentage of BP as test; C=5wt%BP, so the estimated theoretical equation will become as follow:
) = 16.54905 + 8.95 :; �<$((#$=.>?>@>@A)
$=.?@B?CB@A ) (6)
0 5 10 15 20weight percentage of BP %
-22.5
-20
-17.5
-15
-12.5
-10
a-pa
ram
eter
-22.5
-20
-17.5
-15
-12.5
-10
a-pa
ram
eter
0 5 10 15 20weight percentage of BP %
0
25
50
75
100
125
150
175
b-pa
ram
eter
0
25
50
75
100
125
150
175
b-pa
ram
eter
-10 0 10 20Weight percentage of BP %
0.5
1
1.5
2
2.5
3
c-pa
ram
eter
0.5
1
1.5
2
2.5
3
c-pa
ram
eter
0 5 10 15 20Weight percentage of BP %
-0.225
-0.2
-0.175
-0.15
-0.125
-0.1
d-pa
ram
eter
-0.225
-0.2
-0.175
-0.15
-0.125
-0.1
d-pa
ram
eter
Figure 5: The relation between a-parameter and weight percentage of BP%
)" = −9.7788317 − 0.015603376�7 + 2.0513657�D.5 ) = 0.21363959 + 0.1179189� + 2.3083007�"E
Figure 7: The relation between c-parameter and weight percentage of BP%
Figure 8: The relation between d-parameter and weight percentage of BP%
Figure 6: The relation between b-parameter and weight percentage of BP%
Malaysian Polymer Journal, Vol. 6, No. 2, p 135-146, 2011
143
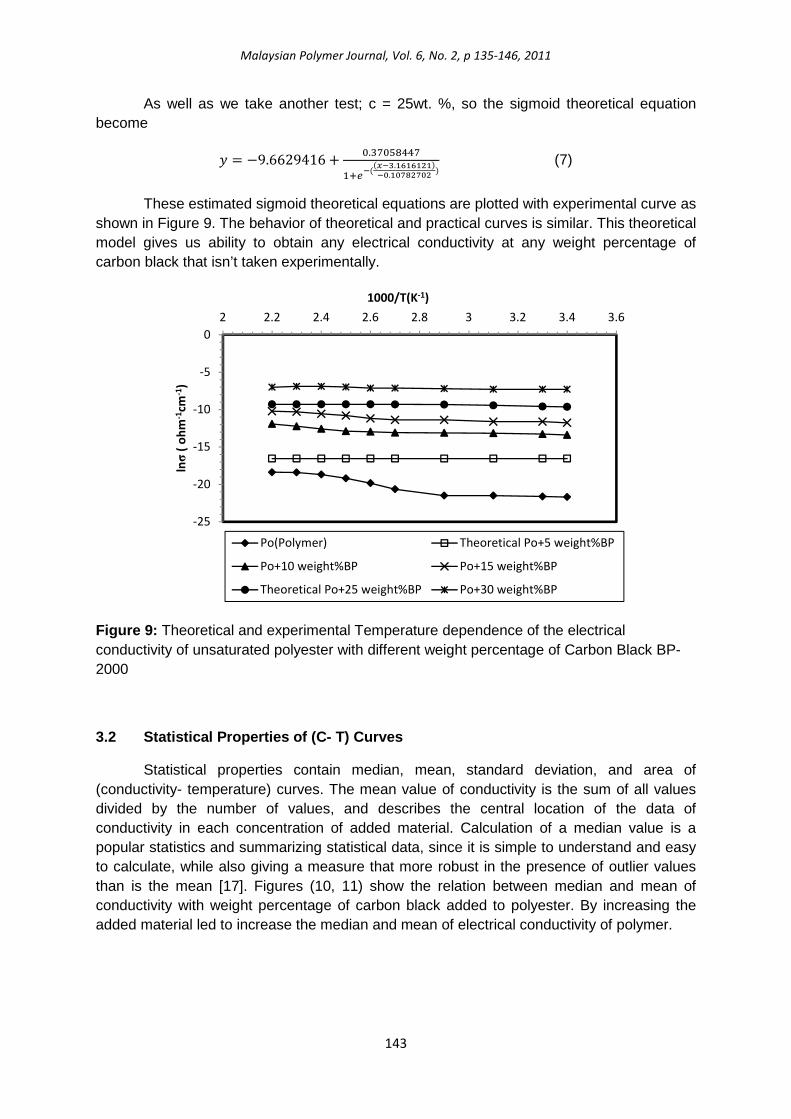
As well as we take another test; c = 25wt. %, so the sigmoid theoretical equation become
) = −9.6629416 + D.:8D5F8 �<$((#$A.?G?G??)
$=.?=@>@= ) (7)
These estimated sigmoid theoretical equations are plotted with experimental curve as shown in Figure 9. The behavior of theoretical and practical curves is similar. This theoretical model gives us ability to obtain any electrical conductivity at any weight percentage of carbon black that isn’t taken experimentally.
Figure 9: Theoretical and experimental Temperature dependence of the electrical conductivity of unsaturated polyester with different weight percentage of Carbon Black BP-2000
3.2 Statistical Properties of (C- T) Curves
Statistical properties contain median, mean, standard deviation, and area of (conductivity- temperature) curves. The mean value of conductivity is the sum of all values divided by the number of values, and describes the central location of the data of conductivity in each concentration of added material. Calculation of a median value is a popular statistics and summarizing statistical data, since it is simple to understand and easy to calculate, while also giving a measure that more robust in the presence of outlier values than is the mean [17]. Figures (10, 11) show the relation between median and mean of conductivity with weight percentage of carbon black added to polyester. By increasing the added material led to increase the median and mean of electrical conductivity of polymer.
-25
-20
-15
-10
-5
0
2 2.2 2.4 2.6 2.8 3 3.2 3.4 3.6
lnσ
( o
hm
-1cm
-1)
1000/T(K-1)
Po(Polymer) Theoretical Po+5 weight%BP
Po+10 weight%BP Po+15 weight%BP
Theoretical Po+25 weight%BP Po+30 weight%BP

Malaysian Polymer Journal, Vol. 6, No. 2, p 135-146, 2011
144
While the standard deviation means the magnitude of deviated the value of electrical conductivity from its average value. So, Figure 12 shows that STD has the greatest value for pure polymer and decrease with increasing weight percentage of black carbon BP2000 that added to polyester. Elsewhere, there is an increment at about 15wt% before decreasing ; this may be led to the electrical conductivity at this point that isn’t change largely from the 10wt. % and 20 wt. %. Figure (13) illustrated the area of (C- T) curve that means conductivity multiply the reciprocal temperature with the concentration of added material. Increasing concentration of black carbon to polyester led to increase area of curve.
4. CONCLUSION
Effect of concentration of carbon black BP2000 on the electrical conductivity of unsaturated polyester was investigated. Electrical conductivity of polymer was increased with increasing concentration of weight percentage of carbon black that added to polymer. Whereas, the activation energy of pure polymer due to the addition of carbon black to be one value.
Sigmoid function was the best fitting equation to estimate theoretical model for the effect of concentration of carbon black on the electrical conductivity of unsaturated polyester.
-25
-20
-15
-10
-5
0
0 20 40m
ed
ian
Weight percentageof BP %
-25
-20
-15
-10
-5
0
0 20 40
me
an
Weight percentage of BP%
0
0.4
0.8
1.2
1.6
0 20 40
ST
D
Weight percentage % -25
-20
-15
-10
-5
0
0 20 40
Are
a
(1/K
oh
m.c
m)
Weight percentage of Bp %
Figure 10: The relation between median and percentage weight of
Figure 11: The relation between mean and percentage weight of BP%
Figure 12: The relation between STD and percentage weight of BP%
Figure 13: The relation between area and percentage weight of BP%
Malaysian Polymer Journal, Vol. 6, No. 2, p 135-146, 2011
145
� = � + H1 + exp L− (� − M)
N O
This model describes the behavior of the shape (s-shape) for temperature dependence conductivity of polyester composite. Statistical properties (mean, median and area) of conductivity value increasing with increasing weight percentage of added material, while STD value decreasing.
5. REFERENCES
[1] Reidy R.F. and Simkovich G., Anomalous electrical behavior of polymer- carbon composites as function of temperature, Journal of material science, 28(3), 799-804, 1993.
[2] Slade R.C.T., and Thompson I.M., Influence of surface area and particle size of dispersed oxide on conductivities of lithium bromide composite electrolytes, Solid state Ionics, 26(4), 287-294, 1988.
[3] Roman H.E., and Yussouff M., Particle size effect on the conductivity of dispersed ionic conductors, Physical review (B), 36(13), 7285- 7293, 1987.
[4] Alexander M.G., Anomalous temperature dependence of the electrical conductivity of carbon- polymethylmethacrylate composites, Research bulletin, 34, 4603- 4611, 1999.
[5] Vacassy R., Hofman H., Papageorgion N., and Gratzel M., Influence of the particle size of electrode materials on intercalation rate and capacity of new electrodes, Journal of power sources, 81, 2621- 2626, 1999.
[6] Allaoui A., Bai S., Cheng H.M., and Bai J.B., “Mechanical and electrical properties of a MWNT/epoxy composites”, Composite Science Technology, 62(15),1993-1998, 2002.
[7] Malinauskas A., “Chemical depositing of conducting polymers”, Polymer, 42(9),3957-3972, 2001.
[8] Pinto G., and Jimmenez-Martin A., “Conducting aluminum- filled nylon 6 composites”, Polymer Composites, 22(1),65-79, 2001.
[9] Chand N., and Nigrawal A., “Investigations on DC conductivity behavior of milled carbon fiber reinforced epoxy graded composites”, Bulletin of Material Science, 31,665-668, 2008.
[10] Chand N., and Nigrawal A., “Development, dielectric and thermal studies on HAF carbon filled polyester gradient composites”, Journal of Composite Materials, doi: 10.1177/0021998309345297, 2009.
[11] Cheng G., Weng W., Wu D., and Wu C., “Preparation of polystyrene/ graphite nano sheet composite”, Polymer, 44,1781, 2003.

Malaysian Polymer Journal, Vol. 6, No. 2, p 135-146, 2011
146
[12] Weng W.G., Chen G.H. Wu D.J, Chen X.F., Lu J.R., and Wang P.P., “Fabrication and characterization of nylon6/foliated graphite electrically conducting nano composite”, Journal of applied polymer Science, part B,42.2844, 2004.
[13] ASTM, D 257- 78, 1988.
[14] B. Tareev, Physics of Dielectric Materials, Mir Publishers, Moscow, 1975.
[15] Singh H.P., and Gupte D., “Temperature and thickness dependence of electrical conductivity of polypropylene”, Indian Journal of Pure and Applied Physics, 24, 444-447, 1986.
[16] Rodriguez E.L., “Particulate filled polyester composites”, Journal of Materials Science letters, G, 1280- 1282, 1987.
[17] Riley K.F., Hobson M.P., and Bence S.J., “Mathematical methods for physics and engineering”, 3rd edition, Cambridge, UK, 2006.
Copyright © 2022 FDOKUMEN