The Economy of Uttar Pradesh in the Post-Reform Period: Politico-Economic Reasons for Stagnation and...
19
1 | Page The Economy of Uttar Pradesh in the Post-Reform Period: Politico-Economic Reasons for Stagnation and Fiscal Crisis Submitted By: Suyash Saxena (CPHL/SSS) Course: Indian Politics IV: Development and Public Policy
-
Upload
independent -
Category
Documents
-
view
0 -
download
0
Transcript of The Economy of Uttar Pradesh in the Post-Reform Period: Politico-Economic Reasons for Stagnation and...
1 | P a g e
The Economy of Uttar Pradesh in the Post-Reform Period: Politico-Economic Reasons for Stagnation and Fiscal Crisis
Submitted By:
Suyash Saxena
(CPHL/SSS)
Course: Indian Politics IV: Development and Public Policy
2 | P a g e
This paper seeks to give an overview of different aspects of the economy of Uttar Pradesh
and investigate the causes behind the major problems economic stagnation and fiscal debt
crisis alongside huge income inequalities between the eastern and the western parts of the
state that it has been facing since the Economic reforms. The enquiry shall attempt to delve
into not just the economic reasons and factors leading to these major problems but also view
those economic factors in the entirety of the changing socio-political climate of the state. The
paper shall unfold in four segments. The opening segment which shall be introductory in
nature, shall give an overview of the economy of the state since independence and the socio-
political factor that influenced it. A special focus in this discussion shall be given to the
economy since after the economic reforms. The second segment shall attempt to give a
deeper insight into the economic contours of the state with an aim to ascertain the politico-
economic factors leading to the economic stagnation since after 1990 and the fiscal crises.
The third segment shall view the economy of U.P. within the broader paradigm of the post-
reform national economy and endeavour to bring out the causal linkages between the neo-
liberal reforms and the economic problems of the state, especially income inequalities. While
the second segment takes account of only the state economy in locating the causes of
economic problems, the third segment takes into account the wider national aspect and within
its scope identifies the impact on the state of Uttar Pradesh. In all these segments the
relationship between the changing political contours and the economic trajectory is also given
its due scope. The paper closes with a few concluding remarks in the fourth segment.
3 | P a g e
I
(An Overview of UP’s economic trajectory during plan period)
According to the Human Development Report U.P. 2005, the per capita income of the state at
the time of independence was close to the national average; at about 93% of the national
average. However, throughout the plan period the gap between the two has kept widening.
The economy of Uttar Pradesh was hugely affected by the economic crisis of mid-1960s and
took a plunge downwards. The Compound Annual Growth Rate (CAGR) of UP during 1965-
1969 was as low as 0.3 while the national average 4.0 (Plan documents, Government of UP.)
The first wave of green revolution in mid-1960s raised the income of certain sections within
the state on the Western side. The initial phase of green revolution focussed on only wheat
production and therefore the contiguous wheat growing regions of Punjab, Haryana and West
Uttar Pradesh registered a rise in income while the rice-growing eastern parts lagged behind.
This led to income inequalities in the state and created classes of rich and poor farmers. The
influence of strong agricultural lobbies of high income west UP on the political-economy is
an important factor in the economic trajectory of the state which shall be dealt with a little
later in the paper but it is evident that most of the agricultural and industrial investment has
taken place in the west and also public policies have leaned in favour of the west.
The second wave of green revolution tried to offset the inequalities by focussing more on the
rice production of the eastern parts and it did succeed to an extent. The growth rate in the
combined period of 5th
and 6th
plan was as high as 9% in UP which was much higher than the
national average. Social movements among the dalits and other marginalised sections were
also a significant factor.1
The growth that was so achieved during this period could not be sustained and dropped
significantly in the beginning of the decade of 1990s and has remained stagnated ever since.
This drop in the Gross State Domestic Product (GSDP) and stagnation of economic activity
in general shall be the focus of the rest of the paper. Two approaches can be followed in order
to ascertain the causes as are discussed in the following paper.
1 Pai, 2002
4 | P a g e
Some scholars argue that at the root of the problem lies in the political-economy of the state
itself. Short lived coalition governments that have repeatedly been able to come in power in
the state since 1990 have followed on populist policies to gain support of particular social
groups and did little to take unpopular economic decisions that would have augmented public
investment, mobilised additional revenue and helped to maintain fiscal discipline. This has
led to gross fiscal indiscipline, mounting debts and deficits. The basic reason, according to
this approach lie in the ‘politics of identity’ and ‘competitive populism’ with which the
political horizons of the state have remained dominated since after the Ram-Janma-Bhumi
movement leading to an inability to pursue developmental policy measures. The electoral
polarisation did not give any government absolute majority and the weak regional
governments that successively came into power aimed only at maintaining their political
presence through populist measures targeted at their particular ‘vote-banks.’
There is also a second approach that could be followed in ascertaining the causes of
economic stagnation and fiscal crises. Certain other scholars have argued that it was in the
very nature of the economic reforms that the conditions of the poorer states deteriorated.
Economic reforms, by their very nature, worsened the already existing income inequalities.
Therefore, according to this second approach, the blame of fiscal strains and inequalities in
UP falls more on the neo-liberal policies of the central government than on the state
government.
This paper shall consider both approaches and shall seek to argue that though there might be
some sharp contradictions between the two approaches, by and large, they conjointly explain
the economic problems faced in UP. Rather than being pure contradictions, they are two
theories operating at two different levels- one at the wider national level and the other at only
the state level and they have complimented each other in augmenting the fiscal strains in the
state.
5 | P a g e
II
(Approach I: Locating the causes within the political-economy of UP state
itself)
In this segment we shall investigate the several aspects of the economy of Uttar Pradesh in
order to locate within the state economy the factors responsible economic stagnation, fiscal
crisis and ‘debt trap’ in which the state got trapped since after 1990. The pivotal argument in
this section is that because only regional and coalition governments have successively been
elected, electoral politics has determined the major policy decisions and economic choice of
the government. As a result of populist measures, plan expenditure has decreased, growth has
stagnated and hence revenue has been shrinking leading to huge debts on the government. All
these aspects shall be brought out through statistical data and analysis thereof.
(The Tables are given in the Appendix)
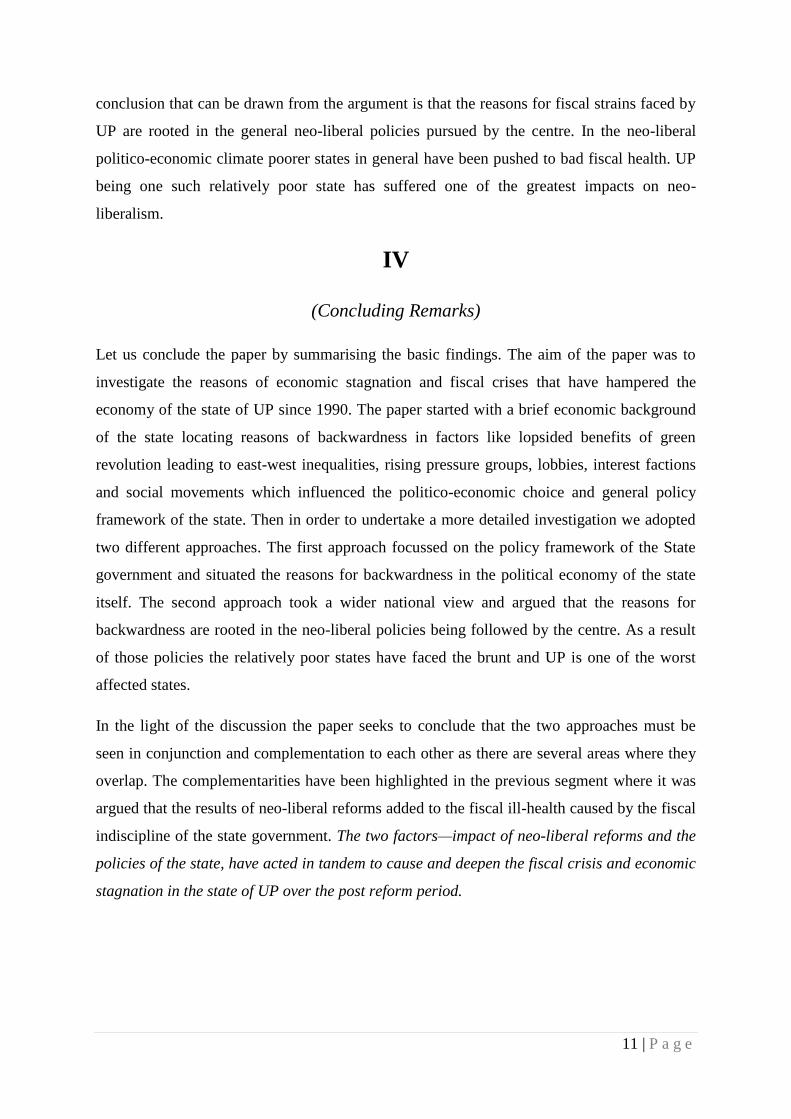
Table-1 shows that after 1990 the growth rate of the state has stagnated at around 3% and the
national growth rate has soared to much higher level; though in the beginning of the plan
period the growth rate in U.P. was comparable to the national rate. One of the basic reasons
for the stagnated growth is the low level of public expenditure. The per capita public
expenditure of U.P. is half the national average and is lowest among all states except Bihar.
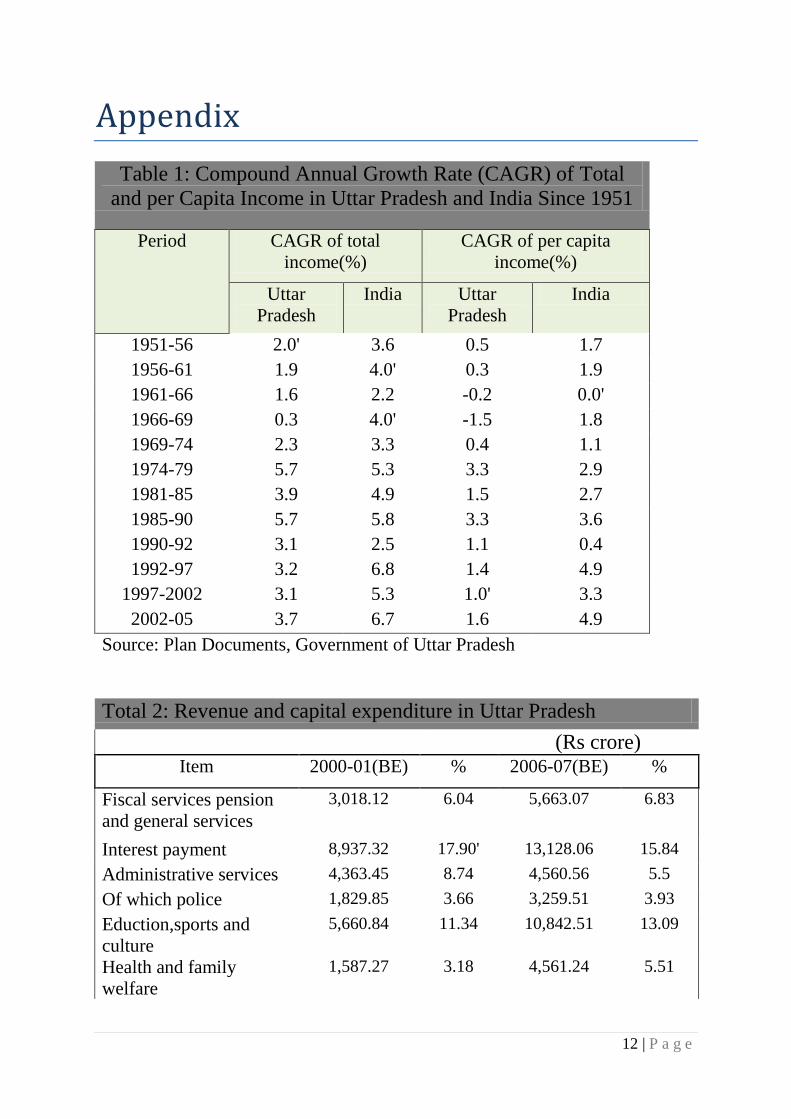
An overview of public expenditure of U.P. government is given in Table-2. This inability to
increase public expenditure and hence the inability to initiate investment and capital
formation in the economy is rooted in the inability to mobilise the state’s resources. The tax
revenue and State Domestic Product ration in U.P. is around 8% as compared to 11% in
Tamil Nadu, Kerala and Karnataka. Per capita tax revenue is just Rs 1,101 which is less than
two-seventh of Karnataka, one-third of Tamil Nadu and much less than even the other least
developed states like Rajasthan and Madhya Pradesh. A brief picture of revenue receipts of
the state is given in Table-3 and 7. As a result of this inability to raise its own revenue, UP
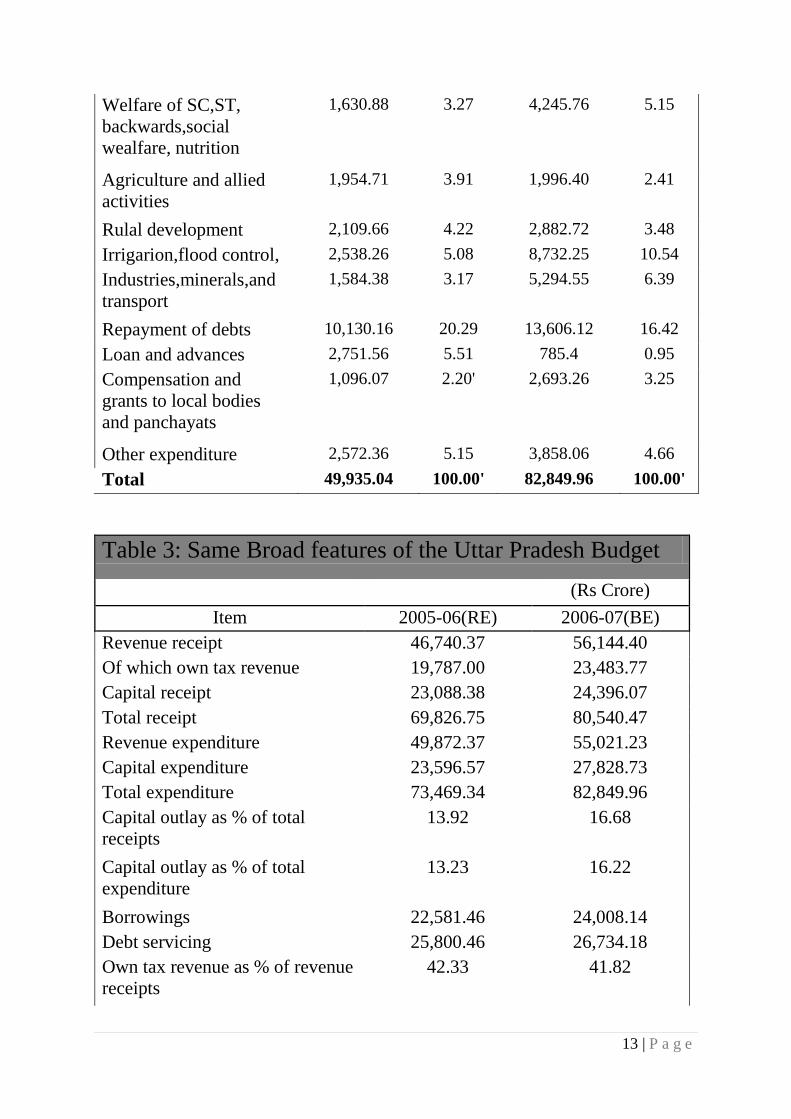
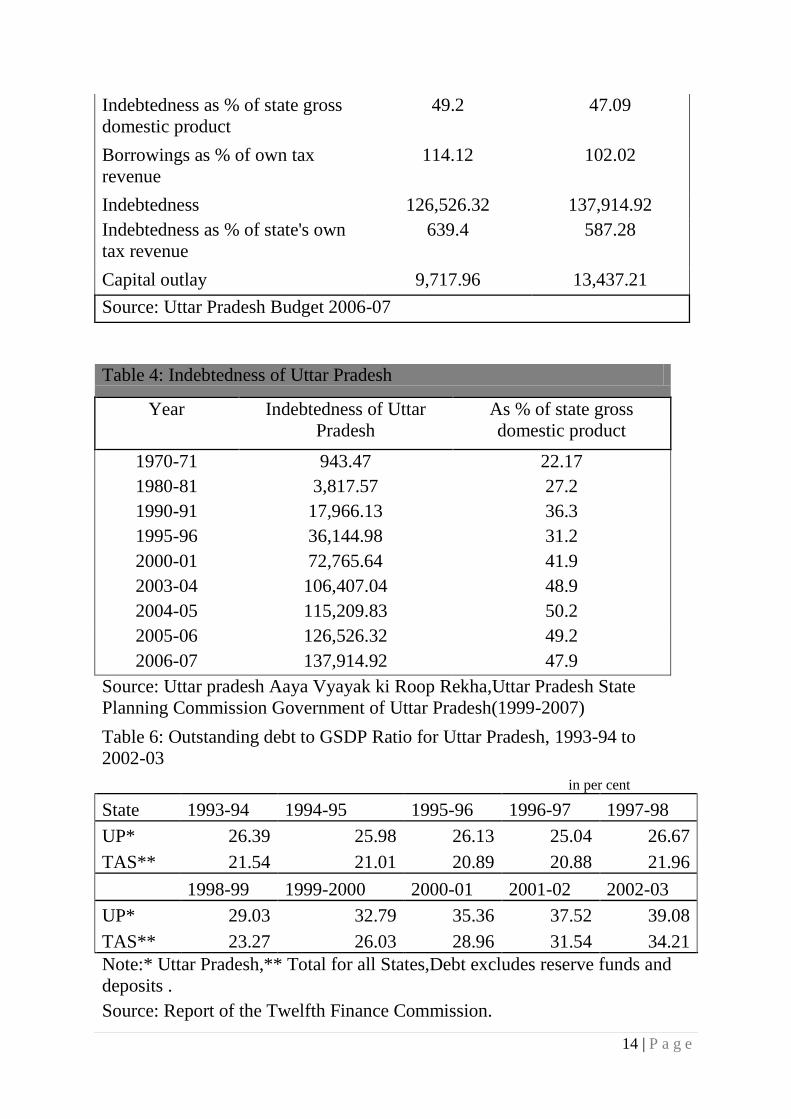
has relied heavily on borrowing which has resulted in high interest payment burden. In 2006-
07 the interest payment of the state is pegged at Rs 13,128 which is equal to 56% of the total
revenue of the state. A statistical picture of indebtedness of UP is given in Tables- 4 and 6.
This discussion shows that there is a vicious circle that has build up in the post-reform period
which has ushered the entire economy of the state into fiscal strains and debts. Underneath all
6 | P a g e
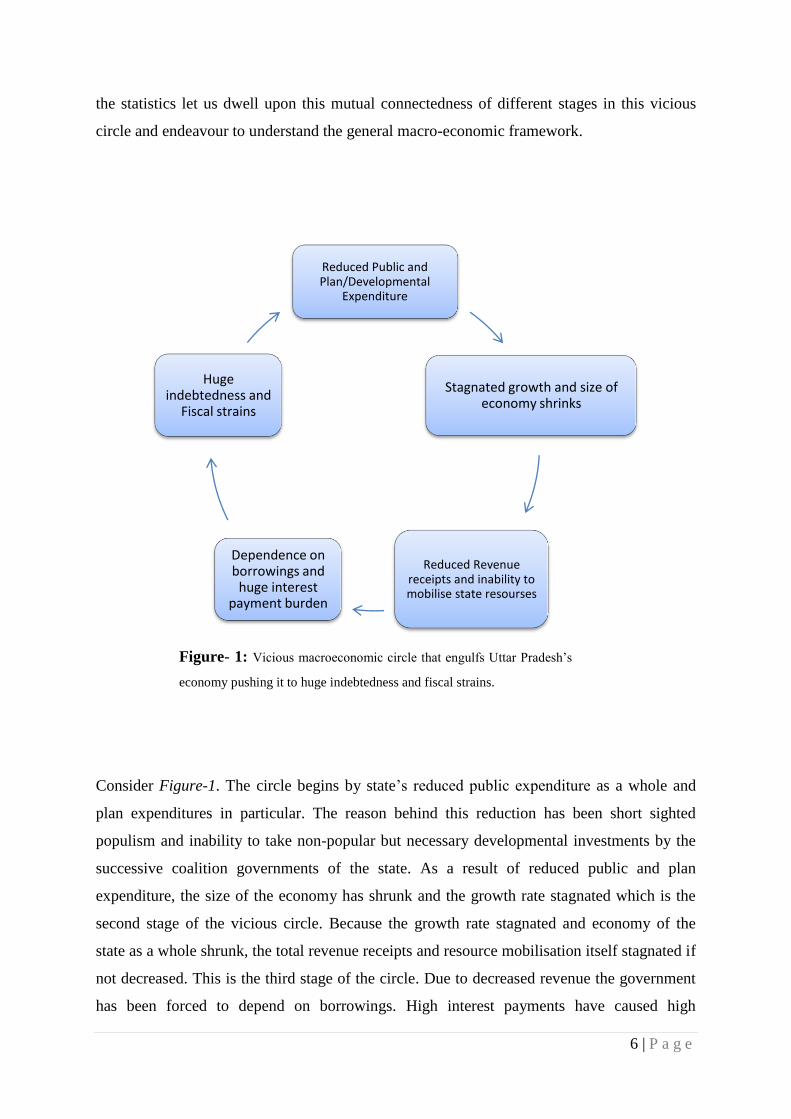
the statistics let us dwell upon this mutual connectedness of different stages in this vicious
circle and endeavour to understand the general macro-economic framework.
Consider Figure-1. The circle begins by state’s reduced public expenditure as a whole and
plan expenditures in particular. The reason behind this reduction has been short sighted
populism and inability to take non-popular but necessary developmental investments by the
successive coalition governments of the state. As a result of reduced public and plan
expenditure, the size of the economy has shrunk and the growth rate stagnated which is the
second stage of the vicious circle. Because the growth rate stagnated and economy of the
state as a whole shrunk, the total revenue receipts and resource mobilisation itself stagnated if
not decreased. This is the third stage of the circle. Due to decreased revenue the government
has been forced to depend on borrowings. High interest payments have caused high
Reduced Public and Plan/Developmental
Expenditure
Stagnated growth and size of economy shrinks
Reduced Revenue receipts and inability to mobilise state resourses
Dependence on borrowings and
huge interest payment burden
Huge indebtedness and
Fiscal strains
Figure- 1: Vicious macroeconomic circle that engulfs Uttar Pradesh’s
economy pushing it to huge indebtedness and fiscal strains.

7 | P a g e
magnitude of indebtedness leading to tremendous fiscal strains faced by the state. This
constitutes the final stage of the circle. This final stage of high indebtedness and fiscal strains
again feeds into the first stage which is the inability to augment or even sustain public and
developmental (plan) expenditure. Thus the vicious circle is complete. This vicious
macroeconomic chain has deepened the fiscal crisis in the state over the two and a half
decades since 1990. (The circular macro-economic chain is be depicted diagrammatically in
Figure-1.)
In the past decade Uttar Pradesh government has come to realise this serious problem that
enshrouds the economy of the state. It has, therefore, taken certain piecemeal measures to
address the macro-economic issues and problems as discussed above. However, political
interests have prevented any concerted efforts to dislodge the vicious circle.
Let us discuss the measures taken by the state government. Though the discussion of all the
policy instruments introduced by the government shall be beyond the scope of this paper, in
order to understand the essence of the efforts made, their limitations and political problems
faced, let us consider one such prominent legislation passed to maintain fiscal discipline in
the state.
UP government passed the Fiscal Responsibility and Budget Management (FRBM) Act, 2004
to rein in the fiscal deficits, public debts, streamline public expenditure and to reduce overall
fiscal strains in the economy. Salient features and aims of the Act are discussed below.
1. FRBM Act aims at ensuring fiscal stability and sustainability; and enhance social as
well as physical infrastructure by augmenting revenue receipts and rationalising
public developmental expenditure. It also lays guidelines for prudent debt
management and greater transparency in fiscal operations.
2. It requires the government to submit before the house every financial year a Medium-
Term Fiscal Reforms Programme Report along with the budget.
3. Specific fiscal targets are set forth on a five-year-rolling basis.
The objectives and the modalities of the Act are laudable. However, fiscal benefits have
eluded the state. The Act was passed in 2004 and since then the governments in power have
8 | P a g e
continued with the populist measures and missed almost every target set each year. The
future also looks bleak.2
In the light of the above discussion one can conclude that the reasons for the fiscal crises
being faced by the state of UP are rooted in the political economy of the state. Unstable
coalition governments or governments of sectarian parties whose electoral interests were tied
to particular social groups along with the adjoining weaknesses like surrendering to pressure
groups and wooing several sections of the population though populist measures. As discussed
in the first segment of this paper, these political trends began to dominate the political
horizons of the state since the beginning of the decade of 1990 when huge mobilisation took
place on religious line in movements such as the ‘Rath Yatra’ and ‘Ram-Janma-Bhumi’, the
brunt of which fell on the growth and developmental prospects of the state. Since then the
political leadership has failed to necessary political commitment and courage to undertake
reform processes and stringent and concerted measures for fiscal consolidation. The solution
to the economic problems faced by the state, according to the argument put forth in this
segment, lies in the political sphere of the state.
III
(Approach II: Locating the causes in the fallouts of neo-liberal reforms of 1990)
In the previous segment we attempted to locate the causes of fiscal crisis within the state
governance and policy itself. However, those causes are not just related to the governance of
the state but also to the wider national policy. It has been observed through the statistics
quoted in the previous segment that the fiscal crisis took the turn for worse only at the
beginning of the reform period. Therefore, this segment shall endeavour to establish a causal
link between neo-liberal policies pursued by the successive central governments and the
fiscal stagnation in the backward states like Uttar Pradesh. We shall examine different aspects
of the post-reform economy and highlight the fallouts on the economy of UP. The basic idea
that runs though the entire argument is that the neo-liberal policies led to fiscal strains in
almost all states but the states that were economically a bit backward were the worst hit.
2 For a detailed discussion on FRBM Act and it consequences on the state economy as well as it future prospects
refer to Economy of Uttar Pradesh Since 1990: Economic Stagnation and Fiscal Crisis by Ajit Kumar Singh
9 | P a g e
UP’s economy is mainly dependent on agriculture. Share of agriculture in the GSDP is about
35% (1999-2000) and agriculture and allied activities absorb about 66% of the state’s
workforce. It has been very well established that agriculture sector has been hit badly due to
the neo-liberal reforms.3 One major reason has been reduced investment in the agricultural
sector in the post liberalisation period. Furthermore, the share of public capital formation in
total capital formation in this sector has fallen from 29.6% to 25.6% in the same period
(Economic Survey 2004-05.) In addition, several policies of the central government have
bitterly affected the agriculture sector. For instance, opening agriculture to international trade,
drying up of agricultural credit and over-emphasis on cash crops during a time period when
the international food prices were decreasing have harmed the economic health of the sector.
As a result, the overall economy of UP which depends squarely on agriculture and allied
activities has suffered setbacks throughout the 1990s.
Stagnation and even deterioration of agriculture, apart from having impact on general
economy of the state, has hit the state’s revenue directly. Though the states are allowed to tax
agricultural income, in case of UP it would have been meaningless since the state is infested
with rural poverty with more than 90% of the agricultural labour force constituted of small
and marginal farmers and landless peasants. This means that at least 36% of the State
Domestic Product is out of the tax net, hugely impacting the revenues receipts of the state.
The general impact of the neo-liberal reforms has been that the inequalities between different
states and within the same state have increased. The states with better industrial base and
better infrastructure have benefitted immensely especially due to the tremendous growth of
the sunrise industries. Poorer states like UP with a meagre industrial and infrastructural base
have got poorer in relation to the states that benefited from the neo-liberal reforms. The
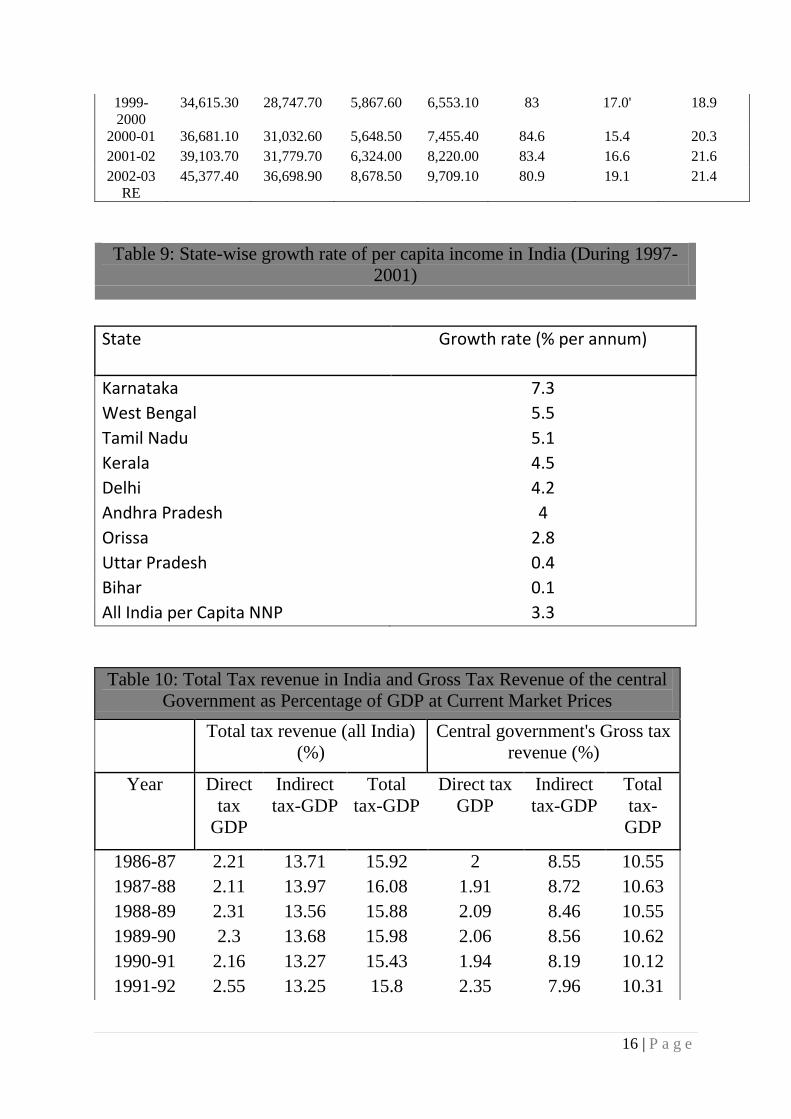
stagnation in growth rate of UP has been already illustrated in Table-1. A comparison with
other states can be demonstrated through Table-9.
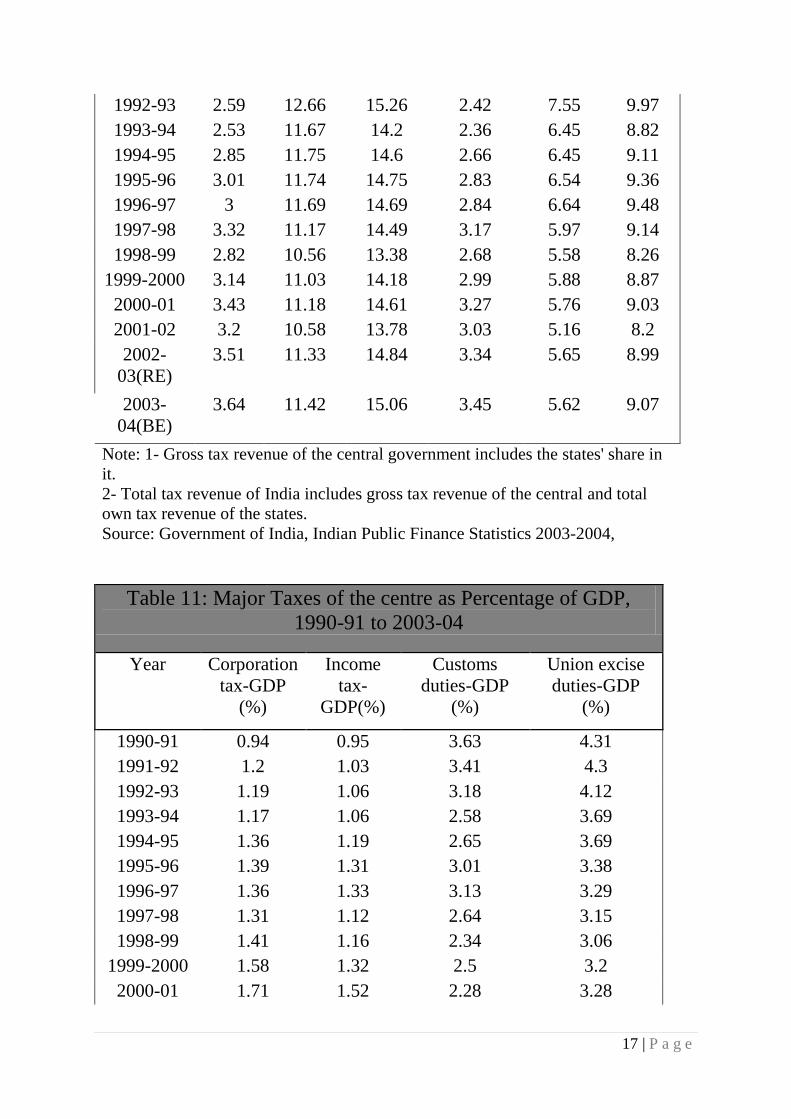
One of the greatest impacts of the neoliberal reforms was felt on the taxation policy of the
central government. In order to attract foreign investors and enthuse domestic investors, the
central government has been moderating it taxation policy, making it more congenial to the
investors. This leniency in taxation policy can be evidently observed through Tables-10 and
11. Prabhat Patnaik has argued that the inability of the government to tap revenue sources is
3 For a detailed discussion refer to Markets that Failed: Neo-Liberal Reforms in India by Jayati Gosh and C.P.
Chandrashekhar
10 | P a g e
directly rooted in the neo-liberal paradigm into which India has entered.4 The entire neo-
liberal psyche is dependent interalia on the plank of attracting foreign capital and wooing
investors and moderate level of taxation is a sine qua non for it. The inability to tap direct tax
sources has forced the central government to follow deflationary economic policies. The
greatest impact of these deflationary measures has been felt by rural India. Reduced
expenditure of the central government in the agriculture sector and its impact on states like
UP which hugely depend on agricultural economy has already been discussed. Taxation
constrains within the neo-liberal paradigm provide yet another justification for that argument.
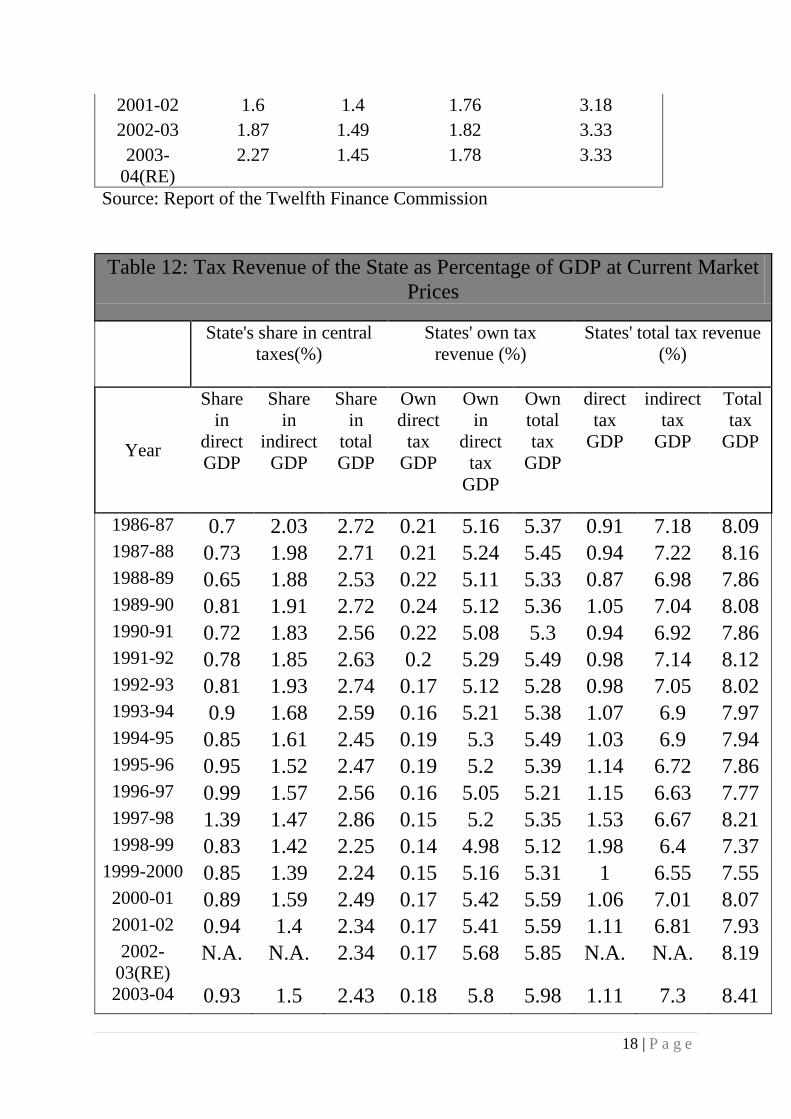
Furthermore, as a result of deflationary policies, the grants to the states have suffered.
Devolution and transfer of finances from the centre to the state has decreased. The interest
rates charged by the centre on the loans given to the states have been hiked. Worst of all, the
Finance Commission has been used by the centre to expand its discretionary powers over
transfer of funds to the states. The reduction in state’s share in central revenues and transfer
of receipts is demonstrated in Table-12.
Another major impact of the neo-liberal policies followed by the centre was seen in the
funding for the Centrally Sponsored Schemes (CSS.) Grants for the CSS have increased
sharply from 26.8% in 1985-86 to 43.4% in 2002-03. Several researchers like Kurian have
pointed out that while the Planning Commission’s or Finance Commission’s transfer to the
states is based on some objective criteria and determined by transparent formulae, this may
not be the case for Centrally Sponsored Schemes.5 They are designed by the central
ministries with stringent directives and guidelines leaving little flexibilities for the state and
scope to innovate according to the conditions of the state. Backward states like UP are at a
disadvantage from such an arrangement because they find it harder to allocate matching
grants under the schemes.6
All the factors discussed till now can be very well connected to the ‘vicious macroeconomic
circle’ that has deepened the fiscal crisis in UP as discussed in the previous section.
Neglected agrarian sector and stagnation of growth in agriculture and allied activities, rising
inequalities, deflationary policies followed by the centre leading to reduced devolution of
receipts to the states, higher interest rates on loans by state governments, huge dependence on
borrowings etc. are all factors that constituted the vicious circle discussed earlier. Hence the
4 Patnaik Prabhat (2004)
5 Kurian (2004)
6 Praveen Jha, Fiscal Strains in the Era of Neo-Liberal Reforms
11 | P a g e
conclusion that can be drawn from the argument is that the reasons for fiscal strains faced by
UP are rooted in the general neo-liberal policies pursued by the centre. In the neo-liberal
politico-economic climate poorer states in general have been pushed to bad fiscal health. UP
being one such relatively poor state has suffered one of the greatest impacts on neo-
liberalism.
IV
(Concluding Remarks)
Let us conclude the paper by summarising the basic findings. The aim of the paper was to
investigate the reasons of economic stagnation and fiscal crises that have hampered the
economy of the state of UP since 1990. The paper started with a brief economic background
of the state locating reasons of backwardness in factors like lopsided benefits of green
revolution leading to east-west inequalities, rising pressure groups, lobbies, interest factions
and social movements which influenced the politico-economic choice and general policy
framework of the state. Then in order to undertake a more detailed investigation we adopted
two different approaches. The first approach focussed on the policy framework of the State
government and situated the reasons for backwardness in the political economy of the state
itself. The second approach took a wider national view and argued that the reasons for
backwardness are rooted in the neo-liberal policies being followed by the centre. As a result
of those policies the relatively poor states have faced the brunt and UP is one of the worst
affected states.
In the light of the discussion the paper seeks to conclude that the two approaches must be
seen in conjunction and complementation to each other as there are several areas where they
overlap. The complementarities have been highlighted in the previous segment where it was
argued that the results of neo-liberal reforms added to the fiscal ill-health caused by the fiscal
indiscipline of the state government. The two factors—impact of neo-liberal reforms and the
policies of the state, have acted in tandem to cause and deepen the fiscal crisis and economic
stagnation in the state of UP over the post reform period.
12 | P a g e
Appendix
Table 1: Compound Annual Growth Rate (CAGR) of Total
and per Capita Income in Uttar Pradesh and India Since 1951
Period CAGR of total
income(%)
CAGR of per capita
income(%)
Uttar
Pradesh
India Uttar
Pradesh
India
1951-56 2.0' 3.6 0.5 1.7
1956-61 1.9 4.0' 0.3 1.9
1961-66 1.6 2.2 -0.2 0.0'
1966-69 0.3 4.0' -1.5 1.8
1969-74 2.3 3.3 0.4 1.1
1974-79 5.7 5.3 3.3 2.9
1981-85 3.9 4.9 1.5 2.7
1985-90 5.7 5.8 3.3 3.6
1990-92 3.1 2.5 1.1 0.4
1992-97 3.2 6.8 1.4 4.9
1997-2002 3.1 5.3 1.0' 3.3
2002-05 3.7 6.7 1.6 4.9
Source: Plan Documents, Government of Uttar Pradesh
Total 2: Revenue and capital expenditure in Uttar Pradesh
(Rs crore) Item 2000-01(BE) % 2006-07(BE) %
Fiscal services pension
and general services
3,018.12 6.04 5,663.07 6.83
Interest payment 8,937.32 17.90' 13,128.06 15.84
Administrative services 4,363.45 8.74 4,560.56 5.5
Of which police 1,829.85 3.66 3,259.51 3.93
Eduction,sports and
culture
5,660.84 11.34 10,842.51 13.09
Health and family
welfare
1,587.27 3.18 4,561.24 5.51
13 | P a g e
Welfare of SC,ST,
backwards,social
wealfare, nutrition
1,630.88 3.27 4,245.76 5.15
Agriculture and allied
activities
1,954.71 3.91 1,996.40 2.41
Rulal development 2,109.66 4.22 2,882.72 3.48
Irrigarion,flood control, 2,538.26 5.08 8,732.25 10.54
Industries,minerals,and
transport
1,584.38 3.17 5,294.55 6.39
Repayment of debts 10,130.16 20.29 13,606.12 16.42
Loan and advances 2,751.56 5.51 785.4 0.95
Compensation and
grants to local bodies
and panchayats
1,096.07 2.20' 2,693.26 3.25
Other expenditure 2,572.36 5.15 3,858.06 4.66
Total 49,935.04 100.00' 82,849.96 100.00'
Table 3: Same Broad features of the Uttar Pradesh Budget
(Rs Crore)
Item 2005-06(RE) 2006-07(BE)
Revenue receipt 46,740.37 56,144.40
Of which own tax revenue 19,787.00 23,483.77
Capital receipt 23,088.38 24,396.07
Total receipt 69,826.75 80,540.47
Revenue expenditure 49,872.37 55,021.23
Capital expenditure 23,596.57 27,828.73
Total expenditure 73,469.34 82,849.96
Capital outlay as % of total
receipts
13.92 16.68
Capital outlay as % of total
expenditure
13.23 16.22
Borrowings 22,581.46 24,008.14
Debt servicing 25,800.46 26,734.18
Own tax revenue as % of revenue
receipts
42.33 41.82
14 | P a g e
Indebtedness as % of state gross
domestic product
49.2 47.09
Borrowings as % of own tax
revenue
114.12 102.02
Indebtedness 126,526.32 137,914.92
Indebtedness as % of state's own
tax revenue
639.4 587.28
Capital outlay 9,717.96 13,437.21
Source: Uttar Pradesh Budget 2006-07
Table 4: Indebtedness of Uttar Pradesh
Year Indebtedness of Uttar
Pradesh
As % of state gross
domestic product
1970-71 943.47 22.17
1980-81 3,817.57 27.2
1990-91 17,966.13 36.3
1995-96 36,144.98 31.2
2000-01 72,765.64 41.9
2003-04 106,407.04 48.9
2004-05 115,209.83 50.2
2005-06 126,526.32 49.2
2006-07 137,914.92 47.9
Source: Uttar pradesh Aaya Vyayak ki Roop Rekha,Uttar Pradesh State
Planning Commission Government of Uttar Pradesh(1999-2007)
Table 6: Outstanding debt to GSDP Ratio for Uttar Pradesh, 1993-94 to
2002-03
in per cent
State 1993-94 1994-95 1995-96 1996-97 1997-98
UP* 26.39 25.98 26.13 25.04 26.67
TAS** 21.54 21.01 20.89 20.88 21.96
1998-99 1999-2000 2000-01 2001-02 2002-03
UP* 29.03 32.79 35.36 37.52 39.08
TAS** 23.27 26.03 28.96 31.54 34.21
Note:* Uttar Pradesh,** Total for all States,Debt excludes reserve funds and
deposits .
Source: Report of the Twelfth Finance Commission.

15 | P a g e
Table 7: Uttar Pradesh's Own Tax Revenue-GSDP Ratio(1985-86to 1997-98)
Year Own tax revenue
(Rs crore)
GSDP at current
prices(Rs crore)
Own tax-GSDP
ratio(%)
1985-86 1,291.40 27,748 4.65
1986-87 1,528.60 30,657 4.99
1987-88 1,988.70 34,352 5.79
1988-89 2,065.70 41,102 5.03
1989-90 2,448.60 46,926 5.02
1990-91 3,162.10 55,506 5.7
1991-92 3,497.40 64,677 5.41
1992-93 3,886.30 70,704 5.5
1993-94 4,132.00 79,481 5.2
1994-95 4,878.30 90,267 5.4
1995-96 5,468.90 101,519 5.39
1996-97 6,306.00 117,975 5.35
1997-98 6,998.00 129,977 5.38
Source: Calculated from data on state budgets in RBI,Handbook of finances
of the states 2004
Table 8: Increasing Proportion of interest payments in Uttar Pradesh's Total
Expenditure
Year UP's total
expenditure
(Rs crore)
UP's
revenue
expenditure
(Rs crore)
UP's
capital
expenditure
(Rs crore)
UP's
interest
payments
(Rs
crore)
Revenue
expenditure
as % of
total
expenditure
Capital
expenditure
as % of
total
expenditure
Interest
payments as
% of total
expenditure
1985-86 5,331.10 3,702.30 1,628.80 321.3 69.4 30.6 6.0'
1986-87 6,225.40 4,349.20 1,876.20 542.7 69.9 30.1 8.7
1987-88 6,900.80 5,079.90 1,820.90 693.8 73.6 26.4 10.1
1988-89 8,078.80 6,256.80 1,822.00 814.6 77.4 22.6 10.1
1989-90 9,336.70 7654.10' 1,982.60 1,041.90 79.4 20.6 10.8
1990-91 12,240.30 9,538.50 2,701.80 1,278.90 77.9 22.1 10.4
1991-92 13,246.10 10,399.20 2,846.90 1,710.30 78.5 21.5 12.9
1992-93 16,135.30 12,690.70 3,440.60 2,041.60 78.7 21.3 12.7
1993-94 16,275.30 12,280.10 2,995.20 2,111.10 81.6 18.4 13
1994-95 21,061.90 15,396.00 5,665.90 3,088.60 73.1 26.9 14.7
1995-96 20,787.00 17,555.80 3,231.20 3,324.90 84.5 15.5 16
1996-97 23,016.70 19,260.70 3,809.00 4,061.00 83.5 16.5 17.6
1997-98 26,625.50 22,195.00 4,430.50 4,689.30 82.4 16.6 17.6
1998-99 31,462.40 26,074.90 5,387.50 5,516.60 82.9 17.1 17.5
16 | P a g e
1999-
2000 34,615.30 28,747.70 5,867.60 6,553.10 83 17.0' 18.9
2000-01 36,681.10 31,032.60 5,648.50 7,455.40 84.6 15.4 20.3
2001-02 39,103.70 31,779.70 6,324.00 8,220.00 83.4 16.6 21.6
2002-03
RE 45,377.40 36,698.90 8,678.50 9,709.10 80.9 19.1 21.4
Table 9: State-wise growth rate of per capita income in India (During 1997-
2001)
State Growth rate (% per annum)
Karnataka 7.3
West Bengal 5.5
Tamil Nadu 5.1
Kerala 4.5
Delhi 4.2
Andhra Pradesh 4
Orissa 2.8
Uttar Pradesh 0.4
Bihar 0.1
All India per Capita NNP 3.3
Table 10: Total Tax revenue in India and Gross Tax Revenue of the central
Government as Percentage of GDP at Current Market Prices
Total tax revenue (all India)
(%)
Central government's Gross tax
revenue (%)
Year Direct
tax
GDP
Indirect
tax-GDP
Total
tax-GDP
Direct tax
GDP
Indirect
tax-GDP
Total
tax-
GDP
1986-87 2.21 13.71 15.92 2 8.55 10.55
1987-88 2.11 13.97 16.08 1.91 8.72 10.63
1988-89 2.31 13.56 15.88 2.09 8.46 10.55
1989-90 2.3 13.68 15.98 2.06 8.56 10.62
1990-91 2.16 13.27 15.43 1.94 8.19 10.12
1991-92 2.55 13.25 15.8 2.35 7.96 10.31
17 | P a g e
1992-93 2.59 12.66 15.26 2.42 7.55 9.97
1993-94 2.53 11.67 14.2 2.36 6.45 8.82
1994-95 2.85 11.75 14.6 2.66 6.45 9.11
1995-96 3.01 11.74 14.75 2.83 6.54 9.36
1996-97 3 11.69 14.69 2.84 6.64 9.48
1997-98 3.32 11.17 14.49 3.17 5.97 9.14
1998-99 2.82 10.56 13.38 2.68 5.58 8.26
1999-2000 3.14 11.03 14.18 2.99 5.88 8.87
2000-01 3.43 11.18 14.61 3.27 5.76 9.03
2001-02 3.2 10.58 13.78 3.03 5.16 8.2
2002-
03(RE)
3.51 11.33 14.84 3.34 5.65 8.99
2003-
04(BE)
3.64 11.42 15.06 3.45 5.62 9.07
Note: 1- Gross tax revenue of the central government includes the states' share in
it.
2- Total tax revenue of India includes gross tax revenue of the central and total
own tax revenue of the states.
Source: Government of India, Indian Public Finance Statistics 2003-2004,
Table 11: Major Taxes of the centre as Percentage of GDP,
1990-91 to 2003-04
Year Corporation
tax-GDP
(%)
Income
tax-
GDP(%)
Customs
duties-GDP
(%)
Union excise
duties-GDP
(%)
1990-91 0.94 0.95 3.63 4.31
1991-92 1.2 1.03 3.41 4.3
1992-93 1.19 1.06 3.18 4.12
1993-94 1.17 1.06 2.58 3.69
1994-95 1.36 1.19 2.65 3.69
1995-96 1.39 1.31 3.01 3.38
1996-97 1.36 1.33 3.13 3.29
1997-98 1.31 1.12 2.64 3.15
1998-99 1.41 1.16 2.34 3.06
1999-2000 1.58 1.32 2.5 3.2
2000-01 1.71 1.52 2.28 3.28
18 | P a g e
2001-02 1.6 1.4 1.76 3.18
2002-03 1.87 1.49 1.82 3.33
2003-
04(RE)
2.27 1.45 1.78 3.33
Source: Report of the Twelfth Finance Commission
Table 12: Tax Revenue of the State as Percentage of GDP at Current Market
Prices
State's share in central
taxes(%)
States' own tax
revenue (%)
States' total tax revenue
(%)
Year
Share
in
direct
GDP
Share
in
indirect
GDP
Share
in
total
GDP
Own
direct
tax
GDP
Own
in
direct
tax
GDP
Own
total
tax
GDP
direct
tax
GDP
indirect
tax
GDP
Total
tax
GDP
1986-87 0.7 2.03 2.72 0.21 5.16 5.37 0.91 7.18 8.09
1987-88 0.73 1.98 2.71 0.21 5.24 5.45 0.94 7.22 8.16
1988-89 0.65 1.88 2.53 0.22 5.11 5.33 0.87 6.98 7.86
1989-90 0.81 1.91 2.72 0.24 5.12 5.36 1.05 7.04 8.08
1990-91 0.72 1.83 2.56 0.22 5.08 5.3 0.94 6.92 7.86
1991-92 0.78 1.85 2.63 0.2 5.29 5.49 0.98 7.14 8.12
1992-93 0.81 1.93 2.74 0.17 5.12 5.28 0.98 7.05 8.02
1993-94 0.9 1.68 2.59 0.16 5.21 5.38 1.07 6.9 7.97
1994-95 0.85 1.61 2.45 0.19 5.3 5.49 1.03 6.9 7.94
1995-96 0.95 1.52 2.47 0.19 5.2 5.39 1.14 6.72 7.86
1996-97 0.99 1.57 2.56 0.16 5.05 5.21 1.15 6.63 7.77
1997-98 1.39 1.47 2.86 0.15 5.2 5.35 1.53 6.67 8.21
1998-99 0.83 1.42 2.25 0.14 4.98 5.12 1.98 6.4 7.37
1999-2000 0.85 1.39 2.24 0.15 5.16 5.31 1 6.55 7.55
2000-01 0.89 1.59 2.49 0.17 5.42 5.59 1.06 7.01 8.07
2001-02 0.94 1.4 2.34 0.17 5.41 5.59 1.11 6.81 7.93
2002-
03(RE) N.A. N.A. 2.34 0.17 5.68 5.85 N.A. N.A. 8.19
2003-04 0.93 1.5 2.43 0.18 5.8 5.98 1.11 7.3 8.41

19 | P a g e