
The Economic Potential of Small Towns in the Eastern Cape ...
192
" The Economic Potential of Small Towns in the Eastern Cape Midlands A thesis submitted in fu lfilment of the Requirements for the degree of MASTER OF ECONOMICS at RHODES UNIVERSITY by Kian Andrew Reynolds December 2008
-
Upload
khangminh22 -
Category
Documents
-
view
0 -
download
0
Transcript of The Economic Potential of Small Towns in the Eastern Cape ...

"
The Economic Potential of Small Towns in the Eastern Cape
Midlands
A thesis submitted in fulfilment of the
Requirements for the degree of
MASTER OF ECONOMICS
at
RHODES UNIVERSITY
by
Kian Andrew Reynolds
December 2008

Acknowledgements
I would like to thank the various people for their assistance with the work:
Professor G. Antrobus, Department of Economics and Economic History Rhodes
University who supervised the project.
Professor E. Nel, Department of Geography Rhodes University who co-supervised the
project.
I acknowledge that all references are accurately recorded and, that unless othenvise
stated, all work herein is my own. I also certify that this thesis has not been
submitted for a degree at any other University.
Kian Reynolds
December 2008
The financial assistance received from the National Research Foundation
for the purposes of the research is acknowledged. Opinions expressed and
conclusions arrived at are that of the author and do not necessarily reflect
the views taken by the National Research Foundation.
ii

Abstract
Small town economic decline has been experienced in many countries across the globe and
can be explained through Geographical Economics, particularly the New Economic
Geography, which suggests that agglomeration occurs as a natural outcome of high
transportation and transactional costs. Yet despite the economic rationale behind their
decline it is not an economic inevitability and there is evidence of towns in the United States,
New Zealand and Canada that have reversed their economic fortunes. [n South Africa
approximately 5 million people live in the 500 small towns and many more live in their rural
hinterlands where povelty levels are extremely high within a national context. Within this
context the thesis examines the current economic status and potential growth prospects of
small towns in the Eastern Cape Midlands in South Africa in order to identify critical growth
dri vers within small town economies.
Five small towns were selected for the study via means of a purposive sample and were
subjected to two regional modelling techniques, namely Shift-Share Analysis and Economic
Base Theory to detelmine their current economic trends and past growth patterns, while a
Social Accounting Matrix was utilised to identify important sectoral linkages, potential
avenues for growth and evident leakages within small town economies.
The sampled towns experienced negative economic growth trends between 1996 and
200 I, the primary loss in employment being accounted for by regional economic changes
as opposed to national or industrial trends. The decline was more severely felt in
primary/industrial sectors of the economy; evidence was found that manufacturing
activities declined in all of the centres, despite the industry growing nationally. The
Social Accounting Matrix highlighted strong links between the agricultural and services
sectors within the national economy. Thus, considering that agriculture was identified as
the primary economic driver within the region and the services sector the largest
employer in all of the towns it is evident that the economic potential of the towns is to a
certain extent linked to the success of agriculture in their hinterlands.
Seven growth drivers, namely size, local economic development, existing markets, existing
industries, infrastructure, municipal leadership and local entrepreneurs and were linked via
III

means of a scoring framework to the sampled towns' economic potential. Whilst the results
of actually determining a towns economic potential are not definitive the study does
provide useful insights about the impact and potential role played by these drivers. Linked
to this scoring framework and to Cook's (1971) hierarchy of places in the Eastern Cape
Midlands four categories of towns were identified in the commercial falming areas and
recommendations were made about appropriate developmental interventions at a municipal
level, such as the need to retain local entrepreneurs and to invest in social amenities.
Considering the evident need for development in rural areas the study provides critical
insights into how to prioritise development strategies within small rural towns in
commercial farming areas. In addition it would enable municipalities to critically reflect on
their municipal Local Economic Development strategies and the relevance within the
context of small towns.
iv

, ' I ' ..
"J
Contents Page
Contents Page .............................................................................................. ............ v
List of Tables .. , .... , ........ , , .. , ...... ,., .... , ............................... , ............................. ......... viii
List of Figures .......................................................................................................... x
Chapter 1 Context and Aims of the Study ....................................................... 1
I, I Aims of the study and an overview of the methodology"""."""".""",,,,, 2
1.2 The Eastem Cape .""""""""""."""""" """ .,, """" ,,.,,"""""" ,, .... ,,"""" 4
1.3 Survey of the Eastern Cape Midlands in the 1960s "",,",,",",""", .. ,,'''''' 12
1.4 Justification for study and the focus area " ."."""""""".".,,"" " ,, ... ,,""'" 13
1.5 Conclusion"",,,,,,,,,,,,,,,,,,,,, """"""""'"''''''''''''''''''''''''' ' ''".".,,''''''''''''' 16
Chapter 2 Literature Review .......................................................................... 17
2. I Definition of a Small Town""""""""""""""""."""" "".".,,""",,"""'" I 7
2.2 International trends regarding Small Towns"""""""."""."""""""."",,, 18
2.3 Trends in South African Small Towns """""".""""."""".".".""""""", 19
2.4 Regional Economics and Location Theory""""""""".".""".""".".""." 22
2.4.1 Regional Economics and the New Economic Geography_ . . ....... 22
2.4 .2 Location Theory... ....... ....... ................ . ...................................................... 26
2,5 Implications for Development"".""""""""""""".""."""".""""""""" 29 2.5.1 Current policy and views on small town development ... ............................. .......... 30
2.5.2 The role of small towns in rural development ..
2.S.3 Potential groy,1h opportunities .. .
.. ...... ... ) (
.. ........ ) )
2.5.4 Views regarding ass istance to Small towns .. .......................... ...34
2,6 Conclusion. " ...... " .. . " ...... " "", .. ,," , .. ,,""'" "" ........... ". " ,,, .. ,, ,,, .. ,, "" ..... , .. 35
Chapter 3 An Economic History of five small Eastern Cape Towns .............. 36
3. 1 Origins of the towns "."""""""" ... """." .. " .... " ""."" .. "", .. """",, ... ,,,, .,, 36
3. 1.1
) , l.2
) .U
Agricultural backgrounds .......................... ............. ................ ... ............... ........... 36
Military towns ..... ... ... ....... ............. .
Church Towns ...
" ...... ) 7
... ... . ) 8
3.2 Socio-economic characteristics ... .......... ....... ........ .................. ................. 39
3.3 Past Economic Indicators ...... ... " ...... " ... " ..... . " "" .. "." ." ................ ,, ....... 44
3.4 Conclusion ", ...... "'" .. ,,, ." .... "." .... , .. ,,, .. ,' , .. , .. " " .. " ... " ...... " .. ..... ". '" , .. , , ... 49
v

Chapter 4 Analytical Methodology ............................... .................................. 50
4.1 Regional Economic Models .............................. ...................................... 50
4.1.1 Economic Base Theory ... .. .. ........................ ....... 50
4.1.2 Shift-Share Analysis ... . .. ....... .. ... 54
4.1.3 Input-Output Models .. . ... . 56
4.1 .4 Gravity Models ... . .. .. ...... . 58
4.1.5 Econometric Models . .......... ................. ........................... .... ... ......... ............ .. ... 59
4.1.6 Social Accounting Matrixes (SAMs).... . . .......................... .... 60
4.1.7 Computable Generated Equilibriwn (CGE) .. ................ ....... ... .. ... .. ...... .... ....... 63
4.2 Models applicable for Small Towns in South Africa ................ ....... ........ 64
4.3 Conclusion ............................................................................................. 65
Chapter 5 Analysis of towns using Shift-Share Analysis, Economic Base Theory
and a Social Accounting Matrix ............................................................................ 66
5.1 Data sets utilised: 1996 and 200 I censuses ............................................. 66
5.2 General Overview of the Towns' Economic Environment ....... ............... 68
5.3 Shift-Sbare Analysis ................ ........ .................... .. ...... ......... .................. 69
5.4 Economic Base Theory and Location Quotient Analysis .......... ... ............ 81
5.5 Social Accounting Matrix ............................................................... ........ 90
5.6 Conclusion ...... ... ........ ............. .......... .. ....... ... ................... ........... .. ......... 93
Chapter 6 Local economic development and private entrepreneurial activities94
6.1 Structured Interviews ............................................................................. 94
6.2 Local Economic Development (LED) ..................................................... 97
6.1 .1 LED Studies .......... ............................ .......... ......... ................ ... ..... ..... ........ .. ..... .... 97
6.1.2 LED goals and strategies within the towns .. . .. 100
6.3 Private business and entrepreneurial activities ......................... ............. 109
6.3.1 Cradock .. . ...... .... .... 109
6.3 .2 Bedford .. . . ... ..... ... 11 0
6.3 .3 Somerset·East and Pearston .. . . .... 111
6.3.4 Grahamstown .. . 112
6.4 Conclusion .................................................. .. ............... .. ................. ..... 113
7 Trends and Growth Drivers ........................................................................ 114
7.1 Identification of trends .... ..................................................................... 114
7.1.1 Decrease in the economic vitality of the sampled towns .. ...... 114
7.1 .2 Rural linkages .. .......... .. ... ........... ... ......... ...... ........ .... ..... .... ............ ............... ...... 11 4
7.1.3 Potent ial for tourism, and lifestyle changes .. ....... ... .......... ........................ .. ....... .. 11 5
7.2 Growth Drivers and Inhibitors ........................................ ... ............. ...... 116
vi

7.2.1 Size .. . 116
7.2.2 Location and Infrastructure ..... .. ......... ..................... ..... .... .... .... ............ ........ ....... 117
7.2.3 Local Leadership .. . ........ ........................... 119
7.2.4 Established Industries .. . ..... ..... .. ...... .................... . 120
7.2.5 Macroeconomic and other variables .. . .... ...... 122
7.3 Detelmination of the towns' economic potential. .... ........ ......... .. ...... ..... 123
7.3. [ Grahamstown ...... ...... .... .. ....... ....... ......... .. ..... ...... ..... .......... ............. .................. 123
7.3.2 Somerset East .. . .. ...... ....... ..... ... .. ... 124
7.3 .3 Cradock .. . . .................... ........... ........... IN
7.3.4 Bedford .. . ... . .... ...... .. ........... ...... ........... ..... ...................... . .... ... .. 125
7.3.5 Pearston . 126
7.4 Importance of growth drivers ................................................................ 126
8 Conclusion .................................................................................................... 128
References ............................................................................................................ 133
Appendixes ........................................................................................................... 146
vii

List of Tables
Table 1.2.1 Population by race within the Eastern Capc Province, 2001... .............................. 5
Table 1.2.2 Employment and unemployment by province, 2002 ..... .. ..... ................................. 6
Table 1.2.3 Human Dcvclopment Index by Province, 1980, 1991 and 1996 ............................ 7
Table 1.2.4 Human Development Index; Projections by Province ........................................... 8
Table 1.2.5 Poverty Levels: Percentage ofpcoplc living in poverty by province and race, 2001
................................................................................................................................ 9
Table 1.4.1 Hierarchy of Towns in the Eastern Cape Midlands, 1970 ................................... . 14
Table 3.2.1 Population of sampled towns, 1930 to 200 I, selected years ............................... . 39
Table 3.2.2 Number of Manufacturers, 1890 to 1991 .................... .................. .................... .. .41
Table 3.2.3 Total number of businesses 1930-1 980 ............ .. ........ .......................................... 42
Table 3.3.1 Employment in terms of economic sector 1980 - 199 1 ...................................... .45
Table 3.3.2 Percentage contribution to Gross Geographic Product by economic sector 1970-
1991 .............................. ........................................................................................ 46
Table 3.3.1 Percentage contribution of Agriculture to Gross Geographic Product, measured at
factor cost .... ..... ....................... .................. ..................................................... ..... 48
Table 4.1.1 Fragment oflnput output table ................. .......... ....... ... .................. ......... ............. 57
Table 5.2.1 Employment Figures 1996 and 2001 ............................. ......... .......... .................. 69
Table 5.3.1 Shift-Share Analysis; ident ification of the components of employment change in
relation to national employment figures 1996 - 200 I .......................................... 71
Table 5.3.2 Shift-Share Analysis; identification of the components of employment change in
relation to the Eastem Cape employment figures 1996 - 200 1 ............................ 74
Table 5.3.3 Shift-Share Analysis, conducted on employment by occupation data; 1996 to 2001,
using national employment figures ................ , ................... .. ................................ 79
Table 5.4.1 LQs oflnduslrit:s within Towns using National Employment data .................... 83
Table 5.4.2 LQs ofIndustries within Towns using Provincial Employment data ................... 84
Table 5.4.3 Economic base, by sector, using national employment figures .......................... .. 87
Table 5.4.4 Agricultural LQs oflocal municipalities, 1996 and 2001 .................................... 89
Table 6.1.1 Structured interviews conducted ............ ...... .. , .................... ...... .................. ..... .... 95
Table 6.2.1 LED objectives by Municipality .............................................. ... ...... ...... ........... 101
Table 6.2.2.1 LED Projects initiated in Cradock ........ ...................... ............... .......... ... ......... 103
Table 6.2.2.2 LED Projects initiated in Bedford .............................. ........... .......................... 104
Table 6.2.2.3 LED Projects init iated in Pearston ................................................................... 106
Table 6.2.2.4 LED Projects initiated in Somerset Eas!.. ................................... ....... ...... ........ 107
viii

Table 6.2.2.5 LED Projects initiated in Grahamstown ........................................................ .. 108
Table 7.1.4.1 Impact of students on the Graharnstown Economy ............................ ............. 121
Table 7.4 Ranking of Growth Drivers in the towns .......................................... ................ 127
Table 8.1 Categories of towns ........................................................................................... 130
ix

List of Figures
Figure 1.2. 1 Map of South Africa ................................................... ....................... ..... ............. 4
Figure 1.2.2 Gross Geographic Product by sector: Eastem Cape .... ...... ..... .................... ...... .. .. 9
Figure 1.2.3 Employment by Race and Industry 200 I: Eastern Cape .................................... 10
Figure] .2.4 Municipal Employment figures as a percentage of provincial employment,
2001 ................. .... ............ ... ............ ... ........ ...... . ......... . ........ ..... II
Figure 1.2.5 Contribution of municipalities to provincial nominal value added .. . ... .. ,_ ...... 11
Figure 2.4.1 Implications of the NEG model where there is labour mobility ........ ................. 25
Figure 3.2. 1 Graphic illustration of the populations, 1930 to 2001, selected years (not to scale)
................................... ... ............................................... ......................................... 40
Figure 3.3. 1 Total GGP at fac tor cost and constant 1985 prices .......................... .... .............. 44
Figure 5.1 Town population as a percentage ofMunicipai population ............... . ........... 68
Figure 5.4. 1 'Export type' employees as a percentage of total employment.. ......................... 88
x

Chapter 1 Context and Aims of the Study
There is a tide in the affairs of men
Which taken at the flood, leads on to fortune;
Omitted, all the voyage of their li/e
Is bound in shallows and in miseries
On such afull sea we are now afloat,
And we must take the current where it serves
,Or lose our ventures
(Brutus in William Shakespeare's Julius Caesar, Act 4, Scene 3: 817)
Internationally, numerous small towns have exhibited a general decrease in population
and a loss of economic vitality. For example, "Small town Australia is certainly at a
crossroads. Many small inland and remote inland communities continue to haemorrhage
in terms of population and business loss. This decline is not new, but has intensified over
the last two decades. Mean age continues to rise, while the 15-24 age group contracts
dramatically. Such a situation is not uniquely Australian. Similarities can be seen in rural
communities of Midwest USA, New Zealand and South Africa" (Kenyon and Black,
200 I: 1). Thus there is emerging international evidence that the 'economic tide' does
seem to be turning away from small towns.
Small towns in South Aft'ica contain approximately 3.3 million people - around 8% of the
country's population - whilst approximately 75% of the country's poor live in rural areas,
most often the hinterlands surrounding small urban areas (eDE, 1996: 1). Thus, it is
evident that these towns play an important role in the social well-being of the nation, not
just in terms of hosting not inconsiderable numbers and population, but also in tenns of
being service centres and providers of social services for their hinterlands. In addition, in
sharp contrast to demographic trends in other countries, "Small (owns (with populations
between 5 000 - 100 000) are becoming increasingly important in South Africa due to
rapid urbanisation" (Atkinson and Zingel, 2004: I ), as their populations appear to be
rising. In this regard it is apparent that the international trend of population decline in
small towns does not seem to hold and that they, along with the cities, are growing in
demographic terms.

Geographical economics literature suggests that agglomeration forces are the pnmary
cause behind the decline economy smaller centres across the globe (Brakman and
Ganetsen, 2005: 5). Is the ' tide turning' away from the sustainability of rural towns, or is
it merely a temporary change that can be reversed by intuitive and well directed
intervention? Should they be assisted from an equity perspective, or is it possible to
stimulate growth and development within the countly through them?
1.1 Aims of the study and an overview of the methodology
The major aim of this thesis is to examine the cunent economic status and potential
economic growth prospects of selected small towns in the Eastern Cape Midlands and
through this to detelmine the extent to which current trends can be manipulated by
policies trying to stimulate economic growth. In addition the thesis sets out to identify
growth dri vers within small town economies and to assess to what extent they impact
upon a towns development.
In order to achieve the primary goal there are also several sub-aims/objectives. These are
to determine past and current economic trends in the sampled towns as well as the nature
of these economies and secondly, to identify growth drivers and other economic
opportunities, which could be harnessed to stimulate economic growth.
An earlier study by Cook (197 1) into the Eastern Cape Interior or Midlands helped guide
the topic selection as it identified the area as one which is unique and hence worthy of
study, in addition her work provided useful comparative data. Other factors guiding the
selection of the study area was the fact that the Eastern Cape is one of the poorest p",1s of
the country, and it is predominantly a rural province, having a significant number of well
established small towns within it, which are critical to social welf",·e. The latter reason
further justifies an examination of possible local development alternatives designed to
respond to shortfalls. A review of the economic structure of the province is presented
later in the chapter, in section 1.2. Five small towns within the Eastern Cape Midlands
were selected to be studied in detail, namely Cradock, Bedford, Somerset-East, Pearston
and Grahamstown. A full justification for their selection is provided later in the thesis.
2

In order to accomplish the aims and objectives of the thesis, a number of different
research techniques were used. Firstly, historical evidence relating to the five towns was
gathered from various sources. The data provided information on past economic trends
and revealed each town's strengths and limitations, which proved valuable when
assessing their economic potential.
To determine current economic trends in the five towns, data from the population
censuses in 1996 and 2001 was used and was subj ected to two regional modelling
techniques namely Shift-Share and Location Quotient i analysis. In addition, a Social
Accounting Matrix (SAM) was utilised to examine important sectoral linkages. The
findings were also supplemented by structured interviews conducted with relevant
stakeholders in the respective towns.
To assess current Local Economic Development (LED) infOlmation was collected though
Municipal Integrated Development Plans (lOPs) and through structured interviews. Once
all the LED strategies were known it became possible to evaluate their effectiveness in
terms of both their employment and growth creation capabilities as well as their ability to
satisfy their intended objectives. However, knowledge of past and current economic
trends as well as LED projects still does not allow for the complete assessment of the
economic potential of a region. It was thus necessary to identify and review other
economic growth dri vers and inhibitors within the towns and to evaluate their impacts.
In order to evaluate a town it is first necessary to review the context of its location.
Towns located in different areas and regions face vastly different challenges. " In the
modem era, which is characterised by enhanced intemationalisation and competition
between places as opposed to nations, small towns are increasingly being recognised as
unique entities which need to be identified and assessed in their own right" (Nel, 1996:
7). Thus, the remainder of the chapter presents the demographic and economic situation
within the Eastern Cape and the settlements within the province as a starting point to the
study. A more detailed justification for the study is also provided.
Chapter 2 reviews the existing literature on small towns and the economic literature
regarding location theory and geographical economics, which was deemed pertinent to
I Chapter 3 reviews the methodology of the two techniques in greater detail
3

this study. Chapter 3 provides greater detail on the methodology of the study and
provides insights into the analytical tools used, whilst chapter 4 reviews the selected
towns' history and past economic trends. Current economic trends are detailed in Chapter
5. LED initiatives of both the municipalities and private stakeholders are reviewed in
Chapter 6, whilst growth drivers and inhibitors are identified in Chapter 7, which also
attempts to determine the towns' economic potential. The conclusion of the study is
presented in Chapter 8.
1.2 The Eastern Cape
The Eastern Cape is situated in the south eastern parts of the Republic of South Africa. It
is the second largest province geographically with a surface area of 170 600 km2. Only
4.3% of this land is cultivated (DSSA, 2004: I), largely because substantial parts of the
province could be classified as semi-arid. However, the coastal belt is well suited to
pineapple production and the inland areas are more suited to animal fann ing including
angora goats, sheep and cattle (DSSA, 2004: I). Figure l.2.1 illustrates the province in
relation to the other provinces in South Africa.
SOUT h.;.\.,.r~IC - PHOV'"I C L S
Figure 1.2.1 Map of South Africa
Source: ANC, 2006
, JOlAN OCt:.AN
4
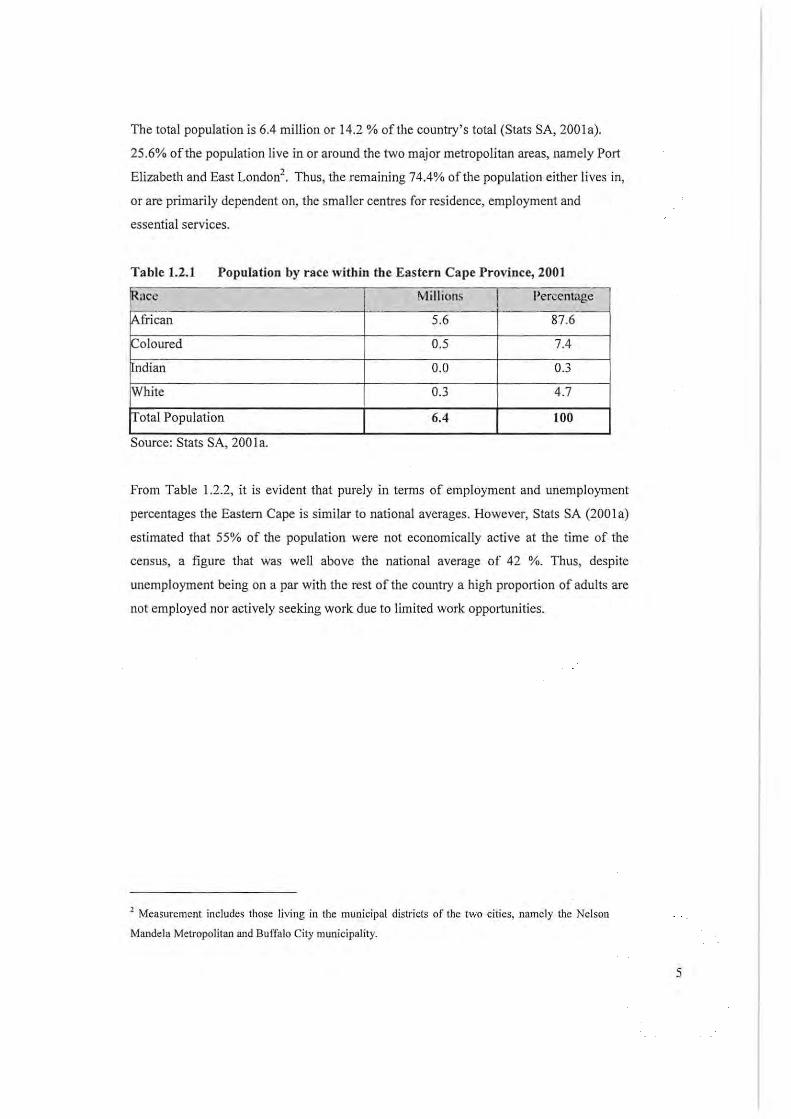
The total populat ion is 6.4 million or 14.2 % of the country's total (Stats SA, 2001a).
25 .6% of the population live in or around the two major metropolitan areas, namely Port
Elizabeth and East London'. Thus, the remaining 74.4% of the population either lives in,
or are primarily dependent on, the smaller centres for residence, employment and
essential services.
Table 1.2.1 Population by race within the Eastern Cape Province, 2001
Rac" Millions ! I'ercentage
African 5.6 87.6
Coloured 0.5 7.4
ndian 0.0 0.3
White 0.3 4.7
otal Population 6.4 100
Source: Stats SA, 200 I a.
From Table 1.2.2, it is evident that purely in terms of employment and unemployment
percentages the Eastem Cape is similar to national averages. However, Stats SA (200 1a)
estimated that 55% of the population were not economically active at the time of the
census, a fi gure that was well above the national average of 42 %. Thus, despite
unemployment being on a par with the rest of the country a high propOltion of adul ts are
not employed nor actively seeking work due to limited work opportunities.
2 Measurement in cludes those living in the municipal districts of the two cities, namely the Nelson
Mandela Metropolitan and Buffalo City municipality.
5

Table 1.2.2 Employment and unemployment by province, 2002
l'nwlnC'C' I:.mplo) cd Iinemplo) ;.>d Unemplo:- t,'d °0 UII~mpl('l)mcnt o oUnl'mployml'nt
(tuill j,' ns) (Stru:t) ( I:"pandcd) (If h \P3 {If I· .\ f'
(milhtm!. 1 (nli lli I1l1~) ( '(ricl) (h-pandcd)
E-Ca pe 1.6 0.6 1.1 28.1 39.2
IFr~e SWle 0.8 0.4 0.5 33.5 40.9
Gall tc llg 2.8 1.0 1.5 27.0 35.6
!KZN 2.0 1.0 1.8 34.3 46.7
Li mpopo 0.9 0.5 1. 1 36.7 55 .1
Mpllm:l lal1ga 0.8 0.3 0.5 29.8 41.7
lNorth West 0.8 0.4 0.7 30.7 46.3
N-Cape 0.2 0.1 0.2 30.0 41.0
\V-Cape 1.5 0.4 0.5 18.6 25.5
fSo ulh Africa 11.4 4.7 7.8 29.4 40.9
Source: Stats SA, 2002 10 SAIRR, 2003: 142
A more suitable indicator may be the Human Development Index (HOI) which
"summarises a great deal of social performance in a single composite index combin ing
three indicators - longevity (a proxy for health and nutrition), education and living
standards" (Nafziger, 1997: 30). Table 1.2.3 indicates the changing HOI levels between
1980 and 1996, for South Africa by province.
3 Economically Active Population
6

Table 1.2.3 Human Development Index by Province, 1980, 1991 and 19964
1980 1991 1996 % Increase
1980-1996
~-Calle 0.42 0.51 0.62 52.4
ree State 0.42 0.66 0.67 19.6
~autcng 0.63 0.82 0.77 22.2
~ZN 0.49 0.6 0.66 34.7
,...impopo 0.37 0.47 0.63 70.3
Mpllmalan(l.a 0.51 0.69 0.66 29.4
NorIh lVest 0.48 0.54 0.61 27.1
IV-C"p" 0.64 0.83 0.76 23.6
/'i-Cape 0.55 0.7 0.68 18.8
South Afrie.a 0.56 0.68 0.69 23.2
Source: SA!RR, 2003: 24
From Table 1.2.3 it is evident that despite recent improvements, the Eastern Cape is one
of the worst off provinces, with an average lID! of 0.62 in 1996, the second lowest of all
the provinces in the country, and below the national average of 0.69. However, what is
noticeable is the improvement from 1980 to 1996, with an increase of 52.4%. Table 1.2.4
provides a projection of the HD! figures of all provinces for 20 I 0 and indicates the
immense impact that HIV/AIDS will have. This is imp0l1ant because it is unlikely that
the 1996 HOI figures would have been fully reflective of the pandemic. The table
illustrates that the HDI figure in 2010 in the Eastern Cape might be only 0.493, which is a
major drop, accounted for by the impact of HIV/AIDS. It is also important to note that
both measures were calculated with different weightings which accounts for the
difference between the two measures.
4 Numbers have been rounded
7

Table 1.2.4 Human Development Index; Projections by Provinces
HDI 1996 HDI2010 HDI2010
with AIDS without AIOS
f-Cape 0.643 0.493 0.608
Free Stall.' 0.671 0.548 0.662
Galltell!;. 0.771 0.621 0.722
"z~ 0.658 0.498 0.614 c--c-._--
LimpI)lh) 0.629 0.431 0.544
f\lpUlnal::mga 0.657 0.522 0.64
Nurth \\\:st 0.679 0.567 0.644
---:-c w- upe 0.608 0.527 0.642
. N-Cap< 0.762 0.659 0.714
! South \frir.a 0.688 0.542 0.654
Source: Health Systems Trust, 2007
Fundamental inequalities, in terms of social and economic variables, also exist within the
province. Nel (1999: 67) indicated that these have been evident since colonial days,
initiated by the early territorial separation of the races, and the economic suppression of
the Xhosa tribe. These inequalities are illustrated in Table 1.2.5, which shows the
proportion of people living in poverty by race and by province. The disparities are clearly
evident with 75% of Africans living in poverty, compared to the 5% of whites and 24%
of coloureds. The table also indicates that 68% of the total population live in poverty,
which is well above the national average of 49%, which highlights the evident
developmental backlog and need for development and economic growth.
S Calculations were conducted in a slightly different manner to that of SAIRR figures and are thus not
directly comparable.
8

Table 1.2.5 Poverty Levels: Percentage of people living in poverty by province and
race, 2001
r~ African Indian Coloured White Total
,-Cape 75 9 24 5 68 ---~------
ree State 61 3 24 5 53
p autcng 38 7 13 3 28
~N 63 8 14 3 54 r-.-\LImpopo 65 6 22 4 64
Mpumalanga ' 59 6 19 5 54
!North West 60 9 29 6 56 jN:- ----- ------- ~
-Cape 67 10 38 5 43
IW~Cape ----
47 10 17 4 21
lSouth Afr ica 60 8 20 4 49
Source: SAIRR (2003 : 182)
The province contributed R40 billion to South Africa' s Gross Geographic Product (GGP) in
2003, a mere 7% of its total (SAIRR, 2003: 48), compared with the 14.2% of the country' s
population living in the province (Stats SA, 200Ia). Figure 1.2.2 provides a graphical
representation of the percentage of Gross Geographic Product by sector, whilst Figure 1.2.3
illustrates the breakdown of the different population groups working in the various sectors.
Com unnity, social and personal services
30%
Finance ,/ 14%
Agriculture 6%
\
Transport
9%
Mining 0%
Manufacturing 22%
Electricity 2%
,
14%
~, Construction 3%
Figure 1.2.2 Gross Geographic Product by sector: Eastern Cape
Source: SAIRR, 2003 : 48
9

160000r----------------------, 140000 120000 100000 80000 60000 40000 20000
o UA~~_~~~ __ ~~U.~UL~~~~~~~~~
Figure 1.2.3 Employment by Race and Industry 2001: Eastern Cape
Source: Stats SA, 200 I a
o Black African
• Coloured
o Indian or Asi,
o White
The figures illustrate that the services sector IS the largest employer, employing
approximately 200 000 people, and its contribution to the GGP was calculated at 30% of the
region ' s total. The manufacturing industry represented 20% of the province's GGP yet only
employed 90 866 people compared to agriculture, which employed 72 122 people but only
contributed 6% to regional GGP (Stats SA, 200Ia). Thus, despite agriculture being a
relatively small contributor to GGP it plays a large part in the regional economy in terms of
employment due to the high labour absorption rate of commercial agriculture and the high
levels of subsistence type activities, particularly in the former homeland regions.
There are also many vast discrepancies in terms of wealth within the province. The primary
discrepancy is between the two major urban centres and the remainder of the province in
terms of economic activity and wealth. Figures 1.2.4 and 1.2.5 compare employment and
gross value added in Port Elizabeth and East London, the two primary urban centres, to the
province' (see Appendix I).
I Despatch and Uitcnhage are incorporated into the Nelson Mandcla Metropole whilst King Williams Town
and Mdantsane are incorporated into the Buffalo City Municipality.
10
I

Others . 52%
Figure 1.2.4
Figure 1.2.5
f\elson Wandela Others Nelson
30% 36% , M:lndela .' , 45%
Buffalo City Buffalo aty , 18% 19%
Municipal Employment figures as a percentage of provincial
employment, 2001 (left)
Contribution of municipalities to provincial nominal value added
(right)
Source: Stats SA, 2001a Figure 1.2.4,
Source: DBSA, 2004 Figure 1.2.5
Nelson Mandela and Buffalo City municipalities collectively account for 48% of total
employment and 64% of total value added, despite only accounting for 27% of the
population (DBSA, 2004: 56). Thus, the provincial economy is clearly dominated by the two
large cities. The local municipalities of King Sabata Dalinyebo and Lukanji which contain
the next two biggest centres in the provincial economy, namely, Mthatha and Queenstown
contributed 6% and 4% respectively to provincial value added, whilst no other municipality
contributed over 2.5%, clearly illustrating that small towns in the Eastern Cape are not major
economic forces and that the bulk of the provincial economy is focused around the two
major urban settlements in the province.
Another important distinction, which accounts for the disparity in terms of wealth, is that the
Province incorporates two former homelands namely the Ciskei and Transkei . During the
apartheid regime in South Africa land was set aside for black South A fricans in ten
Bantustans across the country, constituting 13% of the country's land and these areas were
generally referred to as homelands. There was little or no economic base in these regions and
the socio-economic conditions in them were very poor. These, conditions still remain in
many of these areas and generally these areas are considerably worse off than the former
white areas.
II

1.3 Survey of the Eastern Cape Midlands in the 1960s
A study and regional survey was undertaken on the Cape Midlands and Karoo regions in
the late 1960s (Cook, 1971: I). One of the core components of the survey was a review of
the numerous small towns within the Eastern Cape Midlands. The rationale behind that
study was to identifY the existent settlement patterns and hierarchy of places in the
Eastern Cape Midlands and to identifY possible growth nodes in the area. This was
deemed as important research focus because, at the time, the regional economy was fairly
static and retrogressive in comparison with the remainder of the country and industrial
development was limited in the dispersed inland settlements (Cook, 1971: I).
The government hoped that the creation of a stable water supply through the
Orange River Project, which diverted water to the Fish and Sundays Rivers through a
system of tunnels, would assist in developing the region, in which the urban places would
be the foci of the economic regeneration (Cook, 1971: I).
The study concluded that the spatial economy of the region was undergoing a significant
change; commercial entelprises were declining, leading to capital and labour leaving the
settlements. This movement also resulted in a cut in expenditure on public amenities in
the towns, which compounded the problem and made it harder for centres to attract
people and investment. It went on (0 indicate that smaller, economically weaker
settlements would be affected more significantly in this regard than the larger urban
places. It also concluded that whilst the Orange River project may provide an economic
boost for the region, particularly in certain localities, it would not be a panacea cure for
the economic limitations of the region (Cook, 1971: I).
The report suggested that there were severe limitations to the growth prospects of towns
in the Eastern Cape Midlands and that the smaller centres in particular would struggle to
retain and attract industrial and other core business activities.
12

1.4 Justification for study and the focus area
The study focuses on small towns due to the minimal research that has been undertaken
on them (Dewar, 1995: I). The Eastern Cape Midlands was selected as the focus area of
the study for a number of reasons. Primarily, it is a vast geographical area with limited
economic activities, a factor that was also the major justification for the study undertaken
in the region in the late 1960s. There are also no large cities, making the towns the
primary economic centres, which have experienced marginalization, along with many
other Karoo towns (Nel, 2005*'), both of which were also important justifications for the
earlier study.
Further justifications for the selection of the Eastern Cape Midlands were :
• The earlier study undertaken by Cook (1971) provided a valuable point of
reference, which would enhance the comparability of the study;
• Practical research considerations due to financial constraints; the Eastern Cape
Midlands towns were easily accessible from Grahamstown; and
• It was decided not to consider former homeland towns as the discriminatory
policies prior to 1994, which distorted these settlements and their economies and
would have made their assessment extremely complex. The poor census records
in these settlements prior to 1994 were also a major consideration.
The actual five towns selected for the study within the focus area were chosen based on a
purposive sample, derived from stratification according to the differing categories of
towns by Cook (1971) as shown in Table 1.4.1. The Cook study rated towns by 'orders',
which is a size ranking from lowest to highest, where the lower the' order' the larger the
settlement. Within the region these orders varied from 4 to 8.
Accordingly, the towns of Grahamstown (order 4); Cradock and Somerset East (order 5),
Bedford (order 6) and Pearston (order 7) were selected, as they are a reflective sample of
the different levels of settlements.
7 The asterisk dentotes that the reference is from a direct source, taken from the structured discussions
and interviews conducted as part of this reseach
13

Table 1.4.1 Hierarchy of Towns in the Eastern Cape Midlands, 1970
Order Name Places in the Study A"a
4 Major Country Grahamstown
Town
5 Country Cradock, Graaff-Reinet, Middelburg, Somerset East
Town
6 Minor Country Adelaide, Alice, Bedford, Fort Beaufort, Port Alfred
Town
7 Local Service Aberdeen, Alexandria, Hofmeyer, Jansenville,
Centre Murraysburg, Nouport, Paterson, Pearston,
Steynsburg, Stytlervi lle and Tarkastad
8 Lower Order Alicedale, Bathurst, Balfour, Boesmansrivie.mond,
Service Centre Cookhouse, Hertzog, Hogsback, Kenton-on-Sea,
Klipplaat, Nieu Bethesda, Riebeeck East, Rosemead,
Seymour and Waterford.
Source: Cook, 1971: 10
Figure 1.4. 1 on the following page graphically illustrates the towns in the Eastern Cape
Midlands including those selected.
14

._.,--' ----,,' 2T~tJ
,.' CAPE MIDLANDS AND K ARROO ARE A
r -- -ZOO
<9 ,I)u p (, n rt
S ll" ; nst-ilr>.! IV
, ,., , ".
J1
t..hd ·;~ l l; _. r>l ~ a !\ n '''''' 4 d
e f'-: .. U Bctl. <;:I ::ia M u r r a y ,, 1 I r .. ED ,,0
G r .'\ .... n-H c:-in.:t ~
A b t· n l .... 11 ij)
1-' ,',1.J' '' I\, n 4)
S ,. m .. t' ''' et
KlV Eli l .... l d ·' III , : •
e ,,0 1<..1 :1';,1.1'.0 '
• i§l
• <9
. " j <l' C' tlvohy 10,...1\
C o .. nt.~ 1<own
NI'Mor C. OV'lI'~ l<lw l'
LOC: . 1 • • , ... , .:. ,. ". n l r.
a t." ...... OJ. d • • ' ." ~ . \ . 0 " ..
,,'
Ell "J ' t". , I .. r ~' il l ~'
.. ' Figure 1.4.1 Towns in the Eastern Cape Midlands
Source: Cook, 1971
'3 W ,\ \ <:' d " rd
<!)
I§ CnH.k> ~ k
B f;'rtf ' } r M
e ' j .. rk .l f; f l!. d
n !\ I !(~1)reo 9~" \ ,·· ... U l"
H\!l'l .l.~
".
1i.:.a5! ~ • A (;, •• , id", • e I r... , k . ~ . \ 1 •
~ . ! ; 111: • I '"
,;' - <) .. , \ e e Gt.:li ··· t ) " _11
/\ l i .; . -o •• l r
"" I- >f" j .. ,,. J\ ... ' I1' ~r"H e
e (.;.,,)k h, . .... ~ .. • . " t .r t "(, ., \If ("; : ' l
Hi.':"
, "~ • r.· .... j , !
/
I ri 1:& . ...... -#J -- ~'I ,
H ", .. · • ' ;.:: .~ .. ,..,'
~ " .' ,~ ,
-----... ' .
,
15

1.5 Conclusion
The study alms to identifY the current economIc status and potential economic growth
prospects of small towns in the Eastern Cape Midlands. In order to achieve this aim a review
of factors that could alter a towns' economic potential such as LED and other growth drivers
will be undertaken. The focus area is justified due to the limited work undertaken on small
towns nationally, and the Eastern Cape Midlands was selected as the focus area of the study
due to the evident underdevelopment in the area, which was highlighted in an earlier study
by Cook (1971). Other factors, which contributed to the decision, were that the earlier Cook
(1971) study would be a valuable reference point and that the region was logistically suitable
to work in. The actual towns were chosen through a purposive sample derived by
stratification according to the differing categories of towns. In the fo llowing chapter,
attention turns to an examination of contextual literature, which provided a theoretical basis
for the research process and analysis.
16

Chapter 2 Literature Review
The current chapter reviews the literature regarding small towns, geographical economics
and location theory due to its direct implications for understanding the economic
potential of small towns. From the outset, it is important to state that the literature on
South African small towns is relatively limited, particularly from a purely economic
perspective (Dewar, 1995: I). The chapter begins with Section 2.1, which defines small
towns. Section 2.2 discusses international trends regarding small urban centres and 2.3
reviews specific South African experiences in this regard. Section 2.4 examines the
literature on regional economics and location theory and considers the implications for
small towns. Section 2.5 reviews the implications for development touching on current
policy, links between small town and rural development, potential developmental options
for small towns and views regarding small town support. Section 2.7 concludes the
chapter.
2.1 Definition of a Small Town
The definition of a small town is difficult to determine in its own right and varies
between institutions, regions and countries. The Urban Development Strategy of the
Government of South Africa (RSA, 1995) suggested that any centre with a population of
less than 100 000 be classified as a small town, the definition adopted within the thesis.
Atkinson and Zingel (2004: I) share a similar view, defining them as centres with
populations between 5 000 - 100 000. However, the Centre for Development and
Enterprise (CDE, 1996) suggested that having a population of below 50 000 constitutes a
small town. These definitions also differ across countries, for example the Australian
Bureau of Statistics (ABS, 1998 in Collits, 2000: 5) defines them as settlements with
populations between 1 000 and 19999.
17

Within this classification, three distinct categories of towns emerge in South Africa:
>- Small towns in commercial farming areas, generally experiencing economic
decline,
,. Former homeland towns which are largely economically artificial, and are often
unrelated to farming activities and
> Dense homeland settlements, lacking services and facilities.
(CDE, 1996: 2; Dewar, 1994)
Towns in the Eastern Cape Midlands clearly fit into the first category having been
established in rural areas exhibiting historically significant investments whilst normally
enjoying a symbiotic relationship with their agricultural hinterlands (CDE, 1996: 3).
2.2 International trends regarding Small Towns
As introduced in chapter 1, international literature suggests that there is a general decline
in the economic activity and populations within small urban centres. Erickcek and
McKinney (2004: 2) indicate that this trend is evident in the United States and specific
studies, such as the one conducted by NCED (2002), on small towns in North Carolina in
the United States confirms that between 1970 and 2000 all towns with a population below
10 000 experienced population declines. Coli its (2000: 2) as well as Kenyon and Black,
(2001:1) indicated that the same is occurring in Australia and point out that this trend is
also evident in other countries such as the United States of America, Canada and New
Zealand. As a result, disparities between small towns and larger urban centres appear to
be widening across the globe.
Collits (2000: 3) indicates that small towns in general are facing many developmental
challenges, which include agglomeration tendencies of economic activities towards larger
centres. Courtney and Errinton (2000: 280) support this ·by indicating that in England, the
18

structure of the rural economy has changed and the demand for functions and services as
well as the symbiotic relationship between these centres and their rural hinterlands
appears to have changed. Kenyon and Black (2001: I) support this view and point out that
changing international commodity prices have hit small towns extremely hard, as they
often are reliant on one primary industry; this is particularly true of agricultural and
mining commodities, which in the past have tended to be the staple of many small towns.
Declining economies in small towns accentuates the problem of population loss, as
employment opportunities tend to be scarce pushing people towards the larger centres in
search of employment.
Despite the widespread economic and demographic decline of many small towns in
Australia, Kenyon and Black (2001:1) indicate that a few have shown remarkable
economic persistence, population stability and even growth, illustrating that there are
exceptions to the general trend e.g. Tumby Bay in Australia.
Whilst evidence supports the findings of population and economic decline in towns in
first world countries, is this true of less developed or Third World countries? Hardoy and
Satterthwaitte (1986: 399 in Baker 1990: 18) in Latin America, Asia and Africa found
that the generally accepted concepts and ideas regarding small town development were
incorrect. Whilst the study did not directly refer to the demographics and direct
measurement of economic activity, it introduced the idea that, palticularly in Third World
countries, the experience of small towns, due to their unique circumstances, may not
correspond with first world trends. However, a comparison between towns within these
regions is problematic due to the vast differences in the agricultural hinterlands
surrounding them.
2.3 Trends in South African Small Towns
Of a population of 44.8 million in 200 I, approximately 5 million residents lived in the
approximately 500 small towns within South Africa (SACN, 2004). In addition to this,
19

numerous residents living in the rural hinterlands of these towns were dependent on the
towns for basic and essential services . Contrary to international trends, the populations of
most small South African centres appear to be increasing (Atkinson and Zingel 2004: 2).
In a study of 37 small towns in the Eastern Cape by Nel and Hill (1997) all towns
(excluding former homeland towns which were not included in the study) the populations
were found to be growing, e.g. the population of Aliwal North grew from 13 075 to
21 903 between 1970 and 1991. However, the majority of the towns ' economies were
declining. Studies by the CDE (1996: 18) compared Gross Geographic Product by
magisterial districts between the years 1991-1994 found that nationally 69% had
experienced economic decline (importantly these magisterial districts were dominated by
small towns). The implications of a general rural decline on the small service centres are
significant and support the view that the economic activity in small towns appears to be
declining. However, findings on towns in the Eastern Cape were not all negative . In
Grahamstown, Kenton-on-Sea and Alexandria growth was noted, largely due to the areas
being popular retirement and tourist locations (CDE, 1996: 19). Unfortunately, the data is
now fairly dated, and current Gross Geographic Product data sets at that level are not
available; only when more complex and recent data sets become available can a definite
comparative analysis of economic trends be made (CDE, 1996: 17).
In addition, other documented changes have taken place across the country, which have
had far-reaching effects on the towns and their basic functions. Atkinson and Zinge l
(2004: 2) list these as:
"Radical changes in mining techniques and mineral prIces which have led to the
collapse of many previously wealthy mining towns,
;;. Many rural rail line closures which have led to the demise of many rail junction and
transport towns,
"Movements towards larger econom ies of scale in agriculture due to mechanisation,
agri-businesses, liberalising tariff protection and the introduction of conservation and
20

game falming as rural activities have altered the relationships between the towns and
their hinterlands, and
:'Changing transport technology and shifts in retail purchasing patterns have displaced
the role of the smaller towns as agricultural service centres, in favour of larger more
central places.
(Atkinson and Zingel, 2004: 5)
These factors have had clear, negative impacts on the economies of a number of towns,
and many are dealt with at length later in the study. What can be concluded is that
centres, primarily dependent on one major industry e.g. mining or farming, can and often
have experienced economic collapse, an assumption that is supported by Nel (1996: 8). In
addition Christopher (1982, 152 in Nel, 1996: 7) points out that "the number of small
South African towns is in excess of the present needs of the rural population and hence
many do not possess the services necessary to provide for a community. Thus a spiral of
decline begins where services are withdrawn, making the towns less attractive to the
community." This indicates that potentially it is a necessary eventuality that a number of
small towns will decline.
However, not all observations relating to smaller settlements are negative. Tourism
appears to be growing with towns becoming locations for retirement as well as for
telecommuters (Atkinson and Zingel, 2004: 6). Further, settlements with an estimated
population threshold of 70 000 seem to be growing and do not appear to face the same
economic pressures as the smaller centres (Atkinson and Zingel, 2004: 6).
Atkinson and Zingel (2004: 6) indicate that struggling centres often exhibit similar
characteristics, which include:
:, Dependence on state welfare, for the people and the towns themselves,
" Loss of formal sector jobs and the out-migration of skilled workers,
:, High levels of poverty linked with unemployment and dependency, and
21

;'-Changes in district and municipal demarcation, and new legislation, resulting in the
loss of local municipal autonomy and the reality of under-trained local officials with
low budgets.
(Atkinson and Zingel 2004: 6)
2.4 Regional Economics and Location Theory
A geographic or spatial dimension to economic theory was initially developed by Von
Theunen and subsequent to this additional theories have been developed in an attempt to
explain the concentration of economic activities over space (Mikkelsen, 2004: 3). This
particular geographical dimension has been incorporated into theory through various
proxies such as transportation costs, land prices and labour mobility and through their
interactions; a geographic pattern of change within economic agglomeration emerges due
to an inherent trade off between centripetal forces that agglomerate economic activities
and centrifugal forces, which break up these agglomerations (Mikkelsen, 2004: 3). This
theory is useful as it provides some explanation as to why small towns may be
experiencing economic decline. Both the fields of regional economics as well as the more
traditional location theory are reviewed.
2.4.1 Regional Economics and the New Economic Geography
Geographical economics attempts to explain the spatial allocation of economic activity
and is a sub-disc ipline, which has been gaining considerable attention due to its
implications for a rapidly globalising economy (Naud", 2005: I). The cause for the
resurgence of attention of Regional Economics is primarily due the conceptualisation of
the New Economic Geography (NEG) (Brakman and Garretsen, 2005: 5).
The analytical framework behind the New Economic Geography (NEG) was developed
by Krugman in the early 1990s (Mikkelsen, 2004: 3) and aimed "to put geography into
economics using a general equilibrium framework where location is an endogenous
variable" (Brakman and Garretsen, 2005: 25). Essentially, it seeks to explain economic
22

agglomeration across geographic space and relates these centralisation effects to
transportation costs (Fugita and Krugman, 2004).
Since the inception of the NEG the core-periphery approach has been its fundamental
backbone, a pattern that is explained through imperfect competition, transportation costs
and economies of scale (Krugman 1991 and Krugman and Venables 1995 in Gries, 2005 :
30). Gries (2005: 30) explains the theory by indicating that "the love of variety for
product variations in monopolistic competition together with scale economies leads to an
advantage for the core region. Immigration and more intensive competition through an
increasing number of varieties put pressure on the price level in the core and lead to
positive precautionary externalities" and that this process leads to an escalation of the
agglomeration process as manufacturers tend to locate closer to large markets and
conversely markets will be large where there are existent clusters of manufacturers. It is
this need to be close to markets which leads to the majority of manufacturing activities
being attracted towards cities, which has direct negative implications for small towns.
The NEG can be modelled through a set of seven formulae. The demand side is based on
the Dixit and Stiglitz (1977) model and on the supply side is premised on the notion that
all so called M-Firms produce only one variety of M-good, for which the equi librium
output is fixed and in such a situation the behaviour of the other firms is a given. This
differs very little from the New Trade Models, particularly the one developed by
Krugman (1980), which takes the spatial distribution of workers as given. Despite this,
the NEG model and particularly the equation below, illustrates why the allocation of
firms and workers may matter (Brakman and GalTetsen, 2005: 10).
Where:
W, - is the region's r (nominal) wage rate;
Ys - is expenditures (demand for final consumption and intermediate inputs),
23

Is - is the price index for manufactured goods;
e - is the elasticity of substitution for manufactured goods; and
T" - are the transport costs between regions rand s.
The equation closely resembles the 'o ld-fashioned' market potential function where
wages are higher in regions that have easy access to high wage regions nearby, reflected
by the term YT" (1 -£) , which is generally referred to as the nominal market access
(Redding and Venables, 2004 in Brakman et aI., 200S: 7). Wages are also increased due
to reduced competition, the competition effect, which can be measured by a form of price
index Is which measures fixed mark-ups over marginal costs where there is no 'strategic
interaction between firms'. A low price index would reflect that many different varieties
of products are produced in nearby regions and accordingly the transportation costs of the
particular good would be relatively low, and as such reduce the total demand for locally
produced manufacturing varieties (Brakman et ai, 200S : 7). Considering that a firm's
output levels and mark-ups are fixed, this effect would then need to be compensated for
by a reduction in wages. Thus a change in the price index could impact either negatively
or positively on regional wages (Brakman et ai, 200S: 7).
The term 1,"(1.") in the wage equation, is generally referred to as the supplier access,
(Redding and Venables, 2004 in Brakman et ai, 200S: 7). The smaller the value of!, the
lower the production costs are, which increases the 'break-even' wage rate. Thus,
supplier access indicates that a low price index suggests that other firms supplying
intermediate inputs will tend to be located relatively close to the area of production.
Better supplier access, represented by a lower value of I, will also lower the wage rate
(Brakman et ai, 200S: 7).
The NEG model has two major applications, one for where there is labour mobility, e.g.
between regions within the same country and secondly where there is limited labour
mobility, e.g. between regions in different countries. Considering that all the towns
within the study area are located within South Africa and more specifically the Eastern
24

Cape Midlands it can be assumed that there is a high degree of labour mobility. In such a
situation Brakman et al (2005: 8) predict that using a NEG model similar to that of Pugga
(1999) there will be 'complete agglomeration' of 'footloose agents' due to interregional
labour mobility. This eventual outcome is illustrated in figure 2.4.1 below.
t
.. ! \
. ....................... i
.'
• 0 .z.s "'" 1
<I~. fh~·~·ne ~~ of trade
Figure 2.4.1 Implications of the NEG model where there is labour mobility
Source: Brakman et aI, 2005: 11
Assuming two regions, economic integration would imply that there would be a reduction
in transportation costs. Graphically this would imply a movement along the horizontal
axis towards the value 1 resulting in an increase in the level of freeness of trade, which in
terms of the model is defined as CjJrs=T,,"'; where 0 represents no integration and I
represents free trade and full economic integration. The vertical axis represents the share
of footloose production factors in region I (Brakman et aI, 2005: 8).
The initial situation is assumed to be one of 'autarky'; where the regions are self
sufficient and (q> = 0) and footloose labour is equally distributed over the two regions,
25

which is illustrated by the solid line at v,. At this point, the two regions are identical and
are in long run equilibrium. However, if the degree of economic integration changes, e.g.
it shifts towards (<p = 1) it affects upon this equilibrium. Labour then has the choice to
relocate from the one region to the other if it is more beneficial for them. Initially,
relocation is not beneficial as it is still too costly to import from region 1 to region 2, due
to high transportation costs and because competition for employment increases in region
2. However, once transportation costs decrease beyond a critical point it becomes
beneficial to relocate, as the costs of importing from region 1 are outweighed. This then
stimulates other workers to relocate until all workers have relocated into one region as
shown above in the tomahawk figure (Brakman et aI, 2005: 12).
However, within a national context, where there is labour mobility the outcomes are
quite different. The model suggests that once transportation costs decrease past a celtain
level, total agglomeration in either one or the other location will occur. This implies that
smaller towns will amalgamate with larger urban settlements at some point, depending on
the level of transpOltation costs. This in itself predicts that small towns are unlikely ever
to be able to reverse the current economic trends seen in these types of settlements.
Despite its achievements, there are limitations of the NEG framework and it is clear that
it will never be able to model accurately the complexities of the real world as it re lies
heavily on the special functions for demand and transportation costs. Further, it assumes
that firms are identical and makes no differentiation on the scale to which it is being
applied (Mikkelsen, 2004: 30). Thus, there would be circumstances where towns may be
in a position to avoid economic decline and agglomeration
2.4.2 Location Theory
Although many of the concepts of location theory are incorporated into the New
Economic Geography, they are still relevant and an understanding of these aspects boosts
the understanding of the challenges facing small towns.
26

Central Place Theory
Many location theories have been developed over the years, which have direct
implications for the growth prospects of small towns. Takayama and Labys (1986)
indicated that the classical theorists viewed space as a continuum in which economic
activities were related to a reference point, namely a large city or market area. Thus,
small towns would be developed and sustained by a service network linked to those
living in rural areas. This was the central theme developed by Von Theunen, which was
later incorporated into the Central Place Theory developed by Christaller and L6csh
(Christaller, 1933 and Locsh, 1954 in Pedersen, 1990: 99).
"Central Place theory holds that the growth of a region or town relates to the demand of
goods and services in the hinterland" (Collits, 2000: 16). Fugita et at. (2001: 26)
explained the theory by imagining a large featureless plain inhabited by an evenly spread
out population of farmers . Services to the farmers would not be spread equally, due to an
evident trade-off between economies of scale and transportation costs. Larger centres
would offer greater variation, thus attracting consumers from greater distances and a
hierarchy of places would emerge, explaining the size and the spacing between the
settlements within the area (Collits, 2000: 16). The approach suggests that the greatest
threat to small towns is the emergence of economies of scale and a reduction in travelling
costs, both of which would tend to favour enterprises locating within larger economic
centres.
Factor Endowment Model
The growth of towns can also be explained through 'supply side' theories such as the
Heckscher-Ohlin or Factor Endowment Model developed in the 1930s (Jovanovic, 2003:
28). The theory argues that natural endowments of land, capital and labour would
determine what was produced within a specific region and accordingly the amount and
type of business activities could be related to factor endowments or competitive
advantages (Jovanovic, 2003: 28). However, the theory is based on neoclassical
27

principles, which in itself is problematic, especially in a Third World country where there
are constraints on the operation of the market, e.g. traditional land tenure systems.
Growth Poles
As introduced by Perroux (1950) the concept of growth poles provides an explanation
behind the spacing and size of economic activities (Jovanovic, 2003). Coli its (2000)
describes them as generating forces, which can cause economic activity across space to
be patchy, as there are both positive and negative poles, which either attract or repel
business activities. Thus, growth could be achieved through the creation of positive poles
in smaller centres or it could be sucked away from rural areas into the larger urban
centres. The implications for small town development are that they could experience
economic growth or decline according to the structure and nature of the poles operational
within their local economies.
Spatial clustering
Transaction costs form a major consideration in location theory, and clusters of economic
activity form an important part of reducing these costs. Clusters have the ability to lock-in
economic growth into a specific region, as firms and people are drawn into particular
geographical locations thus creating growth. "A cluster is a relatively large group (a
critical mass) and system of formal and informal functionally related specialised firms,
knowledge skills and competencies, as well as specialised institutions (standard-setting
bodies, schools, universities, research institutes, trade associations), in a particular
geographical location" (Jovanovic, 2003: 48). Thus, they are particularly prevalent within
the new knowledge based economy, which often excludes small towns from attracting
any such firms due to their size and absence of existent clusters. Collits (2000: 16)
highlight that "agglomeration economies drive business activities to locate in the
proximity of one another" which explains the growth patterns of larger urban areas.
28

History
Arthur (1989: 128) illustrates that increasing returns and competition between economic
objects caused economies to become locked into specific outcomes, thus making it an
important element in the development path of an area. This makes the predictability of
the economic future of a region theoretically limited. Whilst it may be possible to predict
the economy within a stable environment one 'event' may change a settlement's
development path overnight, for example the discovery of mineral resources in a small
town would have immediate economic effects, which would have been unforeseen.
Summary
Location theory can be summed into five points, which show the evident bias towards the
growth oflarge urban centres over small town towns (Ottaviano and Thisse, 2004: 20).
:r Economic space is the outcome of trade-offs between various forms of increasing
returns and different types of mobility costs.
:r Price competition, high transportation costs and land use result in the dispersion of
production and consumption.
);> Firms are likely to cluster within large metropolitan areas when they sell
differentiated products and transport costs are low.
:"Cities provide a wide array of fmal goods and specialised labour markets that make
them more attractive to consumers/workers.
:.. Agglomerations are the outcome of cumulative processes involving both the supply
and demand sides.
2.5 Implications for Development
This section reviews current policy and views on small towns, the links between rural
development, potential growth opportunities for small towns and views on small town
assistance.
29

2.5.1 Current policy and views on small town development
In a country with scarce resources, it seems logical to approach rural poverty by
optimising the use of existent infrastructure and investments, namely that found in the
numerous smaller settlements in the countlY (CDE, 1996: 2). Despite their possible
advantages government has in the past given them limited attention (CDE, 1996: 4). "The
former Reconstruction and Development Ministry sub-divided its foci into 'Urban' and
' Rural ', small towns falling between the two" (CDE, 1996: 4) while subsequent national
policy has not specifically recognised small towns as unique entities requiring special
attention. Atkinson and Zingel (2004: 2) indicate that many government schemes are
generally supply-side driven policies, which have actually undernlined the smaller
centres, examples of which are:
:.-Provincial development plans have failed to define and prioritise support for a spatially
balanced hierarchy of towns,
:'-Integrated Development Plans (mps) focus on municipalities and neglect the spatial
role, needs and realities of the towns within them.
,. Municipal governments have been placed under great stress through the need to deliver
on programmes such as housing and land reform, thus prioritising other issues,
~ Many programmes, such as the scaling down of hospitals, and the amalgamation of
middle and working class schools have hastened the departure of the middle class from
the towns,
,.Certain programmes have not received adequate support, e.g. local business supp0l1
centres, whilst others have been disma l failures, particularly some local economic
development projects and poverty alleviation programmes, and
.... The Integrated Rural Development Strategy pursues a scattered approach, emphasising
infrastructure provision in only a few selected locations.
30

However, it is not just the government that has ignored these centres. Dewar (1995: 1)
indicated that they have received scant attention from academics since the mid-1980s and
Nel (1996: 1) also expressed the view that very little research had been conducted on
South African towns, as urban policy has tended to favour the larger centres. No evidence
was found to suggest a major change is this regard.
The CDE (2004: 2) identified four major reasons why small towns are important within
the South African context:
;,. They are situated in the areas with the greatest needs,
)..> Small towns can assist with rural development, as they have existing infrastructure,
;,. Facilities and infrastructure within the towns need to be fully utilised and
;,. Small town development provides alternatives to residence and employment
possibilities for immigrants, taking the pressure off the larger cities.
2.5.2 The role of small towns in rural development
One of the key arguments for investing and developing small towns was that they could
act as an avenue to stimulate rural development. However, from a theoretical standpoint,
this link is by no means clear as previous opinions on this subject were mixed. Baker and
Claeson (1990: 16) indicate that on the one hand optimists saw the development of small
centres as meaningful because they contributed positively to rural development, whilst on
the other hand the more pessimistic view suggested that they affected negatively.
The optimistic view followed the lines of early modernisation theories in which small
towns were seen as locations from where new ideas and technology could trickle down to
the rural population (Tacoli and Satterthwaitte, 2003). Hence, an even distribution of
urban centres became the most efficient option to develop rural areas, or according to
Rondinelli (1985 in Tacoli and Satterthwaittc, 2003: 12) a 'locationally' efficient
distribution would allow clusters of services and infrastructure to serve a widespread
31

population, thus, promoting small settlements was the most logical way to stimulate
econom ic growth in rural areas.
The pessimistic VIew, according to Tacoli and Satterthwaitte (2003: 12), echoed the
'urban bias' argument, which suggested that small centres were 'tools' for the
exploitation of rural areas, and a means to extract natural resources. This suggests that
rural development through small town promotion is not possible (Southall, 1988 in Baker
and Claeson 1990: 18). The line of thinking has parallels with traditional dependency
theory (Atkinson and Zingel, 2004).
However, many scholars have adopted an intermediate position. Hardoy and
Satterthwaitte (1986 in Baker and Claeson, 1990) indicated that in tenns of development,
small towns face unique sets of circumstances. Their individuality makes it difficult to
assess the linkages between their growth and that of their rural hinterlands. Thus, it is
possible that both theories will be useful within differing sets of circumstances.
Recently, wider perspectives have been adopted that describe the linkages between small
towns and their rural hinterlands being partially dependant on power relationships evident
at a national level (Atkinson and Zingel, 2004). Accordingly, government can manipulate
the links by many different actions and policies, making small town promotion either
beneficial or negligible to rural development.
There is some debate around the developmental role played by small towns (Hinderink
and Titus, 2001: 380). However, Atkinson and Zingel (2004: 8) believe that small and
intermediate centres assist rural development in a number of ways. These include:
:r Acting as demand centres and markets for agricultural goods produced in the rural
hinterlands, either for local consumers or by acting as export centres,
";> Acting as service and distribution points for rural regions,
32

:.- Stimulating the growth of rural non-farm activities; stimulating employment generally
through SMMEs or through shifts in the location of branches of private firms or other
private enterprises,
:.-By attracting rural migrants through labour opportunities, easing the pressure on larger
urban settlements, and
);>Through the provision of public services.
The importance of the linkages between the towns and their rural areas are also
emphasised by Baker and Claeson (1990: 16) who point out that the process of
development in rural areas is by no means a one-way process. Small towns can promote
growth in rural areas through the demand for increased agricultural productivity, greater
goods and services provision and as points for the diffusion of new ideas and technology.
The provision of goods and services not only includes basic commercial items, but also
other elements such as education and health. In return, rural areas provide resources, and
are sources of income that can be spent within the town, thus enabling the expansion of
its economic and social functions. However, technological advances will have impacted
upon this relationship.
2.5.3 Potential growth opportunities
The literature thus far suggests that small towns face major economic challenges and that
these forces tend pull economic activities towards larger urban centres. Yet despite these
factors and overall trends, some small towns across the globe have not followed this.
This section provides a more holistic view regarding the drivers and constraints of small
town economies and seeks a broader explanation of how growth, as well as decline, can
be achieved in small towns taking into account economic factors. Jensen (1997 in Collits,
2000: 17) identifies growth factors in small towns, which include:
33

"Regional economies are open and growth is determined by internal and external factors,
"There is interdependence between local and regional economies,
,-Local economic outcomes are generally determined by markets,
"History and geography, including existing settlement patterns, provide both constraints
and opportunities on regional economic outcomes,
"Within a market economy wealth is unevenly distributed,
"Migration of resources between regions is inevitable, and
"Certain towns are advantaged by location, either by access to markets, raw materials,
infrastructure or natural amenities.
Many of these factors are similar to traditional location theory and the NEG, and provide
explanations for the general decline of smaller urban centres. However, they also offer
also shed light as to how growth is achievable within small towns. Firstly, because
growth is determined by external and internal factors, if a town creates a viable economic
environment, business activities may flow towards it. This may be particularly true of
niche markets, which do not face direct competition where transportation costs are
negligible. In addition, incentives to compensate for higher transport costs offered by
local authorities may be an option if local economic conditions, particularly
infrastructure, are good. Secondly, certain towns may have advantages in terms of raw
materials, access to markets, infrastructure and natural amenities, providing a clear
opportunity to stimulate the local economy.
2.5.4 Views regarding assistance to Small towns
Having discussed the numerous difficulties faced by small centres and highlighted
possible opportunities available that may stimulate economic growth, the question which
can be asked is what are the general opinions regarding state assistance to these small
centres? Collits (2000: 2) indicates that there are at least four differing views on small
towns' decline. These are important as they impact directly on whether they should
receive assistance from national government.
34

The first view is that small town decline is inevitable, largely due to economic reasons
and as such, governments should not waste resources trying to promote growth in them,
despite the few success stories. A second view is that decline is inevitable but towns
should be assisted for equity reasons, thus ensuring satisfactory service provision.
Thirdly, government policies have led to small town decline. This idea sees government
actions and interactions between parts of countries as having led to the centralisation of
business, government and service activities into larger urban areas. The last opinion is
that communities can revitalise their economies themselves, promoting the view that
decline is not inevitable and can be turned around through local community action
(Collits, 2000: 2). If small town decline is inevitable, should government waste valuable
resources trying to boost economic activity? On the other hand, if local communities can
reverse small town growth patterns, as a few have done, government assistance might pay
off in creating employment where it is desperately needed and avoid over-concentration
of people and activities in the cities.
2.6 Conclusion
Evidence suggests small town decline is a characteristic that can be explained through
economIc literature, particularly the New Economic Geography and location theory.
However, small centres remain important service centres within the country for the 5
million people living in the 500 towns scattered across the country, as well as the many
others living in their rural hinterlands. Thus, they are important in terms of development
as people living in rural areas are often those living in poverty and are in dire need of
assistance. Adding pressure to this is the rise in population in these centres, a situation
that appears to be unique to third world countries.
The question of support of small towns is controversial and remains a critical question
due to challenges facing them weighed up against their potential to promote rural
development.
35

Chapter 3 An Economic History of five small Eastern Cape
Towns
Arthur (1989: 128) illustrated the point that history is an important factor in the economic
potential of allY region. Thus, a crucial step in the study was the analysis of each town's
history and past economic and demographic trends. The review is not intended to be
exhaustive, yet reflects sufficient light on the towns and highlights how historical factors
have shaped their economic environment.
Section 3.1 reviews the towns' origins, whilst 3.2 examines socio economic trends.
Finally, early economic indicators are assessed in section 3.3.
3.1 Origins of the towns
Cook (1971) undertook a survey ofthe urban centres in the Eastern Cape Midlands, all of
which were classified as 'small towns in commercial farming areas, generally
experiencing economic decline ' . Despite being service centres for their agricultural
hinterlands many did not just emerge and grow for agricultural reasons, hence the reasons
for their establishment may have had important implications for their subsequent
development.
3.1.1 Agricultural backgrounds
Traditionally the development paths of towns across the globe were based upon the idea
that settlements arose in rural areas as many previously farm-based activities became
centralised within them, allowing farming to become specialised (Dewar, 1994: 352).
The concept implied that centres would be established in central places in agricultural
areas.
36

The town of Bedford fitted the description of an agricultural centre, when it was founded
in 1855 (Myburg, 1978: 27). Tn 1855 Sir Andries Stockenstroom, a large land owner in
the region, offered a portion of his land for sale for the purposes of creating a town, from
which he could source labour and provide essential services for himself and other farmers
in the region (Myburg, 1978: 27). Apalt from the agricultural rationale, there was also an
element of self-<lefence in having a larger population in the region, which brought safety
to the local farmers and to Stockenstroom himself (Webster and Williams, 1985: 72).
3.1.2 Military towns
The formation of Grahamstown, Cradock and Somerset East were largely due to military
and administrative reasons. However, the economic and socia l conditions of the
surrounding farmers also played an important role, as it was often their presence that
accounted for the actual location of the towns (Myburg, 1978: 27).
During the time of the Fourth Frontier War in 1812, Sir John Cradock, governor of the
Cape, had the intention of containing the activities of the amaXhosa on the Eastern
Frontier, and stopping the loss of stock and property being experienced by the white
farmers. In order to achieve this he ordered the formation of a line of forts along the
Great Fish River, and behind its northern and southern extremities, the towns of Cradock
and Grahamstown were to be established (Thomson, 1970: 2).
In terms of Cradock's plan, the town of Grahamstown was established in its current
location in 1812. Its existence from a militalY point of view was well justified, as it
successfully defended an attack from Makana in 1819. Fifteen years later Hintsa, the then
paramount chief of the amaXhosa, again threatened the settlement (Thomson, 1970: 3).
"Grahamstown was a guarantee of the permanence of European civilisation on the
Zuurveld" (Thomson, 1970: 2).
37

Cradock was formed for the same reason as Grahamstown, excepting that it was located
behind the northern point of the frontier line. After its initial placement, the fort was
moved to the modern day location of Cradock in 1813 (Myburg, 1978: 27). However, the
requests by locals to move the initial placement of the town to a more suitable location
indicated that there was also the need to meet the needs of an agricultural settlement.
Somerset East was established in 1825, on a farm which had previously acted as a service
depot to European troops in the area, by the then Governor of the Cape Lord Charles
Somerset (Birch, 1972: 63). The town was established as a Sub-Drostdy of Grahamstown,
shifting Cradock to a Sub-Drostdy of Graaff-Reinet (Myburg, 1978: 28). Thus, it was
established due to a mixture of administrative and military functions, but also from an
agricultural perspective as the town served as a central place for the region, especially in
later years.
3.1.3 Church Towns
In 1859, the Dutch Reformed Church established the town of Pearston. Prior to this,
farmers living in the region simply attended church services on a local farm (Myburg,
1978:29). The ministry, seeing the need for a church bought a farm, sub-divided it into a
number of plots, se lling some as town plots and utilising the income generated to defray
the costs (My burg, 1978:29). Thus the modern day town of Pearston was formed due to
religious considerations. In most other settlements the churches followed believers, such
as Grahamstown where the town was already established and subsequently funding was
received from Britain to establish churches for troops and Christians living there
(Antrobus, 2005*).
38

3.2 Socio-economic characteristics
This section reviews historical socio-economic data. The population, number of business
and manufacturing activities can be linked to the towns' origins and other events that may
have had an effect on their economies and development paths.
Between 1930 and 1960, the population of the five towns more than double from slightly
under 35 000 to over 71 000. In the next 41 years until 2001 the total population
increased by 43%. Interestingly, of the 43 percent increase in population between 1960
and 200 I , 71 percent can be attributed to Grahamstown and Cradock. These trends can
be seen on Table 3.2.1 and Figure 3.2.1.
Table 3.2.1 Population of sampled towns, 1930 to 2001, selected years
~'dford--.- i _.-, I I
_ .. 1930 1960 ! 1970 , 1980 1991 1996 2001
2517 3964 5328 4825 10897 8445 8 579
~ .. adock 7567 19561 20522 25638 26857 29 166 31292 .... _ ." ..
;rahamstown 16090 32887 41806 51 195 48694 62640 61747 1:::-- - -Pearston I 125 2669 3 009 3549 3610 3872 4041
S;;;;~rset-East 6221 9801 10246 11246 15890 16389 16580
[Total 34507 71 140 83191 99325 108359 122774 125439
Source: Henderson, 1930, Cook 1971 and Central Stattsllcs ServIce 1970a, b, 1980a, band
1991 a and Stats SA, 200 I a.
39

140000
120000
100000
80000
60000
40000
20000
o 1930 1960
•
1970 1980 1991 1996 2001
.--.- - GrahamstaNn
Cradock
Bedrord
Somerset·East
Pearston _ _ Total
Figure 3.2.1 Graphic illustration of the populations, 1930 to 2001, selected years
(not to scale)
Source: Henderson, 1930, Cook 1971 and Central Statistics Service 1970a, b, 1980a, b and
1991 a and Stats SA, 200 I .
As noted previously, the population growth differs from first world trends, which
generally recognised depopulation of smaller urban centres. The population increase of
14.6% confirms Nel's (1996: 4) observation that indicated that the patterns exhibited
were similar to many other small urban centres across the nation, which he believed may
be linked to displaced farm workers and other rural people moving towards urban areas.
Manufacturing is an ' export' type activity and as such is a definite driver of a local
towns' economy. Table 3.2.2 illustrates the number of manufacturing type activities in
each town from 1890 to 1991 , providing useful clues regarding the economic bases of the
centres. Not surprisingly in 200 I , 87% of these entities were concentrated in the largest
centres.
40

Table 3.2.2 Number of Manufacturers, 1890 to 1991
1891 1899 1910 1920 1931 1940 1950 1960 1970 1982 1991
leMord 5 7 6 8 5 2 0 1 1 3 1
rradock 10 7 7 6 8 9 12 9 9 8 10
A;rahalnstown 30 20 21 12 14 13 20 16 17 22 24
Pearston 2 ,
2 5 2 1 1 1 0 1 1 :>
Somersel-F.ast 8 8 5 10 4 4 4 0 ,
3 3 :>
TOllils 55 45 41 41 33 29 37 27 30 37 39
Source: South Afnca Dlrectones 1891-1970, 1982-1991 and Central Stallstlcs ServIce
1982 and 1991c
In the early 1900s, manufacturing activities were more numerous in all of the settlements.
However, these were generally conducted on a smaller scale, merely satisfying the local
market. Thus, the general decrease can be explained by greater specialisation in
production e.g. small scale manufacturing activates such as cabinet and dressmakers
decreased. However, the main reason for the apparent decline from 1891 to 1920 from 55
to 41 was a reclassification of blacksmiths and repair establishments, previously regarded
as manufacturers. Grahamstown and Cradock are the only two towns that have
consistently had significant numbers of manufacturers throughout the period in question.
Their origins as military and administrative centres provide an explanation, as generally
their functions involved larger populations and consequently they required more services
and manufactured goods, which entailed a larger economic base. It was unfortunately
also not possible to determine what types of manufacturing activities declined during
these time periods from the data contained in the South African Directories. It was thus
difficult to determine the 'health' of the manufacturing sector simply from the number of
entities, as one large manufacturer can be infinitely more valuable than numerous smaller
ones. However, it does provide an indication that manufacturing type activities have not
thrived within the smaller ones.
41

Table 3.2.3 illustrates the total number of business activities, including manufacturing,
retailing and commercial enterprises, dating back to 1931.
Table 3.2.3 Total number of businesses 1930-1980
1931 1970 19110 2005
Bedford 36 40 50 37
% 7.1 6 5.2 3.4
CJ'adock 148 179 212 316
Oft, 29.2 26.8 21.9 29.3
(;r~hamstown 260 327 537 485
% 51.3 49 55.5 44.9
I'earston N/A 16 21 21
% N/A 2.40% 2.2 1.9
Somerset East 63 105 147 221
%1 12.4 15. 70% 15.2 20.5
Totals 507 667 967 1080 Source: South Afncan Dlrectonesl93 I, 1970 and 1980 and Dlrectones a & b 20058
An interesting point raised is that the three biggest towns in the sample group all had
military and administrative backgrounds. Thus, since their inception they were larger
settlements with greater services offered. As a result, these centres always had a more
vibrant economy in terms of population and service provision. Since the I 970s, the three
centres have also experienced overall business growth, suggesting that they have become
regional centres serving the needs of larger rural hinterlands, possibly even other smaller
towns. Grahamstown continues to have the majority of business activities, ranging
between 45 to 56 percent between 1931 and 2005. Interestingly, between 1980 and 2005
Grahamstown experienced a decline of 52 in terms of formal business activities, whilst
both Cradock and Somerset East experienced a growth. The reason behind this shift is not
S The data was collected from a number of business directories and does not Include informal activities or
small businesses without telephones_ Thus it is likely that these figures, especially current figures are
undcrcounted.
42

clear but possibly indicates the emergence of a number of economies of scale 10
Grahamstown.
Pearston was created by the church and never served any major economic function;
barring being a convenience to the local farmers and as a result never took off as an
economic centre - a legacy that is likely to hamper any future developmental initiatives.
Bedford, since its inception, was an agricultural centre and has remained relatively small
in terms of service provision and population thereby appearing not to have altered its
primalY economic functioning. Both of these towns have not experienced significant
business growth since the 1970s, despite increases in population. A possible explanation
is that the larger centres in the region drew consumers away from them.
The information presented has painted an interesting pattern of the towns. Firstly the
populations in all the centres have grown from 71 140 to 125439 between 1970 and
2001. Interestingly neither Bedford nor Pearston have expanded in a commercial sense
despite the population increases, however the rate of population increase in both of these
centres has declined dramatically between 1991 and 2001. In contrast to this, the other
towns appear to have expanded, with the number of business activities having increased
from 611 to I 022 between 1970 and 2005. This, suggests that the three larger centres
have been servicing the needs of a larger rural hinterland plus quite possibly also the
needs and wants of people living in other smaller centres such as Pearson and Bedford.
Lastly, it appears that in terms of the number of establishments manufacturing entities
have struggled in all of the towns, barring Grahamstown. The section on location theory
revealed that business entities, particularly larger ones, such as manufacturers tended to
favour larger urban centres, possibly explaining this trend.
These trends imply that the challenge to stimulate growth in Bedford and Pearston is
large because, despite population increases, neither centre has experienced major
economic growth since the 1930s. For the other three, their beginnings as administrative
centres led to them having larger local economies and populations and they do not appear
43

to face as significant growth challenges as Bedford or Pearston. In terms of the number of
manufacturing activities, which has links with the economic base of the towns,
Grahamstown is the only place that has shown an increase since the 1970s, illustrating
that these entities do not thrive in small towns.
3.3 Past Economic Indicators
An examination of a number of economic indicators was undertaken to identify more
recent trends within the towns' economies between 1970 and 1990 and the results are
presented in Tables 3.3.1, 3.3.2 and Figure 3.3.1 below. The data represents the old
magisterial districts of which the town used to form the centre.
R 250,000
R 200 ,000
R 150,000
R 100,000
R 50,000
RO :})- .... -
1970 1980 1990
Figure 3.3.1 Total GGP at factor cost and constant 1985 prices
Source: (DBSA, 1992: (5) 60-75)
__ G-town
Cradock
Bedford
S-East
-~. - Pearslon
Figure 3.3,1 illustrates changes in the actual size of the local economies between 1970
and 1990 by showing total GGP at factor cost at 1985 constant prices. The figure implies
that total economic activity within the towns generally increased during the period in
question. It also indicated that the local economies of Grahamstown, Cradock and
Somerset East were significantly larger than the other two towns,
44

Table 3.3.1 Employment in terms of economic sector 1980 -1991
\,'J I{ uitt;;e. :"11111111: "1;ur.;'<ICl · £1 .. , ('oom- _ I'm::ne'Cl' ' I ::t1UpOlt IlrI:lI ~ e l'o lm.ltIOUh 1.)w!
hIQITJ:l3- Ul I"i "' .. H~".·"1 t;l:om." :I!'J and anJ .lC'!a!
ft.resuy .• .".,. .......... -mm· ,mr.r.,u)- tH'ln~
olodJtltllll 1C:lI>.-.r
r. rahamSlo" n ( Albany)
1'180 3913 71 1358 145 608 2489 1356 589 9446 19975
1991 2995 17 542 11 2 827 1655 523 580 8163 15387 -
___ Cba ng,· -918 -54 -816 -33 219 -834 -833 -9 -1283 -4588 J2_Change -23 -76 -60 -23 36 -34 -61 -2 -1 4 -23 ~radock
'- - -...--' .-1'180 2053 11 224 40 667 997 1533 244 3676 9445
1'191 1798 4 90 61 447 829 636 275 3599 7739
Cbang!" -255 -7 -134 21 -220 - 168 -897 31 -77 -1706 % Change -12 -64 -60 53 -33 - 17 -59 13 -2 -18 _.
Iledford _._- ------- o-:-r-::-;:- ---- - - ---- --- 3101 1980 1394 12 61 50 163 178 175 20 1048
1991 856 19 34 6 61 134 101 27 1165 2403
Chanee -538 7 -27 -44 -102 -44 -74 7 117 -698 O/u Chano(, -39 58 -44 -88 -63 -25 -42 35 11 -23 ~onll'rset East r-----
19HU 1870 31 366 11 5 298 563 754 115 27 14 6826
1991 1793 11 247 74 488 493 360 147 2541 6154 c- --
Chanee -77 -20 -119 -41 190 -70 -394 32 -1 73 -672 % Chanoe -4 -65 -33 -36 64 -1 2 -52 28 -6 - 10 ::-" _ . e ,--\-_
Pearston ..
626- -1330 1980 513 1 2 0 83 74 26 5 ~-.- ---... -. ,
1991 I 390 0 21 0 65 54 11 9 4 14 964
Cha nge - 123 -I 19 0 -18 -20 -1 5 4 -2 12 -366 % Change -24 - 100 950 0 -22 -27 -58 80 -34 -28
Source: DBSA, 1995: 62 - 66
45

Table 3.3.2 Percentage contribution to Gross Geographic Product by economic
sector 1970 - 1991
A.~mc.JI! Ul e . Mdilufact- Elednc, C("1S<- CommerC(; TrallSf'Uri Fln;,nCJJ19 C"lTlmur. l :y
huntJlliJ Mlnmg an1 U1IIIg gas ructJOll calmln!l lind <llId Insurance :'I"ldsm.iIll
IQreslry QuurT';mg ,waler ac...--omm- eommw\o- and r(>al seMces
Oda:,on jCd',on eh1:ale
\Ibany ---_. __ .. -
1970 13 1 5 2 3 12 8 13 44 -198() 14 0 4 2 2 10 8 16 43
1990 13 0 4 2 4 9 4 16 48
~rad"ck I- 197() 13
-.. - - -.--~ - .. ..-- - ---c---:-22 13 29 o 3 2 8 10
19XO 21 0 I I 4 8 29 12 24
199(l 26 0 1 1 I 8 25 23 17
lBedford
~970 27 0 0 2 6 16 9 4 37
1980 62 0 2 I I 6 3 10 17
1990 58 0 I 0 1 4 2 10 24
~(lmersct East
1<)70 16 0 6 2 7 10 19 5 35
1980 35 0 3 2 1 9 17 10 23
1990 46 0 2 1 3 8 13 11 16 -- ._ '.
f earst"n
1970 46 0 0 1 0 9 6 0 38
1980 71 0 0 1 0 4 2 9 13 _. 19<)0 74 0 0 0 1 4 2 10 10
Source: DBSA, 1992: (5) 60-75
A number of other elements are also noticeable from the tables and graph_ Firstly, the
average increase in the contribution of agriculture to GGP, in the period 1980-1990, was
associated with a decrease in employment. This may indicate a number of things. Firstly,
commercial farmers were expanding production, through greater mechanisation, i.e. there
46

was no need to increase their workforce. Secondly, that the other industries declined thus
accounting for the greater relative contribution by agriculture to GGP during the period;
for example employment in manufacturing for example decreased in all of towns between
33 - 60 percent between 1980 and 1991, barring Pearston, which suggested a major
decrease in economic activity. Alternatively, the difference may be because of a
combination of the two factors.
Another noticeable trend was that the commercial sector, including catering and
accommodation, and the manufacturing sector, experienced a general decline between
1970 and 1990 - 834 jobs were lost in the commercial sector in Albany alone between
1980 and 1991. The services sector was identified as a major contributor to the local
economies, accounting for 48% of employment in Grahamstown in 1991. However,
despite the significant employment its overall contribution to GGP declined in all towns
barring Grahamstown. One of the reasons for the sectors dominance in Grahamstown is
that from very early on since the establishment of Saint Andrews College in 1855, Saint
Andrews Preparatory 1888, Kingswood College 1894 and Rhodes University in 1905 the
town has become an educational centre. Their existence, together with facilities, such as
the High Court, has resulted in the town developing somewhat of a competitive
advantage in the educational sector as well as a few other specialised activities.
Lastly, total employment dropped in all of the districts between 1980 and 1990 despite
the increases in GGP. Thus despite GGP growth the towns may have suffered socially
due to the loss in employment. The decline in agricultural employment affected most
heavily on the local econom ies of Pears ton and Bedford and accounted for 34 and 77
percent respectively of their total decreases in employment. This illustrates that if towns
are dependent on one industry the collapse or decline of that indusuy will have huge
economic effects on the town.
47

The dominance of agriculture in all the towns was also evident in the initial statistics.
Table 3.3.3 extends the analysis and presents the percentage contribution of agriculture to
GGP, at factor cost, in 5-year intervals between 1970 and 1980.
Table 3.3.1 Percentage contribution of Agriculture to Gross Geographic Product,
measured at factor cost
l)istrict 1970 1975 1980 1985 1990
~irahall1stowl1 (A Iban) 15 14 17 12 II
~edford 30 58 67 48 54
r- radock I 15 23 25 21 23 p;-- - - -.
ear. tOil 49 67 75 70 71 r..---- -.---~om~rsc l Easl 19 26 40 35 42
Source (OBSA, 1992: (5) 50 - 70)
The table clearly emphasises the dominant role that agriculture within the old Magisterial
Districts has on the economic livelihood of these regions. In 1990, only Grahamstown
and Cradock had other industries that contributed more to GGP tban agriculture (OBSA,
1992: (5) 50 - 70). Another noticeable trend is the growing reliance of all of the towns,
barring Grahamstown, on the agricultural sector particularly Bedford and Pearston where
agriculture contributed 54 and 71 percent respectively to their GGP.
There were limited mining and quarrying activities within the town. No towns have any
natural resources of any significance except Grahamstown, wbicb has kaolin reserves.
Interestingly, the exploitation of this resource in terms of valued added has not been
substantial. A major explanation for this under-utilisation was the rail prices for
unprocessed resources, which made it cost effective to rail the umefined kaolin to larger
centres as opposed to developing processing industries within the town (Antrobus,
2005*).
48

3.4 Conclusion
From their origins, it is evident that historical events impacted on the development paths
of the towns. Cradock and Grahamstown' s initial military and administrative functions
led to their economies being relatively large service centres in comparison to other towns.
A lack of economic growth in Pearston in a sense can also be linked to its origin as a
town established for religious purposes as opposed to economic rationale, which stunted
the growth potential of the town.
The population in all of the towns has grown since 1930, primarily accounted for by
rural-urban migration and natural population increases over time, which contradicts
observed international trends. Employment in all the towns' magisterial districts
decreased between 1980 and 1991 suggesting that the towns were declining
economically. All the towns are heavily reliant on the agriculture and service sectors in
terms of GGP and employment. Interestingly, the agricultural sector performed relatively
well in terms of GGP, but employment in the sector dropped within all of the towns,
which may partly account for the overall decreases in employment between 1980 and
1991. Evidence also suggests that the manufacturing and commerce were beginning to
struggle towards 1991.
49
Chapter 4 Analytical Methodology
The chapter reviews several analytical research tools to assess regional economies and
the current economic situation within the selected towns in section 4.1 whilst section 4.2
considers their applicability in modelling small town economic performance within South
Africa where available data sets are extremely limited. Finally, section 4.3 presents a
conclusion to the chapter.
4.1 Regional Economic Models
Many different regional models exist, which can assist in explaining the economic growth
or decline of various regions, thus enabling predictions to be made about the future
prospects of a region (Nijkamp et at., 1986: 258). Accordingly, this section reviews the
theory underlying the most prominent techniques pointing out both their strengths and
weaknesses. The three models that were selected for use in the analysis were examined in
greater detail, including the analytical tools used.
4.1.1 Economic Base Theory
Economic base theory divides economic activities into two groups: firstly those that
export goods to outside markets, i.e. basic activities, and those that produce goods for a
local market, i.e. non-basic activities (Juleff, 1993: 4). This implies that only export type
production creates wealth within a region whilst service type activities simply act as
multipliers of the wealth that is brought in. As such, "export base theory focuses on
principal demand-related factors responsible for the growth or decline of a local
economy" (Barkley, 200 I: 2). However, it becomes evident that this approach has its
limitations.
50

"Economic-base models focus on the demand side of the economy. They ignore the
supply side, or the productive nature of investment, and thus (are) short-run in approach"
(Schaeffer, 1999), which implies that regional growth can only be achieved via increases
in exports. This is clearly not a realistic assumption because if autonomous expenditure is
included it becomes possible for regional economies to grow even if exp0l1 activities
have remained unchanged (Ghali 1977 in Schaeffer, 1999). However, economic base
analysis is able to paint part of the picture of regional economies and remains an
important and valuable analytical tool, particularly when dealing with limited data sets.
Of the measures that can be used in economic base theory, the most common are
employment figures utilising location quotients as the main analytical tool (Juleff, 1993:
3), a method utilise in this study.
A basic Keynesian formula for the economic activity within a region, following BIDC
(2002a) can be presented as follows:
¥= I + C + G + (X - M) {4. 1. l.l)
Where
Y - Total Regional Product
I - Investments
C - Consumption
G - Government Expenditure
X - Exports
M - Imports
However, this equation represents the interaction between both the demand and the
supply sides of the economy, but because the theory focuses on the demand side of the
economy the equation can be simplified to:
¥=X+S (4.1.1.2)

S encapsulates all other non-export activities and considering employment data is used in
the calculations the economic base model can be simplified further as:
E t = Eb + En (4.1.1.3)
Where
Et - Total employment
Eb -Basic employment
En - Non-Basic Employment
The equation above does not indicate how to identify export activities and the regions'
basic and non-basic workforce. Juleff, (1993: 2) illustrates how the location quotient
solves this problem, which can be expressed as :
LQ = (e;le,)/ (E/E,) (4.1.1.4)
Where
Et - total employment for the nation
Ei - total employment in national industry
e, - employment in region
ei - employment in the regional industry
Juleff (1993: 2) indicates that if the LQ is greater than one, then the area or region is
relatively specialised in that particular industry and accordingly exports some of these
products to other regions. Similarly, if the LQ is less than 1 it is assumed that the
particular industry is not specialised and as such the region will import goods in that
specific industIy. Essentially if the location quotient is 1.3 and RIO 000 was invested into
a pat1icular sector it would result in a regional income ofR13 000.
However, of the industries that have an LQ greater than 1, not all the workers in that
industty will be serving export markets; certain workers will still be catering for the local
52

market (BIDe, 2002a). Thus in order to calculate the proportion of the workforce
producing for the export market within an export industry it is necessary to determine Eb•
(BIDe, 2002a).
Eb = LQ; - lILQ; (4.1.1.5)
Once Eb has been calculated, the figure can be multiplied by the number of workers
within the export industries to determine the number of basic employees serving export
markets, (BIDe, 2002a). Once this has been achieved, it is possible to calculate total
basic employment, i.e. the export base ofthe community.
The calculation of the LQs of the various industries enables the determination of the
composition of the regional economy, enabling an analysis of its strengths, weaknesses,
opportunities and limitations. Thus, considering the primary aim of the thesis, namely, to
determine the economic potential of the towns, economic base theory has something to
offer. LQ as a measurement tool also appears to be an effective and acceptable way of
measuring the economic base of a particular region.
Nijkamp ef al. (1986: 263) indicates that certain problems and advantages exist when
utilising economic base theory and location quotients. On the positive side, it is a useful
tool when facing practical considerations such as data limitations. Schaeffer (1999) and
BIDe (2002a) discuss a number of the negative aspects of using the LQ approach as a
primary measurement:
).> LQ and economic base theory are only useful tools in the short-run; any changes
that occur within a region after the analysis has taken place will alter the predictive
effectiveness of the model (Schaeffer, 1999).
)'>The measure that LQ > I as a type of threshold measure for regional specialisation
is not significant (BIDe, 2002a). Thus, it merely acts as an indicator and not as a
definite guideline. It is possible for industrial sectors with LQs greater than I not to
53

be exporters, such as the property market and construction industries, which
generally only serve the local market. An increase in their LQs simply reflects
changes in local consumption and investment patterns (BIDC, 2002a).
" The model underestimates exp0l1 employment; the larger the areas the greater the
error (BIDC, 2002a). This is because imports from a large region or province are
relatively small compared to the imports within a small area of analysis.
"The method does not take into account specialisation; employment figures are not
always an accurate measurement and operations may become mechanised leading
to higher production levels without increasing employment (BIDC, 2002a).
An imp0l1ant aspect of economic base theory is the multiplier effect. Generally, the larger
the area the greater it will be. Juleff (1993: 3) indicates that the higher the propensity to
spend locally the greater the effect. Indications regarding the multiplier effect can be
determined via LQs. However, no attempt shall be made to determine the actual
multiplier figure within the towns, due to the complexity of achieving this, except
through general questions posed through the structured interviews. These act only as
rough guidelines regarding trends and spending patterns . Considering the sizes of the
towns, it can be assumed that the mUltiplier will be extremely low in most of lbe centres.
4.1.2 Shift-Share Analysis
"Shift-share analysis is a method of disaggregating regional employment change in an
industry in order to identify the components of that change" (Stevens and Moore, 1980:
419). Essentially, it identifies changes in regional economic performance that are not
related to national shifts, making them effectively regional differences. Holden et aI.,
(1989: IS) confirm that shift-share analysis has been used in regional analysis and in the
evaluation of regional policy making. There are definite positives when applying the
technique to the analysis of small towns, but possibly the most advantageous aspect of the
model is its ability to make projections with minimal data sets (Nijkamp et aI., 1986:
258).
I-
54

The following section reviews the method of shift-share analysis that shall be adopted
within the study. The basic formula is presented by BIDe, (2002b) as:
SS = NS + 1M + RS
Where:
SS - Shift-Share
NS - National Share
1M - Industry Mix
RS - Regional Shift
(4.1.2.1)
Stevens and Moore (1980: 420) indicate that the formulas for each of these items can also
be expressed in terms of employment nationally and locally at the beginning and at the
end point of the analysis.
NS = e; 1-1 (E , I E '-I) (4.1.2.2)
1M = e; '-I (E;' IE; 1-1_ E I I E I-I) (4.1.2.3)
= e; '-I (E; I IE; '-I) - NS
RS = e; '-I (e; 'I e; '-I _ E ; , IE; I-I) (4.1.2.4)
Where
e - Regional employment in all industries
E - National employment in all industries
e; - Regional employment within a specific regional industry
E ; - Regional employment within a specific national industry
t - End period of analysis
t-I - Beginning period of analysis
The National Share (NS) indicates the level to which total employment within a region
has increased due to national changes in the economy. The Industry Mix (1M) identifies ----~--~----------
fast or slow growing industries nationally; thus local areas with a high concentration of
55

fast growmg industries would have grown at a higher rate than areas with high
concentrations of slow growing industries. The Regional Shift (RS) shows regional
industries that have grown or declined in relation to that particular industry's national
trend, and as such is the most relevant component of shift-share analysis (BIDC, 2002b).
Despite the advantages of the method it does have some inherent weaknesses. Holden et
a!., (1989: 32) concluded in their critique of shift-share analysis as a means of regional
analysis, that three major limitations exist. Firstly, mechanical teclmiques are required,
yet the interpretation of the data does require a clear theoretical underpinning. Secondly,
the theory is based solely upon regional employment; this presents certain problems in
terms of reliability. Lastly, deriving growth vectors is a problematic task (Holden et a!. ,
1989: 32). BIDC (2002b) offers a succinct view of the limitations of sift-share analysis:
they describe the technique as a descriptive tool only, and accordingly it should be used
in conjunction with other methods as it fails to account for many factors including
business cycles, identification of comparative advantages and changes resulting from
differing levels of industrial structure. BlOC (2002b) also conclude that because shift
share analysis is simply a view of a local economy at two different points of time the
results become sensitive to the time period that is chosen.
A common notion held in location theory is that manufacturing operations tend to favour
larger metropolitan areas; shift-share analysis enables the testing of this hypothesis
relatively easily. Thus, despite the problems associated with shift-share, when used in
conjunction with other methods the technique provides useful and valuable information
regarding the economic potential of small towns.
4.1.3 Input-Output Models
Input-Output techniques utilise accountancy principles and are seen as models of the
production side of the economy (Hewings and Jensen, 1986: 299). They can be used to
measure the final production of a region in two ways. Firstly by calculating the costs of
56

inputs into a reglOn, such as raw materials, intermediary inputs, imports, labour and
capital. Secondly, by reviewing the output flows from a region (Nijkamp et aI. , 1986:
263).
An input-output table can be broken into four quadrants (Pis sa renko, 2003: I):
• Quadrant I - Intermediate Demand, which is the flow of products produced in the
production process.
• Quadrant 2 - Final Demand, which is the final demand of each producing
industry, e.g. demand for non-industry consumers like households, government or
exports. It is the demand for goods, which are not used to produce other goods (as
opposed to intermediate demand).
• Quadrant 3 - Inputs (e.g. raw materials) to producing industries, which are not
produced by any industry like imported raw materials.
• Quadrant 4 - Primary inputs to direct consumption that are inputs directly
consumed to produce other goods e.g. imported electricity.
These elements can be clearly seen in table 4.1.1.
Table 4.1.1 Fragment of Input output table
Inpul j Oulpul I 2 3 Total Final J)"mand Tolal Output
I XI I X12 XI ' YI XI
2 X,i X ::!2 X2J Y, X,
3 X,i XJ2 XJ) Y, X,
All primary Inputs ZI Z, Z, - -
Total Inputs XI X, X, - -
Source: Plssarenko, 2003: 2
If the change for final demand increases it will increase agricultural output and impact
upon inter industry demand and thus increase outputs from the other sectors, this is
generally referred to as a first order effect. This will then lead to second and third order
57

effects through regional multipliers as the additional money generated circulates within
the regional economy (Pissarenko, 2003: 2).
"The most common view is that of the input-output table in regional analysis is as a
model, virtually sufficient in and of itself, for regional projections and impact analyses"
(Hewings and Jensen, 1986: 306). It allows the identification of current markets and
enables predictions to be made regarding the size of future markets, which will come to
absorb output of the various films (Isard et aI., 1998: 95). Through input-output analysis,
it is possible to:
• Analyse the effectiveness of government's attempts to promote economic growth;
• Analyse the labour market;
• Forecast the economic development of a nation; and
• Analyse the economic development of various regions.
However, criticisms do exist of the model's ability to explain regional growth.
Richardson (1973: 40) believes it lacks the generality of econometric models as it
contains extremely precise theoretical implications and if any were to change the models
forecasting ability is compromised. Another constraint is that this type of modelling is
extremely data demanding (Nijkamp et a1. 1986: 264), making it an inappropriate model
within the South African context.
The model has the ability to shed light on the sectoral relationships within regional
economies. It is a common tool although generally only applied to smaller regions where
data sets are disaggregated to the level of analysis.
4.1.4 Gravity Models
Gravity models are a way in which the effects of distance can be incorporated into
regional analysis (Richardson, 1973: 62). Nijkamp et al. (1986: 264) indicates that many
58

multi-regional economic models incorporate gravity formulas to account for the impact of
transportation costs on industrial location. Hoover and Giarratani (2000: 103) explain the
gravity formulae in much the same light, by indicating that within this type of model the
distance of a market or input source is systematically discounted according to the location
in question. Gravity type formulas can be applied to many situations and form an
important variable within more complex modelling techniques particularly to analyze the
effects economic integration on bilateral trade flows (van Beers, 2000: I). A standard
gravity model can be presented as:
10gXij = ~o + ~llogYi+ ~2 10gYj + ~310gNi+ ~4 10gNj + ~s 10gDij + ~6 10gPij + llij
Where:
x .. = Bilateral commodity trade flow from country i to country j 'l
Y = Gross Domestic Product in country/region i 1
Y = Gross Domestic Product in country/region j J
N. = Population in country/region i 1
N. = Population in country/region j J
D .. = Distance between country/region i and j IJ
P .. = Dummy variables picking up specific 'unnatural' factors IJ
u .. = Log-normally distributed disturbance term IJ
(van Beers, 2000:2)
Despite the possible benefits of this model, without data on actual GDP within the towns
as opposed to municipal regions, it not suitable to apply.
4.1.5 Econometric Models
Another common regional technique is the use of econometric type models. "A major
reason econometric models are so ubiquitous in research and professional work is
because they can be used in a variety of ways" (Isard et aI., 1998: \38). Three major uses
are suggested by Isard et al. (1998: 8); firstly econometric models can be used to test
hypotheses formally. Secondly, they enable future predictions to be made fairly
accurately regarding the dependant variable and lastly, the implications of policy
59

decisions can be easily tested, e.g. changes in consumption, and investment, etc., can be
tested (Isard el aI., 1998: 138). The distinctive element of econometric models is that they
are not based on an underlying theory, as is the case with other models. Instead, they are
based on spec ific relationships and the coeffic ients are specified accordingly. They have
the ability to incorporate other methods, such as gravity models, and thus hold the key to
large scale regional modelling. However, these types of models do require vast and
accurate data sets in order to make accurate predictions. The method can be extremely
useful in analysing small regional economies, but is only commonly utilised in the United
States and other countries such as the United Kingdom due to the vast data sets, which
are disaggregated to small areas. 111e method would thus not be suitable in countries such
as South Africa were comprehensive data sets are not available for smaller urban areas.
4.1.6 Social Accounting Matrixes (SAMs)
"A social accounting matrix (SAM) is a comprehensive, economy wide data framework,
typically representing the economy of a nation" (IFPRI, 2002: 5). The interrelated data
sets thus allow hypotheses and policy issues to be tested (Stats SA, 2002). This is
possible as the SAM is a square matrix where each account within the economy IS
represented in a row or column and each cell represents the payments from the account in
the column to that of the row. It is thus premised on a double entry accounting system
where total revenue is equal to total expenditure (IFPRI, 2002: 5).
The basic structure differentiates accounts for activities (entities of production) and
accounts for commodities. The activity accounts are valued at producer prices whilst the
commodity prices are valued at commodity prices. Commodities are essentially activity
outputs which can either he sold locally or exported and include imports. This separation
of activities from commodities allows many commodities to be generated from a specific
activity, e.g. a forestry activity can produce numerous commodities such as timber and
paper. Commodity payments, represented in the columns, are made to domestic activities,
the rest of the world and various tax accounts and allows imports to be to be modelled as
60

perfect or imperfect substitutes for domestic production. The matrix also accounts for
domestic import and export marketing of each commodity as well as the costs of the
associated transport costs (IFPRI, 2002: 5).
The SAM can be utilised to test hypotheses by calculating the multipliers between the
components within an economy, by using the material balance equation developed by
Sadoulet and De Janvry (1995) and Bautista et al (2002). According to Jauna (2006: 300)
the basic materials balance equation can be specified as:
(I)
Where:
• y' is a nxl column vector of total sectoral output
• A is a nxn matrix of direct technical coefficients for the endogenous factors
• F is a nxl column vector of final demand
Whilst the A matrix corresponds to the number of productive sectors. Thus by solving for
y ' it is poss ible to derive equation 2.
y' = (I-AY' F (2)
Where:
• I is the identity matrix
• (I-A) -, is the Leontief inverse
"The input-output model is concerned with so lving for the sectoral output levels (Y) that
satisfy final demand for those outputs (F) given the inter-industry structure of production
or the intel1nediate input requirements of the production sector" (Jauna, 2006: 300).
Equation 2 can thus be used to obtain various multipliers; most regularly the production
and income multipliers. It can be reduced to :
61

(3)
Thus, Ml becomes the Leontief inverse, which essentially is the input-output multiplier
matrix. Considering yl represents total sectoral output and F is proxy for final demand,
equation 3 can be utilised to calculate endogenous incomes linked to changes in the total
exogenous accounts, given the multiplier matrix. It can also be utilised to analyse the
impacts of outputs caused by exogenous shocks; in other words changes in factors such
as investment, government expenditure and demand from the rest of the world, which
would affect final demand. The multiplier matrix M 1 can thus be utilised to determine
total income change due to the exogenous factors; essentially it will indicate the amounts
by which various sectors change in production due to an exogenous shock. The equation
can now be extended to the SAM multiplier by including the primary factors and
consumption accounts to the production sectors (Jauna, 2006: 301).
By letting "Am be the enlarged square matrix of direct propensities computed from the
SAM and Ms the enlarged inverse (SAM multiplier) matrix" (Jauna, 2006: 301) the MS
can be represented by:
y = MSF, where MS= (1 - Am)-l (4)
MS takes into account the induced effect of the changes of the exogenous shifts within the
national economy. The final demand for goods and services can now be calculated by
multiplying the multiplier matrix by final demand (Jauna, 2006: 301). This can be
represented as:
yl = (l-Ar1 * F (5)
This formula can be used to validate the multipliers and highlights the impacts on all the
entries within the SAM. To actually calculate final output, the figure prior to the shock is
62

subtracted from the amount after the shock. This resulting change in output shifts final
demand within the various sectors and thus elements within the coefficient matrix. This
can be represented as :
(I - Azrl * F - (I - A) -I • F = [(1 - Az) - (1- A)l = 1\ y l (6)
A2 is the change in the coefficient matrix that results from the shocks within the SAM.
Thus, the equation represents the final changes in intermediate inputs (Jauna, 2006: 302).
Through these manipulations, it is possible to test scenarios within the national economy.
Unfortunately, actually, developing or adapting a SAM for a small town within South
Africa is not feasible due to the severe lack of available data at this level. However, the
evident linkages within the national SAM may provide useful information about the
scope and the nature of the linkages between the various sectors within the economy.
4.1.7 Computable Generated Equilibrium (CGE)
A Computable Generated Equilibrium (CGE) is very similar to a SAM; the model
explains all of the payments within a SAM and is therefore disaggregated in a very
similar manner (IFPRI, 2002: 1). A CGE in recent times has become a popular tool in
regional analysis, although still not as widely used as input-output analysis (Partridge and
Rickman, 2004: I). It is essentially a set of equations, which define the actions of actors
within the regional economy due to outcomes based on fixed co-efficients (IFPRl, 2002:
8). "For production and consumption decisions, behaviour is captured by nonlinear, first
order optimality conditions. that is, production and consumption decisions are driven by
the maximization of profits and utility, respectively" (IFPRI, 2002: 8).
A CGE comprises of four main components, namely:
• Activities, production and factor markets
• Institutions
63

• Commodity Markets
• Macroeconomic balances
The major difference between a CGE and a SAM is that taxes have to be paid into 'tax
accounts' which are related to its core government account. Despite their usefulness and
ability to accurately model impacts at a regional level, they require significant data and
are not suitable to disaggregate at a town level.
4.2 Models applicable for Small Towns in South Africa
As illustrated, many models exist, and the more complex ones provide greater insight into
the regions being analysed. However, the problem of data accessibility is severe at a town
level within South Africa and the most useful data sets the 1996 and 2001 population
censuses do not contain the detailed economic data, necessary for utilising the more
complicated techniques e.g. econometric models, SAMs and CGEs. On top of this, few
studies have been undertaken on small towns, thus making other sources of information
scarce (Nel, 1996).
It was thus deemed appropriate to use economic base and shift-share type analysis to
analyse the towns directly. As mentioned the forecasting ability of these models paint a
fairly accurate picture of the economic environment and trends without being data
intensive. A national SAM was also used in conjunction with these methods to identify
important linkages between sectors, although it was not possible to disaggregate this to a
town level. However, it did allow several possible scenarios to be tested at a national
level from which deductions could be made about changes within the towns' local
economies to identify potential avenues to stimulate growth.
64

4.3 Conclusion
The chapter highlighted and reviewed several regional modelling techniques. Despite the
advantages of a number of techniques, they were not utilised due to the unavailability of
economic data at a town level in South Africa. The two models selected to analyse the
towns were Shift-Share analysis and Economic Base theory, considering the data
limitations they together with a national SAM were used to identifY important economic
trends, sectoral linkages and potential avenues for growth.
65

Chapter 5 Analysis of towns using Shift-Share Analysis,
Economic Base Theory and a Social
Accounting Matrix
The chapter assesses recent economic trends within the five selected towns by applying
the available data using regional modelling techniques with the aim of identifying the
complex set of linkages within their local economies. Section 5.1 reviews the census data
and the manipulations that were required to isolate information about the towns
themselves as opposed to the broader municipality. Economic trends are reviewed in 5.2.
Section 5.3 utilises the shift-share technique to analyse changes in the local economies. In
section 5.4 export base theOlY through the use of location quotients is applied to the data
sets, whilst 5.5 employs a Social Accounting Matrix to identifY sectoral linkages within
the national economy and tests a set of hypothetical scenarios and their potential impacts
on the towns. A conclusion is presented in 5.6.
5.1 Data sets utilised: 1996 and 2001 censuses
The primary data sets utilised within the study are the 1996 and 200 I censuses. Despite
being fairly dated, these were the only data sets available that could be disaggregated
below a local municipal level. Even with the census there are certain complications. The
government prior to 1994 used Magisterial Districts as reference areas for economic
statistics whilst the current government uses municipalities, making comparisons prior
and post 1994 impossible for the scope of this work (Central Statistics Service 1991a and
Stats SA 1996). Municipal boundaries were also shifted slightly between the 1996 and
2001 censuses; furthermore the boundaries of 'sub' places within municipalities were
also changed between these periods making comparisons between towns and suburbs
extremely complex (Parry, 2005*). In order to make an accurate comparison, the use of a
GIS system should, ideally, be utilised, as this would allow greater consistency between
the two data sets.
66

Unfortunately, a GIS system was not available for the study. Instead the boundary
differences between the two years were mapped and taken into consideration when
analysing the results. Copies of the town maps, highlighting the administrative
differences can be seen in Appendix 3. Generally, there were fairly significant
geographical changes to the town boundaries in all of the selected towns, barring
Cradock, which exhibited only minor shifts.
Despite the large geographic changes, the demographic differences regarding population
were not believed to be significant. Careful analysis of the town maps indicated that the
major difference between the two periods is that municipal land, e.g. commonage, was
included as part of the towns in 1996 and was excluded in 2001 9 Thus, despite large
boundary changes these movements are not believed to represent major demographic
alterations. In order to confirm this view, testing was undertaken to monitor the
population of the towns as a percentage of the municipality to ensure that the data
correlated.
Figure 5.1 shows that few changes in the ratios took place, indicating that the boundary
shifts had no significant effects on the demographics of the towns. In fact, most of the
towns showed a slight increase in their percentage of the municipal population, which is
consistent with the belief that people living in the rural areas are migrating towards, and
settling in, rural towns around the country. Unfortunately the comparison of suburbs and
'sub-places' was not possible due to their significant boundary alterations.
9 Personal observations made in analysing the maps acquired from the various tourism boards reflect
changes in the town boundaries, sec Appendix 3.
67

100%
80%
60%
40%
20%
Grahamstown Bedford
1996 . 2001
Cradock Pearston
Figure 5.1 Town population as percentage of Municipal population
Source: Stats SA, 1996 & 200 I a
5.2 General Overview of the Towns' Economic Environment
Somerset East
The sampled towns, as seen in chapter four are not decreasing demographically, but what
of their current economic performance? Table 5.2.1 suggests that their situation has
worsened, indicating lower employment levels in 2001 compared with 1996, and
significantly higher levels of unemployment in 20 Table 5.4.2 illustrates the industries in
the towns which contribute to their economic base, i.e. sectors with a LQ greater than I,
and the percentage of the town's workforce producing goods or services for export, i.e.
the extent to which the local economy brings in external money into the local economy.
Theoretically it also indicates that if money was invested into the towns the extent to
which it would generate economic growth. This is also represented graphically on figure
4.4.1 below.
68

Table 5.2.1 Employment Figures 1996 and 2001
G-town
Eml.loycd 1996 12300
Empl"y~d 2001 11 356
% [)ccrease in 7.7%
emplovment Unempl"~'ed 1996 7 954
Unemployrd 20tll 12680
% increase in 59.4%
uuemplo\'mcnt % not EA 1996 44
1-0/. not EA 2001 43
Source: Stats SA 1996 and 2001a
Key: EA = Economically Active
Cr.tdo,·k
5336
5026
5.8%
4 297
5 619
30.8%
45
47
lI~df"rd PensIon S- East
770 364 2933
630 331 2756
18.2% 9.1% 6.0%
I 210 607 2001
1 543 689 2625
27.5% 13.5% 31.2%
59 50 48
59 54 58
Grahamstown exhibited the most drastic results as employment dropped from 12300 in
1996 to 11 356 in 2001 , a decrease of over 944 (7.7%) and unemployment rose by 59%.
The increase in unemployment can be attributed to the actual decrease in employment
and in-migration, which indicates that the official population may be underestimated as it
decreased slightly between 1996 and 2001. The trend was similar, but not as drastic in
the other towns with employment decreasing between 18 and 5 percent, whilst
unemployment rose between 13 and 32 percent. The results indicate conclusively that
there was evidence of a loss in employment, but say very little about why.
5.3 Shift-Share Analysis
Shift-Share analysis essentially identifies changes in regional economic performance that
are not related to national shifts, making them effectively regional differences, which can
be extremely useful when identifying current and past trends in regions, cities or towns.
The theory is briefly reviewed, before it is applied to national and provincial employment
69

data. Following this, the trends identified are examined and key findings are discussed.
The technique is also applied to the occupational data of Grahamstown and Cradock, as
only these two towns have sufficient employment to make the analysis valuable.
Employment based on industry data from the 1996 and 200 1 censuses was subjected to
the Shift-Share formula, shown in chapter three by equation 4.1.2.1, repeated here for
easy reference.
SS = NS + 1M + RS (4.1.2.1)
Where:
SS = Shift-Share, NS = National Share, 1M = Industry Mix and RS = Regional Shift
Source: BIDC, 2002b
The results of the 1996 - 2001 data analysis are shown below in Table 5.3.1. The totals
for employment in each industry are shown for both time periods, and the difference
between them is also highlighted. The NS (National Share) indicates what the
employment levels would be in the industry in 2001 if that industry had followed national
trends. The 1M (Industry Mix) weights the movement according to the particular
industlY' s national trend or weighting, thereby indicating the changes to employment
between the two periods. Finally, the RS (Regional Shift) measures the changes in
employment between the two periods that, as the name suggests, are primarily regional
shifts, i.e. changes that have occulTed due to shifts within the local economy. As the
initial shift-share formula suggests, the addition of the three variables, equals the 2001
employment figure, as essentially shift-share analysis identifies the components of
changes in employment. The equations used to calculate the figures are highlighted
below.
(4.1.2.2)
70
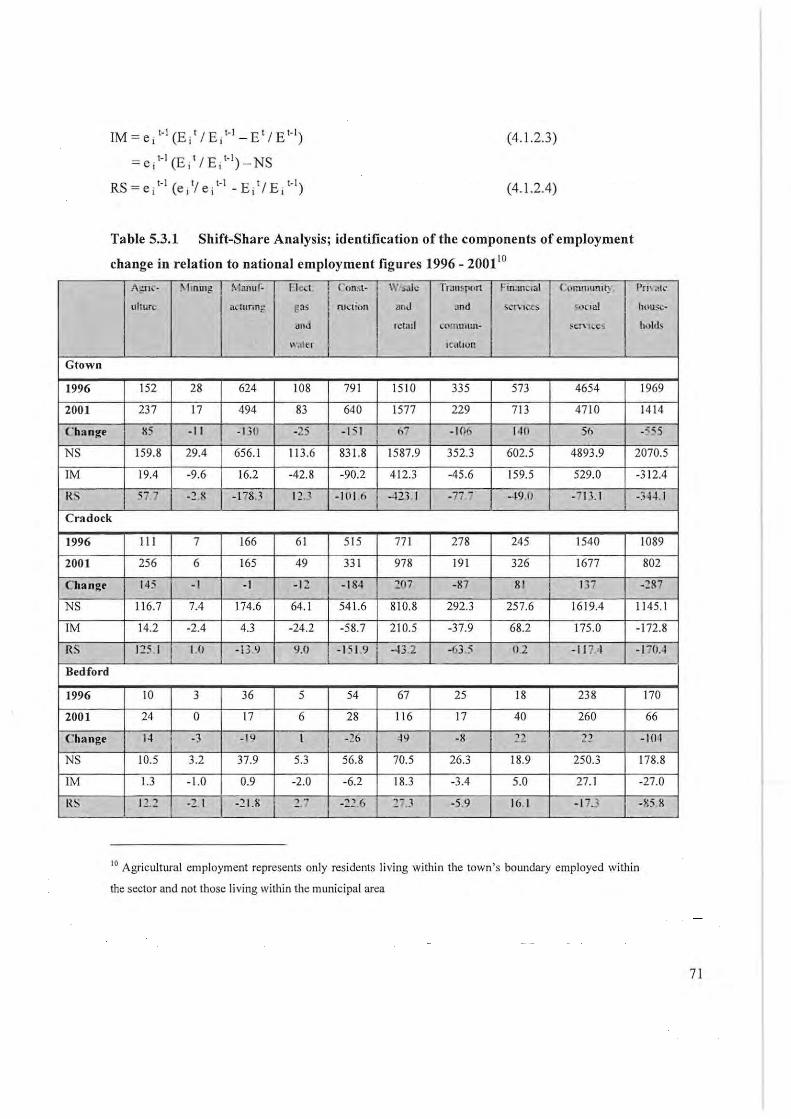
Gtown
1996
2001
Change
NS
1M
RS
1M = e, t-J (E, t iE , t-J _ E tiE t- J)
= e, t- I (E ,t I E, t-J) - NS
RS = e, t-J (e,tl e, t-J _ E, tl E, t-J)
(4.1.2.3)
(4.1.2.4)
Table 5.3_1 Shift-Share Analysis; identification of the components of employment
change in relation to national employment figures 1996 _ 2001 JO
l\~ l t"· t\lmUig ! t\1.\JIlI r· l ied Con!.l- \\' :)ail.: TI JUS('IC'rt J·in.ulclal Communl~ ! I'H \ .11'-
uhun •. I ,1\ IUnn~ g3:; ml.'l;,," an .. 1 .md <;; .. 'T" I,'.e::. ~'.KlaJ I hl)u:: ....
and Ictal! l. omUlIlll- ~el'"\ tcl!'! h •• lds
w.ller ""llIOr!
152 28 624 108 79 1 1510 335 573 4654 1969
237 17 494 83 640 1577 229 713 4710 1414
&5 -11 -1 31J -25 -1 51 07 -1 06 1411 56 -555
159.8 29.4 656. 1 11 3.6 831.8 1587.9 352.3 602.5 4893.9 2070.5
19.4 -9.6 16.2 -42.8 -90.2 412.3 -45.6 159.5 529.0 -3 12.4
577 -~ ~ -1 78.3 12.3 -1111 fI -·121 I -n .1 -19.0 -713. 1 I
-3~~ I
Cradock
1996
2001
Change
NS
1M
RS
Bedford
1996
2001
Change
NS
1M
RS
III 7 166 6 1 515 77 1 278 245 1540 1089
256 6 165 49 33 1 978 191 326 1677 802
14 5 - I -I -12 -184 ~{J7 -X7 &1 1 1>7 -287
11 6.7 7.4 174.6 64.1 541.6 810.8 292.3 257.6 1619.4 1145.1
14.2 -2.4 4.3 -24.2 -58.7 210.5 -37.9 68.2 175.0 -172.8
J ~5 I 1.0 -13.9 9.0 , -I) I.~ i -43 2 -63 :' 0.2 -11 7.4 -1 7004
10 3 36 5 54 67 25 18 238 170
24 0 17 6 28 11 6 17 40 260 66
14 -3 _I \l I -lb '" -x ::!2 ." -10 I
10.5 3.2 37.9 5.3 56.8 70.5 26.3 18.9 250.3 178.8
1.3 -1.0 0.9 -2.0 -6.2 18.3 -3.4 5.0 27. 1 -27.0
12.::! -2 I - ~U; 2.7 -:~.6 27.3 -5.9 16. 1 -1 7..1 -85.&
(0 Agricultura l employment represents only residents li ving withi n the town's boundary employed within
the sector and not those li ving wi thin the municipal area
71

I Agn ...... ~lUling \ 1anuf· l:lec( (,,'11"1· W/'t3iL' ! I'nmslhlrt r.nan .. i.u (\nnmuOIl) Pn\Jb:
ulture J{"luring £ns ru.:IIO" etnd I and '>CT\'I~~ 5,)\:;U\l hom;~·
I and l el:1I1 conunun· "I.·t\ .~s h~I J$
water IcatlOn
Pcarston
1996 20 0 8 0 23 32 7 4 127 88
2001 39 0 0 0 14 30 6 II 129 48
Chan2t I" I) -x 0 -9 -~ - I 7 2 -411
NS 2 1.0 0.0 8.4 0.0 24.2 33.6 7.4 4.2 133.5 92.5
1M 2.6 0.0 0.2 0.0 -2.6 8.7 -1.0 1.1 14.4 -14 .0
RS 15A (] I) · j(6 n .1} -7.6 -1 2 .\ -0 ·1 5 7 - 19.Q . ~ (J.(,
Somerset East
1996 146 3 207 26 21 1 265 88 107 884 506
2001 123 0 189 15 176 353 76 133 861 454
('baDge .1.1 -3 - I S -II -35 g~ - 12 ~6 , --- , · "2
NS 153.5 3.2 217.7 27.3 22 1.9 278.7 92.5 112.5 929.6 532.1
1M 18.7 -1.0 5.4 - 10.3 -24.0 72.3 -12.0 29.8 100.5 -80.3
RS -49.2 -1. 1 -34.1 -2.(1 -21 R 2.0 -u .4.3 - 169. 1 2.2
South Africa (RSA total inc unspec ified: 1996 - 9113846: 2001 - 9583765
1996
2001
814353 541550 1119971 109336 555 132 1098048 483655 680153 1580686 1053105
960486 383496 1206846 71612 520488 1454447 442734 904567 1841854 940320
Source: Own ca lculations, employment data from Stats SA 1996 and 2001 a
Key: NS = National Shift; 1M = Industria l Mix; RS = Regional Shift and G-Town = Grahamstown
While the dynamics of the shift-share analysis have been outlined at a theoretical level,
the best description of how this analytical tool operates is through a worked example.
Looking at the manufacturing sector in Grahamstown, the table indicates that 624 people
were employed in the sector in 1996 and employment decreased to 494 in 2001. The NS
during this period was 656, indicating that had employment followed the overall
employment trends, employment in the sector would have increased to 656 in 200 I. The
1M component indicates that nationa lly, manufacturing activities grew at a quicker rate
relative to other industries and that due to this above average rate, employment should
72

have increased by 16. Lastly the RS, which identifies the changes within the local
economy, was calculated at -178, which indicated that due to 'regional shifts ' 178 jobs
were lost.
Thus within the manufacturing sector in Grahamstown, given an initial employment of
624, the shift-share can be computed as:
SS = NS + 1M + RS
SS = 656.1 + 16.2 -178.3
SS = 494
(4.1.2.1)
The Shift-Share represents the employment within the industry in 2001, while the NS, 1M
and RS merely identify the components of that change. The results imply that the
manufacturing sector in Grahamstown declined due to regional changes as opposed to
national or industrial shifts.
The Eastern Cape is one of the poorest provinces within the country and as such the
economic performance of the sampled towns cannot be separated from the province itself.
In many instances the Eastern Cape itself underperformed in relation to the National
Economy, meaning that the regional shifts/job losses due to the towns ' economic
activities, for example in manufacturing, are not as high as the national analysis. So in
order to gauge the towns' performance within the provincial context, shift share analysis
was also performed at a provincial level, the results of which are shown on Table 4.3.2.
73

Table 5.3.2 Shift-Share Analysis; identification of the components of employment
change in relation to the Eastern Cape employment figures 1996 - 2001
t ·on~t· I ,",0""" I I
A~rtc· MlnlLlg Manur· t:.k"Ct " Whole na."lSflill1 C.;mmumh I i'rl\i1l~
ullurc '''" ,
·~alc and ! ', 'Clal h h, a.:: tUl mg fa, nt. tliln .::t<u at;t: I
qUdm'lI~ """ r~t::Il l lind I <!Ad p.:: rstlllil l
\\'a t.::1 I cnmm i 5er\ "l'S 1
Gtown
1996 152 28 624 108 791 1510 335 573 4654 1969
2001 237 17 494 83 640 1577 229 713 4710 1414
Change 85 -1 1 -130 -25 -151 67 -106 140 56 -555
NS 145.7 26.8 598.2 103.5 758.3 1447.7 321.1 549.4 4461.9 1887.7
1M 9.9 -8.9 -13.9 -31.0 -91.9 437.6 -39.8 288.6 526.4 -177.6
RS 8U -09 _')0 3 10.:' -26. '. - "oR.3 -52.3 - 125.0 -Zn.3 -296. 1
Cradock
1996 111 7 166 61 515 77 1 278 245 1540 1089
2001 256 6 165 49 331 978 19 1 326 1677 802
Change 145 -I -I -12 -184 207 -87 81 137 -287
NS 106.3 6.9 159 58.1 494 739 267 235 1476 1044
1M 7.1 -2.1 -4.4 -16.7 -60 223 -33 123 174 -98
RS 141.6 2 9.6 IL~ -11l~ I 15 ··C -32 2(; -IH I Bedford
1996 10 3 36 5 54 67 25 18 238 170
2001 24 0 17 6 28 116 17 40 260 66
Change 14 -3 -19 I -26 49 -8 22 22 -104
NS 9.6 2.9 34.5 4.8 51.8 64.2 24.0 17.3 228.2 163.0
1M 0.6 - 1.0 -0.8 -1.4 -6.3 19.4 -3.0 9.1 26.9 -15.3
R.'l 13.8 -1.9 -1 6 7 2.6 -175 .32.4 -4.0 13.7 4.9 -~ I.'
Pearston
1996 20 0 8 0 23 32 7 4 127 88
2001 39 0 0 0 14 30 6 11 129 48
Change 19 0 -8 0 -9 -2 -I 7 2 -40
NS 19.2 0 7.7 0 22.1 30.7 6.7 3.8 121.8 84.4
1M 1.3 0 -0.2 0 -2.7 9.3 -0.8 2.0 14.4 -7.9
RS 1 ~.5 11 -75 0 i -5.4 -111.0 0.1 5.2 -7. 1 -28.·1
74

Ag.nc. M"''''f I Manuf- I [1"'1. CO\~I- I "'" Ie I.. '>, 'Oll hn.m~· « ;'lIl1: lOr. il) Pnvalt:
ullure .0<1 I O<lunog I 3" I IUd .lOIl ! ·~alc dud ~tOt;l;pt;.· ~OI. ~ ,!I h's
qu,,~ on, I I "nJ r..:laJi .mo :tn.l pcr..;on.lI
,\,,",/ j '·',mm ' :!l \ k'e ~
Somerset East
1996 146 3 207 26 211 265 88 107 884 506
2001 123 0 189 15 176 353 76 133 861 454
Change -23 -3 - 18 - 11 -35 88 -12 26 -23 -52
NS 140.0 2.9 198.5 24.9 202.3 254.1 84.4 102.6 847.5 485.1
1M 9.4 - 1.0 -4.6 -7.5 -24.5 76.8 - 10.5 53.9 100.0 -45.7
RS -~6A -1.9 --\.8 I -15 -1.8 ~~ .l 2.1 ·23.5 -8id 1-1.5 , Eastern Cape Africa (E-Cape total inc unspecified: 1996 - 786820; 2001 - 754341)
1996
2001
70470 7153 97035 5598 43634 838 17 32850 3518 1 183189
72122 4574 90866 3762 36762 104646 27587 5145 1 196346
Source: Own calculatIOns, employment data from Stats SA 1996 and 2001a
Key: NS = National Shift; 1M = Industrial Mix; RS = Regional Shift; G-Town =
Grahamstown and S-East = Somerset East
102865
89338
The provincial shift-share analysis does highlight that on the whole the towns' economies
performed ' better' in relation to the Eastern Cape than the national economy. For
example, working again through manufacturing in Grahamstown, shown below, it is clear
that the negative RS or 'jobs lost' in manufacturing to regional changes was only 90 as
opposed to 178 in a national context. This change is largely accounted for by the
declining employment figures in the province between 1996 and 2001.
SS = NS + 1M + RS
SS = 598.2 - 13.9 - 90.3
SS = 494
(4.1.2.1)
Unfortunately, the analysis provides no insight on agriculture as the employment figures
only reflect agricultural labourers living in the town itself, meaning that a shift-share of
the sector would be misleading.
75

The analyses did, however, allow the performance of the other sectors to be reviewed.
The most significant finding was in the manufacturing industry. On both levels, all the
towns, excepting Cradock, exhibited negative regional shifts. In Grahamstown the RS
was 178 nationally and only 90 provincially, whilst Bedford exhibited decreases of 22 in
the former and 17 in the latter. This, along with the decreases in real employment within
the industry, indicates that manufacturing declined significantly, despite the fact that
nationally manufacturing employment grew between the two periods, represented by
positive IMs. The drop was not as significant on a provincial level as manufacturing
within the province also declined, represented by the negative IMs and consequently the
regional shifts were not as bad. The performance of manufacturing in all the towns is
alarming and may well account for their poor economic performances, especially
considering that the declines had been occurring for some time.
Mining and Quarrying represented a small proportion of local employment, and exhibited
only minor regional changes, and therefore did not contribute significantly to overall
economic performance of any settlement. Only Grahamstown had any industry in the
sector and employment dropped from 28 to 17. However, the decline can largely be
attributed to national and provincial shifts, i.e. negative lMs. Electricity, water and gas
exhibited some positive regional shifts in the larger towns, despite a loss of employment
in real terms. Thus, despite the evident job losses the sector performed satisfactorily
within the local economies.
In the construction industry, all towns experienced drops in real employment and regional
shifts. However, the regional shifts within the province were not as severe. Cradock,
which was the worst hit, experienced a real decline in employment of 184 jobs or a total
of 23% and had a negative RS of 152 nationally and 103 provincially. Employment in the
wholesale and retail industry increased significantly nationally between 1996 and 2001
and all of the towns, barring Pearston experienced real employment increases. Retailing
performed relatively well in a provincial context as only Grahamstown exh ibited a large
negative regional shift of 308. The result is surprising for Grahamstown, as earlier
76

evidence suggested that the town was acting as a regional urban centre, serving the needs
of a large hinterland; accordingly it would be expected that regional shifts would have
been positive. However, it is quite possible that Grahamstown was already serving the
needs of its hinterland prior to 1994, providing an explanation as to why the industry did
not grow. Another possible explanation is that the two larger urban centres of Port
Elizabeth and East London were drawing consumers from fmlher a field, negatively
impacting retailing in Grahamstown.
Despite little movement in terms of real employment in the services sector, all towns
exhibited negative regional shifts in a national context. Within the province the situation
was more positive as both Cradock and Bedford created employment, i.e. positive
regional shifts, albeit they were not large movements. Considering that services are the
largest employer in the towns it is a concern. Real employment in the financial services
grew in all the centres. However, the improvement was attributed to national and
provincial growth, as opposed to any significant regional shifts. The larger towns had
greater negative regional shifts, and these were bigger in relation to provincial
employment. This is possibly because prior to 1996 the larger towns already had
established financial institutions. Lastly, the transport and communication industry shed
real employment in all of the settlements. But the two largest towns, Grahamstown and
Cradock exhibited the largest negative regiollal shifts, as none of the others appeared to
have had any well-established industries in the sector.
The key findings drawn from the two sets of analysis are highlighted below. On the
whole the towns appeared to have declined economically in relation to the nation as a
whole as the majority of the employment decrease in the towns was accounted for by
regional shifts and not national or industrial trends. This reveals that the local economies
of the sampled towns are indeed declining economically. Evidence was also found that
manufacturing activities declined in all of the centres, despite the industry growing
nationally. The consistency and the extent of the negative regional shifts clearly indicate
that manufacturers appear to be favouring larger urban centres.
77

Shift-share analysis was also extended to the occupational data of Grahamstown and
Cradock. It was applied to determine whether there was a decline in skilled occupations
within the centres, which may account for their lowered economic vitality. It was
conducted on the two largest towns, as it was not feasible to apply the technique to the
smaller centres, as their populations were too low to be significant. The result of the
analysis, shown in Table 4.3.3 , supports the premise that the local economies experienced
an economic slump between 1996 and 2001.
Working through an example: in Cradock the number of elementary occupations
decreased from I 661 in 1996 to 1 603 in 2001. Following national trends, employment
should have risen to 1 746. However, these occupations increased in relation to others
accounting for an increase of 26. Thus the remainder of the change can be identified as a
regional shift, a figure of -169, i.e. 169 jobs were lost in the town due to changes within
the local economy. A worked example is shown below.
SS = NS + 1M + RS (4.1.2.1)
SS = 1747 + 26 -170 = 1603
l I
78

Table 5.3.3 Shift-Share Analysis, conducted on employment by occupation data;
1996 to 2001, using national employment fignres
Grahamstown 1996 i 2001 NS 1M RS
Legislators; senior officials and managers 535 367 562.6 193.0 -388.6
Professionals 2025 1091 2129.4 -575 .2 463.2
Technicians and associate professionals 690 1177 725.6 443.4 8.0
Clerks 1075 1148 1130.4 456.0 438.4
Service workers; shop and market sales workers 1378 1614 1449.0 192.2 -27.2
Skilled agricultural and fishery workers 22 1 120 232.4 -66.6 -45.8
Craft and related trades workers 1305 1056 1372.3 -204.6 -111.7
Plant and machine operators and assemblers 390 529 410.1 13.1 105.8
Elementary occupations 3477 3433 3656.3 54.2 -277.5
Undetennined 1206 822 1268.2 489.2 43.0
Cradock 1996 2001 NS 1M RS
Legislators; senior officials and managers 182 199 191.4 65.7 -58.1
Professionals 556 261 584.7 -157.9 -165.7
Technicians and associate professionals 358 661 376.5 230.1 54.5
Clerks 381 603 400.6 161.6 40.7
Service workers; shop and market sales workers 612 726 643.6 85.3 -2.9
Skilled agricultural and fishery workers 175 70 184.0 -52.7 -61.3
Craft and related trades workers 634 482 666.7 -99.4 -85.3
Plant and machine operators and assemblers 164 212 172.5 5.5 34.0
Elementary occupations 1661 1603 1746.6 25.9 -169.5
Undetermined 623 207 655.1 -252.7 -195.4
Source. Own calculatIOns, employment data from Stats SA, 1996 and 200 I a "
The decrease in professionals in both towns is remarkable and casts doubt on the
accuracy of the census data. No other evidence suggested that half of the professionals
left between 1996 and 2001. Meyer (2005*) indicted that in his opinion this had not
occurred in Grahamstown. The significant negative 1M shifts suggest that the problem
II Please refer to Appendix 4 for South African Totals to verify the calculations.
79

was more likely due to the definitions of a 'professional' between the two periods and the
way the census questions were asked. Furthermore the increase in technicians and
associated professional occupations, suggest that the distinctions between the two groups
were altered. However, for the purposes of the study it was not possible to clarifY the
discrepancies and therefore the views regarding the differences are speculative.
Craft workers, skilled agricultural and elementalY workers, also experienced significant
drops in both towns. The only areas where both towns experienced any positive regional
shifts were technicians and associate professionals and plant and machine operators and
assemblers. The latter is surprising, due to the decreases shown in the manufacturing
sector. In summary the decrease in occupations in Grahamstown and Cradock were
accounted for by regional shifts, supporting the view that the towns struggled
economically.
It should also be noted that using employment figures as the base for economIc
performance has its problems as it is quite possible for GGP to have risen in the towns
without accompanied rises in employment. However, the majority of the trends identified
were significant and thus it can be assumed that the changes within employment within
the various sectors were reflective of their economic performance.
80

5.4 Economic Base Theory and Location Quotient Analysis
Economic-base theory was the other regional modelling technique selected and due to its
ability to determine the effects of shifts in economic activity in cities, towns and regions
(Schaeffer, 1999). The theory aims to identify industries bringing additional wealth into
the town, i.e. wealth creators, which drive the regional economies, using Location
Quotients (LQ) as the measurement tool. The theory was applied to employment statistics
from both the 1996 and 200 I population censuses in order to provide additional
information on the current economic trends and the level of specialisation of industries
within the towns. A calculation of the actual economic base of the towns is also
undertaken, using employment data. This would be the percentage of the population
serving export markets that bring wealth into the regional economy. The LQs of
agriculture were computed, because these activities are minimal within the town
boundaries despite being a major economic force in the region. The formula used in the
analysis, as shown in chapter 4 is:
(4.1.1.4)
The equation illustrates the level of specialisation within each sector. The number I gives
a rough proxy for the level of specialisation within the economy, where a figure greater
than I indicates that the region or town is relatively specialised in that palticular industry
and exports more goods in that particular sector than it imports. Similarly if the LQ is less
than I it can be assumed that the particular industry is not as developed and the region
will import more goods then it exports.
However, in order to calculate the total economic base of a town it is also necessary to
calculate the propOltion of the workforce producing for export markets. Of the industries
that have a LQ greater than I, not all the workers will be serving export markets; some
will be catering for the local market (BIDC, 2002a). The proportion of the workforce
producing for the export market Eb can be determined by:
81

Eb = (LQ; -1)ILQ;
Source: BIDC, 2002a
(4.1.1.5)
Table 5.4. 1 shows the LQ of the towns using national employment figures as the base
whilst Table 5.4.2 illustrates the LQs using Eastern Cape Employment fi gures. Cradock
had a LQ of I. 8 in the services industry in 1996 and a LQ of I. 6 in the same sector in
2001 , utilis ing national employment fi gures, which indicates that the sector is relatively
specialised and serves outside areas, in other words it exp0l1s goods. Simi larly, utilising
national employment figures, the transportation and communication sector in
Grahamstown had a LQ of 0. 5 in 1996 and 0.4 in 2001. This illustrates that the sector is
not spec ialised and that the town will import more services and goods than it would
export. The two tables provide insights into the vitality of the towns during the time
periods in question. In a number of sectors, the LQs calculated using provincial data were
very similar to those using national employment figures. Therefore if a difference is not
mentioned, it can be assumed that the two data sets were fairly similar; only marked
differences between the two are noted. Agricultural LQs of the municipalities are
calculated later in the section as the sector is an extremely imp0l1ant component within
the towns' economies.
82

Table 5.4.1 LQs ofIndustries within Towns using National Employment data
'tm • l\!Jlung Mar.u r· Ek"Cl. l· .• n.-\I.- Vh.,I' ·1 r"ns~nn 1 m, , !~c:t'Ff' la~! Prt~ .l te T '/i ,k h:r. TOldl
uil l:l(' a;;:l:lring g., fUI;.(,m sal, .mJ I I hflu~c- 1Il 1ne~1
Iwater fe-WI I i ,':'01um I I holds
Grahamstown
1996 0.1 0.0 0.4 0.7 1 1 1.0 0.5 0.6 2.2 1.4 1.1 1
~OOI 0.2 0.0 0.3 1.0 1.0 0.9 0.4 0.7 2 .2 1 3 1.2 1
~iff 0.1 0.0 -0.1 0.2 0.0 -0.1 -0.1 0.0 0.0 -0 1 0.2 0
Cradock
1996 0.2 0.0 0.3 1.0 1 6 1.2 1.0 0.6 1.7 18 0.9 1
~001 0.5 0.0 0.3 1.3 11 I '3 0.8 0.7 17 1.6 0.6 1
~iff 0.3 0.0 0.0 0.4 -0.4 0.1 -0.2 0.1 0.1 -0.1 -0.3 0
lBedford
1996 0.1 0.1 0.4 0.5 1.1 0.7 0.6 0.3 1.8 1 () 1 6 I
~OOI 0.4 0.0 0.2 1 3 0.8 1.2 0.6 0.7 " 1.1 0.8 1
Diff 0.2 -0.1 -0.2 0.8 -0.3 0.5 0.0 04 0.4 -0.8 -0.7 0.0
Pearston
1996 0.6 0.0 0.2 0.0 1.0 0.7 0.4 0.1 2.0 2 I I 3 I
two 1 1.2 0.0 0.0 0.0 0.8 0.6 0.4 0.4 2.1 I 5 I 7 I
piff 0.6 0.0 -0.2 0.0 -0.2 -H. I 0.0 0.2 0.1 -0.6 0.5 0
~omerset East
1996 0.6 0.0 0.6 0.7 12 0.7 0.6 0.5 17 1.5 1.4 I
12001 0.4 0.0 0.5 0.7 1.2 0.8 0.6 0.5 1.6 1.7 I 5 I
~iff -0. 1 0.0 0.0 0.0 0.0 0.1 0 .0 0.0 -0.1 0.2 0.1 0
Source. Own calculatIOns, employment data from Stats SA 1996 and 2001a
Key: Dark Grey - LQ greater than or equal to I; Light Grey - Difference in LQs between
1996 and 200 I
12 Refer to appendix 5
83

A number of key findings were also identified through the Economic Base analysis.
Firstly, low values within the manufacturing sector indicated that impOlts significantly
outweighed expolts. However, this is not surprising considering the size of the towns, as
very few centres across the globe, even ones with growing economies, would export more
manufactured goods than are impOlted. The more important finding was the general drop
of the LQ figures in manufacturing between the two time frames, indicating that there
was a general decline.
Table 5.4.2 LQs of Industries within Towns using Provincial Employment data
Agile Mining Man uf- f'kc:- Const- Whole- han. p,'H ",n:ln • .: C,'Imm- I~ I\.\I~ ! VnJel!!r-
uhuro.! a'-ILlnJl~ nell) IIKIIOIl ".,Ie <1lld ur l'\ hl'll.'-\!-
I lIu n:;;.1
l:.l!. 1, 1:111 (;o:umun- ~ .'u .\l hold ..
h;,t~·t I~JlI. \n sen I":. ~ I G-town
1996 0.1 0.3 0.4 I."'.: l.~ T T 0.7 Lo 1.6 T:r 0.1
2001 0.2 0.2 0.4 1. 5 I 2 1.0 0.6 0.9 1.6 1\ 1.1
Diff 0.1 0.0 -0.1 0.2 0.0 -0.2 -0.1 -0.1 0.0 -O . ~ 0.9
Cradock
1996 0.2 0.1 0.3 16 Ii 1.4 I 2 1.0 1.2 1.6 0.1 -- -- -2001 0.5 0.2 0.3 ~.O 1.4 1.4 1.0 1.0 J.3 I :; 0.5
Diff 0.3 0.1 0.0 0.3 -004 0.0 -0.2 -0.1 0.0 -0.2 0.4
Bedford
1996 0.1 0.4 0.4 0.9 I. .' 0.8 0.8 0.5 1.3 1.7 0.2
2001 0.4 0.0 0.2 I 3 0.8 1.2 0.6 0.7 2.2 1.1 0.8
Diff 0.2 -0.4 -0.2 0.4 -0.4 0.4 -0.2 0.2 D.C) -0.6 0.6
Pearston
1996 0.6 0.0 0.2 0.0 1.I 0.8 0.5 0.2 1.5 1.8 0.2
2001 1.3 0.0 0.0 0.0 0.9 0.7 0.5 0.5 1.5 - ~3 1.5
Diff 0.6 0.0 -0.2 0.0 -0.3 -0.2 0.0 0.2 0.0 -0.6 1.4
S-East
1996 0.6 0.1 0.6 12 1.3 0.8 0.7 0.8 1.3 1.3 0.2
2001 0.5 0.0 0.6 1.1 1.3 0.9 0.8 0.7 1.2 --'T4- 1.3
84

I Diff 1-0.1 1-0.1 I 0.0 1-0.2 I 0.0 I 0.1 I 0.0 1-0.1 1-0.1 I 0.1 1.2
Source: Own calculations, employment data from Stats SA 1996 and 2001a 13
Key: LQ greater than or equal to I ; Light Grey - Difference in LQs between 1996 and
2001
Three sectors stood out as the predominant exporters, having LQs consistently above I, in
most of the towns and in both sets of calculations in the tables above, namely
construction, services and private households.
Despite the high LQs in construction, it is most likely that the figure merely represents
short-term boosted local consumption, as is frequently the case within the property and
construction industries (BIDC, 2002a). The generally lower LQs in 200 I than in 1996
support this view. Government housing schemes are one possible reason for the high
figures. However, these industries generally serve only local markets, and thus do not
expand the economic base of the towns.
Employment by private households also cannot be considered an economic base, as the
industry brings in very little additional income into the towns, nor do any of them
'export' this type of employment. Exceptions do exist, such as student housing in
Grahamstown and B&B's elsewhere. However, the high LQs in this field are largely due
to the higher percentage of houses employing domestic workers, not because the sector is
an economic driver.
Evidence suggests that the towns act as 'service' centres, not only for their populations
but also for those living in rural areas surrounding them, which accounts for the high LQs
in that sector. From a developmental viewpoint, it emphasises their importance, as they
do extend personal, community and social services beyond their boundaries, to many
people living in rural areas who require them. The LQs were generally lower in the
provincial context, indicating that the Eastern Cape economy is highly weighted in the
13 Please refer to appendix 5
85

services industry. Services thus represent the largest economic base/ industry in terms of
employment.
Retail and trade industries, are generally not income creators. Cradock is an exception to
this, exhibiting a high national LQ figure of 1.3 . As such it is possible to identify the
town as a retail centre within the region, serving the town and surrounding rural
populations. Adami (2004*), who runs a wholesale outlet within Cradock, indicated that
he also served consumers and traders outside of the town as far a field as Hofmeyer and
even Jefferies Bay The latter is remarkable considering the distance between the two
centres. Transport industries are also more successful in Cradock than in any other of the
towns, almost certainly due to the NIO highway, which passes directly through the town.
It is possible to calculate the economic base of an area through location quotients and
employment data. Table 5.4.3 utilises this method to calculate the export base of all the
towns, this is illustrated on the following page.
I
86

Table 5.4.3 Economic base, by sector, using national employment figures
Community Sen'ices Electricity. Gas and Water
1.0 I'b E\.p~\n I
I h f:,' P'Ort rmplev [mpl .. ,,· I I.Q mer.! !:.mph)y*
ment i Empl,'"
menl l Eb"el ) men: fFr*el '
G-tO\\ n
1996 4654 2.2 0.54 2521 0.7
2001 4710 2.2 0.54 15:!8 1
Cradock
1996 1540 1.7 0.40 615 1
2001 1677 1.7 0.42 7 \0 49 1.3 0.2 14
Bedford I
1996 238 L8 0.44 104 5 0.5
2001 260 2.2 0.54 141 6 1.3 0.2 1
I Pearston I
1996 127 2.0 0.50 64 0 -
200 1 129 2. 1 0.51 66 0
S-E"" ..
1996 884 1.7 0.42 375 0.7
2001 861 1.6 0.38 331 0.7 -_ . _--- - .. -- - ---- -
Source: Own calculations, employment data from Stats SA j 996 and 200 j a
Key: Eb = Basic employment, export employment.
bnplo)
mem
771
978
116
Wholesale and Retail Tota l
LQ j ' h l'xp<'l11 f,,: Total
b PIIII Lmplo ... - tlllr lo\ [ mpk; %
mClll Ii b"~1) m.:1i: mem
1 2521 1230 1 20.5%
0.9 2528 11 352 22.3%
1.2 0.2 128 743 5335 13.9%
1.2 0.2 215 939 5030 18.7%
0.7 104 771 13.5%
1.2 0.2 :!2 164 618 26.5%
0.7 64 365 17.5%
0.6 66 326 20.3%
0.8 375 2933 12.8%
0.8 331 2756 12.0%
87
1-

Table 5.4.2 illustrates the industries in the towns which contribute to their economic base,
i.e. sectors with a LQ greater than 1, and the percentage of the town' s workforce
producing goods or services for export, i.e. the extent to which the local economy brings
in external money into the local economy. Theoretically it also indicates that if money
was invested into the towns the extent to which it would generate economic growth. This
is also represented graphically on figure 4.4.1 below.
G-town Cradock Bedford Pearston S-East
Towns
Figure 5.4.1 'Export type' employees as a percentage of total employment
Source: Own calculations, employment data from Stats SA 1996 and 2001a
The figure illustrates the percentage of the town's workforce producing goods or services
for export. A number of interesting results were found. Firstly, the economic base
increased in all of the towns between 1996 and 2001 , barring Somerset East. However,
the growth can largely be attributed to the services sector, which, as mentioned, is the
primary export base of all the towns. Grahamstown had the highest economic base, which
is not surprising due to the size and the nature of the town, whilst surprisingly, being the
third largest town, Somerset East had the lowest economic base. The towns all exhibit
lower LQs on a provincial level, due to the higher percentage of employment in the
services sector compared to national trends . Essentially the percentage contribution of the
services sector in the Eastern Cape is larger than its contribution nationally. This means
that the LQ for services is far lower in the towns in a provincial context. This would
impact negatively on the measure of their economic base.
88

A determination of the economic base of the towns, without considering agriculture would be
misleading. However, the only way to determine the town's links to the sector would be to
calculate the LQ of the municipality in which it is situated, as presented in Table 5.4.4.
Table 5.4.4 Agricultural LQs oflocal municipalities, 1996 and 2001
Local Municipalities Towns 1996 2001
Inxuba Ycthemba Cradock 2.7 3.0
Blne Crane Route Somerset East and Pearson 4.6 3.9 ---
Nxuba Bedford 4.1 3.4
Mak:lI1a Grahamstown 2.2 1.5
Source: Own calculatIons, em ployment data from Stats SA 1996 and 200 I a
The calculations confilm that agriculture is the pnmary economIc driver within the
municipalities as exhibited by extremely high LQs, ranging from 1.5 to 4.6. While it was not
possible to include the agricultural data in the assessment of the towns themselves, this sector
needs to be taken into account when reviewing their local economies. A worrying factor for
the towns is that the agricultural LQs dropped in all of the municipalities excepting for
Inxuba Yetemba between 1996 and 2001.
Taking the shortcomings of Economic Base analysis into account and the fact that
employment may not always accurately reflect economic activity in a town, it may be
concluded that the method indicates very clearly the dependence of all of the towns on
agriculture as the major export activity. Whilst this is not surprising, due to the nature of the
region, it does indicate the problems that the towns and regions would experience should the
agricultural sector suffer, as the LQ figures suggested may have happened in some of the
municipalities between 1996 and 2001. The results also indicate that Grahamstown is the
only town that is not significantly dependent on this sector, as reflected by relatively low
municipal agricultural LQs figures and its reliance on the many educational institutions;
accordingly it also had the highest export base. The only other major expOlt base within all
the towns was the services sector.
89

5.5 Social Accounting Matrix
The chapter thus far has analysed the economy of the five small towns with the best available
regional modelling techniques subject to severe data limitations. A Social Accounting Matrix
was also used to identify critical linkages within the towns' local economies.
The matrix allowed a number of hypothetical scenarios to be tested and due to the double
accounting mechanisms to forecast the impacts of shocks within all sectors of the economy.
Six scenarios were tested, namely a:
• 10% decrease in value of agricultural production;
• 10% increase in the value of agriculture production;
• RIO billion investment in agriculture;
• 5 % increase in value of production within agri industries;
• RIO billion investment in agri industries, and
• RIO billion investment in the petroleum industry.
Given the strong links all of the towns have with the agricultural sector it would be
reasonable to assume that a decrease in agriculture within the national economy would have a
major economic impact on small towns in rural areas and from this it would be possible to
deduce impacts on their regional economies based on shocks to the national economy. In
other sectors, e.g. manufacturing, an external shock would have little or no impact on the
towns as other economic factors, such as agglomeration forces, have already resulted in these
types of activities relocating towards larger urban centres and thus the effects of the shocks
would be concentrated in or around the larger centres and thus would have little or no
impacts on the towns.
The scenarios were run through were run throu gh the IFPRI South African SAM and yielded
the results highlighted below on table I. They were run though the theoretical framework
90

presented in section 4.2.6. The final calculation is shown below, and represents the final
changes in intermediate inputs.
(I-A2)"" F -(l - A)-" F = [(I-A2) - (l-A)] = t; y' (6)
T bl a e 5.5. 1 r ApplIcation 0 f h SAMI4 t e
(Figures In R10 billion R'IO billion Investment investment
I 10% 10% Increase I R 1 0 billion ! 5% increase
Billions) decre~se In agriculture Investment In I in Agro l in agnc I agric Industries In Agro In petroleum
Industries ,
Sectors AGR -10126.8 12278.0 22.1 153.1 6.6 1.7
MIN -454.1 550.6 1.0 18.0 0.8 4.2
AGI -2709.1 3284.7 6.0 530.3 21.7 3.2
TEX -551.4 668.5 1.2 24.6 1.0 0.8
PPP -543.6 659.1 1.2 36.4 1.5 0.8
PET -817.4 991.0 1.8 29.4 1.2 14.8
CHM -1430.8 1734.8 3.2 49.1 2.1 1.4
HEV -533.0 646.3 1.2 28.9 1.2 0.8
MAC -1148.9 1393.1 2.5 49.3 2. 1 1.7
OHM -573.1 694.9 1.3 32.3 1.4 0.9
ELE -465.8 564.8 1.0 20.9 0.9 0.8
WAT -1514.7 1837.8 3.9 26.7 1.7 1.0
CON -184.7 223.9 0.4 8.5 0.4 0.3
SER -10472.9 12698.1 23.1 612.0 25.5 19.8
Inputs CAP -3583.6 4345.0 7.9 155.9 6.6 5.6
LABLO -1338.0 1622.3 2.9 55.4 2.3 1.7
LABMED -1055.1 1279.3 2.3 61 .5 2.6 1.9
LABHI -538.3 652.7 1.2 32.6 1.4 1.1
FIRMS -3319.4 4024.8 7.3 144.4 6.1 5.2
Households HHLeast -92.3 111.9 0.2 4.1 0.2 0.1
HHLow -203.6 246.9 0.4 9.2 0.4 0.3
HHMiddle -2141.6 2596.6 4.7 103.5 4.3 3.3
HHHiQh -1103.3 1337.8 2.4 56.0 2.3 1.8
HHHighest -990.0 1200.4 2.2 46.0 1.9 1.6
Total -45891.5 55643.0 101 .7 2288.3 96.2 74.9
Source: Own calculatIOns based on IFPRl 1999 South Africa SAM data set prOVIded by J.
Juana
14 Calculations are shown in Appendix 6
91

The table indicates the particular impact that the external shock would have on the particular
sector as well as the other sectors and components of the economy. Despite representing the
national economy the tests yield some interesting resul ts which have various implications for
the towns within the study. Some of the major findings include:
• Agricultural production is most strongly linked to the servIces sector, e.g. a 10%
decrease in agriculture leads to an RI 0472.9 billion loss to the services sector. Being
the dominant sector within all the towns this illustrates their vu lnerabi lity to changes
within the agricultural sector. These linkages would tend to be stronger within small
towns due to their proximity and reliance on agricultural production.
• A RIO billion investment in the agricultural sector results in a RIOI billion boost for
the national economy, illustrating the multiplier effect. Neither similar investments in
the agri industries or the petroleum sector would stimulate the national economy to
such an extent by only generating R96 and R75 billion respectively. In addition the
benefits of investments, such as in the petroleum industry would be concentrated in
the larger urban centres.
• In tenns of growing the regional economies of small towns it would thus appear that
investments and or assistance within the agricultural and agri industries sectors would
impact most significantly and should thus be the primalY focus of growth schemes in
these areas.
• However, even investment within these sectors results in major leakages from the
local economies eg a RIO billion investment in agriculture results in an R 3.2 billion
rand boost to the chemical sector but logically this boost would not be felt by any
small towns in the Eastern Cape Midlands. It further emphasises the multiplier effect
is smaller in small towns due to the number of leakages within the local economies.
While the SAM has the ability to test various scenarios at a national level and provides
insight it unfortunately adds only marginally to an understanding of the differential growths
in the economies of small towns.
92

5.6 Conclusion
Employment statistics between 1996 and 200 I revealed a dramatic decline in employment
within all the towns. When the data sets were subjected to Shift-Share and Economic Base
Analysis the fmdings also suggested that the towns' economic vitality had diminished and
illustrates sectors in which the towns had declined or grown. The Shift-Share analysis
indicated that in both a provincial and national context, the decrease in employment was due
to regional declines and negative regional shifts and not national or industrial trends,
illustrating the weakened regional economies. However, the declines were more significant
compared to national employment figures . Location Quotient analysis yielded similar results
indicating the towns' reliance on particular sectors and a general decline in the LQ figures
between the two time frames.
Agriculture was identified as the dominant economIc force within the region whilst the
services industry provided the backbone of the towns ' actual economies in terms of
employment. Manufacturing performed poorly, indicating the presence of other external
agglomeration economies drawing these activities away from the smaller urban settlements.
The national Social Accounting Matrix additionally highlighted that there were numerous
leakages within the local economies of small towns and that growth in sectors, such as
manufacturing and the chemical sector, would tend to impact larger urban centres. The strong
linkages between the agricultural and services sectors will leave the towns in a vulnerable
position should the agricultural sector decline and emphasised the importance of the sector
for the towns.
93

Chapter 6 Local economic development and private
entrepreneurial activities
The quantitative analysis of the towns revealed detailed information on their current
economic performance and sectoral linkages. However, it was not possible to explain the
different trends and growth trajectories exhibited within the sample towns. In addition the
extent to which current trends could be reversed through development initiates such as
Local Economic Development was not addressed. Thus, a qualitative analysis was
undertaken to acquire additional information, including subtle economic trends not
picked up by the statistical analysis as well as other factors which could alter the towns'
growth potential, such as Local Economic Development and other growth drivers.
Qualitative research can be broadly defined as research that is not based on any statistical
procedures (Strauss and Corbin, 1990: 17 in Hoepfl, 1997: 2). A common tool used in
qualitative research is purposive sampling, which seeks/selects information rich subjects
in order to draw out as much knowledge as possible on a particular subject matter
(Patton, 1990 in Hoepfl, 1997: 3). Purposive sampling techniques were applied to a set of
structured interviews which were conducted in the towns.
6.1 Structured Interviews
Interviewees were selected due to specific knowledge they possessed on the towns and
included municipal officials, prominent businessmen and other knowledgeable residents.
Communication was made telephonically to set up appointments during the respective
field trips to the each of the towns. Table 6.1.1 lists the people selected for the interviews
as well as their positions.
94

Table 6.1.1 Structured interviews conducted
Town Person Position
Cradock MrTantsi Municipal Manager of Cradock MRCAdami Owner of Adami's grocers
( a family business since 1904) MrXMaki' LED Manager Inxuba Yetemba Local
Municipality Mr D. Coetzee Past Municipal Manager and Current
Councillor MrPTam Owner of the Tams chain stores MrW. Walker Dairy Farnler, milks 800 head of cattle daily Mr Schulze Current Councillor Mr P and Mr M Fanners Antrobus MrC. Lang Safari Hunter
Grahamstown MrJ. Accorn Councillor Professor P. Vale Head of Politics Department at Rhodes
University MrC. Meyer Owner of Makana Brick and Tile Professor R. Van der Head of the Grahamstown Residents Merwe Association Mr R Beer Owner of the Beer Property Group M. Crampton CEO ofNISC Mrs B Ngcungca' LED officer Makana Municipality
Bedford Mr J Van Heerden Corporate Services Manager Mrs Kim Van Niekerk Local Estate agent Mr A Gqezeengele • LED Officer Nxuba Municpality Mr David Khoury Local Artist owner of Bedford Craft Centre Mr Ben and Lana B lorn Owners of Eagle's Hout Furniture
Somerset East MrH Machant Mayor of the BCR Municipality
and Pearston Mr Rob Bcach Director of the BCR Development Agency Mr PJ Fourie Owner of PJ Engineering and Thermo Fluid
Engineers Mr Zola Tetswana Previous LED officer and currently employed
by the BCR Development Agency Mr Zola Dora Supervisor on Infrastructure and Community
Service, Pears ton Mr Chris Wilken Employee of the BCR Development Agency Mr Luvuyu Matanga Social Worker, Department of Social
Development, Pearston Mr Nico Lombard Employee of the BCR Development Agency Mr PJ Davenport Owner of the Pearston Hotel and Pearston
Bottle Store Mr A. Mtshudu' LED Manager Blue Crane Route
Municipal ity. . . Key: BCR - Blue Crane Route; * Telephomc lIltervlews conducted WIth mUnIcIpal LED
officials
95

A structured questionnaire was prepared, see box 1 below, and was used as a guide
during the interviews.
Box 1: General Outline ofthe structured interviews
1) Please describe what you do for a living and your personal and professional
relationships with the respective town?
2) From a personal perspective what are the limitations of living in the town?
3) From a professional point of view what are the limitations of working or
operating in/or around the town?
4) What are the personal advantages of living in the town?
5) What are the advantages of working or running a business inlor around the
town?
6) From wbere do you purchase both private and professional goods?
7) In your opinion what might limit potential business activities from locating
within the town?
8) What advantages does the town have for businesses/ people wanting to
relocate?
9) In your opinion what local factors stifle local economic initiatives?
10) Has the local municipality been helpful to you and your business operations
(where applicable)?
11) List various ways in which the municipality could improve or become more
effective?
12) Have you been involved in any LED project? If so please provide details?
13) If yes did the municipality assist?
14) Are you aware of other personal LED projects in the town? If so please give
details?
15) What do you think are the growth prospects of the town?
16) Do you have any other information relating to the town itself that may be of
assistance for the purpose of the study?
96

Because the interviews targeted different role players it was possible to acquire detailed
information on the towns, their economies and developmental initiatives. Full research
notes were taken and are provided in appendix 2.
6.2 Local Economic Development (LED)
The Local Government Systems Act of 2000 charged local government structures with a
mandate "to provide for the core principles, mechanisms and processes that are necessary
to enable municipalities to move progressively towards the social and economic
upliftment" (RSA, 2000). Local Economic Development units at a local level are the
main thrust to achieve this outcome. "In order to promote economic development, it is
increasingly recognised that micro-economic measures at the local level are needed as
well as macro-economic measures at the national level" (World Bank, 2006). Local
Economic Development or LED is a bottom-up type approach that has been attempted by
many centres around the globe and generally encapsulates micro-economic measures. It
is based upon "endeavours, innovation and entrepreneurship of local agents who seek to
achieve meaningful and sustained economic and socia l betterment of their local area"
(Nel, 1994; 265).
LED is an important aspect of the study as it may have the potential to revitalise the
economies of small towns or it may simply be a waste of scarce government resources in
trying to achieve economic growth where it is unachievable.
6.1.1 LED Studies
Within South Africa the principal study of small town development is Stutterheim in the
Eastern Cape (CDE, 1996: 12). Prior to 1996, the local economy appeared to be stagnant
like so many other small rural towns. The ' Stutterheim Initiative ' was launched in 1990,
and the newly established forum settled political disputes and began to address socio
economic problems within the town (CDE, 1996: 13). Despite the progress made by the
Stutterheim Foundation, problems till existed in the town (Mncwabeni and Bond, 1999).
97

LED projects in the town were fa irly limited and many were not sustainable. Despite the
training schemes adopted, employment opportunities remained limited, often resulting in
residents leaving (Mncwabeni and Bond, 1999). The story of Stutterheim clearly
illustrates that LED is not a miracle cure for small towns. Despite the positive aspects
achieved, a major economic revival was not achieved, although it should be said that the
conditions in the town would have been far worse if no actions had taken place.
Alicedale is a former rai lway town located in the Eastern Cape which had extremely high
unemployment levels with a stagnant local economy. However, a public private
partnership which included Makana Local Municipality led to the creation of a high
profile "multi-faceted tourism village that would boast a world-class golf course, a game
reserve, residential golf course, four star hotel, cultural village, conference centre, spa
and wellness facility and a new bar/restraint collectively known as Bushman Sands."
(World Bank, 2006: 72). The private sector provided the bulk of the financial capital and
management expertise whilst the public sector faci litated the project, provided basic
infrastructure and sourced capital for the local community so they could have joint
ownership. It was estimated that the initiative would lead to a number of socio economic
spin-offs, including an estimated 500 permanent and temporary jobs and generate
business opportunities for residents in the town. The example illustrates that private
sector buy-in and an effective public private partnership can revive the fortunes of
flagging small towns, particularly if there are marketable business opportunities (World
Bank, 2006: 72). However, it must be noted that the town has specific locational factors
which made it an ideal location for the establishment of the hotel and golf course
including its proximity to local game parks, cheap land and attractive buildings.
Wuppertal is a small community/settlement in the Cederberg Mounta ins near Cape Town.
I! was characterised by unemployment of around 75% and high out-migration.
Incorporating a central village and 14 outstations the region has a popu lation of2550 and
covers an area of 36 000 hectares. The topography and climate also limits the possibility
of types farming activities. Through the support of regional NGO, A-SNAPP
(Agribusiness in Sustainable Natural Africa Plant Products), Rooibos tea was identified
98

as a niche market product which could be produced in the area. Currently the project has
been developed into a commercial venture with 170 farmers now growing rooibos and
secondary employment has been created on these farms and through the ' tea court'. The
NGO was also critical in establishing market linkages particularly with the European and
American 'fair trade ' markets (World Sank, 2006: 74). However, the actual location of
the town and the ability to grow rooibos in the region was the primary reason for the
establishment of the industry.,
Internationally, LED also impacted on Tumby Say, a small town located in southern
Australia. Due to natural disasters, shifting commodity prices and other macro-economic
variables the economic forecast for the town looked bleak and a local newspaper in 1991
published a story on Tumby Say entitled "A town waiting to die". Shaken by the article
the local council and other concerned residents organised a community meeting where
schemes were discussed to revive the town's economic fortunes and through their
collective actions Tumby Say had the third fastest rural town growth rate in South
Australia in 200 I (Kenyon and Black, 200 I). Some of the activities that stemmed from
the original community planning event included:
• Town beautification projects;
• Introduction of new information technology opportunities;
• Development of a telecentre;
• Development of a marina; and
• Retiree promotion initiative.
The case studies indicate that LED initiatives have the ability to stimulate economIc
growth in small towns. However, these are generally linked to specific locational
developmental advantages such as their proximity to tourist attractions or natural
resources. If these are not existent the ability of LED initiatives to rejuvenate these towns
seems limited.
99

6.1.2 LED goals and strategies within the towns
[nfonnation was collected from the municipal lOPs, telephonic interviews with municipal
LED officials and the other structured interviews. In order to achieve this goal a number
of issues were addressed. Firstly, the aims of the municipal LED strategies were
identified to provide a context/benchmark by which to 'judge ' the actual effectiveness of
the policies. Secondly, the actual impacts of the respective municipal LED actions were
reviewed and assessed in relation to the actual economic environments within the towns.
The aims of the municipal LED policies are identified below in table 6.2.1. An
examination of the table illustrates that optimistic goals were set by municipalities with
all strategies hoping to boost the local economy and increase employment through LED
actions. Nxuba went as far as to set out specific objectives, such as increasing economic
growth in the area by 10% by 2008 through tourism. All the other municipalities
explicitly stated that LED activities were also directed towards poverty alleviation,
barring Nxuba, which implied this outcome.
100

Table 6.2.1 LED objectives by Municipality
Municipality
Makana
(Grahamstown)
N'Auba
(Brdfurd)
Broad objectives
To stimulate the local economy
Job Poverty A
Boost Tourism
Boost Ag,f1CUIllJre
Promote SMMEs
Promote Agriculture
Specili~ Goal.
Boost the number of tourists by
2006
the
potential of the region by 2009
pal1icularly through emerging
farmers
Increase the no. SMMEs by
20% by 2008
growth by 10% through tourism
by 2008
Increase agricultural output by
20% by 2008
Stimulate local economic growth N/A
the living standards of NI A
.'>[)llree: Extracts 2005 and BCR, 2005)
101

6.2.2.1 Cradock
Cradock is situated midway between Port Elizabeth and Bloemfontein. Despite being
located along a major travel route the town faces locational disadvantages by not being
situated near any large population centre. There is mass unemployment and poverty in the
town as only 25% of the population were unemployed and 47 % of the population were
not economically active in 2001 (Stats SA, 200Ia). Within this context the municipal
LED strategy outlined to stimulate the local economy, promote job creation, and assist
with poverty alleviation and to boost tourism and agriculture. The actual projects that
have been implemented or proposed in Cradock to achieve these outcomes are li sted
below in table 6.2.2.1 on the following page.
Current LED projects have benefited 117 - 127 people, the majority of who were
beneficiaries within two major projects, at a cost of just over R5 .5 million. Of
significance is the fact that the cultural village, which was an attempt to promote tourism
and to stimulate employment, was a failure as the initiative collapsed and never really
attracted much tourism activity (Schulze, 2006). The Expanded Public Works funded
programme of fencing off the cemetery has also had a minimal impact, creating only 6
temporary jobs despite costing over 2 million rand. The community gardens initiative had
the greatest impact in tenns of the number of people assisted; however, it was primarily
aimed at poverty alleviation. Thus whilst implemented LED projects may have been
acting as a poverty alleviation tool they do not appear to have the capacity to alter the
towns economic potential. A similar assessment can be made of the planned projects.
Although there will be approximately 300 beneficiaries to construct a remembrance
garden for the Cradock four, who were murdered anti-apartheid activists, the benefits will
only be temporary and unless the garden attracts significant numbers of tourists the Rl.6
million spent may not have a significant impact within the town.
102

Table 6.2.2.1 LED Projects initiated in Cradock
Town: Cradock
Projects Budget Partners R (000)
Hawkers Inrrastmcture' 686 DEAT
Tourist Centre* 700
Create an economic 100 DEAT
profile'
Remembrance Garden* 1600 DEAT
Sub-total 3086
Community gardens 720 Dept Agric
and Social
Dev
Promotion of SMMEs 160
Siyazondla Programme 166 Dept Agric
(crop farming support)
Masimanye Bakery 175
Project
Livestock Project 600 Dept Agric
Fencing of the cemetery 2 000
Training Tour Guides 100 EPA
Vusubuntu Cultural I 600 DEAT and
Village DPLG
Sub-total 5521
Total 8607
Source: Inxuba Yetemba, 2005 and Makl, 2006
Key' - Proposed Projects (Have not been finalised)
Status Jobs created! Expected
Planning 0
Planning 0
Planning 0
Planning 300
temporary
300
Implemented 50 - 60
beneficiaries
Implemented 15
Implemented 0
Implemented 13
Implemented 3
Completed 6 temporary
Completed 0
Completed 30
beneficiaries
117-127
417-427
103

6.2.2.2 Bedford
The objectives identified for LED in the Nxuba municipality were to increase the number
of SMMEs by 20%, boost agricultural output also by 20% through emerging farmers and
increase GGP by 10% through tourism, all by 2008 (Nxuba, 2005). Considering that in
200 I only 630 people were employed in the town these are optimistic aims. Table 6.2.2.2
clearly illustrates that there is very little chance of these claims being met.
Table 6.2.2.2 LED Projects initiated in Bedford
Town: B~dford
Projects Budget Partners Status Jobs R (000) created/
Expected
Tourism Master 250 Planning 0
Plan'
Cabinet Making' 100 DEAT Planning 22
Cotton Project' 420 (Just Da Gama Planning 350
for textiles,
fencing) Amatole
Development
Agency
Sub-Total 770 375
Community 100 Dept of Agric Expanding 32
Gardens
Promotion of 250 OSSA Implementation 28
SMMEs
Promotion Heritage 150 Implemented 0
Garden Festival
Sub-Total 500 60
Total 1270 435
Source: Nxuba, 2005; Gqezengele, 2006
Key' - Proposed Projects (Have not been finalised)
104

The table illustrates that only 3 LED projects had actually been implemented in Bedford
by 2007 which directly impacted on 60 people. It is more difficult to measure the actual
benefits of the Heritage Garden Festival because it did not stimulate direct employment;
however, it created secondary benefits by drawing tourists into the town. According to
Gqezengele, (2006) a large cotton growing project has been proposed in conjunction with
Da Gama textiles and the Amatole Economic Development Agency. This initiative, if
implemented, would go a long was to addressing povelty and unemployment in Bedford,
as there are a proposed 3 SO beneficiaries. However, due to the nature of the initiative its
actual implementation cannot be assured, nor is it likely to impact on the municipality 's
LED targets for 2008. While it is clear that the municipal LED policy has gone some way
towards alleviating poverty although it does not appear capable of meeting its municipal
LED objectives.
6.2.2.3 Pearston
The economic situation in Pearston could be described as dire (Doro, Davenport and
Fourie, 2006*). Only 331 people were employed in 2001 out of a population of 404 I
(Slats SA, 200Ia). Machant (2006*), the Mayor of Blue Crane Route Municipality,
indicated that because of this municipal LED projects tended to focus on poverty
alleviation. By 2006 only one LED project has been implemented in Pearston namely
community gardens, which impacted on approximately 20 people (Mtshudu, 2006). Even
the sustainability of the community gardens appeared to be threatened by high levels of
theft, vandalism and damage due to livestock (Ooro and Matanga, 2006*).
lOS

Table 6.2.2.3 LED Projects initiated in Pearston
Town: Pearston
Projects Budget Partners Status Jobs R (000) created/
Expected Mohair Project' - Dept Agric Planning 100
Bread Baking' 100 - Planning
Ostrich Breeding 75 Planning 6
Programme*
Sub Total 175 106
Community Gardens 250 Dept Agric Implementation 20
Sub Total 250 20
Total 425 126
Source: BeR, 2005; Mtshudu, 2006
Key' - Proposed Projects (Have not been finalised)
6.2.2.4 Somerset East
The municipal objectives for Somerset East, which are the same for Pearston, are: to
stimulate economic growth, reduce unemployment and to improve the living standards of
residents. The actual municipal projects that have been undertaken to achieve these
outcomes are listed below in table 6.2.2.4.
106

Table 6.2.2.4 LED Projects initiated in Somerset East
Tawil: Somersd East
Projects Budget Partners Status Jobs R (000) created
Compile Skills database' 100 Planning 0
Prepare Integrated 200 Planning 0
Tourism Development
Plan'
Ostrich Breeding 75 Planning 0
Programme*
Sub Total 375 0
Integrate with BCDA 75 BCDA Implementati
on
Car Wash' 75 Implementati 6
on
Biltong Festival 650 Implemented 0
Laundry project 250 7
Sub Total 1050 13
Total 1425 13
Source: BeR, 2005; Mtshudu, 2006
Key* - Proposed Projects (Have not been finalised)
The municipal LED strategies have had very little impact with only 13 jobs created in
Somerset East. However, the municipality is fortunate enough to have an economic
development agency tasked with stimulating economic development which appears to be
driving LED and which has made considerable strides in this regard.
The Biltong Festival, an annual event which the municipality has promoted, has provided
secondary benefits for the town through increased spending (Mtshudu, 2006). A laundry
SMME, employing 7 people, is the only LED project which has created employment
(Mtshudu, 2006). Thus it is evident that the very few municipal LED activities in
107

Somerset East are unlikely to alter its economic potential. It also appears that without the
assistance of the BCDA the municipality could not achieve its goals.
6.2.2.5 Grahamstown
Grahamstown's LED objectives were to alleviate poverty and create jobs; a number of
projects were planned to achieve these outcome. These are listed below in table 6.2.2.5 .
Table 6.2.2.5 LED Projects initiated in Grahamstown
Town: GrahalTlstown
Projects Budget Partners Status Jobs R (000) created!
Expected Establish a 'One Stop 82 - Not -Shop' for potential implemented
SMMEs
Hawkers Infrastructure' N/A - Planning -Makana Goat Project· 9000 Dept Agric, Planning -
DEAT
Expansion of Industry 100 Rhodes Implemented -andSMMEs· University
Sub total 9082
Establishment of B&Bs - - Implemented 46
in disadvantaged
communities
Botanical Garden 1000 Parks Dept, Implemented 150
DEAT temporary
Develop Website 5 Completed -Sub total 1005 196
Total 10087 196
Source: Makana, 2005; Ngcungca, 2006
Key· - Proposed Projects (Have not been finalised)
108

There are a number of notable projects which have the capacity to impact positively on
the town. A municipal website was created to promote investment in the region. A public
works programme was initiated in the Botanical Gardens, which created 150 temporary
jobs as well as creating secondary amenities for local residents and visitors and was
achieved though a combination between a municipal and national initiative. Forty six
B&BS were developed in previously disadvantaged areas to operate during the annual
National Arts Festival. The development of a 9 million rand goat project was also being
considered, although there is no certainty whether the project will be implemented or how
many beneficiaries there will be (Ngcungca, 2006).
The evidence suggests that some positive steps have been taken by the municipality in
relation to LED. However, limited direct employment was created.
6.3 Private business and entrepreneurial activities
Private business and entrepreneurial activities playa critical role within the economies of
small towns. Individuals or private entities acting in their best interests have the ability to
create positive externalities which can bring wealth into the town and create employment.
The following section identifies these types of activities.
6.3.1 Cradock
There were a number of private initiatives which were critical to the economy. Sandra
Antrobus bought and renovated the Victoria Hotel and opened a set of Guest Houses.
Tour buses regularly stop over, 37 in November 2004, largely due to marketing and the
reputation of the hotel (S. Antrobus, 2004*). Apart from stimulating additional
employment this activity brings new wealth into the town and the regularity of the tour
busses has created an opportunity for local cultural groups, who perform for the visitors.
Cradock is a distribution centre for a wide rural hinterland and there are two large family
owned retail operations whieh sell to residents, local spaza shops and to smaller retailers
in regional towns. Interestingly, one of these wholesalers, Adami's sold goods to as far
109

away as Jeffereys Bay. However, the retail sector does face competition from larger
centres such as Port Elizabeth many of the wealthier residents within the town prefer to
do their shopping there. These activities are major assets within the town but the question
remains whether these types of activities can be extended further?
6.3.2 Bedford
Between 1 998 and 2000 only 2 houses were so ld in Bedford for as little as RS 000 (Van
Niekerk, 2005*). The 48 houses sold in Bedford since 2001 , led to what has been
described by some as a "rejuvenation" of the town (Van Niekerk, 2005*). This was
sparked off by Van N iekerk (2006) a local estate agent marketing the town in 'Country
Life' magazine. However, it is debatable whether the booming property market and the
number of people who relocated led to an improvement in the econom ic situation for the
community as whole, as non-home owners were little affected by the change of
ownership.
The town has just one significant manufacturing activity, Eagles Hout which employs
146 people. It recently extended its operations from only producing furniture, by also
creating agricultural fence dropper from recycled old telephone cables (Blom, 200Sa*).
However, barring the apparent success of the individual firm, there are no other
manufacturing activities, nor does it appear that any will be attracted in the near future.
Van Niekerk (2005*) pointed out that other local industries, such as the 'Sasko' flourmill,
had closed over recent years.
Training initiatives have also been undet1aken in the town by Lana Blom (200Sb) and
local artist David Khoury (2005*) taught local artists and allowed their works to be sold
in his gallery. Unfortunately Khoury 'S gallery is now closed and it is unlikely that Lana
Blom's initiative will spark significant growth in the town, although it may assist in terms
of poverty alleviation.
110

6.3.3 Somerset-East and Pearston
As seen previously the Blue Crane Development Agency (BCDA), primarily formed
through the determination and drive of individuals (Beach, 2005*) has actively promoted
the towns of Somerset East and Pearston. The Agency is linked with the municipality and
is regularly contracted to undertake development work on its behalf.
The Agency has implemented notable large scale projects in the town, in particular the
development of the Boshberg Eco-Resort, which Beach (2005*) described as a 600
million rand mega project which would include the following:
• Hotel
• 420 residential plots
• A well ness centre/spa
• Trout Fishing
• 18 hole golf course
• Equestrian Estate
The proposed resort is planned to include three different housing nodes aimed at varying
markets which is expected to compete with the more expensive traditional ' go lfing
estates'. The agency plans on developing the resort and the housing nodes themselves as
opposed to tendering them to private developers, as they intend to use the profits to
maintain the resort, develop the golf course and other recreational facilities in the town
that will benefit the whole community. Through the project Tetswana (2006) hopes that
100 permanent and 6000 temporary jobs would be created which wou ld significantly
boost the local economy. The agency has also proposed a hotel resort in Pearston utilising
the 'Karoo' as the major attraction, although it is still in its conceptualisation phase
(Tetswana, 2006*).
The agency has also secured R5 million for the development and construction of an
airport and a light industrial park (Fife, 2006), the primary rationale being to develop
tourism in the area allowing Somerset East to become a gateway to the Greater Addo
I 11

Elephant National Park. A light aircraft assembly plant has also been attracted to the
newly created industrial park primarily through efforts by the agency (Beach, 2005*).
The agency has also implemented agricultural projects which have been developed in and
around both towns. These projects are primarily aimed at creating employment through
promoting high value crops such as flowers and plants which can be used for bio diesel.
An example is the newly created Misty Mountains, a flower famling facility following a
RI million rand investment, which created 15 sustainable jobs (Testswana, 2006*). The
farm is 65% owned by the beneficiaries and the BCDA whilst the remainder is owned by
commercial farmers. It is hoped that the facility would render R88S 000 turnover by 2007
(Fife, 2006). The introduction of the schemes would be supported with training and
mentorship programmes as well as locating markets for the products. Eventually it is
hoped that the agency can assist in securing the newly trained farmers their own land
(Tetswana, 2006*).
It is clear that the agency has been a major catalyst in all of the mentioned projects and
through their actions it does seem possible to improve the economic situation in Somerset
East, although an attempt to rejuvenate Pearston is unlikely.
Somerset East also has successful manufacturing operations such as P J Engineering,
which specialises in machine design and manufacturing. A subsidiary company Thermo
Fluid Engineers also creates air-conditioning units for foreign sports cars (Fourie, 2006*).
The companies appear to be extremely successful due to their high level of expertise and
as such have created a niche market and accordingly do not face significant locational
disadvantages by operating in Somerset East. The town is also home to two other small
niche market manufacturers producing school science kits and rugby jerseys respectively.
6.3.4 Grahamstowo
Grahamstown has a well established educational industry due to the presence of Rhodes
University and private schools including Kingswood College, St Andrews Prep, St
Andrews College and the Diocesan School for Girls (DSG). There are a number of small
112

niche enterprises which have been established due to this academic nature of the town,
these include: Geodatatec, National Inquiry Service Centre (NISC) and Coastal and
Environmental Services (CES) (Makana, 2004b). These activities are boosted by the
skilled and diverse workforce of the town.
Makana Brick and Tile is a major industry in the town and being a manufacturing based
activity it brings significant money into the town. However the entity faces a number of
challenges despite the kaolin reserves in the town. Meyer (2005*) that the operations of
the plant were hindered by what he described as the difficult nature of the working class
in the town. Strikes and other disturbances caused by this caused significant effic iency
and profitability . He indicated that many of the other operations utilising the clay reserves
closed down due to labour unrest and that it was a major growth inhibitor for industrial
type operations.
6.4 Conclusion
In summary, municipal LED programmes, with the exception of Somerset East, have
been a dismal failure. Private initiatives, predominately stimulated by visionary
individuals, often in co-operation with public institutions, have been at the forefront of
what has been deemed as successful in the towns.
113

7 Trends and Growth Drivers
The chapter highlights evident socio-economic trends within the sampled towns and
continues to identity growth drivers within the small economies which are then related to
their economic potential. A basic framework for assessing towns ' economic potential is
provided in section 7.4.
7.1 Identification of trends
7.1.1 Decrease in the economic vitality of the sampled towns
Employment data manipulated in the shift-share and LQ analyses indicated a definite
decrease in the economic activity between 1996 and 2001, a similar economic trend to
many small urban centres around the globe. However, prominent businessmen in
Grahamstown, such as Colin Meyer (2005*) and Rob Beer (2005*), believed that the
town had actually experienced econom ic growth between 1994 and 2005. Due to the
differing reference periods this discrepancy is possible and may be an indication that the
local economy has grown since 200 I.
7.1.2 Rural linkages
From their origins the five towns selected for the study have been heavily dependent on
agriculture, and the relationship between the two has shaped their development.
However, it appears that the interactions between the two have been somewhat altered.
Despite the past dominance of the sector within the regional economy evidence from
interviews suggested that local farmers were now far less dependent on the centres and
many preferred to source goods and services from larger centres.
Van Niekerk (2005*) pointed to a general withdrawal of wealthy farmers from the
Bedford economy, often sending their children to school in Grahamstown and therefore
acquiring retail goods from that town, whilst agricultural goods were often secured from
114

the larger urban centres of Port Elizabeth and East London. Walker (2004*), a dairy
farmer milking 800 cows 30km from Cradock, indicated that if the town were not there, it
would not have a significant effect upon his operations.
The decline in these interactions provides a partial explanation for the worsening
economic conditions in small towns. This can be attributed to the general reduction of
travel costs and improved connectivity, which enable farmers to source goods from other
areas at reduced costs. The expansion of game farming in the areas surrounding many of
the centres has exacerbated the problem, as the reserves/hunting lodges are even less
reliant on the local towns than farmers (Davenport 2006*, Lang 2004*).
7.1.3 Potential for tourism, and lifestyle changes
The CDE (1996) sees tourism as an economic growth opportunity for small towns and
evidence from Clarens, in the Free State, supports this view as Molosankwe (2005)
indicates that the town's economy is sustained by tourists who frequent the centre
throughout the year.
All the Municipal lOPs identified tourism as a promising sector to exploit for future
growth (Makana, 2004; BCR, 2005; Nxuba, 2005 and lnxuba Yetemba, 2005). However,
whilst tourism may be an opportunity, there needs to be some attraction that would want
to make people visit the centres. Whilst it is possible to create these attractions, generally
tourism potential is linked to something within the town, or it surrounds such as natural
amenities or historical buildings or events.
Annual festivals and events are also a potential source of attracting tourists. The National
Arts Festival is held in Grahamstown and attracts up to 20 000 tourists and creates a
positive economic spin off of around R40 million (Snowball and Antrobus, 2003: 26).
Run in tandem with the National Arts Festival itself, the Schools Arts Festival as well as
the annual Sasol Science Festival bring large numbers of scholars into the town. The
tourist industry also benefits from events such as graduation and other University and
115
School functions as well as parents dropping or fetching children/students who often stay
over in the town. These events are closely linked to the towns' educational sector.
Tourism linked business entities in Bedford have also benefited from the introduction of
an annual garden festiva l, where local properties have been displayed to the public (Van
Niekerk, 2005*).
Atkinson and Zingel (2004:6) highlighted that small towns are also becoming popular
centres for retirement and telecommuters, probably due the low cost of living and relaxed
li festyle. According to Khoury and Van Niekerk (2005*), prior to 2000, Bedford was
experiencing an economic decline. Between 1998 and 2000, only two houses were sold,
one for as little as RS 000 (Van Niekerk, 2005*). However, subsequently between 2001
and 2005, 48 hOllses were sold, constituting 12% of the town's housing stock (Van
Niekerk, 2005*). This has been attributed largely to the work of Kim van Niekerk who
placed an article in the magazine 'Country Life' which sparked national interest, and
resulted in a number of people buying property and moving into Bedford (Van Niekerk
2005*; Khoury 2005*).
Thus it is evident that tourism and people relocating to smaller centres is a potential
source of economic growth although it would be difficult to stimulate such opportunities
in towns such as Pearston where there are few natural amenities or other draw-cards such
as historical buildings or events which take place there.
7.2 Growth Drivers and Inhibitors
This section identifies and reviews growth determinants and inhibitors and discusses their
poss ible impacts.
7.2.1 Size
Evidence in South Africa suggests that larger towns, with an estimated population
threshold of 70 000 do not appear to be experiencing economic decline similar to that of
116

the smaller centres (Atkinson and Zingel, 2004: 6). The apparent threshold can be
explained by economic factors. Firstly, at that size some primary industries or services
must exist in almost all settlements e.g. hospitals, schools, bakeries, etc. Accordingly,
secondaJY activities are likely to thrive, creating employment and wealth. The New
Economic Geography also explains this threshold by indicating that at a certain size
business activities and residents from smaller neighbouring seltlements, will shift towards
the larger centre.
Grahamstown had an official population of61 747 in 2001(Stals SA 200Ia), and Makana
Municipality itself numbered 74 539 (DB SA, 2004) indicating that the town is on the
cusp of the threshold. Thus, it is not surprising that the town had the highest economic
base within the sampled towns. A number of secondary academic enterprises also thrive
due to the presence of the university such as Geodatatec, National Inquiry Service Centre
(NISC) and Coastal and Environmental Services (CES) and other service providers such
as restaurants, pubs, hotels and bed and breakfasts also appear to be thriving. If the
popUlation continues to grow, sustained growth could become a reality, especially as the
university is also currently expanding (Vale, 2005*).
The evidence suggests opposite results for the two smallest towns. Pearston and Bedford,
both of which have populations under 10000, face severe growth limitations associated
with their size. Cradock and Somerset East with populations of 31 292 and 16 580 (Stats
SA, 2001) respectively, whilst both below the threshold do not appear as negatively
impacted as the other two smaller centres.
7.2.2 Location and Infrastructnre
According to Jensen, (1997 in Collits, 2000: 15) geographical positioning and
infrastructure playa role in the development potential of any centre.
It is clear that basic infrastructure is a prerequisite for growth, and within the context of
the Cape Midlands, generally speaking bigger centres have greater infrastructure, and
117

have more reliable and effective provision of services. Blom (2005*) complained about
the numerous electricity failures experienced in Bedford, which reduced the
competitiveness of production. Meyer (2005*), owner of Makana Brick and Ti le, in
Grahamstown, chose to locate the factory outside of the town borders in order to have
access to electricity directly from Eskom, the national supplier, as opposed to the
municipality, which is less reliable. These types of problems effectively make smaller
centres a less attractive option for industrial operations. Basic and reliable infrastructure
and competitively priced services are essential to attract enterprises, thus making them
growth inhibitors if a satisfactory level is not achieved.
All the towns studied experienced a decline in manufacturing between 1996 and 200 I,
whilst nationally this sector experienced growth (Stats, 200 I a). Location, including
considerations of natural resources, amenities and access to markets, go a long way to
explaining these growth patterns. The lack of growth in Cradock, primarily because it is
situated away from any large population despite having a good infrastructure plus an
abundance of land and water, exemplifies this. Ottaviano and Thisse (2004), through the
use of location theory, confirmed the importance of transportation costs. Essentially firms
act as profit maximising entities and choose locations where the sum of all costs is the
lowest. Thus transportation costs, and accordingly location, are important factors for the
development prospect of a town. Therefore being located in a larger settlement is a
distinct economic advantage, whilst being located away from markets can stifle economic
growth. Firms also have a natural inclination to move towards larger centres as clustering
of related industries enhances efficiency (Jovanovic, 2003: 48).
While the numerous economic challenges facing small towns, particularly in attracting
and retaining industrial type activities have been illustrated, certain types of economic
enterprises are not reliant on location and infrastructure and are not affected or drawn to
larger settlement, e.g. tourist related businesses and manufacturers producing goods for
niche markets.
1I8

7.2.3 Local Leadership
"The role of local leadership is accepted as a key driver of regional economic
performance. Leadership is especially important in smaller communities which often lack
infrastructure, skills and resources for economic development" (Coli its 2000: 19).
Leadership plays a key role in identifYing economic opportunities and also in ensuring
co-operation amongst the community to achieve these goals. However, local leadership,
in the context of the study, can be broken into two components, namely, leadership from
the municipality and from private stakeholders or individuals.
A) Municipal Leadership
Governance at a municipal level can impact severely upon a town' s economy. However,
good governance may not necessarily be enough to stimulate growth. Two examples of
contrasting municipal leadership illustrate this point.
In Cradock doubts were raised over the financial position of Inxuba Yetemba
Municipality (Adami, 2004*). Coetzee (2004*) a former town clerk indicated that due to
cash flow problems, although better than in previous years, the municipality appeared to
moving from solving one disaster to the next and not acting in a strategic manner. This is
a major concern if businesses are reliant on the municipality for basic services.
Somerset East and Pearston were more fortunate in this regard . The municipality had
ensured a relatively positive relationship between itself and the Blue Crane Development
Agency (BCDA). The interaction between the two provided a strong leadership platform
(Beach, 2005*). The mutual effOlt led to the creation of several innovative industries
capable of stimulating growth. Tetswana (2006*) also confinned this view and indicated
that strong and formal links existed between the two entities and that they had worked
together to achieve many of the projects.
119

B) Private stakeholder and individual leadership
Individuals and local entrepreneurs also form an impOltant component of local
leadership. The reason behind this is clear when reviewing what Henton et al. (1997: 34
in Collits, 200 I: 24) consider the general traits of civic entrepreneurs:
• see economic opportunity within the community;
• are entrepreneurial by nature;
• provide collaborative leadership which connects the economy and the community;
• are motivated by broad and long-run interests; and
• work well in teams, often playing complementary roles.
The traits illustrate why it is important to retain and to attract civic entrepreneurs.
7.2.4 Established Industries
Towns fortunate enough to have established active industries have distinct developmental
advantages. As previously discussed Arthur (1989: 128) noted 'history ' is an important
element in the development path of any area and that certain events can cause industries
to lock into a certain locations due to reductions in transactional costs.
Despite the major advantages of having an established industry, evidence in mlOlOg
towns suggest that should the primary industry close the town itself often collapses
(Atkinson and Zingel, 2004: 5). This is a reality that has led to the decline of many towns,
due to declining mineral prices, mineral depletion and major technical advances
(Atkinson and Zingel, 2004: 5).
Grahamstown is the only town within the study that has a large established industry,
namely education. The presence of the university and schools provides employment for a
large number of residents. The wages paid in the educational sector as well as the money
120
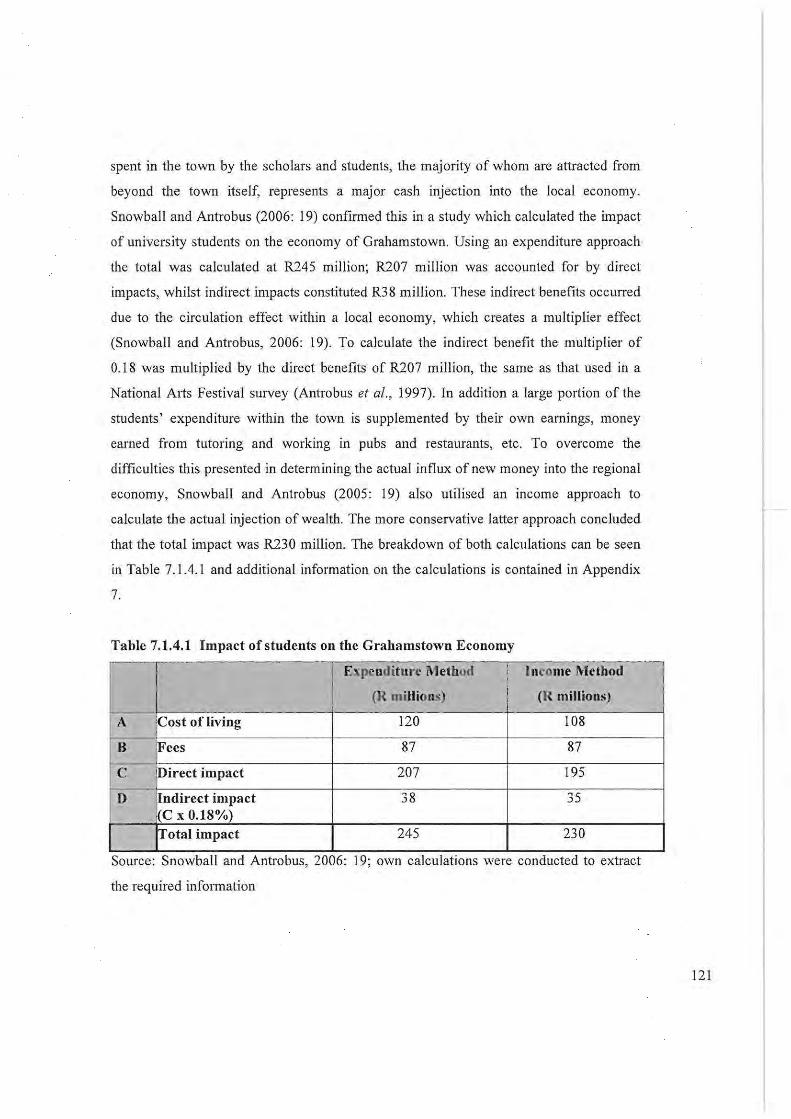
spent in the town by the scholars and students, the majority of whom are attracted from
beyond the town itself, represents a major cash injection into the local economy.
Snowball and Antrobus (2006: 19) confirmed this in a study which calculated the impact
of university students on the economy of Grahamstown. Using an expenditure approach
the total was calculated at R245 million; R207 million was accounted for by direct
impacts, whilst indirect impacts constituted R38 million. These indirect benefits occurred
due to the circulation effect within a local economy, which creates a multiplier effect
(Snowball and Antrobus, 2006: 19). To calculate the indirect benefit the multiplier of
0.18 was mUltiplied by the direct benefits of R207 million, the same as that used in a
National Arts Festival survey (Antrobus et ai., 1997). In addition a large portion of the
students' expenditure within the town is supplemented by their own earnings, money
earned from tutoring and working in pubs and restaurants, etc. To overcome the
difficulties this presented in determining the actual influx of new money into the regional
economy, Snowball and Antrobus (2005: 19) also utilised an income approach to
calculate the actual injection of wealth. The more conservative latter approach concluded
that the total impact was R230 million. The breakdown of both calculations can be seen
in Table 7.1.4.1 and additional information on the calculations is contained in Appendix
7.
Table 7.1.4.1 Impact of students on the Grahamstown Economy
_L E pcnditurc Method I ncomc Method I i i (R millions) , (R millions)
~\ ,
-'Cost ofliving 120 108
~ Fees 87 87
T Direct impact 207 195
I) ndirect impact 38 35 I(C x 0.18%} tr0tal impact 245 230
Source: Snowball and Antrobus, 2006: 19; own calculatIOns were conducted to extract
the required information
I --
121

The study also identified secondary benefits such as visitors to the town; approximately
15% of the sample had family or friends staying over in town. These visitors require
accommodation, food and entertainment benefiting local hotels, B&BS, restaurants, pubs,
shops and game lodges, thus illustrating the abundant secondary impacts.
Thus, it can be seen that the university students and scholars from the private schools
such as Saint Andrews, Diocesan School for Girls, Kingswood and Saint Andrews Prep,
are major economic drivers within the town. Rhodes University itself has grown
significantly over the last thirty years with student numbers that have risen from 2581 in
1981 (RU, 1982) to over 6000 in 2006 (RU, 2006). Vale (2005*) confirmed the trend and
believed that the numbers would continue to rise, validating the statement by referring to
the additional residences and lecture venues that had recently been constructed or were
under construction at the University.
The other towns are not as fortunate to have major established industries to the same
extent as Grahamstown, which makes the creation of wealth in them more difficult to
achieve.
7.2.5 Macroeconomic and other variables
Shifts in national policy or changes in the international economy may either stimulate or
hinder towns' development, for example changes to the National Social Grant System.
"South Africa has one of the biggest non-contributory social we lfare systems in the
world, with about 10m people now receiving basic social protection from the state (22%
of the total population)" (Bisseker, 2005). EPRl, (2004) indicate that social grants have
already gone a long way to alleviating levels of poverty within the country. The impact of
these grants is also felt within the small towns, a view supported by Adami (2004), who
indicated that grant spending was a major economic force in Cradock. Due to the link
between the towns and the agricultural sector, which was highlighted in the Social
Accounting Matrix, fluctuating agricultural commodity prices will have either positive or
negative economic impacts on the towns.
122

7.3 Determination of the towns' economic potential
By knowing the towns' past and current economic trends, current LED and local
entrepreneurial initiatives and the primary growth drivers and inhibitors it is possible to
indicate whether, under a similar macro-economic climate and current local variables, the
towns are capable of reversing the trends between 1996 and 200 1. This is clearly
illustrated by the Social Accounting Matrix which illustrated that a change in the national
economy, particularly in the agricultural sector, would have a major impact on their
economies. The following section brings together the research conducted in earlier
chapters to make an assessment.
7.3.1 Grahamstown
In tenus of the Shift-Share analysis Grahamstown did not perform well and experienced
significant regional shifts in many sectors, including a negative 713 employment shift in
the services sector in relation to developments in a national context. Despite this, the
town actually experienced a real employment increase in services, thus the negative RS
could simply be due to a high national growth rate. Negative regional shifts and real
employment losses were also experienced in both the manufacturing and transportation
industries, similar to trends seen in the other towns. However, when reviewed in
conjunction with Economic Base analysis the town looked particularly healthy.
Grahamstown had the highest measured economic base and exhibited the largest LQs in
the services sector of 2.2.
Being the largest town and given the existence of many educational institutions it also
faced fewer economic challenges. Local Leadership, in terms of the municipality, was
satisfactory but in terms of municipal LED actions very little noticeable positive impact
had been achieved.
Due to a strong initial economic position the town may be capable of economic growth
and some residents interviewed believed that the town had grown between 1996 and 2001
123

(Meyer, 2005* and Beer 2005*). Thus, it does appear to have the capacity to grow
further.
7.3.2 Somerset East
Both the Shift-Share and Economic Base analysis suggested that the economic situation
in Somerset East was unhealthy. Negative regional shifts were experienced in almost all
of the industries in a national context and the town exhibited the lowest percentage
economic base of all the centres. Despite this, the local leadership in Somerset East was
strong and appeared to be the primary economic driver. The Blue Crane Development
Agency (BCDA), working together with the municipality and financed through the
Industrial Development Corporation (IDC), have put into place a number of meaningful
and sustainable LED developmental initiatives, such as the planned formation of an 'eco
resort', light aeroplane manufacturing plant and other unique agricultural projects. The
vision, guidance and determination of the two institutions have changed the economic
outlook of the town and could well reverse the future outlook as suggested by negative
statistical scores. Tetswana (2006*) optimistically predicted that over 6 000 temporary
and 1 000 permanent jobs may be generated through the 'eco-resort', which would result
in a massive boost for the town, considering that total employment in 2001 was only 2
757 (Stats SA 2001a). The BCDA have also begun the long process of diversification of
the local economy, although agriculture still remains the dominant force according to the
LQ figures. The aeroplane manufacturing plant and the arrival and continued success of a
number of successful entrepreneurs such as PJ Fourie, a specialist engineer, bodes well
for the future of the town.
7.3.3 Cradock
Cradock has many of the attributes required for economic growth, namely: land, water,
good rail and road networks and cheap labour, yet it failed to enjoy any meaningful
growth (Adami, 2004*). A major reason behind this is that it lacks locational advantages
by not being situated close to any major markets, which stifled possible investment and
124

business activities. Another major reason behind the outcome was to do with the apparent
lack of strategic guidance and direction shown by the municipality. A number of LED
strategies were introduced, but none made any significant improvements to the town's
economy. Considering this and the numerous economic challenges facing the town, it is
unlikely that future LED projects under present leadership would have any chance of
stimulating growth.
The town was economically stronger than all centres, apart from Grahamstown, in the
Shift-Share and Economic Base analysis, despite showing evidence of decline and in a
provincial context Cradock performed relatively well in a provincial and experienced a
noticeable increase in its Economic Base between 1996 and 200 I. The potential
establishment of a sugar beet/bio-diesel plant may provide a major economic boost for
the town and the possible primary and secondary benefits may alter the economic outlook
of Cradock. However, the establishment is still speculative and under cun'en! conditions
it does not look likely that the town will reverse its continued decline.
7.3.4 Bedford
Bedford, from its origin as an agricultural centre never experienced any major economic
growth nor does it appear likely to occur now, despite exhibiting increases in its
economic base between 1996 and 2001. Individuals in Bedford have made an attempt to
develop the town; however integration between the municipality, community and the
civic entrepreneurs had not been achieved, thereby rendering their efforts ineffective,
including LED initiatives. Due to its small size, locational disadvantages and lack of
growth in the past, the town faces huge economic obstacles, which by themselves will be
extremely difficult, if not impossible to overcome.
125

7.3.5 Pears(on
Pearston, the smallest town considered, despite the strong leadership from its
municipality and the Blue Crane Route Development Agency both situated in Somerset
East, is also unlikely to reverse its decline due to locational and economic challenges.
From its establishment as a Church town, the economic function of the centre was
limited. It recorded a LQ in the manufacturing sector of zero in 2001. Another possible
reason for its economic decline is its close proximity to Graaff-Reinet and Somerset East,
both of which could be considered regional centres drawing customers away from the
smaller towns in the region, such as Pearston. Despite the effolis by the BCDA and the
municipality the town is likely to continue to decline, acting primarily as a welfare
distribution point. Doro, (2006), Matanga (2006), Davenport (2006) and Machant
(2006*) all believe the town had been in a state of continual decline over recent years and
do not anticipate growth occurring in the foreseeable future.
7.4 Importance of growth drivers
The major drivers within the economies of each town are identified below in table 7.4,
and were assessed through visits and the structured interviews!S The performance of
each was ranked on a scale of 0 to 5, where zero indicates that the economic driver is non
existent and five that it is strong in the town. For example, size was evaluated as a
medium level growth driver in Grahamstown hence it was ranked as 4, whilst in Pearstoll
it was considered to be zero as its size is a major economic constraint for the town.
Municipal leadership was also disaggregated between Somerset East and Pearston due to
the slight bias towards the former in terms of development strategy.
15 See the research notes taken on the respective towns in Appendix 2
126

Table 7.4 Ranking of Growth Drivers in the towns
Ill"n LED Sil.l' Emling Exbting Infra:>!- ~lun;""lpa1 1.{lC.1i 1 01. 1 Pl..'rccnlJgc markl.,t~ Industr) mettlr(.' I t"dd':I'Sitip l:;,nu ~rreneurs ofm<1'<
5~ C)n.'
G rah:ml')tlm n 2 4 3 5 3 2 4 23 C radocb. I 2 2 2.5 2.5 2 2.5 14.5 Bodford I I I I I 2 1.5 8.5 SomerSf't EalJlt 5 I I 2 I
, 3 16 0
Pearston I 0 0 0 0.5 2 0.5 4 Key: 0 - 5 where 5 IS excellent and 0 IS poor
The ranking close ly links to the assessment of the towns ' economIc potential.
Grahamstown and Somerset East, the towns identified as most likely to benefit from
economic growth, had the highest rankings with 23 and 16 respectively. Grahamstown in
particular appears to be well positioned to stimulate its local economy due to the presence
of its educational institutions, measured by the ' existing industries' driver, its size and the
existence oflocal entrepreneurs; all three of these key drivers ranked above 4.
Cradock had a ranking 14.5, but what differentiates it from both Somerset East and
Grahamstown is that there is not one specific driver which was particularly strong.
Bedford and Pearston had the lowest ran kings of 8.5 and 4 which highlights why the two
towns face the largest economic challenges. It is also important to note that only 2 of the
7 drivers can actually be improved in the short run, namely LED strategies and municipal
leadership. Thus, the ability to shift the development path of any small town is a major
challenge. The ranking process highlights the importance of growth drivers within small
towns and provides a simple framework by which local municipalities could assess the
developmental outlook within their municipal boundaries. From the study it could be safe
to assume that towns scoring a ranking above 55% would be in a relatively strong
position to promote economic growth, whilst towns scoring lower than 30% would
struggle due to the severe economic challenges facing them.
66
41
24
46
11
127

8 Conclusion
The literature on small towns suggested that their general economic decline across the globe
could be explained using economic theory, pal1icularly Geographical Economics, the New
Economic Geography and location theory which all hypothesise that agglomeration forces
pull economic activity away from smaller towns towards larger urban centres as a natural
outcome of high transportation and transactional costs. Nevertheless, pure economic theory
does not fully explain how towns in the United States, New Zealand and Canada have
managed to avoid this decline and in many circumstances reverse their economic fortunes.
In South Africa approximately 5 million people live in 500 small towns scattered across the
country and this, along with the high poverty levels in the towns themselves and their rural
hinterlands, highlights that these centres cannot be ignored in a national developmental
context.
Similar to international trends all of the sampled towns in the Eastern Cape Midlands
experienced negative growth trends between the two national censuses of 1996 and 200 I,
which both Shift-Share analysis and Economic Base theory confirmed was felt more severely
in the industrial/primary sectors of their local economies. These findings were in line with
regional economic theory, particularly the New Economic Geography, and the results were
similar to Cook's (1971) assessment of the towns in the region. Economic Base theory
conducted at a municipal level identified agriculture as a critical economic driver within all
of the towns' economies and a Social Accounting Matrix (SAM) highlighted the important
linkages between agriculture and the other key sectors, particularly the services sector.
However, what was different from international experience was that all of the towns in the
sample experienced population increases between 1996 and 200 I. The extent of the
population increases suggested that it was due to a combination of immigration from rural
areas, poss ibly attracted by government housing policies and pushed by changing farming
techniques, as well as natural population growth. In addition historical developmental
trajectories were also found to be an important element and in many respects their current
128

economic trends can be traced back to the towns' origins and early economic history,
highlighting the difficulties in forcibly stimulating growth.
Using seven growth drivers, namely, size, local economic development, existing markets,
existing industries, infrastructure, municipal leadership and local entrepreneurs, links were
recognised, via means of a scoring process, between these drivers and a towns ' economic
potential. However, these results are by no means definitive. Despite this it was possibly to
make informed assessments, for example, where several drivers were in place as was the case
in Grahamstown and to a lesser extent Somerset East, achieving economic growth appeared
possible, particularly if the drivers were above a critical threshold level of 55% on the scale.
Similarly, those towns with a low score, such as Bedford and Pearston both below 25%, were
found to have limited growth potential. However, further research is required around the
weightings and identifYing their rank of importance.
In terms of stimulating economic growth within small towns municipal Local Economic
Development (LED) programmes, with the exception of Somerset East, were seen to have
failed and private initiatives, predominately stimulated by visionary individuals, often in co
operation with public institutions, have been at the forefront of what has been deemed as
successful developmental interventions in the towns. Accordingly, local authorities should
thus be cautious of spending vast sums on elaborate growth schemes without very careful
analysis as these may not lead to any noticeable development, particularly if few of the pre
conditions for growth are in place.
From a practical viewpoint the study makes suggestions to municipal LED units aiming to
stimulate economic growth. As previously noted, Cook (1971) categorised towns in the
Eastern Cape Midlands, all of which are towns in previously white commercial farming
areas, according to availability of services into a hierarchy of places. Using this and the
simple scoring framework developed in section 7.4, small towns in the Eastern Cape and
nationally, excluding the former homelands, can be clustered into four broad categories.
Imp0l1antly, the clustering shown in Table 8.1 only holds for small towns in commercial
129

farming areas. The table reflects where the sampled towns would be classified and provides
an indication of where a sample of other towns in the Eastern Cape could be classified.
Table 8.1 Categories of small towns in the Eastern Cape
Category I I Category 2 Category 3 Special Towns Towns Towns opportunity (Order 4) , (Order 5 - 6) (Order 7 - 8) towns Grahamstown Cradock Bedford Kenton-on Sea Queenstown Somerset East Pearston POIt Alfred King Williams Graaff-Reinet Hofmeyer Hogsback Town
Aliwal North Steynsburg Middelburg Venterstad
Alexandria Riebeeck East
Index:
Category 1 - Towns scoring/likely to score 55% and above on the ranking system
Category 2 - Towns scoring/likely to score between 25% and 54% on the ranking system
Category 3 - Towns scoring/likely to score lower than 25% on the ranking system
Special Opportunity Towns - Towns where specific developmental opportunities exist
eg coastal towns
The results of the study suggested that category 1 towns have some growth potential and
with the correct guidance from the municipality it would be possible to develop these
local economies. However, stimulating growth in such centres can be done most
effectively delivered through local entrepreneurial agents as opposed to municipal LED
actions. Strategies identified in the study to promote growth and development in category
I towns included:
• Retaining and attempting to attract skilled residents as local entrepreneurs were
identified as one of the key growth drivers in smali towns and entrepreneurial
agents were found to be at the forefront of stimulating growth in many of the
towns.
• An attractive lifestyle was also identified as a key clement for local entrepreneurs.
Thus encouraging private health care, top-class recreational facilities and good
130

educational institutions were identified as sound strategies as these elements
would make a town a more attractive place to live and were seen to be more
effective in drawing in entrepreneurs as opposed to providing tax breaks or other
forms of incentives.
• Support of existing SMMEs and industries was also found to be easier than
attracting new business ventures into small towns.
Category 2 towns face similar challenges, albeit to a larger degree and as such the
recommendations above hold. However, building world class recreational facilities and
encouraging private health care faci lities for example are unlikely to be viable and as
such simply improving exiting services may be a better option. It is also unlikely that
these towns' economic fortunes can be reversed unless specific developmental vehicles
or mechanisms, such as the development agency in Somerset East, are put into place.
Caution should be observed when setting up development type agencies as they require
vast investments and do not guarantee returns. Un less large scale initiatives with
significant opportunities, such as the Boshberg Development node, are identified and
found to economica lly viable, setting up such vehic les may be inadvisable.
Category 3 towns face a realistic threat of continued economic decline, although not
necessarily inevitable. Development strategies in these towns should rather focus on
poverty alleviation initiatives and the promotion of a sustainable livelihoods approach.
Special opportunity towns. incorporate those that have unique features to stimulate their
local economies, such as the coastal towns, which have in many instances enabled
economic growth. Developmental and growth strategies in such towns should be linked
to maximising these opportunities.
The simple sconng process could be easily repl icated, with appropriate studies, and
utilised to categorise small rural towns in commercial farming areas across the country.
Considering the evident need for development in rural areas within South Africa the
study provides a mechanism by which small rural towns could be targeted by
131

developmental strategies to stimulate growth. Effectively category I and special
opportunity towns should be at the centre of any rural development strategy within the
country as growth and the creation of employment is possible. In addition the study
provides a means to evaluate the applicability of municipal Local Economic (LED)
initiatives and could reduce poorly conceptualised programmes aimed at creating
economic growth in towns where it is unlikely to occur, primarily due to broader national
economic trends which is critical considering the minimal impact of municipal driven
LED strategies despite the sums spent.
132

References
ABS, 1998. Australian Social Trends. Australiau Bureau of Statistics. Australia
ANC. 2006. Map of South Africa. African National Conference. Available at: http://www.anc.org.zalimages/map/samap. Accessed 15 November 2006
ANTROBUS, G., WILLIAMS, v., FRYER, D., KHUMALO, B., STREAK, J., and WEBB, A. 1997. The economic impact of the 1996 Standard Bank National Alts Festival. Department of Economics, Rhodes University. Grahamstown.
ARTHUR, W.B., 1989. Competing Technologies, Increasing Returns, and Lock-in by Historical Events. The Economic Journal. 99: 116-131.
ATKINSON, D. and ZINGEL, J., 2004. Towards a Small Towns Network: Concept, Feasibility and Process Paper. Human Sciences Research Council, Bloemfontein
BAKER, J., 1990. Small Town Africa: Studies in Rural Urban Interaction. Scandinavian Institute of African Studies, Uppsala.
BAKER, J. and CLAESON, C.F., 1990. Introduction in Small Town Africa Studies in Rural-Urban Interaction. Scandinavian Institute of African Studies, Uppsala
BARKLEY, D. L., 2001. Employment Generation Strategies for Small Towns: An Overview of Alternativcs. REDRL Research Report. Available at http://www . cherokee. argecon.c lemson.edu. barkley .researchrepOlt08-2 00 1-02. Accessed 21 September 2004.
BAUTISTA, R.M. , THOMAS, M., MUIR-LERESCHE, M. and LOFGREN, H. 2002. Macroeconomic policy reforms and agriculture: towards equitable growth in Zimbabwe. Research Report 128. International Food Policy Research Institute, Wshington
BCR, 2005. Integrated Development Plan. Blue Crane Ronte Municipality. Municipal Document. Somerset East
BIDC, 2002a. Methods of Regional Analysis: Economic base and location quotient. Business and Industry Data Center. 2. Available at http://www.bidc.state.tx.us/researchcorner/archives/Issue II/Location Quotient.pdf. Accessed 01 April 2005.
BIDC, 2002b. Methods of Regional Analysis: Shift-Share. Business and Industry Data Centcr. 1. Available at http: //www.bidc.state.tx.uslresearchcornerlarchives/Issue I/Shift Share.pdf. Accessed 01 April 2005.
133

BIRCH, K., 1972. Somerset East. Grahamstown Historical Society. 1(2): 63-66
BISSEKER, C., 2005. The Great Juggling Act. Financial Mail. February 25.2005. Available at ht!p:llfree. financialmail.co.zalbudget2005/0verview/bud8.htm. Accessed 12 September 2006.
BRAKMAN, S., GARRETSEN, H. 2005. Geographic Economic in its Teens: Theory, Empirics, Policy and Unresolved Issues. Journal of Development Pcrspectives. (1), 5 - 28
BRAKMAN, S., GARRETSEN, H and SCHRAMM, M. 2005. Putting New Economic Geography to the test: Free-ness of trade and agglomeration in the EU regions. CESIFO Working Paper no. 1566. Available at http://www.cesifo-group.de/. Accessed 01 April 2005
CENTRAL STATISTICAL SERVICES, I 970a. Population Census: Populatiou of Cities, Towns and Rural Areas. No. 02-05-0 I. Government Printers. Pretoria.
CENTRAL STATISTICAL SERVICES, 1970b. Population Census: Geographical Distribution of the Population. No. 02-05-10. Government Printers, Pretoria.
CENTRAL STATISTICAL SERVICES, 1980a. Population Census: Geographical distribution ofthe population with a review for 1951-1980. No. 02-80-13. Government Printers, Pretoria.
CENTRAL STATISTICAL SERVICES, 1980b. Population Census: Occupation by Statistical Region and District. No. 02-80-05. Government Printers, Pretoria.
CENTRAL STATISTICAL SERVICES, 1982.Census of Manufacturing 1980: Principal Statistics on a Regional Basis. No.30-01-02 (1982). Government Printers, Pretoria.
CENTRAL STATISTICAL SERVICES, 1991a. Population Census: Geographical distribution ofthe population with a review for 1970-1991. No. 03-01-02 (1991). Government Printers, Pretoria.
CENTRAL STATISTICAL SERVICES, 1991 b.Census of Manufacturing 1991: Principal Statistics on a Regional Basis. No.30-01-02 (1991). Government Printers, Pretoria.
COLLlTS, P. , 2000. Small Town Decline and Survival: Trends, Success Factors and Policy Issues. Paper presented to "Future of Australian Towns" conference at La Trobe University, Bendigo. June 2004. Available at http://www.regional.org.au/aufcountrvtowns/globallcollits.htm . Accessed 21 September 2004.
134

CEE, 2003. Answers.com. Columbia Electronic Encyclopaedia, Sixth Edition. Columbia University Press., 2003. Available at http://www.answers.com/topic/bantustan. Accessed 14 Nov. 2006
COOK, G. P., 1971. Towns of the Cape Midlands and Eastern Karoo, Institute of Social and Economic Research, Survey of the Cape Midlands and Karoo Region (2), Rhodes University, Grahamstown.
COURTNEY, P and ERRINGTON, A. 2000. The Role of Small Towns in the Local Economy and some Implications for Development Policy. Local Economy. 15(4): 280-301
CHRlSTALLER, W., 1933. Die zentralcn Ortc in Siiddeutchland: Eine iikonomishgeograpische Untersuchung iiber die Gesetzmassigskeit der Verbreitung nnd Entwicklung der Siedlungen mit stadtlichen Funktionen, Gustuv Fischer Verlag, lena.
CHRlSTOPHER, A.l., 1982. South Africa, Longman, London.
DBSA, 1992. Development Information: Region D. Development Bank of Southern Africa. Halfway House.
DBSA, 1995. Eastern Cape: Statistical Macroeconomic Review. Development Information Paper 10 I. Development Bank of Southern Africa. Halfway House.
DBSA, 2004. Eastern Cape Province socio-economic profile. Development Paper No. 155. Development Bank of Southern Africa. Halfway House.
DEMARCATION BOARD, 2005. Information Index. Map of Eastern Cape. Available at http://www.demarcation.org.za/infolndex.aspx. Accessed 17 May.
DEPARTMENT OF ENVIRONMENTAL AFFAIRS AND TOURJSM, 2004. Eastern Cape SOE Report 2004. Available online at http://www.environment.gov.za/soer/ecape/downloadreport.htm. Accessed 20 April 2005.
DEPARTMENT OF HEALTH, 2005. Municipalities of the Republic of Sonth Africa: Eastern Cape Province. Available at http://www.doh.gov.zaldepartmentifoodcontrollsamunicipaIlec-municipal.html. Accessed 20 April.
DEWAR, D., 1994. Reconstructing the South African countryside: The Small Towns. Development Southern Africa. 11(3): 351-362.
DEWAR, D., 1995. Small Towns in Development: Towards a South African Perspective. Unpublished paper. University of Cape Town, Department of Architecture and Planning, Cape Town.
135

EPRI, 2004. The Social and Economic Impacts of South Africa's Social Security System. Economic Policy and Research Institute. Research paper 37, Cape Town.
ERICKCEK, G. A. and MCKINNEY, H. , 2004. Small Cities Blues: Looking for Growth Factors in Small and Medium-sized Cities. Upjohn Institute. Staff Working Paper No. 04-100. Available at http://ideas.repec.org/p/upj/weupjo/04-100.html. Accessed 26 April 2005.
FIFE, 1. Dare to be Dubai: SA's tiniest agency takes R770m property risk to put its dorp on the map. Financial Mail. May 19, 2006.
FUJITA, M. and KRUGMAN, P. , 2004. The New Economic Geography: Past, Present and Future. Papers in Regional Science. 83: 139-164.
FUJITA, M., KRUGMAN, P. and VENABLES, A. J. , 2001. The Spatial Economy. MIT Press, Cambridge.
GHALl, M., 1977. Tourism and Regional Growth: An Empirical Study at Alternative Growth Paths for Hawaii. Studies in Applied Regional Science. Martinus Nijhoff Social Sciences Division, Leiden.
GRIES, T. 2005. Endogenous Formation of Regions in Developing Countries. Journal of Development Perspectives. 1 (I), 29-62
HARDOY, J. E. and SATTERTHWAITTE, D. , 1986. Small and Intermediate Urban Centres: Their Role in National and Regional Development in the Third World. Hodder and Stoughton, in association with the International Institute for Economic Development. London
HEALTH SYSTEMS TRUST, 2007. Human Development Index. Available at ht!p:llnew.hst.org.za/indiclindic.php/83I?mode=data. Accessed 6 April 2007.
HENTON, D. , 1997. Grassroots Leaders for a New Economy: How Civic Entrepreneurs are Building Prosperous Communities. Josey-bass, San Francisco.
HENDERSON, W. P. N., 1930. Official South African Muuicipal Yearbook. 1930-1931. WPM Henderson, Cape Town.
HEWlNGS, G. J. D. and JENSON, J. C. , 1986. Regional, Interregional and Multiregional Input - Output Analysis. Handbook of Regional and Urban Economics Vol I. North Holland Amsterdam, Holland.
HINDERlNK, J. and TITUS, M. 2001. Small Towns and Regional Development: Major Findings and Policy Implications from Comparative Research. Urban Studies. 39(3): 370-391
136

HOEPFL, M., C. I 997.Choosing Qualitative research: A Primer for Technology Education Researchers. Journal of Technology Education. 9(1). Available at http://scolar.lib.vt.edu/ejournals/JTE/v9nl.html. Accessed 7 September 2006.
HOOVER, E. M., and GIARRATANI, F., 2000. An Introduction to Regional Economics. The Web Book of Regional Science. Regional Research Institute, West Virginia University. Available at: http://www.rri.wvu.edulWebbook/Giarratanilcontents.htm. Accessed 12 July 2004.
HOLDEN, D. R. , ALASDAIR, G. M. , and SWALES, J. K., 1989. Shift-Share Analysis of regional growth and policy: a critique. Oxford Bulletin of Economics and Statistics. 5 (I), 15- 34
IFPRI, 1999. South African Social Accounting Matrix 1999. International Food Policy Research Institute. Washington. http: //www.ifpri .org.data/southafrica02.htm
IFPRI, 2002. A Standard Computable General Equilibrium (CGE) Model in GAMS. International Food Policy Research Institute. Washington. Available at
lNXUBA, 2005. Integrated Development Plan. lnxuba Municipality. Public Document.
lNXUBA YETEMBA, 2005. Integrated Development Plan. Inxuba Yetemba Municipality. Public Document.
ISARD, W. , AZIS, J. , DRENNAN, M. P., MILLER, R. E., SALTZMAN, S. , and THORBECKE, E., 1998. Methods of Interregional and Regional Analysis. Ashgate, Aldershot.
JENSEN, R. C., 1997. Rural Australia: Past Present and Future. Paper Presented at the Rural Australia Towards 2000 conference. Charles Sturt University.
JOVANOVIC, N., 2003. Spatial Location of Firms and Industries: An Overview of Theory. Economia Internazionale, 56 (1): 23-82.
JUANA, J.S., 2006. A quantitative analysis of Zimbabwe's land reform policy: mAn application of Zimbabwe SAM multipliers. Agrekon 45 (3): 294-318
JULEFF, L. , 1993. The Implications of Export Base Theory for the Study of Advanced Producer Services (I): Location Quotient Analysis. Social Science Working Paper No.9. Department of Economics, Napier University. Available at ftp: //nefc.mcc.ac.1Ik/publNetEc/RePEc/wuk/napier/ssurp9 .pdf. Accessed 15 November 2004
137

KENYON, P., and BLACK, A. , 2001. Small Town Renewal: Overview and Case Studies. Rural Industries Research and Development Corporation. RlRDC Publication NO 01/043. Available at http ://www.rirdc.gov.aulreports/HCCIOl-043sum.htm. Accessed IS February 2005.
KRUGMAN, P. 1991. Geography and Trade. MIT Press, Cambridge, Mass
KRUGMAN, P. and VENABLES, AJ. 1995. Globalization and the Inequality of Nations. Quarterly Journal of Economics. 110: 857-880.
LOSCH, A., 1954. The Economics of Location. Yale University Press. New Haven
MAKANA. 2004. Integrated Development Plan. Available at http://www.makana.gov.zaldocsIMKN%20IDP%20Review.doc. Accessed 27 July.
MAKANA, 2005. Frontier Prospects. Makana Municipality. Merging Dynamics, Grahamstown.
MIKKELSEN, E. I., 2004. New Economic Geography - an introductory survey. Topics in International Economics, Bergen, Norway.
MNCW ABENI, L and BOND, P, 1999. Local Economic Development in Stutterheim, Available at: http: //www.dplg.gov.za/documen ts/p u blica tio ns/linldngled/li nld ngledcases tudi es/stutterheim.htm. Accessed 6 March 2006.
MOLOSANKWE, B. 2006. Little town flies proudly South African flag. The Star. 8 July, 2006.
MYBURGH, D. W., 1978 The Origins of Towns in the Eastern Cape Midlands. Cont .. ee: Journal for South African Urban and Regional History, 4, pg 25-29
NAFZIGER, E.W., 1997. The Economics of Developing Countries (3e). Upper Saddle River, Prentice Hall.
NAUDE, W. 2005. Geographical Economics and Africa: An editorial overview. Journal of Development Perspectives. 1 (I), 1-4
NCED, 2002. Small Town Trends and Issues. North Carolina Economic Development inc. Available at: http://www.ncruralcenter.org/smalltowns/trends.htm. Accessed 14 November 2006.
NEL, E.L, 1994. Local Development initiatives and Stutterheim. Development Southern Africa. 11(3): 363-367.
138

NEL, E., 1996. Poverty and Inequality iu South Africa: The Small Towu Dimension. Input Paper to the 1996 World Bank Study of Poverty in South Africa. Available at http: //www.govsa.co.za. Accessed 23 July 2004.
NEL, E. L., 1999. Regional and Local Economic development in South Africa: The experience of the Eastern Cape. Aldershot, Ashgate.
NEL, E.L. and HILL, T.R., 1995: The Role of Small Urban Centres in Economic Recovery and Regional Development in Africa - A South African Case Study, Phase II, Research report commissioned by the United Nations Centre for Regional Development, Nairobi.
NIJKAMP, P., RIETVELD, P. and SNICKARS, F., 1986. Regional and Multiregional Economic Models a Survey. The Handbook of Regional and Urban Economics, Vol I. Elsevier Publishers. Amsterdam
OTT A VIANO, G. and THISSE, J. , 2004. New Economic Geography: What about the N?* Centre for operations research and econometrics. Core Discussion Paper No. 2004/65. Available at http://www.core.ucl.ac.be/staff/thissePaperslEnPla5I.pdf. Accessed 23 March 2005.
PA TTON, M., Q. 1990. Qualitative Evaluation and Research Models (2nd Ed). Sage Publications. Newbury Park
PERROUX, F., 1950. Economic Space: Theory and Applications. Quarterly Journal of Economics. 64(1): 89-104
PlSSARENKO, D. 2003. The Basics ofInput- Output Analysis. Available online at http://demetrix.sourceforge.netlresources/2003 _02_20 joAnalysis/ioAnalysis. pdf. Accessed 17 July 2007.
PUGA, D. 1999. The rise and fall of regional inequalities, European Economic Review. 43 , 303-334.
REDDING, S. and VENABLES, A. J. 2004. Economic Geography and International Inequality. Journal ofInternational Economics. 62 (I): 53-82
RSA, 1995a. Urban Development Strategy of the Government of National Unity. Republic of South Africa. Government Gazette No. 16679, Pretoria.
RSA, 2000. The Local Government Systems Act. Government Gazette No. 21776, Pretoria.
139

RICHARDSON, H. W., 1973. Regional Growth Theory. Western Printing Services, Bristol.
RONDINELLI, 1985. Applied Methods of Regional Analysis: the Spatial Dimensions of Development Policy. Westview Press, Colorado
Rhodes University, 1982. Rhodes University Calendar. University Printers, Grahamstown.
Rhodes University, 2006. Rhodes University Calendar. Available at http ://www.ru.ac.za?academic/callendar?2006?university.sud. Accessed 15 June 2006.
SACN, 2004. State of the Cities. South African Cities Network, Cape Town.
SADOULET, E. and DE JANVRY, A. Quantitative Development Policy Analysis. John Hopkins university Press, Baltimore
SAIRR, 2003. South Africa Survey. South African Institute of Race Relations, Johannesburg
SCHAEFFER, W. A., 1999. Regional Impact Models. Regional Research Institute. Available at http://www.rri.wvu.eduIWebBookiSchafferlregionaIGT. pdf. Accessed 10 June 2005.
SNOWBALL J.D and ANTROBUS, G.G, 2003. Economic Valuation of the National Arts Festival: economic impact, business and household surveys. Grahamstown Foundation. Grahamstown
SNOWBALL and ANTROBUS, 2006. Is economic impact a good way to justify the inclusion of foreign students at local universities? South African Journal of Higher Education. 20 (3): 168 - 181
SOUTHALL, A., 1988. Small Towns 111 Africa Revisited. African Studies Review. Special Issue. 31(3): 1 - 134.
SOUTH AFRICAN DIRECTORY, 1891. The Argus Annnai. Argus, Cape Town.
SOUTH AFRICAN DIRECTORY, 1899. The Argus Annual. Argus, Cape Town.
SOUTH AFRICAN DIRECTORY, 1910. The General Directory of South Africa, 1910: Cape Colony, Natal, Orange River Colony, Transvaal, Rhodesia. Dennis Edwards & co, Cape Town.
SOUTH AFRICAN DIRECTORY, 1920. The General Directory of South Africa, 1910: Cape Colony, Natal, Orange Free State, Transvaal, Rhodesia,
140

Basutoland, Swaziland, Portuguese East Africa and South West Africa. Dennis Edwards & co., Cape Town.
SOUTH AFRlCAN DIRECTORY, 1931. Ken Donaldson Directory. Cape Times (Ltd), Cape Town.
SOUTH AFRlCAN DIRECTORY, 1940. Cape Times South African Directory 1940. Cape Times (Ltd), Cape Town.
SOUTH AFRlCAN DIRECTORY, 1950. Cape Times South African Directory 1950. Cape Times (Ltd), Cape Town.
SOUTH AFRlCAN DIRECTORY, 1960. Cape Times South African Directory 1960. Cape Times (Ltd), Cape Town.
SOUTH AFRlCAN DIRECTORY, 1970. Braby's Commercial Directory of South, East and Central Africa 1970. AC Braby (Ltd), Durban.
SOUTH AFRlCAN DIRECTORY, 1980. Braby's Commercial Directory of Soutb, East and Central Africa 1980. AC Braby (Ltd), Durban.
STATS SA, 1996. Population Census. Statistics South Africa. Available at http://www.stassa.co.za. Accessed 5 June 2005.
STATS SA, 2001a. Population Census. Statistics South Africa. Available at http://www.stassa.co.za. Accessed 5 June 2005.
STATS SA, 200 I b. Concepts and Definitions. Statistics South Africa. Report no. 03-02-26(2). Available at http ://www.statssa.gov.zalpublications/populationstats.asp. Accessed 7 July 2005.
STATS SA, 2002. Labour Force Survey: July 2002. Statistics South Africa. Statistical Release P0210, 25 September 2002, Pretoria.
STATS SA, 2003. General Household Survey: July 2002. Statistics South Africa. Statistical Release P0318, 15 December 2003, Pretoria.
STEVENS, B.H. and MOORE, C.L., 1980. A Critical Review ofthe Literature on ShiftShare as a Forecasting Technique. Journal of Regional Science. 20(4): 419-437
STRAUSS, A. and CORBIN, J. , 1990. Basics of qualitative research: grounded theory procedures and techniques. Sage Publications. Newbury Park
TACOLI, C. and SATTERTHWAITTE, D., 2003. The Urban Part of Rural Development: the Role of Small and Intermediate Urban Centres in Rural and Regional Development and Poverty Reduction. The International Institute for
141

Environment and Development. Rural-Urban interactions and livelihood strategies working Paper 9, London.
TAKAYAMA, T. and LABYS, W. C., 1986. Spatial Equilibrium Analysis . Handbook of Regional and Urban Economics. Chapter 5, pp 171-195. Elsevier Publishers B.Y, Amsterdam.
THOMPSON, D. H. , 1970. A Short History of Grahamstown. Grocort and Sherty , Grahamstown.
YAN BEERS, C. , 2000. Is the gravity model a flawed instrument in measnring economic integration effects. Delft University, Delft. Available at hrtp:llwww.tbmtudelft.nl. Accessed 25 June 2008.
WEBSTER, L, J. and WILLIAMS, 1985. Trip to Bedford and District, Grahamstown Historical Society. 4(3): 72-74
WORLD BANK, 2006. Investigation of Pro-Poor Loeal Economic Development in South Africa. Available at http ://www.khanva-aicdd.org. Accessed 23 August 2006.
142

Structured Interviews
ADAMI, C., 2004. Structured Iuterview. Owner of 'Adami's Wholesale ' in Cradock. November
ACCOM, G., 2005. Structured Interview. Municipal Council member in Grahamstown. Grahamstown. February.
ANTROBUS, G., 2005. Personal Communication. Professor of Economics at Rhodes University. Grahamstown. June
ANTROBUS, M., 2004a. Structured Interview. Farmer, Cradock district. Cradock. November.
ANTROBUS, S., 2004b. Structured Interview. Owner of the 'Hotel Victoria ' in Cradock. Cradock. November.
BEACH, R., 2005. Structured Interview. Director of the 'Blue Crane Route Development Agency' in Somerset-East. Somerset East. July.
BEER, R., 2005. Structured Interview. Owner of 'Beer Property Group' in Grahamstown. Grahamstown. November
BLOM, B., 2005a. Structured Interview. Owners of 'Eagle'S Hout' in Bedford, Bedford. June
BLOM, L., 2005b. Structured Interview. Wife of Bennie Blom and involved in a number of training initiatives in the town through the assistance of the Dutch Government, Bedford. June
COETZEE, D. , 2004. Structured Interview. Past Municipal Manager on Cradock, Cradock. November
CRAMPTON, M. , 2005. Structured Interview. Director of 'NISC Institute' and 'African Journals Online', Grahamstown. September.
DAVENPORT, P. J., 2006. Structured Interview. Owner of the Pearston Hotel and Pearston Bottle Store. Pearston. January.
DORO, Z. 2006. Structured Interview. Supervisor Infrastructure and Community Services Blue Crane Route Municipality . Pearston. January.
FOURIE, P. J., 2006. Structured Interview Owner of PJ Engineering and Thermo Fluid Engineers in Somerset East. Somerset East. January.
143
L

GQEZENGELE, A. 2006. Telephonic Interview. LED Officer in Nxuba Local Municipality. November
LANG, c., 2004. Structured Interview. Safari Hunter in the Eastern Cape, Cradock. November
KHOURY, D., 2005. Structured Interview. Local Artist and owner of the 'Bedford Craft Centre ' , Bedford. June
MACHANT, H., 2006. Structured Interview. Mayor of the Blue Crane Route Municipality. Somerset East. January.
MAKI, 2006. Telephonic Interview. LED Manager in Blue Crane Route Municipality. November
MA TANGA, 1., 2006. Structured Interview. Social Worker in the Department of Social Development. Pearston. January.
MEYER, C., 2005. Structured Interview. Owner of 'Makana Brick and Tile', Grahamstown. November.
MTSHUDU, A. 2006. Telephonic Interview. LED Manager Blue Crane Route Municipality. November
NGCUNGA, B. Telephonic Interview. LED Assistant. Makana Local Municipality. November
NEL, E. , 2005. Personal Communications. Professor of Geography at Rhodes University, Grahams(own. June
PARRY, K., 2005. Personal Communications. Dissemination Officer at Statistics South Africa. Communication via E-Mail, Pretoria. March - September
SCHULZE, 2004. Structured Interview. Municipal Councillor in Cradock, Cradock. November.
TAM, P., 2004. Structured Interview. Owner of the 'Tam Group' in Cradock, Cradock. November.
TANTSI, 2004. Structured Interview. Municipal Manager ofCradock, Cradock. November.
TETSWANA, Z., 2006. Structured Interview. Previous LED officer of the Blue Crane Route Municipality, currently employed by the Blue Crane Route Development Agency. Somerset East. January.
144

VALE, P. , 2005. Structured Interview. Head of the Politics Department Rhodes University, Grahamstown. August
VAN DER MER WE, R., 2005. Structured Interview. Retired Professor and head of the 'Residents Association' in Grahamstown, Grahamstown. November.
VAN HEERDEN, 1. , 2006. Structured Interview. Corporate Services Manager Nxuba municipality. Adelaide. Janualy.
V AN NIEKERK, K., 2005. Structured Interview. Local Estate agent and local farming family in Bedford, Bedford. June.
WALKER, W., 2004. Structured Interview. Dairy Farmer Cradock District, Cradock. November.
145

Appendixes
Appendix 1: Municipalities in the Eastern Cape
b ~
~ EC1~_ ECm ~ r " .......,.. - --'3' / EC101 '" ~ '\, C'- "f
",,_ ~ ~ '1 c:;,. ~._ ..... ~ ~~ .. _ ......... v- -'i_~-.t.
'\ \. .. ~~ ~ ~ . .r--( __ p:12 • .. ~-~ ECDMA1 0 ~-A~ EC1 0 2 i~ _J EC127
,/ , ..... "....,.- EC103 c;, r-~< \ ...---lz ~ EC104
EC1Q7 '---, .r1 ~_ E¥,3" 7.
EC1 0
146

Appendixes
Index table of municipality names and towns situated in the Municipalities
-District
Municipality Muuicipalil} Majo,· towns and cities
NELSON MANDELA METROPOLITAN Port Elizabeth LC and 1RC, Despatch, Uitcnhage LC and TRC,
MUNlCIPALITY (NM)" Seaview, Blue Horizon Bay,
CA1v1DEBOO LOCAL MUNICIPALITY (ECIOJ) Cacadu District Munldpality Abenieen. Graaff-Reinet, Nieu-Bethesda
(WD)
BLUE CRANE ROlJfE LOCAL Cacadu District Municipality Cookhouse, Pearslon, Somerset East
MUNICIPALITY(EC 102) (WD)
IKWEZI LOCAL MUNICIPALITY (ECI03) (WO) Cacadu District Municipality Jansenvillc, Klipphul
BAVlAANS LOCAL MUNICIPALITY (EC!o7) Cacadll District Municip;;1ity SteytlerviHe, Willowmore
(WO)
KOUGA LOCAL MUNICIPALITY (ECI08) (WO) Cacadu District Municipality Hankey, Htunansdorp, Jeffreys Bay, Oyster Bay, Patensie. SI
Francis Bay
KOU-KAMMA LOCAL MUNICIPALITY (ECI09) Cacadu District Municipalil:; Joubertina, Kareedcuw
(WD)
MAKANA LOCAL MUNIClP ALITY (EC 104) (WO) Cacadu District N:.:midpaJit:' Alicedale, Glahamstown, Riebeek East
NDLAMBE LOCAL MUNICIPALITY (ECIOS) Cacadu District MWlicipality Alexandria, Bathurst, Boesmansrivier, SeafieJd BoknCl.'Cannon
(WD) Rocks, Kcnton on Sea, Port Alfred
SUNDAY'S RlVER VALLEY LOCAL Cacadu District MlUl.icip2.IiIY Kirkwood, Paterson
MUNICIPALITY (EC!06)(WD)
MBHASHE WCAL MUNICIPALITY (ECI21) Amatole District MllTl)ci"ality tdurywa, Wilkwr"alc, XhorafE Dale
(AD)
MNQUMA LOCAL MUNICIPALITY (EC!22) (AD) Amatolc District MuniciP~ Butterv.'orth, Kentani, NqrunaJ.."We
GREAT KEJ LOCAL MUNICIPALITY (EC123) Amato\e District Municipl.! ity Kei ~1\.luth, Komga , (AD)
Amato!, O;stri,t MW";,aLty I K,; Road. Stull"b,;m. K';skammabo,~ Cath, .. i ~AMAHLATJ LOCAL MUNICIPALITY (EC!")
(AD)
Am,to!' D;striol M"",;,a! .~ BUFFALO CITY LOCAL ML'NICIPALITY (ECI2S) East London, King Williwn's Town
(AD)
NGQUSHWA LOCAL MUNICIPALITY (EC!26) O' . ,-Amalole lstnct Mt;T>.lClrahty Hamhurg, Peddie
(AD)
NKONKOBE LOCAL MUNICIPALITY (ft 127) Anmtole District i'.1ul'jciI:ality Alice, Fort Beaufort, Hogsback,Middlcdrift, Seymour
(AD) I
NXUBA LOCAL MUNICIPALITY (EC I2S) (AD) Chris H.ru District ! Adelaide, Br.dford
Municipality -
INXUBA YETHEMBA LOCAL MUNICIPALITY Chris Hani District Craduck, Mid:l.elburg
(EC!3!) (CHD) Mwlicipality --TSOLWANA LOCAL MUNICIPALnV (Ee 132) Chris Hani District Hofn:eyer, Tarkastad
(CHD) Municipality
147
I I

rNKWANCA LOCAL MUNICIPALITY (EC133) Chris H.ru Dis:rict Molteno. Sterkslroorn
(CHD) Municipality
LUKANJI LOCAL MUNlCIPAUTY (ECI3') Chris Hani Dislrict Queenstown, Whiu!esea/Sada
(CHD) Municipality
fNTSlKA YIITHU LOCAL MUNICIPALITY Cluis Hani L'Iis 'rict COf1r:Wllba, Tsomo
(ECI35) (CHD) Municipality
EMALAHLENI LOCAL MUNICIPALITY (ECI36) Chris Hani Dis .. ict Oord:ccht, loowe, Lady Frere
(CHD) Municipality
ENGCOBO LOCAL MUNlCIPALITY (ECI37) Chris Han! District Engcobo
(CHD) MWlicipality
SAKHISIZWE LOCAL MUNICIPALITY (ECI38) Chris Hani Dis!rict Cala, Elliot
(CHD) MWlicipality -ELUNDINI LOCAL MUNICIPALITY (EC \4 i) (UD) UkhahllllTlba District Mad!ElI. Mt Fletcher. Ugie
Municipality
SENQU LOCAL MUNICIPALITY (ECI42) (UD) Ukhahlamba Disnic! Barkley East, Lady Grey. Rhodes, Sterkspruit
Municipality
MAlErnSWAI LOCAL MUNICIPALITY (EC143) Ukhahlamba _. District l AJiwai North. Jamestown
(till) Municipruity
GARiEP LOCAL MUNICIPALITY (EC I44) (UD) Ukhahlamba District SteynsbUII?" Ventcf;, tad, Burgersdorp
Municipality
MBIZANA LOCAL MUNICIPALITY (EeI51) Oliver Tambo Dblrict Bizanll
(ORTD) MWllcipality -NTABANKULU LOCAL MUNICIPALITY (ECI52) Oliver Tambo Lristficl Tabalkulu
(URTD) Municipality I --INGQUZA LOCAL MUNICIPALITY (Eel 53) Oliver Tambo Dis~ rict Lusikisiki, Flagstaff
(ORTD) Municipality
PORT ST JOHNS LOCAL MUNICIPALITY Oliver Tambo Dis!rict Urnzimvubu, Port $1 Johns
(EC I54) (ORro) MuniciraJity
NYANDENI LOCAL lI.ruNlCIPALITY (ECI55) Oliver Tambo District Lilxx!e, NgqeH:ni
(ORTD) Municipality
MHLONTLO LOCAL MUNICIPAl.ITY (EC156) Oliver T:'mbo Di~ricl Qumb.!, Tsolo
(ORTD) Municipality
KING SABATA DALINDYEBO LOCAL Oli,'er Tambo D:s:rkt .\1qar.duli, Umtata
MUNICIPALITY (ECI57) (ORID) Mllllicipality
UMZ1MK.UW LOCAL Ml..R\'lCIPALITY (EC05bl) Alfred Nul District Umzimkulu
(ANWD) Municipality
UMlIMVUBU LOCAL Millo.'lCIPALITY (EC05b2) Alfred Nw -DlSinct Mt Ayliff, Ml Frere
(ANWD) Municipality - -'--- --
148

Appendix 2: Personal Rough Research notes on the Towns
Cradock Notes
People Interviewed: Mr Cr Adami; owner of Adami's grocer family buss since 1904 Mr P Tam; Owner of the Tams chain in Cradock (grocers, hardware etc) Mr Tantsi; Municipal Manager of Cradock, Mr W. Walker; Dairy Farmer outside ofCradock, milks 800 cows Mr P and Mr M Antrobus; Farmers outside of Cradock Mrs S Antrobus; Owner of Hotel and B&B's C. Lang; Safari Hunter lives on a plot outside of Cradock Mr D. Coetzee; past Municipal Manager and current councillor in Cradock Mr Schulze; current councillor, Cradock. Department of Education Regional
Current Local Economy: I) High unemployment 80 % (Adami, 2004) 2) Workforce is under skilled
>- High staff turnover >- Quality kids leave >- Quality of education poor (Adami, 2004) >- Workers attitude not great, low human capital and they strike (Adami,
2004)
3) Limited numbers of entrepreneurs with limited Resources. 4) Limited skills of existing SMME owners (Adami, 2004).
5) Agriculture :,. Large dairy industry (Walker and Adami, 2004) >- Livestock, meat and wool stable - but smaller farmers struggle to cope
with international competition (Adami, 2004) :.- Crops limited mainly Lucerne (Adami, 2004) :.- Game farming stable (Adami, 2004) :r Trying to develop emerging farmers on municipal land surrounding the
town (Tantsi, 2004) >- BEE unlikely to effect incomes of farmers, unless they leave (Tantsi,
2004) :,. Lack of working capital for farmers, generally they produce low value
goods - need identifY high value crops and need be more creative in product selection.
:,. Irrigated land constitutes 2% of the total land but 80% of total production. Farmers also struggle to maintain the minimum wage. Many unemployed workers move into the town.
>- The majority of the farmers n town are not fully committed to the Sugar Beet plant (M and P Antrobus, 2004).
149

? Hunting lodges generally buy goods in larger centres don't bring clients into town as they run fully sufficient camps, These lodges also provide minimal employment opportunities for locals (Lang, 2004),
,. The town is dependant on agriculture but it is becoming less profitable which has direct implications on the town (Coetzee, 2004)
).> Agriculture cannot create growth without backing of government. ).> Commercial farmers are not dependant on the towns (Walker, 2004),
6) Business Activities in Cradock (Largely service related ): Consist of:
» Banks ? Supermarkets ,. Clothing and Furniture ? Professionals ,. Petrol stations-boosted by main road through Cradock ? Fast Foods- boosted by main road through Cradock ,. Accommodation » Tourism, Mountain Zebra Park, spend money in town
Other key issues include: ,. Buss centre in town has been taken over by smaller business operations
and the nature of the CBD is changing (Schulze), » Wealthy residents shop for clothes and other luxury goods in Port
Elizabeth (Adami, 2004), ? Industry in the town has infrastructural problems and locational
disadvantages which is common amongst many small towns, Cradock does have some locational advantages including the river, N9 passing through the town and available land, (Tantsi, 2004),
).> A proposed milk factory almost was developed in the town which would have provided a major economic boost, (Coetzee, 2004)
? 97 permanent railways jobs were lost which represented a loss of income for the town but which has been compensated by the Karoo regional police headquarters which has been moved to Cradock (Coetzee, 2004)
,. 37 tour buses in November stopped over in Cradock (S, Antrobus, 2004) they however do not stay more than one night.
7) Population is approximately 60000 with 12 000 households ; (personal estimate) (Adami,2004)
8) No major manufacturing concerns in the town (Adami, 2004) 9) Government Departments in the Town
,. Prison - Large juvenile prison » Police - Central Headquarters moved to Cradock, huge economic boost for
the town r Municipality ).> Spoornet - decreased activities recently but there is still a possibility of a
regional office returning
150

" Schools " Hospitals - doctors struggling to make a living therefore many are leaving.
Doctors now regurally travelling. to Hofmeyer and other smaller towns to expand patient base.
10) Other Sources oflncome " Government grants, " Pensions, ;> Child grants and ? Disability grants
Grants are keeping the town alive economically. Residents will stay in Cradock because of grants, if there was no social security network they may need to leave to larger cities as there are greater employment opportunities (Adami, 2004).
Strengths and Weaknesses of the Town
Strengths:
1) Plenty of water through the Fish River scheme. 2) Good Rail and Road infrastructure. 3) Land is cheap, but low returns on agricultural land 4) Labour is cheap, but largely unskilled 5) Cost of living is cheap and the town is a nice place to live. Possibility of attracting
pensioners, but the poor condition of the state hospital does not assist in this regard. 6) Crime is not a severe problem, generally it is largely pretty and mostly confined to the
townships
Weaknesses:
1) Few Entrepreneurs (Tam, 2004) 2) The town is not attractive to entrepreneurs and industry- as there are no clear no
locational advantages. Basic services are getting worse e.g. hospital and there are no personal and social attractions e.g. movies
3) Municipality ineffective and insolvent, has a 2 million rand overdraft and can not service the loan (Adami, 2004)
4) Aids is widespread which affects the availability and productivity of workers . 5) Limited Opportunities for youth, who accordingly will often leave.
Municipality:
Municipal finances are in a poor state and there are still major cash flow problems. (Coetzee, 2004)
151

LED
The municipality appears only doing small things to uplift the community they can not create sustainable jobs though questionable projects like the cultural village . Non involvement by wealthy town members in LED processes is also a problem. However, this can not be blamed entirely on these individuals as Tam (2004) has offered to assist in training schemes but the municipality declined his offer.
152

Grahamstown Notes:
People Interviewed: Professor P. Vale; Head of Politics Department at Rhodes University Mrs M. Crampton; Managing Director ofNISC 'National Inquiry Services Centre' Mr J. Accom; Grahamstown council member Mr C. Meyer; Owner of Makana Brick and Tile Mr R Beer; Owner ofthe Beer Property Group Professor R. Van der Merw; Head of the Grahamstown Residents Association, retired. Attended Makana Investment and Development Conference which was held on the 3'd and 4th of December 2005
Defining Characteristics of the town:
Rhodes University and the private schools are the major economic forces in the town and along with the High Court bring in a large number of professionals into the town. The private schools include Kingswood College, St Andrews Prep, St Andrews College and DSG. Meyer (2005) believes this brings in a large number of diverse people which stimulates 'small town charm'. Meyer (2005) also believes it is the skill and diversity of the residents that makes the town flourish. Beer (2005) also indicated that due to the security of the educational facilities, the town is a relatively risk free environment, i.e it is not going to collapse overnight.
Crampton (2005) whom is MD of the NISC centre believes the town is an ideal location to initiate small knowledge based industries, and pointed to the number of these types of organisations already operating in the town. They include Geodatec, National Enquiries Service (NISC) and Coastal and Environmental services (CES).
Beer (2005) and Meyer (2005) both concur that they felt as though the town had grown over the last ten years. Beer himself has invested vast sums of money in property development including the Pepper Grove Mall based on this perceived growth.
Accom (2004) believes that the town is culturally split both socially and economically with very few people and particularly business operations prepared to operate in the former 'locations'. Accom (2005) also believes poverty and unemployment are major problems and that population growth at the lower income brackets is exacerbating the problem; he also indicates that family planning and basic education may ass ist.
Van der Merwe (2005) believes that there has been a decline in services to the residents in the town, and that many technical aspects of the town have been neglected.
153

Meyer (2005) indicates that despite the kaolin reserves in the town, his operations are not simple due to what he describes as the difficult nature of the working class in the town. He indicated that many of the other operations utilising the clay reserves closed down due to labour unrest and that it was a major growth inhibitor for industrial type operations. Lastly, Meyer's operations were intentionally situated outside of the town borders so that he could source electricity directly from Eskom; if he had gone through the town he would be subjected to significantly higher prices and an irregular supply.
Van der Merwe (2005) indicates that the university is the main driver III the local economy and despite the drop in funding from the government it has successfully managed to source additional funding from overseas. Rhodes is also building new residences and lecture halls indicating that it is expanding (Van der Merwe, 2005). Rhodes is also becoming more involved in LED initiatives in the town due to the realisation that its fate and that of the town are intertwined (Vale, 2005). Beer (2005) indicated that the growing student population benefited businesses in the town and is partially responsible for what he sees as its growth. Beer (2005) believes the town has also become a regional shopping centre and is attracting consumers from some of the smaller centres.
Municipality:
Van der Merwe (2005) believed that the municipality neither facilitated nor inhibited growth in the town over recent years. However he believes that there are a number of inherent weaknesses with the local municipality. Post 1994, fuelled by the current ideology, many of the town officials were sacked losing a lot of the corporate memory and the people who replaced them were under qualified and unskilled. Van der Merwe (2005) also points out that due to the under qualified staff consultants were needed and that salaries were not dropped to incorporate this cost, 46% of the municipal budget goes to salaries. Also the municipality has a debtor's book of approximately 114 million rand, largely due from non collection from business in the town and some of the wealthy citizens not as one might expect from the lower income groups, indicating poor collection techniques.
Meyer (2005) indicated that despite being a major employer in the town he experienced an almost non-existent formal relationship with the municipality and to get them to assist his operations required a lot of effort on his part. Crampton (2005) also indicated that she had almost no relationship with the municipality.
Beer (2005) indicated that the old Chamber of Commerce had became inundated by politics and as such slowly deteriorated as it no longer became a tool for businesses to air their concerns as no action would ever be taken and as a result it no longer functions.
Thus whilst the municipality is not seen as actively discouraging growth in the town it is not yet efficient, due to the high salaries and high debtors book. Nor does it appear that they are looking after existing enterprises and trying to solve some of the major issues that they face . However, efforts were made on their part to host an investment and
l54

development conference in December 2005, to brainstorm ideas about how to generate employment and growth in the region, which is a positive step.
LED initiatives:
A number of LED strategies were mentioned at the development and investment conferences, however almost all of them were incorporated in the municipal integrated development plans and as such are covered in the thesis. However, the conference does reaffirm their commitment to the initiated and proposed projects.
A joint initiative has been formed between Makana Municipality and Rhodes University, which aims to stimulate growth in the community. Projects such as promoting edutourism as a means for growth in the town have been proposed and initiated on a small scale (Vale, 2005).
Due to the collapse of the Chamber of Business Beer (2005) has attempted to create a business forum in the town. He plans to initially invite 140 members, businessmen from all sectors of the community. He plans the forum will meet to discuss key policy areas and later involve the municipality, police and NGOs.
Major Advantages and Growth Drivers: ~ Presence of the University and schools ;;- Highly skilled and diverse population in the town ~ Small town atmosphere :.- Low risk environment
Problems and inhibitors of Growth: » Low skill level oflabour ,. Unemployment and social problems, i.e. expanding population in lower income
groups :.- Difficult workforce ~ Municipality :.- Electricity prices
155

Bedford Notes:
Interviews conducted: Mrs Kim Van Niekerk; Local Estate agent, local farming family Mr David Khoury; Local Artist owner of Bedford Craft Centre Mr Ben and Lana Blom; Owners of Eagle's Hout (146 jobs), Lana heavily involved with
local training initiatives in township, receiving money for research through Dutch Government.
Picture of Bedford: Prior to 2000 Bedford, I ike many other small towns in SA was experiencing a state of economic decline, particularly harsh years were from 1998 - 2000. During this period only 2 houses were sold in the town from as little as R5 000 (Van Niekerk, 2005). Khoury (2005) confirmed this by indicating that in the mid 1980's Bedford took a dive and that numerous businesses closed between 1998 and 2000. The reasons behind the decline were numerous. Firstly, a limited market within the town; the wealthier farmers, or owners of game lodges etc withdrew from the town and their children went to school in Grahamstown and would thus shop there. Secondly tourists to the lodges were not really brought into the town, with the exception of maybe visiting Eagles Hout Furnishers (Blom, 2005). Social activities were also moved out of town, meeting places, cricket club etc (Van Niekerk, 2005). Lastly more traditional reasons were the movement of businesses away from the town; Sasko flour factory closed, venison factory closed (10 jobs) as did the railways earlier, the size of the town also made certain types of local activities such as restaurants unsustainable (Van Niekerk, 2005).
Bedford Rejuvenation: Bedford has undergone a mini rejuvenation since 2000. 48 houses roughly 12% of the housing stock in the town have been sold 2001-2005 (Van Niekerk, 2005). Eagle Hout currently employs 146 people (Blom, 2005) and a flower festival was introduced in 2004, which saw 750 people come into the town for the weekend (Van Niekerk, 2005).
Van Niekerk (2005) marketed the town through articles in Country Life etc, this linked with the low interest rates and cheap housing prices in Bedford resulted in individual 's leaving larger centres to relocate in search of a 'better lifestyle' . The effect that the new entrants have had on the town is debatable but their · entry along with the greater participation from the local farmers has led to a slight increase in economic environment. The increase in farmer participation in the town has been a 'community ' effort; whilst many will not do their shopping in Beford they have become more involved in the town (Van Niekerk, 2005).
Renewed tourism has also been a large econom ic boost in the town. Prior to 2000 very little tourism activities occurred in the town and the town itself was often 'missed ' by those visiting the surrounding game loges. However the form ation of the Bedford Art and Craft centre, by the respected artist David Khoury has drawn tourists into the town and sparked economic growth (Van Niekerk, 2005).
156

Greater interaction amongst various sectors of the community to market Bedford, as a tourist destination was achieved through the formation of a multiracial committee to try and include all sectors of the community. Th is committee initiated the annual fl ower festival, held for the first time in 2004 and co-ordinated other activities to market the town as a tourist destination eg paint bins (Van Niekerk, 2005). However, again it is largely the actions of certain individuals that have sparked an interest in Bedford as a tourist destination, Kim Van Niekerk marketing the town in Country Life etc, and David Khoury setting up his gallery in the town despite certain problems.
Other more traditional economic growth has been achieved at Eagles Hout (Blom, 2005) creating 146 jobs, creating furniture and rubber droppers from old telephone lines. Lana Blom has also been highly involved within the coloured and black community offering part time employment and training to mothers, ladies in the location teaching new skills and assisting throughout the process (Blom, 2005)
Municipal and LED Actions: Bedford has been linked with Adelaide into the Nxuba municipality. The union of these towns has been problematic (Van Niekerk, 2005). The representation on the municipal council favours Adelaide 6 - 4 thus a bias has been noted by certain residents of ' favouritism' towards Adelaide, eg potholes not been fixed etc in Bedford. Van Niekerk, (2005) also believed that the LED officer was a concern indicating that he was not as helpful as he possibly could be in assisting the local committee's LED actions. Khoury (2005) had had numerous clashes with the municipality, threatening him for not paying his bi lls although it was their mistake. Clashes also existed between Khoury and the bottle store across the road, as trucks were often parked in front of his store and drunken customers visiting the bottle store, particularly at the month end scared away potential customers passing through the town. Despite Khoury's potential to attract tourists the municipality did nothing to facilitate the row nor did they assist with other requests made such as cutting down dead trees (Khoury, 2005), despite showing off Khoury' s premises, to the authorities in Bisho.
Blom (2005) also experienced problems with the municipal ity, whom he claimed earned 100% profit on electricity, and at a price far higher than what would be paid in larger urban areas, despite being the largest employer in town.
Town Notes: Somerset East and Pearston
People Interviewed: Mr H Machant Mayor; of the Blue Crane Route Municipality Rob Beach; Director of the Blue Crane Route Development Agency Zo la Tetswana; Previous LED officer of the Blue Crane Route Municipality, currently
employed by the Blue Crane Route Development Agency PJ Fourie; Owner ofP1 Engineering and Thelmo Fluid Engineers Chris Wilken; Employee of the Blue Crane Route Development Agency Nico Lombard; Employee of the Blue Crane Route Development Agency
157

Zola Doro; Supervisor on Infrastructure and Community Service, Pearston Luvuyu Matanga; Social Worker, Department of Social Development, Pearson Mr PJ Davenpol1 ; Owner of the Pearston Hotel and Pearston Bottle Store Mr Ian Fife; Article written in the Financial Mail 'Dare to be Dubai' 19 May 2006 regarding the BluCrane Route Development Agency
As the two towns are located in the same municipality a number of the interviewees provide information on both centres and as such the lists of people interviewed relates to both of the towns.
Somerset East:
Town Characteristics:
Unemployment and poverty, as in other towns in the province, is a severe problem. Beach (2005) believes the actual unemployment figure to be close to 80%. Fourie, (2006) believes that a poverty trap exists within the town, residents are poor and accordingly can not afford training and as a result remain poor. Fourie (2006) goes on to mention that the local economy has extremely strong links with the local farmers. However, in many respects this has changed, as the farmers now tend to go to Port Elizabeth for entertainment and shopping. The saving grace in this regard is that they still suppol1 the local school and as such do frequent the town regularly and buy groceries and other essentials. Setswana (2006) indicated that in 1996 things were not looking good for the town, large retailers such as Edgars left, resulting in a loss of business confidence by all. Also around this time a major transition occurred in much of the rural hinterland as many farmers changed to game farming which required less employment, as a result unemployment rose significantly, as agriculture was a major employer within the area and dependency on grants rose. Currently grants are a major economic force within the town. Fourie (2006) indicates that despite the many problems he believes that the town has begun to grow and feels that it will continue to do so particularly with the development of the' eco resort' .
Current bnsiness Environment
The are a number of niche market manufacturers in the town. These include PJ Fourie Engineering and its subs idiary Thermo fluid engineering, a rugby jersey manufacturer and a school science kit producer. Fourie (2006) indicated that there are economic reasons why he should not be located in the town but because of the level of expertise he and the company have, he can afford to locate where he chooses, essentially Somerset East is his personal preference. The other major industry in the town is a tyre retreading plant. Wilken (2006) believes that with the establishment of a number of small specialist
158

industries and the friendly and attractive nature of the town, it has the ability to attract other small industries. An example is the proposed light aeroplane manufacturing plant.
The Blue Crane Development Agency and LED
The municipality is fortunate to have a Development Agency primarily focused on developing the region, the Blue Crane Route Development Agency. They have implemented a number of projects, and have many more planned including the large scale development of the 'eco-resort', which Tetswana (2006) believes will be the towns ' equivalent to Volkswagen in Uitenhage. The agency is also fortunate to have a good working relationship with the municipality, the Mayor Mr Machant (2006) indicated that the municipality backs the agency fully. A number of the major projects are being developed by the agency in Somerset.
• The 'Eco-Resort' - This project has been initiated by the agency, planning to establish the resort at the foot of the Boshberg Mountain. 18 feasibility studies have been performed (Beach, 2006) showing that the project is viable. However, at the time of the last interview they were struggling to get the final environmental impact assessment. Beach (2006) describes it as mega project and expects about R600m will be invested. The resort includes the following:
;... An Equestrian Estate ,.. 18 hole golf course :.- Hotel ;... A wellness centre/spa >- Trout fishing :r Private housing nodes, 420 houses.
There are three different housing nodes aimed at varying markets, it is felt that the resort will compete with the 'golfing estates' that have sprung up around the country, as a cheaper and possibly more attractive alternative. The agency plans on developing the resort and the housing nodes themselves, as they intend to pour the profits ofthe project back into the town. Thus profits will be utilised to maintain the resort, develop the golf course and to spend on other recreational facilities in the town that will benefit the whole community. Through the project it is hoped that a large number of permanent and temporary jobs will be created which will significantly boost the local economy. Machant (2006) also believes that the spin offs from the project will be felt throughout the town.
• The agency has also secured fund ing for the development and construction of an airport in Somerset East. It has a budget of RS million (Fife, 2006), and included in this is the establishment of a light industrial park. They have also managed to attract an Italian light aircraft assembly plant to locate in the town, which was currently located in Pretoria. It is also hoped that over time that the owner may eventually start
159

to manufacture the planes and parts in the town and then export them elsewhere. The primary rationale behind the development of the Airport is to develop tourism in the area allowing Somerset East to become the economic hub of the region (Fife, 2006). The agency and municipal officials are also hoping for secondary benefits and have developed the idea of initiating a flying school, for the lightweight planes.
• A number of agricultural projects have also been developed in and around the town. These projects are primarily aimed at creating employment and the agency has been promoting high value crops such as flowers and bio diesel. An example is Misty Mountains a flower farming fac ility that has been established and which has led to IS pelmanentjobs (Tetswana, 2006).65% of the farm is owned by the labourers and the remainder by the agency (Fife, 2006). It is hoped that the facility will render R885 000 turnover by next year (Fife, 2006). The introduction of the scheme will be supported with training and mentors hip programmes as well as locating markets for the products. Eventually it is hoped that the agency can assist in securing the newly trained farmers their own land.
The agency has been a major catalyst in all of the mentioned projects in Somerset East although it has worked closely with the municipality and their LED programmes.
Tourism potential
Tourism in the town will receive a huge boost with the completion of the airport. It is hoped that this facility will become the main arrival point for tourists to the region (Fife, 2006). The opening of the NOIthern Gate at Addo National Elephant Park, and the tarring of the road between the gate and Somerset East also coincides with this development (Beach, 2006). Thus it is hoped that visitors to the park as well as the other hunting lodges etc. will fly directly into Somerset East, effectively making it the hub of tourism in the region. 'The natural beauty of the town, which brings in tourists and promotes others to relocate, also assist tourism and the development of the 'Eco Resort ' should increase the number of people visiting the town. The municipality also hosts an annual Biltong Festival, which reportedly draws in large crowds from across the country. Bicycle races and other events are also being planned to try an,d boost the sector (Beach, 2006). Fourie (2006) indicated that the beauty and relaxed nature of the town is one of the major reasons that he relocated.
Municipality
The municipality appears to run fairly smoothly, they work well with the development agency. There very few complaints about them by the locals who appeared to be fairly satisfied with the work they were doing.
160

Pearston: Economic Environment
The economic environment is not healthy as it began to decline drastically in the late 1970's (Wilken, 2006). Mr Machant (2006) the Mayor of the Blue Crane Route Municipality described the town as dying, indicating that the banks, post office and other retailers have left the town. Davenpoort (2006) believes the situation to have worsened since the bank closed as now farmers take labourers to Somerset East to get money, and as a result they tended to source personal products there. Thus the local stores struggled even more. Doro and Matanga (2006) indicted that unemployment is huge in the town and that the dependence of grants is massive. The levels of alcohol abuse etc. are also extremely high as residents have little else to do. They also pointed out that many of the older kids in the towns leave at about 16 to go off and look for work in bigger cities such as Port Elizabeth and Cape Town. Very few return unless ill - they indicated a number of the girls become involved in prostitution and regularly become infected with HIV upon which they retnrn to Pearston to die. Thus the socio-economic conditions within the town are poor.
Davenpoort (2006) indicated that the major reason for the decline was the shift to game farming by a number of the local farmers. Game fanning is not labour intensive and as result many labourers living in Pearston were retrenched. To make the situation worse the local farmers also tended to source their goods from other larger centres such as Port Elizabeth or Graaf Reinett.
LED and the Blne Crane Development Agency
Machant (2006) the Mayor indicated due to the situation in Pearston LED projects tended to focus on poverty alleviation. However, a number of these projects aimed at relieving the situation have been cancelled due to a lack of community interest and mismanagement (Doro and Matanga, 2006). The particular scheme they were referring to was a chicken project which collapsed after a year, despite large investments. They also indicted that crop farming as a poverty alleviation strategy was not an option due to the high levels oftheft, vandalism and damage by livestock.
The BCRDA has come up with a LED type concept for Pearston. Wilken (2006) hopes to be able to initiate a hotel/resort aimed at utilising the ' Karoo ' experience as the main drawcard. The idea is establish the resort, which will attempt to attract foreigners and will also include a golf course. The project is one of the few that could possibly be viable in the town, but is still in the planning stage.
161

Municipality and other remarks
Pearston is located in the same municipality as Somerset East so see the comments regarding the municipality in Somerset East. Overall the situation looks dire for the town. The only promising possibility is the development of the 'Karoo Experience' resort, which is still a long way off, and even if it comes to fruition, which is by no means definite, the sustainability of such a venture is questionable. Thus there does not appear to be any quick solution for the town and its economic future does not appear to be strong.
162

Appendix 3: Differing town boundaries between the 1996 and 2001 censuses
Key: Blue lines - 200] boundaries; Green lines - 1996 boundaries
Grahamstown
kI Art u. ..:V: \ U \ X "'" -Cradock
(".... ....
• ) I . ! f ie ... ---163

Pearston
I
.... t.t. - "j..j'-. " -
Bedford
iJUII. A.I ' .J ~ _ II" .. - - -
164

Somerset East
··· ···:~I~~
!~
!.II 11; 0 -:-· .... " ~ D ~ . . . _# \.V.'I J
bo;D ••..•.• \1"".,
I~ .r,~ . m J.x; } it\: U'!I I ... ---Source: Stats SA 1996 and 2001 a, and Parry (2005)
165

Appendix 4: SA total occupation figures
LegISlators. I Sef'Vlce workers , shop Skilled Craft Plant and
semor Technicians and agne and Inachlne officials and market and related operators and assoCiate sales fishery trades and Elem managers Professionals professionals Clerks workers workers workers assemblers occup Undeter Total
1996 364906 870956 542887 709952 820809 357277 1301996 777910 2380103 987054 9113850 2001 515388 668462 919779 1047700 977591 268107 1164967 844229 2539941 637595 9583759
Source: Stats SA, 1996; Stats SA, 2001
166

Appendix 5: LQ calculations
Nati onal LQ figures:
1996
'v"v-sale Manufact· Constr and Pr IVate Undeler
Agile Mmmg urtn9 Elect uction retail Transport Financial services h/h rnlned Tot
G-town 152 28 624 108 791 1510 335 573 4654 1969 1557 12301
etJel 0.01 0.00 0.05 0.01 0.06 0.12 0.03 0.05 0.38 0. 16 0.13 1
La 0.14 0.04 0.41 0.73 1.06 1.02 0.51 0.62 2.18 1.39 1.07 1.00
Cradock 111 7 166 61 515 771 278 245 1540 1089 552 5335
e Ie, 0.02 0.00 0.03 0.01 0.10 0.14 0.05 0.05 0.29 0.20 0.10 1
La 0.23 0.02 0.25 0.95 1.58 1.20 0.98 0.62 1.66 1.77 0.88 1.00
_I'ledford 10 3 36 5 54 67 25 18 238 170 145 771
eJe .. 0.01 0.00 0.05 0.01 0.07 0.09 0.03 0.02 0.31 0.22 0.19 1
La 0.15 0.07 0.38 0.54 1.15 0.72 0.61 0.31 1.78 1.91 1.60 1.00041
Pearstoll 20 0 8 0 23 32 7 4 127 88 56 365
e/e, 0.05 0.00 0.02 0.00 0.06 0.09 0.02 0.01 0.35 0.24 0.15 1
La 0.61 0.00 0.18 0.00 1.03 0.73 0.36 0.15 2.01 2.09 1.30 1.00041
~East 146 3 207 26 211 265 88 107 884 506 490 2933
e Ie 0.05 0.00 0.07 0.01 0.07 0.09 0.03 0.04 0.30 0.17 0.17 1
La 0.56 0.02 0.57 0.74 1.18 0.75 0.57 0.49 1.74 1.49 1.42 1.00041
S Africa 814353 541550 111 9971 109336 555132 1098048 483655 680153 1580686 1053105 1074122 9110111
~,.IEL_ .9·09 0.06 0.12 0.01 0.06 0.12 0.05 0.07 0.17 0.12 0.12 0.99959
LQ = (ej / et)/ (E/Et)
167

2001
! Manufact- ! Constr W·,sale and Pnvate Undeler
Aoric MinlllQ unnQ Elect I uctlon reta!/ TransOM Financial services I hth mined Tot
G-Iown 237 17 494 83 640 1577 229 713 4710 1414 1237 11352
~-~-" 0.02 0.00 0.04 0.01 0.06 0. 14 0.02 0.06 0.41 0.12 0.11 1.00
~- 0.21 0.04 0.35 0.98 1.04 0.92 0.44 0.67 2.16 1.27 1.22 1
Cradock 256 6 165 49 331 978 191 326 1677 802 249 5030
e .Ie 0.05 0.00 0.03 0.01 0.07 0. 19 0.04 0.06 0.33 0.16 0.05 1
c-h-g 0.51 0.03 0.26 1.30 1.21 1.28 0.82 0.69 1.73 1.63 0.55 1
r~edford 24 0 17 6 28 116 17 40 260 66 45 618
~~ 0.04 0.00 0.03 0.01 0.05 0.19 0.03 0.06 0.42 0.11 0.07 1
La 0.39 0.00 0.22 1.30 0.83 1.24 0.60 0.69 2.19 1.09 0.81 1
Pearston 39 0 0 0 14 30 6 11 129 48 51 326
~~, 0.12 0.00 0.00 0.00 0.04 0.09 0.02 0.03 0040 0.15 0.16 1
La 1.19 0.00 0.00 0.00 0.79 0.61 0.40 0.36 2.06 1.50 1.75 1
S Easl 123 0 189 15 176 353 76 133 861 454 376 2756
f-~I,fet 0.04 0.00 0.07 0.01 0.06 0.13 0.03 0.05 0.31 0.16 0.14 1
La 0.45 0.00 0.54 0.73 1.18 0.84 0.60 0.51 1.63 1.68 1.53 1
S Africa 960486 383496 1206846 71622 520488 1454447 442734 904567 1841854 940320 856905 9583765
~t)IEt __ 0.10 0.04 0.13 0.01 0.05 0.15 0.05 0.09 0.19 0.10 0.09 1.00
168

Provincial LQ fignres
1996 I
Undeter I W-sale I Manufact· Constr . and Pnvate
Agric Milling uring Eloct uction retad _ Transport FmanClal servIces hih mined Tot G-tOWIl 152 28 624 108 791 1510 335 573 4654 1969 1557 12301
el/ e, 0.01 0.00 0.05 0.01 0.06 0.12 0.03 0.05 0.38 0.16 0.13 La 0.14 0.25 0.41 1.23 1.16 1.1 5 0.65 1.04 1.63 1.22 0.13 Cradock 111 7 166 61 515 771 278 245 1540 1089 552 5335
e:/er 0.02 0.00 0.03 0.01 0.10 0.14 0.05 0.05 0.29 0.20 0.10 La 0.23 0.14 0.25 1.61 1.74 1.36 1.25 1.03 1.24 1.56 0.10 Bedford 10 3 36 5 54 67 25 18 238 170 145 771
e~/et 0.01 0.00 0.05 0.01 0.07 0.09 0.03 0.02 0.31 0.22 0.19 La 0.14 0.43 0.38 0.91 1.26 0.82 0.78 0.52 1.33 1.69 0.19 Pearston 20 0 8 0 23 32 7 4 127 88 56 365
eulet 0.05 0.00 0.02 0.00 0.06 0.09 0.02 0.01 0.35 0.24 0 .1 5 La 0.61 0.00 0.18 0.00 1.14 0.82 0.46 0.25 1.49 1.84 0.15 S East 146 3 207 26 211 265 88 107 884 506 490 2933 eo/e, 0.05 0.00 0.07 0.01 0.07 0.09 0.03 0.04 0.30 0 .17 0.17 La 0.56 0.11 0.57 1.25 1.30 0.85 0.72 0.82 1.29 1.32 0.1 7 Ecape 70470 7153 97035 5598 43634 83817 32850 35181 183189 102865 125028 786820 E"IE, 0.09 0.01 0.12 0.01 0.06 0.11 0.04 0.04 0.23 0.13 0. 16 1
169

2001 W-sale
Fmancial I S9lViCeS Manufacl- Consu and Pnvate Undeler
Agrtc Mimng unng . Elect uctlon retail Transport h/11 mined To. G-town 237 17 494 83 640 1577 229 713 4710 1414 1237 11352
_el/el . 0.02 0.00 0.Q4 0,01 0.06 0.14 0.02 0.06 0.41 0. 12 0.11 1.00
LQ 0.22 0.25 0.36 1.47 1.16 1.00 0.55 0.92 1.59 1.05 1.07 1.00
Cradock 256 6 165 49 331 978 191 326 1677 802 249 5030
e,let 0.05 0.00 0.03 0.01 0.07 0.19 0.04 0.06 0.33 0.16 0.05 1.00
~- 0.53 0.20 0.27 1.95 1.35 1.40 1.04 0.95 1.28 1.35 0.49 1.00
Bedford 24 0 17 6 28 116 17 40 260 66 45 618
e,Je, 0.04 0.00 0.03 0.01 0.05 0.19 0.03 0.06 0.42 0.11 0.07 1.00
LQ 0.39 0.00 0.22 1.30 0.83 1.24 0.60 0.69 2.19 1.09 0.81 1.00
Pearston 39 0 0 0 14 30 6 11 129 48 51 326
_~,Ie, __ 0.1 2 0.00 0.00 0.00 0.04 0.09 0.02 0.03 0.40 0.15 0.16 1.00
LQ 1.25 0.00 0.00 0.00 0.88 0.66 0.50 0.49 1.52 1.24 1.53 1.00
S East 123 a 189 15 176 353 76 133 861 454 376 2756
et/et 0.04 0.00 0.07 0.01 0.06 0.13 0.03 0.05 0.31 0.16 0.14 1.00
LQ 0.47 0.00 0.57 1.09 1.31 0.92 0.75 0.71 1.20 1.39 1.34 1.00
Ecape 72122 4574 90866 3762 36762 104646 27587 51451 196346 89338 76887 754341
E,iE, ____ 0. 10 0.01 0.12 0.00 0.05 0.14 0.04 0.07 0.26 0.12 0.10 1.00
170

Appendix 6: SAM calculations
1 Aggregated SAM
AGR MIN AGI - TEX-- - PPP-- PET - CHM HEV MAC OHM ELE WAT vU", I AGR 51179.44 39 31236.81 614.55 1257.44 1.34 441.12 83.39 206.14 2292.17 9.71 8098.29 713.2413451 MIN 174.49 84078.39 117.13 23.89 216.72 11935.15 2368.04 9466.059665 156.37 1669.46437 3952.16 136.93 4173.316C AGI 4917.889 60.46 99823.11 1178.62 134.75 0 1103.543 16.90132938 8.9341.3690716 29.74 0 TEX 536.25 450.43 109.4447 33442.74 38.12039 0 240.5841 44.69 770.6393 1304.20391 6.35 • O~ 000
PPP 322.98 153.46 2824.19 353.0498 41966.02 1.58 1332.618 281.6255296 383.1449 905.412907 28.89 5[,. PET 2907.73 1256.07 523.55 110.1 270.22 23328.16057 5421.384 1399.62 526.35 287.05 103.72 40.64 11 CHM 4544.83 3254.82 967.39 2557.774 2313.88 362.9285245 68996.97 2654.389635 2799.127 6677.14966 64.87 199 853] HEV 585.69 2808.21 2070.35 295.7044 139.56 81.68236884 1526.521 94345.64507 15303.41 1923.56959 180.92 129.32 12595.27
IMAC 2005.96 5118.48 517.84 528.7002 779.6 288.96 831.0025 3708.045186 115517.9 733.31311 1163.26 282.77 OHM 430.75 2304.21 2465.59 819.4579 1292.191 30.15 3426.252 766.0710836 4075.272 39579.013 55.75 147.83 ELE 452.27 3733.23 624.92 279.17 512.28 257.92 1125.73 4665.73 647.06 474.72 28993.25997 427.29 1067.53556 WAT 8324.312 426.54 217.04 59.88 87.27 21.6 66.96 117.37 23.56 30.45 121.
841.63 0 0 0 0 0 0 0 0 1250.87 0 86740. 9847.098 22060.78 45002.11 22173.53 11432.47 15179.26088 26264.49 22238.34429 48440.81 20095.7347 1377.613914 560.8218058 6128.2
v~, 16839.68 23460.27 14246.86 1415.704 5228.822 8134.282921 8438.903 12188.80306 7562.646 3027.28522 11465.49662 2199.903595 8281.71099 LABLO 7101.787 16898.2 4972.932 5265.065 1895.607 542.8916618 2170.905 7221.987701 6627.511 5307.77511 3329.164772 333.4170346 8740.54174 LABMED 1040.271 4365.496 3456.139 922.7977 2733.825 501.1001569 2003.79 3996.14243 4507.312 2379.85776 1476.139638 166.524708 2711. LASHI 238.2006 2348.441 2859.657 822.2685 2327.55 855.9799557 3422077
1 ;+ ::t- "" ~ ;+"" 2990.920578 4937.438 1832.05193 2314.79559 302.1200118 2317.64464
FIRMS 01 01 01 01 01 01 01 0 0 0 0 0 0 01 01 01 01 Ql___ _ Ql Ql 0 0 0 0 0 0
IHHLOW ~I ~I ~I ~I ~I _ ~j ~I ~I ~I ~I ~I ~I ~ IHHHt J ~I ~I ~I ~I u~1 _ _~I ~I ~I ~I ~I ~I ~I ~ GOV 572.413 854.7123 15482.47 2803.183 1174.737 16660.9792 2428.248 1102.038867 11935.55 2582.16357 1111.735498 100.178382 INV 0 0 0 0 0 0 0 0 0 0 0 0 o ROW 3419.824 11962.82 10878.17 6646.451 5705.463 4011.268895 17012.52 8669.843484 70792.9 9071.41379 276.1526337 70. Total 115647.6 186475.6 238395.7 80312.64 79506.52 82195.23514 148622.5 175957.8179 295222.1 100214.168 57311.96863 26316.40151
115647.61 186475.61 238395.71 80312.641 79506.521 82195.235141 148622.51 175957.81791295222.11100214.1681 57311.96863
171

\' rt"'\\" CO" \v
\1'1

2 A: nxn matrix of direct technical coefficients for endogenous factors Calculation used (AlSector total) eg row Agr and column Agr = 51179.44/115647.6
173

.0 00 00 00 00 00 00 00 00 00 00 _0 0
1;
~ 00 00 0 00 00 00 00 00 00 00 0_ 00 0
~ 0 00 00 00 00 00 00 00 00 00 _0 00 0
~ 00 00 0 00 00 00 00 00 00 0_ 00 00 0
i 0 00 00 00 00 00 00 00 00 _0 0 0 00 0
~
5
; 00 00 00 00 00 0 00 00 0_ 00 00 00 0
0 00 00 00 00 00 00 00 _ 0 00 00 00 0
~ 0 00 00 00 00 00 00 0_ 0 0 00 00 00 0
'< u 00 00 00 00 00 0 00 _0 00 00 00 00 0
~ 0 00 0 0 00 00 00 0 _ 00 00 00 00 00 0
§ 00 00 00 00 00 0 _0 00 00 00 00 00 0
~ ~ ~
00 00 00 00 00 - 00 00 00 00 0 0 00 0
~ 00 00 00 00 0_ 0 00 00 00 00 00 00 0
~ 00 00 00 00 _ 0 0 00 00 00 00 00 00 0
~ 0 00 00 00 _0 00 00 00 00 00 00 00 0
~ 00 00 00 -00 00 00 00 00 00 00 00 0
~ 00 00 0_ 00 00 0 00 00 00 00 00 00 0
Ii! 00 00 _0 00 00 0 00 0 0 0 00 00 00 00
>< ~
.;: 00 0_ 00 0 00 00 00 00 00 00 00 00 0 - @ eo ::s 00 _ 00 00 00 00 0 0 00 00 00 00 00 0
.€ ~ -= 0_ 00 00 0 00 00 00 00 00 00 00 00 0
" "C ~ ....
-< _0 00 00 0 00 00 00 00 00 00 00 00 0 , t:: ~
~ ~ h ~ ~ ~ ~ I ~ I! :1 H ~ ~ H ~ ~ H ~ ~ 8~ ~ ~ '" ~


5 Leontifinverse =MINVERSE C90;Z113) F Iffi MN K1 lEX IW IB GM ffiV MOe GM ElE WAf aN S'R eM' lPlW lPB\ffi lAlH FJRM; fHOO fHA< aM"', Iffi 21" 0"" osa OW 02S 0.131 0.1713 O.lg ala 0:E1 oax 1.397 OZJl 0221 01:< 0.Ja2 033( 02!> 01'" 051> osa 0J3:
MN 0"" 1.'" oor. oar. 000: 0.41 0.140 Oal 00il' 0.131 032! 011 0251 01J7\ 00il' 0005 OI'" 0(& 0011 om 000; 0(&
Kl 0581 046e 21S 049: 043< 0.'" 0.:" 0.451 0."" A..: 0471 0.5>4 0<8: A"" 03a OllE 0.00' 071 035; 1.4~ 1."" 00>
lEX 0 11 0.11 01a 1.81 0 1~ O.rJi OO>S 010 0"" 01:< 011 0.11 01~ 01" oem 0100 01BE 017- 000: 021 0.>« 021
IW 011 01eE 0141 0 13< 22Z om 0132 0.11 01J7\ 0142 000i 011 01Z 015< oco. 01:< 013( Ot> om 014: 0.1'" 01~
IB 017 012' 0 11 011 011 1.4~ 0100 0.13 oem 012' 01 0.151 01~ 0.141 00/( 0149 0.151 D.," a"" 01'" 0.13' 014<
GM 0'" a"" a1g 027( 02!l 0.13< 2019 0.2> 0.1'" o.m 0.171 o.m a2Z oa> 01ai 0.2!< 02¥ 0.23< 011 0.2i1 0.27:< 0251
fEY 011 01S:; 011 010: 0'" 0."" 01:< 225< 0.241 0.1"' 01Z 0.1a OSl 0.11 a"" 01'" 0.1<' 01. aa;; 011 0.11 am
M'C 0.201 am oax 021 0.;>], 0.16: 0.192 a2!l l.m 021 027l aLa: 0'" 0.<1> 013< aa> am 0291 014< 02Z 0.2:< 025<
GM 01" 0144 0.131 0."" 01~ 0.00< 0.16< 0.1a 01<> 1."" 011 0134 oax 0.1'" 0071 a1a; 0.1" °1~ oem 0141 01"' 015
ElE 0.1(( 0.151 are 00il' 0.101 0.071 0.<» 01g 000; 000i 21<> 0.1", 014: 0.09' 000 a11€ 0.111 ala Oa;( 0.171 013( 0.11
W\T 032! oas:< 01. 0C61 Oa;( o.m; 0.041 0.010 am oco. am 2ax am om am 0075 am Ooo:J 0031 011 01'" 0.07
aN 0"" aOB< 0031 00il' 003 oor 0033 0011 ow 0.0il' 01~ 00il' 239 0.0il' 001 arne 003 o.w 001 001: 0.0Ie 0.031
S'R 2><- 2"" 2<8: 2"" 245 1.91 2"" 2'" 1."" 2"" 1." 21S; 233 4.45< 1.2<' 273< 271 2718 1.34: 2"' 277 271
eM' a"" a"" oro: 0 56E 061 0531 A"'" 000; a3BE A"" 083( OOCE 060 073! 1.241 a"" 056< 06<1 a", as< 062! 0.$
lPlW 02ID 033< a22l 0.:<> 0.21 016: 0191 02!l alS; 027( 0.'" 0.,," 034: 0.201 0Oil' 1."" 01" 0101 0'" 02> 0"" 0.2>
IPIMD 0.2:< 0"" 0"" 0.27: 0.29: 0.1'" 0.231 0271 019: OZJ A"" 02:< 027. 0.'" 011 Q252 1.201 024 01Z 0.'" 0."" 0.'"
lAlH 011 0130 013 01'" 0.17 0.1'" 01S: 015 011 0.151 01 0134 015 01 00il' 0 129 012; 1.1'" 000: 01« 0 1:> 0.1
FJRM; 0711 0 641 A'" 0 51 0571 0.'" 05Z 061 0331 052: 077 0749 oro 0.68< 1.151 05>4 0.511 0501 1.24> 0501 osa; D."" - am oaz; 001 am 001 0.01 001 am 001 001 am 001 OQZ om 0011 aas:< oor 001 0.011 1.01 001 001
I+L"" 0.044 0Ol! A"" 0044 000 oct!! 0.033 A"" 0."" A"" OOIC 0."" Oa;( OOIC OW 0129 0071 00:< om 000 tOil' 0.00
HIM"" 04s. 04S> 04<! Q461 0.453 0.31 0.381 041< aD< O~ 0.501 04s. 051 0.53< 03V tOOl 09& Q7<' 035< 04« 043 1.:>1 -d- o."" 0252 0.2Z O.~ 0.250 0.17 0.21 025< 01'" 0244 OZJ 0244 Oal 0."" 01 .. 0:>l7 Og)' 0642 a2l1 0."" aZl' 0.21 -.", 021 ow 01~ 018< 0195 Q151 o.m oa> 012' 0 18< 0Z> 022< 02lC 0."" Oali 02<5 025< a35E a2!> Oto a 1B[ 0.171
Tct3 9."" .357 '2!I 9.40< 9.<65 7.14< .661 .00: &79< 9257 964: 10"" 10n 9.00< 5."" laem 9.Ell' 9687 527> 10.29: 1001 9.a;(
176

6 (l-Az)-1 * F-(I-A) -1' F= [(I-Az)-(I-A)] =A Yl
F = Gov + lnv + ROW (See table 1) l-A*F = {=MMULT(Table 5, l-A*F column table 6) Total- Table 1 Difference = I-A *F - Total
F 1-A*F Total AGR 2624.540971 115648.0412 115647.6053 MIN 67079.60397 186475.6782 186475.6427
-AGI 24797.61395 238395.8659 238395.7025 TEX 7590.491395 80312.67464 80312.63943 PPP 3097.734609 79506.55596 79506.51941 PET 6472.06661 82195.28213 82195.23514 CHM 17037.93618 148622.543 148622.4564 HEV 35258.25773 175957.8572 175957.8179 MAC 93888.86169 295222.1857 295222 .1047 OHM 13290.31119 100214.2096 100214.1678
-ELE 2231.357901 57312.01715 57311 .96863
-WAT 477.8265443 26317.08787 26316.40151 CON 53039.23437 150434.8189 150434.8069 SER 253575 .7983 1824883.626 1824882.952 CAP 9424 370416.6229 370416.3707 LASLO 0 141514.5459 141514.4636 LASMED 0 169071 .9376 169071 .8671 LASH I 0 86538.59524 86538.55341 FIRMS 0 343111 .6043 343111 .3707 HHLeast 7034.541693 17674.90247 17674.89657 HHLow 9841.69715 33553.966 33553.95291 HHMiddle 13969.40866 281996.5623 281996.4195 HHHigh 1304.939941 146835.8524 146835.7763
\77
Difference 0.435913402
0.03555476
0.163408134 0.035206387 0.036551859 0.046991936 0.086655078 0.039274541 0.081032594 0.041816882
0.048515805
0.686353463 0.012005258 0.674492741 0.252262134 0.082294289 0.070475564 0.041828003 0.233666796 0.005897559 0.013095014 0.142823694 0.076118623

---
114287.024 I 114286.9547 I 0.069236128 3.411470643
Scenarios were tested by alerting figures on the original SAM to represent the scenarios tested eg a RIO billion investments in the agricultural sector was calculated by adding RIO to R51179 . The calculation ofthese scenarios are illustrated below.
10% decrease 10% increase R10 billion 5% R10 billion R10 billion in agriculture in agriculture investment increase in investment investment
in Agro in in agriculture Industries agriculture Petrolium
AGR -10126.8 12278.0 22.1 153.1 6.6 1.7 MIN -454.1 550.6 1.0 18.0 0.8 4.2 AGI -2709 .1 3284.7 6 .0 530.3 21 .7 3.2 TEX -551.4 668.5 1.2 24.6 1.0 0.8
PPP -543.6 659.1 1.2 36.4 1.5 0.8
PET -817.4 991.0 1.8 29.4 1.2 14.8 CHM -1430.8 1734.8 3.2 49.1 2.1 1.4 HEV -533 .0 646.3 1.2 28 .9 1.2 0.8 MAC -1148.9 1393.1 2.5 49.3 2.1 1.7 OHM -573.1 694.9 1.3 32.3 1.4 0.9 ELE -465.8 564.8 1.0 20 .9 0.9 0.8 WAT -1514 .7 1837.8 3.9 26.7 1.7 1.0 CON -184.7 223.9 0.4 8.5 0.4 0.3 SER -10472.9 12698.1 23.1 612.0 25.5 19.8 CAP -3583.6 4345.0 7.9 155.9 6.6 5.6 LABLO -1338.0 1622.3 2.9 55.4 2.3 1.7 LABMED -1055.1 1279.3 2.3 61 .5 2.6 1.9
178

LABHI -538.3 652.7 1.2 32.6 1.4 1.1 FIRMS -3319.4 4024.8 7.3 144.4 6.1 5.2 HHLeast -92.3 111 .9 0.2 4.1 0.2 0.1 HHLow -203.6 246.9 0.4 9.2 0.4 0.3 HHMiddle -2141 .6 2596.6 4 .7 103.5 4.3 3.3 HHHigh -1103.3 1337.8 2.4 56.0 2.3 1.8 HHHighest -990.0 1200.4 2.2 46.0 1.9 1.6
-45891 .5 55643.0 101 .7 2288.3 96.2 74.9
179

Appendix 7: Calculation of the economic impact of Students on the Grahamstown Economy
The following tables are extracts fTom the study conducted by Snowball and Antrobus (2005) illustrating the economic impacts of Rhodes students on the Grahamstown economy. The study differentiates between South African and foreign students.
Expenditure Method
Table 1: E dit .~ -----~-. - ----thod: L' . . , A__ _ .. _".~_~
A. B. e. Total(Rand) rrotal for all DIGS Monthly spending x 8 Rent x 12 lNo. of pending per (A+B)C
(Rand) Rand) ~tudents tudent (A+B) IR millions SA II 912 12072 2686 23984 64.42 iForeign II 016 13 068 401 24084 9.7
iREs A. B. ~. Total spending rrotal for all Monthly spending x 8 RU res. lNo of per student (A+B)C
~tudents A+B) IR millions ~A 8032 20100 757 28 132 21.3 !Foreign 6624 20100 958 26724 25.6
Table 2: F ~ees per annum Undergradnate Postgraduate
Average fees No. of Total Average fees No. of Total (Rand) students (Rm) Rands students (Rm)
SA 14176 3684 52.2 9773 798 7.8 !Foreign 16 176 I 330 21.5 II 773 440 5.2
180

............ _ .......... _ .............. _ • ••• .. _~. "'-J'" _ •• _.~_. _ ••• _~ .. .... _ ~ . _. _ ....... • •• _ . .. ...... ~ .... __ ~ •• _
SA lForeign IA. Cost of livin!! 85 .64 [.l 5.26 lB. Fees 60.03 6.7 C. Direct impact 145.67 KJ 1.96 p. Indirect impact (C x 0.18%) 06.22 11.15 I!<:: Total impact (C+D) _ J1.1.89 3.1 1
Income Method
Table 4: I _ .. _ ....... - ... _. hod: L' . .. 'VIDe ex penses A. lB· e. iI'otal spending Total for all
iDIGS Monthly income x 8 ~ent x 4 No. of per student A+B)C (Rand) (Rand) tudents A+B) R millions
ISA 15864 4024 2686 19888 53.42 [Foreign 15 968 4356 401 20324 8.15
~S A. lB· e. iI'otal spending Total for all Monthly income x 8 ~U res. No of ~er student A+B)C (Rand) tudents A+B) R millions
SA 6136 20 100 757 26236 19.86 , [Foreien 7680 20 100 958 27780 26.61 __ J
-
181

---~ - -- - --------- ---- --_. --------- --------- - - -- -- - -- ------- ---- - " -------SA !Foreign
IA. Cost of living 73.28 ~4.76 lB. Fees 60.03 ~6.7 n. Direct impact 133.3 1 61.46 D. Indire~t impact (C x 0.18%2 ?3.99 11.06 IE. Total impact (C+D) 157.30 r72.52 'The calculation of fees is similar to the expenditure method.
/ ' ' l ' '
; 1-' "r.u·~;)\ \ V, l .. nO .' ,. , \: n,1,") ~ c" .:J
'. ~,,'\,,",. \ I
.-:;/
182