The Distribution of Benthic and Hyporheic Macroinvertebrates from the Heads and Tails of Riffles
15
Primary Research Paper The distribution of benthic and hyporheic macroinvertebrates from the heads and tails of riffles John Davy-Bowker 1, *, Wayne Sweeting 2 , Nicole Wright 3 , Ralph T. Clarke 1 & Sean Arnott 1 1 Centre for Ecology & Hydrology, Winfrith Technology Centre, DT2 8ZD, Dorchester, Dorset, UK 2 School of Biological Sciences, University of Wales, LL57 2UW, Bangor, Gwynedd, UK 3 Department of Geography, Simon Fraser University, V3B 7R5, Burnaby, British Columbia, Canada (*Author for correspondence: E-mail: [email protected]) Received 29 June 2005; in revised form 5 December 2005; accepted 10 December 2005; published online 4 April 2006 Key words: macroinvertebrates, benthic, hyporheic, riffle, upwelling, downwelling Abstract The spatial distribution of benthic (up to 0.05 m depth) and hyporheic (0.25 and 0.5 m depth) macroin- vertebrates from downwelling zones at the heads of riffles and upwelling zones at the tails of riffles was examined in two studies on a 4th order chalk stream in Dorset, England. In the first study, differences in benthic and hyporheic macroinvertebrate community composition between the head and tail of a single riffle were investigated. In the second study, a replicated design involving eight riffles was used to compare benthic and hyporheic macroinvertebrate community composition both between heads and tails of the same riffles and between riffles. In the first (single riffle) study there were significantly higher mean numbers of benthic invertebrates and families at the riffle head (715 individuals and 13.8 families per 0.0225 m 2 ) compared to the tail (192 individuals and 8.7 families). ANOSIM analysis also showed that the community structure of head and tail benthic samples was significantly different. In the second (replicated riffle) study, there were also significantly more benthic invertebrates at riffle heads ( x=594 per 0.0225 m 2 ) compared to tails ( x=417 per 0.0225 m 2 ), although this was not the case for families, and community structure also differed significantly between riffle heads and tails. In contrast, in the hyporheic zone, there were no significant differences between the total numbers of invertebrates in the riffle heads and tails, or between riffles, although a significant difference in family richness between riffle head and tail samples was identified in the first study. Community analysis revealed progressively poorer separation of riffle head and tail samples at 0.25 m and 0.5 m hyporheic depths. Whilst being able to identify clear differences in benthic communities from riffles heads and tails, the physically heterogeneous nature of the riffle habitats studied made it difficult to account for the consistent differences in macroinvertebrate communities observed with the physical variables measured. Introduction Of the physicochemical factors known to influence the micro-distribution of benthic macroinverte- brates in rivers, substratum particle size, water velocity and depth are probably the most impor- tant (Quinn & Hickey, 1994; Beisel et al., 1998). However, in addition to the physicochemical properties of the benthic habitat, there is a grow- ing awareness that the hyporheic zone may play an important role in the functioning of lotic ecosys- tems (Stanford & Ward, 1988; Triska et al., 1989; Valett et al., 1990; Bencala, 1993). The primary means of physical interaction between surface and hyporheic habitats is via the exchange of water in areas of up- and downwelling Hydrobiologia (2006) 563:109–123 ȑ Springer 2006 DOI 10.1007/s10750-005-1482-9
-
Upload
bournemouth -
Category
Documents
-
view
1 -
download
0
Transcript of The Distribution of Benthic and Hyporheic Macroinvertebrates from the Heads and Tails of Riffles
Primary Research Paper
The distribution of benthic and hyporheic macroinvertebrates
from the heads and tails of riffles
John Davy-Bowker1,*, Wayne Sweeting2, Nicole Wright3, Ralph T. Clarke1 &Sean Arnott11Centre for Ecology & Hydrology, Winfrith Technology Centre, DT2 8ZD, Dorchester, Dorset, UK2School of Biological Sciences, University of Wales, LL57 2UW, Bangor, Gwynedd, UK3Department of Geography, Simon Fraser University, V3B 7R5, Burnaby, British Columbia, Canada(*Author for correspondence: E-mail: [email protected])
Received 29 June 2005; in revised form 5 December 2005; accepted 10 December 2005; published online 4 April 2006
Key words: macroinvertebrates, benthic, hyporheic, riffle, upwelling, downwelling
Abstract
The spatial distribution of benthic (up to 0.05 m depth) and hyporheic (0.25 and 0.5 m depth) macroin-vertebrates from downwelling zones at the heads of riffles and upwelling zones at the tails of riffles wasexamined in two studies on a 4th order chalk stream in Dorset, England. In the first study, differences inbenthic and hyporheic macroinvertebrate community composition between the head and tail of a singleriffle were investigated. In the second study, a replicated design involving eight riffles was used to comparebenthic and hyporheic macroinvertebrate community composition both between heads and tails of thesame riffles and between riffles. In the first (single riffle) study there were significantly higher mean numbersof benthic invertebrates and families at the riffle head (715 individuals and 13.8 families per 0.0225 m2)compared to the tail (192 individuals and 8.7 families). ANOSIM analysis also showed that the communitystructure of head and tail benthic samples was significantly different. In the second (replicated riffle) study,there were also significantly more benthic invertebrates at riffle heads (�x=594 per 0.0225 m2) compared totails (�x=417 per 0.0225 m2), although this was not the case for families, and community structure alsodiffered significantly between riffle heads and tails. In contrast, in the hyporheic zone, there were nosignificant differences between the total numbers of invertebrates in the riffle heads and tails, or betweenriffles, although a significant difference in family richness between riffle head and tail samples was identifiedin the first study. Community analysis revealed progressively poorer separation of riffle head and tailsamples at 0.25 m and 0.5 m hyporheic depths. Whilst being able to identify clear differences in benthiccommunities from riffles heads and tails, the physically heterogeneous nature of the riffle habitats studiedmade it difficult to account for the consistent differences in macroinvertebrate communities observed withthe physical variables measured.
Introduction
Of the physicochemical factors known to influencethe micro-distribution of benthic macroinverte-brates in rivers, substratum particle size, watervelocity and depth are probably the most impor-tant (Quinn & Hickey, 1994; Beisel et al., 1998).However, in addition to the physicochemical
properties of the benthic habitat, there is a grow-ing awareness that the hyporheic zone may play animportant role in the functioning of lotic ecosys-tems (Stanford & Ward, 1988; Triska et al., 1989;Valett et al., 1990; Bencala, 1993).
The primary means of physical interactionbetween surface and hyporheic habitats is via theexchange of water in areas of up- and downwelling
Hydrobiologia (2006) 563:109–123 � Springer 2006DOI 10.1007/s10750-005-1482-9
through the streambed. Surface water and hypor-heic water differ markedly in a number of respects.Firstly, in summer, upwelling zones have coolerwater temperatures than downwelling zones,reflecting the transit time spent in the colder hyp-orheic zone (Brunke & Gonser, 1997; Evans &Petts, 1997; Franken et al., 2001), although thispattern can be reversed in winter (Hendricks,1993). Secondly, dissolved oxygen levels are higherin downwelling water (Grimm & Fisher, 1984;Jones et al., 1995a, b). Thirdly, nutrient levels areoften higher in upwelling zones (Grimm et al.,1991; Boulton, 1993; Valett, 1993).
The biological consequences of exchanges ofsurface water and hyporheic water are onlypartially understood. Bacterial numbers (Dole-Olivier & Marmonier, 1992), bacterial biomass(Hendricks, 1993) and bacterial activity(Hendricks, 1993, 1996) are typically greater indownwelling zones (where aerobic processes areoften dominant) compared to upwelling zoneswhere anaerobic processes can dominate(Hendricks, 1993). Algal and macroinvertebrateresponses to upwelling and downwelling zonesappear to differ. Whereas greater benthic algaldensities have been recorded from upwellingzones compared to downwelling zones (Coleman& Dahm, 1990; Valett et al., 1994), hyporheicinvertebrate density and diversity has been foundto be higher in downwelling zones (Hendricks,1993; Franken et al., 2001). The effects of verti-cal hydraulic exchange on benthic macroinver-tebrate communities are less well known.Research by Plenet et al. (1995) on the FrenchRivers Rhone and Ain has shown that in benthicsamples several hypogean taxa were foundmainly in areas of upwelling. More recentlyPepin & Hauer (2002), studying two rivers innorth-western Montana, have linked distributionand abundance patterns of benthic Ephemerop-tera, Plecoptera and Trichoptera to hyporheicexchange patterns in riffle habitats. However,studies of the effects of vertical hydraulicexchange on benthic macroinvertebrates havebeen few in number and this subject is stillpoorly understood.
Downwelling zones are typically thought tooccur at the heads of riffles while upwelling zonesare found at the tails (Savant et al., 1987). Giventhe considerable differences in the physical and
chemical properties of surface and hyporheicwater, and an increased awareness of the signif-icance of hydrologic exchange processes onstream structure and function (Findlay, 1995;Brunke & Gonser, 1997) we hypothesisd thatbenthic and hyporheic macroinvertebrate assem-blages would differ between riffle heads (down-welling zones) and tails (upwelling zones) andthat benthic and hyporheic numbers and familyrichness would be greater in downwelling zonescompared to upwelling zones. This hypothesiswas tested firstly in a study of the head and thetail of a single riffle. Secondly, a study incorpo-rating eight riffles was carried out allowing us toinvestigate benthic and hyporheic macroinverte-brate community composition between riffleheads and tails, and between riffles, therebyallowing us to further test the generality of ourhypothesis.
Materials and methods
Study area
The study sites were located on the upper reachesof the River Frome in Dorset, the western-mostchalk stream in Southern England. From itssource in the north Dorset Downs (altitude175 m), the Frome flows for some 60 km beforeentering Poole Harbour. The geology of the uppercatchment is complex, comprising Middle andLower Chalk, Upper Greensand and Gault Clay.Groundwater contributes a high proportion of theriver flow, resulting in the stable flow regime that isa typical feature of groundwater dominance(Dunne & Leopold, 1978; Sear et al., 1999). TheFrome system is also typical of groundwater-dominated rivers in its significantly diminishedriver network (Maddock et al., 1996). The eightriffles chosen for study were located within a1.6 km riffle-run stretch of the R. Frome at thevillage of Notton, between 12.7 and 14.3 km fromsource (50� 46¢ N, 2� 33¢ E). Here the river is 4thorder (Strahler, 1964) with a drainage basin ofsome 90 km2. The average river width is 9 m, thesubstrate consists of pebbles, gravel and sand andthe water quality (Table 1) is good (EnvironmentAgency, General Quality Assessment, chemicalgrade B).
110
Survey design
Benthic and hyporheic macroinvertebrate sampleswere collected to examine differences betweencommunity composition from the head and tail ofa single riffle. 10 benthic samples (sampling downto a maximum depth of approximately 0.05 m), 10shallow hyporheic samples (extracted from 0.25 mdepth), and 10 deep hyporheic samples (extractedfrom 0.5 m depth), were collected from the head ofthe riffle and from the tail, giving a total of 60samples.
A more extensive study was also carried outto assess variation between the heads and tails ofriffles relative to variation between riffles, interms of both the benthic and hyporheic fauna.Two benthic samples were collected from thehead of each riffle, and a further two from thetail. Four hyporheic samples (0.25 m depth) werecollected from the same locations as the fourbenthic samples, giving a total of eight samplesfor each of the eight selected riffles. In bothstudies, hyporheic samples were extracted fromdirectly below the benthic sampling locations.Distances between samples from the riffle headand samples from the riffle tail ranged betweenapproximately 2 and 10 m depending on thelength of the riffle. Distances between replicatesamples from within the riffle head or replicatesamples from within the riffle tail were always atleast 1 m.
Sampling methods
Samples from the single riffle study were collectedin May 2001, while those from the replicated rifflestudy were collected in May 2002. Benthic sampleswere collected using a Surber sampler (0.0225 m2,0.3 mm mesh). Hyporheic samples were takenusing a standpipe and Bou Rouch pump (Bou &Rouch, 1967). Approximately 5 l of hyporheicwater was extracted in the single-riffle study and10 l in the replicated riffle study. Hyporheic waterwas filtered on the bank using a 0.3 mm sieve.Invertebrate samples were fixed in the field in afinal solution of approximately 5% formaldehyde.Following laboratory sorting, identification andenumeration to Biological Monitoring WorkingParty (BMWP) family level (Murray-Bligh et al.,1997), specimens were stored in 70% alcohol. Theeight BMWP artificial taxon groups, e.g. ‘‘Hyd-robiidae (including Bithyniidae)’’, are referred toby their primary group name, e.g. ‘‘Hydrobiidae’’.
The invertebrate sampling and environmentaldata collection were closely coupled. Given thatcollection of the hyporheic samples caused con-siderable disturbance due to the need to sledgehammer the standpipe into the streambed, thebiological sampling and recording of environ-mental variables was carried out in the followingsequence: (1) a Surber sampler was positioned overthe gravel on the riverbed; (2) a 0.1 m substratumdepth temperature measurement was taken fromwithin the Surber (using a modified Brannon dig-ital thermometer probe); (3) the benthic Surbersample was collected and the streambed wasmarked with a numbered peg; (4) the near bedvelocity was recorded (Geopacks velocity meter);(5) water depth was measured; (6) a benthic algalsample was taken (1–3 exposed stones were takenand fixed with 5% formaldehyde); (7) substratumcomposition was visually estimated as percentagecover of each of the categories boulders & cobbles(>64 mm), pebbles & gravel (2–64 mm), sand(0.06–2 mm), silt and clay (<0.06 mm); (8) thepercentage macrophyte cover and aerial shadingwas estimated; (9) the 0.25 m and then the 0.5 mhyporheic samples were taken. Throughout thesampling the river temperature was recorded atperiodic intervals and hence the relative difference(RTemp) between the 0.1 m depth substratumtemperature measurements and the river water
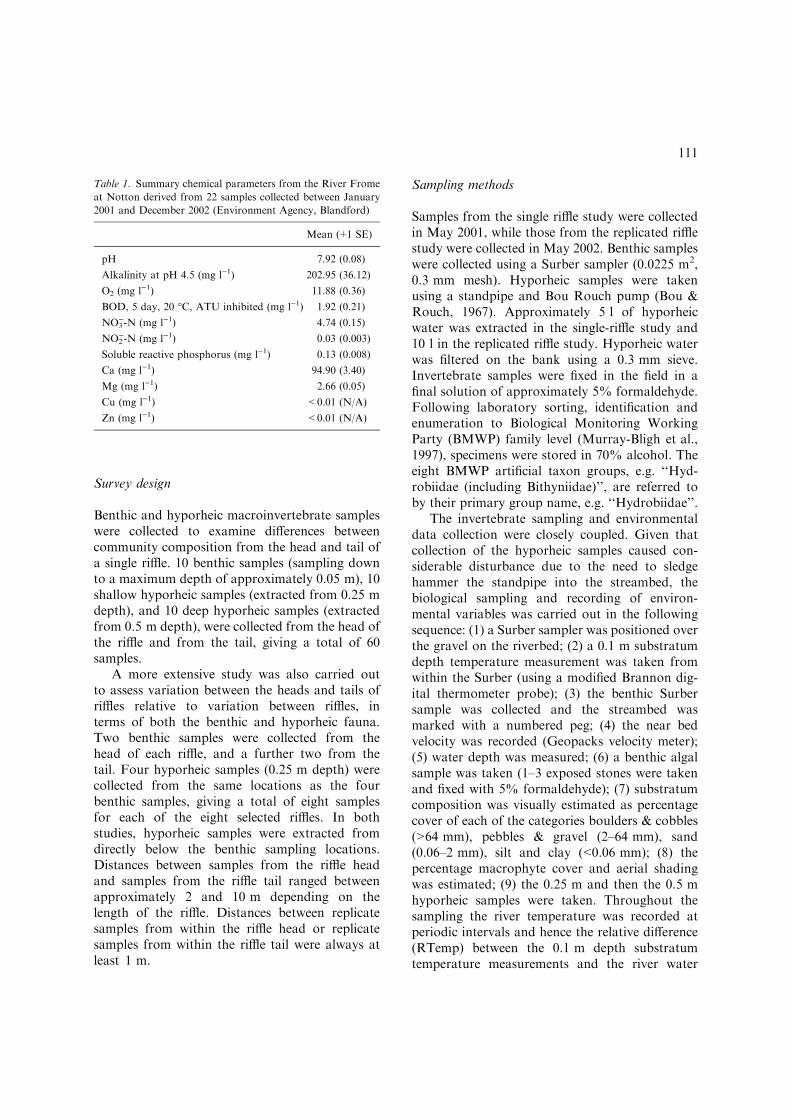
Table 1. Summary chemical parameters from the River Frome
at Notton derived from 22 samples collected between January
2001 and December 2002 (Environment Agency, Blandford)
Mean (+1 SE)
pH 7.92 (0.08)
Alkalinity at pH 4.5 (mg l)1) 202.95 (36.12)
O2 (mg l)1) 11.88 (0.36)
BOD, 5 day, 20 �C, ATU inhibited (mg l)1) 1.92 (0.21)
NO3)-N (mg l)1) 4.74 (0.15)
NO2)-N (mg l)1) 0.03 (0.003)
Soluble reactive phosphorus (mg l)1) 0.13 (0.008)
Ca (mg l)1) 94.90 (3.40)
Mg (mg l)1) 2.66 (0.05)
Cu (mg l)1) <0.01 (N/A)
Zn (mg l)1) <0.01 (N/A)
111

temperature could be calculated. Stones gatheredfor benthic algal comparison were returned to thelaboratory and the percentage of algal cover wasestimated.
Statistical analysis
In the single riffle study, mean differences in thetotal numbers of individuals and families, indi-vidual family abundances, and environmentalmeasurements between the head and tail sampleswere assessed using Student t tests (allowing forany unequal variances). All of the significance testson abundance data (both the Student t test in thesingle riffle study, and the subsequent ANOVA inthe replicated riffle study) were based on double-square root transformed data. This transformationwas found to be the best single transformation(out of x, �x, ��x and log(x+1)) for reducing bothskewness (based on Kolmogorov–Smirnov nor-mality tests) and inequalities in variance betweenthe head and tail sample groups. Similar assess-ments of skewness and inequalities in variance inthe family richness and environmental data indi-cated that no transformation of these variableswas required prior to significance testing.
Inter-sample differences in macroinvertebratecommunity structure were determined using Bray–Curtis (B-C) similarity coefficients between allpairs of samples following double square roottransformation of the raw abundances. Thistransformation is similar to the log(x+1) trans-formation (in that it achieves a comparablereduction in the over-dominance of very abundantfamilies in the community assessment) but iteliminates the need to add a constant to zero val-ues (Bray & Curtis, 1957; Clarke & Gorley, 2001).Overall variation in macroinvertebrate communitystructure was represented using the first twoordination axes of non-metric multi-dimensionalscaling (MDS) based on the B-C similarity coeffi-cients, with lack of fit measured by the STRESScoefficient (Clarke & Gorley, 2001). Several sam-ples in both the single and replicated riffle study,especially those from the deep hyporheic zone, hadno macroinvertebrate families and were thereforeexcluded from the community analyses. One-wayANOSIM (analysis of similarity) randomisationtests based on the B-C similarity coefficients wereused to test for differences in community structure
between the head and tail sample groups. The teststatistic, R is given by:
R ¼ 4ð�rB � �rWÞnðn� 1Þ
where �rW is defined as the average of all ranksimilarities between samples within a group, �rB isthe average of all rank similarities between samplesfrom different groups, the highest similarity corre-sponds to a rank of 1 and n is the total number ofsamples. R=0 indicates that similarities betweenand within groups are on average the same, whilethe maximum possible value of R=1 indicates thatall samples within a groupweremore similar to eachother than any two samples from different groups.All MDS and ANOSIM analysis was carried outusing PRIMER statistical software (Clarke &Gorley, 2001). Relationships between benthicfamily abundances and the environmental variableswere examined using Spearman rank correlation.
In the replicated riffle study, two-way ANOVAwas used to identify significant differences inabundance of the total number of individuals,common families, family richness, and environ-mental measurements, between head/tail positionswithin riffles, between riffles and in terms of theposition–riffle interaction. Riffles were treated as arandom factor, so that overall head-tail differenceswere correctly tested against their interaction withriffles (i.e. the extent to which head-tail differencesvaried between riffles). Abundance data was dou-ble-square root transformed prior to significancetesting while family richness was not transformed.Variation in macroinvertebrate community struc-ture was assessed, as before, using non-metricMDS based on the B-C similarity coefficients.Two-way crossed ANOSIM randomisation testsbased on the B-C similarity coefficients were usedto test for differences in community structurebetween the head and tail sample groups (allowingfor riffle differences) and for differences betweenriffles (allowing for head–tail differences).
Results
Single riffle study
In the single riffle study, there were significantlymore benthic individuals (Fig. 1a) and families
112
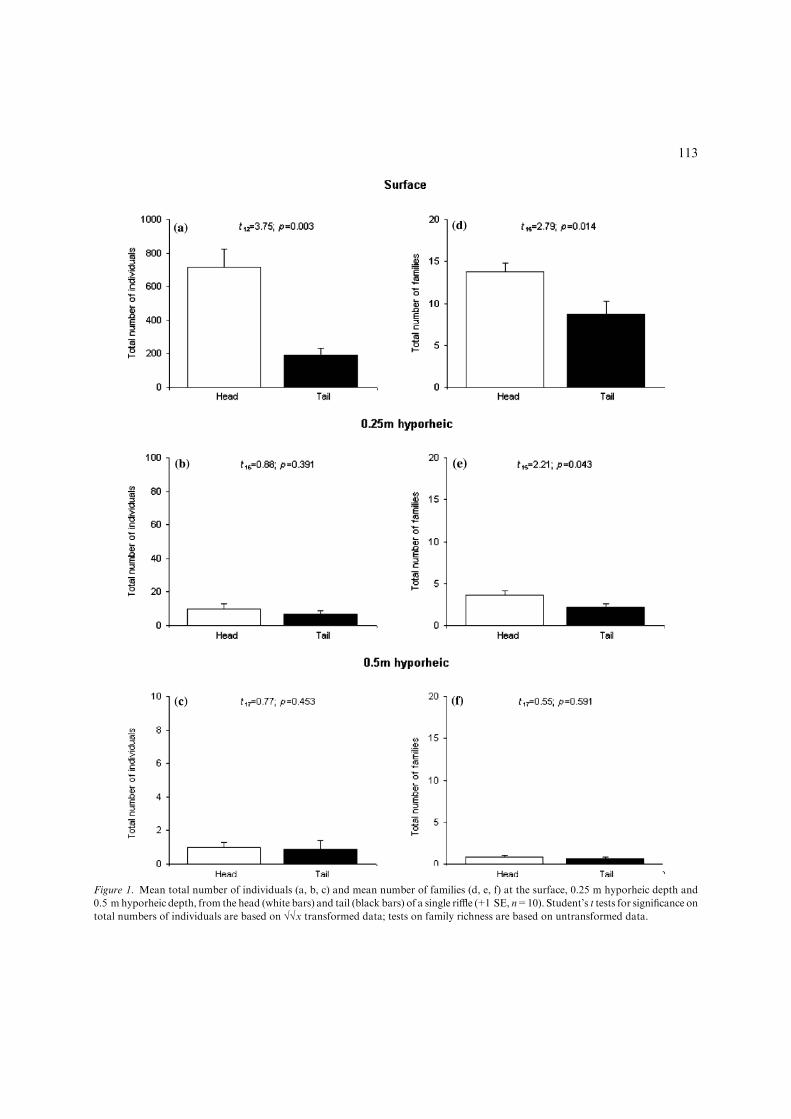
Figure 1. Mean total number of individuals (a, b, c) and mean number of families (d, e, f) at the surface, 0.25 m hyporheic depth and
0.5 m hyporheic depth, from the head (white bars) and tail (black bars) of a single riffle (+1 SE, n=10). Student’s t tests for significance on
total numbers of individuals are based on ��x transformed data; tests on family richness are based on untransformed data.
113
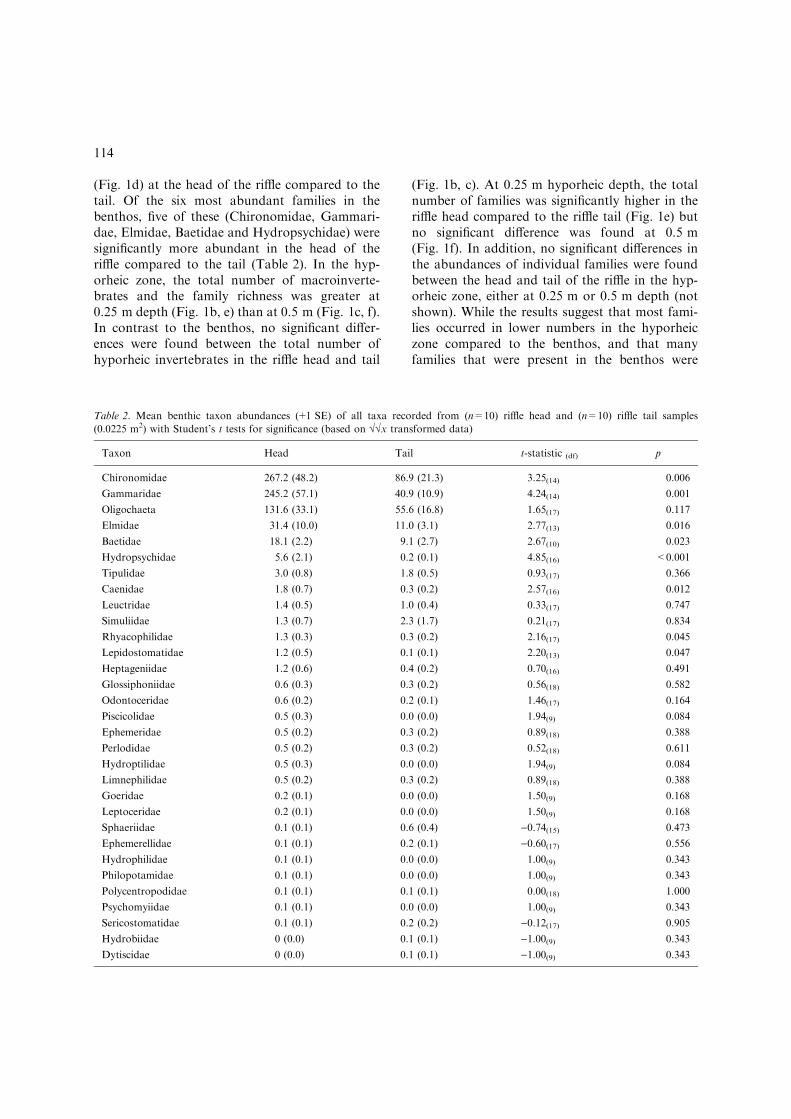
(Fig. 1d) at the head of the riffle compared to thetail. Of the six most abundant families in thebenthos, five of these (Chironomidae, Gammari-dae, Elmidae, Baetidae and Hydropsychidae) weresignificantly more abundant in the head of theriffle compared to the tail (Table 2). In the hyp-orheic zone, the total number of macroinverte-brates and the family richness was greater at0.25 m depth (Fig. 1b, e) than at 0.5 m (Fig. 1c, f).In contrast to the benthos, no significant differ-ences were found between the total number ofhyporheic invertebrates in the riffle head and tail
(Fig. 1b, c). At 0.25 m hyporheic depth, the totalnumber of families was significantly higher in theriffle head compared to the riffle tail (Fig. 1e) butno significant difference was found at 0.5 m(Fig. 1f). In addition, no significant differences inthe abundances of individual families were foundbetween the head and tail of the riffle in the hyp-orheic zone, either at 0.25 m or 0.5 m depth (notshown). While the results suggest that most fami-lies occurred in lower numbers in the hyporheiczone compared to the benthos, and that manyfamilies that were present in the benthos were
Table 2. Mean benthic taxon abundances (+1 SE) of all taxa recorded from (n=10) riffle head and (n=10) riffle tail samples
(0.0225 m2) with Student’s t tests for significance (based on ��x transformed data)
Taxon Head Tail t-statistic (df) p
Chironomidae 267.2 (48.2) 86.9 (21.3) 3.25(14) 0.006
Gammaridae 245.2 (57.1) 40.9 (10.9) 4.24(14) 0.001
Oligochaeta 131.6 (33.1) 55.6 (16.8) 1.65(17) 0.117
Elmidae 31.4 (10.0) 11.0 (3.1) 2.77(13) 0.016
Baetidae 18.1 (2.2) 9.1 (2.7) 2.67(10) 0.023
Hydropsychidae 5.6 (2.1) 0.2 (0.1) 4.85(16) <0.001
Tipulidae 3.0 (0.8) 1.8 (0.5) 0.93(17) 0.366
Caenidae 1.8 (0.7) 0.3 (0.2) 2.57(16) 0.012
Leuctridae 1.4 (0.5) 1.0 (0.4) 0.33(17) 0.747
Simuliidae 1.3 (0.7) 2.3 (1.7) 0.21(17) 0.834
Rhyacophilidae 1.3 (0.3) 0.3 (0.2) 2.16(17) 0.045
Lepidostomatidae 1.2 (0.5) 0.1 (0.1) 2.20(13) 0.047
Heptageniidae 1.2 (0.6) 0.4 (0.2) 0.70(16) 0.491
Glossiphoniidae 0.6 (0.3) 0.3 (0.2) 0.56(18) 0.582
Odontoceridae 0.6 (0.2) 0.2 (0.1) 1.46(17) 0.164
Piscicolidae 0.5 (0.3) 0.0 (0.0) 1.94(9) 0.084
Ephemeridae 0.5 (0.2) 0.3 (0.2) 0.89(18) 0.388
Perlodidae 0.5 (0.2) 0.3 (0.2) 0.52(18) 0.611
Hydroptilidae 0.5 (0.3) 0.0 (0.0) 1.94(9) 0.084
Limnephilidae 0.5 (0.2) 0.3 (0.2) 0.89(18) 0.388
Goeridae 0.2 (0.1) 0.0 (0.0) 1.50(9) 0.168
Leptoceridae 0.2 (0.1) 0.0 (0.0) 1.50(9) 0.168
Sphaeriidae 0.1 (0.1) 0.6 (0.4) )0.74(15) 0.473
Ephemerellidae 0.1 (0.1) 0.2 (0.1) )0.60(17) 0.556
Hydrophilidae 0.1 (0.1) 0.0 (0.0) 1.00(9) 0.343
Philopotamidae 0.1 (0.1) 0.0 (0.0) 1.00(9) 0.343
Polycentropodidae 0.1 (0.1) 0.1 (0.1) 0.00(18) 1.000
Psychomyiidae 0.1 (0.1) 0.0 (0.0) 1.00(9) 0.343
Sericostomatidae 0.1 (0.1) 0.2 (0.2) )0.12(17) 0.905
Hydrobiidae 0 (0.0) 0.1 (0.1) )1.00(9) 0.343
Dytiscidae 0 (0.0) 0.1 (0.1) )1.00(9) 0.343
114

absent from the hyporheic, it should be noted thatdirect quantitative comparisons between the ben-thic and hyporheic samples is not possible becausedifferent sampling methods were used.
At the community level, benthic samples fromthe riffle head and tail were almost completelydistinct, with only a small amount of overlap(Fig. 2a). The distinction between samples fromthe shallow hyporheic (Fig. 2b) was less clear,whilst at 0.5 m depth (Fig. 2c), the impoverishedsamples showed a higher degree of overlap.ANOSIM analysis shows that the communitystructure of the head and tail samples was signifi-cantly different at the surface (Fig. 2a) but not inthe hyporheic (Fig. 2b, c). These results show thatdifferences in macroinvertebrate community com-position between the riffle head and tail wereapparent in the benthos but became progressivelyless apparent with increasing hyporheic depth.
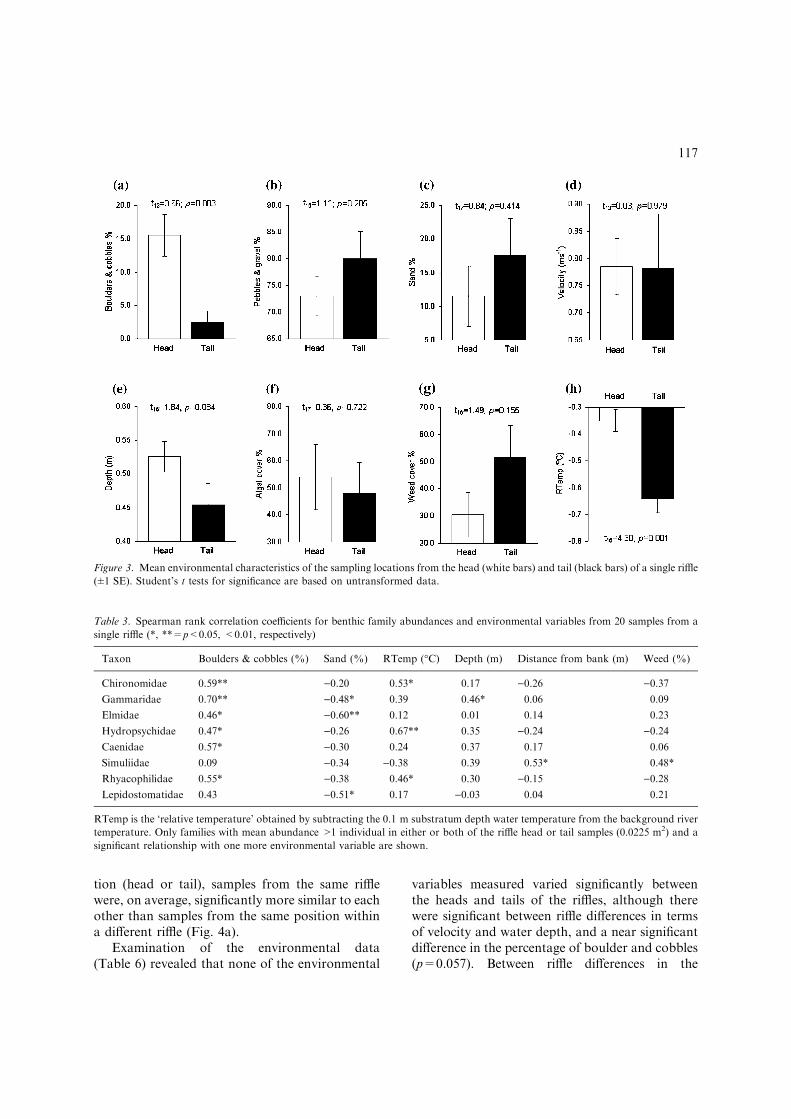
Samples from the head of the riffle had a sig-nificantly higher proportion of boulders and cob-bles (Fig. 3a) suggesting greater interstitial porespace compared to the tail. Samples from the rifflehead also had significantly higher water tempera-tures (Fig. 3h). Each of the 0.1 m substratumdepth water temperatures were subtracted fromthe river water temperature to give the tempera-ture relative to the surface (RTemp) prior to test-ing for significance. The mean RTemp of )0.35 �Cat 0.1 m substratum depth at the head of the riffleshow that the interstitial environment was ther-mally more similar to the main river flowcompared to the tail where the interstitial envi-ronment was cooler (mean RTemp=)0.65 �C),and therefore less hydraulically connected to thesurface water.
Significant positive correlations were foundbetween the abundances of six of the benthic taxa(Chironomidae, Gammaridae, Elmidae, Hydro-psychidae, Caenidae and Rhyacophilidae) and thepercentage of boulders and cobbles across all 20samples (Table 3), while the abundances of Gam-maridae, Elmidae and Lepidostomatidae had sig-nificant negative correlations with the percentageof sand. Chironomidae, Hydropsychidae andRhyacophilidae also had significant positive cor-relations with RTemp. Distances from the bank,percentage weed cover and water depth were lessimportant, only being significantly correlated withthe abundances of one taxon each.
Replicated riffle study
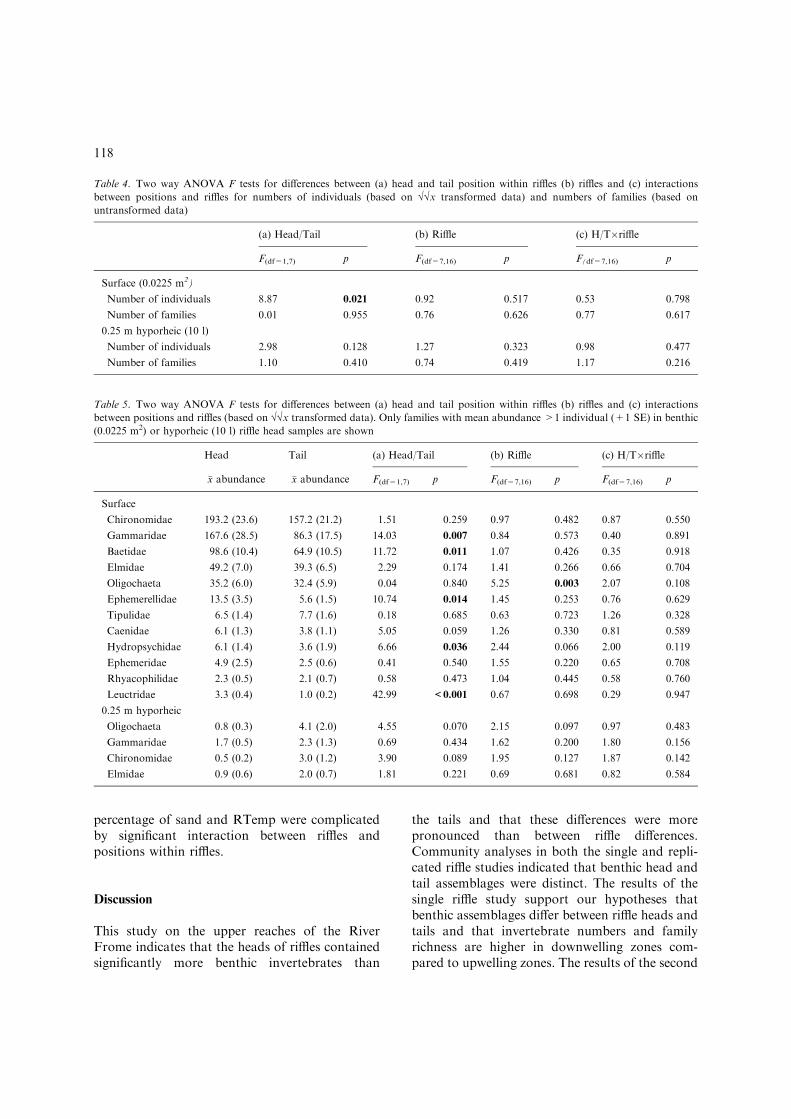
The replicated riffle study (incorporating eightriffles) was carried out to test the generality of ourhypotheses that benthic and hyporheic macroin-vertebrate numbers and family richness would begreater in riffle heads (downwelling zones) com-pared to tails (upwelling zones). Based on the two-way ANOVA, the total number of individuals atthe surface was significantly higher at the heads ofriffles (�x=594 per 0.0225 m2) compared to thetails (�x=417 per 0.0255 m2) and did not differsignificantly between riffles (Table 4). However,unlike the single riffle study, benthic family rich-ness did not differ significantly different betweenheads (�x=16.4; range 12–20 per 0.0225 m2) andtails (�x=16.8; range 9–24 per 0.0225 m2).
As in the single riffle study, Gammaridae(the second most numerically dominant family inthe benthos) was significantly more abundant inthe riffle heads compared to the tails (Table 5),as were Baetidae, Ephemerellidae, Hydropsychi-dae and Leuctridae. In contrast, Chironomidae,Elmidae, Caenidae and Rhyacophilidae, whichwere significantly more abundant in the rifflehead in the single riffle study, did not differsignificantly in abundance between the heads andtails in the replicated riffle study. Only Oligo-chaeta varied in abundance significantly betweenriffles. In the hyporheic zone, no significantfaunal differences were observed between riffleheads and tails or between riffles with respectto the total number of individuals or familyrichness (Table 4), or individual families(Table 5).
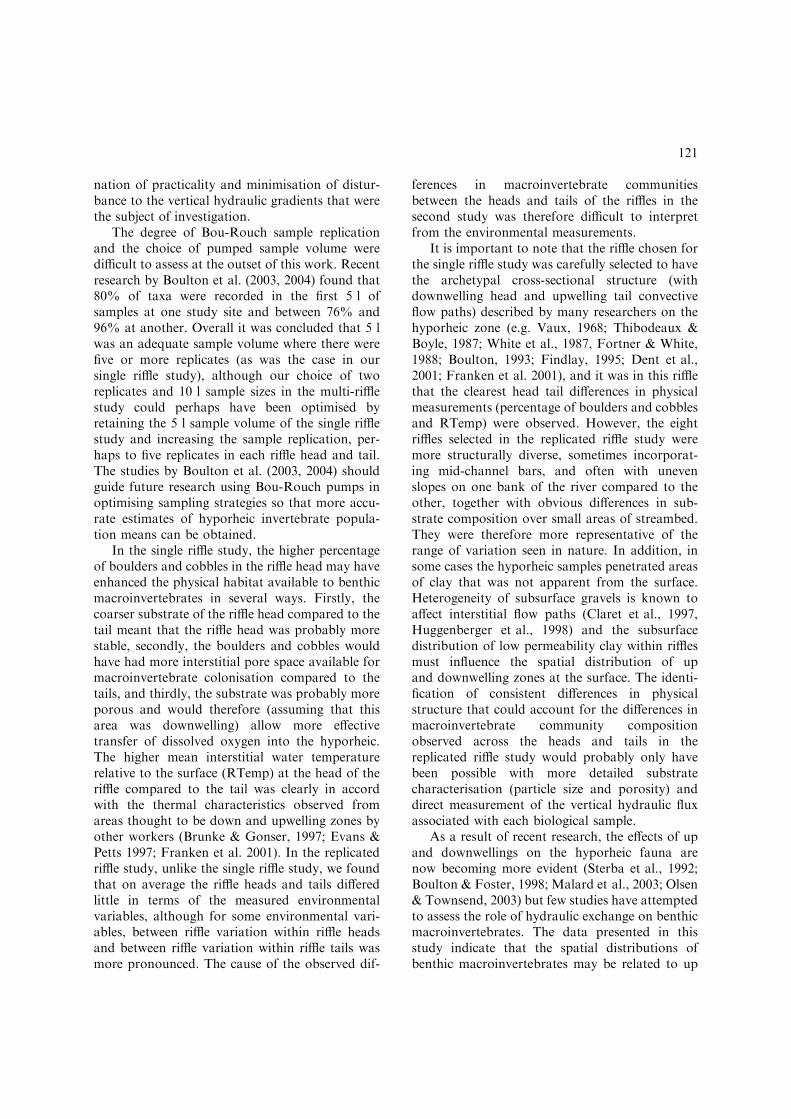
Community analysis of the replicated rifflestudy showed that benthic samples from the rifflehead formed a distinct group in ordination spacewhile the composition of the riffle tail invertebratecommunities was more variable (Fig 4a). At0.25 m hyporheic depth, the distinction betweenriffle head and tail samples was less clear (Fig. 4b)so that a transition from distinct community typesat the surface to less clearly differentiated com-munity types in the hyporheic zone is apparent.ANOSIM analysis confirms that the communitystructure of the head and tail samples was signifi-cantly different at the surface (Fig. 4a) but not inthe hyporheic (Fig. 4b). In addition, at the surface,the ANOSIM analysis showed that within a posi-
( ) g
115
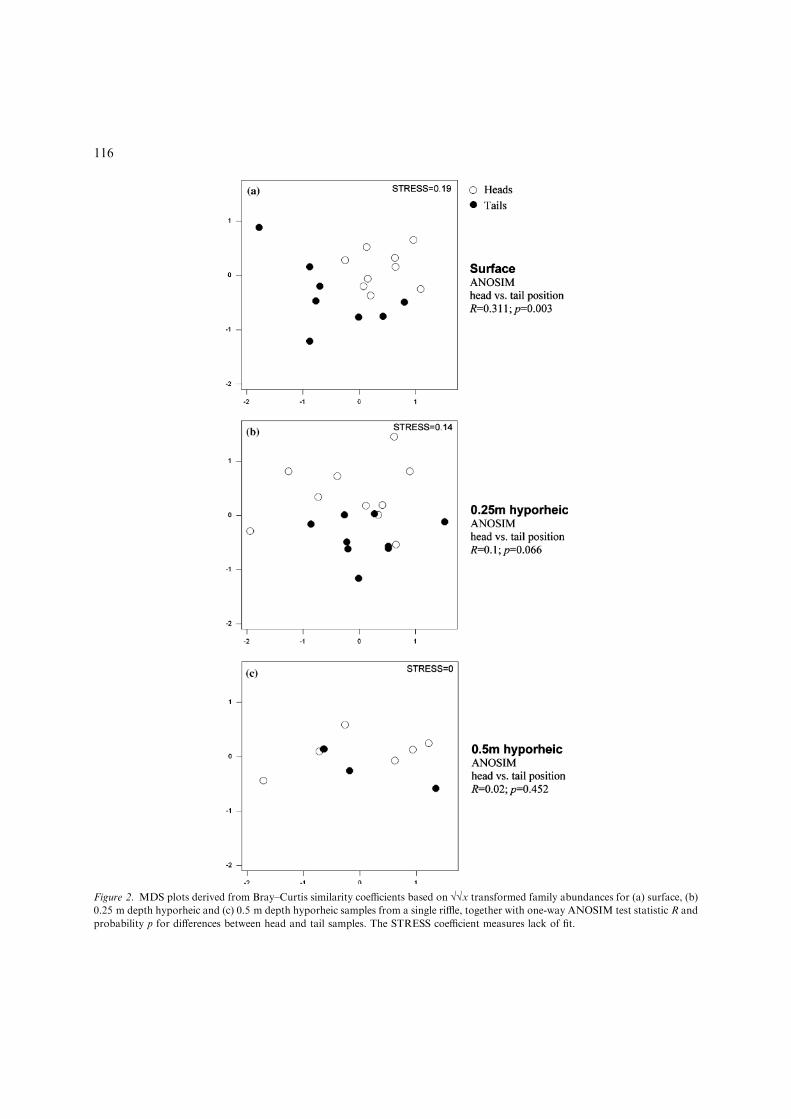
Figure 2. MDS plots derived from Bray–Curtis similarity coefficients based on ��x transformed family abundances for (a) surface, (b)
0.25 m depth hyporheic and (c) 0.5 m depth hyporheic samples from a single riffle, together with one-way ANOSIM test statistic R and
probability p for differences between head and tail samples. The STRESS coefficient measures lack of fit.
116
tion (head or tail), samples from the same rifflewere, on average, significantly more similar to eachother than samples from the same position withina different riffle (Fig. 4a).
Examination of the environmental data(Table 6) revealed that none of the environmental
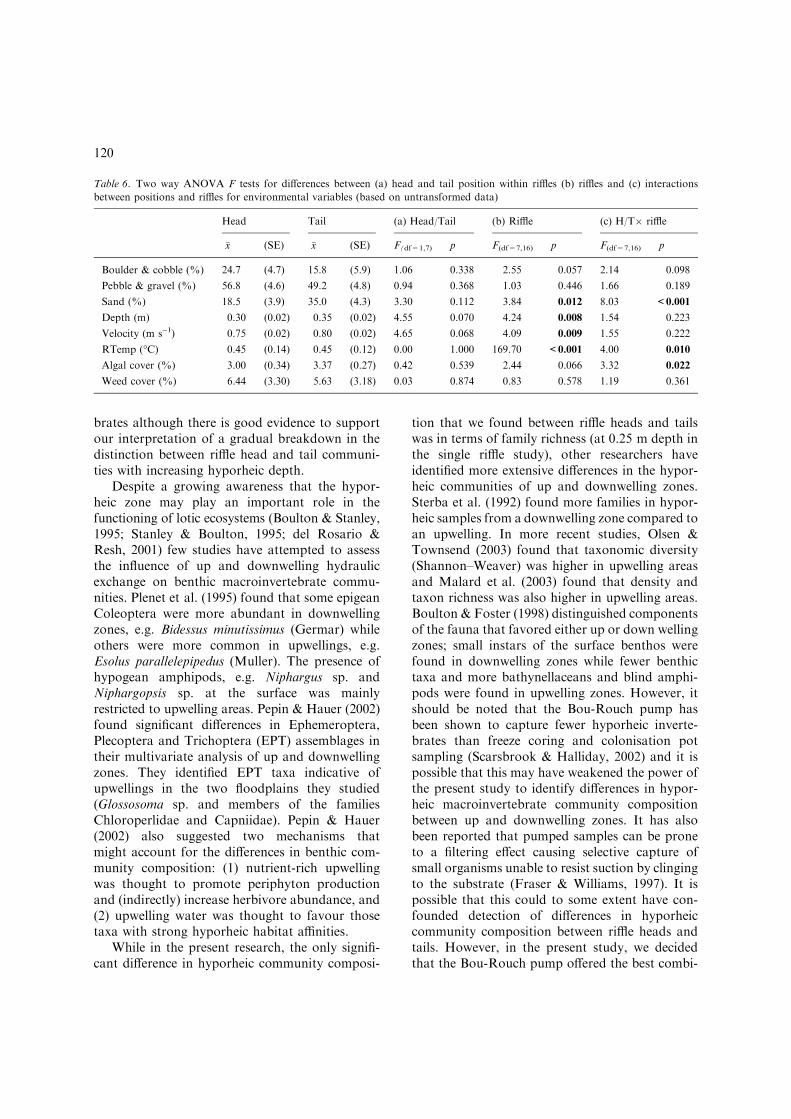
variables measured varied significantly betweenthe heads and tails of the riffles, although therewere significant between riffle differences in termsof velocity and water depth, and a near significantdifference in the percentage of boulder and cobbles(p=0.057). Between riffle differences in the
Figure 3. Mean environmental characteristics of the sampling locations from the head (white bars) and tail (black bars) of a single riffle
(±1 SE). Student’s t tests for significance are based on untransformed data.
Table 3. Spearman rank correlation coefficients for benthic family abundances and environmental variables from 20 samples from a
single riffle (*, **=p<0.05, <0.01, respectively)
Taxon Boulders & cobbles (%) Sand (%) RTemp (�C) Depth (m) Distance from bank (m) Weed (%)
Chironomidae 0.59** )0.20 0.53* 0.17 )0.26 )0.37
Gammaridae 0.70** )0.48* 0.39 0.46* 0.06 0.09
Elmidae 0.46* )0.60** 0.12 0.01 0.14 0.23
Hydropsychidae 0.47* )0.26 0.67** 0.35 )0.24 )0.24
Caenidae 0.57* )0.30 0.24 0.37 0.17 0.06
Simuliidae 0.09 )0.34 )0.38 0.39 0.53* 0.48*
Rhyacophilidae 0.55* )0.38 0.46* 0.30 )0.15 )0.28
Lepidostomatidae 0.43 )0.51* 0.17 )0.03 0.04 0.21
RTemp is the ‘relative temperature’ obtained by subtracting the 0.1 m substratum depth water temperature from the background river
temperature. Only families with mean abundance >1 individual in either or both of the riffle head or tail samples (0.0225 m2) and a
significant relationship with one more environmental variable are shown.
117
percentage of sand and RTemp were complicatedby significant interaction between riffles andpositions within riffles.
Discussion
This study on the upper reaches of the RiverFrome indicates that the heads of riffles containedsignificantly more benthic invertebrates than
the tails and that these differences were morepronounced than between riffle differences.Community analyses in both the single and repli-cated riffle studies indicated that benthic head andtail assemblages were distinct. The results of thesingle riffle study support our hypotheses thatbenthic assemblages differ between riffle heads andtails and that invertebrate numbers and familyrichness are higher in downwelling zones com-pared to upwelling zones. The results of the second
Table 4. Two way ANOVA F tests for differences between (a) head and tail position within riffles (b) riffles and (c) interactions
between positions and riffles for numbers of individuals (based on ��x transformed data) and numbers of families (based on
untransformed data)
(a) Head/Tail (b) Riffle (c) H/T�riffle
F(df=1,7) p F(df=7,16) p F(df=7,16) p
Surface (0.0225 m2)
Number of individuals 8.87 0.021 0.92 0.517 0.53 0.798
Number of families 0.01 0.955 0.76 0.626 0.77 0.617
0.25 m hyporheic (10 l)
Number of individuals 2.98 0.128 1.27 0.323 0.98 0.477
Number of families 1.10 0.410 0.74 0.419 1.17 0.216
Table 5. Two way ANOVA F tests for differences between (a) head and tail position within riffles (b) riffles and (c) interactions
between positions and riffles (based on ��x transformed data). Only families with mean abundance >1 individual (+1 SE) in benthic
(0.0225 m2) or hyporheic (10 l) riffle head samples are shown
Head Tail (a) Head/Tail (b) Riffle (c) H/T�riffle
�x abundance �x abundance F(df=1,7) p F(df=7,16) p F(df=7,16) p
Surface
Chironomidae 193.2 (23.6) 157.2 (21.2) 1.51 0.259 0.97 0.482 0.87 0.550
Gammaridae 167.6 (28.5) 86.3 (17.5) 14.03 0.007 0.84 0.573 0.40 0.891
Baetidae 98.6 (10.4) 64.9 (10.5) 11.72 0.011 1.07 0.426 0.35 0.918
Elmidae 49.2 (7.0) 39.3 (6.5) 2.29 0.174 1.41 0.266 0.66 0.704
Oligochaeta 35.2 (6.0) 32.4 (5.9) 0.04 0.840 5.25 0.003 2.07 0.108
Ephemerellidae 13.5 (3.5) 5.6 (1.5) 10.74 0.014 1.45 0.253 0.76 0.629
Tipulidae 6.5 (1.4) 7.7 (1.6) 0.18 0.685 0.63 0.723 1.26 0.328
Caenidae 6.1 (1.3) 3.8 (1.1) 5.05 0.059 1.26 0.330 0.81 0.589
Hydropsychidae 6.1 (1.4) 3.6 (1.9) 6.66 0.036 2.44 0.066 2.00 0.119
Ephemeridae 4.9 (2.5) 2.5 (0.6) 0.41 0.540 1.55 0.220 0.65 0.708
Rhyacophilidae 2.3 (0.5) 2.1 (0.7) 0.58 0.473 1.04 0.445 0.58 0.760
Leuctridae 3.3 (0.4) 1.0 (0.2) 42.99 <0.001 0.67 0.698 0.29 0.947
0.25 m hyporheic
Oligochaeta 0.8 (0.3) 4.1 (2.0) 4.55 0.070 2.15 0.097 0.97 0.483
Gammaridae 1.7 (0.5) 2.3 (1.3) 0.69 0.434 1.62 0.200 1.80 0.156
Chironomidae 0.5 (0.2) 3.0 (1.2) 3.90 0.089 1.95 0.127 1.87 0.142
Elmidae 0.9 (0.6) 2.0 (0.7) 1.81 0.221 0.69 0.681 0.82 0.584
118

study, incorporating eight riffles, also allow us to(tentatively) extend support for the generality ofour hypotheses for benthic riffle communities and
total numbers of benthic individuals in the upperreaches of the River Frome. The same hypothesescannot be supported for hyporheic macroinverte-
Figure 4. MDS plots derived from Bray–Curtis similarity coefficients based on ��x transformed family abundances for (a) surface and
(b) 0.25 m depth hyporheic samples from eight numbered riffles, together with two-way crossed ANOSIM test statistic R and
probability p for differences between head and tail samples and between riffles (within a position). The STRESS coefficient measures
lack of fit.
119
brates although there is good evidence to supportour interpretation of a gradual breakdown in thedistinction between riffle head and tail communi-ties with increasing hyporheic depth.
Despite a growing awareness that the hypor-heic zone may play an important role in thefunctioning of lotic ecosystems (Boulton & Stanley,1995; Stanley & Boulton, 1995; del Rosario &Resh, 2001) few studies have attempted to assessthe influence of up and downwelling hydraulicexchange on benthic macroinvertebrate commu-nities. Plenet et al. (1995) found that some epigeanColeoptera were more abundant in downwellingzones, e.g. Bidessus minutissimus (Germar) whileothers were more common in upwellings, e.g.Esolus parallelepipedus (Muller). The presence ofhypogean amphipods, e.g. Niphargus sp. andNiphargopsis sp. at the surface was mainlyrestricted to upwelling areas. Pepin & Hauer (2002)found significant differences in Ephemeroptera,Plecoptera and Trichoptera (EPT) assemblages intheir multivariate analysis of up and downwellingzones. They identified EPT taxa indicative ofupwellings in the two floodplains they studied(Glossosoma sp. and members of the familiesChloroperlidae and Capniidae). Pepin & Hauer(2002) also suggested two mechanisms thatmight account for the differences in benthic com-munity composition: (1) nutrient-rich upwellingwas thought to promote periphyton productionand (indirectly) increase herbivore abundance, and(2) upwelling water was thought to favour thosetaxa with strong hyporheic habitat affinities.
While in the present research, the only signifi-cant difference in hyporheic community composi-
tion that we found between riffle heads and tailswas in terms of family richness (at 0.25 m depth inthe single riffle study), other researchers haveidentified more extensive differences in the hypor-heic communities of up and downwelling zones.Sterba et al. (1992) found more families in hypor-heic samples from a downwelling zone compared toan upwelling. In more recent studies, Olsen &Townsend (2003) found that taxonomic diversity(Shannon–Weaver) was higher in upwelling areasand Malard et al. (2003) found that density andtaxon richness was also higher in upwelling areas.Boulton & Foster (1998) distinguished componentsof the fauna that favored either up or down wellingzones; small instars of the surface benthos werefound in downwelling zones while fewer benthictaxa and more bathynellaceans and blind amphi-pods were found in upwelling zones. However, itshould be noted that the Bou-Rouch pump hasbeen shown to capture fewer hyporheic inverte-brates than freeze coring and colonisation potsampling (Scarsbrook & Halliday, 2002) and it ispossible that this may have weakened the power ofthe present study to identify differences in hypor-heic macroinvertebrate community compositionbetween up and downwelling zones. It has alsobeen reported that pumped samples can be proneto a filtering effect causing selective capture ofsmall organisms unable to resist suction by clingingto the substrate (Fraser & Williams, 1997). It ispossible that this could to some extent have con-founded detection of differences in hyporheiccommunity composition between riffle heads andtails. However, in the present study, we decidedthat the Bou-Rouch pump offered the best combi-
Table 6. Two way ANOVA F tests for differences between (a) head and tail position within riffles (b) riffles and (c) interactions
between positions and riffles for environmental variables (based on untransformed data)
Head Tail (a) Head/Tail (b) Riffle (c) H/T� riffle
�x (SE) �x (SE) F(df=1,7) p F(df=7,16) p F(df=7,16) p
Boulder & cobble (%) 24.7 (4.7) 15.8 (5.9) 1.06 0.338 2.55 0.057 2.14 0.098
Pebble & gravel (%) 56.8 (4.6) 49.2 (4.8) 0.94 0.368 1.03 0.446 1.66 0.189
Sand (%) 18.5 (3.9) 35.0 (4.3) 3.30 0.112 3.84 0.012 8.03 <0.001
Depth (m) 0.30 (0.02) 0.35 (0.02) 4.55 0.070 4.24 0.008 1.54 0.223
Velocity (m s)1) 0.75 (0.02) 0.80 (0.02) 4.65 0.068 4.09 0.009 1.55 0.222
RTemp (�C) 0.45 (0.14) 0.45 (0.12) 0.00 1.000 169.70 <0.001 4.00 0.010
Algal cover (%) 3.00 (0.34) 3.37 (0.27) 0.42 0.539 2.44 0.066 3.32 0.022
Weed cover (%) 6.44 (3.30) 5.63 (3.18) 0.03 0.874 0.83 0.578 1.19 0.361
120
nation of practicality and minimisation of distur-bance to the vertical hydraulic gradients that werethe subject of investigation.
The degree of Bou-Rouch sample replicationand the choice of pumped sample volume weredifficult to assess at the outset of this work. Recentresearch by Boulton et al. (2003, 2004) found that80% of taxa were recorded in the first 5 l ofsamples at one study site and between 76% and96% at another. Overall it was concluded that 5 lwas an adequate sample volume where there werefive or more replicates (as was the case in oursingle riffle study), although our choice of tworeplicates and 10 l sample sizes in the multi-rifflestudy could perhaps have been optimised byretaining the 5 l sample volume of the single rifflestudy and increasing the sample replication, per-haps to five replicates in each riffle head and tail.The studies by Boulton et al. (2003, 2004) shouldguide future research using Bou-Rouch pumps inoptimising sampling strategies so that more accu-rate estimates of hyporheic invertebrate popula-tion means can be obtained.
In the single riffle study, the higher percentageof boulders and cobbles in the riffle head may haveenhanced the physical habitat available to benthicmacroinvertebrates in several ways. Firstly, thecoarser substrate of the riffle head compared to thetail meant that the riffle head was probably morestable, secondly, the boulders and cobbles wouldhave had more interstitial pore space available formacroinvertebrate colonisation compared to thetails, and thirdly, the substrate was probably moreporous and would therefore (assuming that thisarea was downwelling) allow more effectivetransfer of dissolved oxygen into the hyporheic.The higher mean interstitial water temperaturerelative to the surface (RTemp) at the head of theriffle compared to the tail was clearly in accordwith the thermal characteristics observed fromareas thought to be down and upwelling zones byother workers (Brunke & Gonser, 1997; Evans &Petts 1997; Franken et al. 2001). In the replicatedriffle study, unlike the single riffle study, we foundthat on average the riffle heads and tails differedlittle in terms of the measured environmentalvariables, although for some environmental vari-ables, between riffle variation within riffle headsand between riffle variation within riffle tails wasmore pronounced. The cause of the observed dif-
ferences in macroinvertebrate communitiesbetween the heads and tails of the riffles in thesecond study was therefore difficult to interpretfrom the environmental measurements.
It is important to note that the riffle chosen forthe single riffle study was carefully selected to havethe archetypal cross-sectional structure (withdownwelling head and upwelling tail convectiveflow paths) described by many researchers on thehyporheic zone (e.g. Vaux, 1968; Thibodeaux &Boyle, 1987; White et al., 1987, Fortner & White,1988; Boulton, 1993; Findlay, 1995; Dent et al.,2001; Franken et al. 2001), and it was in this rifflethat the clearest head tail differences in physicalmeasurements (percentage of boulders and cobblesand RTemp) were observed. However, the eightriffles selected in the replicated riffle study weremore structurally diverse, sometimes incorporat-ing mid-channel bars, and often with unevenslopes on one bank of the river compared to theother, together with obvious differences in sub-strate composition over small areas of streambed.They were therefore more representative of therange of variation seen in nature. In addition, insome cases the hyporheic samples penetrated areasof clay that was not apparent from the surface.Heterogeneity of subsurface gravels is known toaffect interstitial flow paths (Claret et al., 1997,Huggenberger et al., 1998) and the subsurfacedistribution of low permeability clay within rifflesmust influence the spatial distribution of upand downwelling zones at the surface. The identi-fication of consistent differences in physicalstructure that could account for the differences inmacroinvertebrate community compositionobserved across the heads and tails in thereplicated riffle study would probably only havebeen possible with more detailed substratecharacterisation (particle size and porosity) anddirect measurement of the vertical hydraulic fluxassociated with each biological sample.
As a result of recent research, the effects of upand downwellings on the hyporheic fauna arenow becoming more evident (Sterba et al., 1992;Boulton & Foster, 1998; Malard et al., 2003; Olsen& Townsend, 2003) but few studies have attemptedto assess the role of hydraulic exchange on benthicmacroinvertebrates. The data presented in thisstudy indicate that the spatial distributions ofbenthic macroinvertebrates may be related to up
121
and downwelling zones. However, the role of upand downwelling hydraulic exchange is difficult todistinguish from the effects of other environmentalvariables because natural up and downwellingzones are often found at the heads and tails ofriffles, which are themselves physically heteroge-neous. To fully assess the significance of up anddownwelling exchange on the benthic fauna inrelation to physical factors such as substrate,velocity and depth, experiments involving manip-ulation of up and downwelling flow may be re-quired, as suggested by Palmer (1993) and Olsen &Townsend (2003).
Acknowledgements
The authors are grateful to John Blackburn andRick Gunn (Centre for Ecology and Hydrology)for their help with macroinvertebrate determina-tions, Maurice Lock (University of Wales,Bangor) and Eunice Pinn (Bournemouth Uni-versity) for statistical advice and student support,and the Environment Agency (Blandford) forproviding background water quality data from theRiver Frome. We would also like to thank JohnWright and John Murphy (Centre for Ecology andHydrology) and several anonymous reviewers forproviding valuable comments on the manuscript.
References
Beisel, J.-N., P. Usseglio-Polatera, S. Thomas & J.-C. More-
teau, 1998. Stream community structure in relation to spatial
variation: the influence of mesohabitat characteristics.
Hydrobiologia 389: 73–88.
Bencala, K. E., 1993. A perspective on stream catchment con-
nections. Journal of the North American Benthological
Society 12: 44–47.
Bou, C. & R. Rouch, 1967. Un nouveau champ de recherches
sur la faune aquatique souterainne. Comptes Rendus
Academie des Sciences Paris 265: 369–370.
Boulton, A. J., 1993. Stream ecology and surface–hyporheic
hydrologic exchange: implications, techniques and limita-
tions. Australian Journal of Marine and Freshwater
Research 44: 553–564.
Boulton, A. J., M.-J. Dole-Olivier & P. Marmonier, 2003.
Optimizing a sampling strategy for assessing hyporheic
invertebrate biodiversity using the Bou-Rouch method:
within-site replication and sample volume. Archiv fur
Hydrobiologie 156: 431–456.
Boulton, A. J., M.-J. Dole-Olivier & P. Marmonier, 2004.
Effects of sample volume and taxonomic resolution on
assessment of hyporheic assemblage composition sampled
using a Bou-Rouch pump. Archiv fur Hydrobiologie 159:
327–355.
Boulton, A. J. & J. G. Foster, 1998. Effects of buried
leaf litter and vertical hydrologic exchange on hyporheic
water chemistry and fauna in a gravel-bed river in
northern New South Wales, Australia. Freshwater Biology
40: 229–243.
Boulton, A. J. & E. H. Stanley, 1995. Hyporheic processes
during flooding and drying in a Sonoran Desert stream. II.
Faunal dynamics. Archiv fur Hydrobiologie 134: 27–52.
Bray, J. R. & J. T. Curtis, 1957. An ordination of the upland
forest communities of the southern Wisconsin. Ecological
Monographs 27: 325–349.
Brunke, M. & T. Gonser, 1997. The ecological significance of
exchange processes between rivers and groundwater. Fresh-
water Biology 37: 1–33.
Claret, C., P. Marmonier, J. M. Boissier, D. Fontvieille &
P. Blanc, 1997. Nutrient transfer between parafluvial
interstitial water and river water: influence of gravel bar
heterogeneity. Freshwater Biology 37: 657–670.
Clarke, K. R. & R. N. Gorley, 2001. PRIMER v5: User
Manual/Tutorial. PRIMER-E Ltd, Plymouth.
Coleman, R. L. & C. N. Dahm, 1990. Stream geomorphology:
effects on periphyton standing crop and primary production.
Journal of the North American Benthological Society 9:
293–302.
Dent, L. C., N. B. Grimm & S. G. Fisher, 2001. Multiscale
effects of surface–subsurface exchange on stream water
nutrient concentrations. Journal of the North American
Benthological Society 20: 162–181.
Dole-Olivier, M.-J. & P. Marmonier, 1992. Patch distribution
of interstitial communities: prevailing factors. Freshwater
Biology 27: 177–191.
Dunne, T. & L. B. Leopold, 1978. Water in Environmental
Planning. Freeman, San Francisco.
Evans, E. C. & G. E. Petts, 1997. Hyporheic temperature pat-
terns within riffles. Hydrological Sciences-Journal-des Sci-
ences Hydrologiques 42: 199–213.
Findlay, S., 1995. Importance of surface–subsurface exchange
in stream ecosystems: the hyporheic zone. Limnology and
Oceanography 40: 159–164.
Fortner, S. L. & D. S. White, 1988. Interstitial water patterns: a
factor influencing the distributions of some lotic aquatic
vascular macrophytes. Aquatic Botany 31: 1–12.
Franken, R. J. M., R. G. Storey & D. D. Williams, 2001.
Biological, chemical and physical characteristics of
down-welling and up-welling zones in the hyporheic zone of
a north-temperate stream. Hydrobiologia 444: 183–195.
Fraser, B. G. & D. D. Williams, 1997. Accuracy and precision
in sampling hyporheic fauna. Canadian Journal of Fisheries
and Aquatic Sciences 54: 1135–1141.
Grimm, N. B. & S. G. Fisher, 1984. Exchange between inter-
stitial and surface water: implications for stream metabolism
and nutrient cycling. Hydrobiologia 111: 219–228.
Grimm, N. B., H. M. Valett, E. H. Stanley & S. G. Fisher, 1991.
Contribution of the hyporheic zone to stability of an arid-
122
land stream. Verhandlungen des Internationalen Verein fur
Theoretische und Angewandte Limnologie 24: 1595–1599.
Hendricks, S. P., 1993. Microbial ecology of the hyporheic zone:
a perspective integrating hydrology and biology. Journal of
the North American Benthological Society 6: 85–91.
Hendricks, S. P., 1996. Bacterial biomass, activity and pro-
duction within the hyporheic zone of a north-temperate
stream. Archiv fur Hydrobiologie 136: 467–487.
Huggenberger, P., E. Hoehn, R. Beschta & W. Woessner, 1998.
Abiotic aspects of channels and floodplains in riparian
ecology. Freshwater Biology 40: 407–425.
Jones, J. B., S. G. Fisher & N. B. Grimm, 1995a. Vertical
hydrological exchange and ecosystem metabolism in a Son-
oran Desert Stream. Ecology 76: 942–952.
Jones, J. B., S. G. Fisher & N. B. Grimm, 1995b. Nitrification
in the hyporheic zone of a desert stream ecosystem. Journal
of the North American Benthological Society 14: 249–258.
Maddock, I. P., G. E. Petts, E. C. Evans & M. T. Greenwood,
1996. Assessing river–aquifer interactions within the hypor-
heic zone. In Brown, A. G. (ed.), Geomorphology and
Groundwater. John Wiley & Sons, Chichester: 53–74.
Malard, F., D. Ferreira, S. Doledec & J. V. Ward, 2003.
Influence of groundwater upwelling on the distribution of
the hyporheos in a headwater river flood plain. Archiv fur
Hydrobiologie 157: 89–116.
Murray-Bligh, J. A.D.,M. T. Furse, F. H. Jones, R. J.M.Gunn,
R. A.Dines & J. F.Wright, 1997. Procedure for collecting and
analysing macro-invertebrate samples for RIVPACS. Insti-
tute of Freshwater Ecology, & Environment Agency, UK.
Olsen, D. A. & C. R. Townsend, 2003. Hyporheic community
composition in a gravel-bed stream: the influence of vertical
hydrological exchange, sediment structure and physicohem-
istry. Freshwater Biology 48: 1363–1378.
Palmer, M. A., 1993. Experimentation in the hyporheic zone:
challenges and prospectus. Journal of the North American
Benthological Society 12: 84–93.
Pepin, D. M. & F. R. Hauer, 2002. Benthic responses to
groundwater–surface water exchange in 2 alluvial rivers in
northwestern Montana. Journal of the North American
Benthological Society 21: 370–383.
Plenet, S., J. Gibert & P. Marmonier, 1995. Biotic and abiotic
interactions between surface and interstitial systems in rivers.
Ecography 18: 296–309.
Quinn, J. M. & C. W. Hickey, 1994. Hydraulic parameters and
benthic invertebrate distributions in two gravel-bed New
Zealand rivers. Freshwater Biology 32: 489–500.
del Rosario, R. B. & V. H. Resh, 2001. Interstitial invertebrate
assemblages associated with small-scale subsurface flow-
paths in perennial and intermittent California streams.
Archiv fur Hydrobiologie 150: 629–640.
Savant, S. A., D. D. Reible & L. J. Thibodeaux, 1987. Con-
vective transport within stable river sediments. Water
Research 23: 1763–1768.
Scarsbrook, M. R. & J. Halliday, 2002. Detecting patterns in
hyporheic community structure: does sampling method alter
the story? New Zealand Journal of Marine and Freshwater
Research 36: 443–453.
Sear, D. A., P. D. Armitage & F. H. Dawson, 1999. Ground-
water dominated rivers. Hydrological Processes 13: 255–276.
Stanford, J. A. & J. V. Ward, 1988. The hyporheic habitat of
river ecosystems. Nature 355: 64–66.
Stanley, E. H. & A. J. Boulton, 1995. Hyporheic processes
during flooding and drying in a Sonoran Desert stream. I.
Hydrologic and chemical dynamics. Archiv fur Hydrobiol-
ogie 134: 1–26.
Strahler, A. N., 1964. Quantitative geomorphology of drainage
basins and channel networks. In Chow, V. T. (ed.), Hand-
book of Applied Hydrology. McGraw-Hill, New York:
4–39.
Sterba, O., V. Uvira, P. Mathur & M. Rulik, 1992. Variations
in the hyporheic zone through a riffle in the R. Morava,
Czechoslovakia. Regulated Rivers: Research and Manage-
ment 7: 31–43.
Thibodeaux, L. J. & J. D. Boyle, 1987. Bedform-generated
convective transport in bottom sediment. Nature 325:
341–343.
Triska, F. J., V. C. Kennedy, R. J. Avanzino, G. W. Zellweger
& K. E. Bencala, 1989. Retention and transport of nutrients
in a third-order stream in northwestern California: hypor-
heic processes. Ecology 70: 1893–1905.
Valett, H. M., 1993. Surface–hyporheic interactions in a
Sonoran Desert stream: hydrologic exchange and diel peri-
odicity. Hydrobiologia 259: 133–144.
Valett, H. M., S. G. Fisher, N. B. Grimm & P. Camill, 1994.
Vertical hydrological exchange and stability of a desert
stream ecosystem. Ecology 75: 548–560.
Valett, H. M., S. G. Fisher & E. H. Stanley, 1990. Physical and
chemical characteristics of the hyporheic zone of a Sonoran
Desert stream. Journal of the North American Benthological
Society 9: 201–215.
Vaux, W. G., 1968. Intragravel flow and interchange of water in
a streambed. Fishery Bulletin 66: 479–489.
White, D. S., C. H. Elzinga & S. P. Hendricks, 1987. Temper-
ature patterns within the hyporheic zone of a northern
Michigan river. Journal of the North American Bentholog-
ical Society 6: 85–91.
123