
The development of improvements to drivers' direct and indirect vision from vehicles-phase 2
42
•
-
Upload
independent -
Category
Documents
-
view
2 -
download
0
Transcript of The development of improvements to drivers' direct and indirect vision from vehicles-phase 2

Loughborough UniversityInstitutional Repository
The development ofimprovements to drivers'direct and indirect visionfrom vehicles - impact
assessment
This item was submitted to Loughborough University's Institutional Repositoryby the/an author.
Citation: COOK, S., SUMMERSKILL, S., MARSHALL, R. ... et al., 2011.The development of improvements to drivers' direct and indirect vision fromvehicles - impact assessment. Report for Department for Transport DfT TTSProject Ref: S0906 / V8. Loughborough: Loughborough University.
Additional Information:
• This is an impact assessment report prepared by Loughborough DesignSchool, Loughborough University and MIRA Limited, for the Departmentof Transport [DfT TTS Project Ref: S0906 / V8]. This report relates tothe Phase 1 report (available at: http://hdl.handle.net/2134/8872) andPhase 2 report (available at: http://hdl.handle.net/2134/8873).
Metadata Record: https://dspace.lboro.ac.uk/2134/8874
Version: Published
Publisher: Loughborough University and MIRA Limited
Please cite the published version.

This item was submitted to Loughborough’s Institutional Repository (https://dspace.lboro.ac.uk/) by the author and is made available under the
following Creative Commons Licence conditions.
For the full text of this licence, please go to: http://creativecommons.org/licenses/by-nc-nd/2.5/

The Development of
Improvements to Drivers’
Direct and Indirect Vision
from Vehicles – Impact
Assessment
For: Department for Transport
DfT TTS Project Ref: S0906 / V8
Prepared by: Loughborough Design
School, Loughborough University
and MIRA Limited
Date: March 2011

The development of improvements to drivers' direct and indirect vision from vehicles. Impact assessment. (AR2640) Department for Transport [DfT] Sharon Cook, Dr Steve Summerskill, Dr Russell Marshall, John Richardson, Clare Lawton, Rachel Grant, Steve Bayer, James Lenard (Design School, Loughborough University), Keith Clemo (MIRA)

Intentionally Blank
EPORT
The Development of Improvements to Drivers’ Direct and Indirect Vision from Vehicles – PHASE 2
Undertaken on behalf of the
Department for Transport
DfT TTS Project Ref: S0906 / V8
Prepared by
Loughborough Design School
Loughborough University
and
MIRA Limited
31 March 2011

Awarded to
Loughborough University 2007
ESRI Vehicle Safety Research Centre
Driver Sleepiness Research Group
In recognition of vehicle, road and driver safety research

Intentionally Blank

Loughborough University / MIRA i March 2011
TABLE OF CONTENTS
1 INTRODUCTION ............................................................................................... 1
1.1 Background .................................................................................................... 1
1.2 Aim ................................................................................................................. 1
1.3 Objectives ...................................................................................................... 2
1.4 Approach ........................................................................................................ 2
2 DESCRIPTION OF RESEARCH ....................................................................... 3
2.1 Phase 1 .......................................................................................................... 3
2.2 Phase 2 – N2 and N3 blind spot determination ............................................... 4
2.2.1 Accident data ............................................................................................... 4
2.2.2 Driver/Trainer interviews ............................................................................... 5
2.2.3 Field of vision – Digital Human Modelling ..................................................... 5
2.2.4 Quality of vision ............................................................................................ 6
2.2.5 Indirect vision technologies .......................................................................... 7
2.3 Phase 2 – M1 forward field of view (A/B pillar obscuration) ............................ 8
2.3.1 Accident data ............................................................................................... 8
2.3.2 Field of vision – Digital Human Modelling ..................................................... 9
2.4 Phase 2 – M1 and M2 rear field of view (Visibility of rear obstacle) .............. 10
2.4.1 Field of vision – Digital Human Modelling ................................................... 10
3 IMPACT ASSESSMENT ................................................................................. 13
3.1 Introduction .................................................................................................. 13
3.2 Methodology ................................................................................................ 14
3.3 Solutions and cost-benefit analysis .............................................................. 16
3.3.1 Blind-Spot prevention for N2 and N3 vehicles ............................................... 16
3.3.2 Visibility of rear obstacle ............................................................................. 26
3.3.3 Mirror image quality .................................................................................... 31

Loughborough University / MIRA ii March 2011
Intentionally Blank

The Development of Improvements to Phase 2 report Drivers‟ Direct and Indirect Vision from Vehicles S0906 / V8
Loughborough University / MIRA 1 March 2011
1 INTRODUCTION
1.1 Background
The Transport Technology and Standards (TTS) Division of the Department for Transport
has a responsibility for providing technical support to policy formulation and development.
This is achieved through a broad research programme pertaining to vehicle-related safety
issues to support the development of vehicle standards and regulations and the
enforcement of standards. Within this remit, TTS wished to investigate the issues and
implications for extending regulations relating to drivers‟ field of view requirements.
Currently all M and N vehicles have to comply with European legislation with respect to
indirect vision (vision through mirrors and cameras); however when direct vision (through
the windscreen and side windows) is considered this is only mandated for M1 vehicles. If
the legislation is to be extended then the Department needs to be able to take an
informed stance on any proposals to it. To facilitate this, it therefore wishes to
understand:
What the direct field of vision requirements for M2, M3 and all N category vehicles
are, since it cannot be assumed that the requirements for M1 can be directly
transferred.
The implications for RH drive and LH drive vehicles being used in LH drive and RH
drive environments respectively.
The effect of vehicle size.
The relationship between direct and indirect field of view requirements in order to
support as close as possible a 360° visual field requirement.
1.2 Aim
The over-arching aim of the project is to investigate the drivers‟ direct forward field of view
and indirect field of view requirements for all „M‟ and „N‟ category vehicles with the
intention to identify solutions to achieve, as far as is practicable, a 360° field of vision in
which other road users can be easily seen.

The Development of Improvements to Phase 2 report Drivers‟ Direct and Indirect Vision from Vehicles S0906 / V8
Loughborough University / MIRA 2 March 2011
1.3 Objectives
The stated objectives of the project cover:
Vision
The research needs to provide information on what drivers of „M‟ and „N‟ category
vehicles:
Should be able to see.
What they actually see in the real world.
How their field of vision may be affected by vehicle design.
Blind spots
The research needs to:
Identify blind spots in both drivers‟ direct and indirect fields of view.
Propose practical solutions to eliminate the identified blind spots.
Solutions
The solutions should facilitate drivers in easily seeing other road users at all times. The
solutions should aim to:
Minimise obscuration of the direct field of view relating to vehicle design, exterior
mirrors and other vehicle features.
Maximise the drivers‟ indirect field of view.
Provide recommendations for amendments to the European legislations, where
appropriate.
The context in which the objectives need to be considered includes:
Right and left hand drive vehicles.
Basic vehicle design and the drivers‟ environment.
Future potential vehicle design features.
1.4 Approach
The research approach was undertaken in two phases:
Phase 1 whose aim was to scope the existing knowledge base in order to
prioritise and direct activities within Phase 2.
Phase 2 whose aim was to investigate the specific driver vision problems
prioritised in Phase 1 and determine solutions to them.

The Development of Improvements to Phase 2 report Drivers‟ Direct and Indirect Vision from Vehicles S0906 / V8
Loughborough University / MIRA 3 March 2011
2 DESCRIPTION OF RESEARCH
2.1 Phase 1
The approach undertaken within Phase 1 was to use triangulated research methods
to investigate the aspects relating to drivers direct and indirect vision by means of:
A literature review.
A review of previous accident data studies.
Consultations with major interest groups.
A legislative review.
The data derived from these activities was used to address the key issues raised
within the project‟s work specification regarding:
What should the driver be able to see (section 3).
What do drivers need to see (section 4).
What can drivers actually see (section 5).
Blind spots (section 6).
Accident scenarios (section 7).
Solutions (sections 8, 9 and 10).
Using the data gathered, an assimilation activity was undertaken to identify the
vision-related risk factors pertinent for each vehicle category and prioritise areas for
further investigation within Phase 2 (section 12).
An Initial Impact Assessment was also undertaken (section 13).
A preliminary research plan was then proposed for discussion with the Department
(section 14).
Following this, the research programme for Phase 2 was developed as follows:
N2 and N3 Category vehicles
Work package 1: Blind spot determination
Task 1: Accident data analysis.

The Development of Improvements to Phase 2 report Drivers‟ Direct and Indirect Vision from Vehicles S0906 / V8
Loughborough University / MIRA 4 March 2011
Task 2: Driver and trainer interviews.
Task 3: Digital Human Modelling.
Task 4: Technology review.
Work package 4: Mirror image quality
Work package 5: Reliability of detection systems
M1 vehicles
Work package 2: Forward field of view – A/B pillar obscuration
Task 1: Accident data analysis.
Task 2: Digital Human Modelling.
M1 and M2 vehicles
Work package 3: Rear field of view – Visibility of rear obstacle
Task 1: Digital Human Modelling
Impact Assessment – Work package 6
2.2 Phase 2 – N2 and N3 blind spot determination
This work area formed the main areas of investigation within the Phase 2 research
programme.
2.2.1 Accident data
STATS19 data for 2008 was analysed using cluster analysis to obtain representative
scenarios for light and heavy goods vehicles (N category vehicles) where ‟Vision
affected by vehicle blind spot‟ was recorded on the database as a contributory factor
(no. 710). Seven cluster scenarios were identified, four of which were considered to
be of interest to the study:
Articulated left-hand drive HGVs over 7.5 tonnes changing lane to the right and
colliding with cars.
HGVs over 7.5 tonnes changing lane to the left and colliding with cars.
HGVs changing lane to the right and colliding with cars.
Goods vehicles turning left and colliding with vulnerable road users.

The Development of Improvements to Phase 2 report Drivers‟ Direct and Indirect Vision from Vehicles S0906 / V8
Loughborough University / MIRA 5 March 2011
2.2.2 Driver/Trainer interviews
Interviews with HGV drivers and trainers identified driving scenarios in which blind
spots may be an issue as: changing lanes, pulling away, reversing, manoeuvring and
negotiating junctions. Problematic blind spot areas were cited as the rear, the front
corners and along the sides. These findings tend to corroborate the accident
scenarios identified.
In addition, it was found that drivers considered that their awareness of the visual
difficulties associated with blind spots was good. The trainers supported this view
highlighting the role of training and the importance of mirror set-up and checking.
Most drivers were content with the number and coverage of their mirrors (although
the validity of this finding is dependent upon their understanding of what an
appropriate level of coverage is).
2.2.3 Field of vision – Digital Human Modelling
In order to add validity to the modelling, cases from the On The Spot (OTS) database
were used to exemplify the accident cluster scenarios selected for investigation. The
category N2 and N3 vehicles selected for modelling were chosen from a top ten list of
vehicle registrations in the UK using SMMT.
N2 – DAF LF 45; Renault Midlum; IVECO Eurocargo.
N3 – DAF XF 105; Volvo 480 (Left hand drive); Scania R420.
Drivers‟ direct and indirect vision was modelled using anthropometric data for the
99th%ile and 4th%ile UK males combined with the observed postures to provide two
distinct eye positions for the testing of mirrors.
Analyses were first undertaken to identify the limits to the combined direct and
indirect vision for both percentile measures in all six vehicles. These variables were
then applied to the OTS cases and the implications of these limits to vision
investigated.
Vision related issues identified from this work included:
Blind spot between the volume of space visible through the Class V mirror and the
volume of space visible through the window apertures.

The Development of Improvements to Phase 2 report Drivers‟ Direct and Indirect Vision from Vehicles S0906 / V8
Loughborough University / MIRA 6 March 2011
Poor alignment of mirrors reduces the area of coverage. (This links to the driver
interviews confirming the importance of correct set-up and drivers being enabled in
this).
Image distortion at the edge of the mirrors.
2.2.4 Quality of vision
Concerns raised in phase 1 and within the DHM work above regarding the quality of
the image provided by mirrors and the drivers‟ ability to correctly interpret what they
see was the focus of field trials undertaken within Phase 2 of the project.
The Class IV, V and VI mirrors of a Volvo FH tractor unit were assessed within the
trials. The areas of ground plane visibility prescribed for each were centralised within
the mirror and visual targets (car, cyclist, child pedestrian and a bin bag) were
presented to twenty trial participants who were N3 truck drivers. Each target was
presented singularly to the drivers who took representative glances in the mirror.
Following each observation, the driver was asked to report:
If the target was visible (on some occasions no target was presented).
What the target was (car, cyclist, child pedestrian or bin bag).
Their confidence in that interpretation on a scale of 1-7.
Whether the target was visible by direct vision.
To assess the potential impact of distortion at the mirror edges, an additional target
position just outside the prescribed area was assessed for the Class V and VI
mirrors.
The study found:
Correct detection rates across all mirrors exceeded 93%.
Correct recognition rates were at least 90% across all mirrors.
Correct detection and recognition rates were compromised towards mirror edges.
These findings suggest that Class IV, V and VI mirrors are capable of providing good
indirect vision of the prescribed areas. However correct adjustment is important
since a misaligned mirror may cause some of the prescribed area to only be viewable
at the mirror edge where detection and recognition rates are poorer. It is

The Development of Improvements to Phase 2 report Drivers‟ Direct and Indirect Vision from Vehicles S0906 / V8
Loughborough University / MIRA 7 March 2011
recommended that the scale of the problem of poor adjustment is investigated and
mechanisms to assist improved step-up encouraged e.g. the adoption of mirror
adjustment bays, improved mirror designs that require no adjustment or provide a
mechanism for easy adjustment by the driver. It should be recognised that other
factors may impact accurate mirror use including: rain; dirt on the mirror and
windows; driver inattention; driver attending to another visual task; time pressures,
etc. Alternative technologies such as cameras and sensors were also discussed.
2.2.5 Indirect vision technologies
An expert appraisal to investigate the performance of standard mirrors, an extended
view mirror (Spafax), cameras and sensors was undertaken. A 1m ground plane grid
system was marked out extending 3m to the front of the truck; 5m to the nearside
and 2m to the offside. This was sufficient to cover the Class V and VI prescribed
areas and the extended area specified in the GRSG proposal amendment to
regulation No. 46 (January 2011).
The data recorded included:
If, and to what extent, the target could be seen by direct vision.
If, and to what extent, the target could be seen by the indirect vision system.
The approximate orientation of the target as presented in the system.
A rating of the level of confidence in recognising the target via the system.
Maps showing detection and recognition responses over the grid were produced to
aid the comparison of the technologies. These indicated that:
with respect to detection:
Within the Class V prescribed area, all systems provided complete detection.
Within the GRSG proposed area, the extended mirror outperformed the
standard Class V mirror; indicative results suggest that the camera system
would also outperform the standard Class V mirror.
To the side there was less overlap between direct and indirect vision indicating
a greater potential for blind spots (and reflecting the findings in the DHM task).
Within the Class VI prescribed area, the standard mirror and the camera
system provided complete coverage – the sensor system showed failures at
the nearside edge and along the front of the truck.

The Development of Improvements to Phase 2 report Drivers‟ Direct and Indirect Vision from Vehicles S0906 / V8
Loughborough University / MIRA 8 March 2011
The camera system helps to address blind spots caused by the mirrors
themselves.
with respect to recognition:
The mirror systems presented the most extreme changes in orientation of the
target, often presenting the target in positions ranging form on its side to
upside down.
The camera system displayed a greater proportion of the target compared to
the standard mirrors.
Both mirror and camera images are likely to be impacted by external factors
such as rain, dirt, glare, etc.
Distortion of larger objects resulted in a pronounced bending effect of the
image.
Such distortions were most pronounced at the edges of the mirrors.
Due to the greater impacts of orientation and distortion, the mirror images
were less intuitive in interpreting the external scene e.g. for direction of motion
of the target.
2.3 Phase 2 – M1 forward field of view (A/B pillar
obscuration)
2.3.1 Accident data
STATS19 data for 2008 was analysed using a new Cluster analysis methodology to
obtain representative scenarios for M1 vehicles where ‟Vision affected by vehicle
blind spot‟ was recorded on the database as a contributory factor (no. 710).
Nine cluster scenarios were identified, three of which were considered to be of
interest to the study:
Entering or using a roundabout and colliding with a pedal cyclist.
Entering or using a junction and colliding with a motorcycle or car that approached
from the right-hand side of the driver.
Entering or using a junction and colliding with a pedal cyclist or car that
approached from the left-hand side of the driver.

The Development of Improvements to Phase 2 report Drivers‟ Direct and Indirect Vision from Vehicles S0906 / V8
Loughborough University / MIRA 9 March 2011
2.3.2 Field of vision – Digital Human Modelling
In order to add validity to the modelling, cases from the On The Spot (OTS) database
were used to exemplify the accident cluster scenarios selected for investigation. The
category M1 vehicles selected for modelling were based on prevalence within the
fleet as follows:
Volkswagen Golf.
Volkswagen Touran.
Hyundai i10.
The Volkwagen models share the same platform with the Touran having a split A-
pillar compared to the single A-pillar of the Golf. Drivers‟ direct and indirect vision
was modelled using two different driver extremes – 99th percentile Dutch male and
the smallest UK female capable of driving the vehicle.
Analyses were first undertaken to identify the limits to the combined direct and
indirect vision for both percentile measures in all vehicles. These variables were then
applied to the OTS cases and the implications of these limits to vision investigated.
Vision related issues identified from this work included:
Blind spots are variable in both size and position based on the design of the A-
pillar, the position of the pillar and the eye-point of the driver.
„Looking around‟ the pillar eliminated the blind spots caused by A and B-pillar
obscuration of the modelled vehicles.
A-pillar size would need to be substantially reduced to have a noticeable effect on
the driver‟s view.
Whilst structural strength is important for secondary safety, manufacturers should
be encouraged to balance this against the primary safety needs for improved
vision and so should be looking to reduced A-pillar thickness.
The Development of Improvements to Phase 2 report Drivers‟ Direct and Indirect Vision from Vehicles S0906 / V8
Loughborough University / MIRA 10 March 2011
2.4 Phase 2 – M1 and M2 rear field of view (Visibility of
rear obstacle)
2.4.1 Field of vision – Digital Human Modelling
The vehicles selected for modelling were:
M1 – Volkswagen Touran.
M2 – Ford Transit long wheelbase minibus.
Drivers‟ direct and indirect vision was modelled using two different driver extremes –
99th percentile Dutch male and the smallest UK female capable of driving the
vehicle.
Analyses were undertaken to identify the limits to the combined direct and indirect
vision for both percentile measures in both vehicles. These variables were used to
assess direct and indirect vision.
Direct vision was assessed by means of:
Target markers defined within ISO/TR 12155.
A wall-like target (5m wide, 1m high).
Defining minimum target heights necessary in order to be seen by direct
vision.
Indirect vision was assessed by means of:
The mirror requirements as specified for each class of mirror within the
relevant standards – ECE46-1, ECE46-02, 2006/96/EC and FMVSS111.
Vision related issues identified from this work included:
M1 vehicle
Class I are fully compliant.
Class III mirrors when set up optimally to provide an appropriate rearwards
view fall marginally short of the field of view requirements for ECE46-02 and
2006/96/EC in relation to the areas closest to the rear of the vehicle,
particularly on the nearside. It is likely that they could be adjusted to comply,
but only with compromising rearwards view.

The Development of Improvements to Phase 2 report Drivers‟ Direct and Indirect Vision from Vehicles S0906 / V8
Loughborough University / MIRA 11 March 2011
Class I compliance is theoretical since in reality the rearwards field of view is
compromised by internal fixtures such that it is only applicable to the
uppermost half of the rear window.
The same rearward limitation impedes direct vision where only objects greater
than 1400mm in height could be seen directly behind the vehicle.
The areas of obscuration to the rear of the vehicle range from 6.5-10m on the
ground plane and 0.5-1.1m on a plane 1m above the ground. Thus there is
potential for a child or other obstacle lower than 1m to be obscured.
M2 vehicle
Class I and II mirrors are fully compliant.
Class I compliance is theoretical since in reality the rearwards field of view is
heavily compromised by internal fixtures such that it is minimal and as such
the mirror fails to comply with the standard.
The same rearward limitation impedes direct vision where only objects greater
than 1800mm in height could be seen directly behind the vehicle.
For practical purposes the rearwards visibility of this vehicle is essentially zero
and could not be relied upon.
The specification given in Directive 2001/85/EC that a person 1.3m tall
standing 1m behind the vehicle is considered to be visible in direct vision is not
met.

The Development of Improvements to Phase 2 report Drivers‟ Direct and Indirect Vision from Vehicles S0906 / V8
Loughborough University / MIRA 12 March 2011
Intentionally Blank

The Development of Improvements to Phase 2 report Drivers‟ Direct and Indirect Vision from Vehicles S0906 / V8
Loughborough University / MIRA 13 March 2011
3 IMPACT ASSESSMENT
3.1 Introduction In the description of work for Phase 2 of the project, the team undertook to complete
an impact assessment for solutions to each of the issues studied in Work Packages 1
to 4, that is:
WP1: N2 and N3 Blind Spot Determination
WP2: M1 Forward Field of View, A/B Pillar Obscuration
WP3: M1 and M2 Rear Field of View, Visibility of Rear Obstacle
WP4: Mirror Image Quality.
The proposal had this to say about the impact assessment that would be conducted:
“Where the research determines that there is a real problem in terms of risk of
accidents, the most cost-effective solution will be identified. Where this solution calls
for changes to be made to existing legislative standards, an impact assessment will be
carried out. This sets out a range of possible measures that the responsible minister
can adopt, and provides guidance for him in choosing which of these, if any, to
approve. The assessment evaluates as precisely as possible the cost and benefit of
the courses of action on society in general and specific stakeholders. The procedure
for carrying out the Impact Assessment has been standardised across government
and is set out by the Department for Business, Innovation and Skills on its website”.
Solutions have been proposed for Work Packages 1 and 3, and impact assessments
carried out for a variety of options to these. However, in the case of Work Package 2,
although A- and B-pillars on cars can be shown to impair forward and side vision,
there is no solution in the area of vehicle legislation that could benefit this impairment
without having a serious effect on other safety aspects of the vehicle. In the case of
Work Package 4, a number of recommendations have been made, including a firm
proposal to require all new N2 and N3 vehicles to be fitted with all mirrors (including
Class II, IV, V and VI) that are capable of being adjusted from the driver‟s seat. The
cost of installing such mirrors in the current vehicle fleet was estimated. However, the
project did not provide the data needed to estimate the benefits that would result, so
it was not possible to determine the magnitude of the benefit that might accrue from
this measure.

The Development of Improvements to Phase 2 report Drivers‟ Direct and Indirect Vision from Vehicles S0906 / V8
Loughborough University / MIRA 14 March 2011
3.2 Methodology The first step in the impact assessment was to define the range of practical measures
that were identified as solutions to the problem in each of the work packages. The
range of measures was limited to those actions that the Department for Transport
might be able to undertake, either on its own or in collaboration with other
stakeholders. Where changes in vehicle engineering standards were required, these
can generally only be made on the basis of the internationally-agreed standards that
govern vehicle type approval.
The second step was to identify the engineering changes that would be necessary to
vehicles or operating procedures in order to conform to the changes in legislation. In
most cases, these comprised additional systems that must be added to the vehicle,
or changes to its existing systems. In other cases, there may be changes in the
operators‟ procedures. The project carefully evaluated the options available to a
stakeholder.
The third step was to evaluate the costs and benefits to the stakeholders resulting
from implementing the measures identified above. In most cost-benefit studies the
total costs and benefits are evaluated separately and compared against each other.
In this case, however, a slightly different technique was employed. This starts by
evaluating the total benefits that will accrue in one year once the measures are fully
in place, using the accident data. Once each improved vehicle has been put into
service, these annual benefits will continue to accumulate each year for as long as
the system remains active. For the purposes of this assessment, it has been
assumed that the system will operate for a period of 5 years before requiring
replacement or major overhaul. Therefore, the annual benefits are multiplied by 5 to
give the total benefits, and these can be balanced against the additional vehicle cost.
This total value is then divided by the number of vehicles per year that are affected
by the engineering changes, to give a value for the benefit that will arise from each
vehicle. This represents in effect a budget cost per vehicle for implementing these
changes, if the measure is to have a positive benefit. The range of engineering
solutions that might achieve these benefits are then evaluated and reviewed. There
are several advantages to this approach, compared with the conventional technique:

The Development of Improvements to Phase 2 report Drivers‟ Direct and Indirect Vision from Vehicles S0906 / V8
Loughborough University / MIRA 15 March 2011
The numbers are much more comprehensible than the tens or even hundreds of
millions of pounds of total benefit and cost that might be involved in the case of an
effective measure that requires changes across a large number of vehicles.
The market for engineering solutions can be assessed in a more comprehensive
way. For example, where a range of systems that could alleviate a problem is on the
market, the assessment is no longer limited to the “cheapest” or “average” price, but
can examine in detail that portion of the market that meets the necessary budgetary
constraints.
In the market review for solutions, allowance has been made for:
The retail cost of devices.
The labour for installing them.
Where this can be estimated, any changes in operating costs of the vehicle, such
as fuel consumption, loss of productivity etc.
The benefits that accrue from making the proposed change in most cases
correspond to the value of the deaths and injuries that will be prevented by adopting
the proposed measure. This is done on the basis of expert judgement as to the
number of injuries that are potentially preventable by the measure, and an estimate
of the effectiveness of the measure in achieving this. In the UK, there are accepted
monetary values than are assigned to each fatal, serious and slight injury, and for
each fatal, serious and slight injury accident. These figures are published by the
Department for Transport, in the annual Recorded Road Casualties for Great Britain
document. They are based on “willingness to pay” studies conducted by the
Department and updated at regular intervals. Using these standard values, we are
able to compare the value of the costs and benefits for each single measure.
As mentioned above, most of the legislative changes that are proposed can only be
implemented on an EU-wide basis. However, evaluating costs and benefits over the
EU as a whole is not practical within the scope of the project. The reason for this is
that comparable accident and vehicle fleet figures are not always available for the
whole of the EU, and other member states adopt widely differing values for the cost
of injury. Therefore the costs and benefits have been evaluated for the United
Kingdom alone. Broadly, it could be assumed that the balance of costs and benefits
would be similar across the Union, but it would be for the other national
representatives at the ECE working groups to estimate these for their own territories.

The Development of Improvements to Phase 2 report Drivers‟ Direct and Indirect Vision from Vehicles S0906 / V8
Loughborough University / MIRA 16 March 2011
A full evaluation of costs and benefits needs to take account of the fact that these
arise at different times, insofar as the costs occur when the vehicle is manufactured,
but the benefits accumulate gradually during the time it is in service. Current UK
statistics show an average age of just over 7 years for the UK LGV fleet, so it is likely
to take well in excess of 10 years before this transition period is complete. For the
purposes of the assessment, the comparison is made on the basis that the benefits
of a fully compliant vehicle fleet exist; in other words the situation that will occur once
the changes have spread over the full vehicle fleet.
3.3 Solutions and cost-benefit analysis
3.3.1 Blind-Spot prevention for N2 and N3 vehicles
3.3.1.1 Proposed measures
Work Package 1 showed that there was a deficiency in the driver‟s vision to the front
nearside on N2 and N3 vehicles, and that this was largely responsible for many
injuries, typically those in Clusters 1, 2 and 7 of the accident analysis. These
corresponded to three different collision scenarios as follows:
Cluster 1: Side-swipe collision of a left-hand drive LGV with a car during a lane
change manoeuvre to the right (in other words, the side opposite the driver).
Cluster 2: Side-swipe collision of a right-hand drive LGV with a car, during a lane
change manoeuvre to the left, or collision with vehicle merging from the left
(essentially, a mirror image of Cluster 1).
Cluster 7: Collision of the LGV with a vulnerable road user, during a left-turn
manoeuvre.
It identified two measures that need to be made in order to reduce injuries in these
types of collision. One of these was judged to have the potential to eliminate
collisions where the driver looked but was unable to see the hazard, and the other
the potential to eliminate all of the collisions, including those where the driver failed to
look.

The Development of Improvements to Phase 2 report Drivers‟ Direct and Indirect Vision from Vehicles S0906 / V8
Loughborough University / MIRA 17 March 2011
These two measures were, respectively:
To introduce legislation to require the extension of the driver‟s field of view on the
passenger side of all new N2 and N3 class vehicles (using the Class V mirror) in
the lateral dimension, from the current 2m minimum distance from the vehicle side
(specified in Directive 2003/97/EC and Regulation ECE46.02) to 4.5m from the
vehicle side, and in the longitudinal direction from the current 1m forwards of the
driver‟s ocular points to 3m forwards. The current longitudinal dimension to the
rearmost edge of the zone of 1.75m behind the driver‟s ocular points remains
unchanged.
To introduce legislation to require the installation on all new N2 and N3 category
vehicles of an automated system capable of detecting a pedestrian or cyclist close
to the nearside of the LGV, and to alert the driver when this occurs as they are
about to make an abrupt left turn.
3.3.1.2 Engineering changes proposed
For the first measure, it was concluded that it is practical to extend the field of view to
the necessary extent by simply fitting a larger Class V mirror. Alternatively, a vehicle
manufacturer may choose to comply with the proposed change to the legislation by
installing a camera-monitor system to view the nearside of the LGV.
The project examined an extended view mirror by a leading manufacturer that will
meet the proposed requirements. It also examined the range of camera-monitor
systems currently on the market and concluded that systems suitable for meeting the
proposed change already exist. Both of these have been demonstrated to work
effectively on demonstrator and concept vehicles, and are already fitted to a small
number of LGVs in service. It is therefore concluded that there are no technical
problems that will prevent manufacturers from installing either of these on most
conventional designs of LGV. It should be noted that ECE46.02 already allows
camera systems to be fitted in place of Class V mirrors, so there is already a legal
basis for using either type of system.
For the automated alert systems proposed as the second measure, there are a
number of technologies that can be used as the basis of such a system; for example,
ultrasound, radar, infra-red or machine vision. Some of these technologies are
mature, have been demonstrated on safety concept vehicles and are already on the

The Development of Improvements to Phase 2 report Drivers‟ Direct and Indirect Vision from Vehicles S0906 / V8
Loughborough University / MIRA 18 March 2011
market. An important question that has been raised in relation to such systems is the
effectiveness of the Human-Machine Interface (HMI) that delivers the warning to the
driver. This is whether it can deliver the warning effectively, but without annoying the
driver or overloading them with unnecessary alerts to the extent that they begin to
ignore them completely. Discussions with manufacturers suggest that a good form of
HMI is the combination of a small LED positioned next to or within in the Class IV
mirror that illuminates when the system detects a person close to the side of the
LGV, supplemented with an audible or haptic warning to the driver whenever the left-
turn indicator is activated.
It is believed that the benefits of such types of system justify the establishment of an
EU-wide requirement to fit them on all new LGVs. However, there is currently no
standard for assessing how effectively they are capable of detecting a Vulnerable
Road User in the appropriate zone, and this must be established before a European
standard can be put in place. The technical requirements of this standard have not
yet been established and are outside the scope of this project. However, most of the
requirements will apply to the component approval of the system and not its
installation on the vehicle. This means that the majority of the cost of developing and
approving the system will be spread over the full sales of the system, rather than for
its installation in a specific vehicle type.
3.3.1.3 Benefits
Both of the measures proposed have the potential to prevent a large proportion of the
injuries that fall into Cluster 7 of the accident analysis, that is, the collision of left-
turning LGVs with vulnerable road users. The accidents in this cluster comprised the
following numbers for year 2008:
Slight 27, Serious 5, Fatal 3.
These were accidents involving LGVs, where there was some indication that driver
blind spot might have been a contributory factor. However, the numbers include all
types of LGV, including light goods vehicles in the N1 class. Since the proposal is
only to require N2 and N3 vehicles to adopt the changes, then those accidents to N1
vehicles will not be affected. Cluster 7 contains 18 N1 vehicles, within a total of 35.
Since no evidence can be found to evaluate the involvement of the different
categories according to severity, it is assumed that this is equal for all categories.

The Development of Improvements to Phase 2 report Drivers‟ Direct and Indirect Vision from Vehicles S0906 / V8
Loughborough University / MIRA 19 March 2011
Therefore, the above figures have been reduced in the ratio of 18/35 or 0.514 to
eliminate the N1 vehicles. With these eliminated the totals are:
Slight 13.11, Serious 2.43, Fatal 1.46.
3.3.1.4 Benefits of first two measures (larger mirror or camera system)
“Failed to look properly” was the most common contributory factor in STATS 19
reports and was noted in 39% of slight accidents, 32% of serious accidents, and 24%
of fatal accidents that occurred in 2009. For this measure, it was assumed that giving
the driver a better field of view would make no difference in these cases, so the
above figures were multiplied by 0.61, 0.68 and 0.76 respectively to account for this.
The resulting figures were multiplied by the standard costs per accident for each
class of injury noted in Reported Road Casualties Great Britain 2009, to give the
following annual benefits value for the UK.
Injury Class Number of accidents prevented
Value of preventing
each accident £
Prevention value (rounded to nearest £)
Slight 8.00 1880 15 039
Serious 1.65 21 370 35 291
Fatal 1.11 1 790 200 1 982 519
All 10.76
2 032 849 Table 1 Annual Benefits from Eliminating Cluster 7 Accidents to N2 and N3 Vehicles where
“Driver Failed to Look Properly” Please note that whilst the ‘Number of accidents prevented’ are reported to two decimal places, their actual values have been used in the calculation of the ‘Prevention value’. Therefore differences which may arise when comparing the ‘Prevention value’ with the result of multiplying the second and third column of each table are due to rounding.
As well as preventing some of the injuries in Cluster 7, the same measures if
implemented on the overseas LGVs associated with this cluster would also reduce
the number of side-swipes in Cluster 1 and the injuries associated with them, so
these can also be counted in the benefits. The accidents in this cluster comprise
Slight 168, Serious, 7, Fatal 1.
According to the accident data, all of these accidents involved N2 or N3 category
vehicles, so all of them will be affected by the measure. As for the Cluster 7 results,
these are scaled to eliminate the failed to look properly cases, using the same
factors. The resulting number of accidents and benefits value is given below.

The Development of Improvements to Phase 2 report Drivers‟ Direct and Indirect Vision from Vehicles S0906 / V8
Loughborough University / MIRA 20 March 2011
Injury Class Number of accidents prevented
Value of preventing
each accident £
Prevention value (rounded to nearest £)
Slight 102.48 1880 192 662
Serious 4.76 21 370 101 721
Fatal 0.76 1 790 200 1 360 552
All 108.00
1 654 936 Table 2 Annual Benefits from Eliminating Cluster 1 Accidents to N2 and N3 Vehicles where
“Driver Failed to Look Properly” Please note that whilst the ‘Number of accidents prevented’ are reported to two decimal places, their actual values have been used in the calculation of the ‘Prevention value’. Therefore differences which may arise when comparing the ‘Prevention value’ with the result of multiplying the second and third column of each table are due to rounding.
Again, we can count the benefits from preventing some of the Cluster 2 accidents as
above. The accidents in this cluster comprise
Slight 161, Serious 7, Fatal 1
In this case, there were 2 light goods vehicles that would not be affected out of a total
of 169, so these figures have been multiplied by 167/169, or 0.988. Discounting the
number who failed to look properly, this gives the following numbers and values.
Injury Class Number of accidents prevented
Value of preventing
each accident £
Prevention value (rounded to nearest £)
Slight 97.05 1880 182 450
Serious 4.70 21 370 100 517
Fatal 0.75 1 790 200 1 344 451
All 102.50
1 627 418 Table 3 Annual Benefits from Eliminating Cluster 2 Accidents to N2 and N3 Vehicles where
“Driver Failed to Look Properly” Please note that whilst the ‘Number of accidents prevented’ are reported to two decimal places, their actual values have been used in the calculation of the ‘Prevention value’. Therefore differences which may arise when comparing the ‘Prevention value’ with the result of multiplying the second and third column of each table are due to rounding.
Adding the benefits for Cluster 7, Cluster 1 and Cluster 2 accident figures, the total
annual value of benefits per year resulting from the measures is £5 315 203. Over
the assumed 5 year life of the system, the total benefits come to £26 576 013
(allowing for rounding errors). If the measure is to prove economic, the average
budget for parts and installation per affected vehicle will be the total 5 year benefits,
divided by the number of vehicles affected. For the purpose of this assessment, it is
assumed that the measure will apply to all new N2 and N3 LGVs in the UK. Currently,
very few LGVs are fitted with systems of this type, so it is assumed that all of these
vehicles will be affected. Using figures from SMMT for new vehicle registrations, the
number of N2 and N3 LGVs registered in the UK in 2010 was 30200. Dividing the total

The Development of Improvements to Phase 2 report Drivers‟ Direct and Indirect Vision from Vehicles S0906 / V8
Loughborough University / MIRA 21 March 2011
benefits by this figure, this represents a budget of £880 per vehicle for the purchase
and installation of a suitable system, if a positive benefit is to be achieved by this
measure.
3.3.1.5 Benefits of the third measure (driver alert)
Unlike the camera system, which is not likely to affect those accidents in which the
driver failed to look properly, the driver alert has the potential to eliminate all of the
accidents in Clusters 1, 2 and 7. Therefore, the estimation of benefits for this
measure counts all of these accidents.
The resulting reduction in accidents and associated values for the Cluster 7, Cluster
1 and Cluster 2 accidents are given in the following tables.
Injury Class Number of accidents prevented
Value of preventing
each accident £
Prevention value (rounded to nearest £)
Slight 13.11 1880 24 655
Serious 2.43 21 370 51 899
Fatal 1.46 1 790 200 2 608 577
All 17.00
2 685 131 Table 4 Annual Benefits from Eliminating All Cluster 7 Accidents to N2 and N3 Vehicles
Please note that whilst the ‘Number of accidents prevented’ are reported to two decimal places, their actual values have been used in the calculation of the ‘Prevention value’. Therefore differences which may arise when comparing the ‘Prevention value’ with the result of multiplying the second and third column of each table are due to rounding.
Injury Class Number of accidents prevented
Value of preventing
each accident £
Prevention value (rounded to nearest £)
Slight 168.00 1880 315 840
Serious 7.00 21 370 149 590
Fatal 1.00 1 790 200 1 790 200
All 176.00
2 255 630 Table 5 Annual Benefits from Eliminating All Cluster 1 Accidents to N2 and N3 Vehicles
Injury Class Number of accidents prevented
Value of preventing
each accident £
Prevention value (rounded to nearest £)
Slight 159.09 1880 299 098
Serious 6.92 21 370 147 820
Fatal 0.99 1 790 200 1 769 014
All 167.00
2 215 932 Table 6 Annual Benefits from Eliminating All Cluster 2 Accidents to N2 and N3 Vehicles
Please note that whilst the ‘Number of accidents prevented’ are reported to two decimal places, their actual values have been used in the calculation of the ‘Prevention value’. Therefore differences which may arise when comparing the ‘Prevention value’ with the result of multiplying the second and third column of each table are due to rounding.

The Development of Improvements to Phase 2 report Drivers‟ Direct and Indirect Vision from Vehicles S0906 / V8
Loughborough University / MIRA 22 March 2011
Adding the benefits for Cluster 7, Cluster 1 and Cluster 2 accident figures, the total
annual value of benefits per year resulting from the measures is £7 156 692 (allowing
for rounding errors). Over the assumed 5 year life of the system, the total benefits
come to £35 783 462 (allowing for rounding errors). If the measure is to prove
economic the average budget for parts and installation per affected vehicle will be the
total benefits, divided by the number of vehicles affected. For the purpose of this
assessment, it is assumed that the measure will apply to all new N2 and N3 vehicles
in the UK. Currently, very few LGVs are fitted with systems of this type, so it is
assumed that all of these vehicles will be affected. Using figures from SMMT for new
vehicle registrations, the number of N2 and N3 LGVs registered in the UK in 2010 is
30200. Dividing the total benefits by this figure, this represents a budget of £1185 per
vehicle for the purchase and installation of a suitable system, if a positive benefit is to
be achieved by this measure.
3.3.1.6 Costs
Consultations with system suppliers were carried out to evaluate the cost of
purchasing a system that would just meet the requirements of the proposed measure,
if this were part of a deal with a vehicle manufacturer to fit to all their vehicles. They
were also asked for the time that one of their skilled fitters might take to install the
system, which was multiplied by a figure of £35 per hour for current labour costs in
the automotive industry.
For the mirror system, it was not possible to undertake a full market survey because
only one suitable mirror is known to exist at the present time. However, the
manufacturer of this mirror estimated a retail price of £40 for their product. This falls
within the range of prices for existing Class V mirrors. Fitting is the same as the
current Class V mirror, so it is assumed that there is no additional labour associated
with installation. The cost represents less than 5% of the budget figure of £880, so
this represents a strong balance of benefit over cost.
For the camera system, the average purchase price quoted was £420, with a typical
installation time of 2 hours, representing £70, making a total of £490. Since the
system would replace a Class V mirror (average cost £40) this represents a net

The Development of Improvements to Phase 2 report Drivers‟ Direct and Indirect Vision from Vehicles S0906 / V8
Loughborough University / MIRA 23 March 2011
additional cost of £450. This represents 51% of the budget figure of £880, so this
also represents a strong balance of benefit over cost, although not quite as strong as
the mirror. Since camera-monitor systems are already covered by the legislation,
mandatory installation will not require the manufacturer to undertake any additional
testing for type-approval, so there will be no additional costs associated with approval
that would be imposed on either the system or vehicle manufacturer.
The costs for mandatory installation of a driver alert system have been derived in a
similar way, by costing systems incorporating ultrasound sensors, activating a
flashing LED and an audible alarm when reverse gear is selected. The average
purchase price for such a system is £360, with an estimated £70 cost for installation,
making £430 in all. This represents 36% of the budget price of £1185 per vehicle for
a system of this type. Again, this represents a balance of benefit over cost.
3.3.1.7 Other considerations
All of the measures proposed here have been assessed for their effect on
Government targets for CO2 emissions and other environmental considerations.
In the case of the larger mirror, its overall dimensions are only marginally greater
than a conventional Class V mirror, and in any case the contribution of the Class V to
the overall aerodynamic drag generated by all of the mirrors is small. Therefore, it is
assumed that any increase in fuel consumption and CO2 emissions due to changes
in drag will be negligible.
In the case of the camera-monitor systems, these normally house the camera inside
a streamlined housing mounted flush with the surface of the cab, so the aerodynamic
drag is quite low. If an operator chooses to fit a camera system, then they may have
the option of dispensing with the Class V mirror, in which case there may be a small
saving in fuel costs due to the reduction in aerodynamic drag. However, it is not
known whether the operator would prefer to do this, or whether they would prefer to
retain the Class V mirror as a back-up.
Considering the power required to operate the system, this is estimated to be less
than 100w on average. This is negligible, compared with the motive power of a
typical LGV.

The Development of Improvements to Phase 2 report Drivers‟ Direct and Indirect Vision from Vehicles S0906 / V8
Loughborough University / MIRA 24 March 2011
The alerting system would have an even smaller effect on CO2 emissions, since the
external sensors would project at most a few millimetres from the vehicle bodywork,
and the power consumption would be less than the camera-monitor.
3.3.1.8 Conclusions
Considering the UK alone, if the regulations for driver vision required an extension of
the area visible to the nearside from 2m to 4.5m from the side of the vehicle, this
could be accommodated by fitting either a slightly larger Class V mirror, or by
installing a suitable camera-monitor system. For the larger Class V mirror, there
would be a negligible additional cost to the manufacturer or operator, but the
measure has the potential to save 2.6 fatal, 11.1 serious and 207.5 slight injuries per
year on UK roads, representing a saving of £5 315 203 per year, or £26 576 013 over
an assumed 5 year life for the mirror (allowing for rounding errors). This represents a
significant saving for negligible additional cost.
If manufacturers chose to meet the requirements by installing a camera-monitor
system, it is assumed that the same number of injuries would be saved so the total
value of the benefits would be the same. Dividing this total by the 30 200 heavy
LGVs registered in the UK per year represents a budget of £880 per vehicle, if it is to
achieve a positive balance of benefit over cost. MIRA has surveyed the market for
camera-monitor systems and there are many systems that could meet the
requirements for less than this budget. Overall, the average price is £490 per vehicle,
including installation, giving a total cost of £14 798 000 per year for all N2 and N3
vehicles registered in the UK. Therefore, the camera-monitor system represents a
positive balance of benefit over cost.
If all LGVs in the UK were required to install driver alert systems, this would have the
potential to save 3.4 fatal, 16.3 serious and 340.2 slight injuries per year,
representing £7 156 692 per year, or £35 783 462 (allowing for rounding errors) over
the 5 year life assumed for the system. Spread over the 30 200 LGVs registered per
year in the UK, this represents a budget of £1185 per vehicle, if it is to achieve a
positive balance of benefits over cost. From a market survey of alert systems suitable
for meeting the requirements, it is apparent that there is a range of systems available
within the budget price. Overall, the average price per vehicle for such systems,

The Development of Improvements to Phase 2 report Drivers‟ Direct and Indirect Vision from Vehicles S0906 / V8
Loughborough University / MIRA 25 March 2011
including installation, amounts to £430. This represents a positive balance of benefit
over cost in the ratio of 2.76.
Measure Larger Class V Mirror
Camera / Monitor
Driver Alert
Total benefits over 5 years
£26.5 m £26.5m £35.7m
No of vehicles affected 30200
Target unit cost £880 £880 £1185
Average net cost per vehicle
£40 £490 £430
Benefit / cost 22.5 1.80 2.76 Table 7 Cost-benefit summary for potential solutions to blind-spot prevention for N2 and N3
vehicles
On this basis, it appears that the engineering changes to accommodate both of the
proposed measures would prove economic, insofar as the benefits of reducing
injuries over the working life of the systems exceed the additional cost of purchasing
and installing the system.
This conclusion should be weighed against the assumptions that have been made in
this assessment. These are detailed elsewhere but may be summarised as follows:
That the measure is introduced throughout Europe, and that the overall costs and
benefits in the other member states will be commensurate with the UK figures
quoted here.
That all N2 and N3 vehicles in service are fitted with a compliant system.
That the enlarged mirror or camera systems will prevent all of the N2 / N3 collisions
identified in Clusters 1, 2 and 7 of the accident analysis, except those in which
“failed to look properly” is identified as a contributory factor.
That the rate of involvement of N1 in the collisions identified in the clusters is the
same as for N2 and N3 vehicles.
That the driver alert system will prevent all of the N2 / N3 collisions identified in
Clusters 1, 2 and 7, including those where “failed to look properly” is identified as a
contributory factor.
That the benefits will be realised over a 5-year service life of the system.
That there will be no additional running costs for the vehicles over this period.

The Development of Improvements to Phase 2 report Drivers‟ Direct and Indirect Vision from Vehicles S0906 / V8
Loughborough University / MIRA 26 March 2011
3.3.2 Visibility of rear obstacle
3.3.2.1 Proposed measures
The project has demonstrated that there is a deficiency in the rear vision from certain
M1 and M2 vehicles, and that this is largely responsible for many injuries associated
with vehicles that are reversing.
From the research and testing carried out in Work Package 3, the following
engineering changes to vehicles are proposed, in order to reduce the number of
injuries that occur when these vehicle types are reversing:
To mandate the installation of a camera-monitor system on all M1 and M2 category
vehicles, to allow the driver to view the area to the rear while reversing.
To mandate the installation of a driver alert system on all M1 and M2 vehicles, to
warn the driver of persons close to the rear of the vehicle while reversing.
3.3.2.2 Engineering changes proposed
In the case of the camera-monitor system, the minimum equipment level would be a
single camera mounted in a position that gives the field of view specified. Although
some cameras offer a “night vision” capability, this is not considered to be a
necessary part of the minimum fitment, since the reversing lamp will provide sufficient
illumination at the range required. A basic monochrome monitor would be sufficient.
No minimum screen size needs to be specified. The most basic systems currently
offered for sale incorporate a 2.5inch colour monitor.
In the case of the driver alert system, the minimum equipment level would be a single
sensor with an audible alarm. However, the most basic systems currently on sale
offer 2 sensors with a multi-tone buzzer. Many suitable systems are already on the
market as reversing aids.
3.3.2.3 Costs for the camera-monitor system
The camera-monitor and driver alert systems proposed as reversing aids for M1 and
M2 vehicles are different from the systems proposed for N2 / N3 blind spot. The latter
are of much more rugged design to withstand the working environment of a LGV, and
are designed for a 24volt electrical system. The devices proposed for this application
do not require these qualities and are therefore generally cheaper.

The Development of Improvements to Phase 2 report Drivers‟ Direct and Indirect Vision from Vehicles S0906 / V8
Loughborough University / MIRA 27 March 2011
The partners have reviewed 8 reversing camera-monitor systems currently on sale as
retrofit devices and also the systems offered by manufacturers as factory-fitted
accessories in 2 popular mid-range saloon cars. All of these meet the minimum
specification detailed above. The retrofit systems cover a range of prices from £40 to
£205 with an average price of £130; some of the higher priced systems offer features
that are not necessary for the basic functionality envisaged such as combined sensor
alerts and night vision. On this basis, the typical price for a basic system is
considered to be £125, which covers the 5 cheapest systems. Installation of these
systems (some of which use wireless connectivity for the monitor unit) is judged to
require less than 1 hour‟s labour, representing an additional cost of £35, making a
total cost of £160 per car. The additional cost charged by car manufacturers for their
original equipment reversing camera systems varies between £200 and £400 and is
therefore consistent with the above costs.
Currently, reversing cameras are classed as surveillance cameras and are therefore
not subject to mandatory performance standards. If their fitment was made
obligatory, then it might be appropriate to introduce some form of minimum
performance requirements for them, and these could be incorporated into ECE46.02,
since this already addresses camera-monitor systems as alternatives for some mirror
types. This could impose an additional cost on manufacturers, which could increase
unit costs by a small amount, depending on sales volumes.
Although some new cars are already fitted with reversing cameras as standard, these
are believed to form a very small proportion of the total number produced. If all of the
1 996 300 new cars registered in the UK in 2010 were required to be fitted with
reversing camera-monitor systems, therefore, the total cost would be approximately
£319 408 000. However, this only considers M1 vehicles and not M2.
3.3.2.4 Benefits for the camera-monitor system
The cluster analysis referred to in the previous section was confined to category N
vehicles only, and did not include accidents to category M vehicles, as per the agreed
project plan. Hence it is not possible to examine the benefits of preventing reversing
accidents in the same way. To overcome this difficulty, access was granted by DfT to
some earlier unpublished data for reversing accidents. This data was only available
The Development of Improvements to Phase 2 report Drivers‟ Direct and Indirect Vision from Vehicles S0906 / V8
Loughborough University / MIRA 28 March 2011
for M1 vehicles in 2007, where vehicle blind spot was judged to be a contributory
factor. Due to the lack of data availability for M2 vehicles, the following sections
therefore only consider benefits with respect to M1 vehicles. The data contained the
following classes of injury:
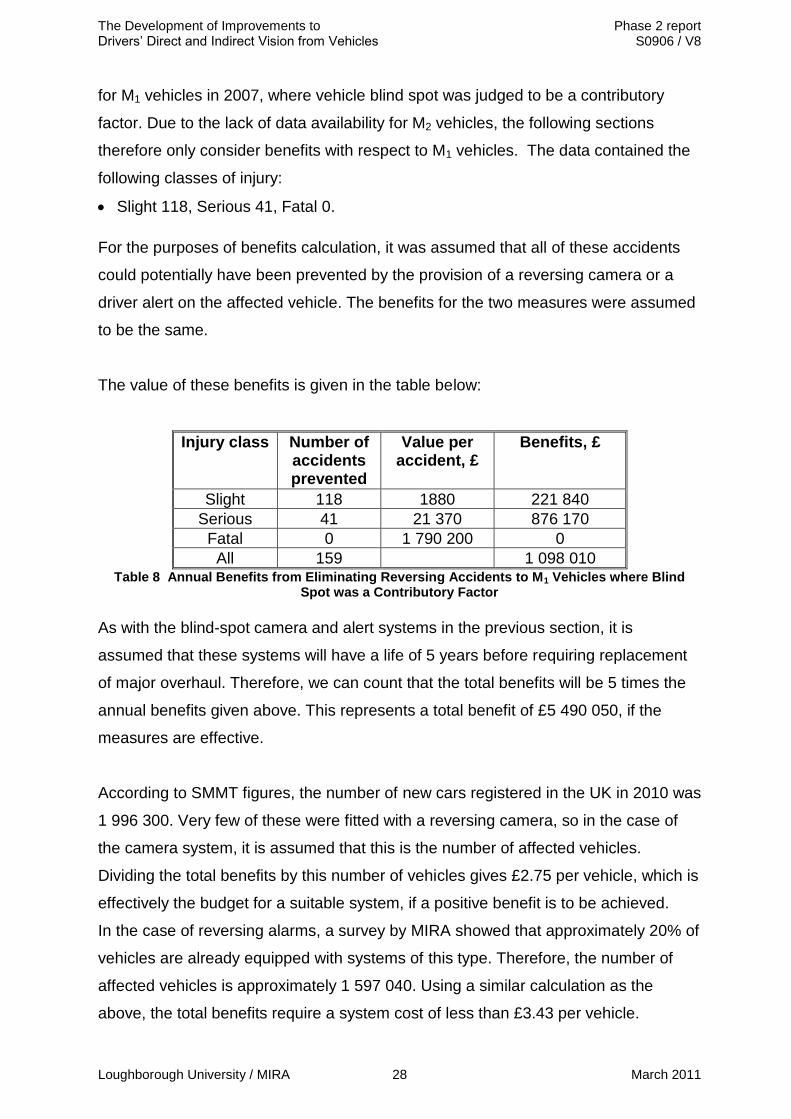
Slight 118, Serious 41, Fatal 0.
For the purposes of benefits calculation, it was assumed that all of these accidents
could potentially have been prevented by the provision of a reversing camera or a
driver alert on the affected vehicle. The benefits for the two measures were assumed
to be the same.
The value of these benefits is given in the table below:
Injury class Number of accidents prevented
Value per accident, £
Benefits, £
Slight 118 1880 221 840
Serious 41 21 370 876 170
Fatal 0 1 790 200 0
All 159
1 098 010 Table 8 Annual Benefits from Eliminating Reversing Accidents to M1 Vehicles where Blind
Spot was a Contributory Factor
As with the blind-spot camera and alert systems in the previous section, it is
assumed that these systems will have a life of 5 years before requiring replacement
of major overhaul. Therefore, we can count that the total benefits will be 5 times the
annual benefits given above. This represents a total benefit of £5 490 050, if the
measures are effective.
According to SMMT figures, the number of new cars registered in the UK in 2010 was
1 996 300. Very few of these were fitted with a reversing camera, so in the case of
the camera system, it is assumed that this is the number of affected vehicles.
Dividing the total benefits by this number of vehicles gives £2.75 per vehicle, which is
effectively the budget for a suitable system, if a positive benefit is to be achieved.
In the case of reversing alarms, a survey by MIRA showed that approximately 20% of
vehicles are already equipped with systems of this type. Therefore, the number of
affected vehicles is approximately 1 597 040. Using a similar calculation as the
above, the total benefits require a system cost of less than £3.43 per vehicle.

The Development of Improvements to Phase 2 report Drivers‟ Direct and Indirect Vision from Vehicles S0906 / V8
Loughborough University / MIRA 29 March 2011
3.3.2.5 Costs for the driver alert system
MIRA reviewed 18 parking sensors currently on sale as retrofit devices, and also the
systems offered as factory fitted accessories on 5 mid-range saloon cars. All of these
meet the minimum specification detailed above. The retrofit devices range in price
between £30 and £110, with an average price of £62. In general, the more expensive
systems do not offer more features, so it is assumed that the difference in price is
determined by quality. Installation of these systems is judged to require 1 hours
labour, representing an additional cost of £35, making a typical total cost per vehicle
of £97.
It is difficult to identify an accurate price for factory-fitted systems since most of these
are offered as a package together with other features. However, two of the
manufacturers reviewed offer 2-sensor “parking systems” for £130 and £199, and
one offers a 4-sensor system for £249.
Unlike the reversing camera system, a significant proportion of new cars are already
fitted with parking sensors as standard. No statistics could be found for this.
However, MIRA conducted a small survey of current vehicles and estimates that 20%
of 2007-2011 cars have such systems already fitted. Therefore, the additional
number of systems that will be needed if all cars are to be fitted is estimated as 1 597
040. Therefore, the estimated total cost for installing these across the fleet in the UK
is £154 912 880.
Measure Reversing camera / monitor
Driver alert
Total benefits over 5 years
£5.5m £5.5m
No of vehicles affected 2.0m 1.6m
Target unit cost £2.75 £3.43
Average net cost per vehicle
£160 £97
Benefit / cost 0.02 0.04 Table 9 Cost-benefit summary for potential solutions to rear visibility for M1 vehicles

The Development of Improvements to Phase 2 report Drivers‟ Direct and Indirect Vision from Vehicles S0906 / V8
Loughborough University / MIRA 30 March 2011
3.3.2.6 Other considerations
Currently, camera systems are permitted as an alternative to certain classes of
mirrors by ECE46.02. Therefore, this regulation would form the regulatory basis for
the performance of reversing camera systems. On the other hand, there is currently
no mandatory standard for the performance of reversing alarms, and it might be
necessary to draft such a standard if these are to be made mandatory. Approval of
systems to this standard could impose a cost burden on manufacturers, with a
consequent additional cost per component passed on.
Calling for the mandatory installation of camera-monitor or driver alert systems for the
most numerous sector of the motor industry (even in the UK, let alone Europe) would
call for a significant increase in the production of such devices, even on a world-wide
basis. It is not known whether the industry is capable of responding to this increase in
demand, or what the effect on raw material resources would be, or what effect this
might have on the price structure.
Both of the measures proposed here have been assessed for their effect on
Government targets for CO2 emissions and other environmental considerations.
External cameras and sensors of this type do not significantly alter the external
profile of the car and their power consumption is negligible in comparison with the
motive power of the vehicle. They would therefore not be expected to affect the fuel
consumption or CO2 emissions of cars. However, the change in CO2 emissions
associated with the increased production of these devices is not known.
3.3.2.7 Conclusions
On the basis of these figures, it is estimated that requiring all M1 vehicles in the UK to
install reversing cameras or driver alerts could prevent 0 fatal, 41 serious, and 118
slight injuries per year on UK roads, representing a saving of £1 098 010. Since very
few cars are currently fitted with reversing cameras, this represents a per-vehicle
benefit of £2.75. On the other hand, since an estimated 20% of new cars are already
fitted with a reversing alert system, the average benefit from equipping the remaining
cars with one of these is higher, at £3.43 per vehicle. Against this, a survey of the
market for these systems indicates that the average price for a reversing camera
system is approximately £160 per vehicle, while the average price for a reversing

The Development of Improvements to Phase 2 report Drivers‟ Direct and Indirect Vision from Vehicles S0906 / V8
Loughborough University / MIRA 31 March 2011
alert system is £97 per vehicle. None of the systems surveyed was available for less
than the budget price. On balance therefore, the cost of equipping the entire UK car
fleet with either type of system would be more than the benefits arising from the
reduction in injuries.
Instead, it is recommended that a further review should be carried out in 5 to 10
years time, when it seems likely that the majority of cars will be equipped with
reversing cameras or alerts as standard. If this happens, the costs of implementing
the measures will have reduced significantly, making their adoption across the whole
of the M1 fleet more attractive economically.
3.3.3 Mirror image quality
3.3.3.1 Proposed measure
From the research undertaken, it appears that drivers of N3 vehicles may not adjust
their mirrors correctly, although no quantitative data appears to be available on this.
Thus, even though the vehicle mirrors could potentially allow the driver to see the
minimum areas prescribed in the regulation, the full extent of these areas may not be
seen from the driver‟s seat. It is believed that the main reason for this is that the
driver is too busy to check or adjust the mirrors at the start of shift or does not know
how to do so correctly. However, there may also be cases where the driver is using
the mirror for a purpose other than that for which it is intended e.g. close
manoeuvring.
Difficulties in adjusting the mirrors may be problematic for drivers. For many LGVs
the mirrors are located too far above the ground to be reached without steps. Class II
and IV mirrors are often located too far forwards to be reached easily through the
driver‟s window. Even where access is possible, the nearside mirrors require the
driver to leave their seat to make the adjustment, and this may require some
backward and forward movement while the position of the mirror is checked and re-
adjusted.
There is a widely-held belief that the wide angle view of Class V and VI mirrors
makes it less important to set them correctly, and that once set they will offer an

The Development of Improvements to Phase 2 report Drivers‟ Direct and Indirect Vision from Vehicles S0906 / V8
Loughborough University / MIRA 32 March 2011
adequate view for a wide range of driver sizes and driving positions. Simulation work
in WP1 has shown that this is not so.
The technology for adjusting mirrors remotely is now quite common on M1 vehicles,
and is being offered as standard equipment on some N2 / N3 vehicles for the Class II
mirrors. However, the number of Class IV, V and VI mirrors incorporating electric
adjustment is currently very small.
The measure proposed is that all new N2 and N3 LGVs in the UK should be required
to be fitted with mirrors, including Class IV, Class V and Class VI, that are adjustable
from the driver‟s seat. In the case of Class II mirrors, most manufacturers already
have such mirrors available so it will only be necessary to offer them as standard,
rather than an option. However, they would face a greater obstacle in fitting Class V
and VI mirrors that are electrically adjustable. A market survey failed to find any
manufacturers who currently offer such mirrors so it would be necessary for them to
develop new products to meet this demand, even though the necessary actuators
already exist.
3.3.3.2 Costs
MIRA has conducted a survey of parts prices to estimate the additional cost of
electric Class V and VI mirrors over the equivalent manually adjustable mirrors, and
this would be approximately £50 per mirror to include switches, actuators and wiring.
Thus, for a LGV that currently has electrically adjustable Class II mirrors only, the
cost of full electrical adjustment would be £200, for two Class IV‟s, one Class V and
one Class VI.
3.3.3.3 Benefits
It is not possible at this stage to evaluate the benefits of the measure, because it was
not practical for the project to survey the proportion of vehicles on the road where the
mirrors are mal-adjusted to a dangerous extent, or to judge to what extent a particular
degree of mal-adjustment affects the accident risk. Furthermore, even if such mirrors
make adjustment easier, it is not known whether this will encourage drivers to adjust
them more frequently, without other measures such as publicity campaigns being put
in place. Therefore, it is not possible to make a case for whether the proposed
measure would be economic or not.

The Development of Improvements to Phase 2 report Drivers‟ Direct and Indirect Vision from Vehicles S0906 / V8
Loughborough University / MIRA 33 March 2011
3.3.3.4 Conclusion
Although it seems likely that there would be a reduction in the injuries arising in
vision-related accidents by requiring all mirrors on N2 and N3 vehicles to be
adjustable from the driver‟s seat, it is not possible to estimate how many injuries
would be saved by this measure. In addition, it is critical that drivers understand the
rationale for the defined visible area and are capable of adjusting mirrors to meet that
specification. The average cost of installing these on a LGV would be approximately
£200, but it is not known whether this would result in a positive overall balance of
benefit over cost.