The Coordination of Leaf Photosynthesis Links C and N Fluxes in C3 Plant Species
15
The Coordination of Leaf Photosynthesis Links C and N Fluxes in C 3 Plant Species Vincent Maire 1 *, Pierre Martre 2,3 , Jens Kattge 4 , Franc ¸ois Gastal 5 , Gerd Esser 6 , Se ´ bastien Fontaine 1 , Jean- Franc ¸ ois Soussana 1 * 1 INRA, UR874 UREP, Clermont-Ferrand, France, 2 INRA, UMR1095 GDEC, Clermont-Ferrand, France, 3 Blaise Pascal University, UMR1095 GDEC, Aubie `re, France, 4 Max Planck Institute for Biogeochemistry, Jena, Germany, 5 INRA, UR4 P3F, Lusignan, France, 6 Justus Liebig University, Institute for Plant Ecology, Giessen, Germany Abstract Photosynthetic capacity is one of the most sensitive parameters in vegetation models and its relationship to leaf nitrogen content links the carbon and nitrogen cycles. Process understanding for reliably predicting photosynthetic capacity is still missing. To advance this understanding we have tested across C 3 plant species the coordination hypothesis, which assumes nitrogen allocation to photosynthetic processes such that photosynthesis tends to be co-limited by ribulose-1,5- bisphosphate (RuBP) carboxylation and regeneration. The coordination hypothesis yields an analytical solution to predict photosynthetic capacity and calculate area-based leaf nitrogen content (N a ). The resulting model linking leaf photosynthesis, stomata conductance and nitrogen investment provides testable hypotheses about the physiological regulation of these processes. Based on a dataset of 293 observations for 31 species grown under a range of environmental conditions, we confirm the coordination hypothesis: under mean environmental conditions experienced by leaves during the preceding month, RuBP carboxylation equals RuBP regeneration. We identify three key parameters for photosynthetic coordination: specific leaf area and two photosynthetic traits (k 3 , which modulates N investment and is the ratio of RuBP carboxylation/oxygenation capacity (V Cmax ) to leaf photosynthetic N content (N pa ); and J fac , which modulates photosynthesis for a given k 3 and is the ratio of RuBP regeneration capacity (J max ) toV Cmax ). With species-specific parameter values of SLA, k 3 and J fac , our leaf photosynthesis coordination model accounts for 93% of the total variance in N a across species and environmental conditions. A calibration by plant functional type of k 3 and J fac still leads to accurate model prediction of N a , while SLA calibration is essentially required at species level. Observed variations in k 3 and J fac are partly explained by environmental and phylogenetic constraints, while SLA variation is partly explained by phylogeny. These results open a new avenue for predicting photosynthetic capacity and leaf nitrogen content in vegetation models. Citation: Maire V, Martre P, Kattge J, Gastal F, Esser G, et al. (2012) The Coordination of Leaf Photosynthesis Links C and N Fluxes in C 3 Plant Species. PLoS ONE 7(6): e38345. doi:10.1371/journal.pone.0038345 Editor: Ben Bond-Lamberty, DOE Pacific Northwest National Laboratory, United States of America Received December 27, 2011; Accepted May 3, 2012; Published June 7, 2012 Copyright: ß 2012 Maire et al. This is an open-access article distributed under the terms of the Creative Commons Attribution License, which permits unrestricted use, distribution, and reproduction in any medium, provided the original author and source are credited. Funding: This study contributes to the French ANR DISCOVER project (ANR-05-BDIV-010-01). VM was funded by a PhD grant of the French research ministry (MENRT). The funders had no role in study design, data collection and analysis, decision to publish, or preparation of the manuscript. Competing Interests: The authors have declared that no competing interests exist. * E-mail: [email protected] (JFS); [email protected] (VM) Introduction The response of leaf net photosynthesis to variations in light, temperature and CO 2 concentration has been successfully represented by the biochemical model of C 3 photosynthesis proposed by Farquhar, von Caemmerer and Berry [1]. This model has pioneered the mechanistic representation of the main biochemical processes of leaf photosynthesis, based on the assumption that photosynthesis is limited by either the carboxyl- ation/oxygenation of ribulose-1,5-bisphosphate (RuBP) by the enzyme ribulose 1?5-bisphosphate carboxylase/oxygenase (Ru- bisco; W c ), or the regeneration of RuBP by the electron transport chain (W j ). Maximum rates of these two processes are determined by carboxylation capacity (V Cmax ) and electron transport capacity (J max ). A strong correlation linearly links the variations of V Cmax and J max across species (e.g. [2]) and environmental conditions during plant growth (e.g. [3,4]). Since both capacities are measured independently, this result suggests that CO 2 assimilation is regulated in a coordinated manner by these two processes [5]. The variations of net photosynthesis with growth condition, season and species, are related to concurrent changes in leaf nitrogen content (N a ) and to the allocation of nitrogen between different protein pools [6]. V Cmax and J max linearly correlate with N a at both intra-and-interspecific levels [3,4,7]. Nevertheless, so far the relationship between V Cmax and J max and their link to N a are empirical correlations, their scatter is substantial, and a predictive process understanding C–N coupling at the leaf scale is still missing. As photosynthetic capacity is among the most influential parameters in current vegetation models [8], such an understand- ing is essential to predict photosynthesis at leaf, plant, stand and ecosystem scales under changing environmental conditions. Haxeltine and Prentice [9] suggested a general model for the light-use efficiency of primary production, which links photosyn- thetic capacity and N a . This model is based on the Farquhar’s model of photosynthesis and has been implemented in the global terrestrial vegetation model LPJ [10]. This approach does not account for N limitation and is based on the optimization theory that maximizes assimilation against incoming radiation. Until now, a clear understanding of leaf N variations along vegetative PLoS ONE | www.plosone.org 1 June 2012 | Volume 7 | Issue 6 | e38345
-
Upload
independent -
Category
Documents
-
view
0 -
download
0
Transcript of The Coordination of Leaf Photosynthesis Links C and N Fluxes in C3 Plant Species

The Coordination of Leaf Photosynthesis Links C and NFluxes in C3 Plant SpeciesVincent Maire1*, Pierre Martre2,3, Jens Kattge4, Francois Gastal5, Gerd Esser6, Sebastien Fontaine1, Jean-
Francois Soussana1*
1 INRA, UR874 UREP, Clermont-Ferrand, France, 2 INRA, UMR1095 GDEC, Clermont-Ferrand, France, 3 Blaise Pascal University, UMR1095 GDEC, Aubiere, France, 4 Max
Planck Institute for Biogeochemistry, Jena, Germany, 5 INRA, UR4 P3F, Lusignan, France, 6 Justus Liebig University, Institute for Plant Ecology, Giessen, Germany
Abstract
Photosynthetic capacity is one of the most sensitive parameters in vegetation models and its relationship to leaf nitrogencontent links the carbon and nitrogen cycles. Process understanding for reliably predicting photosynthetic capacity is stillmissing. To advance this understanding we have tested across C3 plant species the coordination hypothesis, which assumesnitrogen allocation to photosynthetic processes such that photosynthesis tends to be co-limited by ribulose-1,5-bisphosphate (RuBP) carboxylation and regeneration. The coordination hypothesis yields an analytical solution to predictphotosynthetic capacity and calculate area-based leaf nitrogen content (Na). The resulting model linking leafphotosynthesis, stomata conductance and nitrogen investment provides testable hypotheses about the physiologicalregulation of these processes. Based on a dataset of 293 observations for 31 species grown under a range of environmentalconditions, we confirm the coordination hypothesis: under mean environmental conditions experienced by leaves duringthe preceding month, RuBP carboxylation equals RuBP regeneration. We identify three key parameters for photosyntheticcoordination: specific leaf area and two photosynthetic traits (k3, which modulates N investment and is the ratio of RuBPcarboxylation/oxygenation capacity (VCmax
) to leaf photosynthetic N content (Npa); and Jfac, which modulatesphotosynthesis for a given k3 and is the ratio of RuBP regeneration capacity (Jmax) toVCmax
). With species-specificparameter values of SLA, k3 and Jfac, our leaf photosynthesis coordination model accounts for 93% of the total variance in Na
across species and environmental conditions. A calibration by plant functional type of k3 and Jfac still leads to accuratemodel prediction of Na, while SLA calibration is essentially required at species level. Observed variations in k3 and Jfac arepartly explained by environmental and phylogenetic constraints, while SLA variation is partly explained by phylogeny. Theseresults open a new avenue for predicting photosynthetic capacity and leaf nitrogen content in vegetation models.
Citation: Maire V, Martre P, Kattge J, Gastal F, Esser G, et al. (2012) The Coordination of Leaf Photosynthesis Links C and N Fluxes in C3 Plant Species. PLoSONE 7(6): e38345. doi:10.1371/journal.pone.0038345
Editor: Ben Bond-Lamberty, DOE Pacific Northwest National Laboratory, United States of America
Received December 27, 2011; Accepted May 3, 2012; Published June 7, 2012
Copyright: � 2012 Maire et al. This is an open-access article distributed under the terms of the Creative Commons Attribution License, which permitsunrestricted use, distribution, and reproduction in any medium, provided the original author and source are credited.
Funding: This study contributes to the French ANR DISCOVER project (ANR-05-BDIV-010-01). VM was funded by a PhD grant of the French research ministry(MENRT). The funders had no role in study design, data collection and analysis, decision to publish, or preparation of the manuscript.
Competing Interests: The authors have declared that no competing interests exist.
* E-mail: [email protected] (JFS); [email protected] (VM)
Introduction
The response of leaf net photosynthesis to variations in light,
temperature and CO2 concentration has been successfully
represented by the biochemical model of C3 photosynthesis
proposed by Farquhar, von Caemmerer and Berry [1]. This
model has pioneered the mechanistic representation of the main
biochemical processes of leaf photosynthesis, based on the
assumption that photosynthesis is limited by either the carboxyl-
ation/oxygenation of ribulose-1,5-bisphosphate (RuBP) by the
enzyme ribulose 1?5-bisphosphate carboxylase/oxygenase (Ru-
bisco; Wc), or the regeneration of RuBP by the electron transport
chain (Wj). Maximum rates of these two processes are determined
by carboxylation capacity (VCmax) and electron transport capacity
(Jmax). A strong correlation linearly links the variations of VCmax
and Jmax across species (e.g. [2]) and environmental conditions
during plant growth (e.g. [3,4]). Since both capacities are measured
independently, this result suggests that CO2 assimilation is
regulated in a coordinated manner by these two processes [5].
The variations of net photosynthesis with growth condition,
season and species, are related to concurrent changes in leaf
nitrogen content (Na) and to the allocation of nitrogen between
different protein pools [6]. VCmaxand Jmax linearly correlate with
Na at both intra-and-interspecific levels [3,4,7]. Nevertheless, so far
the relationship between VCmaxand Jmax and their link to Na are
empirical correlations, their scatter is substantial, and a predictive
process understanding C–N coupling at the leaf scale is still
missing. As photosynthetic capacity is among the most influential
parameters in current vegetation models [8], such an understand-
ing is essential to predict photosynthesis at leaf, plant, stand and
ecosystem scales under changing environmental conditions.
Haxeltine and Prentice [9] suggested a general model for the
light-use efficiency of primary production, which links photosyn-
thetic capacity and Na. This model is based on the Farquhar’s
model of photosynthesis and has been implemented in the global
terrestrial vegetation model LPJ [10]. This approach does not
account for N limitation and is based on the optimization theory
that maximizes assimilation against incoming radiation. Until
now, a clear understanding of leaf N variations along vegetative
PLoS ONE | www.plosone.org 1 June 2012 | Volume 7 | Issue 6 | e38345

canopies as well as across species and environments has not been
provided by the optimization theory [11,12]. For instance, all
reported studies observed N gradients less steep than predicted
with the optimization theory, suggesting that it likely overestimates
predicted C gain [13–18]. Moreover, there are several limitations
in optimization theory calculations (for a detailed discussion, see
[19]).
Chen et al. [20] proposed an alternative approach: the
coordination hypothesis of leaf photosynthesis. The basic assump-
tion of this approach is that VCmaxand Jmax are actively regulated
by plants in response to environmental conditions such that for
most representative conditions Wc equals Wj. The optimality
criterion in this context is not maximum C gain (as proposed in
[21–23]), but the balance of RuBP carboxylation and regenera-
tion, providing a coordinated allocation of resources, i.e. nitrogen,
to these two photosynthetic processes (Fig. S1). For vertical
gradients within canopies the co-limiting N content was shown to
increase with irradiance and to decline with temperature and with
atmospheric CO2 concentration [20]. In agreement with exper-
imental studies, the coordination hypothesis showed that N
distribution with canopy depth declines less than the light gradient
[13–18].
However, so far this co-limitation and its link to Na has been
considered only for vertical gradients within plant canopies, and
has not yet been studied and validated across plant species and
environmental conditions. This is possibly due to a lack of
appropriate data including environmental growth conditions and
photosynthetic parameters for a range of C3 plant species. In
addition, a full test of this hypothesis requires extending the
calculation of the co-limiting N content to account for the coupling
between leaf photosynthesis and stomatal conductance [3] as well
as ascribing leaf N to structural and metabolic pools [24,25].
In this study, we evaluate for the first time the coordination
hypothesis for sunlit leaves and its link to Na for a large range of
plant species grown under different environmental conditions. We
use an extended version of the Farquhar model of C3 photosyn-
thesis, a stomatal conductance model and a leaf N model to couple
C, N and water fluxes at the leaf scale (see equations and variables
in Tables 1–2). We apply this model to a dataset that includes leaf
and environmental characteristics during plant growth and gas
exchange measurements for a total of 31 C3 species (293
observations, Table S1). For each observation, plant characteris-
tics included the specific leaf area (SLA, m2 g21 DM), Na
(gN m22), and VCmaxand Jmax (mmol m22 s21) at reference
temperature and atmospheric CO2 concentration. The dataset
covers six plant functional types (PFTs) grown both under constant
and outdoors environments at a range of N and water supplies and
atmospheric CO2 concentrations.
In agreement with the half-life time of Rubisco [26], we
assumed that photosynthetic coordination varies with the mean
over one month of the environmental conditions during plant
growth. We tested the coordination hypothesis: i) by comparing
simulated Wc and Wj values for the measured Na, and ii) by
comparing simulated (Nac) and measured (Na) leaf N contents.
Second, thanks to a statistical model, we distinguished the plant
species and environmental conditions effects on leaf photosynthet-
ic traits. Third, we tested the implications of our leaf photosyn-
thesis coordination model for net C assimilation (An) and for
photosynthetic N use efficiency (PNUE) by varying plant photo-
synthetic traits and environmental growth conditions. Based on
these results, we discuss the applicability of the coordination
hypothesis to predict photosynthetic capacity and N content of
sunlit leaves at the ecosystem and global scales.
Methods
A Model Coupling Leaf N with CO2 and H2O FluxesSeveral formulations and parameterizations of the original
model by Farquhar et al. [1] have been described. Here, we refer
to the formulation and parameterization used by Wohlfahrt et al.
[3]. The net rate of C assimilation (An, mmol m22 s21) was limited
either by carboxylase activity of Rubisco (Wc, mmolCO2 m22 s21)
or by electron flux through the chloroplast photosystems (Wj,
mmolCO2 m22 s21) (see Eqn 3–4, 7 in Table 1). Their respective
capacity, VCmaxand Jmax, scaled with photosynthetic leaf N
content (Npa, gN m22) (Eqn 6, 9). The relationship between the
intracellular CO2 concentration (Ci, Pa) and the stomatal
conductance (gs, mmol m22 s21) was modeled according to Falge
et al. [27] (Eqn 14–17). gs can limit An and thereby modify the
linearity of the photosynthetic capacities vs Npa relationship [28].
An analytical method was used to couple An and gs, leading to the
calculation of An through a system of five equations and five
unknowns [29,30] (Eqn 17). The daytime temperature depen-
dence of VCmaxand Jmax was described following Medlyn et al.
[31] (Eqn 12). Some studies have shown from a large dataset that
the entropy terms of VCmaxand Jmax acclimate to the mean growth
temperature (Tg, K) experienced by leaves over the preceding
month [32]. The formalism and parameterization proposed by
these authors [32] was used in this study to describe the
acclimation of VCmaxand Jmax to Tg (Eqn 18–19). Similarly,
Ainsworth and Long [33] have shown an acclimation of An to
atmospheric CO2 concentration during the preceding month (Cg,
Pa). This was also taken into account (Eqn 20–21), by modifying
the relationship of Vcmax and Jmax at standard temperature (Jfac,
dimensionless) and the relationship of Vcmax at standard temper-
ature to Npa (k3, mmolCO2 g21 N s21) according to a linear
function of the difference between reference (Cra) and growth CO2
concentrations (Cg).
A sensitivity analysis of the photosynthesis-stomatal conduc-
tance model was performed by analyzing the range of parameter
variations in literature (Text S1, Table S2) and the sensitivity of
the model outputs in response to a 615% change in parameter
values (Text S1, Fig. S2–S3). An index of sensitivity (IOS) was
calculated as the ratio of output to parameter changes and was
used to discuss on the model uncertainties linked to model
calibration.
Coordinated N Content of Sunlit LeavesWithin leaves, N is partitioned between metabolic and structural
pools [24,25]. The coordinated leaf N content, Nac (gN m22) is
calculated as the sum of structural leaf N and of photosynthetic
leaf N (Npac, gN m22). As leaf structures are highly dependent
upon the biomass investment in dry matter (DM) [34], structural
leaf N (fns, gN g21 DM) is expressed per unit DM. fns is assumed
constant across species and independent of canopy depth and light
intensity. fns value corresponds to the average value reported in the
literature for a range of C3 species (0.012 gN g21 DM, for a
review see Lotscher et al. [25]). In contrast, metabolic leaf N
associated with leaf photosynthesis is expressed per unit area since
both light capture and CO2 exchange with atmosphere are
intrinsically area-based phenomena [3]. As a key measure of leaf
morphology [6], SLA links dry matter-based structural N content
(fns) to area-based photosynthetic N content (Npac):
Nac~Npaczfns=SLA ð1Þ
Coordination of Leaf Photosynthesis
PLoS ONE | www.plosone.org 2 June 2012 | Volume 7 | Issue 6 | e38345

Under given environmental conditions, Npac is defined as the
Npa value at which An was co-limited by Wc and Wj (Fig. S1). Both
VCmaxand Jmax are linear functions of Npa and, for given
environmental conditions, there is a single Npac value for which Wc
equals Wj. At this co-limiting point, Npac equals (see Text S2 Eqn
2a-2d for details):
Table 1. Equations of the photosynthesis - stomatal conductance models.
Process Equation Unit Eqn Ref.
Nitrogen sub-model
Leaf nitrogen content Nac~Npaczfns=SLA g N m22 1 2
Leaf photosynthetic N content
Npac~4:1a:PPFD
kac3
: Cizk2
4:Ciz8:C�ð Þ:WVcmax
� �2
{1
Jatcfac:WJmax
� �2 !1=2 g N m22 2 2
Photosynthetic sub-model
Net photosynthetic rate An~ 1{C�=Cið Þ:min Wc, Wj
� �{Rday mmol m22 s21 3 [1]
Rubisco limited photosynthetic rate through RuBPcarboxylation/oxygenation
Wc~rCmax
:WVcmax
: Ci
Cizk2
mmol m22 s21 4 [1]
Intermediate variable synthesising theRubisco affinity for CO2
k2~Kc:HKc
: 1zOi= KO:HKO
ð Þð Þ Pa 5 [1]
Maximum rate of carboxylation V rCmax
~kac3:Npa mmol m22 s21 6 [2]
RuBP regeneration limited photosyn2theticrate through electron transport
Wj~J:Ci
4:Ciz8:C�mmol m22 s21 7 [1]
Light dependence of electron transport rateJ~
4:a:PPFD
1z 4:a:PPFDð Þ2.
Jrmax
:WJmax
� �2� 1=2
mmol m22 s21 8 [1]
Potential RuBP regeneration rate Jrmax~Jatc
fac:V r
Cmaxmmol m22 s21 9 [2]
CO2 compensation point in the absence ofmitochondrial respiration
C�~0:5:Oi=t:HtPa 10 [1]
Leaf respiration without photorespiration Rday~Ifac:Rr
dark:HRdark
Rrdark~Rfac
:V rCmax
Ifac~0:5, if PPFDw25 mmol m{2 s{1
Ifac~c:PPFDzd, if PPFDƒ25 mmol m{2 s{1
mmol m22 s21 11 [27]
Temperature dependence of Jmax and Vcmax
W~ expDHa
R:T r: 1{
T r
TK
� � �:
1z expDSat:T r{DHd
R:T r
�
1z expDSat:TK{DHd
R:TK
�dimensionless 12 [31]
Temperature dependence of Kc, Ko, t and RdarkH~ exp
DHa
R:T r: 1{T r=TKð Þ
�dimensionless 13 [27]
Stomatal conductance sub-model
Stomatal conductance gs~gminzgfac: AnzIfac
:Rdarkð Þ:102:hs=Cs mmol m22 s21 14 [27]
CO2 partial pressure at the leaf boundary layer Cs~Ca{An:102
�gb Pa 15 [3]
Photosynthesis-stomata coupling
CO2 intercellular concentration Ci~Cs{An:1:6:102
�gs Pa 16 [29]
Analytical solution for photosynthesis calculationA~
a:Ci{a:d
e:Cizb{Rday
e:a:A3nzA2
n: e:bzb:hze:a:Rday{a:a� �
zAn: e:czb:
c
Ca
ze:b:Rdayzb:h:Rday{a:bza:d:h
� �
z e:c:Rdayzb:Rday: c
Ca{a:cza:d:
c
Ca
� �~0
a~gmin=gb{gfac:hs:102z1:6:102
b~Ca: gb
:gfac:hs{2:gmin{1:6:gbð Þ{Rday
:gfac:hs:102
c~Ca: Ca
:gmin:gb:10{2zRday
:gfac:gb:hs
� �h~gfac
:gb:hs{gmin
mmol m22 s21 17 [29]
Photosynthetic acclimation
DSatVcmax
~DSrVcmax
zp4: T r{Tg
� �DSat
Jmax~DSr
Jmaxzp4
: T r{Tg
� � Photosynthetic
acclimation to growth temperature
Jatfac~Jfaczp1
: T r{Tg
� �J K21 mol21 JK21 mol21
dimensionless
18a 18b19
[32]
Photosynthetic acclimation to CO2 concentration Jacfac~Jr
faczp2: Cr
a{Cg
� �kac
3 ~kr3zp3
: Cra{Cg
� �dimensionless
mmol g21 N s2120 21 [33]
doi:10.1371/journal.pone.0038345.t001
Coordination of Leaf Photosynthesis
PLoS ONE | www.plosone.org 3 June 2012 | Volume 7 | Issue 6 | e38345

Table 2. Parameters and variables of the photosynthesis - stomatal conductance models.
Symbol Value Unit Description
Parameters
C 20.02 m2 s mmol21 Slope of the linear relationship between Ifac and PPFD in the range 0–25 mmol m22 s21
Cra 35 Pa Reference atmospheric CO2 partial pressure
d 1 mmol CO2 m22 leaf s21 y-intercept of the linear relationship between Ifac and PPFD in the range from 0–25 mmol m22 s21
gb 300 mmol m22 s21 Leaf boundary layer conductance to water vapour
gfac 13.7 dimensionless Stomatal sensitivity coefficient
gmin 76.2 mmol m22 s21 Minimum stomatal conductance to water vapour
Ifac 0.5 dimensionless Coefficient representing the extent to which Rdark is inhibited in the light
Jrfac dimensionless Ratio between Jmax and VCmax
of plant grown at the reference temperature and at the reference CO2
partial pressure
kr3 mmol CO2 g21 N s21 Slope of linear relationship relating Npa to VCmax
at the reference temperature and at the referenceCO2 partial pressure
Kc 19.42 Pa Michaelis-Menten constant for carboxylase activity of Rubisco
Ko 14 300 Pa Michaelis-Menten constant for oxgenase activity of Rubisco
Oi 21 000 Pa Internal leaf oxygen concentration
p1 20.012 dimensionless Coefficient representing the extent to which Jfac is modified by the CO2 partial pressure during plantgrowth
p2 0.036 dimensionless Coefficient representing the extent to which Jfac is modified by the temperature during plant growth
p3 0.3192 mmol CO2 g21 N s21 Coefficient representing the effect of CO2 partial pressure during plant growth on k3
p4 0.94 dimensionless Coefficient representing the effect of growth temperature on entropy term for Jmax and VCmax
R 8.314 J K21 mol21 Perfect gas constant
Rfac 0.011 dimensionless Ratio between Rdark and VCmaxat reference temperature
SLA m2 leaf g21 DM Specific leaf area
a 0.05 mol CO2 mol21 photon Apparent quantum yield of net photosynthesis at saturating CO2
DHaJmax 83 608 J mol21 Activation energy of Jmax
DHaKc 65 800 J mol21 Activation energy of Kc
DHaKo 36 000 J mol21 Activation energy of Ko
DHaRdark 50 861 J mol21 Activation energy of Rdark
DHaVcmax 86 529 J mol21 Activation energy of VCmax
DHat 228 990 J mol21 Activation energy of t
DHd 200 000 J mol21 Deactivation energy
DSrJmax
660.42 J K21 mol21 Entropy term of Jmax for plant grown at reference temperature
DSrVcmax
654.24 J K21 mol21 Entropy term of VCmaxfor plant grown at reference temperature
t 2 838 dimensionless Rubisco specificity factor at reference temperature
Input Variables
Ca Pa CO2 partial pressure in the ambient air
Cg Pa Atmospheric CO2 partial pressure during preceding month of plant growth
hs dimensionless Leaf surface relative humidity
PPFD mmol m22 s21 Photosynthetic photon flux density
Tk K Air temperature. In our analysis Tk = Tg
Tg K Mean air temperature during preceding month of plant growth
Tr 293.16 K Reference temperature for metabolic activity
Output variables
An mmol m22 s21 Net photosynthesis
Ci Pa Internal CO2 partial pressure
Cs Pa Leaf surface CO2 partial pressure
gs mmol m22 s21 Stomatal conductance to water vapor
k2 Pa Intermediate variable synthesizing the Rubisco affinity for CO2
J mmol m22 s21 Light dependence of the rate of electron transport
Coordination of Leaf Photosynthesis
PLoS ONE | www.plosone.org 4 June 2012 | Volume 7 | Issue 6 | e38345

Npac~4:1a:PPFD
kac3
:
Cizk2
4:Ciz8:C�ð Þ:WVcmax
!2
{1
Jatcfac:WJmax
� �20@
1A
1=2 ð2Þ
where a (molCO2 mol21photon) is the apparent quantum yield of
An at saturating CO2, PPFD (mmol m22 s21) is the photosynthetic
photon flux density, kac3 (mmol CO2 g21N s21) is k3 acclimated to
Cg (Eqn 21), k2 (Pa) is an intermediate variable synthesizing the
Rubisco affinity for CO2 (Eqn 5), C* (Pa) is the CO2 compensation
point in the absence of mitochondrial respiration, Jatcfac is Jfac
acclimated to Cg and Tg (CO2 air concentration and temperature
during preceding month of plant growth, Eqn 19–20), and WVcmax
and WJmax(dimensionless) are the response functions of VCmax and
Jmax to temperature (Eqn 12). Overall, Npac integrates the
sensitivity of photosynthetic machinery to Tg, PPFD, Ci and hs.
DatasetA dataset was assembled from measurements and literature to
associate leaf photosynthetic traits of mature sunlit leaves with
environmental growth conditions (Dataset SI4). VCmaxand Jmax at
reference temperature (Tr = 20uC), Na, SLA, as well as Tg, PPFD,
hs and Cg during the month preceding leaf measurements were
included. VCmaxand Jmax values were standardized using a
consistent formulation and parameterization of C* and the
Michaelis-Menten constants for carboxylase (Kc, Pa) and oxygen-
ase (Ko, Pa) Rubisco activity [32,35].
The dataset has 293 entries from 31 C3 plant species covering
six plant functional types (PFTs): temperate broadleaved and
coniferous evergreen trees (PFT1), temperate broadleaved decid-
uous trees (PFT2), deciduous shrubs and herbs (PFT3), perennial
C3 grasses and forbs (PFT4), C3 crops (wheat, PFT5) and N-fixing
Table 2. Cont.
Symbol Value Unit Description
Jacfac dimensionless Jfac acclimated to CO2 during plant growth
Jatfac dimensionless Jfac acclimated to temperature during plant growth
Jatcfac dimensionless Jfac acclimated to CO2 and to temperature during plant growth
Jmax mmol m22 s21 Potential rate of RuBP regeneration
Jrmax mmol m22 s21 Potential rate of RuBP regeneration at reference temperature
k3 mmol CO2 g21 N s21 Slope of linear relationship relating Npa to VCmax
kac3 mmol CO2 g21 N s21 Slope of linear relationship relating Npa to VCmax
acclimated to CO2 during plant growth
Na g N m22 leaf Leaf N content per leaf area
Nac g N m22 leaf Leaf N content per leaf area when Wc equals Wj
Npa g N m22 leaf Leaf photosynthetic N content per leaf area
Npac g N m22 leaf Leaf photosynthetic N content per leaf area when Wc equals Wj
Rdark mmol m22 s21 Leaf dark respiration rate
Rrdark mmol m22 s21 Leaf dark respiration rate at reference temperature
Rday mmol m22 s21 Leaf respiration rate from processes other than photorespiration
VCmaxmmol m22 s21 Maximum carboxylation rate of Rubisco
V rCmax
mmol m22 s21 Maximum carboxylation rate of Rubisco at reference temperature in the absence of any deactivationas a result of high temperature
Wc mmol m22 s21 Rubisco-limited photosynthetic rate
Wj mmol m22 s21 RuBP regeneration limited photosynthetic rate through electron transport
W dimensionless Temperature dependence of Jmax or VCmax
WVcmaxdimensionless Temperature dependence of VCmax
WJmaxdimensionless Temperature dependence of Jmax
H dimensionless Temperature dependence of Kc, Ko, t, or Rdark
HKcdimensionless Temperature dependence of Kc
HKodimensionless Temperature dependence of Ko
Ht dimensionless Temperature dependence of t
HRdarkdimensionless Temperature dependence of Rdark
C* dimensionless CO2 compensation point in the absence of mitochondrial respiration
DSat J K21 mol21 Entropy term acclimated to temperature during plant growth
DSatJmax
J K21 mol21 Entropy term of Jmax acclimated to temperature during plant growth
DSatVcmax
J K21 mol21 Entropy term of VCmaxacclimated to temperature during plant growth
Parameter values are derived from Wohlfahrt et al. [3–4].doi:10.1371/journal.pone.0038345.t002
Coordination of Leaf Photosynthesis
PLoS ONE | www.plosone.org 5 June 2012 | Volume 7 | Issue 6 | e38345

trees (PFT6). The final dataset covers a wide range of plant growth
conditions: Tg (ranging from 7.1 to 21.0uC), PPFD (500 to
1170 mmol m22 s21), hs (0.51 to 0.89) and Cg (36 and 60 Pa).
However, data corresponding to severe drought and/or to very
low N availability during growth were excluded from the dataset.
Four categories of inorganic N availability (low, medium, high and
very high), two categories of soil moisture and of atmospheric CO2
concentration (ambient and elevated) and six categories of
experimental set-up (climate chamber, sunlit climate chamber,
botanical garden, natural vegetation, free air CO2 enrichment
(FACE) and open top chambers) were defined. The dataset has
been made available via the TRY initiative on plant traits [36].
Data AnalysisCoordinated Wc and Wj. The basic assumption of the
coordination hypothesis is that under the environmental condi-
tions to which a leaf is adapted, RuBP carboxylation equals RuBP
regeneration (Wc = Wj). Here we tested this for the average daily
plant growth conditions (excluding night values) during the last
month preceding photosynthesis measurements. We used four
environmental variables (Cg, PPFD, Tg and hs) corresponding to
the average plant growth conditions as model input, and VCmaxand
Jmax derived from separate photosynthesis measurements on the
same plants. A single set of values was used for all other 33 model
parameters and was originated from Wohlfahrt’s calibration
(Table 2) [3,4]. Wc and Wj, both predicted for the average plant
growth conditions for each observation (n = 293), were compared
by least square linear regression. Regression residuals were
analyzed using a general linear model (GLM) with Tg, hs, Cg
and with PFTs and N categories. PFTs and N levels were
compared by the post ANOVA Tukey’s HSD method.
Prediction of the coordinated leaf N content. Nac was
calculated for each observation (n = 293) using four environmen-
tal variables (Cg, PPFD, Tg and hs) corresponding to the growth
conditions of the past month and three leaf traits (k3, Jfac and SLA).
k3 is calculated as the ratio between VCmaxand Npa, while Jfac is
calculated as the ratio between Jmax and VCmax. The prediction of
Nac was evaluated by the relative root mean squared error
(RRMSE), which is the relative average of the squared differences
between predicted and observed values [37]. RRMSE values
lower than 0.2 indicates here acceptable errors. Systematic
(RRMSES) and unsystematic (RRMSEU) errors [37] specified
the error source of RRMSE (Eq. I).
RRMSES~Xn
i~1
EEi{Mi
� �2
,n
" #0:5
: 1�MM
with EEi~b:Miza
RRMSEU~Xn
i~1
Ei{EEi
� �2
,n
" #0:5
: 1�MM
ðIÞ
where Ei and Mi are the predicted and measured values of the
observation i, �MMi is the average of Mi and EEi is an estimate of Ei
deriving from the linear regression between Ei and Mi.
Dependence of leaf photosynthetic parameters on plant
functional type (PFT). ANOVA followed by LSD method for
mean comparison tests, were used to analyze the role of PFT for
the estimation of leaf photosynthetic traits used in the test of the
coordination hypothesis (VCmax, Jmax, k3, Jfac and SLA). In order to
test if the calibration of leaf photosynthetic traits can be simplified
to obtain a unique value or a value by PFT, we estimated
independent values of k3, Jfac and SLA traits minimizing the
squared differences between Na and Nac (Newton’s optimization
method). Mean and optimized values per PFT were then
compared by linear regressions. The calibration of leaf traits by
species was not tested since the number of observations per species
was too variable in our dataset.
Dependence of leaf photosynthetic parameters on
environmental growth conditions. Multiple regression mod-
els were used to analyze the effects of environmental growth
conditions (Tg, PPFD, hs and Cg, N and soil moisture categories) on
leaf traits (VCmax, Jmax, k3, Jfac and SLA). For regression models of
k3 and Jfac, the values of dependent variables were log-transformed
and all residuals followed a normal distribution.
We tested if the prediction of leaf photosynthetic traits by
environmental growth conditions was robust and validated
likewise the coordination hypothesis. We conducted bootstrap
analyses to predict Wc and Wj as a function of VCmaxand Jmax
estimated by an independent regression model and environmental
growth conditions. In the same way, bootstrap analyses were
conducted to predict Nac as a function of estimated k3 and Jfac. To
do so, two-thirds of the 293 observations were randomly used to
parameterize the multiple regression models (20 random sets,
Tables S3–S4). These models were used to predict the leaf
photosynthetic parameters VCmax, Jmax, k3 and Jfac of the
remaining observations from their environmental growth condi-
tions. As SLA was not predictable from environmental growth
conditions (see in result the low coefficient of determination in SLA
regression model), experimental specific values were used. Finally,
Wc, Wj and Nac were calculated and the coordination hypothesis
was evaluated again (Tables S5–S6).
We also attempted to falsify the testable hypothesis (Wc = Wj
and Na = Nac) provided by the photosynthetic coordination
hypothesis. To this end, we randomized environmental growth
conditions among observations (permutation test) and tested the
alternative hypothesis significant differences between Wc and Wj
and between Na and Nac.
Prediction from our leaf photosynthesis coordination
model. The implications of the coordination hypothesis for
Nac, An and PNUE were tested by varying: i) the values of the leaf
parameters k3 and Jfac under mean environmental growth
conditions (PPFD = 666 mmol m22 s21, Tg = 16.9uC, hs = 0.74);
ii) the values of the environmental growth parameters Tg and
PPFD assuming mean leaf photosynthetic parameter values
(k3 = 59.1 mmol g21Npa s21; Jfac = 2.45;
SLA = 17.7 m2 kg21 DM).
All statistical tests were performed using Statgraphics Plus (v.
4.1, Manugistics, USA).
Results
Leaf Photosynthesis Shows Co-limitation Under MeanGrowth Conditions
We assessed the level of photosynthetic co-limitation by
comparing dark (Wc) to light-driven (Wj) biochemical processes
under growth conditions experienced by the leaves in the month
prior to observations. Wc strongly correlated with Wj (Fig. 1A,
n = 293, P,0.001, intercept not significantly different from zero)
across species and growth environments (characterized by Tg,
PPFD, hs and Cg). An ANOVA on the regression residuals revealed
a significant PFT effect (d.f. = 5, 283; P,0.001; data not shown).
The calculated Wc/Wj ratio was not significantly different from
one (t-test at P,0.05, n = 293). This ratio varied neither with
species parameters, nor with environmental growth conditions.
Coordination of Leaf Photosynthesis
PLoS ONE | www.plosone.org 6 June 2012 | Volume 7 | Issue 6 | e38345

Predicted Coordinated Leaf N Content (Nac) MatchesObserved Leaf N Content (Na)
Overall, predicted and observed Na values were closely
correlated with a slope not significantly different from one and
an intercept not significantly different from zero (Fig. 1B, n = 293,
P,0.001, RRMSE = 0.12). The breakdown of RRMSE into
unsystematic and systematic error terms showed that the
prediction error was mostly unsystematic and therefore associated
to data and not to a systematic model error (RRMSEs = 0.012;
RRMSEu = 0.108). An ANOVA on the residuals of the prediction
showed weak but significant effects of PFTs, Tg and hs (d.f. = 5, 1,
1, respectively; P,0.01; data not shown).
As fns was assumed constant across species [25], we calculated
Npa and Npac by subtracting the ratio fns/SLA to Na and Nac,
respectively. Similarly, predicted and observed Npa values were
closely correlated (Fig. 1C, n = 293, P,0.001, RRMSE = 0.21).
Figure 1. Tests of the coordination hypothesis using experimental values of leaf photosynthetic traits (Vcmax, Jmax, Jfac, k3 and SLA).A) Relationship between the predicted rates of RuBP carboxylation/oxygenation (Wc) and RuBP regeneration (Wj) under plant growth conditions. B)Relationship between predicted (Nac) and observed (Na) leaf N content. Na was calculated as the sum of the leaf photosynthetic and structural Ncontents. Leaf photosynthetic N content was predicted using Eqn 2 with the species-specific parameters k3 and Jfac. C) Relationship betweenpredicted (Npac) and observed (Npa) photosynthetic leaf N content. D) Relationship between predicted and observed leaf C/N ratio. A common leafstructural N content was used (fns = 0.012 gN g21 DM). Solid lines are the regressions. Short-dashed and long-dashed lines indicate the confidence(at 95%) and prediction intervals, respectively. The insert in Fig. 1B shows the same relationship without the very high observed Na values for thePFT1. ***, P,0.001.doi:10.1371/journal.pone.0038345.g001
Coordination of Leaf Photosynthesis
PLoS ONE | www.plosone.org 7 June 2012 | Volume 7 | Issue 6 | e38345

As carbon content in leaves was assumed to be approximately
constant, we calculated a C/N ratio by dividing Na and Nac by the
ratio between a common carbon content (fcs = 0.45 gC g21 DM;
[36,38]) and SLA. Predicted C/N matched significantly the
calculated C/N, observed across environmental conditions and
across species and PFTs (Fig. 1D).
Dependency of Leaf Parameters on Plant Functional TypeIn the dataset (Table S1), the parameters used to calculate
leaf photosynthesis and stomatal conductance were SLA, Jfac, k3,
calculated from VCmax, Jmax and leaf N measurements (Eqn 12,
15). At Tr, VCmaxand Jmax varied between 4–141 mmol m22 s21
and 8–213 mmol m22 s21, respectively. k3 varied from 4.6 to
350 mmol g21N s21 while Jfac values were very constrained
from 1.69 to 3.71, as already observed [2]. Finally, SLA varied
from 1.5 to 43.2 m2 kg21 DM. All photosynthetic traits showed
significant dependency to PFT (P,0.001) but with different
determination coefficient (r2 = 0.66, 0.64, 0.24, 0.47 and 0.40
for VCmax, Jmax, k3, Jfac and SLA, respectively). Post-ANOVA
LSD tests showed that the discrimination among the PFTs was
more effective for Jfac, Jmax and SLA separating significantly
four groups among the six PFTs (Table S7) and was much
weaker for k3 and VCmax(two groups were significantly
distinguished).
k3, Jfac and SLA can be optimized to a value which minimizes
the squared differences between Na and Nac (Table 3A). When k3
was optimized by PFT, Na was accurately predicted (slope = 0.96,
r2 = 0.73, RRMSE = 0.23). When a single value was used for the
whole dataset, Na prediction was not satisfactory. The optimization
by PFT of Jfac led to a strong prediction of Na (slope not different
from one, r2 = 0.79, RRMSE = 0.23). When a single value was
used for the entire dataset (Jfac = 2.11), the prediction of Na was
less accurate but the slope of the relationship between Wc and Wj
remained close to one. Finally, the optimisation of SLA by PFT or
to a single value for the entire dataset strongly reduced the
accuracy of Na prediction. Optimization of the k3 and Jfac
parameters showed that Na can be acceptably predicted when their
values are defined by PFT. For all traits, average values by PFT
and optimized values by PFT displayed significant linear
relationships (Table 3B).
Table 3. Estimates of the optimized value (for the entire dataset and by PFT) of leaf photosynthetic traits (Jfac, k3 and SLA).
A) Optimized value Wc/Wj Na/Nac
Parameter Slope r2 Slope r2 RRMSE
k3
All 48.3 1.1560.02 0.78 0.9460.02 0.64 0.28
PFT 45.2; 37.1; 54.0; 79.4; 46.2; 24.2 1.0860.02 0.88 0.9660.02 0.73 0.23
Jfac
All 2.11 1.0660.02 0.89 0.9760.02 0.68 0.31
PFT 2.11; 2.11; 2.59; 1.70; 2.33; 3.10 1.0460.02 0.92 1.0260.02 0.79 0.23
SLA
All 17.7 1.0260.02 0.92. 0.8860.02 0.43 0.44
PFT 8.1; 13.7; 18.2; 20.0; 18.3; 13.4 1.0260.02 0.92. 0.9660.02 0.48 0.37
k3 and Jfac
All k3 = 48.3; Jfac = 2.11 1.1860.02 0.79 0.8960.02 0.68 0.33
PFT k3 = 45.2; 37.1; 54.0; 79.4; 46.2; 24.2 Jfac = 2.11; 2.11;2.59; 1.70; 2.33; 3.10
1.0660.02 0.88 0.9660.02 0.74 0.26
B) k3 Jfac SLA
PFT Mean Optimized Mean Optimized Mean Optimized
PFT1 65.0 45.2 2.23 2.11 11.1 8.1
PFT2 46.6 37.1 2.32 2.11 13.1 13.7
PFT3 90.1 54.0 2.53 2.59 21.4 18.2
PFT4 86.1 79.4 2.04 1.7 22.0 20.0
PFT5 44.9 46.2 2.69 2.33 18.3 18.3
PFT6 38.1 24.2 2.50 3.1 20.3 13.4
Correlation r2 = 0.68 P,0.001 r2 = 0.49 P,0.001 r2 = 0.68 P,0.001
The squared difference between measured Na and predicted Nac values were minimized by Newton’s method. A) The optimization was done with one trait at a timewithout changing the values of the two other traits. The optimized values are ordered by PFT (i.e. the first value corresponds to PFT1). B) The optimized values by PFTwere compared to mean per PFT in the dataset by using a linear regression model. Abbreviations: PFT1, temperate broadleaved and coniferous evergreen trees; PFT2,temperate broadleaved deciduous trees; PFT3, deciduous shrubs and herbs; PFT4, perennial C3 grasses and forbs; PFT5, C3 crops (wheat); PFT6, N-fixing trees.doi:10.1371/journal.pone.0038345.t003
Coordination of Leaf Photosynthesis
PLoS ONE | www.plosone.org 8 June 2012 | Volume 7 | Issue 6 | e38345
Dependency of Leaf Parameters to EnvironmentalGrowth Conditions
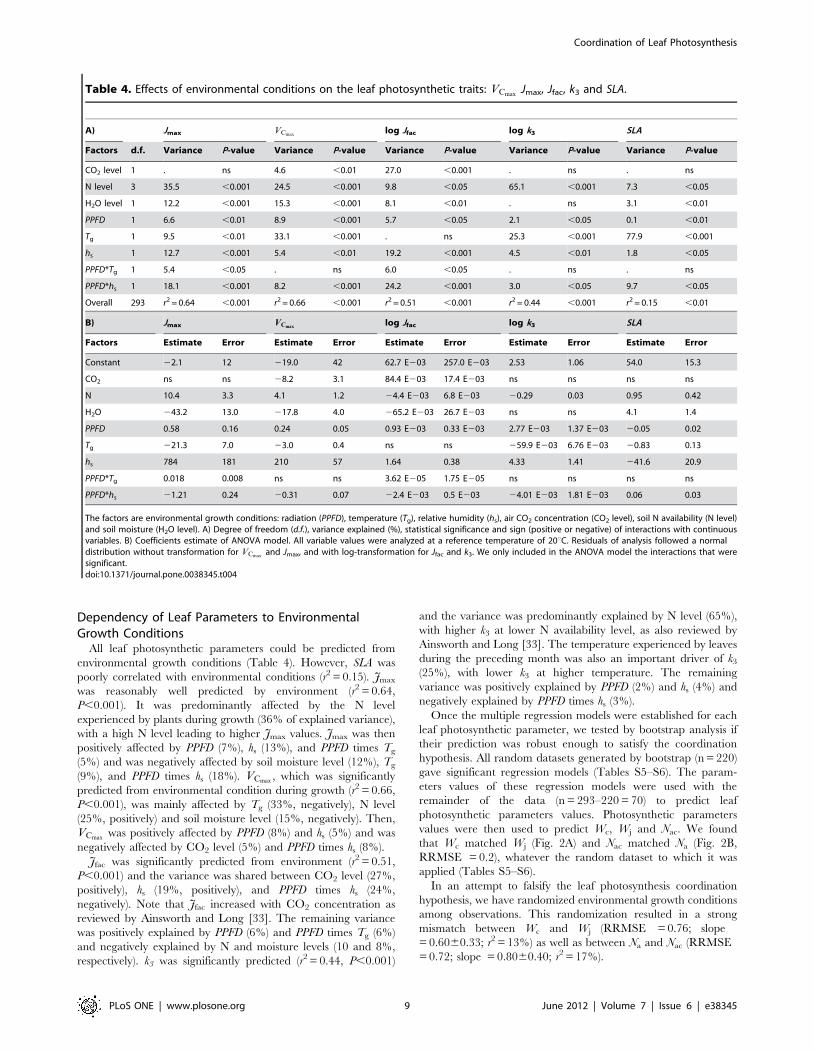
All leaf photosynthetic parameters could be predicted from
environmental growth conditions (Table 4). However, SLA was
poorly correlated with environmental conditions (r2 = 0.15). Jmax
was reasonably well predicted by environment (r2 = 0.64,
P,0.001). It was predominantly affected by the N level
experienced by plants during growth (36% of explained variance),
with a high N level leading to higher Jmax values. Jmax was then
positively affected by PPFD (7%), hs (13%), and PPFD times Tg
(5%) and was negatively affected by soil moisture level (12%), Tg
(9%), and PPFD times hs (18%). VCmax, which was significantly
predicted from environmental condition during growth (r2 = 0.66,
P,0.001), was mainly affected by Tg (33%, negatively), N level
(25%, positively) and soil moisture level (15%, negatively). Then,
VCmaxwas positively affected by PPFD (8%) and hs (5%) and was
negatively affected by CO2 level (5%) and PPFD times hs (8%).
Jfac was significantly predicted from environment (r2 = 0.51,
P,0.001) and the variance was shared between CO2 level (27%,
positively), hs (19%, positively), and PPFD times hs (24%,
negatively). Note that Jfac increased with CO2 concentration as
reviewed by Ainsworth and Long [33]. The remaining variance
was positively explained by PPFD (6%) and PPFD times Tg (6%)
and negatively explained by N and moisture levels (10 and 8%,
respectively). k3 was significantly predicted (r2 = 0.44, P,0.001)
and the variance was predominantly explained by N level (65%),
with higher k3 at lower N availability level, as also reviewed by
Ainsworth and Long [33]. The temperature experienced by leaves
during the preceding month was also an important driver of k3
(25%), with lower k3 at higher temperature. The remaining
variance was positively explained by PPFD (2%) and hs (4%) and
negatively explained by PPFD times hs (3%).
Once the multiple regression models were established for each
leaf photosynthetic parameter, we tested by bootstrap analysis if
their prediction was robust enough to satisfy the coordination
hypothesis. All random datasets generated by bootstrap (n = 220)
gave significant regression models (Tables S5–S6). The param-
eters values of these regression models were used with the
remainder of the data (n = 293–220 = 70) to predict leaf
photosynthetic parameters values. Photosynthetic parameters
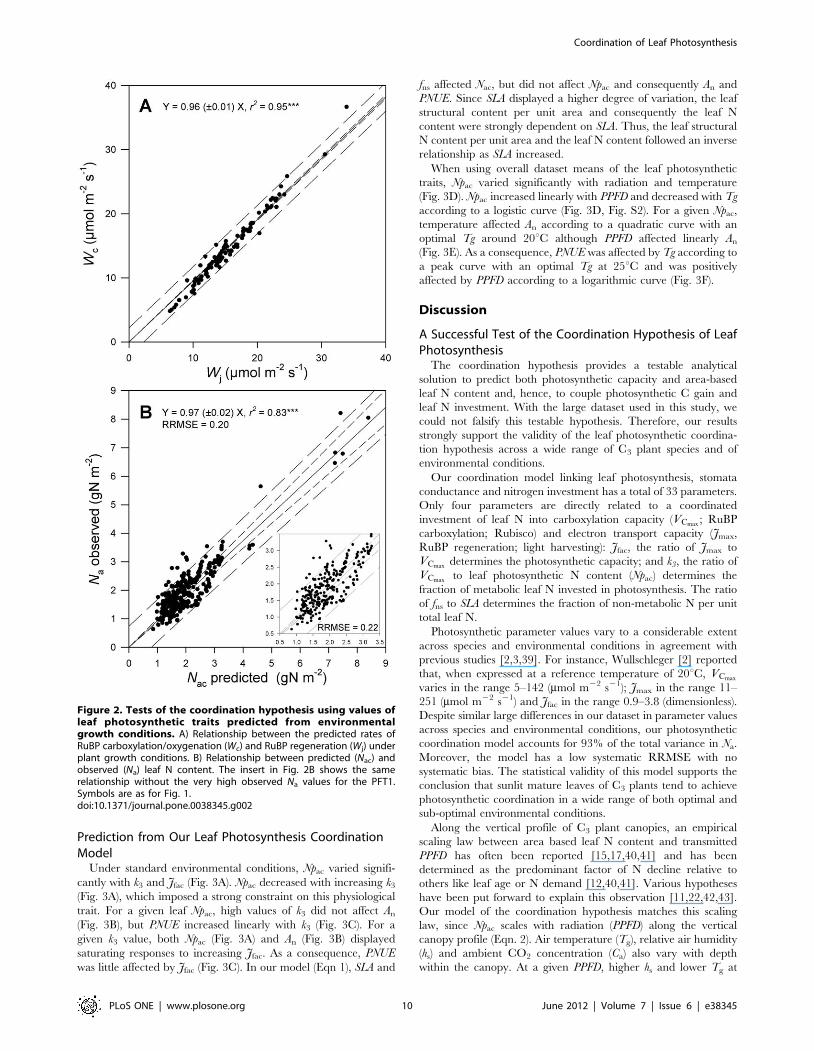
values were then used to predict Wc, Wj and Nac. We found
that Wc matched Wj (Fig. 2A) and Nac matched Na (Fig. 2B,
RRMSE = 0.2), whatever the random dataset to which it was
applied (Tables S5–S6).
In an attempt to falsify the leaf photosynthesis coordination
hypothesis, we have randomized environmental growth conditions
among observations. This randomization resulted in a strong
mismatch between Wc and Wj (RRMSE = 0.76; slope
= 0.6060.33; r2 = 13%) as well as between Na and Nac (RRMSE
= 0.72; slope = 0.8060.40; r2 = 17%).
Table 4. Effects of environmental conditions on the leaf photosynthetic traits: VCmaxJmax, Jfac, k3 and SLA.
A) Jmax VCmaxlog Jfac log k3 SLA
Factors d.f. Variance P-value Variance P-value Variance P-value Variance P-value Variance P-value
CO2 level 1 . ns 4.6 ,0.01 27.0 ,0.001 . ns . ns
N level 3 35.5 ,0.001 24.5 ,0.001 9.8 ,0.05 65.1 ,0.001 7.3 ,0.05
H2O level 1 12.2 ,0.001 15.3 ,0.001 8.1 ,0.01 . ns 3.1 ,0.01
PPFD 1 6.6 ,0.01 8.9 ,0.001 5.7 ,0.05 2.1 ,0.05 0.1 ,0.01
Tg 1 9.5 ,0.01 33.1 ,0.001 . ns 25.3 ,0.001 77.9 ,0.001
hs 1 12.7 ,0.001 5.4 ,0.01 19.2 ,0.001 4.5 ,0.01 1.8 ,0.05
PPFD*Tg 1 5.4 ,0.05 . ns 6.0 ,0.05 . ns . ns
PPFD*hs 1 18.1 ,0.001 8.2 ,0.001 24.2 ,0.001 3.0 ,0.05 9.7 ,0.05
Overall 293 r2 = 0.64 ,0.001 r2 = 0.66 ,0.001 r2 = 0.51 ,0.001 r2 = 0.44 ,0.001 r2 = 0.15 ,0.01
B) Jmax VCmaxlog Jfac log k3 SLA
Factors Estimate Error Estimate Error Estimate Error Estimate Error Estimate Error
Constant 22.1 12 219.0 42 62.7 E203 257.0 E203 2.53 1.06 54.0 15.3
CO2 ns ns 28.2 3.1 84.4 E203 17.4 E203 ns ns ns ns
N 10.4 3.3 4.1 1.2 24.4 E203 6.8 E203 20.29 0.03 0.95 0.42
H2O 243.2 13.0 217.8 4.0 265.2 E203 26.7 E203 ns ns 4.1 1.4
PPFD 0.58 0.16 0.24 0.05 0.93 E203 0.33 E203 2.77 E203 1.37 E203 20.05 0.02
Tg 221.3 7.0 23.0 0.4 ns ns 259.9 E203 6.76 E203 20.83 0.13
hs 784 181 210 57 1.64 0.38 4.33 1.41 241.6 20.9
PPFD*Tg 0.018 0.008 ns ns 3.62 E205 1.75 E205 ns ns ns ns
PPFD*hs 21.21 0.24 20.31 0.07 22.4 E203 0.5 E203 24.01 E203 1.81 E203 0.06 0.03
The factors are environmental growth conditions: radiation (PPFD), temperature (Tg), relative humidity (hs), air CO2 concentration (CO2 level), soil N availability (N level)and soil moisture (H2O level). A) Degree of freedom (d.f.), variance explained (%), statistical significance and sign (positive or negative) of interactions with continuousvariables. B) Coefficients estimate of ANOVA model. All variable values were analyzed at a reference temperature of 20uC. Residuals of analysis followed a normaldistribution without transformation for VCmax
and Jmax, and with log-transformation for Jfac and k3. We only included in the ANOVA model the interactions that weresignificant.doi:10.1371/journal.pone.0038345.t004
Coordination of Leaf Photosynthesis
PLoS ONE | www.plosone.org 9 June 2012 | Volume 7 | Issue 6 | e38345
Prediction from Our Leaf Photosynthesis CoordinationModel
Under standard environmental conditions, Npac varied signifi-
cantly with k3 and Jfac (Fig. 3A). Npac decreased with increasing k3
(Fig. 3A), which imposed a strong constraint on this physiological
trait. For a given leaf Npac, high values of k3 did not affect An
(Fig. 3B), but PNUE increased linearly with k3 (Fig. 3C). For a
given k3 value, both Npac (Fig. 3A) and An (Fig. 3B) displayed
saturating responses to increasing Jfac. As a consequence, PNUE
was little affected by Jfac (Fig. 3C). In our model (Eqn 1), SLA and
fns affected Nac, but did not affect Npac and consequently An and
PNUE. Since SLA displayed a higher degree of variation, the leaf
structural content per unit area and consequently the leaf N
content were strongly dependent on SLA. Thus, the leaf structural
N content per unit area and the leaf N content followed an inverse
relationship as SLA increased.
When using overall dataset means of the leaf photosynthetic
traits, Npac varied significantly with radiation and temperature
(Fig. 3D). Npac increased linearly with PPFD and decreased with Tg
according to a logistic curve (Fig. 3D, Fig. S2). For a given Npac,
temperature affected An according to a quadratic curve with an
optimal Tg around 20uC although PPFD affected linearly An
(Fig. 3E). As a consequence, PNUE was affected by Tg according to
a peak curve with an optimal Tg at 25uC and was positively
affected by PPFD according to a logarithmic curve (Fig. 3F).
Discussion
A Successful Test of the Coordination Hypothesis of LeafPhotosynthesis
The coordination hypothesis provides a testable analytical
solution to predict both photosynthetic capacity and area-based
leaf N content and, hence, to couple photosynthetic C gain and
leaf N investment. With the large dataset used in this study, we
could not falsify this testable hypothesis. Therefore, our results
strongly support the validity of the leaf photosynthetic coordina-
tion hypothesis across a wide range of C3 plant species and of
environmental conditions.
Our coordination model linking leaf photosynthesis, stomata
conductance and nitrogen investment has a total of 33 parameters.
Only four parameters are directly related to a coordinated
investment of leaf N into carboxylation capacity (VCmax; RuBP
carboxylation; Rubisco) and electron transport capacity (Jmax,
RuBP regeneration; light harvesting): Jfac, the ratio of Jmax to
VCmaxdetermines the photosynthetic capacity; and k3, the ratio of
VCmaxto leaf photosynthetic N content (Npac) determines the
fraction of metabolic leaf N invested in photosynthesis. The ratio
of fns to SLA determines the fraction of non-metabolic N per unit
total leaf N.
Photosynthetic parameter values vary to a considerable extent
across species and environmental conditions in agreement with
previous studies [2,3,39]. For instance, Wullschleger [2] reported
that, when expressed at a reference temperature of 20uC, VCmax
varies in the range 5–142 (mmol m22 s21); Jmax in the range 11–
251 (mmol m22 s21) and Jfac in the range 0.9–3.8 (dimensionless).
Despite similar large differences in our dataset in parameter values
across species and environmental conditions, our photosynthetic
coordination model accounts for 93% of the total variance in Na.
Moreover, the model has a low systematic RRMSE with no
systematic bias. The statistical validity of this model supports the
conclusion that sunlit mature leaves of C3 plants tend to achieve
photosynthetic coordination in a wide range of both optimal and
sub-optimal environmental conditions.
Along the vertical profile of C3 plant canopies, an empirical
scaling law between area based leaf N content and transmitted
PPFD has often been reported [15,17,40,41] and has been
determined as the predominant factor of N decline relative to
others like leaf age or N demand [12,40,41]. Various hypotheses
have been put forward to explain this observation [11,22,42,43].
Our model of the coordination hypothesis matches this scaling
law, since Npac scales with radiation (PPFD) along the vertical
canopy profile (Eqn. 2). Air temperature (Tg), relative air humidity
(hs) and ambient CO2 concentration (Ca) also vary with depth
within the canopy. At a given PPFD, higher hs and lower Tg at
Figure 2. Tests of the coordination hypothesis using values ofleaf photosynthetic traits predicted from environmentalgrowth conditions. A) Relationship between the predicted rates ofRuBP carboxylation/oxygenation (Wc) and RuBP regeneration (Wj) underplant growth conditions. B) Relationship between predicted (Nac) andobserved (Na) leaf N content. The insert in Fig. 2B shows the samerelationship without the very high observed Na values for the PFT1.Symbols are as for Fig. 1.doi:10.1371/journal.pone.0038345.g002
Coordination of Leaf Photosynthesis
PLoS ONE | www.plosone.org 10 June 2012 | Volume 7 | Issue 6 | e38345
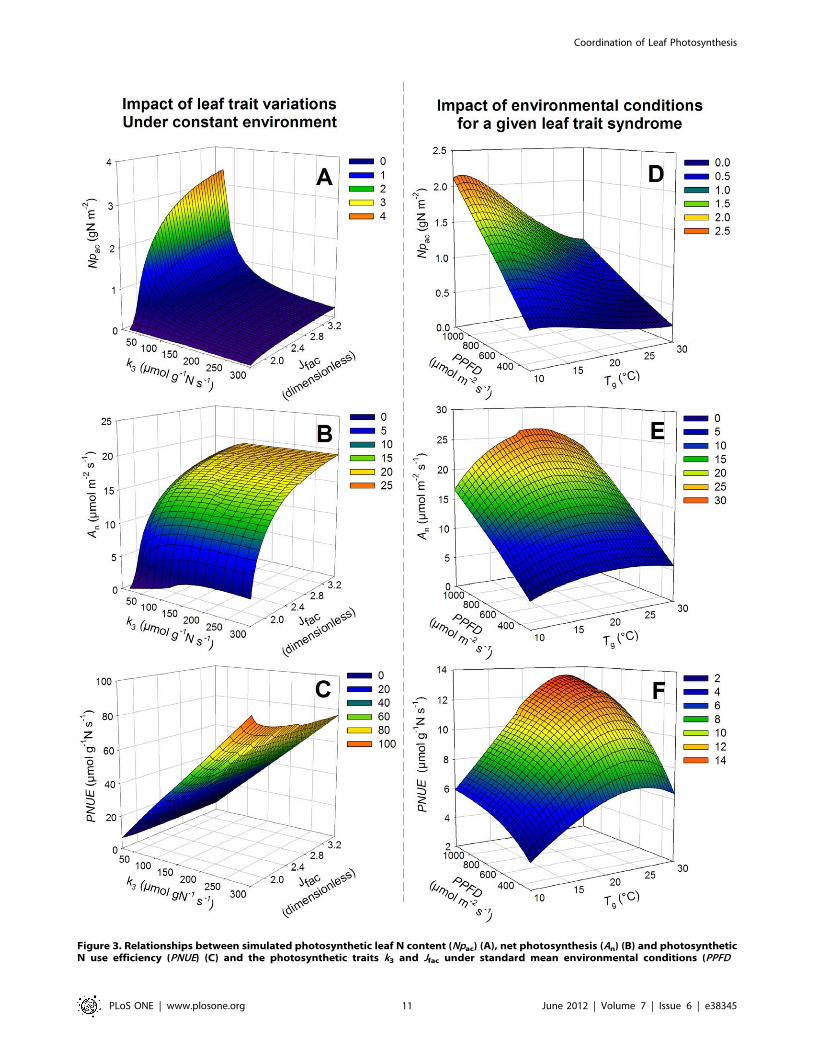
Figure 3. Relationships between simulated photosynthetic leaf N content (Npac) (A), net photosynthesis (An) (B) and photosyntheticN use efficiency (PNUE) (C) and the photosynthetic traits k3 and Jfac under standard mean environmental conditions (PPFD
Coordination of Leaf Photosynthesis
PLoS ONE | www.plosone.org 11 June 2012 | Volume 7 | Issue 6 | e38345

depth would reduce Npac, while a lower Ca would increase it. For
some crop species like wheat, N limitation has been reported to
accelerate the decline in Na with PPFD [25,40,41], which may
indicate preferential N allocation to leaves in full light, resulting in
preferential photosynthetic coordination of these leaves despite N
limitation.
Variations in photosynthetic N protein contents (Npac) appear to
be an overwhelming determinant of Na. In contrast, structural leaf
N (fns) values varied only within a narrow range [38], when they
were optimized by species or by PFT (from 0.0107 to
0.0135 gN g21 DM for wheat and N-fixing trees, respectively,
corresponding to 0.61 and 0.78 gN m22 leaf when SLA is set to
17.6 m2 kg21 DM, dataset mean). Although optimized fns values
showed little variations on a leaf dry mass basis, it accounted for
15–50% of Na (gN m22), across all species in the dataset due to the
strong variation in SLA across all species. Structural N is found in
cell walls (1.6–9.5% of leaf N in Polygonum cupsidatum and 40–60%
for sclerophyllous tree, shrub and vine species, [34,44]) and in
nucleic acids (10–15%, [45]). In addition, other non-photosyn-
thetic nitrogenous compounds (e.g. cytosolic proteins, amino acids,
ribosomes and mitochondria) contribute to the structural leaf N
pool [46]. Several experimental studies have attempted to estimate
fns, reporting values between 0.0101 and 0.0136 gN g21 DM for a
range of herbaceous C3 species [16]. These fns values are in the
same range as those found for dead leaves after N resorption at
senescence [47]. Structural N would therefore not be redistributed
by this process [48].
Determinism of Leaf N Content VariationGenetic and environmental factors have long been recognized
to interact in determining the Amax vs. leaf N relationship [5]. Our
study provides a means for disentangling: i) the direct environ-
mental effects on leaf photosynthetic N content (Npac); ii) the role
of photosynthetic parameters for Npac in a given environment; and
iii) the response of photosynthetic parameters i.e. the plant
acclimation to plant growth environment.
First, for a given set of plant parameters, positive effects of
radiation and negative effects of air temperature, air relative
humidity and CO2 concentration on Npac are predicted by Eqn 2
(Fig. 3D–F). These results are in accordance with the prediction by
Farquhar et al’s canopy photosynthesis model [49], which links
stomatal control with leaf area and leaf N content by optimizing
both water and nitrogen use efficiency and predicts an increase of
leaf N content and VCmaxwith mean radiation increase [24,50] and
mean annual rainfall [49,51]. According to the coordination
hypothesis, changes in Npac affect both biochemical photosynthesis
capacities, VCmaxand Jmax. Indeed, seasonal variations in VCmax
and
Jmax have been observed for a number of plant species [52,53] and
were related to changes in Rubisco and cytochrome-f contents in
Polygonum cuspidatum [54]. Including photosynthetic capacity (VCmax
and Amax) and its relationship to leaf N content in terrestrial
biosphere models resulted in substantial changes in gross primary
productivity with latitude [7]. Coupled environmental variations
in PPFD, TK, hs and Ca simultaneously affect Npac throughout
time, which has major implications for gross primary productivity
and PNUE of a given species or genotype.
Second, the coordination hypothesis implies that under a given
environment, Na tends toward a unique coordinated Nac value
(Eqn 2). As shown by the analysis of model sensitivity to
parameters and input variables (Text S1, Fig. S3), k3 and Jfac
are among the most important determinants of Nac value.
Assuming a single average value of k3 and of Jfac for all species
in the dataset would increase Na RRMSE by 50% (Table 3A).
However, using a single Jfac value by PFT with species-specific k3
and SLA values provided a strong accuracy for Na prediction. This
result is consistent with the strong linear relationship between
VCmaxand Jmax reported by Wullschleger [2] among 109 species,
which probably indicates a phylogenetic constraint for Jfac. Under
given environmental conditions, our results show that there is no
single combination of k3 and Jfac that can maximize both An and
PNUE (Fig. 3A–C). Therefore, variable combinations of these
photosynthetic traits could be equally relevant. This relative
independency of k3 and Jfac suggests that these functional traits
(sensu [55]) correspond to possibly overlooked axes of differenti-
ation among C3 plant species. k3, which modulates the N
investment at a given An, could be related to a plant strategy of
nutrients conservation [56]. Jfac, which increases An for a given k3,
could be related to a plant strategy of nutrients exploitation.
However, the lack of correlation between these two photosynthetic
traits and SLA, which is a key morphological trait separating
exploitative and conservative species strategies for nutrient use
[56], suggests that these physiological traits form a secondary axis
of differentiation across C3 species.
Third, some environmental growth conditions such as PPFD,
Tg, hs, Ca and N availability had significant effects on k3 and Jfac.
The increase in k3 at low N availability tends to reduce Npac and,
hence, N demand for leaf construction thereby increasing PNUE.
The increase in k3 with PPFD tends to compensate for the direct
positive effect of PPFD on Npac, thereby lowering N demand for
leaf construction under high light environments. Similarly, the
decrease of k3 with Tg mitigates the direct negative effect of
temperature on Npac, thereby equalizing the N demand for a range
of temperature. Mostly independently from changes in k3 (since
these two traits are not correlated across plant species), Jfac
increases with Ca, in agreement with the lower decline under
elevated CO2 of Jmax compared to VCmax[33]. Moreover, Jfac is
negatively related to PPFD, which is in good agreement with the
higher allocation of leaf N to chlorophyll observed in low PPFD
acclimation experiments [57]. Like the increase in k3, the decrease
in Jfac with PPFD tends to compensate for the direct positive effect
of PPFD on Npac, especially for species with low k3 value. Finally,
the effect of temperature on Jfac is not significant which is in
agreement with previous studies that reports constant Jfac with
temperature (e.g. [33]).
Uncertainties in the Calculation of the Coordinated LeafPhotosynthetic N Content
Our model takes into account the two main biochemical
processes controlling leaf photosynthesis as well as the biophysical
= 666 mmol m22 s21, Tg = 16.96C, hs = 0.74). k3 is the ratio between VCmaxand Npa. Jfac is the ratio between Jmax and VCmax
. A mesh of k3 valuesvarying between 10 and 300 mmol g21 N s21 with 20 steps and of Jfac values varying between 1.75 and 3.5 with 0.05 steps was used. Figures D–E–F,relationships between (Npac) (D), net photosynthesis (An) (E) and photosynthetic N use efficiency (PNUE) (F) and the radiation (PPFD) and temperature(Tg) conditions during growth. Averages over the dataset of leaf photosynthetic parameters (k3, Jfac and SLA) are used (k3 = 59.1 mmol g21 Npa s21,Jfac = 2.45, SLA = 17.7 m2 kg21 DM). The mesh for temperature is 0.5uC between 10 and 30uC and the mesh for radiation is 50 mmol m22 s21
between 300 and 1200 mmol m22 s21. The values of hs and Tg were fixed at 0.8 and 20uC, respectively. An was calculated with the coordinated leafprotein content and PNUE was calculated as the ratio between An and Npac.doi:10.1371/journal.pone.0038345.g003
Coordination of Leaf Photosynthesis
PLoS ONE | www.plosone.org 12 June 2012 | Volume 7 | Issue 6 | e38345

process controlling stomatal conductance. Recently, leaf mesophyll
conductance has also been identified as an important biophysical
limitation of photosynthesis [58–60], particularly for species with
low SLA by decreasing VCmaxmore than Jmax [61,62] and
particularly during plant acclimation to water stress condition
[58,59]. Applying mesophyll conductance in our model would first
require recalculating VCmaxparameter from a non-rectangular
hyperbola of the An-Ci curve and with a new set of Rubisco kinetic
constants, for example [58]. Moreover, it would also require the
incorporation in our model of the CO2 diffusion mechanism
between intercellular and chloroplast spaces according to a
mesophyll conductance parameter [59,60]. Furthermore, the
coupling between An and gs leading to the calculation of An would
require solving a new system of equations and unknowns. Finally,
this would require additional mesophyll conductance data, which
were not available in our dataset. The inclusion of a variable
mesophyll conductance [61,62], as well as of other mechanisms
implied in plant responses to water deficits [63], would allow
testing the photosynthetic coordination hypothesis under severe
abiotic stress conditions. With the coordination model reported
here that does not include these processes, Na values are lower
than Nac values under more severe abiotic stress conditions (data
not shown).
The calculation of Npac relies on a number of plant parameter
and environmental variables, leading to further uncertainties (see
Text S1, Table S2 and Fig. S2–S3 for full details). Apart from SLA,
k3 and Jfac, all plant parameters were assumed to have a single set
of values across the entire dataset (Table 2). Since the photosyn-
thetic model was shown to be little sensitive to most of these
parameters (Text S1, Fig. S3), using species-specific values would
only marginally increase the accuracy of Na prediction.
ImplicationsOverall, our study confirms the basic assumption of the
coordination hypothesis: leaves coordinate the development of
VCmaxand Jmax such that Wc equals Wj. This opens opportunities
to couple C and N at a global scale by incorporating the
coordination hypothesis into dynamic global vegetation models
(DGVMs). However, the applicability of this hypothesis for
improved prediction of photosynthetic capacity and leaf nitrogen
content depends on the accuracy at which we can determine key
parameters of the combined photosynthesis - stomatal conduc-
tance – leaf N model as well as the timescale of plant regulatory
photosynthesis mechanisms. The two key parameters Jfac and k3
seem to be predictable from a combination of environmental
growth conditions - probably due to the strong dependence of the
development of the photosynthetic machinery on environment
variables – and information about plant growth form or PFT.
However, the morphological trait SLA does not seems to be
predictable with sufficient accuracy from environmental condi-
tions which is consistent with the large functional diversity found
in a given environment [64]. SLA needs to be defined at least by
PFT and preferably by species. This study thus confirms the
relevance of leaf morphology, represented by SLA, in photosyn-
thesis, which has been pointed out before, (e.g. [56]). However, SLA
is one of the best-studied plant traits worldwide (e.g. [36]) and it
may be possible to determine SLA with sufficient accuracy for a
large range of C3 species. Finally, although the turnover of
photosynthetic enzymes like Rubisco can be seen as very
constrained within the C3 plant kingdom, to our knowledge there
is no study that investigates its variability across species. We
therefore stress the need for further comparative research
quantifying the variability of photosynthetic enzyme turnover
across C3 species. Further tests of the coordination hypothesis will
require, during plant growth, coupled measurements of microcli-
mate, of leaf gas exchanges and of photosynthetic traits, including
the dynamics of Rubisco, within the canopy [65].
ConclusionThis study bridges a gap concerning the coupling of C and N
fluxes in C3 plant species. It confirms the basic assumption of the
leaf photosynthesis coordination hypothesis and demonstrates that
this hypothesis can be successfully applied across species and PFTs
and under a wide range of climates. Moreover, we have shown
that k3 and Jfac in combination with SLA are major plant
functional traits, which reflect plant adaptation to light, temper-
ature and N availability during growth. Surprisingly, few studies
provide both leaf photosynthetic parameters and environmental
conditions during plant growth. Improved datasets combining the
k3 and Jfac photosynthetic traits with the SLA morphological trait
are needed to further increase our understanding of leaf economics
(C–N stœchiometry) and plant strategies. The leaf photosynthesis
coordination model reported here has been successfully used in a
patch scale grassland vegetation model [66,67]. Further applica-
tions include modeling at regional and global scales the role of
plant diversity for the carbon and nitrogen cycles.
Supporting Information
Figure S1 Details on the leaf photosynthesis coordina-tion hypothesis. Variation of leaf carboxylation rates with leaf
nitrogen content for three levels of radiations (A–C). According to
the leaf photosynthesis coordination theory, a leaf photosynthetic
N content is determined as colimiting the carboxylation/
oxygenation of ribulose-1,5-bisphosphate (RuBP) by the enzyme
ribulose 1?5-bisphosphate carboxylase/oxygenase (Rubisco; Wc),
and the regeneration of RuBP by the electron transport chain (Wj).
Below Npac, the photosynthesis will be limited by the Rubisco
activity and therefore by the amount of leaf proteins. Beyond Npac,
the marginal gain of photosynthesis per unit of leaf proteins is
weak. Along the vertical canopy profile, Npac declines with
transmitted radiation when all other variables are equal.
(TIF)
Figure S2 Mean temperature functions of the maximumrates of carboxylation (VCmax
) and electron transport(Jmax) and their ratio (WJmax
/WVcmax). Functions were calcu-
lated using the parameters related to temperature sensitivity
(activation and deactivation enthalpies and entropy) as calibrated
by Kattge & Knorr (2007) for many species (48 species for VCmax,
32 for Jmax and 29 for their ratio). The error bars correspond to
the standard errors among species representing the inter-specific
variability.
(TIF)
Figure S3 Sensitivity analysis of the photosynthesis-stomatal conductance model. Following Felix & Xanthoulis
(2005), a sensitivity analysis of the models calibrated for Dactylis
glomerata with common one-to-one variation of parameters
(615%). Output variables are shown as lines, parameters as
columns. The sensitivity index (IOS) was calculated as the
maximal ratio of output variation to parameter variation during
a climatic scenario (air temperature, PPFD, hs and Ca) recorded
from an upland site in central France (Theix, 45u439N, 03u019E,
870 m) for years 2003–2004. Color tones indicate sensitivity index
(positive, red; negative, blue).
(TIF)
Table S1 Dataset used for the validation of leafphotosynthesis coordination. The excel file includes the leaf
Coordination of Leaf Photosynthesis
PLoS ONE | www.plosone.org 13 June 2012 | Volume 7 | Issue 6 | e38345

photosynthetic parameters and the environmental growth condi-
tions used to calculate Wc, Wj and Nac.
(XLS)
Table S2 Range of the observed values among literatureof the parameters used in the leaf photosynthesis –stomatal conductance model. The categories were the
minimum, the maximum, the median and the percentage of
variation of parameters range. The sources of observations were
also reported. The sources, where the minimum and maximum
values were observed, were annotated with – and +. A reference
temperature of 20uC was used.
(DOC)
Table S3 Multiple regression analyses of Vcmax and Jmax
from environmental growth conditions for the bootstrapanalysis. Independent variables: X1: air CO2 concentration (Cg);
X2: N level; X3: soil H2O level; X4: radiation (PPFD); X5: air
growth temperature (Tg); X6: air relative humidity (hs). The
number of observations was 236.
(DOC)
Table S4 Multiple regression analyses of k3 and Jfac
from environmental growth conditions for a bootstrapanalysis. Independent variables were the same as Table S3. The
number of observations was 236.
(DOC)
Table S5 Prediction of Wc and Wj (mmol m22 s21) inusing the parameters Vcmax and Jmax calculated fromregression analyses on the independent part of thedataset in a bootstrap analysis (Table S3). Characteristics
of the Wc/Wj relationship. The intercepts of regression for each
PFT were set to zero (since there were not significantly different
from zero) to estimate the slopes. RRMSE: relative root mean
square error.
(DOC)
Table S6 Prediction of Nac in using the parameters k3
and Jfac calculated from the regression analyses on the
independent part of the dataset in a bootstrap analysis(Table S4). Characteristics of the relationship between predicted
and observed leaf N content (Nac/Na, gN m22). The intercepts of
regression for each PFT were set to zero (since there were not
significantly different from zero) to estimate the slopes. Abbrevi-
ation: RRMSES and RRMSEU are systematic and unsystematic
relative root mean square error, respectively.
(DOC)
Table S7 Dependence of leaf photosynthetic parame-ters on plant functional type (PFT). ANOVA model and
mean comparison test by LSD method of the PFT effect on leaf
photosynthetic traits used in the test of coordination hypothesis
(VCmax, Jmax, k3, Jfac and SLA). The values of k3 and Jfac were log-
transformed and all residuals followed a normal distribution. For a
given variable, PFTs with the same letter belong to the same
group.
(DOC)
Text S1 Sensitivity analysis of the photosynthesis –stomatal conductance model.
(DOC)
Text S2 Demonstration of the formalism of the coordi-nated leaf photosynthetic N content.
(DOC)
Acknowledgments
Authors thank V. Allard, N. Gross, J. Schymanski, N. Viovy and P. Ciais
for constructive comments on a previous version of the manuscript.
Author Contributions
Conceived and designed the experiments: JFS VM. Analyzed the data: VM
PM JK JFS. Wrote the paper: VM PM JK JFS. Assembled the data: JK
VM PM FG GE. Provided model development and statistical methods:
VM. Commented on the manuscript: GE SF FG.
References
1. Farquhar GD, Caemmerer Sv, Berry JA (1980) A biochemical model of
photosynthetic CO2 assimilation in leaves of C3 species. Planta 149: 78–90.
2. Wullschleger SD (1993) Biochemical limitations to carbon assimilation in C3
plants - A retrospective analysis of the A/Ci curves from 109 species. J Exp Bot44: 907–920.
3. Wohlfahrt G, Bahn M, Horak I, Tappeiner U, Cernusca A (1998) A nitrogen
sensitive model of leaf carbon dioxide and water vapour gas exchange:application to 13 key species from differently managed mountain grassland
ecosystems. Ecol Model 113: 179–199.
4. Wohlfahrt G, Bahn M, Haubner E, Horak I, Michaeler W, et al. (1999) Inter-
specific variation of the biochemical limitation to photosynthesis and related leaftraits of 30 species from mountain grassland ecosystems under different land use.
Plant Cell Environ 22: 1281–1296.
5. Field CB, Mooney HA (1986) The photosynthesis-nitrogen relationship in wild
plants. In: On the economy of plant form and function (ed T.J. Givnish), 25–55.Cambridge University Press, Cambridge.
6. Niinemets U, Tenhunen JD (1997) A model separating leaf structural and
physiological effects on carbon gain along light gradients for the shade-tolerantspecies Acer saccharum. Plant Cell Environ 20: 845–866.
7. Kattge J, Knorr W, Raddatz T, Wirth C (2009) Quantifying photosyntheticcapacity and its relationship to leaf nitrogen content for global-scale terrestrial
biosphere models. Global Change Biol 15: 4 976–991.
8. Zaehle S, Sitch S, Smith B, Hatterman F (2005) Effects of parameteruncertainties on the modeling of terrestrial biosphere dynamics. Global
Biogeochem Cycles 19: 1–16.
9. Haxeltine A, Prentice IC (1996) A general model for the light-use efficiency of
primary production. Funct Ecol 10: 551–561.
10. Sitch S, Smith B, Prentice IC, Arneth A, Bondeau A, et al. (2003) Evaluation ofecosystem dynamics, plant geography and terrestrial carbon cycling in the LPJ
dynamic global vegetation model. Global Change Biol 9: 161–185.
11. Kull O (2002) Acclimation of photosynthesis in canopies: models and limitations.
Oecologia 133(3): 267–279.
12. Bertheloot J, Martre P, Andrieu B (2008) Dynamics of light and nitrogen
distribution during grain filling within wheat canopy. Plant Physiol 148: 1707–1720.
13. Dreccer MF, Van Oijen M, Schapendonk A, Pot CS, Rabbinge R (2000)
Dynamics of vertical leaf nitrogen distribution in a vegetative wheat canopy.Impact on canopy photosynthesis. Ann Bot 86: 821–831.
14. Dreccer MF, Slafer GA, Rabbinge R (1998) Optimization of vertical distribution
of canopy nitrogen: an alternative trait to increase yield potential in wintercereals. J Crop Prod 1: 47–77.
15. Werger MJA, Hirose T (1991) Leaf nitrogen distribution and whole canopy
photosynthetic carbon gain in herbaceous stands. Vegetatio 97: 11–20.
16. Schieving F, Pons TL, Werger MJA, Hirose T (1992) The vertical distribution ofnitrogen and photosynthetic activity at different plant densities in Carex
acutiformis. Plant Soil 142: 9–17.
17. Rousseaux MC, Hall AJ, Sanchez RA (1999) Light environment, nitrogencontent, and carbon balance of basal leaves of sunflower canopies. Crop Sci 39:
1093–1100.
18. Johnson IR, Thornley JHM, Frantz JM, Bugbee B (2010) A model of canopyphotosynthesis incorporating protein distribution through the canopy and its
acclimation to light, temperature and CO2. Ann Bot 106: 735–749.
19. Reynolds JF, Chen JL (1996) Modelling whole-plant allocation in relation to
carbon and nitrogen supply: Coordination versus optimization: Opinion. PlantSoil 185: 65–74.
20. Chen JL, Reynolds JF, Harley PC, Tenhunen JD (1993) Coordination theory of
leaf nitrogen distribution in a canopy. Oecologia 93: 63–69.
21. Field CB (1983) Allocating leaf nitrogen for the maximisation of carbon gain:
leaf age as a control of the allocation program. Oecologia 56: 341–347.
22. Hirose T, Werger MJA (1987) Maximizing daily canopy photosynthesis with
respect to the leaf nitrogen allocation pattern in the canopy. Oecologia 72: 520–526.
23. Medlyn BE (1996) The optimal allocation of nitrogen within the C3
photosynthetic system at elevated CO2. Aust J Plant Physiol 23: 593–603.
Coordination of Leaf Photosynthesis
PLoS ONE | www.plosone.org 14 June 2012 | Volume 7 | Issue 6 | e38345
24. Evans JR (1989) Photosynthesis and nitrogen relationships in leaves of C3 plants.
Oecologia 78: 9–19.25. Lotscher M, Stroh K, Schnyder H (2003) Vertical leaf nitrogen distribution in
relation to nitrogen status in grassland plants. Ann Bot 92: 679–688.
26. Suzuki Y, Makino A, Mae T (2001) Changes in the turnover of Rubisco andlevels of mRNAs of rbcL and rbcS in rice leaves from emergence to senescence.
Plant Cell Environ 24: 1353–1360.27. Falge E, Graber W, Siegwolf R, Tenhunen JD (1996) A model of the gas
exchange response of Picea abies to habitat conditions. Trees-Structure Function
10: 277–287.28. Wong SC, Cowan IR, Farquhar GD (1979) Stomatal conductance correlates
with photosynthetic capacity. Nature 282: 424–426.29. Baldocchi D (1994) An analytical solution for coupled leaf photosynthesis and
stomatal conductance models. Tree Physiol 14: 1069–1079.30. Press WH (1992) Numerical Recipes. (Cambridge University Press, New York).
31. Medlyn BE, Dreyer E, Ellsworth D, Forstreuter M, Harley PC, et al. (2002)
Temperature response of parameters of a biochemically based model ofphotosynthesis. II. A review of experimental data. Plant Cell Environ 25: 1167–
1179.32. Kattge J, Knorr W (2007) Temperature acclimation in a biochemical model of
photosynthesis: a reanalysis of data from 36 species. Plant Cell Environ 30:
1176–1190.33. Ainsworth EA, Long SP (2005) What have we learned from 15 years of free-air
CO2 enrichment (FACE)? A meta-analytic review of the responses ofphotosynthesis, canopy. New Phytol 165: 351–371.
34. Onoda Y, Hikosaka K, Hirose T (2004) Allocation of nitrogen to cell wallsdecreases photosynthetic nitrogen-use efficiency. Funct Ecol 18: 419–425.
35. Bernacchi CJ, Pimentel C, Long SP (2003) In vivo temperature response
functions of parameters required to model RuBP-limited photosynthesis. PlantCell Environ 26(9): 1419–1430.
36. Kattge J, Dıaz S, Lavorel S, Prentice IC, Leadley P, et al. (2011) TRY – a globaldataset of plant traits. Global Change Biol 17: 2905–2935.
37. Willmott CJ (1982) Some comments on the evaluation of model performance.
Bull Am Meteorol Soc 63: 1309–1313.38. Maire V (2009) From functional traits of grasses to the functioning of grassland
ecosystem: a mechanistic modeling approach. PhD dissertation, Blaise PascalUniversity, Clermont-Ferrand, France, 300p.
39. Thompson WA, Kriedemann PE, Craig IE (1992) Photosynthetic response tolight and nutrients in sun-tolerant and shade-tolerant rain-forest trees.1. Growth,
leaf anatomy and nutrient content. Aust J Plant Physiol 19(1): 1–18.
40. Hikosaka K, Terashima I, Katoh S (1994) Effects of leaf age, nitrogen nutritionand photon flux-density on the distribution of nitrogen among leaves of a Vine
(Ipomoea-Tricolor-Cav) grown horizontally to avoid mutual shading of leaves.Oecologia 97(4): 451–457.
41. Hikosaka K (1996) Effects of leaf age, nitrogen nutrition and photon flux density
on the organization of the photosynthetic apparatus in leaves of a vine (Ipomoea
tricolor Cav) grown horizontally to avoid mutual shading of leaves. Planta 198(1):
144–150.42. Schieving F, Poorter H (1999) Carbon gain in a multispecies canopy : the role of
specific leaf area and photosynthetic nitrogen-use efficiency in the tragedy of thecommons. New Phytol 143(1): 201–211.
43. Terashima I, Araya T, Miyazawa S, Sone K, Yano S (2005) Construction and
maintenance of the optimal photosynthetic systems of the leaf, herbaceous plantand tree: an eco-developmental treatise. Ann Bot 95(3): 507–519.
44. Harrison MT, Edwards EJ, Farquhar GD, Nicotra AB, Evans JR (2009)Nitrogen in cell walls of sclerophyllous leaves accounts for little of the variation
in photosynthetic nitrogen-use efficiency. Plant Cell Environ 32: 259–270.
45. Hirose T, Werger MJA, Rheenen JWAv (1989) Canopy development and leafnitrogen distribution in a stand of Carex acutiformis. Ecology 70: 1610–1618.
46. Evans JR, Seemann JR (1989) The allocation of protein nitrogen in thephotosynthetic apparatus: costs, consequences, and control. In: Photosynthesis
(ed W.R. Briggs), 183–205. Liss, New York.
47. Hirose T, Werger MJA, Pons TL, Van Rheenen JWA (1988) Canopy structureand leaf nitrogen distribution in a stand of Lysimachia vulgaris L. as influenced by
stand density. Oecologia 77: 145–150.
48. Lemaire G, Gastal F (1997) N uptake and distribution in plant canopies. In
‘Diagnosis on the nitrogen status in crops’, Ed. G. Lemaire, Springer-Verlag,Heidelberg, 3–43.
49. Farquhar GD, Buckley TN, Miller JM (2002) Optimal stomatal control inrelation to leaf area and nitrogen content. Silva Fenn 36: 625–637.
50. Caemmerer Sv, Farquhar GD (1984) Effects of partial defoliation, changes ofirradiance during growth, short-term water-stress and growth at enhanced
p(CO2) on the photosynthetic capacity of leaves of Phaseolus-vulgaris L. Planta
160: 320–329.
51. Mooney HA, Ferrar PJ, Slatyer RO (1978) Photosynthetic capacity and carbon
allocation patterns in diverse growth forms of Eucalyptus. Oecologia 36: 103–111.
52. Wilson KB, Baldocchi DD, Hanson PJ (2000) Spatial and seasonal variability ofphotosynthetic parameters and their relationship to leaf nitrogen in a deciduous
forest. Tree Physiol 20: 565–578.
53. Misson L, Tu KP, Boniello RA, Goldstein AH (2006) Seasonality of
photosynthetic parameters in a multi-specific and vertically complex forestecosystem in the Sierra Nevada of California. Tree Physiol 26: 729–741.
54. Onoda Y, Hikosaka K, Hirose T (2005) Seasonal change in the balance betweencapacities of RuBP carboxylation and RuBP regeneration affects CO2 response
of photosynthesis in Polygonum cuspidatum. J Exp Bot 56: 755–763.
55. Lavorel S, McIntyre S, Landsberg J, Forbes TDA (1997) Plant functionalclassifications: from general groups to specific groups based on response to
disturbance. Trends Ecol Evol 12: 474–478.
56. Wright IJ, Reich PB, Westoby M, Ackerly DD, Baruch Z, et al. (2004) The
worldwide leaf economics spectrum. Nature 428: 821–827.
57. Evans JR, Poorter H (2001) Photosynthetic acclimation of plants to growth
irradiance: the relative importance of specific leaf area and nitrogen partitioningin maximizing carbon gain. Plant Cell Environ 24: 755–767.
58. Ethier GJ, Livingston NJ (2004) On the need to incorporate sensitivity to CO2
transfer conductance into the Farquhar-von Caemmerer-Berry leaf photosyn-
thesis model. Plant Cell Environ 27: 137–153.
59. Flexas J, Loreto F, Niinemets U, Sharkey TD (2009) Preface: Mesophyll
conductance. J Exp Bot 60: 2215–2216.
60. Niinemets U, Diaz-Espejo A, Flexas J, Galmes J, Warren CR (2009) Importance
of mesophyll diffusion conductance in estimation of plant photosynthesis in the
field. J Exp Bot 60: 2271–2282.
61. Pons TL, Flexas J, von Caemmerer S, Evans JR, Genty B, et al. (2009)
Estimating mesophyll conductance to CO2: methodology, potential errors, andrecommendations. J Exp Bot 60(8): 2217–2234.
62. Niinemets U, Diaz-Espejo A, Flexas J, Galmes J, Warren CR (2009) Role ofmesophyll diffusion conductance in constraining potential photosynthetic
productivity in the field. J Exp Bot 60: 2249–2270.
63. Damour G, Simonneau T, Cochard H, Urban L (2010) An overview of models
of stomatal conductance at the leaf level. Plant Cell Environ 33: 1419–1438.
64. Diaz S, Hodgson JG, Thompson K, Cabido M, Cornelissen JHC, et al. (2004)
The plant traits that drive ecosystems: Evidence from three continents. J Veg Sci15: 295–304.
65. Irving LJ, Robinson D (2006) A dynamic model of Rubisco turnover in cerealleaves. New Phytol 169: 493–504.
66. Soussana JF, Maire V, Gross N, Hill D, Bachelet B, et al. (2012) GEMINI: agrassland model simulating the role of plant traits for community dynamics and
ecosystem functioning. Parameterization and Evaluation. Ecol Model 231: 134–
145.
67. Maire V, Soussana JF, Gross N, Bachelet B, Pages L, et al. (2012) Plasticity of
plant form and function sustains productivity and dominance along environmentand competition gradients. A modeling experiment with GEMINI. Ecol Model
231 In press.
Coordination of Leaf Photosynthesis
PLoS ONE | www.plosone.org 15 June 2012 | Volume 7 | Issue 6 | e38345