The Cone Loading Test to Estimate Deformability Moduli of a Tropical Soil
13
The Cone Loading Test to Estimate Deformability Moduli of a Tropical Soil Jude Christian Salles, Gian Franco Napa García Graduate Students, Department of Geotechnical Engineering, São Carlos School of Engineering, University of São Paulo (USP), Avenida do Trabalhador Sancarlense 400, 13.566-590, São Carlos (SP), Brazil; e- mail: [email protected] and [email protected] Dr. Heraldo Luiz Giacheti Professor, D.Sc.; Department of Civil and Environmental Engineering, UNESP – São Paulo State University, Av. Eng. Luiz Edmundo C. Coube 14-01, 17.033-360, Bauru (SP), Brazil; e-mail: [email protected] ABSTRACT The Cone Loading Test (CLT) consists of the execution of a load test on the piezocone probe in conjunction with the CPT test. The CLT yields the modulus E CLT , a parameter that can be used in the estimative of foundation settlement. It is also presented here the interpretation and the process to determine E CLT values from the stress-displacement curves obtained from cone loading tests. Several CLT tests were conducted at the experimental research site of São Paulo State University, Bauru-SP-Brazil. The geotechnical profile at the studied site is a brown to bright red slightly clayey fine sand, a tropical soil common to this region which is lateritic, unsaturated and collapsible. The results of CLT tests satisfactorily represent the behavior of the investigated soil. The penetrometric modulus E CLT for each depth was calculated considering the elastic behavior in the initial linear segment of the soil stress-strain curve. The E CLT moduli obtained for the various tests were compared to moduli obtained from PMT and DMT test results performed at same studied site. The shear modulus degradation curves obtained from the CLT tests are also presented. The comparison to PMT and DMT results indicates the CLT test is a viable complementary test to the CPT in the quest for better understanding stress-strain behavior of soils. Further, the CLT test provides a graphic visualization of the degradation of the shear modulus with increasing levels of strain. As a hybrid geotechnical test, CPT+CLT can be valuable in the investigation of non-conventional collapsible soils, whose literature lack reference parameters for the prediction of settlement in the design of foundations. KEYWORDS: Site characterization, field test, CPT, cone loading test, CLT, deformability moduli, tropical soil. INTRODUCTION In geotechnical engineering and especially in foundation design, the site characterization is a stage critically important in the design. The site investigation program has a direct bearing on the success or failure of the entire project. Geotechnical engineering relies on the soundness of the - 4169 -
Transcript of The Cone Loading Test to Estimate Deformability Moduli of a Tropical Soil
The Cone Loading Test to Estimate
Deformability Moduli of a Tropical Soil
Jude Christian Salles, Gian Franco Napa García Graduate Students, Department of Geotechnical Engineering, São Carlos
School of Engineering, University of São Paulo (USP), Avenida do Trabalhador Sancarlense 400, 13.566-590, São Carlos (SP), Brazil; e-
mail: [email protected] and [email protected]
Dr. Heraldo Luiz Giacheti Professor, D.Sc.; Department of Civil and Environmental Engineering, UNESP – São Paulo State University, Av. Eng. Luiz Edmundo C. Coube
14-01, 17.033-360, Bauru (SP), Brazil; e-mail: [email protected]
ABSTRACT The Cone Loading Test (CLT) consists of the execution of a load test on the piezocone probe in conjunction with the CPT test. The CLT yields the modulus ECLT, a parameter that can be used in the estimative of foundation settlement. It is also presented here the interpretation and the process to determine ECLT values from the stress-displacement curves obtained from cone loading tests. Several CLT tests were conducted at the experimental research site of São Paulo State University, Bauru-SP-Brazil. The geotechnical profile at the studied site is a brown to bright red slightly clayey fine sand, a tropical soil common to this region which is lateritic, unsaturated and collapsible. The results of CLT tests satisfactorily represent the behavior of the investigated soil. The penetrometric modulus ECLT for each depth was calculated considering the elastic behavior in the initial linear segment of the soil stress-strain curve. The ECLT moduli obtained for the various tests were compared to moduli obtained from PMT and DMT test results performed at same studied site. The shear modulus degradation curves obtained from the CLT tests are also presented. The comparison to PMT and DMT results indicates the CLT test is a viable complementary test to the CPT in the quest for better understanding stress-strain behavior of soils. Further, the CLT test provides a graphic visualization of the degradation of the shear modulus with increasing levels of strain. As a hybrid geotechnical test, CPT+CLT can be valuable in the investigation of non-conventional collapsible soils, whose literature lack reference parameters for the prediction of settlement in the design of foundations. KEYWORDS: Site characterization, field test, CPT, cone loading test, CLT, deformability moduli, tropical soil.
INTRODUCTION In geotechnical engineering and especially in foundation design, the site characterization is a
stage critically important in the design. The site investigation program has a direct bearing on the success or failure of the entire project. Geotechnical engineering relies on the soundness of the
- 4169 -

Vol. 18 [2013], Salles et al. 2013 4170 data collected from field and laboratory tests. For this purpose, site investigation techniques are being proposed or improved continually. Among the great variety of in situ tests available today, the Cone Penetration Test (CPT) is becoming increasingly popular for its adaptability to the conditions at hand. One of the advantages of CPT is its versatility: it can be modified for specific purposes ranging from the measurement of soil resistance and pore pressure to geophysical and environmental applications. The Cone Loading Test (CLT) is another option to be incorporated to the CPT test, which has been evolving continually since its inception as new techniques are implemented and better electronics are developed. The CLT uses the CPT equipment; it does not require any major modification to the CPT gear and it is carried out simultaneously. The CLT essentially consists of stopping the pushing of the cone by the CPT at a depth of interest, as identified in the soil profile, and performing a load test on the instrumented cone. The CLT is fast, inexpensive, and it yields valuable additional information about the deformability moduli of the soil.
CPT TEST The CPT test first began in Holland as a mechanical device in the 1930’s. This test has
evolved and become very sophisticated with modern electronics. At its minimal configuration, the basic sensors of a CPT cone measure tip resistance (qc) and lateral friction (fs). But generally a fully instrumented cone is a wireless device with a great variety of transducers that can measure most everything, including pore pressure (u), inclination, temperature, electrical resistivity, shear wave velocity, contamination, among many other measurable parameters. The results obtained from CPT are not direct; its results must be interpreted through correlations with data from the literature and local experience.
CLT TEST As a complement to the CPT, the CLT permits the straightforward estimation of the elasticity
modulus of a soil, which is one the most difficult soil parameter to determine, even with the triaxial test, because it depends on obtaining a representative sample of the soil, among so many other affecting factors. The CLT test provides deformability information, which may be more useful information to the engineer designing foundations, where stability and settlement are the two primary design concerns. The CLT test can be performed simultaneously with CPT test at every meter of depth or just at the depths identified in the soil profile as depths of interest. CLT requires minimal and inexpensive adaptation to the CPT apparatus.
A typical CLT test is executed according to Reiffsteck et al. (2009) as follows: after the campaign of CPT tests is done and the soil profile is generated graphically, certain layers of soil are normally identified as candidates for further investigation. Thus, again the CPT probe is pushed, and stopped at the depths of interest and the CLT test is carried out. Once a selected depth is reached, the pushing is stopped and a minimum of 5 minutes is waited for the dissipation of build-up of pore pressures. Next the system comprising the CPT rods and cone is lifted up to a qc value equal to the hydrostatic condition previously experienced by the soil in situ, prior to the presence of the cone. The idea is to minimize the disturbance to the soil to be tested. The loading test is carried out typically in increments of qc/10, with qc being the dynamic tip stress when the CPT pushing was stopped. The loading test follows the procedure for the Menard pressuremeter PMT, according to ISO/CEN 22476-4 and ASTM D4719. At each incremental loading stage the pressure is kept for 60 seconds, at which point it is recorded the stress qc and the respective
Vol. 18 [2013], Salles et al. 2013 4171 vertical displacement Δh of the cone. Each pair of points qc and Δh later become a point on the curve stress-displacement. For the tests presented here the CPT pushing equipment used was built by Pagani, model TG63-150. The CPT pushing equipment is essentially a self-driven tractor with a diesel-driven hydraulic pump that can push rods with up to 150 kN of force. The equipment used was more than adequate to push 35.7 mm rods and cone to all the depths tested.
The pushing equipment was anchored into the soil by helical piles 3 m long and its telescoping rods lifted the entire tractor off the ground for leveling and to serve as a reaction system. The adaptation needed to the CPT equipment to perform the CLT test consisted of the addition of a reference beam 3 m long to serve as support to the telltales that measured Δh at the top pushrod. The reference beam was fabricated out of aluminum because this material is unaffected by any stray magnetic field that might be generated by the equipment and affect the readings of the telltales. The beam was fixed onto the soil by two steel stakes driven into the soil, each at least 1.5 m away from the CPT rods, to avoid vibration that can affect readings.
The CLT test procedure uses the CPT equipment as a reaction system; therefore, it is important that the equipment be firmly held to the ground. At the beginning of each CLT test the top of the CPT shaft was separated from the pushing equipment and a short stroke (50 mm) hydraulic actuated cylinder was positioned on top of the rod and connected to a hand-cranked oil pump. As each stress increment of qc was applied with the hand pump, its associated Δh values was read and recorded. Figure 1 shows the CPT equipment being used as a reaction system and the reference beam with the gages in place.
The raw data obtained from CLT consists of measured values of stress applied at the cone and measured vertical displacement Δh recorded by the mechanical dial gauges or LVDTs. These values require a number of corrections before meaningful inferences can be made from them about the soil. With the presence of pore pressure, it is necessary to correct qc to qt because what is known as the unequal end area effect (Campanella et al., 1982), according to Eq. (1)
( ) 21t cq q a u= + − Eq. (1)
It should be noted that according to Robertson (2013), in fine grained soils, where qc is relatively low compared to the pore pressure built up around the cone due to undrained CPT penetration, qt can be higher than qc by as much as 30 %. In a situation where pore pressure is generated as a response to the applied load, an accurate record of this pressure is necessary to assure a correct interpretation of the test data.
The vertical displacement Δh also needs to be corrected due to the compression of the rods during the cone loading test. This correction was done applying Hooke’s Law, Eq. (2).
( )s sleeve c tip
cs rod
L f A q Ah h
E A⋅ +
∆ = ∆ − Eq. (2)
where ch∆ is the corrected displacement, h∆ is the measured displacement, L is the length of the rod,
sleeveA is the area of the friction sleeve, tipA is the area of tip of the cone, rodA is the area of transversal
section of the rod and sE is elastic modulus of steel.

Vol. 18 [2013], Salles et al. 2013 4172
Figure 1: Cone loading test using CPT equipment and reference beam.
After calculation of the corrected displacement it is necessary to convert displacement to strain, to be used in the calculation of the modulus ECLT. Eq. (3) considers that CPT exerts influence over a bulb of stress that is created in the soil immediately below the tip of the cone and such bulb has a height he, as proposed by Boussinesq. Eq. (3) gives ECLT in terms of the increment in stress, displacement, and the equivalent height of the region of influence ahead of the cone.
cCLT e
qE hh
∆= ⋅∆
Eq. (3)
where eh is the equivalent elastic height that converts vertical displacement to deformation in dimensionless units.
The interpretation of CLT test starts with what is known from the work of Boussinesq and his application of load onto round and square steel plates on surface soil and at the bottom of shallow foundations. In CLT an assumption is made that the tip of the CPT cone resembles a circular plate of radius R being embedded into a continuous, homogeneous, isotropic and linearly elastic soil. Thus, taking the coefficient of Poisson for a sandy soil is 0.33, Boussinesq’s Eq. (4) was applied to calculate the vertical displacement Δh:
21
2Rh P
Eπ ν−
∆ = Eq. (4)

Vol. 18 [2013], Salles et al. 2013 4173
However, since Boussinesq’s work was on surficial soil, and the CLT test is executed in great depths, an adjustment factor of ½ is used, as proposed by Butterfield and Banerjee (1971). Thus, re-arranging Eq. (4), the elastic height he was solved.
A further adjustment was done to Bossinesq’s original equation to account for the scale effect, geometry of the cone, and the remolding effect that occurs in the bulb ahead of the tip of the cone. Reiffsteck et al. (2009) proposed the introduction of an adjustment factor k equal to 1/5, arrived at empirically from the comparison of CLT and triaxial tests, and centrifuge tests. Thus after converting displacement to deformation, Eq. (3) was adjusted to Eq. (5):
1.c
CLTqE
kε∆
= Eq. (5)
After all corrections are applied to the raw data, actual values of moduli can be derived for each depth and for each point in the curve. Thus, a visual representation is possible of the maximum stress the soil can bear and the levels of the deformation associated. Using the elasticity theory, each value of E was converted to G according to Eq. (6):
( )2 1
EGν
=+
Eq. (6)
STUDIED SITE The studied site is in the middle of a geological formation rich in sandstone, The Paraná
Sedimentary Basin. The soil is typical of tropical regions and humid climate, where abundant rains have washed away the silica leaving a structured soil rich in hydrated and oxidized iron and aluminum. At the experimental research site, the subsoil is predominantly a brown to bright red slightly clayey fine sand, porous, and collapsible, resulting from the decomposition of Bauru Sandstone Formation. The relative density of the soil increases with increasing depth. The top 13 m of depth has lateritic soil behavior, transitioning to non-lateritic below this depth according to The MCT Classification System (Mini, Compacted, Tropical) proposed by Nogami and Villibor (1981).
Vol. 18 [2013], Salles et al. 2013 4174
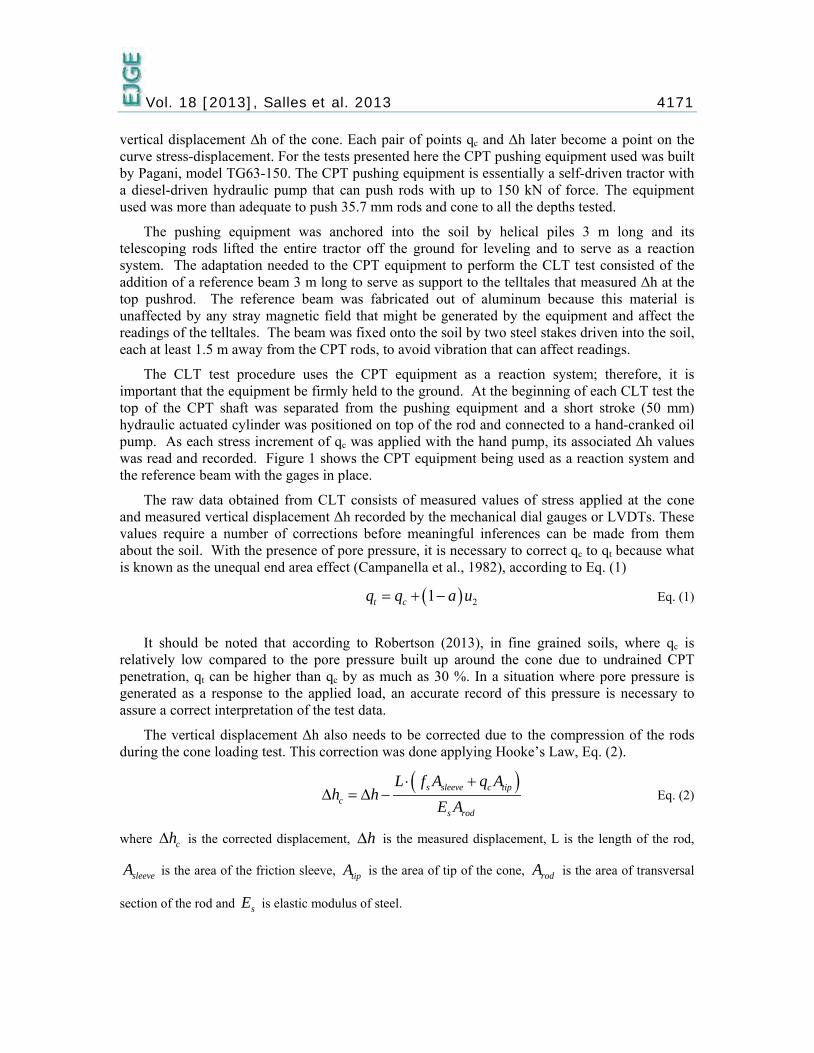
Figure 2: In situ test results in the studied site (Giacheti & Esquivel, 2001).
RESULTS AND DISCUSSION A campaign of 7 CPT tests in two different areas of the research site was carried out. CLT
tests were conducted at every meter of depth in most of the CPT tests. Altogether over 60 CLT tests were performed and only 51 were used to generate stress-strain curves. Those curves rejected did not meet the quality criterion used; they yielded unrealistic outlying moduli values far removed from those expected from the literature and local experience. Figure 3 shows the results of the CPT tests. It can be seen that all curves indicate the presence of a hardened soil layer with higher tip resistance (qc) near the surface. The tip resistance and the lateral friction (fs) increase almost linearly with depth leading to a friction ratio (Rf) between 0.5 and 1.5%. CPT tests do not yield soil samples for laboratory analysis but the soil type can be inferred from classification charts that correlate corrected cone penetration resistance (qt) to sleeve friction (fs) and friction ration (Rf).
Void ratioe
0,0 0,5 1,0
eSr
SoilProfile
0
5
10
15
20
Grain size(%)
0 50 100
N
0 10 20 30 40
Dep
th (m
)
Red clayey
fine sand
(SM - SC)
SiltyClay
Fine
sand
Med
ium
sand
Silt
Cla
y
T/N(Kgf.m/blow)
0 1 2 3 4
Rf Mec(%)
0 2 4 6 8
qc Mec(MPa)
0 4 8 12 16
0 50 100Saturation
degree, Sr (%)
LA'
NA'
qcElet(MPa)
0 4 8 12
Rf Elet(%)
0 2 4 6 8
Characterization SPT-T Mechanical CPT Eletrical CPT

Vol. 18 [2013], Salles et al. 2013 4175
Figure 3: CPT test data at the studied site.
By means of the Unified Approach, as proposed by Robertson (2013), which normalizes the soil parameters obtained through CPT, it is possible to determine the soil behavior type index Ic for a qualitative behavior analysis. As shown by Robertson (1990), the classification chart used in the interpretation of CPT results do not identify the soil according to its texture, given that the cone registers the mechanical behavior of the soil in situ, i.e., resistance, stiffness and compressibility. In Figure 4 the dark lines indicate the limits of the index Ic. It can be seen that the majority of the CPT results obtained in the studied site are predominantly between the lines Ic = 2.05 and Ic = 2.60, indicating the presence of a soil whose behavior is that of a sandy mixture of silty sand and sandy silt, which do not correspond exactly to the soil texture observed in laboratory but it is within the expected soil behavior, according to Giacheti (2001). Nevertheless, CPT data obtained in this campaign were coherent with those of the literature for this research site.
qc (MPa)
0 4 8 12 16
Rf (%)
0 2 4 6 8
fs (kPa)
0 200 400 600
CPT1CPT2CPT3CPT4CPT5CPT6CPT7
SoilProfile
Dep
th (m
)0
2
4
6
8
10
12
14
16
Red clayeyfine sand
LA'
NA'
SM - SC

Vol. 18 [2013], Salles et al. 2013 4176
Figure 4: Normalized soil classification chart by Robertson (2013) with soil index Ic and
CPT data for the studied site.
Figure 5 shows the results of the cone loading tests performed simultaneously with the CPT1 test. It can be seen the trend how the load is mobilized during the loading process and how the soil strength increases with depth. This can be explained by the behavior that is typical of granular soils whose strength increases with the confinement stress. In the studied site the soil is mainly a clayey sand.
Figure 5: Typical stress-settlement curves from CLT tests at location of CPT1.
0.00.51.01.52.02.53.03.54.04.55.05.56.0
0.0 0.5 1.0 1.5 2.0 2.5 3.0 3.5 4.0 4.5 5.0
Con
e tip
resi
stan
ce, P
p (M
Pa)
Settlement (mm)
2 m3 m6 m7 m

Vol. 18 [2013], Salles et al. 2013 4177
In the CLT tests presented here, cone tip resistance correction due to pore pressure was not necessary because the soil is unsaturated sandy soil up to all tested depths. Thus, measured qc values are equal to qt, since pore pressure values were assumed equal to zero.
After applying the shortening correction due to rod compression, three types of modulus were calculated. First, the penetrometric modulus ECLT was determined at the ‘linear’ initial interval by calculating the slope of a linear trend through it. It was observed that in a typical convex CLT curve, the linear interval can go up to 30% of the ultimate stress (Craig, 2004; Das, 2008). Also, secant and tangent moduli were calculated from stress-strain curves at every stress-strain pair. These three types of moduli are shown schematically in Figure 6.
Figure 6: Representation of penetrometric (ECLT), tangent (Epn tan) and secant (Epn sec)
moduli at the i-th point from corrected stress-strain curve of the CLT test at 7 m depth of the CPT 1.
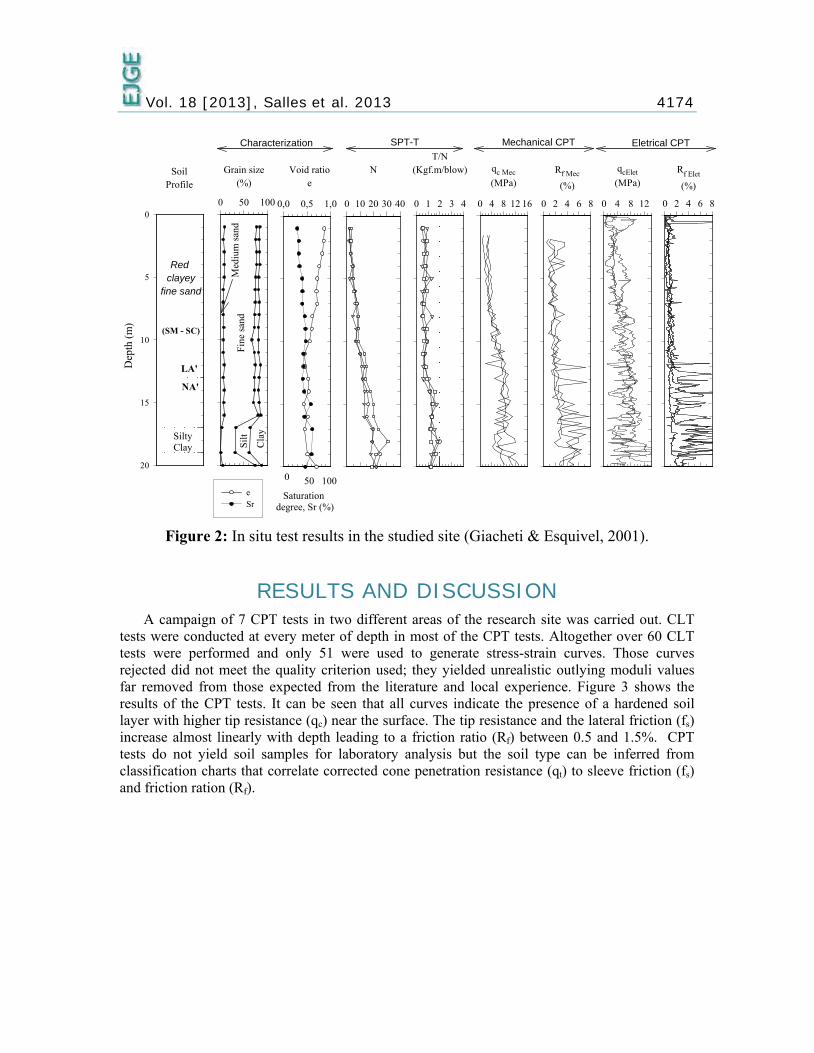
The values of deformability modulus determined from the CLT tests (ECLT) were compared to the values obtained with the Menard´s penetrometer (EPMT) and the Marchetti´s dilatometer (EDMT) for tests carried out at the same research site. EPMT and EDMT were taken as reference and it was noted that ECLT tend to overestimate the values of the other tests, according to Figure 7.
0
1
2
3
4
5
6
0.00 0.05 0.10 0.15 0.20
Tip
resis
tanc
e, q
c (M
Pa)
strain, εpn ( )
7 m
EPN TAN
EPN SEC
ECLT
Vol. 18 [2013], Salles et al. 2013 4178
Figure 7: Deformability modulus determined using PMT, DMT, and CLT tests at the
studied site.
ECLT presented a mean value of 20.1 MPa and a mean penetrometric strain ε of 2% for the studied site. The mean value of ECLT represents 5% of the mean dynamic elastic modulus (Emax) for the studied site. This percentage is approximately one half of the 10% recommended by Barkan (1962) for sands. This difference can be attributed to the fact that Barkan´s recommendation was based on cyclic behavior of sedimentary soils and the soil of at the studied site consists on a tropical soil that was monotonically loaded. The mean strain level registered is considered large when comparing it to strain levels for typical foundation behavior, i.e., 0.1%. Yet, this value is just referential since it can be considered as the maximum level of the visual linearity of the stress-strain curve.
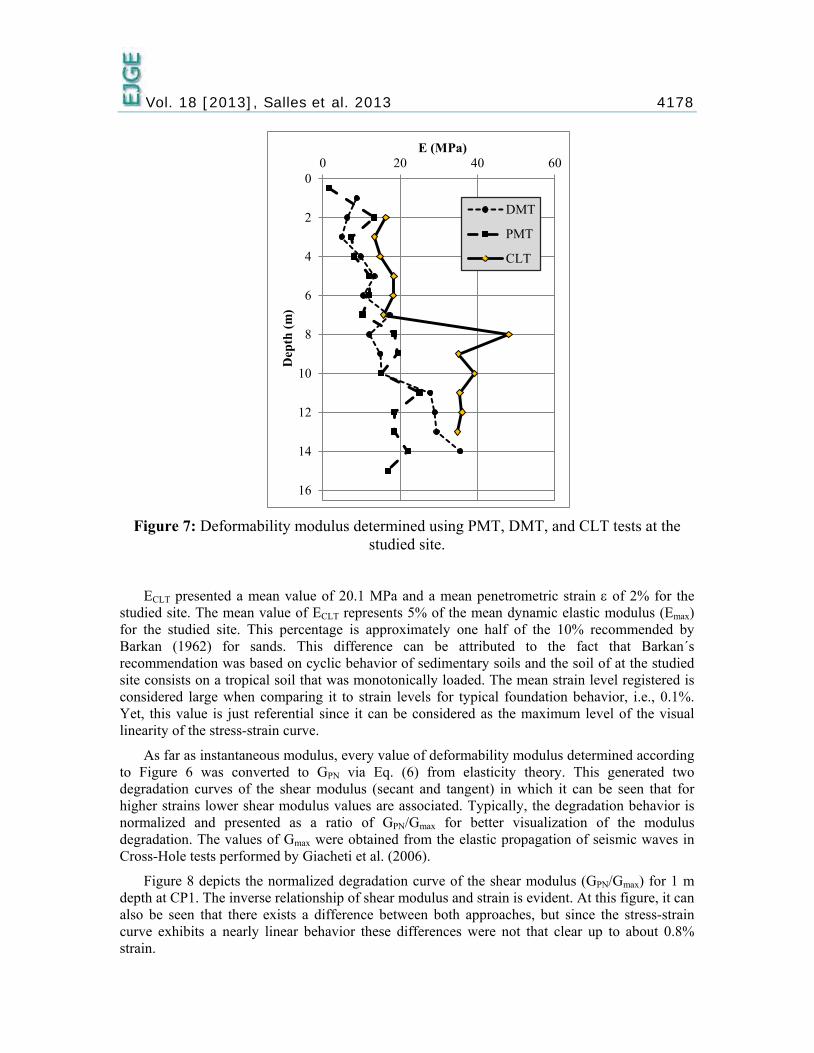
As far as instantaneous modulus, every value of deformability modulus determined according to Figure 6 was converted to GPN via Eq. (6) from elasticity theory. This generated two degradation curves of the shear modulus (secant and tangent) in which it can be seen that for higher strains lower shear modulus values are associated. Typically, the degradation behavior is normalized and presented as a ratio of GPN/Gmax for better visualization of the modulus degradation. The values of Gmax were obtained from the elastic propagation of seismic waves in Cross-Hole tests performed by Giacheti et al. (2006).
Figure 8 depicts the normalized degradation curve of the shear modulus (GPN/Gmax) for 1 m depth at CP1. The inverse relationship of shear modulus and strain is evident. At this figure, it can also be seen that there exists a difference between both approaches, but since the stress-strain curve exhibits a nearly linear behavior these differences were not that clear up to about 0.8% strain.
0
2
4
6
8
10
12
14
16
0 20 40 60
Dep
th (m
)
E (MPa)
DMT
PMT
CLT
Vol. 18 [2013], Salles et al. 2013 4179
Figure 8: Shear modulus degradation curve for CLT test at 1 m depth of CPT 1.
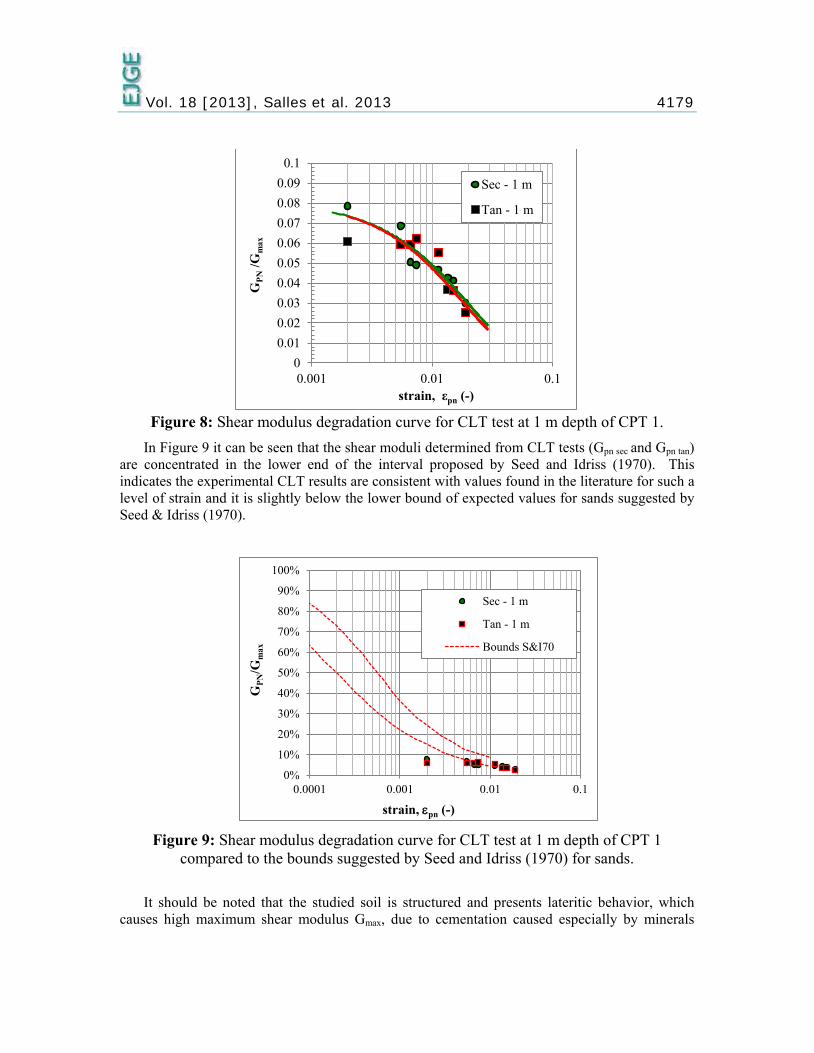
In Figure 9 it can be seen that the shear moduli determined from CLT tests (Gpn sec and Gpn tan) are concentrated in the lower end of the interval proposed by Seed and Idriss (1970). This indicates the experimental CLT results are consistent with values found in the literature for such a level of strain and it is slightly below the lower bound of expected values for sands suggested by Seed & Idriss (1970).
Figure 9: Shear modulus degradation curve for CLT test at 1 m depth of CPT 1
compared to the bounds suggested by Seed and Idriss (1970) for sands.
It should be noted that the studied soil is structured and presents lateritic behavior, which causes high maximum shear modulus Gmax, due to cementation caused especially by minerals
00.010.020.030.040.050.060.070.080.090.1
0.001 0.01 0.1
GPN
/Gm
ax
strain, εpn (-)
Sec - 1 m
Tan - 1 m
0%
10%
20%
30%
40%
50%
60%
70%
80%
90%
100%
0.0001 0.001 0.01 0.1
GPN
/Gm
ax
strain, εpn (-)
Sec - 1 m
Tan - 1 m
Bounds S&I70
Vol. 18 [2013], Salles et al. 2013 4180 such as iron and aluminum oxides. Such minerals contribute to the structured nature of the soil and to its rapid degradation with increasing levels of strain.
CONCLUSIONS The presented results show that the CLT test can complement the CPT test to produce
additional information about the soil deformability. The soil at the studied site is described as a porous collapsible residual soil from sandstone. The values of modulus determined with the CLT tests were compared to those by Menard´s pressuremeter and Marchetti´s dilatometer. Further, the deformability modulus determined with CLT in the initial linear interval presented an average value of 20.1 MPa. This value represents 5% of the dynamic elastic modulus. Additionally, the modulus degradation of the soil at the studied site was also explored. Shear modulus ratio curves plotted slightly below the lower bound of expected values for sands by Seed & Idriss (1970). This behavior might be explained by the monotonic loading and also because of the soil genesis. Finally, the CLT test can be used to study the deformability behavior of tropical soils since not enough data is readily available in the literature for this type of soil.
REFERENCES 1. AMERICAN SOCIETY FOR TESTING AND MATERIALS. ASTM D4719. Standard
Test Method for Pressuremeter Testing in Soils. v.04.08. New York. 1987.
2. Barkan, D. D. Dynamics of Bases and Foundations. 1. ed.: McGraw-Hill, 1962 (translated from the Russian by L. Drashevska)
3. Campanella, R. G.; Gillespie, D.; Robertson, P. K. Pore pressure during cone penetration testing. In: Proceedings of the 2nd European Symposium on Penetration Testing ESPOT II. 1982. Amsterdam. Amsterdam: A.A. Balkema, 1982. p. 507-512.
4. Craig, R. F. Craig's soil mechanics. ed.: CRC PressI Llc, 2004. 0415327032.
5. Das, B. M. Advanced soil mechanics. Third Edition. ed. New York: Taylor & Francis, 2008. 594 p. 0415420261.
6. Giacheti, H. L. Os ensaios de campo na investigação do subsolo: Estudo e considerações quanto à aplicação em solo tropicais. Tese (Livre Docência). Faculdade de Engenharia, Unesp-Bauru, Bauru, São Paulo, Brasil, 2001.
7. Giacheti, H. L.; De Mio, G.; Dourado, J. C.; Malagutti Filho, W. Comparação entre resultados de ensaios sísmicos Down-Hole e Cross-Hole no Campo Experimental da UNESP de Bauru. XIII Congresso Brasileiro de Mecânica dos Solos e Engenharia Geotécnica. 2006. Curitiba. p. 669-674.
8. Giacheti, H. L.; Esquivel, E. R. Correlações entre atrito lateral medido em provas de carga, em estacas apiloadas, instrumentadas e resultados de ensaios SPT-T e CPT. Solos e Rochas, v.24, n.2, p.171-174. 2001.

Vol. 18 [2013], Salles et al. 2013 4181
9. ISO/CEN. 22476-4:2012: Geotechnical investigation and testing - Field testing - Part 4: Ménard pressuremeter test, 2012. 66 p.
10. Nogami, J. S.; Villibor, D. F. Uma nova classificação de solos para finalidades rodoviárias. Simpósio Brasileiro de Solos Tropicais em Engenharia, Rio de Janeiro.
11. Reiffsteck, P. et al. Measurements of soil deformation by means of cone penetrometer. Soils and Foundations, v.49, n.3, p.397-408. 2009.
12. Robertson, P. Interpretation of in-situ testsisome insights. The James K. Mitchell Lecture: In: Coutinho and P.W. Mayne (Editors), Geotechnical and Geophysical Site Characterization 4. London: Taylor and Francis Group, 2013, p. 3-24.
13. Robertson, P. K. Soil classification using the cone penetration test. Canadian Geotechnical Journal, v.27, n.1, p.151-158. 1990.
© 2013 ejge