The concept of fiscal space - ILO
86
ESS Extension of Social Security The concept of fiscal space and its applicability to the development of social protection policy in Zambia Luca Aguzzoni ESS Paper N°28 Global Campaign on Social Security and Coverage for All International Labour Office Social Security Department Geneva
-
Upload
khangminh22 -
Category
Documents
-
view
1 -
download
0
Transcript of The concept of fiscal space - ILO

ESS Extension of Social Security
The concept of fiscal space and its applicability to the development
of social protection policy in Zambia
Luca Aguzzoni
ESS Paper N°28
Global Campaign on Social Security and Coverage for All
International Labour Office
Social Security Department Geneva

Copyright © International Labour Organization 2011 First published 2011 Publications of the International Labour Office enjoy copyright under Protocol 2 of the Universal Copyright Convention. Nevertheless, short excerpts from them may be reproduced without authorization, on condition that the source is indicated. For rights of reproduction or translation, application should be made to ILO Publications (Rights and Permissions), International Labour Office, CH-1211 Geneva 22, Switzerland, or by email: [email protected]. The International Labour Office welcomes such applications.
Libraries, institutions and other users registered with reproduction rights organizations may make copies in accordance with the licences issued to them for this purpose. Visit www.ifrro.org to find the reproduction rights organization in your country. ILO Cataloguing in Publication Data The concept of fiscal space and its applicability to the development of social protection policy in Zambia / Luca Aguzzoni; Social Security Department, International Labour Office. - Geneva: ILO, 2011 xiv, 72 p. ISBN: 978-92-2-125349-5 ;978-92-2-125350-1 (pdf) International Labour Office; Social Security Dept social protection / social security / social expenditure / fiscal policy / social security financing / Zambia 02.03.1 The designations employed in ILO publications, which are in conformity with United Nations practice, and the presentation of material therein do not imply the expression of any opinion whatsoever on the part of the International Labour Office concerning the legal status of any country, area or territory or of its authorities, or concerning the delimitation of its frontiers.
The responsibility for opinions expressed in signed articles, studies and other contributions rests solely with their authors, and publication does not constitute an endorsement by the International Labour Office of the opinions expressed in them.
Reference to names of firms and commercial products and processes does not imply their endorsement by the International Labour Office, and any failure to mention a particular firm, commercial product or process is not a sign of disapproval.
ILO publications and electronic products can be obtained through major booksellers or ILO local offices in many countries, or direct from ILO Publications, International Labour Office, CH-1211 Geneva 22, Switzerland. Catalogues or lists of new publications are available free of charge from the above address, or by email: [email protected]
Visit our website: www.ilo.org/publns
Printed in Switzerland

The concept of fiscal space and its applicability to the development of social protection policy in Zambia iii
Contents
Page
Acknowledgements ........................................................................................................................... vii
Abbreviations .................................................................................................................................... ix
Executive summary ........................................................................................................................... xii
1. Introduction ............................................................................................................................. 1
2. Literature review ..................................................................................................................... 2
2.1. Social protection in low-income countries ................................................................... 2
2.1.1 Advantages and disadvantages of investment in social protection ..................... 3
2.2. The concept of fiscal space ........................................................................................... 5
2.3. The African economy ................................................................................................... 6
2.4. The creation of fiscal space: Policy options ................................................................. 8
2.4.1. Official development assistance ......................................................................... 9
2.4.2. Domestic revenue mobilization .......................................................................... 9
2.4.3. Deficit financing ................................................................................................. 15
2.4.4. Reprioritization and efficiency of expenditures ................................................. 16
3. Case study: Zambia ................................................................................................................. 17
3.1. Social cash transfers in Zambia .................................................................................... 18
3.2. The SP package ............................................................................................................. 19
3.3. Country characteristics ................................................................................................. 22
3.4. The Zambian economy ................................................................................................. 23
3.5. Creating fiscal space in Zambia .................................................................................... 29
3.5.1. Official development assistance ......................................................................... 29
3.5.2. Domestic revenue mobilization .......................................................................... 33
3.5.3. Deficit financing ................................................................................................. 42
3.5.4. Reprioritization and efficiency of expenditures ................................................. 50
3.6. A policy proposal .......................................................................................................... 54
3.6.1. Creating fiscal space: Concrete strategies .......................................................... 55
3.6.2. Scaling up social protection expenditure ............................................................ 57
4. Conclusions ............................................................................................................................. 61
Appendix ........................................................................................................................................... 63
Bibliography ...................................................................................................................................... 69

iv The concept of fiscal space and its applicability to the development of social protection policy in Zambia
List of tables
Page
Table 1. Overall taxation and contributions by category in sub-Saharan Africa: Changes over time .................................................................................................................................. 12
Table 2. Social cash transfer pilot schemes in Zambia .................................................................. 18
Table 3. The social protection package: Estimated costs of benefits for 2009 .............................. 20
Table 4. Non-traditional exports, 2003–2008 (US$ million) ........................................................ 27
Table 5. The Joint Assistance Strategy for Zambia (JASZ): Cooperating Partner financing commitments, 2006–2010 (US$ millions) ...................................................................... 32
Table 6. Official development assistance grants received, 2005–2008, and projections, 2009–2012 (ZMK billions) ....................................................................................................... 32
Table 7. Tax arrears, 2007 and 2008 ............................................................................................. 38
Table 8. Revenue generation from mining, 2005–2010 ................................................................ 39
Table 9. Informal sector tax revenues, 2007 and 2008 (ZMK billion) .......................................... 40
Table 10. Zambia’s external debt stock, 2003–2008 (US$ millions) .............................................. 45
Table 11. External debt service, Government of Zambia, 2003–2008 (US$ millions) ................... 46
Table 12. Total public debt, 2005–2011 .......................................................................................... 47
Table 13. Debt Burden Thresholds under the Debt Sustainability Framework ............................... 48
Table 14. Financing projections, 2009–2012 .................................................................................. 49
Table 15. Government expenditure as a percentage of GDP, 2005–2010, IMF projections ........... 51
Table 16. Government expenditure as a percentage of GDP, 2009–2012, MTEF projections ....... 53
Table 17. Sources of additional fiscal space, 2010–2016 (percentage of GDP) ............................. 56
Table 18. Macroeconomics assumptions ......................................................................................... 63
Table 19. Structure of the Zambian tax system ............................................................................... 64
Table 20. Fiscal framework in Zambian Kwachas .......................................................................... 65
Table 21. Fiscal framework as a percentage of GDP ...................................................................... 66
Table 22. Macroeconomic framework: MTEF compared to IMF data and projections .................. 67
Table 23. Financing plan: Immediate full implementation ............................................................. 67
Table 24. Financing plan: Gradual implementation ........................................................................ 68

The concept of fiscal space and its applicability to the development of social protection policy in Zambia v
List of figures
Figure 2. Revenue as a percentage of GDP: An international comparison ..................................... 13
Figure 3. Estimated costs of the SP package as a percentage of GDP, 2009–2025 ........................ 21
Figure 4. Estimated costs of the SP package if introduced gradually over five years, as a percentage of GDP, 2009–2025 ...................................................................................... 21
Figure 5. Real GDP annual growth, 2000–2011 (percentages) ...................................................... 24
Figure 6. Copper production and prices, and FDI inflow, 1995–2012 ........................................... 24
Figure 7. Contribution to GDP, selected sectors, 1994–2008 (percentages) .................................. 25
Figure 8. Exchange rate dynamics, 1996–2008 .............................................................................. 26
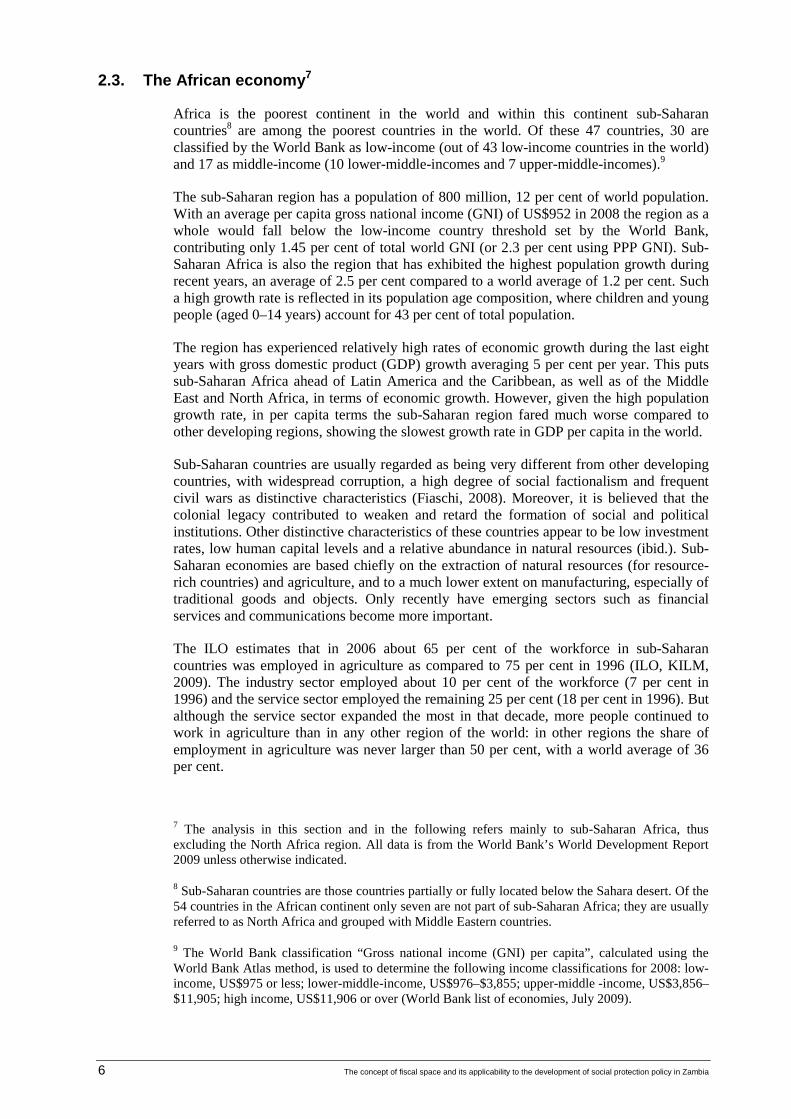
Figure 9. Growth of domestic credit to the private sector, 1996–2008 (percentage of GDP) ........ 28
Figure 10. GNI per capita, Zambia and other low-income countries, 1962–2007 (current US$) .... 30
Figure 11. Types of official development assistance, 1960–2005 (2007 US$ millions) .................. 30
Figure 12. Revenue collection, 2000–2010 (percentage of GDP) .................................................... 36
Figure 13. Composition of domestic revenue, percentages of total revenue, 2001–2008 ................ 37
Figure 14. Estimated composition of domestic revenue, percentages of total revenue, 2009–2012 38
Figure 15. Total tax rates, all African countries, 2008 ..................................................................... 41
Figure 16. External debt stock and official development assistance flow, Zambia, 1970–2006 (percentage of GDP) ........................................................................................................ 43
Figure 17. Costs and financing of the social protection package if introduced fully with immediate effect (percentage of GDP) ............................................................................ 58
Figure 18. Costs and financing of the social protection package if introduced gradually over five years (percentage of GDP) .............................................................................................. 59


The concept of fiscal space and its applicability to the development of social protection policy in Zambia vii
Acknowledgements
This paper has been commissioned by the ILO Social Security Department in Geneva. The author would like to thank all those who have contributed to it, especially Pauline Barrett-Reid, Krzysztof Hagemejer, Ross Leach and Wolfgang Scholz (all of the ILO Social Security Department). The paper also benefited from discussions held during the fieldwork in Lusaka, especially with Adrian Shikwe (ILO), Alan Whitworth and Sonya M. Sultan (UK Department for International Development (DFID), Litia Simbangala (Central Statistical Office), Trevor K. Kaunda (Ministry of Labour and Social Security), Marte Briseid (Norwegian Agency for Development Cooperation) and Samuel M. Bwalya (Zambia Revenue Authority). It goes without saying that any errors are the sole responsibility of the author.


The concept of fiscal space and its applicability to the development of social protection policy in Zambia ix
Abbreviations
ARA Autonomous Revenue Authority
COMESA Common Market for Eastern and Southern Africa
CPIA Country Policy and Institutional Assessment (World Bank)
CSO Central Statistical Office (Zambia)
DBT Debt Burden Threshold (World Bank)
DFID Department for International Development (United Kingdom)
DSF Debt Sustainability Framework (World Bank)
EC European Community
EU European Union
FDI foreign direct investment
FNDP Fifth National Development Plan
GDP gross domestic product
GNI gross national income
GRZ Gold Reserve Inc.
HIPC Heavily Indebted Poor Countries Initiative
JASZ Joint Assistance Strategy for Zambia
LCMS Living Conditions Monitoring Survey
MDG Millennium Development Goal
MDRI Multilateral Debt Relief Initiative
MFEZ Multi-Facility Economic Zone
MFNP Ministry of Finance and National Planning (Zambia)
MTEF Medium Term Expenditure Framework
NPV net present value
ODA official development assistance
SADC Southern African Development Community
SCT social cash transfer
SP social protection
SPS Social Protection Strategy
WTO World Trade Organization
ZMK Zambian Kwacha
ZRA Zambia Revenue Authority


The concept of fiscal space and its applicability to the development of social protection policy in Zambia xi
Executive summary
This paper builds on the ILO report Zambia: Social protection expenditure and performance review and social budget (2008) which assessed Zambia’s social protection system. Among other findings, the report concluded that the social protection programmes currently in place in Zambia fail to alleviate poverty because they are underfunded and do not target those most in need. As a way forward to the provision of nationwide social protection coverage the report suggested the introduction of a social protection package (hereafter the SP package) consisting of three non-contributory elements: a universal old-age pension for all individuals over the age of 60; a social cash transfer targeting the 10 per cent more destitute or incapacitated households; and a child benefit targeting households with children below a certain age. For the latter, some different specifications of child benefits were analysed.
Social protection programmes are increasingly seen as an important pillar for growth together with other public investment projects (infrastructure, health, education). Expenditure in social protection can have a positive impact on growth; some authors (Bonilla García and Gruat, 2003) have even defined social protection policies as productive investments (that is, yielding economic returns).
Social protection investments have great potential for alleviating poverty, reducing vulnerability and protecting the welfare of the poor. But in sub-Saharan countries only 5–10 per cent (Xaba et al., 2002) of the labour force has access to contributory social protection, while the vast majority of the population works in the informal sector and lacks formal coverage. In sub-Saharan countries characterized by high informality of economic activities and high levels of subsistence agriculture, non-contributory programmes must therefore play a crucial part in alleviating and preventing vulnerable people from falling into poverty.
The design of effective social protection policies requires careful reflection. The programme design must compare the positive effects on social and economic development with the costs it will address to society. A careful analysis should also consider the opportunities available for the financing of social protection programmes, identifying the advantages and disadvantages of the different sources.
In this context, we introduce the concept of creating fiscal space to finance social protection. Although there is no agreement among economists and policy-makers as to the exact meaning of the term “fiscal space”, how it has been used in the development context is clear. Fiscal space has to do with the financing from government revenues of policies conducive to the development of a country. The term may be seen both in its narrower definition as a redefinition of the fiscal rules to which sensible fiscal policy has always been subject, or in broader terms as a full-blown set of policy actions for development.
Disagreement on the definition of the term notwithstanding, the policies that have been put forward to create or secure fiscal space for a desired project are very similar across the literature. The four main strategies are: increasing official development assistance (ODA); enhancing the mobilization of domestic revenue; increasing borrowing; and reprioritizing current expenditure to make it more efficient.
This paper analyses the implementation of the SP package in Zambia, one of the poorest countries in the world. Roughly half its population of 12 million is made up of children and young people aged 0–14 years. In 2006 the Government of Zambia estimated that 64 per cent of the population was poor, with 51 per cent in extreme poverty. The majority of the population (70 per cent of those employed) work in agriculture: The labour market is

xii The concept of fiscal space and its applicability to the development of social protection policy in Zambia
characterized by a high degree of informality, with about 82 per cent of employed persons working in the informal economy.
Since the year 2000 Zambia’s economy has expanded at an average annual rate of 5 per cent and is expected to grow at a similar rate in the immediate future. After the decades of economic decline that began in the mid-1970s and a ten-year-long period of liberalization, privatization and stabilization policies, the country has at last begun to experience economic growth. Average growth rates went from an average of 1.5 per cent between 1995 and 1999 to 4.5 per cent between 2000 and 2004, and to the recent record level of 6 per cent between 2004 and 2008.
These recent high growth rates have been possible thanks to a buoyant market for copper, Zambia’s main export (copper accounts for around 70 per cent of total exports), as well as a robust flow of capital investments that have fuelled the domestic economy. Moreover, in 2005 Zambia benefited from extensive debt relief so that after many years of being one of the most indebted countries in the world in terms of debt stock as a share of GDP, its debt sustainability now looks healthy. Notwithstanding these economic successes, economic growth in Zambia has not been accompanied by similar improvements in the overall living conditions of the population; these have remained fairly stagnant over the last decade.
Despite the world economic crisis Zambia’s economic prospects look favourable: the country is attracting foreign investments both in the mining sector and in other key sectors such as electricity generation, tourism, agriculture, communications and oil extraction. However, the Government has yet to demonstrate that it is able to turn economic growth into better living conditions for its citizens; the next few years will be crucial in this respect.
Before 2005 social protection was not an integral part of the country’s poverty reduction strategy. It was then that the Zambian Government reviewed its social protection programme and developed a Social Protection Strategy (SPS) that was eventually included in its Fifth National Development Plan 2006–2011 (FNDP). Among other interventions, the Government identified social cash transfers (SCTs) as key non-contributory social protection programmes to alleviate poverty. Yet despite its original stated interest in and commitment to scaling up social protection, the Government has not increased its budget allocation to social protection programmes and thus many of the objectives set out in the SPS and FNDP remain unmet. For SCTs only some pilot schemes have been implemented, financed by external donors with government administrative support, and their coverage remains very low, being limited to only five districts out of a total of seventy-three. This paper analyses the cost of the nationwide implementation of similar SCTs and proposes a financing plan.
We estimate the cost of implementing the SP package in two main variants, depending on which child benefit specification is chosen: one in which the child benefit targets households with at least one child under the age of 5, and one where the child benefit targets households whose eldest child is under the age of 7 (although during the first phase all households with a child below 7 will receive the benefit). Of the three elements of the SP package the child benefit is the most expensive, especially during the early stages. Introducing the package with full nationwide coverage in 20091 would cost between 2.8 and 3.7 per cent of GDP during the first year, declining to 1–1.5 per cent of GDP in the
1 As this paper focuses on fiscal analysis for the implementation of the SP scheme, the social protection expenditure results are based on the report Zambia: Social protection expenditure and performance review and social budget (ILO, 2008). While the year of implementation for the introduction of the package and the gross figures may change, the relative figures provide an order of magnitude for analysis of the fiscal space and the implementation of the SP package

The concept of fiscal space and its applicability to the development of social protection policy in Zambia xiii
long run (2025). For an idea of the scale of resource mobilization needed, consider that government social expenditure amounts to about 6 per cent of GDP including health and education, with non-contributory social assistance accounting for only 0.1 per cent of GDP; to give another term of comparison, Zambia’s total grant receipts amount to 4.4 per cent of GDP.
The Government has also made no plans to increase its budget allocation to social protection: in the latest Medium Term Expenditure Framework 2010–2012 (MTEF), the share of resources allocated to social protections remains flat at today’s levels. Hence we argue that if the Government is serious about increasing social protection it will have first to commit to a revenue mobilization plan to secure the financing for such expenditure. In our analysis we propose a financing plan in which the Government, starting in 2010, commits itself to raise each year additional resources eventually amounting to 4.5 per cent of GDP per year by 2015; of these resources a third will have to be assigned to social protection spending. Under this plan the additional resources mobilized by the Government to finance social protection would amount to the following values (as a percentage of GDP): 0.3 per cent in 2010, 0.7 per cent in 2011, 1 per cent in 2012, 1.2 per cent in 2013, 1.4 per cent in 2014, and 1.5 per cent from 2015 onwards.
These projections are to a certain extent optimistic, for we believe that the Government could do better than its projections according to its Medium Term Expenditure Framework for 2010–2012. Still, our projections are also conservative. For instance, Weeks and McKinley (2006) propose a much bolder financing plan by which the Government is able to direct an additional 17 per cent of GDP toward the financing of Millennium Development Goals (MDG) expenditure (of which 8.8 percentage points are made up of higher domestically financed expenditure). Moreover we assume that only a third of the extra revenue generated goes to the financing of increased social protection expenditure. We make this assumption because it is understandable that if the Government is able to generate extra resources some will also be used to finance capital expenditure and expenditures in health and education – the three priority sectors in the MTEF 2010–2012.
We show that given the cost of the full package and the current and projected medium-term fiscal framework it would be extremely difficult for the Government to be able to finance an immediate full scaling up in social protection expenditure. The programme could be financed by donors during the first years, but given the scale of resources needed this would imply an increase in donors’ current budget allocation to Zambia by more than 60 per cent, and this seems unlikely to happen in the short term.
We therefore propose to phase in the programme over a period of five years. We assume that the three benefits of the SP package are introduced simultaneously in 2009, but that in the first year only 20 per cent of those entitled receive the benefits. Then each year a further 20 per cent of the entitled population starts to receive benefits so that eventually, by 2013, all those entitled to the benefits are covered. Figure 1 shows the projected cost of the gradual scaling up of social protection expenditure (as a percentage of GDP) for the two variants of the SP package. The part in positive figures shows the cost of the three benefits (from top to bottom: child benefit; targeted SCT; old-age pension). The negative figures show the proposed financing split between government (top) and donors (bottom). From this figure we can already see that even in this scenario, despite the gradual introduction of benefits, the Government will not be able to cover the whole cost of the scaling up, although the external resources required are much reduced.

xiv The concept of fiscal space and its applicability to the development of social protection policy in Zambia
Figure 1. Costs and financing of the SP package if introduced gradually over five years (percentage of GDP)
Source: Author’s calculations.
The chart on the left presents the case in which the child benefit targets households with a child below the age of 5. Here we see that unless the Government is able to raise further additional revenue, donors’ contributions will be needed to finance the delivery of the package of social protection. In the short term the total donor commitment would amount to an average annual amount of 0.78 per cent of GDP for the first seven years (from 2009 to 2015). This on average would amount to half the resources needed to finance the immediate scaling up. In Euros, in this scenario donors would be required to allocate 30 million Euros to cover the costs of the first seven years, an average of 4.2 million Euros per year. This would represent, on average, 5.4 per cent2 of the annual European Union (EU) budget allocated to Zambia. However, donor support is projected to continue also beyond the first seven years, although declining to zero in the long term.
The chart on the right presents the case in which the child benefit targets households with the eldest child aged less than 7 years. In this case the average financing required from donors during the first seven years amounts to 0.75 per cent of GDP per year, that is, less than half the resources needed to finance the immediate scaling up for the same scenario. In Euro terms the total commitment would amount to 26 million Euros (3.7 million Euros per year) which, on average, represents 4.7 per cent of the annual EC budget allocated to Zambia. If the Government proves to be successful in raising its share of financing, no further donor commitment would be needed after 2015.
The economic outlook for Zambia looks favorable since the country seems to be able to attract a sizeable amount of foreign direct investment (FDI) that will enable it to develop further and diversify its economy. The economy of Zambia is indeed projected to keep growing steadily at relatively high rates during the next years.
In this paper we argue that the introduction of the SP package is potentially affordable for Zambia. However, the Government needs to commit itself to a clear resource mobilization strategy if it is to implement this policy. Hence, it is in the hands of the Government to turn the projected economic growth into improved standards of living for all its citizens.
2 The European Union (EU) has committed 475 million Euros to Zambia over the six-year period 2008–2013 (EC, 2007). In our calculations we assume that it commits a similar amount also for the following years, that is, about 80 million Euros per year.
-4.0 -3.0 -2.0 -1.0 0.0
1.0
2.0
3.0
4.0
2009 2011 2013 2015 2017 2019 2021 2023 2025
Pension 60+ SCT 10% of HHChild <5 Government cost as % of GDPDonors’ cost as % of GDP
-4.0 -3.0 -2.0 -1.0 0.0 1.0 2.0 3.0 4.0
2009 2011 2013 2015 2017 2019 2021 2023 2025
Pension 60+ SCT 10% of HHChild eldest<7 Government cost as % of GDPDonors’ cost as % of GDP

The concept of fiscal space and its applicability to the development of social protection policy in Zambia 1
1. Introduction
In 2005 the Government of Zambia reviewed its social protection programme and developed a Social Protection Strategy (SPS) that was eventually included in Zambia’s Fifth National Development Plan 2006–2011 (FNDP). Since then, as distinct from previous National Development Plans, social protection has become an integral part of the country-wide poverty reduction strategy.
Among other interventions, the Government identified social cash transfers (SCTs) as key non-contributory social protection programmes to alleviate poverty. Yet despite its original stated interest in and commitment to scaling up social protection, the Government has not increased its budget allocation to social protection programmes and thus many of the objectives set out in the SPS and FNDP remain unmet. For SCTs only some pilot schemes have been implemented, financed by external donors with government administrative support, and their coverage remains very low, being limited to only five districts out of a total of seventy-three.
This paper builds on an ILO report (2008) assessing Zambia’s social protection system. Among other findings, the report concluded that the social protection programmes currently in place fail to alleviate poverty because they are underfunded and do not target those most in need. As a way forward to the provision of nationwide social protection coverage the report suggested the introduction of a social protection package consisting of three non-contributory elements: a universal old-age pension for all individuals over the age of 60; a social cash transfer targeting the 10 per cent more destitute or incapacitated households; and a child benefit targeting households with children below a certain age. For the latter, some different specifications of child benefits were analysed.
The aim of this paper is twofold: first, to estimate the short-term and long-term financial costs of implementing this social protection package; second, to provide an analysis of the Government’s capability to finance the adoption of the package. In relation to the former, the estimates suggest that the introduction of the entire package with full nationwide coverage in 2009 would cost between 2.8 and 3.7 per cent of GDP during the first year, declining to 1–1.5 per cent of GDP in the long run (2025). For an idea of the scale of resource mobilization needed, consider that government social expenditure amounts to about 6 per cent of GDP including health and education, with non-contributory social assistance accounting for only 0.1 per cent of GDP.
In relation to the financing of social protection we introduce the concept of fiscal space in Chapter 2. This chapter includes a review of the literature on social protection in low-income countries, introducing the concept of fiscal space, discussing its meaning and outlining the strategies to create it that have been proposed in the literature.
The case study in Chapter 3 critically assesses each of these strategies in the Zambian context. It estimates the cost of the proposed social protection package analyses the financing options available and draws up a policy proposal on how to finance the implementation of the package. This chapter demonstrates that within the current projected medium-term fiscal framework and without any improvement in revenue performance, the Government of Zambia would not by itself be able to introduce the package unless substantial cuts in expenditure in other sectors were to be made and the resources saved diverted to social protection. Avoiding such cuts, we provide clear medium-term resource mobilization targets for the Government, showing that if it is able to adhere to this plan the implementation of the social protection package could be affordable with a relatively small commitment from external donors if phased in over a time period of five years, while with a higher financial commitment from donors the plan could be phased in earlier.

2 The concept of fiscal space and its applicability to the development of social protection policy in Zambia
2. Literature review
Social protection (social security)3 refers to policies that aim to ensure affordable access to health care and to provide certain minimum income security and other support in case of old age, sickness, disability, death and maternity. Social protection also aims at preventing poverty and alleviating existing poverty and exclusion (ILO, 2008, p. 11). Together with investments in education and infrastructure, social protection programmes are increasingly recognized as having great potential for fostering growth and reducing poverty. As Roy et al. (2009) put it, the policy debate in the past has been shaped by a false dichotomy that considered infrastructure investment as growth-enhancing and sustainable, whereas social expenditure would only alleviate poverty without providing the same economic returns, thus being unsustainable. Lately this dichotomy has been overcome as new research4 has highlighted the beneficial influence that investments in one area have on the achievement of other development goals, thus suggesting the importance of a scaling up of multi-sectoral public expenditure programmes. Notwithstanding this renewed focus on social protection, governments still need to be able to finance such programmes without putting the sustainability of their budgets at risk. In this context we may see the emergence of the fiscal space debate as the quest for resources to finance sustainable social public expenditure.
The following section reviews the arguments put forward in the literature in support of social protection investment in low-income countries. Subsequent sections review the current debate on fiscal space and discuss the financing opportunities available to increase social protection expenditure in these countries.
2.1. Social protection in low-income countries
Social protection is a concept in continuous evolution, so that its meaning and scope depend on the socio-economic characteristics of the society to which we apply it. What people meant by social protection at the dawn of the Industrial Revolution differs from the set of policies recommended today in developed economies. At the same time, the social protection policies currently advocated for low-income countries, although they share the same objectives as those pursued in developed countries, have to be framed consistently according to the characteristics of the local labour market and to the local level of socio-economic development.
Following Bonilla Garcia and Gruat’s (2003) definition, in broad terms social protection refers to those policies that target three main objectives: first, guaranteeing to all people access to essential goods and services as a protection against life contingencies; second, adopting proactive measures to lower and protect against risks; and third, promoting the individual and social potential to reduce poverty and foster sustained development.
In this paper we focus on a narrower definition of social protection, restricting our attention to two social protection instruments: non-contributory and contributory programmes.5 As non-contributory we identify those programmes, financed either by the
3 The ILO makes no distinction between the terms “social protection” and “social security”.
4 Especially research carried out in the context of the Millennium Development Goals.
5 Although social protection policies in low-income countries also comprise investments in education and health, in this paper we will not directly consider these two categories, chiefly because they have both received wide attention in the policy debate, and because their contribution
The concept of fiscal space and its applicability to the development of social protection policy in Zambia 3
government or other private institutions, that transfer resources (cash or in-kind transfers) to those deemed in need because of their vulnerability or poverty status. Examples of non-contributory programmes include child benefits, social pensions, food transfers and conditional cash transfers; the list is not exhaustive. Contributory schemes, in contrast, are those measures that are financed out of contributions paid by scheme members; they promise a payment of benefits if some change in circumstances takes place. Examples of contributory schemes are contributory old-age pensions, unemployment benefits and invalidity pensions; again, the list is not exhaustive. Since the latter schemes are based on contributions they necessitate the availability of a developed and formal employment sector (together with an administration capable of collecting the contributions) and for this reason their coverage is usually limited to employees in the formal sector.
In sub-Saharan countries, which are characterized by high informality of economic activities and high levels of subsistence agriculture, non-contributory programmes have a crucial role in alleviating and preventing vulnerable people from falling into poverty. Nonetheless, special contributory programmes could also play an important role even in the absence of an extended formal sector, as new forms of contribution collection and schemes (for instance microinsurance programmes)6 can be designed to cater to employees of the informal sector.
2.1.1 Advantages and disadvantages of investment in social protection
Social protection programmes are increasingly seen as an important pillar for growth together with other public investment projects (infrastructure, health, education). Expenditure in social protection can have a positive impact on growth; some authors (Bonilla García and Gruat, 2003) have even defined social protection policies as productive investments (that is, yielding economic returns).
The implementation of social protection policies could help low-income countries in the achievement of the Millennium Development Goals, both directly and indirectly. Indeed, social protection programmes have the potential to contribute productively to the economy, complementing a wide set of investments in other areas (health, education, economic policies) and fostering the creation of human capital, social capital and economic growth.
Social protection is a viable instrument for alleviating extreme poverty and reducing the share of people living below the poverty threshold, for instance through targeting the most vulnerable groups such as the elderly, children, and persons with disabilities, and through providing support for those who have temporarily fallen into hardship owing to job loss or ill-health. By providing income security in moments of hardship, social protection can prevent the sale of a household’s productive assets, such as livestock, and help to maintain a basic level of nutrition. It can maintain or even increase access to health care and to education that would otherwise have to be relinquished in times of hardship. In addition, cash transfers to households can stimulate the growth of local markets because they increase local demand. At the same time, the availability of minimum income security can insure households from certain risks, protecting them from the shocks of everyday life such as the death of a household member, loss of livestock, crop failure, or commodity price volatility. In turn, this can encourage households and individuals to take more
to the accumulation of human capital is widely recognized. Moreover, because of their importance education and health investments deserve separate treatment beyond the scope of this paper.
6 Microinsurance programmes were originally developed by providers of microcredit as a kind of insurance policy for the lender in case the borrower faced certain contingencies such as death or crop failure.

4 The concept of fiscal space and its applicability to the development of social protection policy in Zambia
(calculated) risks in their economic activities, increasing productivity. In low-income countries social protection expenditure can also be seen as an investment in social cohesion, redistributing resources, reducing inequalities and strengthening the social contract between the State and its citizens. Finally, in sub-Saharan countries, establishing a well-designed system of social protection that provides support in case of income loss can also ease the adoption of much-needed structural reforms that will inevitably, in the short term, bring financial loss to many people.
Having taken into consideration all the benefits that a social protection system can bring to the economic and human development of a society, we need to assess the costs of these policies. Although contributory and non-contributory schemes involve different types of cost, differing as they do in their financing structure, the main forces in place are broadly the same, so that both schemes can be analysed together. Social protection entails two kinds of cost. The first is the financial cost, representing the financial resources needed to pay the transfers, whether in cash or in kind. These costs have both short- and long-term implications, and several sources of financing may be available (contributions, general taxation, external grant, borrowing and so on). The second – related to the first and especially to the source or mix of sources of financing chosen – are the opportunity costs. In general social protection expenditures will have to be financed from internal resources in order to be sustainable in the long run, thus raising taxes. Higher taxes in turn may be a disincentive for taxpayers, in deciding to work or to comply with the tax system. They may also have a negative effect on national savings if taxpayers have a higher propensity to save than beneficiaries do. Lower savings could then imply lower investments and a lower rate of growth.
Opportunity costs also arise with respect to the scale of benefits. Transfers that are too generous can act as a disincentive to work, with benefit recipients weighing up the likelihood of losing the transfers against the possibility of taking a job. Effective social protection will therefore have to include incentives for beneficiaries to leave the programme when their conditions improve. In sub-Saharan countries non-contributory social protection mostly targets extreme poverty and transfers are unlikely to be too generous, so that we might think the above considerations do not apply. However, they still need to be taken into account, since specific financing decisions or scheme design can have indirect effects on the economic activity of the different actors involved.
Social protection investments have a great potential for alleviating poverty, reducing vulnerability and protecting the welfare of the poor. However, the design of effective social protection policies requires careful reflection. The programme design will have to weigh the positive effects on social and economic development against the costs it will address to society. Although in sub-Saharan Africa basic social protection programmes seem to be inexpensive in financial terms (DFID, 2006) this alone cannot be a justification for financing and implementing them. Social protection interventions need to be country- and context-specific. A careful analysis should address and identify the groups to be targeted and the likely short-term and long-term effectiveness of benefits. It should consider the opportunities available for the financing of social protection programmes, identifying the advantages and disadvantages of the different sources. Social protection financing will have to be incorporated coherently into the national fiscal framework.
The following section considers these issues directly, focusing on the financing of non-contributory social protection programmes and analysing the concept of fiscal space in this context.

The concept of fiscal space and its applicability to the development of social protection policy in Zambia 5
2.2. The concept of fiscal space
The notion of fiscal space has recently emerged in the discussions and debates of international organizations (especially in the context of achieving the MDGs). In the opinion of some authors (Perotti, 2007) fiscal space is simply a restatement of two concepts: intertemporal government budget constraint and sustainability of public finance. Perotti argues that it has already been established that in order to increase government expenditure in one sector there is the need to cut expenditure in other sectors, or increase current or future taxes, or inflate away the government debt (for instance by printing money). Also, he argues that favouring investments with higher rates of social marginal value, given the same cost, is an old concept that has informed public policy for a number of years.
In his critique Perotti refers mainly to the concept of fiscal space outlined by Heller (2005), which is the definition that has received wide attention from policy-makers, international organizations and practitioners during recent years. Heller (2005, p. 3)) defines fiscal space as: “the availability of budgetary room that allows a government to provide resources for a desired purpose without any prejudice to the sustainability of a government’s financial position”. Both Perotti and Heller agree that the notion of fiscal space emerged from the pressures on governments to relax the budgetary rules so as to leave room for productive investments that would generate future paybacks. Initially, such investments focused on the accumulation of physical capital (infrastructure projects), but as time went on new calls were raised to apply the same rationale to investment in human capital (mainly education and health) since, it was argued, these investments too would pay for themselves over the long term.
Recently other authors (Roy and Heuty, 2009, pp.7 and 33) have redefined the concept of fiscal space, arguing that the debate needs to be framed in a different way: it should take account of all possible interdependencies between the different funding opportunities and the development process of a country. They define fiscal space as “concrete policy actions for enhancing domestic resource mobilization and the reforms necessary to secure the enabling governance, institutional and economic environment for these policy actions to be effective”. In this definition they clearly emphasize on the one hand the importance of mobilizing domestic resources; though they are not against official development aid (ODA) they claim that it can only be effective if it contributes to an increase in domestic resource mobilization – otherwise countries will never free themselves from dependency on foreign aid. On the other hand, their definition underlines the importance of the role of the context in which reforms have to be implemented, pointing out that the sustainability and effectiveness of policy actions depend on the conditions of the political economy in a country.
Although there is no agreement among economists and policy-makers on the exact meaning of the term fiscal space, how the term has been used in the development context is nevertheless clear. Fiscal space has to do with the financing of policies conducive to the development of a country. The term may be seen both in its narrow sense, as a redefinition of the fiscal rules to which sensible fiscal policy has always been subject, or in broader terms as a full-blown set of policy actions for development.
Notwithstanding the disagreement on the definition of the term, the policies that have been put forward in the literature to create or secure fiscal space for a desired project are very similar.
In order to outline the socio-economic context of our analysis, the next section provides a brief description of the main characteristics and challenges of the African economy, while in the following section we review the main financing opportunities for the creation of fiscal space and discuss their implications for sub-Saharan countries.
6 The concept of fiscal space and its applicability to the development of social protection policy in Zambia
2.3. The African economy 7
Africa is the poorest continent in the world and within this continent sub-Saharan countries8 are among the poorest countries in the world. Of these 47 countries, 30 are classified by the World Bank as low-income (out of 43 low-income countries in the world) and 17 as middle-income (10 lower-middle-incomes and 7 upper-middle-incomes).9
The sub-Saharan region has a population of 800 million, 12 per cent of world population. With an average per capita gross national income (GNI) of US$952 in 2008 the region as a whole would fall below the low-income country threshold set by the World Bank, contributing only 1.45 per cent of total world GNI (or 2.3 per cent using PPP GNI). Sub-Saharan Africa is also the region that has exhibited the highest population growth during recent years, an average of 2.5 per cent compared to a world average of 1.2 per cent. Such a high growth rate is reflected in its population age composition, where children and young people (aged 0–14 years) account for 43 per cent of total population.
The region has experienced relatively high rates of economic growth during the last eight years with gross domestic product (GDP) growth averaging 5 per cent per year. This puts sub-Saharan Africa ahead of Latin America and the Caribbean, as well as of the Middle East and North Africa, in terms of economic growth. However, given the high population growth rate, in per capita terms the sub-Saharan region fared much worse compared to other developing regions, showing the slowest growth rate in GDP per capita in the world.
Sub-Saharan countries are usually regarded as being very different from other developing countries, with widespread corruption, a high degree of social factionalism and frequent civil wars as distinctive characteristics (Fiaschi, 2008). Moreover, it is believed that the colonial legacy contributed to weaken and retard the formation of social and political institutions. Other distinctive characteristics of these countries appear to be low investment rates, low human capital levels and a relative abundance in natural resources (ibid.). Sub-Saharan economies are based chiefly on the extraction of natural resources (for resource-rich countries) and agriculture, and to a much lower extent on manufacturing, especially of traditional goods and objects. Only recently have emerging sectors such as financial services and communications become more important.
The ILO estimates that in 2006 about 65 per cent of the workforce in sub-Saharan countries was employed in agriculture as compared to 75 per cent in 1996 (ILO, KILM, 2009). The industry sector employed about 10 per cent of the workforce (7 per cent in 1996) and the service sector employed the remaining 25 per cent (18 per cent in 1996). But although the service sector expanded the most in that decade, more people continued to work in agriculture than in any other region of the world: in other regions the share of employment in agriculture was never larger than 50 per cent, with a world average of 36 per cent.
7 The analysis in this section and in the following refers mainly to sub-Saharan Africa, thus excluding the North Africa region. All data is from the World Bank’s World Development Report 2009 unless otherwise indicated.
8 Sub-Saharan countries are those countries partially or fully located below the Sahara desert. Of the 54 countries in the African continent only seven are not part of sub-Saharan Africa; they are usually referred to as North Africa and grouped with Middle Eastern countries.
9 The World Bank classification “Gross national income (GNI) per capita”, calculated using the World Bank Atlas method, is used to determine the following income classifications for 2008: low-income, US$975 or less; lower-middle-income, US$976–$3,855; upper-middle -income, US$3,856–$11,905; high income, US$11,906 or over (World Bank list of economies, July 2009).

The concept of fiscal space and its applicability to the development of social protection policy in Zambia 7
By international standards sub-Saharan Africa has a relatively low inactivity rate with only about 25 per cent of the workforce neither employed nor unemployed, and this share has remained quite constant during the last decade. However, an extremely high number of employed persons in the region are in the category of working poor. ILO estimates (KILM) point out that 87 per cent of workers have an income of less than US$2 a day, and this share remained constant throughout the last decade while other regions in the world – notably South-East Asia – saw an improvement over the same period.
In 2007 agriculture, despite being the sector that employs almost two-thirds of the workforce, contributed only 15 per cent, on average, of GDP for sub-Saharan Africa. The sector that contributed the most was services, with a share of 54 per cent, while the share for the industry sector was 32 per cent. In the light of the employment data, this GDP composition confirms that agriculture in sub-Saharan Africa is mostly labour-intensive with very low productivity rates, and in many cases simply subsistence agriculture.
Resource-rich countries in Africa are usually endowed with oil10 or minerals11 (gold, diamond, copper). The economies of these countries are heavily reliant on exports of these natural resources, representing the major share of their exports. Yet despite the contribution of this relatively capital-intensive sector to income generation, these activities generate little employment compared to agriculture or manufacturing. Moreover, an abundance of natural resources has often turned into a curse for poor countries, as conflicts over resource rent and bad administration have led to underinvestment and inefficient use of the resources. A wave of privatization over the last two decades has brought in foreign capital and foreign ownership and this has been reflected in higher productivity but has caused other concerns as governments have lost control over an important source of revenue for their economies.
One predominant characteristic of sub-Saharan economies is their high degree of informality. Although there is no established definition of the “informal economy”, it can be defined from an enterprise-based approach as those activities carried out in firms or establishments which are not registered (unregistered firms, working in the household or in the streets), or from an employment-based approach as the conditions of being employed and theoretically protected by labour laws but in practice unable to claim these rights (ILO, 2008, p. 64).
Schneider (2002) calculates that in Africa the informal economy accounted for an average of 42 per cent of a country’s GDP in 1999/2000. Within the sample there was considerable variation: while in some countries (Nigeria, United Republic of Tanzania, Zimbabwe) the informal economy represented almost 60 per cent of GDP, in others (Botswana, Cameroon, South Africa) it accounted for only around 30 per cent. Africa as a whole is one of regions in the world where the informal economy was most prevalent, together with South America (41 per cent) and the Eastern European transition economies (38 per cent), while in more developed economies the informal sector accounted for less than 20 per cent of GDP.
It seems, too, that the degree of informality is increasing among sub-Saharan African countries. As Xaba et al. (2002) report, in 1990 only 21 per cent of the labour force was employed in the informal economy but in 1998 40–60 per cent of the urban labour force was informal. This evidence is supported by the finding that during the 1990s almost 90
10 Angola, Cameroon, Chad, Democratic Republic of Congo (DRC), Equatorial Guinea, Gabon, Nigeria (IMF Regional Outlook, 2009).
11 Botswana, Côte d’Ivoire, Guinea, Namibia, Saõ Tome, Sierra Leone, Zambia (IMF Regional Outlook, 2009).

8 The concept of fiscal space and its applicability to the development of social protection policy in Zambia
per cent of the new jobs created were informal. The authors identify one of the drivers of this increase in the rise of women’s participation in the informal economy during that decade. Another factor is the wave of privatization in economic activity that took place in many countries. While in many countries the government used to be, and still is, the largest formal-sector employer, once nationalized firms were sold to private investors the new owners began to resort to informal employment and this increased the degree of informality in the economy.
One of the main consequences of this high degree of informality is that a very small share of workers has access to social protection. It is estimated that only 5–10 per cent (Xaba et al., 2002) of the labour force has statutory social protection coverage. This is because many workers and employers cannot afford, or are unwilling to pay, social security contributions, being pressed to satisfy more urgent needs. Other factors that might explain this lack of coverage include lack of trust in the government or in social protection administration, or a lack of knowledge about the social protection entitlements in place, so that informal workers may prefer to resort to other types of coverage12 or may even decide not to be covered at all.
In this context it is therefore of great importance to consider the introduction of forms of universal non-contributory social protection that do not discriminate between worker types (formal vs non-formal). However, non-contributory programmes have to be financed directly from government budgets. The next section investigates a set of possible options for the creation of fiscal space to finance the introduction of non-contributory social protection policies in low-income countries.
2.4. The creation of fiscal space: Policy options
In theory, there are several opportunities to create fiscal space to finance public expenditure, but in practice, not all these proposals are feasible or desirable for a given country. In order to proceed from a theoretical analysis to a practical proposal we have to consider both the desired public programme and the revenue opportunities available within the political and socio-economic context and future growth perspective of the specific country. Also, it is easy to understand that the availability of fiscal space depends on the type of programme that the government wishes to implement; programmes differ in their long-term effects on the growth and development of a country. Further, securing fiscal space involves considerations of the short, medium and long term, as the public programmes for which resources are sought are likely to be long-term projects that will necessitate fiscal space over several years, not only in the year of implementation.
In 2006 the Development Committee of the World Bank and the IMF identified four broad categories of fiscal instruments through which governments can create fiscal space:
� official development assistance (ODA)
� domestic revenue mobilization
� deficit financing
� reprioritization and efficiency of expenditures.
12 Groups or categories of informal workers may set up ad hoc schemes to cover particular risks and offer mutual support, but these schemes appear to be successful only if there is a trusted category association capable of administering the contributions and payouts.

The concept of fiscal space and its applicability to the development of social protection policy in Zambia 9
2.4.1. Official development assistance (ODA)
External grants to finance public expenditure are an appealing source of finance for developing countries, and in the context of the MDGs they are increasingly available (Heller, 2005). In the recent wave of debt relief, both the Heavily Indebted Poor Countries (HIPC) Initiative and the Multilateral Debt Relief Initiative (MDRI) were able to provide some sources of fiscal space to countries eligible for debt relief.
However, external grants cannot be relied on as a long-term sustainable source of fiscal space. First of all, grants are not always predictable and stable, while expenditure targets have to be met every year. Thus only a clear commitment to provide a constant stream of payments is able to generate fiscal space, at least in the medium term if not in the long run (Heller, 2005). Second, as Diaw et al (2009) point out, ODA carries a cost for the beneficiary country: it absorbs management resources, and it often comes with conditionalities attached either about the programmes to be financed or about the reforms to be carried out. Third, an excessive reliance on aid can lead to what the literature defines as “aid dependency” with all the institutional consequences that this brings. Fourth, increasing ODA flows can cause an appreciation in the domestic currency, giving rise to what has been called “Dutch disease” thus worsening the competitiveness of the country. This is not a peculiarity of ODA but of any kind of external financial resource coming into the country. Although it is not a given that increased inflows of external resources will necessarily cause the currency to appreciate, as this ultimately depends on the expenditure financed by such resources (domestic vs foreign expenditure), it is likely that social protection programmes will mostly increase demand for local (domestic) goods, thus potentially causing appreciation. However, this also depends on the amount of resources at stake.13
ODA is thus an attractive source of financing but also brings with it some costs to be considered. Still, for low-income countries with limited scope for access to other resources in the short term, ODA can represent an important source of financing for public expenditure. In any case, careful planning is required for the financing needed in the medium term when domestic resources will have to substitute external grants.
2.4.2. Domestic revenue mobilization
Mobilizing domestic resources can be very attractive for low-income countries because it does not entail the negative side effects of external resources such as appreciation of the domestic currency or Dutch disease, the possibility of constraints on borrowing, or the imposition of external conditionalities on spending. But raising domestic resources entails social, political and economic costs, and the process can be very demanding in terms of both administrative capacity and technical capabilities; in addition, extensive reforms usually require several years for implementation.
Despite this, there is wide consensus that even for poor countries the mobilization of domestic resources will have to be one of the most important sources of public expenditure financing for the achievement of sustained development (Heller, 2005; Roy and Heuty, 2009; Bräutigam et al, 2008; Gupta and Tareq, 2008). This is reflected in the fact that donor countries are increasingly conditioning their external grants on the achievement of revenue mobilization targets in the receiving countries.
13 However, if external grants are used to finance the purchase of imported goods the effect on the appreciation of the currency may be insignificant.

10 The concept of fiscal space and its applicability to the development of social protection policy in Zambia
There are several reasons why revenue mobilization has proved ineffective in sub-Saharan Africa during the past decades. One of the major obstacles to revenue collection is the small size of the formal sector and the importance that the informal sector and subsistence agriculture still play in these economies. These features are in turn reflected in a very thin potential tax base combined with a system, as Heller (1997) points out, of high marginal tax rates and numerous exemptions (usually negotiated with the central government).
However, the failure of African States to raise domestic revenue is a far more complex issue, as the tax systems prevailing today are the product of a peculiar process of development, and the revenue performance of a country is inevitably related to the governance of the State and the relationship and contract in place between the State and its citizens.
The role of taxation
Bräutigam et al (2008, p.1) define taxation as “the new frontier for those concerned with state building in developing countries”, affirming that taxes are central to the life and development of a State and that their role goes far beyond the simple financing of government goals. That a State should collect its own revenue is essential to provide security, to guarantee basic needs and sustain development, but the authors go beyond this, claiming that taxation is also central in building the power of the State and shaping its contract with society. However, they allow that taxation in general (for instance, increasing tax pressure) is not a priori meritorious and State-enhancing in its own right: taxation can also generate unrest and social conflict.
They also argue that in practical terms the relationship between raising revenue and governance has been overly neglected by the aid community, with most efforts having been concentrated on reducing expenditure and raising revenue. One example is the attention received in past years by the “Washington Consensus” doctrine that shaped the debate on reforming taxation systems, arguing for a combination of low tax rates and a broad tax base administered by an independent revenue authority (Heller, 1997, 2005; Gupta and Tareq, 2008). The improvements brought by these reforms to the tax systems and tax administrations of low-income countries notwithstanding, two other authors (Moore and Fjeldstad, in Bräutigam et al, 2008) claim that these tax reforms failed to contribute to State-building, where State-building is defined as: “increasing the capacity of government to interact with societal interests, to obtain support and resources from those interests, and to pursue consistent lines of action” (p. 242). They call for a different approach to tax reform, affirming that governments need to strike a balance between coercive taxation and engaging taxpayer. This, they suggest, can be done by including as many citizens as possible and by providing a transparent, predictable and consensual taxation system.
Taxation and the African State
It is thus apparent that a prerequisite to a discussion about reforming the tax system is an understanding of the evolution of taxation in the sub-Saharan African States. Although a comprehensive analysis is beyond the scope of this paper14 we think it important to highlight some peculiarities and characteristics.
14 For a review of taxation and African States see Von Soest (2008) as well as Fjeldstad and Therkildsen, in Bräutigam et al (2008).

The concept of fiscal space and its applicability to the development of social protection policy in Zambia 11
Von Soest (2008) analyses taxation in Africa taking into consideration three characteristics of the taxation system: enforcement, the provision of public goods, and tax administration. Enforcement (and especially, in the past, coercion) and the provision of public goods are defined as the two different “forces” that provide incentives to citizens to pay taxes. In addition, citizens have to deal with the tax administration in order to pay their taxes and in this context the characteristics of that administration, subject to threats both internal (such as tax officials not carrying out their duties) and external (such as political influence) shapes this latter relationship and together with the two “forces” determines the tax collection activity in a country.
Following Von Soest (2008) and Fjeldstad and Therkildsen (in Bräutigam et al, 2008), African States passed from a pre-colonial stateless condition to a colonial period that saw the creation of new institutions bringing domination and rule. Colonial powers transferred administrative capacity, but this was mostly limited to the capital cities of the overseas territories. For the indigenous population the first experiences of taxation were in the form of poll taxes or head taxes, usually collected by local intermediaries on behalf of the colonial power. Tax collection was also used as a mean to enforce salaried labour, that is, through coercion indigenous communities were forced into the market economy. Direct taxation was mostly absent as it would have implied high administrative efforts and social resistance. Poll taxes and income taxes differed substantially, so that while the former involved a high number of taxpayers the latter were paid by only a few. For instance, in Uganda in 1961 only 10,000 people paid income tax while 1.4 million paid poll tax (Fjeldstad and Therkildsen, in Bräutigam et al, 2008). The other main source of financing consisted of trade taxes and the exploitation of natural resources.
Beginning in the 1960s, once most African countries reached independence the newly formed States continued to enforce the colonial system of tax collection. It is only recently, owing to increased political competition, that the second force (the provision of public goods) has begun to play a major role, as tax policy has become part of the political debate and political programmes, and politicians have started to bargain over taxation with their electorate. However, as Guyer (1992, cited in Bräutigam et al, 2008, p. 134) points out, there is the risk that such bargaining will give rise to the peculiar outcome of political representation but with a preference for no taxation. Nevertheless, it seems there is evidence supporting the provision of public goods, especially at the local level. Hoffman and Gibson (2005, cited in Bräutigam et al, 2008, p. 29) report evidence from the United Republic of Tanzania to the effect that local governments that derive most of their budget from local taxes are more likely to budget higher resources for public services than local governments that derive most of their funding from the central government or donors; the latter budget fewer resources for local services. Thus there seems to be a role for taxation in increasing accountability of the political system and enforcing a social contract, at least at the local level.
The next section presents some methods that aim to identify the potential for increasing domestic revenue mobilization.
Identifying the unexploited potential for revenue mobilization
Gupta and Tareq (2008) suggest that in low-income countries there is potential for a tax increase of between 1 and 4 percentage points (as a percentage of GDP) during the next 10 years. Heller (2005) suggests that, as a minimum, the priority has to be for low-income countries to increase the revenue share of GDP to at least 15 per cent. But any sensible assessment of the possibility of increasing domestic revenue will have to be highly country-specific. Moreover, as can be seen in table 1, sub-Saharan countries have a tax-to-GDP ratio of around 20 per cent on average and this ratio has been quite stable during the

12 The concept of fiscal space and its applicability to the development of social protection policy in Zambia
past thirty years. But although the overall ratio has remained quite constant, the composition of tax revenue has changed significantly. The share of revenues from international trade decreased by an average of 11 percentage points, reflecting the fall in tariffs that has followed the recent waves of globalization. To compensate for this fall in international trade revenues, both direct and indirect tax revenues have had to increase; however, while the latter have increased by 15 percentage points the former have increased by only 5 percentage points.
Table 1. Overall taxation and contributions by category in sub-Saharan Africa: Changes over time
Category 1980-1984 1985-1989 1990-1994 1995-1999 2000-2003
Overall taxation1 20.8 (43) 20.6 (44) 19.8 (45) 19.7 (45) 20.1 (46)
International trade2 33.6 (41) 33.4 (43) 30.3 (43) 26.8 (42) 22.8 (45)
Indirect tax2 21.8 (40) 23.3 (42) 38.8 (43) 35.9 (45) 36.7 (45)
Direct tax2 19.8 (40) 20.7 (42) 24.1 (45) 22.3 (46) 24.9 (46)
1 Percentage of GDP
2 Percentage of overall taxation; number of countries in parenthesis, percentages do not add up to 100.
Source: Brun et al, 2006.
On average, the tax-to-GDP ratio for sub-Saharan countries remains below the average found in more developed economies (for OECD countries, for example, the average in 2000 was 36.1 per cent15) suggesting that there is scope for increasing tax revenues as countries move along their development path. Indeed, if we plot government revenues as a percentage of GDP against the per capita national income (as in figure 2) we can see that there is a linear relationship between these two entities, although a significant variation around the linear regression can be observed. This evidence suggests that revenue levels could be increased in low-income countries as these countries move from low-income to higher-income levels; still, the optimal level of revenue-to-GDP will be highly country-specific.
There are indeed several factors that affect the potential and optimal levels of taxation for a country. As Brun et al. (2006) point out, the amount of revenue a government is able to collect depends on both structural factors and efforts of tax collection. They suggest a methodology through which is possible to separate the two, and argue that by looking at the level of tax effort and its variation over time it is possible to identify over- or under-taxation in a specific country. In their analysis, the structural factors identify the tax potential, which is the rate of taxation one would normally expect in that country. The difference between the observed tax rate and the tax potential is the tax effort. A positive tax effort signifies an over-exploitation of the current resources available in the country, while a negative tax effort signifies an under-exploitation of the country’s potential.
Tax effort is highly dependent on tax policy, which can be changed in the short term, while tax potential depends on structural factors that can only be changed in the long run. Thus, measuring tax effort potentially identifies the fiscal space that can be created in the short term given the resources available in the country. For sub-Saharan Africa Brun et al estimate a positive tax effort for the 1990s and a negative tax effort (–1 per cent) for the years between 2000 and 2003, suggesting a recent regime of under-taxation.
15 See http://www.oecd.org/dataoecd/48/27/41498733.pdf.

The concept of fiscal space and its applicability to the development of social protection policy in Zambia 13
Figure 2. Revenue as a percentage of GDP: An international comparison
Source: World Development Indicators, 2002.
Strategies to increase revenue mobilization
Domestic revenues can come from both taxation and other sources (privatization revenues, fines, fees, rents, and so on). In turn, taxation can be divided into three main categories: direct taxes (generally income tax and corporate tax), indirect taxes (of which value added tax (VAT) is the most important, but also excises and sale taxes), and trade taxes (tariffs on imported and exported goods). In the international aid community there seems to be consensus on the type of instruments available to mobilize internal resources (Heller, 1997, 2005; Gupta and Tareq, 2008; Brun et al, 2006).16 Indeed, although the specific mix of instruments will depend on the current tax performance of each single State most of the strategies proposed apply to a vast majority of countries.
Starting with trade taxes, we have already seen (table 1) that low-income countries have experienced a drastic reduction in this source of income during the last thirty years following the recent waves of trade liberalization. For the coming years further reductions in this source of revenue can be foreseen. Low-income countries need to strengthen their capability to tax international trade. This will probably entail a reorganization of customs administration and a rationalization of customs procedure so as to have a cost-effective and efficient system in place. Also, since the tariff rate is due to decrease further there is a need to extend the tax base as far as possible so as to tackle smuggling and loopholes in the system. And the tariff level is not the only dimension through which a country can become attractive for international trade. There are several others, for instance speeding up customs procedures and increasing transparency while leaving the tariff structure untouched: this would attract business and potentially raise total revenues.
Following the fall in trade taxes, it was indirect taxes that mostly filled the gap in government revenues. Among the indirect taxes VAT has been successfully introduced in many low-income countries during recent years. There is general consensus that further improvements could be made by broadening the VAT base as much as possible and
16 The strategies to increase revenue mobilization proposed within this section are drawn mainly from these authors unless specifically stated.
0
5
10
15
20
25
30
35
40
45
50
2 2.5 3 3.5 4 4.5 5 Log GNI per capita (2002) US$

14 The concept of fiscal space and its applicability to the development of social protection policy in Zambia
reducing the exemptions available. In addition, to simplify the system so as to have only one single rate would help in streamlining the tax administration.
Excises can also contribute to the mobilization of internal resources but they should be limited to those goods for which there are consumption concerns, either because excessive consumption is harmful to users (e.g. tobacco, alcohol) or there is the need to limit excessive consumption from a societal point of view (e.g. petrol).
The strategies suggested for income tax and corporate tax move in the direction of: simplifying the overall system, as a simpler tax policy entails less administrative resources both for the revenue authority and the taxpayer; broadening the tax base as far as possible; and minimizing the number of exemptions granted. This latter point is of particular importance as it contributes to the first two – the simplification of the system and the broadening of the tax base – and it would also reduce the custom of lobbying for exemptions, thus also reducing the waste of administrative resources.
Moore and Fjeldstad (2008, in Bräutigam et al) suggest revising urban property taxation – indeed they claim that property income and property wealth are both under-taxed in most African countries. By strengthening property taxation and decentralizing its administration the central government could provide local authorities with a reliable instrument of financing. As an obstacle to property taxation they identify the high start-up cost of setting up a database of properties, although with today’s IT technology the investment should become profitable.
Another strategy that could be considered is to rationalize the use of tax incentives and tax holidays to attract investment. Gupta and Tareq (2008) affirm that despite the efforts of many sub-Saharan countries to attract foreign enterprises by offering advantageous deals, there has been only a limited increase in foreign direct investment once the mining and other natural resource sectors are excluded. Indeed, they suggest that poor countries should improve the business climate and provide other kinds of incentive, rather than taxation being the only instrument, as this produces a perverse effect on the wider economy. For instance, granting tax holidays to foreign firms or to some sectors can also increase pressure to grant exemptions and tax holidays to domestic firms or to other sectors.
Another measure that has received wide attention is the creation of an autonomous revenue authority (ARA) to which the government delegates the collection of revenues. ARAs are not part of the public administration; they are a separate entity from the Ministry of Finance. The rationale for creating ARAs is to remove revenue collection from political influence and to free revenue authorities from the restrictions of the civil service system. ARAs also usually enjoy much freedom in the hiring of staff and in wage-setting (competitive with the advanced private sector) so as to attract talented people.
The greatest challenge that most low-income countries will face during the years to come is the taxation of the informal sector. As outlined above, the great importance of the informal sector in low-income countries is one of the causes of poor performance in the collection of revenues. Despite this, little attention seems to be devoted to this issue, especially in the guidelines expressed by the Washington Consensus,17 apart from the intention to include small businesses in the VAT system.
Several explanations are put forward as to why taxation of the informal sector has received so little attention. Joshi and Ayee (2008, in Bräutigam et al) suggest that tax practitioners have usually been sceptical about investing heavily in a sector in which there is such a small potential short-term return. Another major obstacle has been the fact that there is
17 Heller (1997) outlines some practical examples of small business taxation.

The concept of fiscal space and its applicability to the development of social protection policy in Zambia 15
little knowledge available about the sector. And the informal sector is highly heterogeneous, including all kinds of situations from very small businesses with an extremely low turnover to relatively medium-sized businesses whose turnovers would justify tax compliance but that simply evade taxes.
In the literature two main suggestions are found concerning taxation of the informal sector: associational taxation and forfeit tax. The first proposal, associational taxation, is advocated by Joshi and Ayee (2008) who argue in favour of a taxation system that is the outcome of negotiations between the government and the business associations (bargaining on behalf of their members). They identify two conditions for the successful implementation of associational taxation. On the one hand the government needs to be under great pressure to raise additional revenues. On the other hand there has to be a counterpart (recognized by its members) representing an informal-sector business category. They cite, as evidence of successful implementation, the agreement by which income tax was introduced to the informal transport sector in Ghana in 1987.
The second proposal is advocated by Heller (1997), who suggests the introduction of a “forfeit” system for small businesses. In such a system businesses would pay taxes in relation to some observable entity, for instance the rent they pay, their turnover, or the size of the business premise. He also suggests the introduction of a withholding tax on payments made to professionals or contractors and a withholding tax levied on imports for small business.
It seems clear that a better knowledge of the informal sector would provide valuable insights into the feasible possibilities of introducing taxes in this sector. Collins et al (2009), for instance, describe in their recent book their extensive study conducted into the financial lives of poor people. They provide interesting findings, especially about the intense financial activities carried on by the poor and the lack of appropriate financial instruments to manage their needs. From their analysis has emerged the finding that there could be scope for the State to engage these citizens consensually in the taxation system by providing appropriate financial tools, for instance social insurance schemes based on flexible accounts.
Finally, another measure to increase the mobilization of domestic revenue could be the provision of financial incentives that are dependent on revenue mobilization efforts. Fjeldstad and Therkildsen (in Bräutigam et al, 2008) report the case of the United Republic of Tanzania where donors, as an incentive to revenue collection by local authorities, introduced a matching scheme in which additional donors’ funds were made available only following local revenue mobilization. Although this is an indirect way to address the problem it could prove successful.
2.4.3. Deficit financing
Borrowing both externally and internally is another way of creating fiscal space. However, loans need to be repaid, so that sooner or later revenue mobilization will have to take place to pay back the funds borrowed. Another restraint facing many countries is that they have already accumulated vast amounts of debt, so that increasing borrowing levels might become unsustainable. As Heller (2005) points out, borrowing for a specific project is one thing, but if borrowing takes place to finance a government fiscal deficit then in order to assess the sustainability of the loan the overall debt position of the country needs to be considered, together with the implications for sustainability.
External borrowing can also expose the domestic currency to an appreciation leading to a loss in competitiveness, as with the receipt of external grants discussed earlier. On the other hand, resorting to the domestic market for funds could push up interest rates, especially in those countries with a low level of monetization. Such upward pressure on

16 The concept of fiscal space and its applicability to the development of social protection policy in Zambia
interest rates could crowd out resources for the private sector, with potentially negative effects on the prospective for growth in the country.
Generally, most sub-Saharan countries have a history of being highly indebted; it is only recently that after the wave of debt forgiveness in the early 2000s most of these countries have improved their debt position. Potentially they could now increase their borrowing both domestically and externally. However, many years of poor debt management and excessive debt accumulation have left scars, and so both borrowers and lenders will have to learn from the errors of the past and carefully plan and assess any new borrowing prospects.
2.4.4. Reprioritization and efficiency of expenditures
In the quest for fiscal space, reprioritizing and increasing the efficiency of expenditure has to be high on the agenda. This will call for an extensive and comprehensive analysis of all items of expenditure so as to identify areas where improvements can be made. Unproductive programmes should be cut, and where possible savings made by joining divisions or tasks. A sensible area in most low-income countries is the wage bill of the civil service, a significant part of government budgets. Valuations on the distribution of the wage bill across government departments and tasks should be made so as to privilege the most productive sectors.
In order to increase expenditure efficiencies Gupta and Tareq (2008) suggest the introduction of expenditure-tracking. They report evidence that the introduction of expenditure-tracking surveys showed that only 15 per cent of the non-wage budgetary resources allocated to education actually reached the schools in Uganda. Other studies identify leakages of about 60 per cent of the budget in education spending in Zambia and the United Republic of Tanzania. Thus they argue in favour of the introduction of systems to track spending across all government sectors, the creation of internal control systems and the development of effective audit procedures.
This chapter has discussed the importance of investment in social protection programmes and in particular, in the context of sub-Saharan countries, the importance of non-contributory social protection programmes. The concept of fiscal space was then presented, and the main strategies put forward in the literature to create fiscal space outlined. In the next chapter we conduct the case study analysis for Zambia.

The concept of fiscal space and its applicability to the development of social protection policy in Zambia 17
3. Case study: Zambia
The adoption in 2005 by the Zambian Government of a Social Protection Strategy (SPS) to be implemented in the Fifth National Development Plan 2006–2010 (FNDP) gave strong indications of a move towards a national system of social protection.
The SPS has two central aims: to ensure that poor people are able to meet their basic needs; and to reduce the exposure of households to risks and shocks. As distinct from previous poverty reduction plans drafted by the Government (such as the First Poverty Reduction Strategy Paper), social protection has now become an integral part of a country-wide poverty reduction strategy. As Holmes and Slater (2008) report, the vision of the SPS is not limited to the provision of assistance but views social protection as a means to actively engage poor and vulnerable citizens in the economy and to encourage growth.
The SPS identifies three categories among the most vulnerable groups in Zambia:
� Low-capacity households. This category comprises those households with very marginal livelihoods. Highly exposed to risks (in particular environmental risks), these households have little capacity to deal with potential shocks. They are usually active in low-input and low-output agriculture, have few active adults, and lack the skills or capacity to engage in alternative economic activities. This category also includes widows, people with disabilities and the elderly. These households could graduate from their current situation in the short or medium term if provided with the assistance to deal with risks.
� Incapacitated households. This category comprises households with almost no economically active adults or with such high dependency ratios as to make it impossible to maintain the household. It includes households with many elderly people or/and children and households in which adult members are affected by HIV/AIDS. The situation of these households will be improved only when the children become economically active.
� Child-headed households and street children.
Following these definitions a set of social assistance (non-contributory) programmes was identified targeting each relevant group (see ILO, 2008, section 4.2, p. 98).
Recently some preliminary reviews (ILO, 2008; Holmes and Slater, 2008; Mboozi, 2008) have begun to assess how the current programmes are faring against their proposed objectives. The main conclusions are that current social protection programmes fail to alleviate poverty because they are underfunded and do not target those most in need. As Holmes and Slater (2008) point out, given the current budget the coverage is too limited and inconsistent, so that it seems highly unlikely that households can graduate from their present conditions. Mboozi (2008) states that the projects under way so far are proving to be effective, but that their funding is insufficient and inconsistent, pointing out that in budget considerations priority is given to infrastructure projects and to projects that are seen as growth-enhancing rather than social protection. These concerns reveal that there is a need to increase awareness of the benefits of social assistance programmes and that current projects need to be better coordinated and strengthened.

18 The concept of fiscal space and its applicability to the development of social protection policy in Zambia
The ILO (2008) assessment of current non-contributory social protection (or social assistance)18 programmes finds that existing programmes account for only 1.5 per cent of all social protection expenditure. This figure represents only 0.2 per cent of GDP, and given current policy there are no prospects of an increase in expenditure in the coming years.
Most of the Zambian population is classified as poor and these social assistance projects should target poverty, helping the poor to rise from their condition. It is thus apparent that the current budget allocation is insufficient and that a scaling up of funding is necessary to ensure nationwide coverage and effective intervention.
3.1. Social cash transfers in Zambia
The Social Protection Strategy and the Fifth National Development Plan identified social cash transfers (SCTs) as key non-contributory programmes to alleviate poverty in Zambia. However, the Government has not yet autonomously implemented any SCT schemes. It is currently running four main non-contributory programmes: the Public Welfare Assistance Scheme (PWAS), the Food Security Pack, the School Feeding Programme (funded by the World Food Programme) and the Project Urban Self-Help Programme. Under these schemes the Government provides a range of benefits in the form of food, health assistance, education, agricultural inputs and short-term jobs.
It is only recently that, under the PWAS and sponsored by international donors, the Government has become involved in small-scale SCT pilot schemes. These are administered by the Zambia Ministry of Community Development and Social Services and are financed by the UK Department for International Development (DFID). In 2009 five pilot schemes running in the districts of Kalomo, Monze, Kazungula, Chipata and Katete (see table 2).
Table 2. Social cash transfer pilot schemes in Zambia
Districts Inception Beneficiaries Type of targeting Type of benefit Monthly benefit (ZMK)
Kalomo Nov. 2004 3 300 households
10% more destitute or incapacitated households
Unconditional 50 000 (with children) 40 000 (no children)
Chipata Jul. 2006 1 400 households Unconditional 40 000 plus 10 000 per primary school child 20 000 x secondary school child
Monze Jan. 2007 2 548 households Soft conditionalities 50 000 (with children) 40 000 (no children)
Kazungula Aug. 2005 627 households Unconditional 70 000 (with children) 50 000 (no children)
Katete Aug.2007 4 706 individuals Social pension 60+ Unconditional 60 000
As shown in table 2, four of the five schemes target the 10 per cent more destitute or incapacitated households while only the Katete pilot scheme targets the elderly, providing an unconditional pension to all individuals over the age of 60. All the benefits (excluding
18 This excludes health and education programmes.

The concept of fiscal space and its applicability to the development of social protection policy in Zambia 19
the Katete pilot) include some form of child benefit, households with children receiving more.
These pilot schemes have undergone several evaluation analyses assessing both the implementation and administration of the schemes, as well as the impact they have had on the beneficiary households or individuals. The results and implications of these will be of essential importance once the schemes are scaled up to national level. A description of the lessons learned from these evaluations is beyond the scope of this paper, but so far as their impact on beneficiaries is concerned it is clear that the pilot schemes have had a significant effect (for a review see ILO, 2008, p. 103; Tembo and Freeland, 2008; and Devereux and Wood, 2008). Cash transfer recipients improved their consumption levels (both food and non-food), and invested in micro-enterprises or bought productive assets (i.e. livestock). The scheme with soft conditionalities saw an improvement in school attendance, while health indicators also improved in most of the schemes.
3.2. The SP package
As a way forward to the provision of nationwide social protection coverage, the ILO (2008) report suggests the introduction of a social protection package that consists of three main elements:
� Social cash transfers (SCT) targeting vulnerable households and covering 10 per cent of all households. The benefit per household assumed is equivalent to the average amount of benefit paid within the current cash transfer pilot schemes, adjusted annually for inflation. The 2009 figure for the benefit is estimated at ZMK47,500 per household per month.
� Universal old-age pension for all persons aged 60 and over. The monthly benefit amounts to ZMK60,000 in 2009 and is to be adjusted annually for inflation.
� A child benefit, paid at the household level, with three possible variants:
o Option 1: For the first child under the age of 7, ZMK60,000 per month;
o Option 2: For the first child under the age of 15, ZMK60,000 per month;
o Option 3: Paid to every household with a child below the age of 5, ZMK60,000 per month.
All three child benefit options assume that the benefit is adjusted annually for inflation. For the first two options there will be a transition period in which the benefit is paid to all households with at least one child below the relevant age threshold; subsequently the benefit will be paid only for the first child.19
Table 3 presents cost estimates for the above five benefits. These estimates assume that the policies cover 100 per cent of the entitled population from the first year of implementation (in this case 2009). This scenario is unlikely, since it will take time to scale up the policies to the national level, so that these estimates represent an upper bound of the costs entailed by the adoption of the policy.
19 The transition period has been envisaged to allow no discrimination against those households with younger children below the age threshold but an older child above the threshold. This is to assure that all households with children receive the benefit at least for one child.

20 The concept of fiscal space and its applicability to the development of social protection policy in Zambia
The old-age pension would cost ZMK418 billion (ZMK523 billion including administrative and delivery costs).20 The targeted social cash transfer would cost ZMK140 billion in 2009 (ZMK182 billion taking into account administrative and delivery costs). The costs of the three child benefits range from ZMK817 billion for Option 3 to ZMK1,433 billion for Option 2. Overall, child benefits appear to be the most expensive policies to implement and this reflects the current population composition in which children aged 0–14 account for almost half (45 per cent) of total population. Overall these estimates suggest that were the Government to roll out all three policies this would cost between ZMK1,721 billion and ZMK2,496 billion in 2009. As a percentage of GDP the cumulative cost in the first year would be between 2.87 per cent and 4.14 per cent.
Table 3. The SP package: Estimated costs of benefits for 2009
Pension 60+ SCT 10% of HH Child <5 Child eldest<7 Child eldest<15
Number of beneficiaries 581,032 245,131 1,134,937 1,714,543 1,990,014
Monthly benefit amount (ZMK) 60,000 47,500 60,000 60,000 60,000
Admin. cost (% of total benefits) 25% 30% 25% 25% 25%
Cost excl. admin. (ZMK billion) 418 140 817 1234 1433
Cost incl. admin. (ZMK billion) 523 182 1021 1543 1791
Cost excl. admin. as % of GDP 0.69% 0.23% 1.36% 2.05% 2.38%
Cost incl. admin. as % of GDP 0.87% 0.30% 1.70% 2.56% 2.97%
Source: Author’s calculations.
Although more expensive at its introduction, the cost of the overall package (as a percentage of GDP) is projected to decline over time. Figure 321 shows a projection22 of the cost estimates for the period between 2009 and 2025. In the long run the cost is projected to decline to 1.59 per cent of GDP if the child benefit of Option 3 is chosen (left chart) or to 1.09 per cent of GDP if the child benefit of Option 1 is chosen (right chart). Benefits are indexed by inflation as measured by the Consumer Price Index.23
20 Administrative and delivery costs are inferred from previous pilots, and from the present author’s calculations. In general, administrative costs are assumed to be higher during the first year of implementation due to capital investment and fixed cost. Moreover, means-tested benefits (SCT) are assumed to be more expensive to administer and monitor.
21 To keep the analysis simple the child benefit of Option 2 is not analysed in detail in conjunction with the other benefits; however, the shape of its cost is similar to Option 1, only scaled up for the higher share of entitled beneficiaries.
22 The projections take the population projections as given. We do not model the effects that the introduction of the policy might have in improving living conditions.
23 Average inflation over the period is assumed to be 4.9 per cent, average growth of real GDP 4.8 per cent and average growth of nominal GDP 10 per cent. These assumptions are taken from IMF and Ministry of Finance and National Planning projections.

The concept of fiscal space and its applicability to the development of social protection policy in Zambia 21
Figure 3. Estimated costs of the SP package as a percentage of GDP, 2009–2025
Source: Author’s calculations.
However, it is unlikely that the Government will be able, or willing, to cover the total entitled beneficiary population in the first year of introduction. Given the scale of the package it is more likely that the Government will introduce the proposed policies gradually, beginning with a few districts and eventually covering the entire nation. Figure 4 presents cost estimates assuming that the full policy package is gradually implemented over a period of five years, starting with 20 per cent of entitled beneficiaries in 2009 and covering an additional 20 per cent each year. By 2013 the policy would be effective nationwide. In this case the cost of the package would be limited to between only 0.57 per cent and 0.75 per cent of GDP in the year of introduction. The costs would then increase with the share of covered beneficiaries.
Also, if real GDP growth and the inflation rate confirm our projections (see table 18 in the Appendix) the cost of the total package as a percentage of GDP would look more affordable in the medium and long term, reaching a maximum of 2–2.5 per cent of GDP around 2013 to then decline in the long run at 1.1–1.6 per cent of GDP.
Figure 4. Estimated costs of the SP package if introduced gradually over five years, as a percentage of GDP, 2009–2025
Source: Author’s calculations.
The specifications of these social protection packages and the outlined introduction strategies are merely a preliminary policy proposal that will have to be agreed with all the relevant stakeholders (the Government, Ministry of Labour and cooperating partners). However, this analysis is a point of departure for opening a serious debate on the possibilities that Zambia has to scale up its social protection programme. The estimates suggest that the costs of providing a basic package of social security in Zambia are in line with, if not cheaper than, similar packages that have been introduced in other low- and middle-income countries. Lesotho and South Africa, for example, provide an old-age social pension that costs approximately 1.4 per cent of these nations’ GDP, while Namibia administers a social pension that costs approximately 0.7 per cent of GDP (HelpAge International, 2009).
0.0 0.5 1.0 1.5 2.0 2.5 3.0 3.5 4.0
2009 2011 2013 2015 2017 2019 2021 2023 2025
Pension 60+ SCT 10% of HH Child <5
0.00.51.01.52.02.53.03.54.0
2009 2011 2013 2015 2017 2019 2021 2023 2025
Pension 60+ SCT 10% of HH Child eldest<7
0.00.51.01.52.02.53.03.54.0
2009 2011 2013 2015 2017 2019 2021 2023 2025
Pension 60+ SCT 10% of HH Child <5
0.00.51.01.52.02.53.03.54.0
2009 2011 2013 2015 2017 2019 2021 2023 2025
Pension 60+ SCT 10% of HH Child eldest<7

22 The concept of fiscal space and its applicability to the development of social protection policy in Zambia
Despite these seemingly favourable international comparisons, government current total expenditure for social protection in Zambia accounts for 0.6 per cent of GDP, while current expenditure in social assistance programmes is 0.15 per cent of GDP (and partly financed by donors). This comparison indicates the scale of the challenge that the Government of Zambia would face if it were to implement the policy: current social protection expenditure would be quadrupled. But this does not mean that the whole package is unaffordable for Zambia; current expenditure in social protection is not a good indicator of the true potential expenditure level that the Government could sustain.
In order to assess the affordability of the proposed package a more careful and detailed analysis is needed. Hence, in the following sections we investigate the possibility of creating fiscal space to finance the scaling up in social protection expenditure. The next two sections provide an overview of the socio-demographic characteristics of Zambia and a description of the country’s economy. Following these, section 3.5 explores the possibility of creating fiscal space in Zambia in light of the strategies outlined in Chapter 2, section 2.4. Finally, section 3.6 outlines a policy proposal to finance the scaling up of social protection expenditure.
3.3. Country characteristics 24
Zambia is a landlocked country covering an area of 752,610 square kilometres – roughly the same size as Austria, Germany and Italy combined. Seven per cent of the land is arable while 57 per cent is occupied by forests. Its neighbouring countries are Angola, Botswana, the Democratic Republic of Congo, Malawi, Mozambique, Namibia, the United Republic of Tanzania, and Zimbabwe.
Zambia has a population of 12 million. The population is young and growing fast, with 46 per cent aged under 14; it has grown at an average rate of 2 per cent per year during the last eight years, but this growth is projected to slow down in the near future. The share of population aged over 60 years accounts for only 5 per cent of the total, reflecting both the high population growth rate experienced in the last decades and the short life expectancy. Life expectancy stands at 41 for men and 42 for women, mostly due to the widespread prevalence of the HIV/AIDS epidemic: the country has an adult HIV prevalence rate of 16 per cent. Child mortality rates are also high even by regional standards (170 per 1,000, for children under the age of 5).
Zambia has been a republic since gaining its independence from the United Kingdom in 1964. Initially, political power was effectively in the hands of the President rather than Parliament, and from 1972 the country experienced almost two decades of single-party democracy. In 1991 Zambia underwent one of the most peaceful transitions from single partitism to multipartitism, and since then the democracy has proved quite stable. According to the World Governance Indicators25 Zambia has achieved a high rate for political stability, greatly outperforming the regional average. It does less well under the indicators for government effectiveness and control of corruption; while it still outperforms the average for sub-Saharan Africa it is by a lower margin. Despite the many improvements made during recent decades there is still potential for the Government to increase its effectiveness and delivery of policies.
24 All data in this section come from the World Bank’s World Development Report 2009 unless otherwise indicated.
25 World Governance Indicators, http://info.worldbank.org/governance/wgi/index.asp.

The concept of fiscal space and its applicability to the development of social protection policy in Zambia 23
With a per capita GNI of US$800 ($1,220 using PPP GNI) Zambia is one of the poorest countries in the world. Only 35 per cent of its population lives in urban areas, with the majority living in the rural areas. Within the country there are wide disparities among regions: while the Lusaka region is the richest part of the country with a poverty incidence of 52 per cent, in the Western region the poverty incidence reaches 89 per cent.
Zambia26 has a relatively high participation rate with 65 per cent of the population economically active and an unemployment rate of 14 per cent. The predominant characteristic of the Zambian labour market is its high degree of informality. According to the 2006 Living Conditions Monitoring Survey (LCMS) 82 per cent of employed persons aged 12 and above worked in the informal sector (75 per cent male and 90 per cent female). The Government employs a relatively small share: only 6 per cent of employed persons work for central or local Government or for parastatal enterprises (although this share increases to 12 per cent for urban employment).
The LCMS 2006 also reveals that the majority of people in Zambia – 70 per cent of all those employed – work in the agriculture, fishery and forestry sectors. There is also wide variation here: in the rural areas this share rises to 90 per cent, whereas it is only 16 per cent in urban areas. In these areas the sectors with the highest employment rates are manufacturing (10 per cent), community, social and personal services (22 per cent) and wholesale and retail trade (27 per cent). The mining sector employs only 2 per cent of employed people (5 per cent in urban areas), while only 1 per cent of employees work for the electricity and gas sector, with a similar percentage in the construction sector. The low employment rates of these latter sectors reflect their capital-intensive nature and indicate that the high growth rates in these sectors have only a marginal impact on employment growth and thus on the improvement of overall living conditions.
The average household monthly income is ZMK510,000 (ZMK276,000 in rural areas and ZMK950,000 in urban areas) and, with an average household size of roughly five members, this means that average per capita income is roughly ZMK100,000 per month (or around US$20). The level of income inequality is high and there are no discernible trends of improvement. Income inequality fell for a few years from 2000 but the latest LCMS (2006) reveals that it is now rising: in 2006 the lower 50 per cent of the population had only 7.8 per cent of total income (compared to shares of 20 per cent in 2004 and 15 per cent in 2002) while the top 10 per cent of the population enjoys 52 per cent of total income (compared to shares of 27 per cent in 2004 and 47 per cent in 2002).
3.4. The Zambian economy
Since the year 2000 Zambia’s economy has expanded at an average annual rate of 5 per cent and is expected to grow at a similar rate in the immediate future. After the decades of economic decline that began in the mid-1970s and a ten-year-long period of liberalization, privatization and stabilization policies, the country has at last begun to experience economic growth. As shown in figure 5, average growth rates went from an average of 1.5 per cent between 1995 and 1999 to 4.5 per cent between 2000 and 2004, and to the recent record level of 6 per cent between 2004 and 2008.
26 Information on the labour market comes from the 2006 Living Conditions Monitoring Survey (LCMS), CSO, Zambia.

24 The concept of fiscal space and its applicability to the development of social protection policy in Zambia
Figure 5. Real GDP annual growth, 2000–2011 (percentages)
Sources: IMF, 2008d, 2009b.
Historically, the economy has relied heavily on copper production and the fortunes of the country are still heavily dependent on the dynamics of the copper market. The high copper prices of the last few years came at the right moment for Zambia as the privatization of mines, together with the capital investments made, have increased both mining efficiency and production. The latest price rises have contributed to a considerable new inflow of capital into the country (figure 6) that will further strengthen the production capacity of Zambia’s copper mines. Overall it is estimated that half of all FDI directed to Zambia has been invested in the mining industry (UNCTAD, 2006). There can be no doubt that the surge in copper prices has contributed to the growth of national product in recent years, although mining is not the only sector that has spurred economic growth.
Figure 6. Copper production and prices, and FDI inflow, 1995–2012
Sources: IMF, 2004, 2008d; UNCTAD, 2006.
Figure 7 presents the contributions to the country’s GDP by various sectors. The first startling fact is the dramatic change in the contribution of the mining industry during the period under analysis. Whereas in 1994 the mining sector accounted for 17 per cent of total GDP, in 1999 it accounted for only 4 per cent and this share has remained invariant over the last ten years. This contrasts with the fact that, as shown in figure 6, both copper production and price remained fairly constant between 1995 and 2003, increasing sharply after 2004. The decline in the importance of copper for the domestic economy can be linked to the sharp and continual depreciation of the Zambian Kwacha between 1996 and 2003 (figure 8). Since almost all the copper extracted in Zambia is exported, earnings are highly influenced by international factors such as the price of copper and exchange rate fluctuations.
0
20
40
60
80
1 000
1 200
1995 1996 1997 1998 1999 2000 2001 2002 2003 2004 2005 2006 2007 2008es
2009pro
2010 pro
2011 pro
2012pro
0
1 000
2 000
3 000
4 000
5 000
6 000
7 000
8 000
000 ton (left axis) 2008 US$ million (left axis) US$ ton (right axis)
copper price
copper production
FDI
01
2345
67
2000 2001 2002 2003 2004 2005 2006 2007 2008 2009proj
2010proj
2011proj

The concept of fiscal space and its applicability to the development of social protection policy in Zambia 25
Figure 7. Contribution to GDP, selected sectors, 1994–2008 (percentages)
Source: Central Statistical Office (CSO), Zambia.
These external factors only partly explain the reduction in the mining share of GDP. The currency depreciated by a factor of four between 1996 and the early 2000s, and this is reflected in a similar four-fold reduction in domestic product contribution. But it is surprising that copper’s contribution to GDP by 2008 seems unaffected by the surge in production, the high copper price and even a relative appreciation of the currency (2005–2008). A share of GDP of only 4 per cent seems far too low for a country such as Zambia. This evidence suggests a possible failure to capture the real impact of copper production; the collection of information on copper production and earnings may well be inaccurate. Strengthening the quality of information is of vital importance, not only in itself but also in order to contribute to a serious and fair debate on the taxation of the mining sector.
A completely opposite story can be told about two other sectors, forestry and construction, both of which have seen sustained growth and are now among the three most important sectors (by share of GDP). In 1994 these sectors accounted for only 4 per cent of GDP, but today they each contribute 16 per cent. The sector that seems to contribute most to the national product is the wholesale and retail sector, although since this sector is dominated by informal operators the estimates may not be accurate.
It is disappointing to see that the importance of the agricultural sector has declined over time, contributing only 3 per cent of GDP despite the relatively large share of investments from abroad and from within the country that this sector has attracted during the last decade (UNCTAD, 2006). The contribution of other sectors such as manufacturing and electricity generation has been fairly constant over time; these two sectors accounted for 10 per cent and 3 per cent of GDP respectively.
0.0
2.0
4.0
6.0
8.0
10.0
12.0
14.0
16.0
18.0
20.0
1994 1995 1996 1997 1998 1999 2000 2001 2002 2003 2004 2005 2006 2007 2008
Forestry Agriculture Mining and quarrying Manufacturing Electricity, gas and water Construction Wholesale and retail trade

26 The concept of fiscal space and its applicability to the development of social protection policy in Zambia
Figure 8. Exchange rate dynamics, 1996–2008
0
1 000 2 000 3 000 4 000 5 000 6 000 7 000 8 000 9 000
10 000
1996 1997 1998 1999 2000 2001 2002 2003 2004 2005 2006 2007 2008
ZMK/USD ZMK/EUR ZMK/GBP
Source: Pacific Exchange Rate Service.
The sectors that have grown the most from 2000 to 2008 are:
� Mining, with an average real growth of 8 per cent per year, accounting for 12 per cent of real GDP growth;
� Construction, with an average real growth of 17 per cent per year, accounting for 24 per cent of real GDP growth;
� Tourism; and transport, storage and communication: these sectors saw average constant price growth rates of 10 per cent per year, accounting for 5 per cent and 15 per cent of real GDP growth respectively.
Other emerging sectors that have made significant contributions to economic growth are financial services, and community, social and personal services.
The Government of Zambia has recently devoted efforts to developing the growth of non-traditional exports so as to free the country from excessive dependence on copper exports. The performance of these has been mixed; table 4 shows their evolution. Overall, between 2003 and 2008 the non-traditional exports sector grew at an average rate of 18 per cent per year, but after these five years of sustained growth almost all exports declined in 2008. The sectors that experienced the highest growth were those linked to copper manufacturing (copper wire and electrical cables). Exports of cane sugar and burley tobacco also grew at an average rate of 22 and 39 per cent respectively over the period analysed. But some other sectors performed poorly: cotton yarn and electricity experienced negative growth rates, fresh fruits never expanded, and fresh flowers grew by only 4 per cent.
On the demand side the growth was mainly driven by investment in capital formation, of which the majority is private foreign-financed capital expenditure. Mining, energy and manufacturing were the three most important sectors (in order of importance) in terms of capital investments.

The concept of fiscal space and its applicability to the development of social protection policy in Zambia 27
Table 4. Non-traditional exports, 2003–2008 (US$ million)
2003 2004 2005 2006 2007 2008 Average yearly growth rate (percentages)
Copper wire 29.2 60.1 102.7 175 195.4 163.5 48%
Cane sugar 30.6 33.4 68 54.3 74.4 60.7 22%
Burley tobacco 19 39.4 69.9 70.5 63.2 74.6 39%
Cotton lint 28.6 51.4 66.8 62.3 37.1 35.4 12%
Electrical cables 16.2 32.7 46.2 103.7 150.5 54.5 50%
Fresh flowers 22.4 25.5 31 34.7 38.3 23.7 4%
Cotton yarn 22.1 23.9 23.4 18.9 12.4 7.5 -17%
Fresh fruits & veg. 26.9 23.2 21 25.3 24.6 27 1%
Gemstones 23.4 16.2 19.6 18.1 28.6 32.4 11%
Gas oil/petroleum oils 16.6 24.3 10.3 10.3 20.9 25.9 23%
Electricity 8.4 4.4 4.8 7 7.3 3.3 -9%
Total 243.4 334.5 463.7 580.1 652.7 508.5 18%
Source: Bank of Zambia
During the past decade the Government has established a reputation for creating a business-friendly environment. Such efforts are reflected in the good rankings that Zambia has received in surveys that look at the investment environment. For instance, the Ease of Doing Business survey (World Bank, 2009) ranks Zambia seventh among all African countries. Also, Zambia belongs to two main regional trade networks, the Common Market for Eastern and Southern Africa (COMESA) and the Southern African Development Community (SADC), this in addition to World Trade Organization (WTO) membership and several bilateral agreements.
The inflow of foreign direct investment (FDI) to Zambia has usually been linked to the performance of the copper sector, as shown in figure 6. Although FDI has been high during the last decade, if the inflow is scaled to the size of the economy it becomes clear that Zambia performed just below the average of the SADC countries (even when South Africa is excluded).
After mining, the sector that received a high share of FDI is services, especially banking, communication and tourism. These investments have led to the establishment of a modern banking sector with the participation of several international players, to the development of mobile communication and to the development of holiday resorts and game parks around the Victoria Falls. Agriculture has also attracted FDI mainly for the production of fruit, flowers, cotton, maize, tobacco and sugar, both for the domestic market and for exports. The inflow of FDI in agriculture also contributed to the transfer of know-how and technical skills through the establishment of privately-sponsored colleges training workers in the agricultural sector. The investments in manufacturing have been mostly linked to the production of goods for the domestic or regional markets. This saw the establishment of firms manufacturing finished copper products (copper wire, cables, rods) and in the production of food and beverages.
28 The concept of fiscal space and its applicability to the development of social protection policy in Zambia
Despite this relatively high level of inflow, FDI in Zambia has failed to promote a continuous transfer of knowledge and skills, with the exception of the agricultural sector. The investment “spillovers” have also been limited, since most of the FDI was concentrated in the relatively capital-intensive and export-oriented mining sector, thus generating little employment (in fact, employment levels in the mining sector are recovering only now after years of employment rationalization) and little interaction with domestic firms.
Two other sectors in which Zambia has great potential are agriculture and electricity generation, but the performance of these has been disappointing in recent years. The agriculture sector employs the majority of employed workers in Zambia and, as mentioned above, is one of the sectors in which there was most transfer of knowledge. Thus any development and expansion in this sector is potentially pro-poor growth-enhancing. However, during the last eight years there has been almost no growth in this sector’s contribution to domestic product. Agriculture is still heavily dependent on weather conditions and recently has also suffered from high prices of inputs such as oil and fertilizer, as well as from inadequate domestic policies – for example, trade restrictions on maize do not allow investors to take advantage of high international maize prices, leading to inefficient underproduction (AEO, 2008).
Electricity supply in 2008 was characterized by repeated load shedding caused by deficits in production. Overall, the electricity network has suffered extensively from years of under-investment resulting from the combination of one of the lowest electricity tariffs in Africa and an inefficient state operator, ZESCO. In the short term energy-saving measures are thought to be the only way to increase the reliability of the service, but in the long term investments are needed to increase power generation and to extend network coverage and reliability. In both 2008 and 2009 tariff increases were agreed and these should provide the base for both a more efficient use of energy by consumers and a scaling up in investments, since these increases have made investment economically viable (AEO, 2008).
A prerequisite for the development of a vibrant private sector is the availability of resources to finance entrepreneurial activities. Domestic firms have benefited from the inflow of foreign capital, mostly in the form of joint-venture capital. However, the availability of domestic credit offers the ability to gain access to financial markets without having to rely on the sentiments of foreign investors often influenced by external conditions. Figure 9 shows the evolution of domestic credit to the private sector as a percentage of GDP: stagnant and slightly falling between 1996 and 2005, then increasing sharply from 2006 and almost doubling as a percentage of GDP. For 2009, however, it is expected to decline following the global financial and economic crisis.
Figure 9. Growth of domestic credit to the private sector, 1996–2008 (percentage of GDP)
02468
10121416
1996 1997 1998 1999 2000 2001 2002 2003 2004 2005 2006 2007 2008
Sources: Bank of Zambia; IMF, 2008d, 2009b.

The concept of fiscal space and its applicability to the development of social protection policy in Zambia 29
Another financing option for private firms is to list at the Lusaka Stock Exchange. The stock market performed well at the beginning of 2008 but declined thereafter. Market capitalization increased from US$4,827 million at the end of 2007 to US$6,532 million in September 2008, but had declined to US$4,106 million by the end of that year. In June 2009 market capitalization was at US$3,902 million, accounting for 37 per cent of GDP. There are currently 21 firms listed on the stock market.
Although the world economic crisis has not left Zambia unaffected, the economic prospects for the country look highly favourable in the medium term. The Government is developing two multi-facility economic zones, two business parks that are attracting several foreign businesses with a focus on manufacturing high-tech products for the African market. Investors are interested, especially those from China and India who have already pledged important investments, specifically in gas and oil exploration in the north-western and western regions, as well other investments in the mining and electricity industries.27
The economic development of future years will be crucial for the overall development of the country. The Government needs to prove that it has the ability to attract and retain foreign investors, and also the ability to create opportunities for the development of the domestic market. The past ten years have shown that economic growth is not automatically followed by improvements in living conditions. In the next few years, therefore, the Government must demonstrate that it is able to turn the favourable economic conditions into an overall improvement of the nation’s condition.
In the context of this need to deliver and foster pro-poor economic growth, the next section considers in detail the options available to the Government in financing an increase in social protection expenditure.
3.5. Creating fiscal space in Zambia
In Chapter 2, section 2.4 we presented four strategies to increase fiscal space. This section considers each of these strategies in turn and assesses their potential in contributing to the creation of fiscal space in Zambia. Detailed analysis of the timescale is limited, in general, to the medium term, for reliable fiscal and macroeconomic projections are mostly limited to this period. However, possible long-term implications and strategies are considered where possible.
3.5.1. Official development assistance (ODA)
This section briefly reviews the flow of official development assistance to Zambia in the past, the current situation of ODA already committed by donor countries and the likely evolution of ODA resources in the near future.
Since 1960, Zambia has received the equivalent of US$35 billion (in 2007 US$) in the form of ODA (OECD, ODA database). To make an international comparison, this figure amounts to around one-third of the Marshall Plan.28 Zambia has received almost US$700 million a year on average in ODA, or roughly $60 per person per year.
27 As reported in the Lusaka Times, 17 March 2009 and 30 September 2008
28 Cost of Marshall Plan: US$12.7 billion, inflation-adjusted: US$115.3 billion.

30 The concept of fiscal space and its applicability to the development of social protection policy in Zambia
Despite this huge influx of aid, the socio-economic development of Zambia has been disappointing. As figure 10 shows, in the 1960s Zambia was outperforming the average for sub-Saharan countries even including South Africa. But from the second half of the 1970s Zambia’s per capita GNI began to decline, while on average the other sub-Saharan countries had improved their position. During the 1980s and 1990s Zambia’s GNI per capita remained markedly below the sub-Saharan average, increasing sharply only after 2000.
Figure 10. GNI per capita, Zambia and other low-income countries, 1962–2007 (current US$)
Source: World Bank database.
From figure 11 we can see that most of the ODA to Zambia has been in the form of grants, although loans have also played an important role, with total loans amounting to roughly 60 per cent of total grants received. However, figure 11 also shows that loan repayments have always represented a small share of total ODA; Zambia eventually failed to pay back most of its ODA loans and has benefited from consistent debt forgiveness (during the years between 1990 and 2007) amounting to 75 per cent of the total amount borrowed.
Figure 11. Types of ODA, 1960–2005 (2007 US$ millions)
Source: OECD, ODA database.
At present several donor countries are actively engaged with the Government in support of the Fifth National Development Plan (FNDP). This commonality of intent is reflected in the Joint Assistance Strategy for Zambia 2006–2010 (JASZ), a framework developed by
-600
-100
400
900
1 400
1 900
1960 1963 1966 1969 1972 1975 1978 1981 1984 1987 1990 1993 1996 1999 2002 2005
Grants (net debt relief)
Gross loans Memo loan repayments
0
10
20
30
40
50
60
70
80
90
100
196 196 196 197 197 197 198 198 198 198 199 199 199 200 200 200
Sub-Saharan Africa Low-income Countries

The concept of fiscal space and its applicability to the development of social protection policy in Zambia 31
12 bilateral donors to harmonize their efforts and to manage donor/government cooperation in support of the FNDP. The JASZ replaced the Country Assistance Strategies of the individual Cooperating Partners. Its key objectives are to establish a shared vision for the Cooperating Partners in support of the FNDP, and to define and to align Cooperating Partners’ priorities with those of the Government. In an effort to increase the effectiveness of ODA effectiveness the JASZ also aims to simplify aid management and transaction costs.
The signatories to the JASZ document are Canada, Denmark, Finland, Germany, Ireland, Italy, Japan, the Netherlands, Norway, Sweden, United Kingdom, United States, the African Development Bank, the European Commission, and the United Nations.
The JASZ adopted a planning framework of five years to harmonize with the FNDP horizon (2006–2010). Within the FNDP it emerged that the budget needed by the Government would amount to ZMK62.6 trillion (US$14.9 billion) of which ZMK48.4 trillion (US$11.5 billion) would be financed directly by the Government and ZMK11.2 trillion (US$2.7 billion) through external financing. This left ZMK3 trillion (US$710 million) of the budget uncovered.
Table 5 shows the 2006 commitment of the Cooperating Partners during the period covered by the FNDP. These figures are probably accurate only for the year 2006, as for all the subsequent years and especially 2009 and 2010 they relied on strong assumptions. Nonetheless, there seemed to be consensus among the Cooperating Partners that Zambia would receive grants or loans of US$700–750 million per year over the time frame of the FNDP. This was considered sufficient to cover the gap.
At the same time, the Cooperating Partners drew attention to the fact that they were concerned by the performance of domestic revenue mobilization, especially by the generation of tax revenue. Thus they would closely monitor developments in this area, because failure to meet the FNDP financing targets would put the execution of the proposed projects at risk. There were also concerns about the ability of the Government to execute the budget, suggesting a low absorption capacity of the public administration to deliver the projects planned. Finally, the Cooperating Partners were also concerned about the lack of government efforts to produce efficiency savings.

32 The concept of fiscal space and its applicability to the development of social protection policy in Zambia
Table 5. The Joint Assistance Strategy for Zambia (JASZ): Cooperating Partner financing commitments, 2006–2010 (US$ millions)
2006 2007 2008 2009 2010
Modalities US$ US$ US$ US$ US$
General budget support 145.2 176.3 175.1 210.5 211.4
Sector-wide approaches (SWAp) 94.4 116.5 106.4 111.8 110.8
Education 55.3 73 69.3 70.4 69.4
Health 39.1 43.5 41.7 41.4 41.4
Project/programme grants 548.8 361.6 361.6 328.5 263.2
Total grants 788.3 696 643.1 650.8 585.4
Project loans 147.4 166.7 118.5 46.6 39
Programme loans 0 40 0 0 0
Total loans 147.4 206.7 118.5 46.6 39
GRAND TOTAL 935.6 902.6 761.6 697.5 624.4
Source: JASZ 2007–2010.
Since both the FNDP and the JASZ time frames will come to an end in 2010, it is difficult to have a clear picture of the ODA resources that will be available for Zambia for the years after that date. The Government is drafting the Sixth National Development Plan to be implemented from 2011, and within this framework the Cooperating Partners will probably commit to specific targets, as they have done for the FNDP. The best estimates to date of ODA resources that will probably be available are those included in the Medium Term Expenditure Framework 2010–2012 (MTEF) of the Ministry of Finance and National Planning, and some anecdotal evidence drawn from IMF (2009b) and AEO (2008) publications. Table 6 reports the levels of grants received by Zambia between 2005 and 2008 and presents the projections available for the years between 2009 and 2012.
Table 6. ODA grants received, 2005–2008, and projections, 2009–2012 (ZMK billions)
IMF projections MTEF projections
2005 2006 2007 2008 est. 2009 proj. 2010 proj. 2009 proj. 2010 proj.2011 proj. 2012 proj.
(ZMK billions)
Grants excl. debt relief
1 825 1 797 2 104 2 073 3 032 3 019 1 550 2 871 2 102 1 867
Budget support 543 423 582 643 832 920 561 771 703 681
Project grants 1 282 1 374 1 522 1 430 2 200 2 100 989 2 100 1 399 1 186
Financing of deficit 84 36 0 113 209 167 495 574 418 140
Grants excl. debt relief
5.6 4.6 4.6 3.9 5.0 4.4 2.5 4.1 2.5 2.0
Budget support 1.7 1.1 1.3 1.2 1.4 1.3 0.9 1.1 0.8 0.7
Project grants 3.9 3.5 3.3 2.7 3.7 3.1 1.6 3.0 1.7 1.2
Financing of deficit 0.3 0.1 0.0 0.2 0.3 0.2 0.8 0.8 0.5 0.1
Sources: IMF, 2009b; MTEF 2010–2012; AEO, 2008.

The concept of fiscal space and its applicability to the development of social protection policy in Zambia 33
Between 2005 and 2008 Zambia received an average of 4.8 per cent of GDP in grants or loans from multilateral or bilateral cooperating partners. Of this almost all was in form of grants; 0.15 per cent of GDP took the form of highly concessional budget support loans.
For the years 2009 and onwards we rely on both IMF and MFNP projections. These differ substantially for 2009, where the MFNP reports grants for only 2.5 per cent of GDP (half the value projected by the IMF, see below), and budget support of 0.8 per cent of GDP. For the following years it is projected that grants will decline sharply to account for only 2 per cent of GDP by 2012.
The grant projections contained in the MTEF seem to be quite conservative, contrasting with the IMF projections which show grants and loans slightly increasing to over 5 per cent of GDP in the medium term (IMF, 2009b). A document in African Economic Outlook (AEO, 2008) also supports the IMF projection, reporting that donors will not reduce their flow of ODA in the near future.
3.5.2. Domestic revenue mobilization
This section analyses the sources of government domestic revenue, focusing on how its composition has changed during the recent years of high economic growth. It also attempts to identify untapped potential and possibilities for increasing revenue and to provide a discussion of the challenges involved.
The main pillar of domestic revenue mobilization for the modern State is an effective tax system that comprises both a rational tax policy and an efficient and capable tax administration.
Tax policy29
Zambian tax policy has its roots in the tax system introduced by the British during the colonial period. Since independence it has provided for the collection of direct taxes on income for individuals, and on profits for companies, as well as trade taxes levied on import and export.
In the early history of the tax system the highest marginal rate on personal income tax reached 60 per cent, and even 90 per cent soon after the copper price crisis. The rate was later brought down to 50 per cent in the 1980s. Such high tax rates were not incentives for tax compliance. Moreover, the policy implied that various exemptions and special regulations were made following complaints by business and individual taxpayers. The tax system was described as “inequitable, unstable, complicated, distortionary and increasingly ineffective in mobilizing revenue”.30
Only in 1992 with the advent of the Third Republic was the tax system rationalized and made simpler to understand and administer. However, the various governments in power during subsequent years have repeatedly failed to reduce the number of tax exemptions; on the contrary, tax incentives continue to be negotiated in bilateral agreements with the Ministry of Finance and National Planning. One example is the favourable deal (for the investors) with which Zambia privatized its copper industry. Investors in mining in the 1990s were able to negotiate both a relatively low royalty rate on mineral extraction and a favourable exemption regime that assured a very low tax take (Fraser and Lungu, 2007).
29 This section is mainly drawn from Von Soest, 2008.
30 Tax PolicyTask Force (TPTF, 1992), cited in Von Soest, 2008.
34 The concept of fiscal space and its applicability to the development of social protection policy in Zambia
The tax policy has been amended recently to provide for taxation of some informal-sector operators (especially mini-taxis), small-scale traders, and small businesses.
Indirect taxation in Zambia also dates back almost to independence: it was in 1973 that the Government introduced a sales tax as a first form of indirect taxation. However, it seems that the administration of and compliance with sales tax was unsatisfactory, and this led to the introduction of value added tax (VAT), at a rate of 20 per cent in 1995 (later reduced to 17.5 per cent). The VAT policy also included many exemptions and even zero rating in some cases.31
The last category of taxes is the trade tax which, as in many other African countries, has contributed to a large part of revenue generation. The trade taxes were characterized by high tariffs intended to protect domestic production; in 1975 a quarter of all traded goods had tariff rates at over 500 per cent. During the following years, especially after the 1990s, a wave of trade liberalization brought lower tariff rates, so that present maximum rates are at about 40 per cent.
Tax administration
The history of tax administration in Zambia can be divided into two separate phases. The first runs from independence (1964) to 1994 when tax administration was part of the state public administration structure (Department of Taxes and Custom and Excise). The second phase started in 1994 following the setting up of the Zambian Revenue Authority (ZRA), a semi-autonomous institution that is charged with the responsibility of collecting revenue for the Government.
The Department of Taxes and Custom and Excise was usually understaffed, subject to political pressure and badly equipped to perform its operations. The ZRA was created in 1994 with the support of the UK Department for International Development (DFID) and the backing of several multilateral and bilateral donors that came to view domestic revenue mobilization as a priority for Zambia. The rationale for the creation of the Authority was to increase revenue collection performance (bringing a more managerial approach to tax collection) and to preserve the tax administration from political influence. The ZRA is now responsible for the collection of direct tax, indirect tax and trade tax (thus replacing the Custom and Excise). Its relationship with the Government is based mainly on revenue collection targets that the Authority is required to meet.
However, as Von Soest (2008) emphasizes, the ZRA has not always been able to act free from political influence. First, the Commissioner General of the ZRA is appointed directly by the President and there is some evidence that in the past political pressure has been exerted on ZRA officials. Following the 2001 elections, however, when President Mwanawasa came to power, the climate has improved slightly, although there have still been some episodes in which tax controls and audits have been used as a means of political control.
Until January 2002 the ZRA was headed by a foreign Commissioner and this seems to have helped in counter-weighting the political pressures. Thus the complete transfer of the Authority into Zambian hands has put its independence at greater risk, especially when it has to bargain its financing and autonomy with the Ministry of Finance and National Planning.
These problems of autonomy notwithstanding, by most definitions the ZRA is a modern revenue Authority with a high potential for delivering an efficient tax collection system. Its
31 Notably farming, where VAT was used as a subsidy on purchases of goods and equipment.

The concept of fiscal space and its applicability to the development of social protection policy in Zambia 35
creation marked the start of a new era in tax administration in Zambia. DFID invested extensively in information and communication technology, so that the ZRA is now equipped with a modern technology infrastructure and a modern software base to collect information. Moreover, in 2006 the ZRA embarked on a new modernization programme.
The level of professionalism and merit within the ZRA ranks quite high, in contrast with some other administration departments. It is able to attract bright professionals, even competing with the private sector in offering attractive wage conditions as well as a highly competitive environment in which merit is rewarded (in the form of renewal of contracts or of promotion).32
Accountability has also increased. There is in place an Internal Affairs Unit that is mandated to investigate cases of corruption or violations of the Code of Conduct such as theft, bribery and so on.33 Revenue collection, though, remains a risky activity, prone to employee misbehaviour, especially within the Custom and Excise division.
So far as the relation of the ZRA with taxpayers is concerned, some enterprises have complained about the enforcement and audit practices to the effect that enforcement tends to be aggressive, and audit uncoordinated. It is also believed that the Authority is tough on the “easy targets” – enterprises that are registered and visible – while being softer on informal and unregistered businesses. This may reflect the ZRA business model, which provides incentives for the maximization of revenue collection from the few visible taxpayers while not pursuing the many small traders in the informal sector.
The ZRA seems committed to engaging fairly with all its stakeholders (government, business and citizens) in increasing awareness about tax compliance and improving its standards of service delivery. The Authority is indeed engaged with the Government, to which it provides tax policy advice and submits tax policy proposals to improve the administration of the tax system in light of its experience in the field. The ZRA is also actively engaged with the taxpayer community, notably through educational and advisory campaigns about the tax system and tax compliance.
Performance of the tax system
At the time of writing34 Zambia tax policy comprises different types of taxes that can be broadly classified as direct taxes, indirect taxes, and customs and excise. Table 19 (in the Appendix) shows the various types of taxes and their specifications. While at first glance the system seems quite simple and easy to interpret, tax policy provides for numerous ad-hoc exemptions that add complications, as mentioned above.
Figure 12 provides indicators of revenue collection performance for the years 2000 to 2010 (projections). It can be seen that as a share of GDP revenue collection has been somewhat disappointing during recent years, and even more disappointing in consideration of Zambia’s sustained growth (5 per cent average growth of GDP) over the period analysed.
32 Employment contracts in the ZRA have a term of five years. The establishment of a good track record is a pre-condition to be considered for renewal.
33 In 2008, 24 investigations into employees took place, six of which were dismissed. In 2007 three employees were convicted or given a custodial sentence.
34 As in all other countries, the tax system in Zambia is in continuous evolution, so that detailed tax policy specifications are subject to frequent change.

36 The concept of fiscal space and its applicability to the development of social protection policy in Zambia
Figure 12. Revenue collection, 2000–2010 (percentage of GDP)
Source: IMF, 2008d, 2009b.
From the figure it can be seen that tax revenue collection has decreased over time as a share of GDP. When mining tax (the part of revenue that is more volatile and subject to external shocks) is excluded it is clear that tax revenue has decreased by roughly 1 per cent of GDP between 2002 and 2009. Between 2007 and 2008 there was an increase in revenue driven by the extra tax generated from the copper sector which enjoyed years of boom prices. Since copper prices have now returned to normal this extra revenue is expected to decline.35
Turning attention to the composition of tax revenue we can see (figure 13) that income tax paid by individuals makes up the highest share of total revenue, contributing over 30 per cent of government revenue. Just below income tax comes value added tax (VAT), contributing 30 per cent of revenue. The sharp decline in VAT between 2007 and 2008, when this source contributed less than 25 per cent of revenue, is cause for concern. Apparently this was caused by administrative challenges (according to the Bank of Zambia, 2008) and the IMF (2009b) reports that the Government will tackle the issues and seek IMF assistance to improve VAT performance.
Company tax has historically contributed very little to revenue generation (less than 10 per cent) although recently the figure has climbed to 15 per cent, probably driven by higher taxation in the copper industry. Mining tax went from contributing almost nothing to revenue generation to almost 15 per cent of revenue in 2008. The last two largest sources of revenue, excise and international trade taxes, provided roughly constant (although slightly declining) shares of revenue over the period, from 15 to 10 per cent.
35 The Government has already abolished the windfall tax introduced in 2008 in the copper industry and has introduced a 100 per cent capital deduction for the mining sector (Budget speech highlights, ZRA, 2009).
12.5
13.5
14.5
15.5
16.5
17.5
18.5
19.5
20.5
2000 2001 2002 2003 2004 2005 2006 2007 2008 est
2009 proj
2010proj
Tax revenue Revenue Tax revenue (excluding mining) ,

The concept of fiscal space and its applicability to the development of social protection policy in Zambia 37
Figure 13. Composition of domestic revenue, percentages of total revenue, 2001–2008
Source: CSO (GFS surveys), ZRA.
The Ministry of Finance and National Planning has recently released the Medium Term Expenditure Framework (MTEF) 2010–2012 that can be used to revise the revenue projections for this period of time and assess the impact of the global financial crisis on projected government revenue generation. The MTEF36 forecasts a slight recovery: tax revenue is expected to increase by 2 percentage points of GDP from 15.9 per cent to 17.9 per cent between 2009 and 2012. Of this increase, 1.6 percentage points are due to an increase in VAT revenue and the remaining 0.4 percentage points are due to higher Custom and Excise duties. Non-tax revenue is also expected to increase by 0.1 percentage point of GDP over the same time span, bringing the total increase in revenue to 2.1 percentage points of GDP.
Figure 14 presents the composition of the tax revenue projections included in the MTEF. Income tax is expected to decrease slightly, accounting in 2012 for 30 per cent of domestic revenue. VAT is expected to recover from the 2009 drop and become the highest contributor to revenue generation, slightly above income tax at 30 per cent of domestic revenue. Company tax is expected to decrease slightly from 12 to 10 per cent of domestic revenue. Excise tax and international trade tax are shown as stable over the period, each contributing 12 per cent of total revenue. Finally, mining tax is also expected to be stable at 5 per cent of domestic revenue.
36 The Medium Term Expenditure Framework (MTEF) 2010–2012 presents several tables reporting projections for the year 2009 onwards that are not consistent among themselves or with the text. For instance, table 5 for 2009 projects grants at ZMK1,550 billion, while tables 2 and 3 project grants at ZMK2,769 billion. Since this is the case for several other items in both tables and text, it is difficult to make good use of these projections. Moreover, these figures are not consistent with IMF estimates; thus no direct comparison of the IMF data with the MTEF projections can be made.
0 5
10
15
20
25
30
35
40
2001 2002 2003 2004 2005 2006 2007 2008
Income tax Company tax VAT
Excises International trade tax Mining tax

38 The concept of fiscal space and its applicability to the development of social protection policy in Zambia
Figure 14. Estimated composition of domestic revenue, percentages of total revenue, 2009–2012
Source: MTEF 2010–2012, Ministry of Finance and National Planning, Zambia.
Related to revenue performance, another disappointing indicator is the accumulation of tax arrears.37 Table 7 reports the levels of tax arrears acknowledged by the Zambia Revenue Authority. Between 2007 and 2008 tax arrears increased by 21 per cent to ZMK4,191 billion. Almost half these arrears are unpaid company tax amounting to ZMK2,020 billion. A comparison of these arrear levels with revenue collection shows that the extra arrears accumulated in 2008 alone made up 7.63 per cent of 2008 total revenue collection, or 1.38 per cent of GDP. In addition, if all the arrears had been collected in 2008, revenue would have been 43 per cent higher, or to put it another way, the Government would have had an extra 7.8 per cent of GDP in revenue.
Table 7. Tax arrears, 2007 and 2008
2007 2008 Difference 2008-2007
Tax arrears (ZMK billion) 3452.00 4191.00 739.00
Percentage of GDP 7.56 7.80 1.38
Percentage of revenue 42.95 43.28 7.63
Source: ZRA Annual Report, 2008.
Because copper accounts for almost 70 per cent of Zambia’s exports, the copper industry has historically played a large role in Zambian economic history. Taxation of the copper sector has always been controversial; debates on the subject attract wide attention from government, corporations and civil society. One of the major criticisms is that the private corporations which hold extraction licences for the mines are not paying enough taxes. As shown above in figure 12, the contribution of mining tax to revenue generation was indeed minimal during the first years of the decade. Table 8 looks at the taxation of the mining sector in more detail. Almost all the copper that is extracted in Zambia is sold abroad (roughly 95 per cent) and this makes the mining sector extremely vulnerable to external shocks, as domestic earnings on copper sales are driven by the interplay of the world
37 Tax arrears are tax liabilities that have been assessed but not yet paid to the tax authority.
0
5
10
15
20
25
30
35
2009 proj 2010 proj 2011 proj 2012 proj
Income tax Company tax VAT Excise duties International trade tax Mining
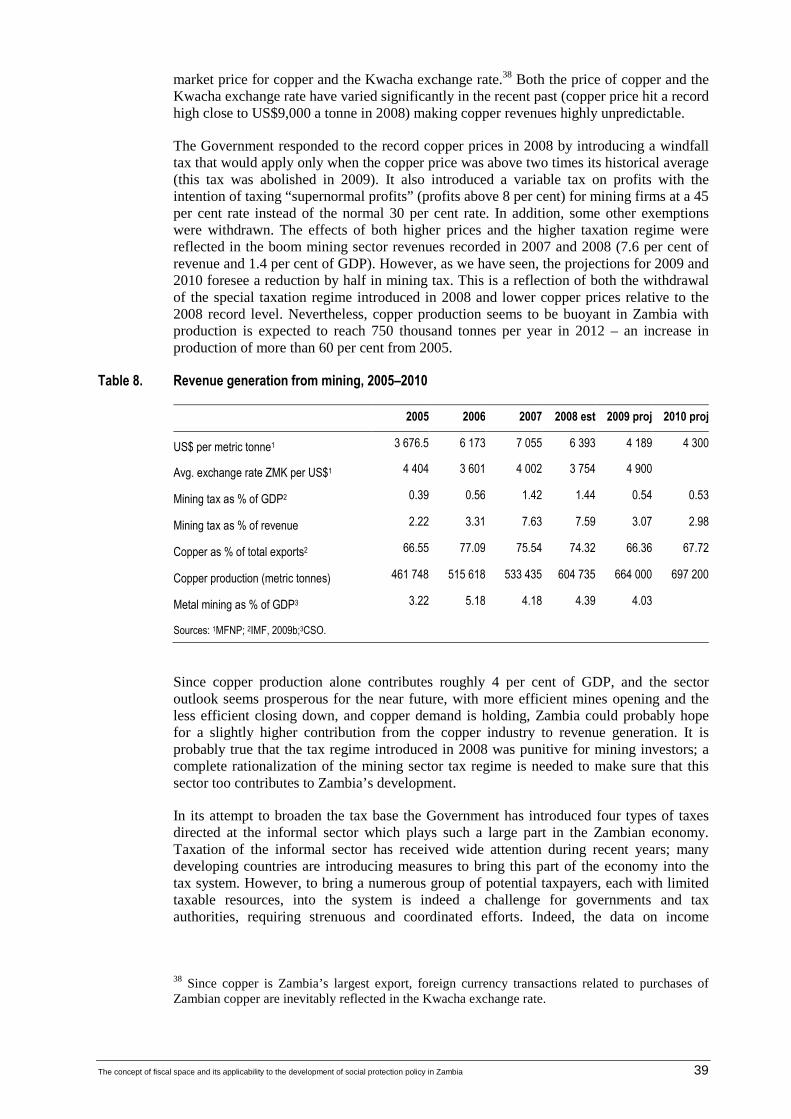
The concept of fiscal space and its applicability to the development of social protection policy in Zambia 39
market price for copper and the Kwacha exchange rate.38 Both the price of copper and the Kwacha exchange rate have varied significantly in the recent past (copper price hit a record high close to US$9,000 a tonne in 2008) making copper revenues highly unpredictable.
The Government responded to the record copper prices in 2008 by introducing a windfall tax that would apply only when the copper price was above two times its historical average (this tax was abolished in 2009). It also introduced a variable tax on profits with the intention of taxing “supernormal profits” (profits above 8 per cent) for mining firms at a 45 per cent rate instead of the normal 30 per cent rate. In addition, some other exemptions were withdrawn. The effects of both higher prices and the higher taxation regime were reflected in the boom mining sector revenues recorded in 2007 and 2008 (7.6 per cent of revenue and 1.4 per cent of GDP). However, as we have seen, the projections for 2009 and 2010 foresee a reduction by half in mining tax. This is a reflection of both the withdrawal of the special taxation regime introduced in 2008 and lower copper prices relative to the 2008 record level. Nevertheless, copper production seems to be buoyant in Zambia with production is expected to reach 750 thousand tonnes per year in 2012 – an increase in production of more than 60 per cent from 2005.
Table 8. Revenue generation from mining, 2005–2010
2005 2006 2007 2008 est 2009 proj 2010 proj
US$ per metric tonne1 3 676.5 6 173 7 055 6 393 4 189 4 300
Avg. exchange rate ZMK per US$1 4 404 3 601 4 002 3 754 4 900
Mining tax as % of GDP2 0.39 0.56 1.42 1.44 0.54 0.53
Mining tax as % of revenue 2.22 3.31 7.63 7.59 3.07 2.98
Copper as % of total exports2 66.55 77.09 75.54 74.32 66.36 67.72
Copper production (metric tonnes) 461 748 515 618 533 435 604 735 664 000 697 200
Metal mining as % of GDP3 3.22 5.18 4.18 4.39 4.03
Sources: 1MFNP; 2IMF, 2009b;3CSO.
Since copper production alone contributes roughly 4 per cent of GDP, and the sector outlook seems prosperous for the near future, with more efficient mines opening and the less efficient closing down, and copper demand is holding, Zambia could probably hope for a slightly higher contribution from the copper industry to revenue generation. It is probably true that the tax regime introduced in 2008 was punitive for mining investors; a complete rationalization of the mining sector tax regime is needed to make sure that this sector too contributes to Zambia’s development.
In its attempt to broaden the tax base the Government has introduced four types of taxes directed at the informal sector which plays such a large part in the Zambian economy. Taxation of the informal sector has received wide attention during recent years; many developing countries are introducing measures to bring this part of the economy into the tax system. However, to bring a numerous group of potential taxpayers, each with limited taxable resources, into the system is indeed a challenge for governments and tax authorities, requiring strenuous and coordinated efforts. Indeed, the data on income
38 Since copper is Zambia’s largest export, foreign currency transactions related to purchases of Zambian copper are inevitably reflected in the Kwacha exchange rate.

40 The concept of fiscal space and its applicability to the development of social protection policy in Zambia
distribution in Zambia imply that there should be a small group of wealthy taxpayers contributing the majority of revenue and a large group of taxpayers either contributing very little each or not even qualifying to pay tax at all. These considerations notwithstanding, it is also the case that many businesses and activities which are “hidden” in informal sector should be paying tax. Devising methods (apart from pure coercion) to engage these entities and bring them into the tax system has to be a priority for developing countries, especially in a medium- and long-term perspective.
The four taxes introduced in Zambia are described in the Appendix, table 19, under the heading “Informal sector taxes”. Turnover tax is charged at 3 per cent (the tax is applied to gross turnover, not income) for businesses with annual turnover of less than ZMK200 million. For turnover levels higher than this threshold businesses should pay company tax at the standard rates. The presumptive tax is applied to taxis and mini-buses and is not directly related to turnover or income, while the base tax applies to market traders and again is not based on income or turnover but is a fixed amount payable each year (ZMK150,000). Finally, advance income tax applies to unregistered businesses and taxes business imports at a rate of 3 per cent (soon to increase to 6 per cent). Table 9 reports the performance of the four informal-sector taxes in 2007 and 2008.
Table 9. Informal sector tax revenues, 2007 and 2008 (ZMK billion)
Tax type 2007 2008
Turnover tax 18.75 23.12
Presumptive tax on taxis and mini-buses 1.82 2.29
Base tax 0.04 0.03
Advance income tax 12.33 60.8
Total informal sector 32.94 86.24
Total revenue 8036.66 9682.70
Share of total revenue 0.41 0.89
Source: ZRA.
For all but one tax there was a marked increase in revenue collection between 2007 and 2008; the only tax that saw a decrease in revenue collection is base tax. However, as might be expected, the total contribution of informal-sector taxes to revenue generation is very low, 0.9 per cent of total revenue in 2008. Still, the impact of these taxes should be quantified not only in monetary terms, but also in its effect in contributing to the creation of awareness about tax compliance and enforcing the contract between the State and its citizens.
Investment incentives
In the context of domestic revenue mobilization it is important to discuss some of the policies that the Government of Zambia is putting in place to attract entrepreneurial activities and investments. Through its Zambia Development Agency the country is trying its best to be seen internationally as investment-friendly; examples include the creation of

The concept of fiscal space and its applicability to the development of social protection policy in Zambia 41
the Multi-Facility Economic Zones (MFEZ)39 and the granting of special exemptions to new investors. Although such investment promotion policies are much needed to attract business and create opportunities for growth, Zambia needs to balance the cost of the incentives it provides with the benefits it can recoup from such policy actions.
There is a risk that by offering incentives mainly based on tax holidays and exemptions such policies, instead of contributing to the growth of the country, undermine its development by eroding the tax base and thus the resources available. In its latest Medium Term Expenditure Framework (MTEF) 2010–2012, the Ministry of Finance and National Planning (MFNP) acknowledges as much: revenues as a percentage of GDP were 3 per cent lower in 2009 than in 2000. Another factor identified by the MFNP is the trade liberalization implied by Zambia’s membership in two regional free trade groups.40
Figure 15. Total tax rates, all African countries, 2008
0
50
100
150
200
250
300
350
Za
mb
iaB
ots
wa
na
Leso
tho
Ma
uri
tiu
sM
ala
wi
So
uth
Afr
ica
Eth
iop
iaR
wa
nd
aN
ige
ria
Gh
an
aS
ão
To
mé
an
d P
rin
cip
eM
oza
mb
iqu
eU
ga
nd
aS
ud
an
Sw
azi
lan
dC
ap
e V
erd
eM
ad
ag
asc
ar
Dji
bo
uti
Zim
ba
bw
eE
gy
pt,
Ara
b R
ep
.G
ab
on
Lib
eri
aS
ey
che
lles
Cô
te d
'Iv
oir
eB
urk
ina
Fa
soTa
nza
nia
Se
ne
ga
lN
ige
rC
am
ero
on
Ke
ny
aTo
go
Ma
liA
ng
ola
Eq
ua
tori
al G
uin
ea
Tun
isia
Co
ng
o, R
ep
.B
en
inM
au
rita
nia
Alg
eri
aE
ritr
ea
Bu
run
di
Ce
ntr
al A
fric
an
Re
pu
blic
Co
mo
ros
Sie
rra
Le
on
eG
am
bia
, th
eC
on
go
, De
m. R
ep
.
Ta
xe
s (p
erc
en
tag
e o
f co
mm
erc
ial p
rofi
ts)
Other taxes (%)
Labor tax and contributions (%)
Profit tax (%)
Median Total tax rate
Source: Doing Business Database, 2008. World Bank, available at http://www.doingbusiness.org/MethodologySurveys/PayingTaxes.aspx
Figure 15 shows the total tax rates for all African countries as computed by the World Bank Doing Business Database.41 It emerges that for a hypothetical business that is mainly
39 For instance, an MFEZ is currently being developed in partnership with Chinese investors in the area of Chambishi on the Copperbelt. This is expected to accommodate 60 firms and create over 6,000 jobs. The MFEZ will focus on the Information and Communication Technology (ICT) sector, both hardware and software. Another area identified is in Lusaka South where Gold Reserve Inc. (GRZ), in partnership with Malaysian and Japanese investors, will develop a second MFEZ.
40 Zambia is part of the Common Market for Eastern and Southern Africa (COMESA) and the Southern African Development Community (SADC).
41 Doing Business, a project of the World Bank, records the taxes and mandatory contributions that a medium-size company must pay or withhold in a given year, as well as the administrative burden in paying taxes and contributions. Taxes and contributions measured include the profit or corporate income tax, social contributions and labour taxes paid by the employer, property taxes, property transfer taxes, dividend tax, capital gains tax, financial transactions tax, waste collection taxes and vehicle and road taxes (http://www.doingbusiness.org/MethodologySurveys/PayingTaxes.aspx).

42 The concept of fiscal space and its applicability to the development of social protection policy in Zambia
concerned with low taxation levels Zambia looks a very attractive location with the lowest total tax rate (16 per cent of profits), closely followed by Botswana. Zambia ranks eighth in the world by lowest total tax rate. However, tax rate is not the only parameter that affects business location decisions, and Zambia does not fare equally well in the overall ranking of the Database under Ease of Doing Business, where it appears as 100 (out of 183 countries, with Singapore ranked first), although among African countries Zambia is still the seventh best ranked.
There is a risk that tax competition between neighbouring countries may erode the domestic tax base. By offering advantageous deals to foreign investors the Government will inevitably be put under pressure from domestic firms to lower the tax burden for them too. This suggests that tax incentives should be used with extreme care, in particular as there are also other instruments that can be leveraged to attract investors: access to credit, a predictable and fair taxation system, enforcement of private contracts, a skilled workforce and a fair and reliable judiciary system.
Decentralization of revenue collection, and tax sharing with the local community
Zambia could take some steps forward by engaging with local communities and decentralizing the collection of some taxes. A National Decentralization Policy is in place, but does not state clearly the amount of resources to which each local community is entitled. Indeed, in the MTEF the Government proposes to introduce a formula-based allocation of grants, based on population adjusted by poverty and deprivation factors. It could take also a different road, making local communities responsible for the collection of some taxes with a regulation on tax sharing that determines the amount of revenue the local community can retain.42 Such a policy could potentially be applied to the collection of taxes from the informal sector. Indeed, in order for collection from the informal sector to be cost-effective and well targeted the tax collector needs to be present in the local community and to know local businesses in depth so as to target potential taxpayers, create awareness and tax education, and negotiate the engagement of local businesses into the taxation system.
3.5.3. Deficit financing
This section reviews the possibilities the Government has to access international financial markets and borrow funds to finance its projects. Zambia has a history of high indebtedness; in the past it has relied mostly on external financing, with little domestic financing. However, following debt forgiveness in the last decade Zambia’s debt position has changed dramatically so that now, as the debt stock looks sustainable, Zambia could enjoy improved opportunities of financing. Crucially, this will depend on how Zambia acts now: it needs to build a good reputation for debt management as soon as possible.
External debt
Like other African countries, Zambia began to accumulate a large amount of external debt in the 1970s. The roots of its dependence on foreign capital are to be found in the copper crisis of 1974 that hit Zambia’s copper-based mono-economy heavily. In addition, during those years the whole world was also facing the first “oil shock” that fuelled inflation and worsened the terms of trade for non-oil-exporting countries. At the same time, because of the high oil prices oil-rich countries had excess resources to invest, leading to a period of low interest rates and easy access to credit. The combination of these factors, together with
42 For further information see Nkombo, Habasonda. and Mwiinga, 2008.

The concept of fiscal space and its applicability to the development of social protection policy in Zambia 43
a new attention of the developed world toward channelling aid to poor countries, meant that large amounts reached African countries in the form of grants or loans.
During the 1970s Zambia entered into three negotiations43 with the IMF and saw its stock of external debt increase from US$0.8 billion to US$3.2 billion in just one decade. In relation to the size of the domestic economy, the ratio of total debt stock to GDP went from just below 50 per cent to almost 100 per cent during that decade (figure 16). Following the copper and oil crises the Zambian Government failed to take appropriate economic measures, so that Zambia remained excessively dependent on its main natural resource and consequently highly vulnerable to external shocks. Moreover, the Government believed that external circumstances would improve rapidly and so did not scale back its expenditure levels; it used the loans to pay for current expenditure.
Figure 16. External debt stock and ODA flow, Zambia, 1970–2006 (percentage of GDP)
Source: World Bank, World Development Indicators.
The debt accumulated during that decade has shaped Zambia’s debt history until recently; Zambia, like many other African countries, became a “debt overhang”44 country. Several explanations of the debt crisis have been put forward, but there is general agreement that three factors contributed to it: poor domestic policy, external shocks, and reckless lending.45
Economic conditions did not improve during the 1980s but Zambia continued to borrow until 1987, when it stopped complying with an IMF stabilization programme and eventually defaulted on the repayment of debt arrears to the World Bank in 1991. The 1991 election brought to power a new coalition (the Movement for Multiparty Democracy, under President Frederick Chiluba) with an ambitious plan of economic reform following the Washington Consensus that consisted in a set of liberalization, stabilization and
43 Zambia external debt statistics, African Development Bank.
44 Debt overhang is the situation in which the debt stock of a country is larger than its expected capacity to repay it. Such a situation implies that even productive investments (investments with a positive NPV) may not be financed because interest on existing debt is higher than the expected return on the new productive investments.
45 For a discussion of this three factors see Prince (2009).
0
50
100
150
200
250
300
350
1970 1972 1974 1976 1978 1980 1982 1984 1986 1988 1990 1992 1994 1996 1998 2000 2002 2004 20060
10
20
30
40
50
60
70
External debt stock as % of GDP (left Y-axis) ODA as % of GDP (right Y-axis)

44 The concept of fiscal space and its applicability to the development of social protection policy in Zambia
privatization policies. Despite this ambitious programme economic performance remained poor, Zambia’s debt position did not improve and the ratio of debt to GDP stabilized at 200 per cent for the decade.
Only after 2000, as the economy started to grow at a faster rate, did Zambia’s ratio of debt to GDP and its solvency status improve. The country began a process of debt relief, first under the Highly Indebted Poor Country relief (HIPC) and later with the Multilateral Debt Relief Initiative (MDRI).
In 1999 the IMF in its preliminary document on the HIPC debt relief (IMF, 2000) estimated that Zambia had nominal outstanding debts of US$6.3 billion (or US$5.1 billion in present value terms). The NPV of external debt was equivalent to approximately 500 per cent of exports and 900 per cent of central government revenues. Twenty-four per cent of government revenue went to servicing the debt.46 The situation looked so difficult that the report concluded that even after full debt relief Zambia’s remaining external debt stock levels would still be unsustainable.
Before debt relief the largest part of Zambia’s external debt (over 90 per cent) was held by the Government (table 10), with the rest held by private and parastatal entities. More than 60 per cent of government debt was contracted with multilateral creditors, mainly the IMF and World Bank, and the rest with bilateral creditors. Just before the debt relief Zambia had no outstanding debt with commercial banks, although it had to enter into litigation with a “vulture fund” (Donegal) to which Romania had sold (for US$3.3 million) its credit of US$15 million originating in 1979.47
46 For further information on HIPC debt relief and eligibility criteria see http://www.imf.org/external/np/exr/facts/hipc.htm.
47 “Vulture fund” is the name given to a company that buys distressed debt (usually at a discount price) and then tries to make a profit by settling a deal with the debtor or often by taking the debtor to court. For further information on Donegal vs Zambia see IMF (2007).

The concept of fiscal space and its applicability to the development of social protection policy in Zambia 45
Table 10. Zambia’s external debt stock, 2003–2008 (US$ millions)
2003 2004 2005 2006 2007 2008 preliminar
Creditor US$mn % US$mn % US$mn % US$mn % US$mn % US$mn %
Total government debt
5,948 91.2 6,620 93.5 4,651 92.0 999 52.6 1,107 53.1 1,200 56.8
Bilateral 2,245 35.2 2,748 38.8 1,014 20.1 277 14.6 287 13.8 295 14.0
Paris Club 2,000 31.2 2,483 35.1 807 16.0 204 10.7 213 10.2 221 10.5
Non-Paris Club 245 3.8 265 3.7 207 4.1 73 3.9 74 3.6 75 3.5
Multilateral 3,703 56.0 3,872 54.7 3,541 70.0 588 30.9 709 34.0 763 36.1
IMF 1,065 14.6 890 12.6 591 11.7 41 2.2 87 4.2 96 4.5
World Bank Group 2,294 36.0 2,359 33.3 2,336 46.2 261 13.7 317 15.2 436 20.7
Others 344 5.4 623 8.8 614 12.1 286 15.1 305 14.6 231 10.9
Suppliers/ Bank 96 1.9 133 7.0 111 5.3 142 6.7
Private/Parastatal debt
547 8.8 460 6.5 405 8.0 902 47.4 981 46.9 910 43.2
Total external debt 6,495 100 7,080 100 5,056 100 1,901 100 2,088 100 2,109 100
Source: Bank of Zambia
During the early 2000s Zambia, assisted by the IMF, implemented several economic reforms under HIPC relief, eventually reaching completion in April 2005. The whole HIPC debt relief process resulted in the cancellation of US$3.9 billion of external debt, and the following year MDRI added another US$2.7 billion – a total of US$6.6 billion in debt relief between 2000 and 2006 (IMF, 2007). The Government and the parastatal and private sectors now hold roughly the same shares of external debt. The largest creditors of the Government of Zambia are again the multilateral ones, with the World Bank again the largest.
Table 11 shows that the debt relief had a dramatic impact on the servicing of external debt (interest and principal repayments). Looking at the ratio of debt service to revenue, and debt service to exports, it is clear that the situation has improved for Zambia. In 2003 and 2004 debt service represented 25 and 37 per cent of domestic revenues respectively (excluding grants) whereas after debt relief this ratio went down to less than 4 per cent for 2006.

46 The concept of fiscal space and its applicability to the development of social protection policy in Zambia
Table 11. External debt service, Government of Zambia, 2003–2008 (US$ millions)
Creditor 2003 2004 2005 2006 2007 2008
Bilateral 72.2 58.4 71.5 38.3 35.9 35.7
Paris Club 47 42.5 50.3 21.1 3.5 9.2
Others 25.2 15.9 23.3 17.2 32.4 26.5
Multilateral 121.6 312.5 85 32.9 24.8 28
Suppliers/Bank 0 0.7 0.8 0.3
Total 193.8 370.9 156.5 71.9 61.5 64
Debt service/revenue (%) 25% 37% 12% 4% 3% 2%
Debt service/exports (%) 15% 18% 6% 2% 1% 1%
Sources: Bank of Zambia, IMF.
During recent years Zambia has continued to borrow from abroad, contracting highly concessional loans. In 2006 and 2007 Zambia negotiated loans for US$80 million and US$140 million respectively. The major lenders were the International Development Association (World Bank) and the African Development Fund (African Development Bank), although China is starting to play a larger role (30 per cent of total 2007 loans). The projects financed under these loans are mainly water supply and sanitation and road/railways projects.
The medium-term external financing outlook for the next three years set out by the Government in the 2010–2012 MTEF anticipates that the Government will continue to seek highly concessional loans from both multilateral and bilateral cooperating partners for an amount of ZMK2,341.4 billion, about US$161 million a year).48 It aims to invest these funds into development projects that yield high economic and social returns, such as roads, water and sanitation facilities, and health and education centres. Moreover, the Government intends to frame any newly contracted external debt within a clearly defined debt sustainability framework.
Domestic debt
Total domestic government debt is comprised of two main categories, public domestic debt and public liabilities. The first category includes government securities and funds borrowed from the banking system. The second category comprises domestic arrears, parastatal debt, pension arrears and determined and yet-to-be-determined litigation cases against the Government and its agencies.
Before debt relief in 2005 domestic debt was less than 20 per cent of total public debt (see table 12); afterwards, however, it became the highest share. Moreover, it is clear from the interest charged on the two types of debt that domestic debt has been always more expensive than external debt, reflecting the concessional nature of the latter. In analysing debt sustainability for Zambia it is therefore necessary to include the sustainability of domestic debt. Also, domestic borrowing needs to be managed carefully so as not to crowd
48 Using an exchange rate of ZMK4,834 per US$1.

The concept of fiscal space and its applicability to the development of social protection policy in Zambia 47
out domestic credit by either pushing up interest rates or rationing credit for the private sector.
In June 2006 following the HIPC and MDRI debt relief, a report prepared for the Ministry of Finance and National Planning reported that domestic debt levels were unsustainable (the Government had failed to meet some obligations), finding that after the 2003 Domestic Debt Policy and Reduction Strategy domestic debt was still off track and further measures had to be taken to reduce the burden of domestic debt on public finances.
In contrast, an IMF study in 2005 found that the situation had improved in Zambia because consecutive years of fiscal discipline had reduced the borrowing needs of the central Government and thus helped lower the domestic interest rate (IMF, 2005). Some government policies such as limiting domestic borrowing to 0.5 per cent of GDP seem to have had a positive effect on the economy: private-sector credit has expanded during recent years, doubling as a percentage of GDP between 2002 and 2007 (IMF, 2008c).
Table 12. Total public debt, 2005–2011
2005 2006 2007 2008 2009 proj. 2010 proj. 2011 proj.
Percentage of public debt
External 82% 32% 33% 34% 45% 49% 51%
Domestic 18% 68% 67% 66% 55% 51% 49%
ZMK billion
External 27,947 3,452 3,836 3,652 5,963 6,996 7,959
Interest 133 60 54 70 90 93 116
Domestic 6,218 7,270 7,719 6,948 7,434 7,385 7,685
Interest 731 689 721 880 979 1042 1004
Percentage of GDP
External 86.1% 8.8% 8.4% 6.8% 9.9% 10.2% 10.4%
Interest 0.4% 0.2% 0.1% 0.1% 0.1% 0.1% 0.2%
Domestic 19.2% 18.5% 16.9% 12.9% 12.3% 10.8% 10.0%
Interest 2.3% 1.8% 1.6% 1.6% 1.6% 1.5% 1.3%
Total public debt 105.3% 27.3% 25.3% 19.7% 22.2% 21.0% 20.4%
Total interest 2.7% 1.9% 1.7% 1.8% 1.8% 1.7% 1.5%
Source: IMF, 2009b.
Debt sustainability
The IMF and the World Bank, within the context of the Monterrey Consensus to meet the Millennium Development Goals (MDGs), have set out some practical guidelines and benchmarks to guide both debtor countries and potential investors in assessing the country’s capacity to repay its current and future debt obligations. This framework is known as the Debt Sustainability Framework (DSF) and was introduced in April 2005.

48 The concept of fiscal space and its applicability to the development of social protection policy in Zambia
DSF countries were divided into three distinct groups or categories, depending on the quality of their policies and institutions (it is believed that the quality of policies and institutions has an impact on the country’s ability to fulfil its debt obligation). Thus, for the same economic fundamentals different quality levels imply different capacity to repay.
For each category the World Bank and IMF defined a set of five Debt Burden Thresholds (DBT). The first three look at the Net Present Value (NPV) of debt as a percentage of, respectively, exports, GDP and revenue, while the other two look at the debt service as a percentage of exports and revenue. Values of these ratios in excess of the DSF Debt Burden Threshold are thus indicators of a debt distress situation: the country should borrow extra funds with caution and investors should be wary in lending, given the country situation.
Zambia is classified as a Medium Policy country under the World Bank’s Country Policy and Institutional Assessment (CPIA) index. Table 13 accordingly shows its Debt Burden Thresholds under the Medium Policy line.
Table 13. Debt Burden Thresholds (DBT) under the Debt Sustainability Framework (DSF)
NPV of debt as a percentage of Debt service as a percentage of
Exports GDP Revenue Exports Revenue
Weak Policy 100 30 200 15 25
Medium Policy 150 40 250 20 30
Strong Policy 200 50 300 25 35
Source: IMF.
The IMF periodically conducts country studies (known as Debt Sustainability Analysis) to assess the debt sustainability of low-income countries. In Zambia the last study of this sort was conducted in 2007, with the following one scheduled for October 2009. From the 2007 report (IMF, 2008c) it emerges that the debt sustainability of Zambia has greatly improved after debt relief. This is reflected in debt ratios that are, and are expected to remain, well below the Debt Burden Threshold. Moreover, the report envisages the possibility that Zambia can take up external loans even on non-concessional terms for the financing of productive investment such as electricity generation.
The debt ratios indicate that external debt for Zambia is sustainable. The NPV to GDP ratio in the IMF simulation is expected to rise from 6 to 7 per cent in the medium term and eventually decline to 4 per cent (DBT is 40 per cent). The NPV to export ratio is expected to rise from 14 to 23 per cent in the medium term and then remain constant in the long term (DBT is 150 per cent). The debt service to export ratio is expected to rise from 1 to 2 per cent (DBT is 20 per cent). However, the IMF points out that to further reduce its vulnerability to external shocks, Zambia should diversify its exports, still very dependent on copper and hence subject to external fluctuations in price and demand for this single commodity.
Zambia also scored well in the IMF analysis regarding the sustainability of public debt. The NPV of domestic debt as a share of GDP is expected to fall from 18.6 per cent in 2006 to 10.4 per cent in 2027. At the same time the NPV of public debt (both external and domestic) as a share of GDP is expected to fall from 27 per cent in 2006 to 16 per cent in 2027. On the other hand, the sustainability of public debt looks more problematic. The ratio of NPV of public debt to revenue in 2006 was 150 per cent. In the IMF baseline scenario such a ratio would be expected to improve (i.e. reduce) in the medium and long

The concept of fiscal space and its applicability to the development of social protection policy in Zambia 49
term, but it is very vulnerable to economic performance so that a lower than expected GDP growth might worsen this ratio and bring it worryingly close to the Debt Burden Thresholds.
Public debt levels therefore seem sustainable, although the Government cannot relax on revenue collection and economic performance: on the contrary, it must strengthen them so as to avoid putting its capacity to service its debt obligations at risk, and so as to assure continuous access to the financial markets.
Debt projections
In the MTEF 2010–2012 the Ministry of Finance and National Planning provides its latest projections of probable financing needs over the period of time considered. As shown in table 14, the MFNP forecasts that for 2009 and 2010 the deficit will be respectively around 2.5 and 3 per cent of GDP. For 2011 and 2012 the deficit is forecast to be reduced by half to 1.5 and 1.15 per cent of GDP. On average, 70 per cent of the financing needs will be covered by accessing the domestic financial market, while the remainder will be covered by concessional loans from the multilateral and bilateral Cooperating Partners. The deficit is thus projected to remain at a very low level over the period, reflecting the continuation of fiscal discipline. Indeed, as revenues are falling the Government seems to be committed to cutting its expenditure rather than increasing borrowing.
Table 14. Financing projections, 2009–2012
MTEF projections as % of GDP 2009 2010 2011 2012
Fiscal balance -2.47 -2.93 -1.50 -1.15
Financing 2.47 2.93 1.50 1.15
Domestic financing 1.69 2.12 1.00 1.00
Net external financing 0.78 0.81 0.50 0.15
Source: Ministry of Finance and National Planning, MTEF 2010–2012
Given the GDP growth projections averaging at more than 5 per cent between 2009 and 2012, it seems that the Government could potentially run larger deficits. Indeed, in light of the debt sustainability analysis the Government could be in a position to increase borrowing to finance projects with a high return (for instance investment in electricity production) or could borrow to finance its own capital investment. This would free up resources that could be used to finance other projects in social protection, education and health. However, so long as the Government is unable to turn economic growth into higher revenue collection this prospect looks far off, and fiscal discipline is undoubtedly still needed.
Sovereign debt rating
Sovereign risk ratings are increasingly used by international investors and aid agencies to make their investment and financing decisions. Sovereign debt rating is useful not only for the debt issuer but would also benefit the whole country, as it offers a benchmark for private-sector creditworthiness. In sub-Saharan Africa only 21 countries have received a rating from one or more rating agencies. Zambia has been scheduled to receive its first sovereign debt rating from one of the major agencies for a couple of years now, but this has not materialized to date. Ratha et al. (2007) estimate that Zambia could have a sovereign debt rating of BB– to BB which would put it in the same ranking as countries such as Brazil and Turkey. Receiving a debt rating would offer a benchmark to the country

50 The concept of fiscal space and its applicability to the development of social protection policy in Zambia
which would greatly ease the evaluation of Zambia’s debt performance and increase the transparency of public finances. It would also help to attract investors. It is therefore to be recommended that Zambia try to get this rating as soon as possible and take steps towards improving it.
In conclusion of this section it can be asserted that Zambia’s external debt government public debt positions have greatly improved during recent years. External debt benefited extensively from debt relief and better management, while domestic debt was put on a sustainable track thanks to better policies that helped to reduce the cost of borrowing and limit the need for domestic finance.
It is generally agreed that Zambia today is potentially under-borrowing; this is probably a reflection of the fact that it has only recently come out of the process of debt relief. There is thus potential to increase borrowing in the short term even on non-concessional terms, but only on condition that the projects to be financed are highly productive and yield economic returns. In this context the IMF (2008c) has pointed out that within Zambia’s debt management strategy there is a need to increase the capacity to evaluate, correctly assess and carry out investment projects.
3.5.4. Reprioritization and efficiency of expenditures
Reprioritization of expenditure, together with domestic revenue mobilization, need to be key priorities if the Zambian Government is to create additional fiscal space in the near future to invest in social protection. Indeed, as we have seen above, both ODA and borrowing seem to offer only limited scope for a scaling up of expenditure. Attention therefore needs to be focused on increasing the domestic resources available.
The previous sections have looked at increasing the revenue collected by the Government. This section analyses the government use of these resources (i.e. government expenditure). Government can find additional resources to finance social protection in two ways: on the one hand it can divert resources from other sectors to increase social protection expenditure; on the other hand it can review and rationalize the entire expenditure side (perhaps targeting only some sectors where efficiency savings are easily identified) with the aim of achieving efficiency savings which can then be employed to financing the desired activities. The first strategy boils down to policy choice (for instance scaling down fertilizer programmes and using the savings to finance social protection), but is subject to pressure from the various interest groups. The second strategy, however, is free from such pressures,49 since potentially everybody can benefit from efficiency savings. But this requires a much higher effort from the Government in identifying those areas in which savings can be made.
A prerequisite for reprioritization of expenditure is that the government “expenditure envelope” is large. Reprioritization and efficiency savings can also be made when smaller expenditure envelopes are available, but with large expenditure levels the scope to generate extra resources is correspondingly larger. Table 15 shows that government expenditure in Zambia amounts to roughly 25 per cent of GDP, slightly below the African average of 28 per cent.50 Yet within total government expenditure it is possible to distinguish between discretionary and non-discretionary expenditure. The latter refers to those expenditure items over which the Government has no short-term discretion, meaning that some
49 Although one interest group opposing efficiency savings could be the public administration itself, if it is administered by corrupt public officials.
50 African Development Bank indicators, 2004.

The concept of fiscal space and its applicability to the development of social protection policy in Zambia 51
expenses such as interest, wages, election expenses and arrears need to be honoured by the Government in the short term. Although in the long term the Government can take policy actions to limit these expenses, for instance by reducing the size of the public administration or by contracting lower debts, the short-term discretion over these items is limited. For the short term, therefore, it is necessary to focus on the Government’s discretionary expenditure in order to produce an indicator of the expenditure envelope available.
According to table 15, discretionary expenditure increased from 9.5 per cent of GDP in 2005 to 12.7 per cent in 2007. Further, according to these IMF figures the share of discretionary expenditure is projected to remain fairly constant at this level, except for a small dip in 2008, until 2010. The increase in projected discretionary expenditure is mainly due to a more than doubling projected level of capital expenditure and to an increase in expenditure for goods and services. In contrast, non-discretionary expenditure was projected to decline over the same period. If foreign-financed capital expenditure is also included in discretionary expenditure, total discretionary expenditure remains fairly constant over the period. Hence from this first analysis it looks as though the amount of domestically-financed expenditure over which the Government has policy discretion has increased recently and thus there is higher potential for revenue reprioritization. However, it is also apparent that a priority for Zambia has been to invest in infrastructure as foreign-financed capital expenditure has declined, and is expected to further decline, over time. Thus the reprioritization of the expenditure that has taken place has mostly benefited domestically-financed capital expenditure. Such a priority might indeed limit the financing of other programmes as it suggests that freed-up available resources are mostly channelled toward capital investment.
Table 15. Government expenditure as a percentage of GDP, 2005–2010, IMF projections
2005 20061 2007 2008 est. 2009 proj. 2010 proj.
Revenue and grants 23.0 21.5 23.3 22.9 22.7 22.3
Expenditures 25.7 23.1 24.5 24.4 25.3 24.0
Current expenditures 18.0 18.4 19.8 19.6 19.8 18.8
Wages and salaries 7.6 7.2 7.7 8.3 8.5 8.1
Interest payments 2.7 1.9 1.7 1.8 1.8 1.7
Domestic arrears payments 0.8 0.6 0.7 1.1 0.6 0.0
Total non-discretionary 11.0 9.8 10.1 11.2 10.8 9.7
Goods and services 3.8 4.5 6.1 5.2 5.8 5.2
Other 3.9 4.7 4.3 4.3 3.8 3.9
Capital expenditure, domestically financed 1.7 1.5 2.4 2.4 3.0 3.6
Total discretionary 9.5 10.8 12.7 11.9 12.6 12.7
Capital expenditure, foreign financed1 5.2 2.6 1.7 1.3 1.9 1.5
Total capital expenditure 7.0 4.1 4.0 3.7 4.9 5.2
Total discretionary including1 14.7 13.3 14.4 13.2 14.5 14.2
Discrepancy overfinancing 0 -1 1 0 0 0
Overall balance -2.6 -2.9 -0.2 -1.7 -2.6 -1.7
1 Does not include debt relief grants.
Source: IMF, 2009b
The data presented in table 15 for the years 2009 and 2010 are projections made at the beginning of 2009, and given the latest events that have shocked the world economy and to which Zambia was not immune, it seems that most of these projections will have to be

52 The concept of fiscal space and its applicability to the development of social protection policy in Zambia
revised (most likely downwards). The recent Medium Term Expenditure Framework (MTEF) 2010–2012 from Zambia’s Ministry of Finance and National Planning can used to revise the expenditure projections for the years after 2009 and assess the likely impact of the world financial crisis on government expenditure. Table 16 presents the expenditure projections included in the MTEF.51
The MTEF states that, due to lower revenue, expenditure on non-priority sectors will be constrained and resources allocated to key sectors such as food production, the development of infrastructure for agriculture, water and sanitation, energy, roads, education, health and public safety. At the same time the Government aims to increase and improve service delivery so as to reduce wasteful expenditure.
Overall, the MTEF projections foresee a sensible reduction over the medium term for government expenditure, decreasing from the current 25 per cent of GDP to 22 per cent. Most of this reduction will take place in current expenditure: from 18 per cent of GDP to 15 per cent.
The wage bill is expected to decrease to less than 8 per cent of GDP by 2011. To achieve this objective wage increases will have to be limited within the CPI level and recruitment will have to fall. The only two sectors for which net recruitment is expected to increase are education and health.
Interest payments are expected to decrease marginally, reflecting better management of domestic debt and low levels of external (mainly concessional) debt. Domestic arrears are also expected to decrease, with the Government committed to settle most of them (for instance to pay pension arrears in full) in 2009. Non-discretionary expenditure is expected to decrease in the medium term by 1 per cent of GDP, confirming the trend of previous years.
51 But see footnote 36.

The concept of fiscal space and its applicability to the development of social protection policy in Zambia 53
Table 16. Government expenditure as a percentage of GDP, 2009–2012, MTEF projections
2009 2010 2011 2012
Expenditures (1) 23.4 24.9 22.3 22.0
Current expenditures (2) 18.1 19.3 16.5 15.2
Wages and salaries (4) 8.4 8.3 8.0 8.0
Interest payments (6) 1.8 1.8 1.6 1.4
Domestic arrears payments (8) 0.6 0.5 0.2 0.2
Total non-discretionary (10) 10.7 10.5 9.8 9.6
Goods and services (5) 5.8 5.2 4.0 4.0
Other (7) 2.1 4.1 2.9 1.8
Capital expenditure1 (3) 4.8 4.5 5.1 6.2
Total discretionary (11) 12.7 13.8 12.0 12.0
Discrepancies (9) 0.0 0.6 0.5 0.4
1 In the METF no distinction is made between domestically and foreign-financed capital expenditure.
(1) (2) (3) (4) (5) Percentages derived directly from METF;
(6) Domestic debt interest METF, external debt interest IMF; (8) Actual value given in METF;
(7) Computed as difference; (9) difference = (1)-(10)-(11).
Source: Ministry of Finance and National Planning, MTEF 2010–2012.
Of all expenditure items, the only one that is expected to grow is capital expenditure, which is projected to rise to 6.2 per cent of GDP by 2012 from a level of 4.8 per cent in 2009. Goods and services expenditure is expected to decrease by 1.8 per cent of GDP between 2009 and 2012. From these items we can deduct that expenditure on other programmes will be limited to roughly 2 per cent of GDP – down from the previous historical level of roughly 4 per cent.
Also, the expenditure projected for the period 2010–2012 will have to consider resources for the national census of housing and population, and the preparation of the 2011 elections.
Overall, these projections predict an overall contraction in fiscal policy, with the Government tightening public expenditure other than capital investments. Allowing for the fact that capital expenditure is a priority area of investment, it seems that the Government will face challenges in providing the resources to finance its various sectors. It is even more difficult to see how it would be possible to finance additional expenditure within this expenditure framework.
Conscious of the challenge, the Government proposes to focus on programmes that improve service delivery and contribute to economic growth and poverty reduction while reducing “any observed wasteful expenditures”. Still, both the IMF (2009b) and the AEO (2008) find that success so far in achieving these efficiency targets has been mixed. So long as revenue collection does not reverse its downward trend, it seems that Zambia has little choice but to scale back its spending plans.

54 The concept of fiscal space and its applicability to the development of social protection policy in Zambia
3.6. A policy proposal
In section 3.2 we presented a minimum package of social protection benefits and provided an estimate of the short- and medium- to long-term costs that the introduction of such a package would entail. An analysis of the Government’s fiscal operations followed, looking both at recent years and at projected future developments (IMF and MFNP projections). The aim of this analysis was to assess to what extent the Government is able to finance the proposed increase in social protection expenditure. The four main strategies investigated are, according to the literature (see section 2.4), to secure a higher ODA flow, enhance domestic revenue mobilization, increase borrowing, and reprioritize the expenditure.
This section builds upon these findings to propose a concrete strategy to finance the adoption of the minimum package of social protection benefits (the SP package).
In recent years government expenditure on non-contributory and contributory social protection (excluding education and health) has been generally low in Zambia, with average allocations of 2.5 per cent. This figure accounts for less than 1 per cent of GDP. Within this expenditure envelope, however, are included both State pension contributions and social assistance expenditure. Once State pension contributions and pension outlays are excluded, the amount the Government allocates to social assistance programmes accounts for less than 0.1 per cent of GDP. Although the Government considers social protection a priority sector within its development plan (as outlined in the Fifth National Development Plan) there is no concrete plan to significantly scale up social protection expenditure. Indeed, in the Medium Term Expenditure Framework 2010–2012 social protection expenditure remains relatively constant, at today’s levels.
The fact that the Government has not allocated a higher budget share of expenditure to social protection expenditure reflects the findings of section 3.5.4. There we saw that government expenditure is indeed expected to decline over the medium term (2010–2012), as a percentage of GDP. Moreover, within the entire expenditure envelope the item that will receive priority (after paying wages, interest rates and arrears) is capital expenditure followed closely by investment in education and health care.
In section 3.2 we saw that the implementation in full, by 2009, of one of the two versions of the minimum package of social protection (the packages differing on the design of the child benefit) would cost on average 2.8–3.7 per cent of GDP (table 3). Between 2010 and 2012 total government expenditure is expected to decline by around the same amount. Also, what was defined as discretionary expenditure (including foreign-financed capital expenditure) is expected to decrease slightly between 2008 and 2009 and then remain fairly constant. Hence, given the Government’s priorities and the reduction in projected expenditure it seems unlikely that it will be able to finance higher levels of social protection expenditure.
However, this does not mean that Zambia cannot afford the adoption of a minimum SP package. As we have seen in the above analysis, there could be many ways by which the Government of Zambia could raise (non-aid) financing for worthwhile projects. Indeed, government projections for the medium term appear to be fairly conservative, probably due to strict fiscal rigour – a consequence of the many years of fiscal mismanagement and of weak administrative and project management capabilities.
During the last decade the effectiveness of government and public administration has improved substantially; this has contributed to the exceptional growth rate that Zambia has experienced in the last eight years. Nevertheless, in the short term it is inadvisable for the Government of Zambia to relax its fiscal rigour without further improving its administrative and project management capabilities, as strengthening these is needed to avoid falling into the growth traps of the past.

The concept of fiscal space and its applicability to the development of social protection policy in Zambia 55
3.6.1. Creating fiscal space: Concrete strategies
In section 3.5 we considered in detail four broad strategies by which the Government of Zambia could raise financing for an increase in social protection expenditure. In this section we suggest a set of possible concrete strategies in light of the analysis conducted above. Although there are potentially many actions that the Government could take to raise financing, not all are equally viable or sustainable in the long term. Here we try to identify some interventions that are viable, relatively non-distortionary and simple to implement. Although it is difficult to quantify the magnitude of the different interventions we suggest some targets that should be within reach.
Box 1 shows a set of key strategies through which Zambia could increase its fiscal space in the medium term. The first and most important calls for an increase in tax revenues. Enhancing the performance of the tax system has to be a priority for Zambia. Although the Government expects to steadily increase the amount of tax revenue it collects between 2009 and 2012, the tax collection projected for 2012 as a percentage of GDP is lower than the amounts collected in 2008, 2000 and 2001. The government projections account only for a recovery in VAT revenue (which collapsed in 2009). We have argued that the Government could and should do more in this respect. A sharp increase in tax rates is inadvisable as this would bring distortions into the economy but, as we have seen, there is scope to slightly increase company tax and also mining tax rates (which are still relatively low) and to keep broadening the tax base, reducing the ad-hoc exemptions. In addition, after the recent introduction of a set of taxes that target the informal sector we would expect informal-sector tax revenue to steadily increase during the first years of introduction and then stabilize after the new tax regime reaches equilibrium. The Government and the Zambia Revenue Authority should also take steps to slow the pace of accumulation of tax arrears. Overall, government targets should be to generate additional revenue of 0.4 per cent of GDP in 2010, rising to 2 per cent of GDP in additional revenue by 2015.
The second strategy refers to improving the management of the public debt. As we have seen, public debt is in much better shape than it was before the debt relief of 2006, but non-concessional (domestic and external) debt is playing an increasingly important role in financing government needs. Thus it is the cost of debt, rather than the stock of debt, that is receiving wider attention now. The Government has a debt management strategy in place which has been relatively successful in lowering the cost of borrowing during the last decade. However, there are suggestions that the Government could further improve the current situation (IMF, 2009b). The target should be to create additional savings of 0.5 per cent of GDP within the next five years.
The third strategy calls for a rationalization of expenditure and a reallocation of resources among the different expenditure items. Assisted by the IMF and the World Bank, the Government is putting in place measures to improve the public payment system and the management of government funds. It should also review the effectiveness, delivery and design of some of its programmes, allocating resources to those that are more effective and better target the priorities set out in the Fifth National Development Plan (for instance, a revision of the Fertilizer Support Programme that saw its budget allocation more than double in 2008, is under way). Overall, the target for this category should be to provide savings of 0.2 per cent of GDP in the first year, followed by savings of 1 per cent of GDP within the next five years.
The last action envisages an increase in both concessional and non-concessional borrowing. We have seen that the outlook for public debt sustainability is favourable and that by many standards the Government is potentially under-borrowing. Despite the extreme care with which any additional borrowing has to be agreed, there is probably scope to increase borrowing to finance projects that guarantee a high economic return.

56 The concept of fiscal space and its applicability to the development of social protection policy in Zambia
These projects mainly concern investments in electricity generation, and transport and communication infrastructure. If the Government is able to demonstrate that it has the ability to effectively plan, deliver and create value for money with these infrastructure projects, it will then be able to attract financing both from concessional and non-concessional lenders. The Government has plans to sharply increase the amount of domestically-financed capital expenditure, and with no increase in resources this would be to the detriment of spending in other sectors. If the Government could increase borrowing it could potentially plan higher capital expenditure while keeping expenditure constant in the other sectors. In the medium term the target would be for the Government to increase borrowing by 0.5 per cent of GDP in 2010 and then by 1 per cent in the following years.
Table 17 presents the targets outlined above. If the Government were able to adhere to this plan this would generate a fiscal space amounting to 1 per cent of GDP in 2010 (of which 0.8 percentage points are additional expenditure).52 The fiscal space would then gradually increase to 4.5 per cent of GDP by 2015 (of which 3 percentage points are additional expenditure).
Table 17. Sources of additional fiscal space, 2010–2016 (percentage of GDP)
Source 2010 2011 2012 2013 2014 2015 2016 onwards
1) Tax revenue 0.4 0.8 1.2 1.6 2.0 2.0 2.0
2) Debt management 0.1 0.2 0.3 0.4 0.5 0.5 0.5
3) Expenditure revision 0.1 0.2 0.4 0.6 0.8 1.0 1.0
4) Borrowing 0.4 0.8 1.0 1.0 1.0 1.0 1.0
Total additional resources 1.0 2.0 2.9 3.6 4.3 4.5 4.5
Social protection financing 0.3 0.7 1.0 1.2 1.4 1.5 1.5
In claiming that the Government could do better than its Medium Term Expenditure Framework for 2010–2012, these projections are to a certain extent optimistic. But they are still conservative compared to Weeks and McKinley (2006), for instance, who propose a much bolder financing plan under which the Government would be able to direct an additional 17 per cent of GDP toward the financing of Millenium Development Goals expenditure (of which 8.8 percentage points are made up of higher domestically-financed
52 Both the savings due to better debt management and efficiency gains in expenditure imply a “recycling” of expenditure that does not increase total expenditure level.
Box 1. Increasing fiscal space: Key actions
1. Enhance revenue mobilization
a. VAT
b. Mining tax
c. Corporate tax
d. Informal sector tax
e. Tax Arrears
2. Improve public debt management
3. Rationalize expenditure
a. Improvement in fiscal management
b. Reallocation of resources
4. Increase concessional and non-concessional borrowing

The concept of fiscal space and its applicability to the development of social protection policy in Zambia 57
expenditure). Moreover, in our projection we assume that only one-third of the extra revenue generated goes to the financing of increased social protection expenditure. We make this assumption because it is understandable that if the Government is able to generate extra resources some will be used to finance capital expenditure and expenditure in health and education (the three priority sectors according to the MTEF 2010–2012).
Among the various actions that would allow the creation of fiscal space, the revenue generated by informal sector tax could play a major part. In 2007 these revenues amounted to ZMK32.94 billion (0.07 per cent of GDP) and in 2008 to ZMK86.24 billion (0.16 per cent of GDP). If this trend is confirmed as increasing numbers of informal workers become engaged in the taxation system, this source of revenue could become an important pillar of social protection financing. Moreover, in committing informal tax revenue as a financing mechanism for social protection the Government would strengthen the social contract that it has established with its citizens. Following the argument that tax revenue is used to provide public goods in exchange, the Government would tax the informal sector in order to provide a basic old-age pension (to which informal workers would not otherwise have access), a child benefit, and income security in case of hardship. Such a policy could in turn have a positive effect on revenue collection, as (informal) taxpayers might “voluntarily” pay taxes as a way of committing themselves to the social contract. In Zambia, where 90 per cent of employed persons work in the informal sector, the logic of this argument might well strengthen the collection of tax revenues.
This section, intentionally, has not included in its analysis any additional resources that the Government could raise from donor countries. This is because we wanted to quantify and set clear targets that the Government itself should aim to achieve. The resort to ODA should only come after a clear and credible government commitment to meet the short-term (to the extent possible) and long-term liabilities implied by the scaling up of social protection expenditure. Donors may well assist the Government during the transition phase from pilots to national scaled-up intervention, but finance commitments by donors should be limited to the short term.
3.6.2. Scaling up social protection expenditure
This section provides models of two alternative timescales for the adoption of the social protection package described in section 3.2: first, the adoption in full of the three benefits starting from 2009, and second, a gradual adoption of the full package in which each year an additional 20 per cent of the entitled population starts receiving the benefits. Both these models assume that the government resources to finance the scaling up are limited to those identified in table 17.
Immediate scaling up
In this model it is assumed that the adoption of the entire SP package takes place all at once, that is, the whole entitled population receives the benefits, starting from 2009.53 Figure 17 shows the projected cost of this immediate scaling up. The positive part of the charts shows the cost of the three benefits (from top to bottom: child benefit, targeted social cash transfer, old-age pension). The negative part shows the proposed financing split between government (top) and donors (bottom). The chart on the left refers to the package in which the child benefit of option 3 is included (i.e. child benefit paid to all households with at least one child below the age of 5), while the chart on the right refers to the package in which the child benefit of option 1 is included (i.e. child benefit is paid to
53 The benefits consist in monthly benefits; we assume that if the package is adopted in late 2009 it is with retroactive effect so that all the 2009 monthly benefits are paid in full.

58 The concept of fiscal space and its applicability to the development of social protection policy in Zambia
households where the eldest child is below the age of 7, although at the beginning it is paid to all households with at least one child below age 7).
Figure 17. Costs and financing of the SP package if introduced fully with immediate effect (percentage of GDP)
Source: Author’s calculations.
From the chart we can see that during the first years the Government will not be able to contribute much to the financing of the package. In the first year in particular, donors will need to finance the entire cost, with the Government gradually taking over the financing in the following years. In table 23 (Appendix) an outline is provided of the projected expenditure and financing sources (split between Government and donors). Given the available resources the Government would not be able to cover all the financing needs of the package that includes the child benefit of option 3 (households with a child under 5 years old). But in the version that includes the child benefit of option 1 (households where the eldest child is under 7 years old) the Government would be able to take over completely by 2015. In this latter version total donors’ commitment would amount to an average of 1.7 per cent of GDP over a period of seven years (from 3.7 per cent in 2009 to 0.07 per cent in 2015). Further, in this scenario the Government would even save resources, as in the long run the cost of the package would decline to approximately 1 per cent of GDP. The total cost to donors would amount to 54 million Euros54 in current prices or an average of 7.7 million Euros per year. Given that for the period 2008–2013 the European Union has committed an average of 80 million Euros55 per year to Zambia, the cost of the scaling up would amount to an average of 9.8 per cent of the Union budget.
In the scenario in which the child benefit of option 3 is adopted, donors’ commitment would amount to an average of 1.55 per cent of GDP during the first seven years (from 2.87 per cent in 2009 to 0.56 per cent in 2015). For the following years (2016–2025) either the Government is able to provide other resources to cover the entire cost or the donors would have to keep contributing a small share of the total cost (from 0.5 per cent of GDP in 2016 to 0.1 per cent of GDP in 2025). In Euro terms the financial commitment for donors would amount to a total of 52 million Euros and on average, on an annual basis, would account for roughly 9.5 per cent of the annual EU budget allocated to Zambia. In this scenario donor support is projected to continue beyond the first seven years.
54 The exchange rate used is: 1 Euro = ZMK6,290. The same exchange rate is used for all conversion into Euros.
55 The European Union has committed 475 million Euros to Zambia over the six-year-period 2008–2013 (EC, 2007). In our calculations we assume that it commits a similar amount also for the following years, that is, about 80 million Euros per year.
-4.0
-3.0
-2.0
-1.0
0.0
1.0
2.0
3.0
4.0
2009 2011 2013 2015 2017 2019 2021 2023 2025
Pension 60+ SCT 10% of HHChild <5 Government cost as % of GDPDonors’ cost as % of GDP
-4.0
-3.0
-2.0
-1.0
0.0
1.0
2.0
3.0
4.0
2009 2011 2013 2015 2017 2019 2021 2023 2025
Pension 60+ SCT 10% of HHChild eldest<7 Government cost as % of GDPDonors’ cost as % of GDP
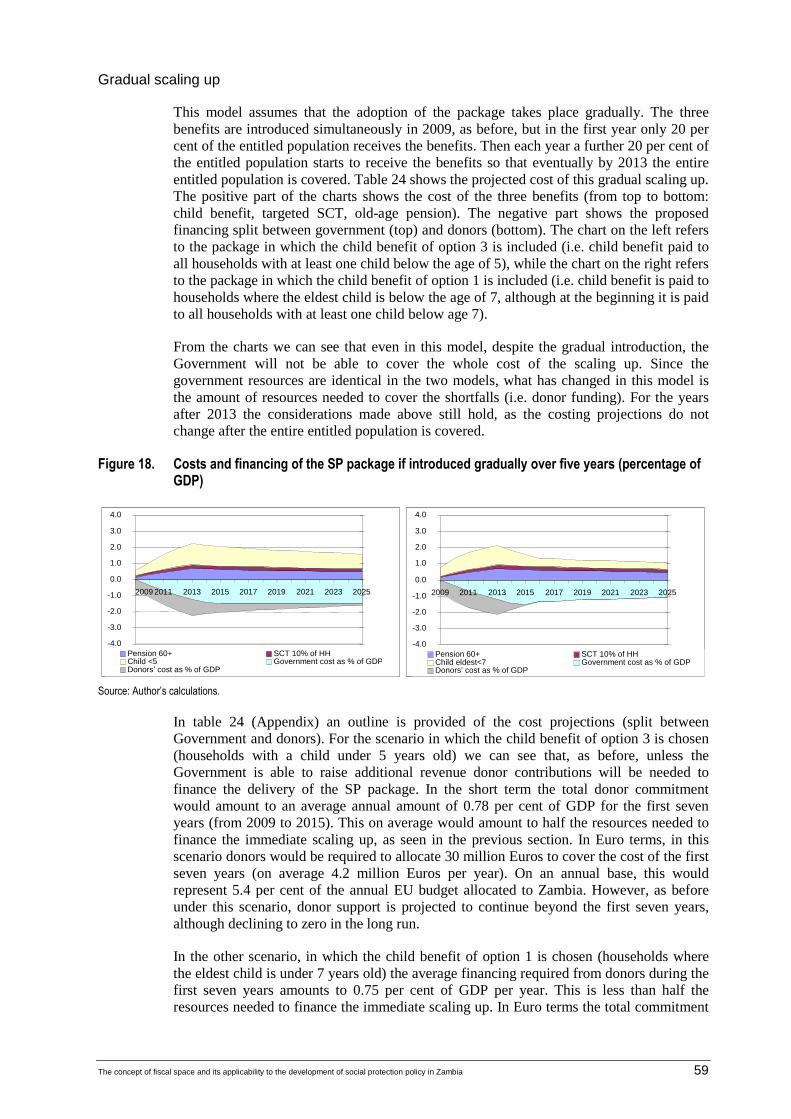
The concept of fiscal space and its applicability to the development of social protection policy in Zambia 59
Gradual scaling up
This model assumes that the adoption of the package takes place gradually. The three benefits are introduced simultaneously in 2009, as before, but in the first year only 20 per cent of the entitled population receives the benefits. Then each year a further 20 per cent of the entitled population starts to receive the benefits so that eventually by 2013 the entire entitled population is covered. Table 24 shows the projected cost of this gradual scaling up. The positive part of the charts shows the cost of the three benefits (from top to bottom: child benefit, targeted SCT, old-age pension). The negative part shows the proposed financing split between government (top) and donors (bottom). The chart on the left refers to the package in which the child benefit of option 3 is included (i.e. child benefit paid to all households with at least one child below the age of 5), while the chart on the right refers to the package in which the child benefit of option 1 is included (i.e. child benefit is paid to households where the eldest child is below the age of 7, although at the beginning it is paid to all households with at least one child below age 7).
From the charts we can see that even in this model, despite the gradual introduction, the Government will not be able to cover the whole cost of the scaling up. Since the government resources are identical in the two models, what has changed in this model is the amount of resources needed to cover the shortfalls (i.e. donor funding). For the years after 2013 the considerations made above still hold, as the costing projections do not change after the entire entitled population is covered.
Figure 18. Costs and financing of the SP package if introduced gradually over five years (percentage of GDP)
Source: Author’s calculations.
In table 24 (Appendix) an outline is provided of the cost projections (split between Government and donors). For the scenario in which the child benefit of option 3 is chosen (households with a child under 5 years old) we can see that, as before, unless the Government is able to raise additional revenue donor contributions will be needed to finance the delivery of the SP package. In the short term the total donor commitment would amount to an average annual amount of 0.78 per cent of GDP for the first seven years (from 2009 to 2015). This on average would amount to half the resources needed to finance the immediate scaling up, as seen in the previous section. In Euro terms, in this scenario donors would be required to allocate 30 million Euros to cover the cost of the first seven years (on average 4.2 million Euros per year). On an annual base, this would represent 5.4 per cent of the annual EU budget allocated to Zambia. However, as before under this scenario, donor support is projected to continue beyond the first seven years, although declining to zero in the long run.
In the other scenario, in which the child benefit of option 1 is chosen (households where the eldest child is under 7 years old) the average financing required from donors during the first seven years amounts to 0.75 per cent of GDP per year. This is less than half the resources needed to finance the immediate scaling up. In Euro terms the total commitment
-4.0
-3.0
-2.0
-1.0
0.0
1.0
2.0
3.0
4.0
2009 2011 2013 2015 2017 2019 2021 2023 2025
Pension 60+ SCT 10% of HHChild <5 Government cost as % of GDPDonors’ cost as % of GDP
-4.0
-3.0
-2.0
-1.0
0.0
1.0
2.0
3.0
4.0
2009 2011 2013 2015 2017 2019 2021 2023 2025
Pension 60+ SCT 10% of HHChild eldest<7 Government cost as % of GDPDonors’ cost as % of GDP

60 The concept of fiscal space and its applicability to the development of social protection policy in Zambia
would amount to 26 million Euros, or an average of 3.7 million Euros per year, representing 4.7 per cent of the annual EU budget allocated to Zambia.
In light of the above analyses it is clear that the Government is not on its own able to afford the scaling up in social protection expenditure in either of the two models presented.56 If it is to implement the social protection package in full, donor support will be needed. In this case the second scenario – a gradual scaling up – is most likely and indeed most favourable: it is both more practical to implement and affordable to finance. In the immediate scaling up scenario donors would be required to increase their current grant commitments by more than 60 per cent during the first years of implementation until the Government could begin to cover the higher share of the cost. In contrast, the gradual scaling up of social protection through the introduction of all three social security benefits (with child benefit of either option 1 or 3) over a period of five years could be affordable for both the Government and the donors.
56 If the gradual scaling up takes seven years (2009–2015) the Government might be able to cover the entire cost without donor intervention. However, seven years might be too long a period for the phasing in of such a policy; it could create social tensions and conflicts between those covered and those not covered.

The concept of fiscal space and its applicability to the development of social protection policy in Zambia 61
4. Conclusions
This paper has analysed the possibilities of creating fiscal space in Zambia and using it to finance a minimum package of social protection benefits. The first part of the paper reviewed some of the arguments put forward in the literature in favour of social protection investments in developing countries and specifically in sub-Saharan African countries. Such investments have received wide attention and are recognized as playing a growth-enabling role in health, education and infrastructure. Within this development context the concept of fiscal space was introduced and the four main strategies proposed in the literature to create it were reviewed. These strategies, as defined by the Development Committee (2006), are: increasing official development aid (ODA), raising internal resources, borrowing, and reprioritizing current expenditure.
We then turned specifically to Zambia. In the past eight years Zambia has experienced sustained economic growth that has not been matched by comparable improvements in the living conditions of its citizens. Nor has the Government been able to turn the years of economic growth into higher revenues; as a share of GDP revenues has actually decreased and expenditure has been reduced accordingly. Zambia is still one of the poorest countries in the world and is characterized by a highly informal economy in which current social protection programmes fail to target those most in need or to alleviate poverty.
Following the ILO report (ILO, 2008) advocating the introduction and implementation of a package of social protection benefits (old-age pension, targeted social assistance and child benefit), the present paper has argued that the introduction of such a package is potentially affordable for Zambia, but that the Government needs to commit itself to a clear resource mobilization strategy. Our estimates57 suggest that if the Government were to introduce the full package gradually over five years it would cost 0.7 per cent of GDP in the first year, 1.31 per cent of GDP in the second year, and peak at 2.14 per cent of GDP once all the beneficiaries were covered. If real GDP continues to increase faster than population growth, the cost of the SP package would gradually decrease to only 1.09 per cent of GDP by 2025.
Our analysis proposes that the Government commit itself to a financing plan, starting in 2010, that would raise additional resources each year, eventually amounting to 4.5 per cent of GDP per year (by 2015). One-third of these additional resources would be assigned to social protection spending. According to this plan, the Government would mobilize 0.3 per cent of GDP in additional resources in 2010 and 0.7 per cent of GDP in 2011, so that by 2015 social protection would be financed by 1.5 per cent of GDP in additional resources. If the Government is able to commit to this plan then with some help from external donors it would be able to introduce the package from 2009. Donor support would be required only during the first seven years of implementation (2009–2015); an average donor commitment amounting to 0.75 per cent of GDP per year would allow the Government to phase in the reform. In Euro terms, donors’ commitment would amount to 26 million Euros over the seven years, or an average of 3.7 million Euros per year. This on average represents 4.7 per cent of the annual European Community budget allocated to Zambia.
The estimates provided in this paper are to a certain extent conservative. Indeed, if the Government were able to mobilize higher levels of resources it could potentially offer more generous benefits. This paper has shown that such higher levels of resource mobilization are not beyond the bounds of possibility.
57 Here we refer to the costing of the package which includes the child benefit of option 1, which is the package that entails the lowest cost in the long run.

62 The concept of fiscal space and its applicability to the development of social protection policy in Zambia
The economic outlook for Zambia looks favourable, as the country seems to be able to attract a sizeable amount of FDI that will enable it to develop further and diversify its economy. The Zambian economy is indeed projected to continue its steady growth at relatively high rates during future years. Moreover, investment in social protection contributes to enabling pro-poor growth. Turning this growth into improved standards of living for all its citizens is now within reach of the Government.

The concept of fiscal space and its applicability to the development of social protection policy in Zambia 63
Appendix
Table 18. Macroeconomics assumptions
IMF 2009 projections Assumptions
20082009 proj
2010 proj
2011 proj 2012 2013 2014 2015 2016
Nominal GDP (ZMK billions) (3) 53,706 60,232 68,593 76,525 85,092 94,618 105,211 116,989 128,366
Real GDP growth (1) 6.0 4.0 4.5 5.0 5.9 5.9 5.9 5.9 5.0
GDP deflator (1994 = 100) 1,422 1,533 1,670 1,773 1,862 1,955 2,053 2,156 2,253
GDP deflator growth (2) 10.9 7.8 8.9 6.2 5.0 5.0 5.0 5.0 4.5
Real GDP (1994 prices) 3,776 3,928 4,108 4,315 4,570 4,839 5,125 5,427 5,699
Growth in nominal GDP implied by (3) 17.6 12.2 13.9 11.6 11.2 11.2 11.2 11.2 9.7
Growth in nominal GDP implied by (1) and (2) 17.6 12.1 13.8 11.5 11.2 11.2 11.2 11.2 9.7
Difference 0.0 0.0 0.1 0.1 0.0 0.0 0.0 0.0 0.0
CPI end of period 16.6 10.0 7.0 5.0 5.0 5.0 5.0 5.0 4.5
Assumptions
2017 2018 2019 2020 2021 2022 2023 2024 2025
Nominal GDP (ZMK billions) (3) 140,850 154,547 169,577 183,414 198,381 214,569 232,078 251,015 271,498
Real GDP growth (1) 5.0 5.0 5.0 4.0 4.0 4.0 4.0 4.0 4.0
GDP deflator (1994 = 100) 2,354 2,460 2,571 2,673 2,780 2,892 3,007 3,128 3,253
GDP deflator growth (2) 4.5 4.5 4.5 4.0 4.0 4.0 4.0 4.0 4.0
Real GDP (1994 prices) 5,984 6,283 6,597 6,861 7,135 7,421 7,717 8,026 8,347
Growth in nominal GDP implied by (3) 9.7 9.7 9.7 8.2 8.2 8.2 8.2 8.2 8.2
Growth in nominal GDP implied by (1) and (2) 9.7 9.7 9.7 8.2 8.2 8.2 8.2 8.2 8.2
Difference 0.0 0.0 0.0 0.0 0.0 0.0 0.0 0.0 0.0
CPI end of period 4.5 4.5 4.5 4.0 4.0 4.0 4.0 4.0 4.0
Sources: IMF, 2008d, 2009b; and author’s assumptions

64 The concept of fiscal space and its applicability to the development of social protection policy in Zambia
Table 19. Structure of the Zambian tax system (ZMK)
Source: ZRA.
Direct taxes Company tax Normal rate Turnover >K200million 35% Farming 15% Large mining 30% Charitable organizations 15% Non-traditional export sector 15% Fertilizer 15% Banks 0-250 000 000 annual 35%
Above 250 000 000 annual 40% Income taxes Sole traders and 0-700 000 per month 0%Pay as You Earn Income from 700 000-1 335 000 per month 25%
1 335 000-4 100 000 per month 30% Above 4 100 000 per month 35%
Turnover tax Gross Below 200 000 000 annual 3%Base tax Tax for marketeers Per annum ZMK 150 000 Presumptive tax Minibus and taxis
Per annumZMK 600 000-ZMK 7 200 000
Advance income tax All commercial imports by unregistered traders
3% of value for duty purpose
Property transfer tax
3%Withholding tax
15% Mineral royalty tax Paid for extraction of minerals Base metals (gross value) 3%
Gemstones or precious (norm value) 5%Other minerals (gross value) 2%
Indirect taxes Value Added Standard 16%
0%
ExemptedStatutory registration Turnover > 200,000,000 annualVoluntary registration Turnover < 200,000,000 annual
Custom and excise Customs duty 0%, 5%, 15% and 25%
depending on the natureof goods.
Excise duty Electricity 3%Mineral/aerated waters 10% 10% Domestic kerosene 15% 15% Industrial kerosene 30% 30% Other light oils 15% 15% Diesel 30% 30% Petrol 60% 60% Other hydro-carbon oil products 30% 30% Opaque beer ZMK145 /Lt Clear beer 60% Ethyl alcohol (spirits) 125%Wine 125%Tobacco 145% or K90, 000/MilleCosmetics 20% Saloon cars/Station wagons (less than 1 500cc) 20%
(1 500cc & above) 30% Buses 25% Pick ups/Light trucks 10%
Import VAT Charged on all imported goods Same rate as domestic VAT 0%, 16%
Informal sector taxes
This is a tax levied on all goods imported into the country exported out of the country. It is based on the CIF (cost, insurance and freight) value
This is tax charged when property is transferredfrom one person to another, and it is levied on therealizable value of the property
Rental Income, consultancy fees, management fees, commissions, royalties, dividends, contractors, public entertainment, interest earned on a savings account and income for non-resident contractors
Exports, medical supplies, school exercise books, energy-saving appliances and raw materials for manufacturing nets
Funeral services, health supply services, educational services, gold in bullion form, water supply services, conveyance of domestic property, domestic kerosene, transportation of persons by road, air, rail and boat, financial services, insurance services and ancillary services

The concept of fiscal space and its applicability to the development of social protection policy in Zambia 65
Table 20. Fiscal framework in Zambian Kwachas (ZMK)
IMF IMF projections MTEF projections
2005 2006 20072008 est 2009 2010 2009 2010 2011 2012
GDP 32,456 39,223 45,669 53,706 60,232 68,593 63,259 70,821 83,735 95,248
Total revenue and grants 7,467 8,415 10,626 12,293 13,681 15,264 13,414 15,121 17,004 19,465
Total revenue 5,642 6,618 8,522 10,221 10,649 12,245 10,646 12,251 14,902 17,598
Tax 5,512 6,317 8,184 9,653 10,195 11,794 10,192 11,820 14,403 17,031
Non-tax 130 301 338 567 454 450 454 431 499 567
Grants 1,825 1,797 2,104 2,073 3,032 3,019 2,769 2,870 2,102 1,867
Total expenditure 8,350 9,051 11,209 13,101 15,248 16,437 14,979 17,197 18,259 20,557
Expenses 5,828 7,203 9,045 10,541 11,943 12,888 11,565 13,695 13,803 14,434
Assets 2,267 1,601 1,842 1,967 2,953 3,549 3,062 3,168 4,271 5,927
Liabilities 254 247 322 593 352 0 352 334 185 196
Discrepancy (-overfinancing) 25 -483 474 -102 0 0 1 0 0 0
Fiscal balance -858 -1,119 -109 -910 -1,567 -1,173 -1,564 -2,076 -1,255 -1,092
Net domestic financing 617 -1,066 -36 653 1,170 833 1,069 1,502 837 952
Net external financing 241 -53 145 257 397 340 495 574 418 140
Sources: IMF, 2008d, 2009b; MTEF 2010–2012.

66 The concept of fiscal space and its applicability to the development of social protection policy in Zambia
Table 21. Fiscal framework as a percentage of GDP
IMF IMF projections
MTEF projections
2005 2006 2007 2008est.
2009 2010 2009 2010 2011 2012
Total revenue and grants 23.0 21.5 23.3 22.9 22.7 22.3 21.2 21.4 20.3 20.4
Total revenue 17.4 16.9 18.7 19.0 17.7 17.9 16.8 17.3 17.8 18.5
Tax revenues 17.0 16.1 17.9 18.0 16.9 17.2 16.1 16.7 17.2 17.9
Non-tax 0.4 0.8 0.7 1.1 0.8 0.7 0.7 0.6 0.6 0.6
Grants 5.6 4.6 4.6 3.9 5.0 4.4 4.4 4.1 2.5 2.0
Total expenditure 25.7 23.1 24.5 24.4 25.3 24.0 23.7 24.3 21.8 21.6
Expenses 18.0 18.4 19.8 19.6 19.8 18.8 18.3 19.3 16.5 15.2
Assets 7.0 4.1 4.0 3.7 4.9 5.2 4.8 4.5 5.1 6.2
Liabilities 0.8 0.6 0.7 1.1 0.6 0.0 0.6 0.5 0.2 0.2
Discrepancy (-overfinancing) 0.1 -1.2 1.0 -0.2 0.0 0.0 0.0 0.0 0.0 0.0
Fiscal balance -2.6 -2.9 -0.2 -1.7 -2.6 -1.7 -2.5 -2.9 -1.5 -1.1
Net domestic financing 1.9 -2.7 -0.1 1.2 1.9 1.2 1.7 2.1 1.0 1.0
Net external financing 0.7 -0.1 0.3 0.5 0.7 0.5 0.8 0.8 0.5 0.1
Sources: IMF, 2008d, 2009b; MTEF 2010–2012.

The concept of fiscal space and its applicability to the development of social protection policy in Zambia 67
Table 22. Macroeconomic framework: MTEF compared to IMF data and projections
2006 2007 2008 2009 2010 2011 2012
actual actual final proj. proj. proj. proj.
MTEF
Real GDP growth (1) 6.2 6.2 5.7 4.3 5.0 5.5 6.0
GDP deflator growth (2) 13.3 13.2 12.6 8.1 9.0 7.9 6.9
Nominal GDP (ZMK billions) (3) 38,561 46,357 55,211 63,259 70,821 83,735 95,248
Nominal GDP growth implied by (3) 20.2 19.1 14.6 12.0 18.2 13.7
Nominal GDP growth implied by (1) and (2) 20.2 19.0 12.7 14.5 13.8 13.3
Difference 0.0 0.1 1.8 -2.5 4.4 0.4
CPI end of period 9.0 8.9 16.6 12.0 9.5 9.0 8.0
IMF
Real GDP growth (1) 6.2 6.3 6.0 4.0 4.5 5.0
GDP deflator growth (2) 13.8 9.6 10.9 7.8 8.9 6.2
Nominal GDP (ZMK billions) (3) 39,223 45,669 53,706 60,232 68,593 76,525
Nominal GDP growth implied by (3) 20.8 16.4 17.6 12.2 13.9 11.6
Nominal GDP growth implied by (1) and (2) 20.9 16.5 17.6 12.1 13.8 11.5
Difference 0.0 -0.1 0.0 0.0 0.1 0.1
CPI end of period 8.2 8.9 16.6 10.0 7.0 5.0
Sources: IMF, 2008d, 2009b; MTEF 2010–2012.
Table 23. Financing plan: Immediate full implementation
Source: Author’s calculations.
2.1 1.85 1.61 1.38 1.18 1.14 1.11 1.08 1.06 Cost incl. admin .as % of 3.73 3.27 2.86 2.4 2.14 1.83 1.57 1.33 1.30 1.26 1.23 1.20 Government share 0 10 23 3 5 78 96 100 100 100 100 10Government cost (ZMK 0.0 510.2 822.6 1 135.4 1 508.0 1 754.8 1 711.8 1 1 949.4 2 078.9 2 209.1Donors’ cost (ZMK 2 247.7 2 1 1 291.7 890.1 0.0 0.0 0.0 0.0 Government cost as % of 0.00 0.33 0.67 0.97 1.20 1.43 1.50 1.33 1.30 1.26 1.23 1.20Donors’ cost as % of 2.94 2.19 1.52 0.94 0.40 0.07 0.00 0.00 0.00 0.00
Immediate scaling Full package (child < 5) 2009 201 2011 2012 2013 2014 2015 201 2017 2018 2019 2020Covered beneficiaries 100 100 100 100 100 10 100 100 100 100 100 100Admin. cost (as % of total 26 23 20 18 1 1 13 13 13 13 1 13Cost incl. admin.( ZMK billions ))
1 726.0 1 849.5 1 2 040.9 2 141.1 2 253.1 2 407.3 2 563.2 2 728.0 2 3 086.3 3 268.9Cost excl. admin. as % of GDP 2.28 2.19 2.11 2.03 1.9 1.89 1.82 1.76 1.71 1.66 1.61 1.57 Cost incl. admin. as % of 2.87 2.70 2.54 2.40 2.2 2.14 2.06 2.00 1.94 1.88 1.82 1.78 Government share 0 12 26 40 5 6 73 75 77 80 8 84Government cost (ZMK 0.0 822.6 1 135.4 1 508.0 1 754.8 1 925.5 2 112.7 2 2 543.7 2 751.2Donors’ cost (ZMK 1 726.0 1 620.8 1 1 218.4 1 005.7 745.1 615.3 584.0 542.6 517.7Government cost as % of 0.67 0.97 1.20 1.43 1.50 1.50 1.50 1.50 1.50 1.50 Donors’ cost as % of 2.87 1.87 1.43 1.06 0.71 0.56 0.50 0.44 0.38 0.32 0.28 Full package (child eldest < Covered beneficiaries 100 100 100 100 100 10 100 100 100 100 100 100Admin. cost (as % of total 25 23 20 18 1 1 13 13 13 13 1 13Cost incl. admin. (ZMK 2 247.7 2 243.1 2 2 114.2 2 025.5 1 926.1 1 834.1 1 711.8 1 827.2 1 2 078.9 2 209.1Cost excl. admin. as % of 2.98 2.66 2.37

68 The concept of fiscal space and its applicability to the development of social protection policy in Zambia
Table 24. Financing plan: Gradual implementation
Source: Author’s calculations.
Gradual scaling upFull package (child < 5) 2009 201 2011 2012 2013 2014 2015 2016 201 2018 2019 202Covered beneficiaries (%) 20 40 60 80 10 100 100 100 100 100 100 10Admin. cost (as % of total benefits) 26 23 20 18 16 14 13 13 13 13 13 13Cost incl. admin. (ZMK billions) 345.2 739.8 1 166.1 1 2 141.1 2 253.1 2 407.3 2 563.2 2 728.0 2 902.2 3 3 268.9Cost excl. admin. as % of GDP 0.46 0.88 1.27 1.63 1.96 1.89 1.8 1.76 1.71 1.66 1.61 1.57 Cost incl. admin. as % of GDP 0.57 1.08 1.52 1.92 2.26 2.14 2.0 2.00 1.94 1.88 1.82 1.78 Government share (%) 0 31 44 50% 53 67 73 75 77 80 82 84Government cost (ZMK billions) 0.0 228.6 510.2 822.6 1 135.4 1 508.0 1 754.8 1 925.5 2 112.7 2 318.2 2 2 751.2Donors’ cost (ZMK billions) 345.2 511.2 655.9 810.2 1 005.7 745.1 652.5 637.7 615.3 542.6 517.7Government cost as % of GDP 0.00 0.33 0.67 0.97 1.20 1.43 1.50 1.50 1.50 1.50 1.50 1.50 Donors’ cost as % of GDP 0.57 0.75 0.86 0.95 1.06 0.71 0.56 0.50 0.44 0.38 0.32 0.28 Full package (child eldest < 7) Covered beneficiaries (%) 20 40 60 80 10 100 100 100 100 100 100 10Admin. cost (as % of total benefits) 25 23 20 18 16 14 13 13 13 13 13 13Cost incl. admin. (ZMK billions) 449.5 897.2 1 311.5 1 2 025.5 1 926.1 1 834.1 1 711.8 1 827.2 1 949.4 2 2 209.1Cost excl. admin. as % of GDP 0.60 1.07 1.42 1.69 1.85 1.61 1.38 1.18 1.14 1.11 1.08 1.06 Cost incl. admin. as % of GDP 0.75 1.31 1.71 1.99 2.14 1.83 1.57 1.33 1.30 1.26 1.23 1.20 Government share (%) 0 25 39 49 56 78 96 100 100 100 100 100 Government cost (ZMK billions) 0.0 228.6 510.2 822.6 1 135.4 1 508.0 1 754.8 1 711.8 1 827.2 1 949.4 2 078.9 2 209.1Donors’ cost (ZMK billions) 449.5 668.6 801.4 868.8 890.1 418.1 79.3 0.0 0.0 0.0 0.0 0.0Government cost as % of GDP 0.00 0.33 0.67 0.97 1.20 1.43 1.50 1.33 1.30 1.26 1.23 1.20 Donors’ cost as % of GDP 0.75 0.97 1.05 1.02 0.94 0.40 0.07 0.00 0.00 0.00 0.00 0.00

The concept of fiscal space and its applicability to the development of social protection policy in Zambia 69
Bibliography
African Economic Outlook (AEO). 2008. Zambia, country report. Available at http://www.africaneconomicoutlook.org
Bonilla García, A.; Gruat, J.V. 2003. Social protection: A life cycle continuum investment for social justice, poverty reduction and sustainable development (Geneva, ILO).
Bräutigam, D.; Fjeldstad, O.; Moore, M. 2008. Taxation and state-building in developing countries: Capacity and consent (Cambridge, Cambridge University Press).
Brun, J-F. et al. 2006. Evaluation of fiscal space in developing countries: Concept paper, CERDI, Université d’Auvergne.
Collins, D. et al. 2009. Portfolios of the poor: How the world's poor live on $2 a day (Princeton University Press).
Development Committee. 2006. Fiscal policy for growth and development: An interim report, paper presented at the Development Committee Meeting, (Washington, DC, World Bank and IMF).
Devereux, S.; Wood, D. 2008. Zambia’s social cash transfer pilot schemes: A review report for the Technical Working Group on Social Assistance (Paris, OECD).
Department for International Development (DFID). 2006. Social protection and economic growth in poor countries, Social Protection Briefing Note Series No. 4 (London).
Diaw, A. et al. 2009. “Securing fiscal space for the Millennium Development Goals in Senegal”, in Roy and Heuty (2009).
European Commission (EC). 2007. Zambia–European Community: Country Strategy Paper and National Indicative Programme for the period 2008–2013. Available at http://ec.europa.eu/development/index_en.cfm.
Fiaschi, D. 2008. Natural resources and social conflict: An explanation of sub-Saharan countries stagnation, Discussion Papers 2009/82, Dipartimento di Scienze Economiche (DSE), University of Pisa.
Fraser, A.; Lungu, J. 2007. “For whom the windfalls? Winners & losers in the privatisation of Zambia’s copper mines”. Available at http://www.minewatchzambia.com/.
Gupta, S.; Tareq, S. 2008. “Mobilizing revenue”, in Finance and Development, Vol. 45, No. 3 (Sept.)
Guyer, J. I. 1992. “Representation without taxation: An essay on democracy in rural Nigeria, 1952–1990”, in African Studies Review, Vol. 35, No. 1.
Heller, P. S. 1997. “Strengthening revenue mobilization efforts in Sub-Saharan Africa”, in L. Wallace (ed.): Deepening structural reform in Africa: Lesson from East Asia (Washington DC, IMF).
____. 2005. Understanding fiscal space, IMF Policy Discussion Paper PDP/05/4 (Washington DC).

70 The concept of fiscal space and its applicability to the development of social protection policy in Zambia
____. 2006. “The prospect of creating ‘fiscal space’ for the health sector”, in Health Policy and Planning, Vol. 21, No. 2, pp. 75–79(5).
____; Keller, C. 2001. Social sector reform in transition countries, IMF Working Paper WP/01/35 (Washington DC).
HelpAge International. 2009. Social pensions in low and middle income countries. Available at http://www.helpage.org/Researchandpolicy/Social protection.
Hoffman, B. D.; Gibson, C. C. 2006. Fiscal governance and public services: Evidence from Tanzania and Zambia, Department of Political Science, University of California (San Diego).
Holmes, R.; Slater, R. 2008. Social protection for low capacity households in Zambia, Project Briefing No.11 (London, DFID).
ILO, 2008. Zambia: Social protection expenditure and performance review and social budget (Geneva).
____. 2009. Key Indicators of the Labour Market (Geneva). Available at http://www.ilo.org/public/english/employment/strat/kilm/
International Monetary Fund (IMF). 2000. Zambia: Preliminary document on the enhanced initiative for Heavily Indebted Poor Countries (Washington DC).
____. 2004. Zambia: Selected issues and statistical appendix (Washington DC).
____. 2005. Zambia: 2005 Article IV Consultation, Third Review Under the Three-Year Arrangement Under the Poverty Reduction and Growth Facility, Request for Waiver and Modification of Performance Criterion, and Financing Assurances Review: Staff Report; Public Information Notice and Press Release on the Executive Board Discussion; and Statement by the Executive Director for Zambia (Washington DC).
____. 2007. Heavily Indebted Poor Countries (HIPC) Initiative and Multilateral Debt Relief Initiative (MDRI): Status of implementation (Washington DC).
____. 2008a. Request for a three-year arrangement under the Poverty Reduction and Growth Facility (Washington DC).
____. 2008b. Debt relief under the Heavily Indebted Poor Countries Initiative, Fact Sheet (Washington DC).
____. 2008c. Zambia: 2007 Article IV Consultation: Staff Report; Staff Statement; Public Information Notice on the Executive Board Discussion; and Statement by the Executive Director for Zambia (Washington DC).
____. 2008d. Zambia: Statistical Appendix (Washington DC).
____. 2009a. Regional Outlook (Washington DC).
____. 2009b. First and Second Reviews of the Three-Year Arrangement under the Poverty Reduction and Growth Facility (Washington DC).
Joshi, A.; Ayee, J. “Associational taxation: A pathway into the informal sector?”, in Bräutigam et al. (2008).
Lequiller, F.; Blades, D. 2006. Understanding national accounts (Paris, OECD).

The concept of fiscal space and its applicability to the development of social protection policy in Zambia 71
Lusaka Times. 2008. “Social protection policy to be in effect soon” (4 July). Available at http://www.lusakatimes.com.
Mboozi, B. 2008. “Zambia social protection case study”, presentation given at the International Policy Centre for Inclusive Growth. Available at http://www.ipc-undp.org/doc_africa_brazil/Zambia.pdf.
Nkombo, N.; Habasonda, L.; Mwiinga, I. 2008. A case for decentralised government in the new Zambian constitution, A concept paper prepared for the MS Zambia Knowledge and Strategy Team on Inclusion and Effective Voice. Available at http://www.scribd.com/doc/19713200/Decentralisation-in-the-Zambian-Constitution.
Perotti, R. 2007. Fiscal policy in developing countries: A framework and some questions, Policy Research Working Paper No. 4365 (Washington DC, The World Bank).
Petrauskis, C. 2006. Social protection: A basic human right, a government responsibility, an investment in the future, Social Condition Research Project, Jesuit Centre for Theological Reflection.
____. 2007. Social protection: A progressive strategy for pro-poor empowerment, Social Condition Research Project, Jesuit Centre for Theological Reflection.
Prince, S. 2009. Has the HIPC Debt Relief Initiative created the fiscal space crucial to reducing poverty in low-income countries? Unpublished manuscript.
Ratha, D.; Mohapatra, S.; Plaza, S. 2008. Beyond aid: New sources and innovative mechanisms for financing development in sub-Saharan Africa, Policy Research Working Paper No. 4609 (Washington DC, World Bank).
Reisen, H.; Ndoye, S. 2008. Prudent versus imprudent lending to Africa: From debt relief to emerging lenders, OECD Working Paper No.268 (Paris).
Roy, R.; Heuty, A. 2009. Fiscal space: Policy options for financing human development (London, UNDP, Earthscan).
Roy, R. et al. 2009. “Fiscal space for what? Analytical issues from a human development perspective”, in Roy and Heuty (2009).
Schick, A. 2008. Budgeting for fiscal space, Asian OECD Senior Budget Officials Meeting, Bangkok, Thailand.
Schneider, F. 2002. Size and measurement of the informal economy in 110 countries around the world. Rapid Response Unit, The World Bank (Washington DC).
Scholz, W.; Cichon, M.; Hagemejer, K. 2000. Social budgeting (Geneva, ILO/ISSA).
Tembo, G.; Freeland, N. 2008. Impact of social cash transfer on household welfare, investment and education (Palm Associates Ltd., MASDAR International Consultants).
Task Policy Task Force (TPTF). 1992. Final Report Presented to the Minister of Finance, Hon. E. G. Kasonde: Recommendations on Tax Reform for the 1993 Budget (Lusaka: TPTF, Ministry of Finance, Budget Section).
United Nations Conference on Trade and Development (UNCTAD). 2006. Investment policy review: Zambia (Geneva).

72 The concept of fiscal space and its applicability to the development of social protection policy in Zambia
Von Soest, C. 2008. The African State and the capability to raise revenue, Ph.D Dissertation, University of Leipzig.
Weeks, J.; McKinley, T. 2006. Does debt relief increase fiscal space in Zambia?, International Poverty Centre, Country Study No. 5 (London).
Weeks, J. 2008. The reduction of fiscal space in Zambia: Dutch disease and tight-money conditionalities, International Poverty Centre paper No. 14 (London).
World Bank, The. 2002, 2009. World Development Indicators (Washington DC).
____. 2009. Ease of Doing Business Survey, in World Bank Doing Business Database, http://www.doingbusiness.org/EconomyRankings/.
Xaba, J.; Horn, P.; Motala, S. 2002. The informal sector in sub-Saharan Africa (Geneva, ILO).