CONCEPT OF FISCAL DECENTRALIZATION AND WORLDWIDE OVERVIEW by
31
1 Globalization and Localization: Decentralization Trends and Outcomes Robert D. Ebel, Lead Economist Serdar Yilmaz, Public Sector Specialist World Bank Institute Course Intergovernmental Relations & Local Financial Management World Bank, 2004 I. INTRODUCTION The practice of governance has long been associated with what central governments do and how they operate. Recent years have seen worldwide interest in decentralization of policymaking power. The pursuit of decentralization is widespread, as both developed and developing countries attempt to challenge central governments' monopoly of policymaking power (World Bank, 1999). In the western world, decentralization has been carried out to reorganize the organizational structure of government. The main goal has been the provision of public goods and services cost effectively in the "post-welfare state" era (Bennett, 1990; Wildasin, 1997). Developing countries are turning to fiscal decentralization to escape from the traps of ineffective and inefficient governance, macroeconomic instability, and inadequate economic growth (Bird and Vaillancourt, 1999). Throughout post-communist Central and Eastern Europe, decentralization of the state is the direct result of the transition from a socialist system to market economy and democracy (Bird, Ebel, and Wallich, 1995). Fiscal decentralization can be an effective means of improving economic and financial management. But it is not a panacea for all economic problems; rather it provides a greater potential for an improved public administration system. The goal of fiscal decentralization is efficiency gains in public services. Stigler (1957) argued that a representative government works best the closer it is to the people. The allocative efficiency argument underpins the economists' rationale for fiscal decentralization. In his seminal work on the theory of public finance, Musgrave (1959) similarly argues that policies of subnational branches of governments should be permitted to differ in order to reflect the preferences of their residents. Carrying Stigler's and Musgrave's arguments further, Oates (1972) formulated the decentralization theorem as "each public service should be provided by the jurisdiction having control over the minimum geographic area that would internalize benefits and costs of such provision." The decentralization theorem provides the theoretical basis for fiscal decentralization practices with generality. However, the definition and implementation of decentralization differ greatly across nations due to differences in economic and political
-
Upload
conflictanddevelopment -
Category
Documents
-
view
4 -
download
0
Transcript of CONCEPT OF FISCAL DECENTRALIZATION AND WORLDWIDE OVERVIEW by

1
Globalization and Localization: Decentralization Trends and Outcomes
Robert D. Ebel, Lead Economist
Serdar Yilmaz, Public Sector Specialist
World Bank Institute Course
Intergovernmental Relations & Local Financial Management
World Bank, 2004
I. INTRODUCTION The practice of governance has long been associated with what central governments do
and how they operate. Recent years have seen worldwide interest in decentralization of
policymaking power. The pursuit of decentralization is widespread, as both developed
and developing countries attempt to challenge central governments' monopoly of
policymaking power (World Bank, 1999).
In the western world, decentralization has been carried out to reorganize the
organizational structure of government. The main goal has been the provision of public
goods and services cost effectively in the "post-welfare state" era (Bennett, 1990;
Wildasin, 1997). Developing countries are turning to fiscal decentralization to escape
from the traps of ineffective and inefficient governance, macroeconomic instability, and
inadequate economic growth (Bird and Vaillancourt, 1999). Throughout post-communist
Central and Eastern Europe, decentralization of the state is the direct result of the
transition from a socialist system to market economy and democracy (Bird, Ebel, and
Wallich, 1995).
Fiscal decentralization can be an effective means of improving economic and
financial management. But it is not a panacea for all economic problems; rather it
provides a greater potential for an improved public administration system. The goal of
fiscal decentralization is efficiency gains in public services. Stigler (1957) argued that a
representative government works best the closer it is to the people. The allocative
efficiency argument underpins the economists' rationale for fiscal decentralization. In his
seminal work on the theory of public finance, Musgrave (1959) similarly argues that
policies of subnational branches of governments should be permitted to differ in order to
reflect the preferences of their residents. Carrying Stigler's and Musgrave's arguments
further, Oates (1972) formulated the decentralization theorem as "each public service
should be provided by the jurisdiction having control over the minimum geographic area
that would internalize benefits and costs of such provision."
The decentralization theorem provides the theoretical basis for fiscal
decentralization practices with generality. However, the definition and implementation of
decentralization differ greatly across nations due to differences in economic and political

2
structures. This diversity creates challenges to measure and compare the degree of
decentralization across countries and to make generalizations about it.
Available Indicators of Decentralization
While most of the governments in the world are still highly centralized, subnational
governments are claiming an increasingly larger share of the public sector in terms of
both expenditure and revenue (see Figure 1). Figure 1 shows the unweighted average of
expenditures and revenues of subnational governments for those countries reported in the
Government Finance Statistics of the International Monetary Fund (IMF). Both
expenditure and revenue shares of subnational governments are increasing in total public
sector.1
The share of subnational governments in total government spending or revenue
gives us an idea of the relative aggregate importance of the different levels of
government, and its change over time. However, neither of them is a perfect measure of
fiscal decentralization. Comparing the degree of fiscal decentralization across countries is
a complex and multifaceted task that requires identification of subnational autonomy and
discretion on expenditure and revenue affairs. Although there has been a great effort by
both multinational (OECD, 1999, 2001, 2002) and bilateral (USAID, 1999) organizations
to develop a methodology for comparable statistics on fiscal decentralization across
countries, there is as yet no standardized data set.
Figure 1: Decentralization Trends
0.00
0.05
0.10
0.15
0.20
0.25
0.30
0.35
1987 1988 1989 1990 1991 1992 1993 1994 1995 1996 1997 1998 1999 2000 2001
Expendit ure Revenue
1 Revenue figures are for all revenues other than intergovernmental grants.

3
The broadest source of data for cross-country analysis of public finance is the
IMF's Government Finance Statistics (GFS), which has consistent definitions across
countries over time. Although, GFS is the most widely available internationally
comparable data source on subnational finances, the need to standardize the fiscal
variables inevitably leads to a loss of detail and data richness. For example, although GFS
provides a breakdown of expenditures by function and economic type, it is silent about
expenditure autonomy. Thus, expenditures that are mandated by the central government
appear as subnational expenditure in
the GFS. Similarly, on the revenue
side, the GFS contains information
about tax and non-tax revenues,
intergovernmental transfers, and other
grants, but it does not distinguish
whether taxes are collected through
shared taxes, piggybacked taxes, and
locally determined "own-source"
taxes, or what proportion of
intergovernmental transfers is
conditional as opposed to general
purpose transfers.
Although the expenditure share
of subnational governments in total
government spending is an imperfect
measure of decentralization, it is a
common practice in the literature to
use the percentage share of subnational
governments expenditure to assess the
degree of decentralization in a country.
Figure 2 shows the degree of fiscal
decentralization, measured as the
percentage share of subnational
governments expenditure in total
government spending, in the world. As
seen in the figure, in general,
subnational governments (intermediate
plus local) in federal countries have
executed a higher portion of total
government spending than their
counterparts in unitary countries. In
2001, the average subnational share of
expenditures was 40.1% for federal
countries and 21.67% for unitary
countries.
Figure 2: Subnational Share of Expenditures by
Country (2001)
0% 10% 20% 30% 40% 50% 60% 70%
Argentina
Canada
United States*
South Africa
Bolivia
Peru
Belarus
Russian Federation
Georgia
Mongolia
Poland
Ukraine
Moldova
Latvia
Estonia
Hungary
Lithuania
Czech Republic
Romania
Bulgaria
Israel*
Thailand
Croatia
Slovenia
Chile
Slovak Republic
Share of Total
Local
State or Provincial
* For Israel and the United States, figures are from the year 2000.

4
Generalizations About Decentralization
The government structure in any country is unique reflecting the historical
developments. The natural consequence of the variation in government structure is
different models of intergovernmental fiscal systems and different applications of
decentralization practices across countries. Despite these differences, there are certain
broad patterns recurring in many countries. Bird (1995) lists them as existence of
inadequate "own resources" of subnational governments to finance the expenditure
functions, heterogeneity of subnational governments, and the lack of subnational
autonomy to levy taxes that are capable of yielding enough revenue to meet local needs.
Table-1: Local Government Revenues as Percent of Expenditures
Unitary Countries 1997 1998 1999 2000 2001
Albania 3.69% 4.05% N/A N/A N/A
Azerbaijan 66.78% 58.30% 49.64% N/A N/A
Belarus 77.73% 81.69% 83.60% 88.49% 85.96%
Bulgaria 65.35% 61.08% 58.50% 55.52% 66.98%
Croatia 93.83% 89.18% 89.75% 94.99% 92.02%
Czech Republic 72.74% 75.80% 71.77% 71.31% 61.22%
Denmark 58.55% 59.25% 60.33% 63.10% N/A
Estonia 73.10% 72.04% 68.09% 71.47% 58.98%
Iceland 84.29% 85.31% N/A N/A N/A
Kazakhstan 78.76% 71.68% 89.80% 89.54% N/A
Latvia 73.82% 72.08% 71.37% 71.05% 65.54%
Lithuania 71.71% 80.65% 89.25% 89.16% 85.30%
Mauritius 40.68% 42.52% 39.39% N/A N/A
Moldova 58.66% 62.49% 73.73% 68.11% 79.42%
Mongolia 60.10% 57.32% 57.01% 49.39% 55.06%
Norway 61.30% 59.71% 57.90% N/A N/A
Poland 66.21% 64.76% 60.47% 59.85% 58.68%
Slovak Republic 79.75% 73.69% 74.90% 76.88% 80.21%
Slovenia 81.88% 80.60% 77.88% 76.54% 78.47%
United Kingdom 27.91% 29.33% N/A N/A N/A
Federal Countries*
Australia 81.80% 86.69% N/A N/A N/A
Austria 83.89% 82.51% N/A N/A N/A
Bolivia 100.02% 96.97% 102.84% 80.03% N/A
Mexico 93.32% 83.06% 75.13% N/A N/A
Switzerland 82.02% 84.37% 86.04% N/A N/A
United States 64.92% 62.78% 62.48% N/A N/A * In federal countries local government is the lowest tier of government.
Source: International Monetary Fund. 2001. Government Finance Statistics Year Book 2002, Country Tables
Subnational governments have inadequate level of "own resources." The revenues
under direct control of local governments invariably less than their expenditures in most
of the countries. Table 1 reports local governments revenues as a percentage of their
expenditures. The figures in the table are from GFS of the IMF, therefore they are subject

5
to constraints discussed above. For example, the revenue figures include taxes which
their rate and base are determined by central government as well as shared taxes.
However, regardless of local governments' control over revenue resources, as seen in the
table their revenues are less than the expenditure levels in both unitary and federal
countries.
There are striking variations in the size and capacity of subnational governments.
There is a big differences in terms of population, expenditure capacity and revenue
sources across subnational units in almost every country. Direct comparison of
subnational governments size and capacity across countries is difficult to make but intra-
country variations exist in all the countries. In India, for example, the average per capita
expenditures of states was 2354.97 rupee in 1998 and it varied from 69.18 to 167.77 % of
the national average across states (see Table 2). It is these variations that make the design
of intergovernmental transfer system an important component of fiscal decentralization
process.
Table-2: Current Per Capita Expenditure Levels of Indian States 1995 1996 1997 1998
All States 1564.23 1791.62 1946.13 2354.97
ANDHRA PRADESH 93.43% 109.39% 100.63% 94.57%
BIHAR 57.51% 48.16% 47.25% 57.46%
GUJARAT 122.02% 122.91% 132.01% 133.28%
HARYANA 182.70% 197.69% 175.09% 163.82%
KARNATAKA 108.96% 112.82% 109.40% 111.16%
KERALA 119.44% 120.13% 132.93% 129.18%
MADHYA PRADESH 77.86% 83.79% 77.49% 76.45%
MAHARASHTRA 125.66% 131.38% 131.20% 116.45%
ORISSA 86.64% 81.52% 80.38% 86.99%
PUNJAB 159.66% 168.93% 173.78% 167.77%
RAJASTHAN 105.88% 91.70% 88.38% 94.00%
TAMILNADU 116.59% 120.64% 125.90% 118.54%
UTTAR PRADESH 70.86% 66.38% 69.16% 69.18%
WEST BENGAL 73.26% 75.68% 75.05% 85.81% Source: Indian Subnational Database, The Statistical Information Management and Analysis System, World Bank.
Subnational governments lack the legal authority to levy some taxes. The size
and pattern of subnational government taxation varies greatly from country to country
(see Table 3). Income and property taxes are the most important sources of subnational
revenue. However, as seen in the table, corporate tax on revenues is exclusively the
central government's source of revenue.

6
Table-3: Tax Revenue Attributable to Each Level Government Income Tax Property Tax Corporate Tax
1999 2000 1999 2000 1999 2000
C L C L C L C L C L C L
Belarus 0.00% 100.00% 0.00% 100.00% 0.00% 100.00% 0.00% 100.00% 100% 0% 100% 0%
Bulgaria 51.96% 48.04% 52.26% 47.74% 0.04% 99.96% 0.09% 99.91% 100% 0% 100% 0%
Croatia 60.64% 39.36% 54.69% 45.31% 32.50% 67.50% 32.21% 67.79% 100% 0% 100% 0%
Czech Republic 36.96% 63.04% 35.38% 64.62% 61.63% 38.37% 57.30% 42.70% 100% 0% 100% 0%
Denmark 42.00% 58.00% 40.98% 59.02% 41.53% 58.47% 35.46% 64.54% 100% 0% 100% 0%
Estonia 43.95% 56.05% 44.33% 55.67% 0.00% 100.00% 0.00% 100.00% 100% 0% 100% 0%
Kazakhstan 2.26% 97.74% 2.35% 97.65% 4.00% 96.00% 2.62% 97.38% 100% 0% 100% 0%
Latvia 28.63% 71.37% 28.42% 71.58% 1.48% 98.52% 0.52% 99.48% 100% 0% 100% 0%
Lithuania 28.72% 71.28% 29.00% 71.00% 0.00% 100.00% 0.00% 100.00% 100% 0% 100% 0%
Mauritius 100.00% 0.00% N/A N/A 86.98% 13.02% N/A N/A 100% 0% 100% 0%
Moldova 0.00% 100.00% 0.00% 100.00% 1.26% 98.74% 0.11% 99.89% 100% 0% 100% 0%
Mongolia 0.00% 100.00% 0.00% 100.00% 0.00% 100.00% 0.00% 100.00% 100% 0% 100% 0%
Norway 42.22% 57.78% N/A N/A 42.99% 57.01% N/A N/A 100% 1% 100% 1%
Poland 71.52% 28.48% 72.08% 27.92% 0.13% 99.87% 0.13% 99.87% 100% 0% 100% 0%
Slovak Republic 83.80% 16.20% 79.77% 20.23% 31.42% 68.58% 31.03% 68.97% 100% 0% 100% 0%
Slovenia 100.00% 0.00% 100.00% 0.00% 7.89% 92.11% 3.77% 96.23% 100% 0% 100% 0%
Source: International Monetary Fund. 2002. Government Finance Statistics Year Book 2002, Country Tables
II. WHY DECENTRALIZATION? The key elements underlying the interest in decentralization are increasing efficiency,
transparency and accountability in the public sector. During the last two decades, the
economic reforms in developing countries largely focused on the role of markets and
understated the importance of the organization of the public sector in achieving broader
macro objectives such as economic stability, sustainable growth, and provision of basic
public services equitably across people and jurisdictions.
The poor performance of the central governments in achieving those macro
objectives has fueled the interest in fiscal decentralization. In recent years, there has been
a widespread movement toward assigning certain functions of public sector to
subnational governments in order to offload the burden from central government's
shoulder and rely more on lower level governments, which are often underutilized and
have untapped revenue potential (Smoke, 1994).
In many developing countries, like India (Rao, 1999), Philippines (Rood, 2000),
Columbia (Bird and Fiszbein, 1999), and Brazil (Dillinger and Webb, 1999), the failure
of the central government in avoiding large fiscal deficits and macroeconomic instability,
and in providing adequate level of services has generated a growing interest in
decentralization of government functions. However, in some of the developing countries,
subnational governments fall short of meeting the expectations due to a variety of
reasons, and in several cases, decentralization has been blamed for the underperformance
of the public sector. Some macro economists argue that in a decentralized system, since
policymaking becomes a responsibility shared by different levels of government,
circumvention of central control over monetary and fiscal policies may have aggravated
macroeconomic problems in these countries (Prud'homme, 1995; Tanzi, 1996).
According to them, central governments are better equipped in dealing with spillover
effects of local spending, inflationary pressures of monetization of local debt and cyclical

7
shocks. To the extent that this line of argument highlights the potential problems arising
from decentralization when checks and balances of intergovernmental relations systems
are not in place, decentralization can make matters worse. A good decentralization policy
is not easy to design; clearly, it can be done well or badly (Bird and Vaillancourt, 1999).
However, empirical research on decentralization and macroeconomic governance
gives little support to the macroeconomic concern in general. A recent study on the
relationship between fiscal federalism and macroeconomic governance finds that
“decentralized fiscal system offers a greater potential for improved macroeconomic
governance than centralized fiscal systems.”2 In fact, highly decentralized federal
countries, such as Switzerland, Germany, Austria, and USA, have very stable
macroeconomic performance and low rates of inflation (Shah, 1997).
The concern over macroeconomic performance in a decentralized system stems
from the traditional Keynesian demand management argument. In traditional Keynesian
theory, fiscal policy is an important tool for the manipulation of short-run demand which
affects prices and employment levels. When Musgrave (1959) identified macroeconomic
stability as one of the three functions of government, policy makers and economists alike
viewed fiscal policies as important factors for the aggregate demand fluctuations and
argued that it should be left to the central government. According to Spahn (1998),
Keynesian demand management argument has overemphasized the need for centralized
macroeconomic policies, because:
(1) it assumes regionally symmetrical shocks. There may well be regionally
asymmetrical shocks.
(2) it assumes a closed economy. Fiscal shocks would be offset by an exchange-
rate change in an open economy.
(3) it assumes segmented capital markets. As long as capital markets are informed
and rational, it might be less costly for subnational governments to borrow from
capital markets. Borrowing from central government for the sake of stabilization
policy might exceed the cost of region specific risk factors.
(4) it neglects supply-side effects of effects of fiscal policy. Fiscal policy is not
simply "demand management," it has supply-side effects also through the way
public resources are used. Local governments can use fiscal policy power to deal
with macroeconomic problems, such as unemployment and economic growth.
(5) it neglects built-in stabilizers. Built-in stabilizers are not confined to the
central government alone, they can work at all levels of government. Fiscal
stabilization is guaranteed through built-in stabilizers.
Spahn (1998) makes the point that countries like Argentina and Brazil have had
macroeconomic problems due to subnational borrowing reflects the fact that the old
institutional arrangements do no longer function under the decentralized regime and in
order to have an effective mechanism of intergovernmental cooperation, institutional
reform is required in countries undergoing decentralization process.
2 Huther and Shah (1998) examine statutory aspects of central bank operations, such as the terms of office
for chief executive officer, the formal policymaking power, limitations on lending to the government and
other 13 criteria and show that there is a positive correlation between central bank independence and
decentralization.

8
The institutional context of intergovernmental fiscal relations entails the overall
economic development, the nature of the legal system, ongoing process of economic and
political reform, the organization of monetary and financial institutions, and tensions
arising from ethnic, religious, or economic differences (Wildasin, 1997). This
institutional background has a crucial effect on the nature of the intergovernmental
financial system. In countries that do not have institutional structures that support mature
and stable federations, subnational governments may use their fiscal power irresponsibly
causing macroeconomic problems.
Wildasin (1997) argues that "effective fiscal decentralization requires an
institutional structure that minimize these adverse incentives." According to him, three
important characteristics of an intergovernmental system that would have significant
impact on decentralization process are transparency, accountability, and predictability. In
the case of lack of these three characteristics, subnational governments would settle their
intergovernmental fiscal transactions on ad hoc basis, responding to the fiscal distress of
lower-level units with a variety of special loans, grants, negotiated tax-sharing
agreements, directed-credit programs, and other emergency bailouts, rather than
establishing firm transparent rules which would govern the form and extent of fiscal
flows between central and subnational fiscal and financial institutions.3 Consequently, in
order for the decentralization to be effective and successful, the transfer of fiscal power
from the center to the localities must be supplemented by institutional arrangements that
monitor the system. Such proper arrangements that enforce hard-budget constraints
motivate responsible behavior by the subnational governments and reduce the possibility
of macroeconomic instability.
It is important to recognize that fiscal decentralization does not necessarily lead to
macroeconomic instability. In fact, most countries choose to decentralize because of
macroeconomic distress. The poor macroeconomic performance in these centralized
countries typically resulted in large budget deficits, which were financed primarily by
external borrowings. Over time, interest payments claimed an increasing share of their
budget and the vicious cycle of borrowing and debt service left central governments
without a choice but to rely more and more on local governments for service provision.
However, in the absence of appropriate rules that regulate intergovernmental
relations, forcing local governments to provide adequate level of services and
maintaining a sustainable decentralized system has proven to be difficult in many
countries. Today, we are faced with the fact that many central government fail to deliver
macroeconomic stability and adequate level of public services. The question is whether
fiscal decentralization aggravates macroeconomic problems when appropriate rules are in
place, the institutions of political control and accountability are mature, and
administrative professionalism and control mechanisms are developed.
The question of the impact of fiscal decentralization on macroeconomic indicators
has been analyzed from different perspectives in the academic literature. Empirical
studies have tested the impact of fiscal decentralization on public sector size and
economic growth and found contradictory results (see Box 1 and 2). A simple analysis of
the relationship between subnational government spending and GDP provides some
preliminary findings about the impact of fiscal decentralization on a basic
3 Op. cit. Wildasin (1998).

9
macroeconomic indicator. Table 4 reports correlation coefficients between GDP per
capita and local government spending. As seen in the table, in developed countries, where
people are more educated and institutions of a civil society have been better developed,
there is a high and significant positive correlation between the two variables. On the other
hand, in developing countries, where the institutions of political control and
accountability are yet to cultivate, the correlation coefficients are low, even negative.
Table-4: Correlation coefficients for GDP Per Capita and Local Government Spending*
Australia 0.985 Italy 0.951
Austria 0.996 Kenya -0.774
Belguim 0.955 Luxembourg 0.981
Bolivia -0.850 Mexico 0.544
Canada 0.992 Netherlands 0.910
Chile -0.362 Norway 0.984
Colombia -0.726 Philippines 0.147
Denmark 0.971 Portugal 0.982
Finland 0.981 Spain 0.996
France 0.956 Sweden 0.234
Germany 0.978 Switzerland 0.974
Iceland 0.875 Thailand 0.818
Ireland 0.936 UK 0.982
Isreal 0.345 USA 0.991
* In federal countries local governments are defined as below state governments,
therefore it does not refer to state plus local governments total.
Figure 3 presents the same
relationship on a scatter diagram. It
appears that there is a linear relationship
between the growth rates of local
government expenditure share and GDP
per capita in the same group of
countries. As seen in the chart, higher
decentralization is positively associated
with the average growth rate of per
capita GDP; as countries become more
decentralized (the average growth rate
of local governments expenditure
increases) the growth in GDP per capita
increases.
Figure-3: Growth in GDP Per Capita & Decentralization
1981-1998
Austria
Canada
GermanyUSA
Switzerland
Australia
Spain
ColumbiaMexico
Argentina
Bolivia
Norway
LuxembourgItaly
United Kingdom
Netherlands
Sweden
PortugalIrelandIceland
Kenya
France
FinlandDenmark
Chile Belgium
Isreal
Thailand
Philippines
-0.0600
-0.0400
-0.0200
0.0000
0.0200
0.0400
0.0600
0.0800
-0.02 -0.01 0.00 0.01 0.02 0.03 0.04 0.05
Average Growth Rate of Local Government Expenditure Share in Total Government Expenditure

10
Box -1: Empirical Studies on the Impact of Fiscal Decentralization on Public Sector Size
If greater decentralization increases number of alternative fiscal jurisdictions, any
attempt to increase tax rates in one jurisdiction would result in migration of its residents to
another jurisdiction (Tiebout, 1956). In Tiebout's analysis, taxpayers migrate alternative
jurisdictions in order to avoid higher taxes and interjurisdictional competition limit excessive
taxing power of the governments. Along with the lines of Tiebout, Brennan and Buchanan
(1980) developed the “Leviathan” hypothesis, in which they argue that fiscal
decentralization serves as a constraint on the behavior of the revenue-maximizing
government. The "Leviathan" hypothesis predicts that the overall size of the public sector
should vary inversely with fiscal decentralization; fiscal decentralization increases
competition among local governments, which ultimately limits the size of the public sector.
Empirical studies have tested the relationship between subnational government expenditures
in total government expenditure and reduction in the total public sector size and reported
conflicting results.
Studies Testing “Leviathan” Hypothesis
Study Unit of Analysis Findings
Oates (1985) Cross-country comparison No significant relationship
Nelson (1986) United States No significant relationship
Marlow (1988) United States Strong negative correlation
Grossman (1989) United States Strong negative correlation
Joulfaian and Marlow (1990) United States Strong negative correlation
Grossman and West (1994) Canada Strong negative correlation
Ehdaie (1994) Cross-country comparison Strong negative correlation
Box -2: Empirical Studies on the Impact of Fiscal Decentralization on Economic Growth
There has been little research done on the impact of fiscal decentralization on economic
growth. Until recently the debate over the merits of fiscal decentralization had been on
theoretical grounds of efficiency gains and the empirical studies that have analyzed the impact
of fiscal decentralization on economic growth have only appeared recently. The general
finding of these studies is that fiscal decentralization is associated with slower economic
growth.
Studies on The Impact of Fiscal Decentralization on Economic Growth
Study Unit of Analysis Findings
Davoodi and Zou (1998) Cross-country comparison Significant negative relationship
Xie, Zou and Davoodi (1999) United States Significant negative relationship
Zhang and Zou (1998) China Significant negative relationship
Serious methodological issues confront efforts to carry out studies about the impact of
fiscal decentralization on economic growth. First, there is the issue of specification of
empirical model. The literature on economic growth suggests that growth is a complex
phenomenon with multi-dimensions (Levine and Renelt, 1992). These studies are criticized on
the grounds of a possible model misspecification (Martinez-Vazquez and McNab, 1997).
Second, the fiscal decentralization variable used in these studies does not represent the
multidimensionality of the issue. Without controlling for subnational governments’ autonomy

11
over expenditure and revenue decisions and whether subnational officials are democratically
elected, the expenditure share of subnational governments as a fiscal decentralization variable
means very little in representing the level of decentralization. Third, regression coefficients
may very well be the product of spurious correlation. In regression analysis models, the cause-
and-effect relationship runs directly from explanatory variables to the dependent variable.
However, if both dependent and independent variables are determined simultaneously, the
distinction between dependent and explanatory variables becomes dubious. If there is no
unidirectional cause-and-effect relationship, the dependent variable is determined by
explanatory variables, and some of the explanatory variables are, in turn, determined by
output. Given that there has been extensive research on the role of economics on growth on
fiscal decentralization (Oates, 1985; Pommerehne, 1977; Kee, 1977; Bahl and Nath, 1986) and
very little research on the causation line from fiscal decentralization to economic growth, it is
highly suspected that the regression coefficients reported on these studies is a mere reflection
of spurious correlation. Therefore, the theoretical underpinnings of the relationship between
fiscal decentralization and economic growth still need to be further developed.
The strong positive correlation between decentralization and GDP per capita in
developed countries support the argument that as people become more educated, better
informed about their governments, and more aware of problems that affect their lives,
their desire to bring the control of government functions closer to themselves grows
(Smoke, 1994). In fact, much of the decentralization that has taken place in the past
decade has been motivated by political dynamics that promote democracy and
transparency. In most countries, decentralization has been an essential part of the
democratization process as discredited autocratic central regimes are replaced by elected
governments and the spread of multiparty democratic systems give a chance to local
voice to be heard.
The rationale for democratic participation and transparency is to make it possible
for people to participate in and influence the decisions made within their own
geographical area. In a decentralized system, where locally elected governments have the
power to pursue the agenda mandated by voters, citizen participation in decision making
process cultivates a culture of democracy and transparency in public management system.
Therefore, an important component of decentralization process is to design mechanisms
that would encourage participation of citizens in decision-making process.
Participation is concerned with increasing the role of citizens in choosing their
leaders and in telling what to do. Regular elections, local referendums, permanent
councils and other institutional structures are some of the easily identifiable and effective
tools that may improve the ability of local governments to identify and act on citizen
preferences in a decentralized setting. Studies have shown that citizens' participation and
control over government's actions can increase the quality of public management system
and that participation of citizens in decision-making process can lead to some identifiable
improvements in the allocation of resources (Putnam, 1993; Fiszbein, 1997, Narayan and
Pritchett, 1997).
In a seminal study Putnam (1993) compares regional governance practices in Italy
and concludes that regional governments that are more open to constituent pressure were
more successful at managing resources and delivering services. In a similar study,

12
Fiszbein (1997) shows that in Columbia, elected officials whose jobs are under public
scrutiny are more likely to pick better staff to work for them. Finally, in a recent study
Narayan and Pritchett (1997) analyze the relationship between the quality of local
schooling and the level of social capital in rural Tanzania. They conclude that there is a
positive association between schooling and social capital which in return increase the
economic well-being of rural communities.
Two other studies found similar results in the analysis of the relationship between
fiscal decentralization and political participation and governance quality recently. Huther
and Shah (1998) have developed governance quality index, to analyze the relationship
between fiscal decentralization and governance quality, for a sample of 80 countries. The
index is composed of four indices: citizen participation index, government orientation
index, social development index, and economic management index. Their findings
suggest that decentralized systems are more responsive to citizens’ preferences than
centralized systems. In another study, the Inter-American Bank analyzed different aspects
of fiscal decentralization in Latin American and the Caribbean countries and conclude
that there is a positive association between political autonomy and participation at lower
levels of government, and the extent to which government expenditures are decentralized
(The Economic and Social Progress Report, 1997).
III. DIFFERENCES IN THE DEGREE OF DECENTRALIZATION In the past, due to political ideology or the autocratic character of the regime, some
countries felt the need to keep their distant provinces together under one power. As
discussed in the previous section, there are several factors contributed to the growing
interest in fiscal decentralization. Although, these are common factors for most of the
countries, there exist differences in the degree of decentralization across nations (see
figure 4 and 5)4. These differences are in part explained by different size variables, such
as population (Oates, 1972; Pommerehne, 1977; Bahl and Nath, 1986), land area (Oates,
1972), and GDP (Pommerehne, 1977).
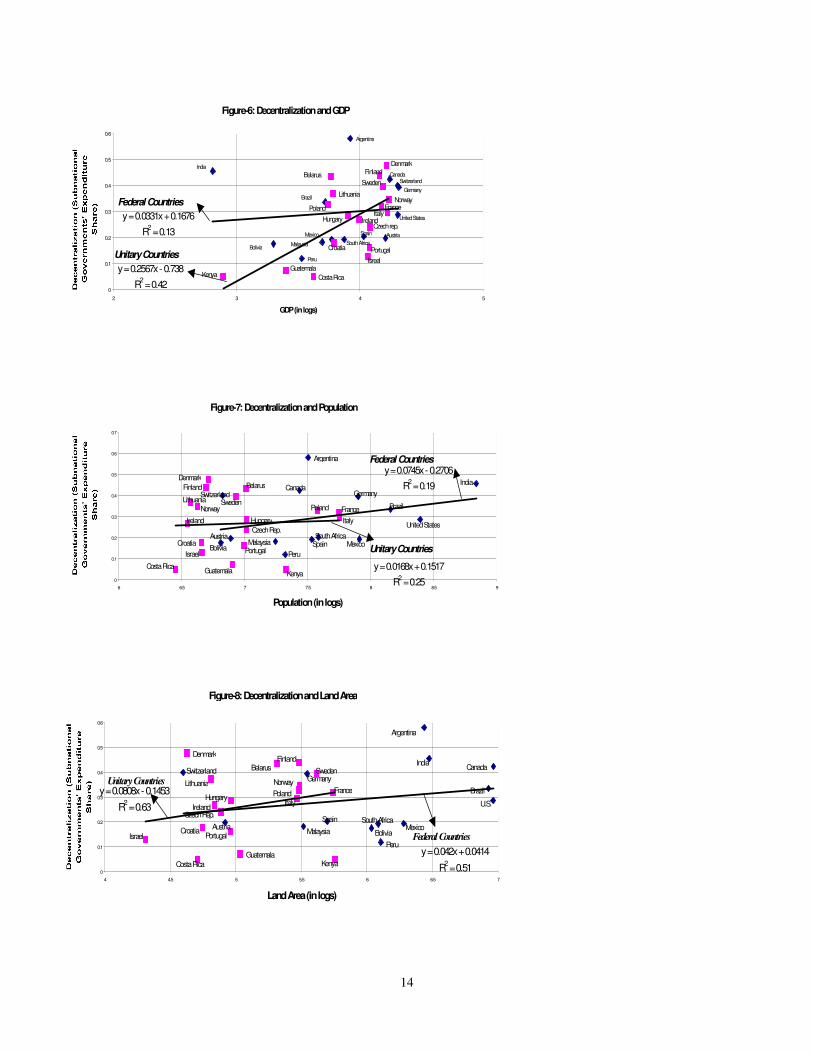
Figures 6, 7, and 8 present the association between country size and
decentralization for federal and unitary countries separately.5 The reason for separating
them is the differences in governance systems. In general, the public administration
system in large countries is based on principles of federalism and the division of power
between central government and its component units is provided by the constitution.
However, the centralization-decentralization distinction is not synonymous with the
distinction between federal and unitary systems. Just like unitary countries can be
decentralized federal countries can be centralized.
4 Figures 4 and 5 present the variation in expenditure and revenue shares of subnational governments across
regions. As presented in figures 4 and 5, high-income countries are relatively more decentralized than
others. Subnational governments in East Asian and South Asian countries appear to have the lowest level of
subnational expenditure and revenue shares compared to other regions of the world. However, this may not
be the case. South Asia pillar in figure 4 includes only Thailand, Macao, and Mongolia. In figure 5, it only
includes Thailand, which is not a reflection of the characteristics of the region. Otherwise, sub-Saharan
Africa would have the lowest levels of subnational revenue and expenditure shares. 5 The figures for subnational governments' expenditure share are from GFS used in Figure 1 and the size
variables are from World Development Indicators of the World Bank.

13
Figure 4: Subnational Share of
Expenditures by Region
0%
10%
20%
30%
40%
50%
60%
East Asia and
South Asia (3)
Africa (2) Eastern Europe
and the Russian
Federation (18)
Latin America
and the
Caribbean (5)
High Income,
OECD (9)
Figure 5: Sub-national Share of Revenues by
Region
0%
5%
10%
15%
20%
25%
30%
35%
40%
45%
East Asia and
South Asia (1)
*Africa (2) Eastern Europe
and the Russian
Federation(10)
Latin America and
the Caribbean (5)
High Income,
OECD 4)
Note: Simple average of most recent observations in available countries. Numbers in parenthesis indicate number of countries represented.
* Africa: In figure 5 Africa numbers are from the year 1999.
Figure 6 shows the association between GDP per capita and decentralization in
federal and unitary countries. The regression line suggests that GDP per capita is
positively associated with higher decentralization in both groups. The positive association
is stronger and the regression analysis has a stronger explanatory power for unitary
countries. The positive association of decentralization and GDP per capita suggests that
an increase in income increases expenditure levels for subnational governments. The
steeper regression line for unitary states implies that the increase in income levels has a
stronger effect on subnational governments' expenditure levels than it has in federal
states.
Figure 7 presents the association between population and fiscal decentralization for
the same group of countries. It appears that population is positively associated with
higher levels of subnational governments spending in both groups also. However, as seen
in the figure, unlike GDP per capita, the positive association is stronger for federal
countries. The stronger association of population with fiscal decentralization in federal
countries is consistent with the argument that as the country size gets bigger, subnational
governments are expected to play an important role in delivering public services.
The third size variable that explains the degree of differences among countries is
land area. Figure 8 shows the relationship between land area and decentralization. As
seen in the figure, the regression line has a positive slope for both groups of countries,
which suggest that land area is positively associated with higher decentralization. The
magnitude of the impact of land area on fiscal decentralization is stronger for unitary
states than federal ones.
14
Figure-7: Decentralization and Population
MexicoSouth Africa
Spain
Peru
MalaysiaBolivia
Austria
CanadaSwitzerland
Brazil
Germany
United States
India
Argentina
GuatemalaCosta Rica
Kenya
PortugalIsrael
Croatia
Czech Rep.
Hungary
Sweden
Ireland
Norway
Lithuania
BelarusFinland
Denmark
Italy
FrancePoland
y = 0.0745x - 0.2706
R2 = 0.19
y = 0.0168x + 0.1517
R2 = 0.250
0.1
0.2
0.3
0.4
0.5
0.6
0.7
6 6.5 7 7.5 8 8.5 9
Population (in logs)
Federal Countries
Unitary Countries
Figure-8: Decentralization and Land Area
U.S.
Brazil
CanadaIndia
Argentina
Peru
MexicoSouth Africa
Bolivia
Spain
MalaysiaAustria
GermanySwitzerland
Italy
KenyaGuatemala
Costa Rica
PortugalIsraelCroatia
Czech Rep.Ireland
HungaryFrancePoland
Norway
Sweden
FinlandBelarus
Lithuania
Denmark
y = 0.042x + 0.0414
R2 = 0.51
y = 0.0808x - 0.1453
R2 = 0.63
0
0.1
0.2
0.3
0.4
0.5
0.6
4 4.5 5 5.5 6 6.5 7
Land Area (in logs)
Federal Countries
Unitary Countries
Figure-6: Decentralization and GDP
Peru
AustriaSpain
South Africa
Mexico
MalaysiaBolivia
United States
Brazil
Germany
SwitzerlandCanada
Argentina
India
Costa Rica
GuatemalaKenya
Croatia Portugal
Isreal
Czech rep.IrelandHungary
PolandItaly
FranceNorway
Lithuania
Denmark
Sweden
FinlandBelarus
y = 0.0331x + 0.1676
R2 = 0.13
y = 0.2567x - 0.738
R2 = 0.42
0
0.1
0.2
0.3
0.4
0.5
0.6
2 3 4 5
GDP (in logs)
Federal Countries
Unitary Countries

15
IV. HOW TO DECENTRALIZE?
The transfer of authority and responsibility for public functions from the central
government to subordinate or quasi-independent government organizations covers a
broad range of topics (World Bank, 1999). There is no prescribed set of rules governing
the decentralization process that apply to all countries. Decentralization takes different
forms in different countries, depending on the objectives driving the change in structure
of government.
In general, decentralization of public policy making power is the transfer of legal
and political authority to plan projects, make decisions and manage public functions from
the central government and its agencies to institutions within smaller geographical
boundaries - subnational governments. Power can be transferred on three fronts: political,
administrative, and fiscal. Although, each type of decentralization has different
characteristics, system outcomes, and policy implications, the expected impact on
people's life is an increase in the quality (see Figure 9). While distinguishing among
different types of decentralization is useful for highlighting its many dimensions, it is
impossible to disentangle the inter-linkages between these three concepts.
Decentralization on political fronts aims to give citizens and their elected
representatives more power in public decision-making. The concept implies the transfer
of policy and legislative power to citizens and their democratically elected
representatives. Political decentralization is often associated with pluralistic politics and
representative governments. If necessary, it requires constitutional or statutory reforms,
development of pluralistic political parties, the strengthening of legislatures, and the
creation of local political units and the encouragement of effective public interest
groups.6
On the administrative front, decentralization of policymaking power means the
redistribution of authority, responsibility, and financial resources among different levels
of government. Administrative decentralization can be done in two different ways:
functional and areal distribution of power (Rondinelli, 1981). Functional distribution is to
transfer authority to specialized organizations that operate across jurisdictions. An
example of functional distribution is the creation of field offices within national
ministries dealing with health care, education, and transportation issues. Areal
distribution of power aims to transfer responsibility for public functions to institutions
within specified geographical and political boundaries. Usually, areal distribution of
power is to a subnatinal government - a province, district or municipality.
In the case of administrative distribution of power, an important distinction that has
important implications on intergovernmental relations systems is the forms of
decentralization: deconcentration, delegation, and devolution.
1. Deconcentration involves the shifting of responsibilities from central government
agencies located in the capital city to regional offices. Rondinelli (1981) defines
deconcentration as local administration in which all subordinate levels of government
within a country are agents of the central authority either appointed by or are
responsible directly to the central government. This is the least extensive type of
administrative decentralization.
6 Op. cit. Rondinelli (1999).

16
2. Delegation refers to the transfer of public policy making and administrative authority
and/or responsibility for carefully spelled out tasks to institutions and organizations
that are either independent or under the central government's indirect control.
Typically, delegation of functions is by the central ministries to semi-autonomous
organizations not wholly controlled by the central government but legally accountable
to it, such as state owned enterprises, public utilities, and regional planning and
economic development authorities.
3. Devolution is the most extreme form of decentralization where independently
established subnational governments are given the responsibility for the delivery of a
set of public services along with the authority to impose taxes and fees to finance
services. In a devolved system, subnational governments have independent authority
to raise their own revenues and to make investment decisions. It is devolution of
administrative power that underlies decentralization of power on political fronts.
Devolution is usually synonymous to fiscal decentralization where subnational
governments have clear expenditure assignments, substantial budget autonomy, and
legally recognized geographical boundaries within which they perform public functions.
Although the varieties of fiscal decentralization may exist, corresponding to the degree of
independent decision making exercised at the subnational level, the general description of
the term fiscal decentralization encompasses the political, economic, and institutional
underpinnings of intergovernmental fiscal relations, and ranges from examining the
efficiency of public institutions and developing sustainable infrastructure finance, to
rationalizing fiscal transfer mechanisms and supporting the social safety net (Ebel and
Hotra, 1997).
Therefore, a carefully designed fiscal decentralization policy should not only
enhance local autonomy where subnational governments are allowed to act independently
within their own sphere of competence in designing revenue and expenditure policies but
also promote political accountability, economic efficiency and transparency.

17
Fiscal
•Fiscal Resources
•Fiscal Autonomy
•Fiscal Decision-making
Political
•Civil Liberties
•Political Rights
•Democratic Pluralistic
System
System Outcomes
•Resource Mobilization
•Resource Allocation
•Fiscal Capacity
Administrative
•Administrative Structures
and Systems
•Participation
•Political Accountability
•Political Transparency
•Political Representation
•Administrative Capacity
•Admin. Accountability
•Admin. Transparency
•Responsive Services
•Effective Services
•Efficient Services
•Sustainable Services
System Results Impact
FACTORS
THAT
AFFECT
OUTCOM
E TIME
Decentralization
Figure- 9: Decentralization on Three Fronts
Source : Adapted from Parker, Andrew N. 1995,"Decentralization: The Way Forward for Rural Development?" Policy Research Working Paper 1475. The World Bank, Washington, D.C.
•Increased Incomes
•Increased Productivity
•Increased Literacy
•Decreased Mortality
•Increased Living Standards
•Growth of Civil Society

20
There is no easy answer to the question of how to design a decentralization strategy
to promote transparency, accountability, and efficiency in intergovernmental financial
systems. Ideally the intergovernmental fiscal system should function leaving little room
for ambiguity and negotiations among different levels of government. Therefore, an
important component of a decentralization strategy is designing a legal and regulatory
framework that would provide guidance to different levels of government in sorting out
the roles and responsibilities.
In the process of decentralization, the constitution should enshrine the broad
principles on which decentralization is to operate, including rights and responsibilities of
all levels of government, the description, and role of key institutions at central and local
levels, and the basis on which detailed rules may be established or changed (Ford, 1999).
The specific parameters of the intergovernmental fiscal system and the institutional
details of the local government structure must be defined in the laws governing relations
across governments. Ford (1999) lists the issues that the legal framework of reform
efforts should address as:
• Classification of local governments within tiers established under the constitution;
• Broad organization structures and their roles and responsibilities;
• Terms of office, operating powers, procedures, and limitations of the political
leadership, as distinct from the civil service;
• The degree of autonomy of personnel policies and administration of local
governments;
• The taxing and fiscal administration authority of local governments;
• The borrowing authority and capacities of local governments;
• The distribution of budgeting, expenditure management, accounting, auditing, and
reporting requirements;
• Service provision and delivery authority;
• The mechanisms for citizen participation and voice.
V. FOUR PILLARS OF THE INTERGOVERNMENTAL FISCAL SYSTEM
The design of a decentralized system requires the "sorting-out" of public sector
responsibilities among different types of governments and the process of sorting out
entails the transfer of some decision-making powers from central to subnational
governments (Ebel, Varfalavi and Varga, 2000). However, designing a decentralized
system is not limited to the question of assigning responsibilities among different levels
of government. The question is designing an intergovernmental finance system that can
best achieve the national policy objectives. Such objectives may include not only
efficiency, transparency, and accountability but also achieving equity among people and
places, maintaining national integrity and political stability. The challenge is to design an
intergovernmental system that links decentralization reforms to the economic, social, and
institutional development of the society. According to Bird (2000), such a design is based
on four pillars: expenditure assignment, revenue assignment, intergovernmental
transfers/grants, and subnational debt/borrowing.

21
Expenditures
Expenditure assignment is the first step in designing an intergovernmental fiscal system.
Designing revenue and transfer components of a decentralized intergovernmental fiscal
system in the absence of concrete expenditure responsibilities would weaken the
decentralization process (Martinez-Vazquez, 1994). In Latin America and Eastern
Europe, many countries have focused only on the revenue side of decentralization and
neglected a clear assignment of expenditure responsibilities. This led to weak
decentralized systems and fiscally overburdened central governments.
The lack of clarity in the definition of subnational responsibilities has a negative
impact in three important respects. First, if the responsibilities are imprecise, the
necessary corresponding revenues will remain poorly defined. Second, without clear
responsibilities, subnational government officials might prefer to invest in populist
projects which benefit them in the short run rather than in projects with long term impact
on the region's economy (such as infrastructure, education, etc.). Third, there will be a
confusion whether subnational expenditures represent local priorities or centrally
determined programs.
The key to the success of a decentralized system is matching expenditure
responsibilities with the objectives of service assignment. A report prepared by the US
Advisory Commission on Intergovernmental Relations (ACIR) on Governmental
Functions and Processes (1974) lists four criteria in assigning services: economic
efficiency, fiscal equity, political accountability, and administrative effectiveness. As
presented in Figure 10, these characteristics suggest that expenditure assignments should
be made to governmental units that can
...(1) supply a service at the lowest possible cost; (2) finance a function
with the greatest possible fiscal equalization; (3) provide a service with
adequate popular political control; and (4) administer a function in an
authoritative, technically proficient, and cooperative fashion.7
These four factors provide a framework to determine whether each function could
be best performed by central government or any other level of governmental unit. In
more specific terms they relate economic, political, and administrative considerations to
the size variable: 8
1. Economic Efficiency: Functions should be assigned to jurisdictions
(a) that are large enough to realize economies of scale and small enough not to
incur diseconomies of scale; [economies of scale]
(b) that are willing to provide alternative service offerings to their citizens and
specific services within a price range and level of effectiveness acceptable to
local citizenry; [public sector competition]
(c) that adopt pricing policies for their functions whenever possible. [public
sector pricing]
2. Fiscal Equity: Appropriate functions should be assigned to jurisdictions
7 ACIR (1974), p. 7.
8 ACIR (1974), p. 7.

22
(a) that are large enough to encompass the cost and benefits of a function or
that are willing to compensate other jurisdictions for the service costs imposed
or for benefits received by them ; [economic externalities]
(b) that have adequate fiscal capacity to finance their public service
responsibilities and that are willing to implement measures that insure inter-
personal inter-jurisdictional fiscal equity in the performance of a function.
[fiscal equalization]
3. Political Accountability: Functions should be assigned to jurisdictions
(a) that are controllable by, accessible to, and accountable to their residents in
the performance of their public service responsibilities; [access and control]
(b) that maximize the conditions and opportunities for active and productive
citizen participation in the performance of a function. [citizen participation]
4. Administrative Effectiveness: Functions should be assigned to jurisdictions
(a) that are responsible for a wide variety of functions and that can balance
competing functional interests; [general-purpose character]
(b) that encompass a geographic area adequate for effective performance of a
function; [geographic adequacy];
(c) that explicitly determine the goals of and means of discharging public
service responsibilities and that periodically reassess program goals in light of
performance standards; [management capability]
(d) that are willing to pursue intergovernmental policies for promoting inter-
local functional cooperation and reducing inter-local functional conflict;
[intergovernmental flexibility] and
(e) that have adequate legal authority to perform a function and rely on it in
administering the function. [legal adequacy]
The ACIR report stresses that these characteristics might yield conflicting
recommendations for expenditure assignment therefore based on the objectives of
decentralization they must be weighted against each other in assigning functional
responsibilities. For example, if education services are assigned to subnational
governments, wealthier jurisdictions will have more financial resources than poor
jurisdictions to allocate for this function. Therefore, assigning this function to subnational
governments will contradict to fiscal equalization criteria. However, assigning it to the
central government means loss of political control for local residents.
Table 5 provides an overview of expenditure patterns across countries reported in
the Government Finance Statistics Yearbook 1998. As seen in the table, functions with
high degree of spillover externalities (such as defense and welfare) are exclusively
performed by central governments and functions which require a high degree of political
accountability (such as education) are performed by subnationl governments in both
federal and unitary countries.

23
F i s c a l E q u i t y
• E c o n o m i c e x t e r n a l i t i e s
• F i s c a l e q u a l i z a t i o n
E c o n o m i c E f f i c i e n c y
• E c o n o m i e s o f s c a l e
• P u b l i c s e c t o r c o m p e t i t i o n
• P u b l i c s e c t o r p r i c i n g
O u t c o m e
• A v o i d " f r e e - r i d e r s "
• D i m i n i s h e d i n t e r - j u r i s d i c t i o n a l
d i s p a r i t i e s
• A c c e s s a n d c o n t r o l
• L e a s t - c o s t l e v e l o f s e r v i c e
• T r u e p r e f e r e n c e s o f
" c o n s u m e r - v o t e r s " • B e s t u s e o f p u b l i c s e r v i c e
D i f f u s i o n o f p o l i t i c a l
p o w e r
• P o p u l a r s u p p o r t o f
g o v e r n m e n t a l s y s t e m
• S e r v i c e
E f f i c i e n t
• E g a l i t a r i a n
i n S e r v i c e
P r o v i s i o n
• E f f e c t i v e i n
S e r v i c e
D e l i v e r y
• T e c h n i c a l l y
P r o f i c i e n t
F e a t u r e s o f
I n t e r g o v e r n m e n t a l S y s t e m
F O U R A S S I G N M E N T F A C T O R S
C r i t e r ia
F i g u r e - 1 0 : E x p e n d i t u r e A s s i g n m e n t P r o c e s s
S o u r c e : A d a p t e d f r o m A C I R . ( 1 9 7 4 ) . G o v e r n m e n t a l F u n c t i o n s a n d P r o c e s s : L o c a l a n d A r e a w i d e . A d v i s o r y C o m m i s s i o n o n I n t e r g o v e r n m e n t a l R e l a t i o n s , A - 4 5 . W a s h i n g t o n , D C .
A d m i n i s t r a t i v e E f f e c t i v e n e s s
L e g a l a d e q u a c y •
• G e n e r a l - p u r p o s e g o v e r n m e n t
• I n t e r g o v e r n m e n t a l f l e x i b i l i t y
• G e o g r a p h i c a d e q u a c y
• M a n a g e m e n t C a p a b i l i t y
• C i t i z e n p a r t i c i p a t i o n
J u r i s d i c t i o n a l a c c o u n t a b i l i t y
• L i m i t s j u d i c i a l i n t e r f e r e n c e
• V e r t i c a l a n d h o r i z o n t a l
c o o p e r a t i o n o f
g o v e r n m e n t a l u n i t s
• E f f e c t i v e p u b l i c
a d m i n i s t r a t i o n
• G r e a t e r p r o f e s s i o n a l i s m
•
•
P o l i t i c a l A c c o u n t a b i l i t y

24
Tables-5 A & B: Expenditure Shares of Central and Subnational Governments in Unitary and Federal Countries
Table- 5A Defense Education Health Housing Police Recreation Welfare Subsidies Other
C L C L C L C L C L C L C L C L C L
Albania 100% 0% 20% 80% 70% 30% 68% 32% 100% 0% 65% 35% 81% 19% 63% 37% 75% 25%
Azerbaijan 100% 0% 17% 83% 16% 84% 2% 98% 100% 0% 55% 45% 99% 1% 100% 0% 84% 16%
Belarus 98% 2% 18% 82% 21% 79% 0% 100% 81% 19% 42% 58% 97% 3% 92% 8% 74% 26%
Bulgaria 100% 0% 39% 61% 44% 56% 32% 68% 98% 2% 65% 35% 94% 6% 90% 10% 82% 18%
Croatia 100% 0% 81% 19% 99% 1% 63% 37% 99% 1% 31% 69% 99% 1% 54% 46% 64% 36%
Czech Republic 98% 2% 82% 18% 95% 5% 23% 77% 83% 17% 35% 65% 93% 7% 98% 2% 41% 59%
Denmark 100% 0% 53% 47% 5% 95% 69% 31% 88% 12% 43% 57% 46% 54% 65% 35% 73% 27%
Estonia 100% 0% 45% 55% 97% 3% 1% 99% 99% 1% 61% 39% 91% 9% 56% 44% 62% 38%
Iceland 100% 0% 47% 53% 99% 1% 31% 69% 92% 8% 45% 55% 78% 22% 82% 18% 78% 22%
Kazakhstan 86% 14% 22% 78% 57% 43% 0% 100% 75% 25% 55% 45% 73% 27% 66% 34% 79% 21%
Latvia 99% 1% 28% 72% 95% 5% 20% 80% 93% 7% 53% 47% 94% 6% 91% 9% 66% 34%
Lithuania 100% 0% 30% 70% 98% 2% 0% 100% 97% 3% 61% 39% 91% 9% 99% 1% 78% 22%
Mauritius 100% 0% 100% 0% 100% 0% 77% 23% 99% 1% 79% 21% 99% 1% 100% 0% 91% 9%
Moldova 100% 0% 32% 68% 40% 60% 23% 77% 85% 15% 64% 36% 95% 5% 93% 7% 57% 43%
Mongolia 100% 0% 28% 72% 13% 87% 38% 62% 51% 49% 61% 39% 99% 1% 31% 69% 56% 44%
Norway 100% 0% 37% 63% 23% 77% 13% 87% 83% 17% 35% 65% 81% 19% 85% 15% 66% 34%
Poland 100% 0% 43% 57% 88% 12% 18% 82% 96% 4% 45% 55% 95% 5% 88% 12% 62% 38%
Slovak Republic 100% 0% 100% 0% 100% 0% 40% 60% 95% 5% 72% 28% 99% 1% 96% 4% 73% 27%
Slovenia 99% 1% 76% 24% 99% 1% 22% 78% 94% 6% 55% 45% 99% 1% 77% 23% 81% 19%
United Kingdom 100% 0% 33% 67% 100% 0% 59% 41% 48% 52% 35% 65% 80% 20% 91% 9% 78% 22%
Table- 5B Defense Education Health Housing Police Recreation Welfare Subsidies Other
C S L C S L C S L C S L C S L C S L C S L C S L C S L
Australia 100% 0% 0% 28% 72% 0% 52% 47% 1% 23% 44% 33% 13% 83% 3% 20% 46% 34% 90% 8% 1% 58% 33% 9% 46% 46% 8%
Bolivia 100% 0% 0% 57% 37% 6% 38% 47% 15% 23% 31% 46% 100% 0% 0% 24% 14% 62% 93% 6% 2% 30% 39% 30% 78% 5% 17%
Switzerland 90% 5% 5% 10% 55% 36% 57% 25% 19% 14% 23% 63% 7% 67% 26% 13% 31% 56% 78% 14% 8% 33% 44% 23% 39% 28% 33%
United States 100% 0% 0% 5% 43% 52% 57% 32% 11% 72% 9% 20% 18% 28% 55% 24% 11% 65% 69% 22% 8% 64% 26% 9% 69% 13% 19%
Russian Fed. 100% 0% 0% 14% NA 86% 15% NA 85% 7% NA 93% 73% NA 27% 15% NA 85% 90% NA 10% 89% NA 11% 64% NA 36%
Indonesia 100% 0% 0% 93% NA 7% 91% NA 9% 98% NA 2% 99% NA 1% 100% NA 0% 100% NA 0% 14% NA 86% 100% NA 0% C= Central Government, S= State or Provincial Government, L= Local Government
Source: International Monetary Fund, 1998. Government Finance Statistics Yearbook 1998.

25
Revenues The essence of decentralization is that subnational governments have the authority and
responsibility to own-finance local services at the margin. Complete fiscal autonomy over
revenues requires that in principle local governments can change tax rates and set tax
bases. Box 3 illustrates varying levels of local revenue autonomy in different tax designs.
The general principles of revenue assignment to different levels of governments are listed
in fiscal federalism and local government finance literature (Oates, 1972; Bird, 2000):
1. The tax base assigned to subnational governments should be immobile in order to
allow local authorities some freedom to vary rates without the base vanishing. Inter-
jurisdictional mobility of tax base makes taxation of mobile factors difficult to
subnational governments.
2. Redistributive taxes should be assigned to the central government. Taxes imposed on
mobile factors for redistribution purposes might result in inefficient jurisdictional
allocation of the factors of production. Uniform redistributive taxes minimize
locational distortions of economic activities.
3. Services provided by subnational governments should be financed through user
charges and other local fees and taxes that are related to benefits. Efficient allocation
of resources requires subnational governments to recover their expenses from the
beneficiaries of their services. Examples of benefit related revenues include taxes
levied on motor vehicles and fuels and construction fees.
4. It should not be possible to export the tax to nonresidents.
5. Taxes that are subject to important economies of scale in collection efforts should be
centralized.
6. Taxes subject to cyclical fluctuations needs to be protected by a system of counter-
cyclical rate adjustments in order to avoid subnational governments exploitation of
fiscal power.
7. Taxes levied on tax bases that are unevenly distributed should be centralized. Uneven
distribution of tax bases among subnational governments forces the residents of one
subnational area to bear the economic burden of taxes imposed by another
jurisdiction. Taxation of natural resource is the best example of this type of taxation
practice.
8. Local revenue yield should be adequate to meet local needs and sufficiently buoyant,
that is expanding at least as fast as expenditures over time.
9. The revenue yield should be stable and predictable over time.
10. The revenue system should be easy to administer efficiently and effectively.
11. Subnational taxes should be visible to encourage subnational government liability.

26
Figure 11: Vertical Imbalance by Region
0%
5%
10%
15%
20%
25%
30%
35%
40%
45%
Africa (2) Eastern
Europe (18)
South, East
Asia and the
Pacific (6)
Latin
America &
Caribbean
(3)
High Income
OECD (4)
Note: Measured as transfers to sub-national governments as a share
of sub-national expenditures. Simple average of most recent
observations in available countries. Numbers in parenthesis indicate
number of countries represented.
Box- 3: Fiscal Autonomy in Subcentral Governments
Own taxes Base and rate under local control.
Overlapping taxes Nationwide tax base, but rates under local control
Nontax revenues Fees and charges. Generally, the central government
specifies where such charges can be levied and the
provisions that govern their calculation.
Shared taxes Nationwide base and rates, but within a fixed proportion of
the tax revenue (on a tax-by-tax basis or on the basis of a
“pool” of different tax sources) being allocated to the
subcentral government in question, based on (1) the revenue
accruing within each jurisdiction (also called the derivation
principle) or (2) other criteria, typically population,
expenditure needs, and/or tax capacity.
General purpose grant Subcentral government share is fixed by central government
(usually with a redistributive element), but the former is free
to determine how the grant should be spent; the amounts
received by individual authorities may depend on their
efforts.
Specific grants The absolute amount of the grant may be determined by
central government or it may be “open-ended” (that is,
dependant on the expenditure levels decided by lower levels
of government), but in either case central government
specifies the expenditure programs for which the funds
should be spent. Source: Anwar Shah, The Reform of Intergovernmental Fiscal Relations In Developing & Emerging Countries, Policy
and Research Series #23, World Bank 1994.
Intergovernmental Transfers The revenue and expenditure
assignments give rise to vertical and
horizontal imbalances within a nation's
intergovernmental finances. In fact,
every intergovernmental transfer
system has two dimensions: (i) the
vertical dimension, concerned with the
distribution of revenues between
central and local governments; and (ii)
the horizontal dimension, concerned
with the allocation of financial
resources among the recipient units.
A vertical imbalance occurs
when the expenditure responsibilities
of subnational governments do not
match with their revenue raising
27
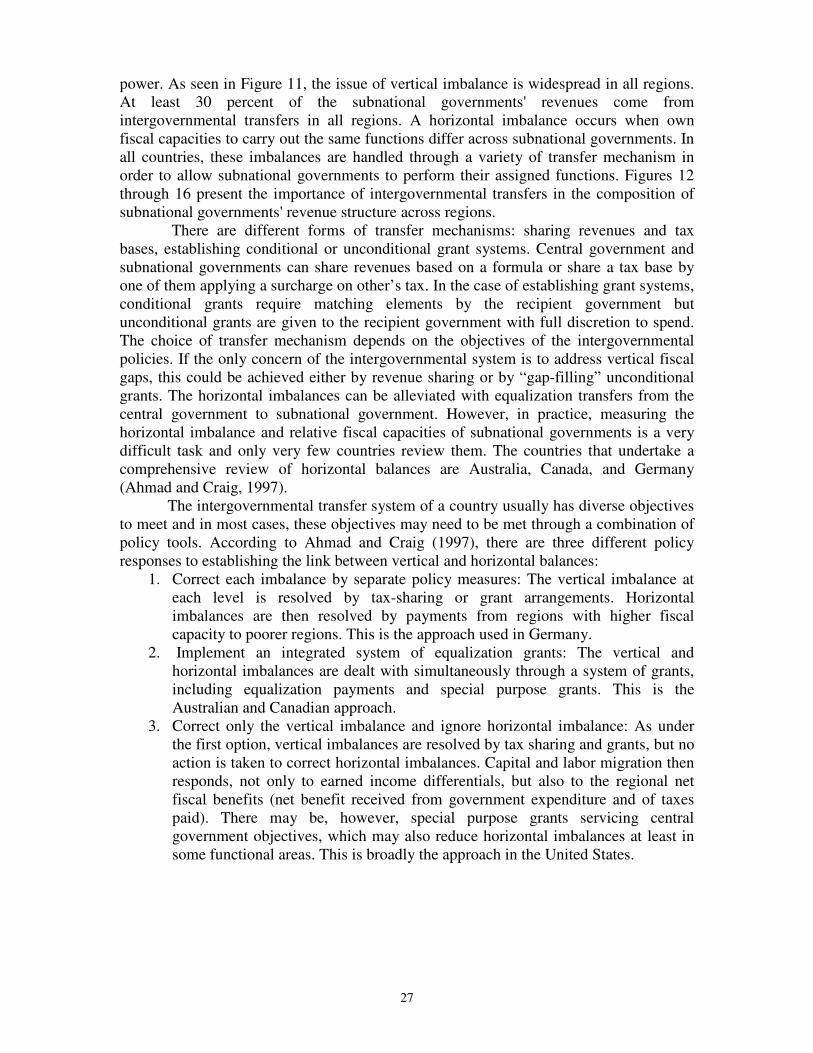
power. As seen in Figure 11, the issue of vertical imbalance is widespread in all regions.
At least 30 percent of the subnational governments' revenues come from
intergovernmental transfers in all regions. A horizontal imbalance occurs when own
fiscal capacities to carry out the same functions differ across subnational governments. In
all countries, these imbalances are handled through a variety of transfer mechanism in
order to allow subnational governments to perform their assigned functions. Figures 12
through 16 present the importance of intergovernmental transfers in the composition of
subnational governments' revenue structure across regions.
There are different forms of transfer mechanisms: sharing revenues and tax
bases, establishing conditional or unconditional grant systems. Central government and
subnational governments can share revenues based on a formula or share a tax base by
one of them applying a surcharge on other’s tax. In the case of establishing grant systems,
conditional grants require matching elements by the recipient government but
unconditional grants are given to the recipient government with full discretion to spend.
The choice of transfer mechanism depends on the objectives of the intergovernmental
policies. If the only concern of the intergovernmental system is to address vertical fiscal
gaps, this could be achieved either by revenue sharing or by “gap-filling” unconditional
grants. The horizontal imbalances can be alleviated with equalization transfers from the
central government to subnational government. However, in practice, measuring the
horizontal imbalance and relative fiscal capacities of subnational governments is a very
difficult task and only very few countries review them. The countries that undertake a
comprehensive review of horizontal balances are Australia, Canada, and Germany
(Ahmad and Craig, 1997).
The intergovernmental transfer system of a country usually has diverse objectives
to meet and in most cases, these objectives may need to be met through a combination of
policy tools. According to Ahmad and Craig (1997), there are three different policy
responses to establishing the link between vertical and horizontal balances:
1. Correct each imbalance by separate policy measures: The vertical imbalance at
each level is resolved by tax-sharing or grant arrangements. Horizontal
imbalances are then resolved by payments from regions with higher fiscal
capacity to poorer regions. This is the approach used in Germany.
2. Implement an integrated system of equalization grants: The vertical and
horizontal imbalances are dealt with simultaneously through a system of grants,
including equalization payments and special purpose grants. This is the
Australian and Canadian approach.
3. Correct only the vertical imbalance and ignore horizontal imbalance: As under
the first option, vertical imbalances are resolved by tax sharing and grants, but no
action is taken to correct horizontal imbalances. Capital and labor migration then
responds, not only to earned income differentials, but also to the regional net
fiscal benefits (net benefit received from government expenditure and of taxes
paid). There may be, however, special purpose grants servicing central
government objectives, which may also reduce horizontal imbalances at least in
some functional areas. This is broadly the approach in the United States.

28
There are three key factors in the design of intergovernmental fiscal transfers: the
size of distributable pool, the basis for distributing transfers, and conditionality (Bird,
2000). Determining the distributable pool has an important impact on the stability of the
intergovernmental fiscal relations system. Sharing a fixed percentage of all central taxes
is a better way of establishing transfer system rather than sharing on an ad hoc basis.
Sharing must be based on the basis of a formula. Discretionary or negotiated transfers are
Figure- 12: Composition of Subnational Revenues
and Grants in Europe and Central Asia
0% 20% 40% 60% 80% 100%
Azerbaijan 1999
Belarus 2000
Bulgaria 2000
Croatia 2000
Czech Republic
2000
Estonia 2000
Hungary 2000
Latvia 2000
Lithuania 2000
Poland 2000
Romania 2000
Russian
Federation 2000
Tax Revenue
Transfers from other Levels of Government
Other Revenues
Figure- 13: Composition of Subnational Revenues
and Grants in East Asia and the Pacific
0% 20% 40% 60% 80% 100%
China 1999
Mongolia 2000
Thailand 2000
Tax Revenue
Transfers from Other Levels of Government
Other Revenue
Figure- 14: Composition of Subnational Revenues
and Grants in High-Income OECD Countries
0% 20% 40% 60% 80% 100%
Australia 1999
Austria 1999
Germany 1999
Italy 1999
Norway 1999
Sweden 1999
Canada 2000
Denmark 2000
Switzerland 2000
United States
2000
Tax Revenue
Transfers from other Levels of Government
Other Revenue
Figure- 15: Composition of Subnational Revenues
and Grants in Latin America and the Caribbean
0% 20% 40% 60% 80% 100%
Argentina 2000
Bolivia 2000
Chile 2000
Mexico 2000
Peru 2000
Tax Revenue Transfers from other Levels of Government Other Revenue

29
unstable and unpredictable in nature. The
formula for revenue sharing should take needs
and capacity into consideration. Once the first
two factors have been sorted out, the last
question is whether the transfer should be
made conditional on a measure. Expenditure
conditionality ensures that the transfer amount
is spent on a specified service. On the other
hand, performance conditionality links
transfers to a performance criteria.
Subnational Borrowing/Debt There are three primary reasons why
subnational borrowing can be considered as an
appropriate tool for subnational public
finance:
1. Intergenerational equity: The benefits
of certain investment projects, such as
infrastructure and education, are
spread over time, which means that not only present residents of a locality, but
also future residents will consume the services provided by the projects.
Therefore, the benefit principle of taxation suggests that future residents should
also contribute the cost of investment. For this purpose borrowing is an
appropriate tool that offers a means through which payments for capital projects
can be spread over the life of the project so as to coincide more closely with the
stream of future benefits (Oates, 1972).
2. Economic Development: Delaying infrastructure investments might have a
negative impact on subnational economic performance. Such a negative impact
will have a direct effect on residents’ life in terms of less employment
opportunities and decline of earning levels. Therefore, borrowing is an
appropriate tool for subnational governments in investing infrastructure projects
to stimulate regional economy.
3. Synchronization of Expenditure and Revenue Flows: Access to financial tools
offers an opportunity to subnational governments to synchronize expenditures
incurred and revenue collection. For a variety of reasons expenditure incurred and
tax intake may not be fully synchronized for a particular year. In such a situation,
borrowing provides subnational governments with the chance to smooth out the
mismatch and provide services without disruption.
There are at least two different channels through which subnational governments can
borrow: through a public intermediary such as infrastructure bank or direct borrowing
from private capital markets. The international experience suggests that lending through a
public entity, either central government lending or public financial intermediary, suffers
from political favoritism (World Bank, 1990). Direct access to private markets entails
development of market-based relationship between lenders and subnational governments,
which requires the use of private credit rating and bond insurance agencies to monitor
subnational borrowing. Establishing these institutions offers a potential for improving
transparency and political accountability in local government management. As capital
Figure- 16: Composition of Subnational
Revenues and Grants in Sub Saharan Africa
0% 20% 40% 60% 80% 100%
M aurit ius 1999
Senegal 1999
South Africa
2000
Uganda 2000
Tax Revenue
Transfers from other Levels of Government
Other Revenue

30
markets emerge, residents of local governments would learn more about the financial
health of their governments.
Subnational borrowing is an important component of the devolution of fiscal
powers to local authorities. However, a well-designed regulatory framework for
subnational borrowing is necessary to ensure that subnational borrowing does not provide
perverse incentives to lending institutions and subnational governments for excessive
lending and borrowing. Such a framework includes standardized accounting procedures
for subnational governments, disclosure of subnational governments’ liabilities and
repayment capacity. However, these measures by themselves will not be sufficient to
curb moral hazard problem. The macro concern of moral hazard occurs when subnational
governments are backed by the central government by providing guarantees to their
borrowing. In these circumstances, the incentive structure is set for excessive borrowing
of subnational governments, which would ultimately lead subnational governments to
default on loans.
A common proposal to deal with subnational governments’ default on loans is to
institute limits on the borrowing ability of subnational governments (Ter-Minassian and
Craig, 1997). There are two reasons limiting subnational governments’ borrowing ability
(Bird, 2000). First, if there is no constraint on subnational governments borrowing, the
propensity to behave fiscally irresponsible is very high. In the absence of the checks and
balances of the subnational debt issuance mechanism, subnational governments may
increase their current expenditures well above their capacity to finance them and close
the gap through borrowing, especially in countries where general inability of central
governments to impose hard-budget constraints exist. The second reason for imposing
restrictions on subnational borrowing is macroeconomic stabilization. Since the central
government has the responsibility for stabilization policies, it is important that it has full
control over public debt.
VI. CONCLUDING REMARKS This module has stressed that fiscal decentralization is a multifaceted complex issue. One
of the principal arguments in this module is that specific aspects of the fiscal
decentralization process can be worked out in the context of each individual country.
Legal and constitutional framework, as well as institutional structure of the public
administration system in each country has a bearing on the outcome fiscal
decentralization application. However, the common components of designing a
decentralized system of intergovernmental fiscal relations in all countries are assignment
of responsibilities for governmental functions, assignment of the power among levels of
government to tax people and collect revenues, the nature of intergovernmental transfers
system and ability of subnational governments to borrow.
The failure to design these interrelated components in a consistent way may lead to
undesirable results. However, the issue of designing an effective intergovernmental
structure is not limited to these components. It involves electing local government
officials, having approved budget locally, absence of mandates on local governments as
regards to employment and salaries, keeping adequate books of account and monitoring,
and monitoring progress towards an effective fiscal decentralization. Annex 1 provides a
comparative assessment of the decentralized system in selected countries in East Asia.

31
References:
ACIR. 1974. Governmental Functions and Processes: Local and Areawide. Advisory
Commission on Intergovernmental Relations, A-45, Washington DC.
Ahmad, Ehtisham and Jon Craig. (1997). “Intergovernmental Transfers” in Teresa Ter-
Minassian (ed.) Fiscal Federalism in Theory and Practice (Washington DC: IMF).
Bahl, Roy W. and Shyam Nath. 1986. “Public Expenditure Decentralization in
Developing Economies” Government and Policy 4: 405-18.
Bennett, Robert J., ed. (1990). Decentralization, Local Governments and Markets
(Oxford: Clarendon Press).
Bird, Richard M. (2000). Intergovernmental Fiscal Relations: Universal Principals, Local
Applications" International Studies Program Working Paper 00-2, Andrew Young
School of Policy Studies, Georgia State University, Atlanta.
Bird, Richard M. (1995). Financing Local Services: Patterns, Problems and Possibilities,
Centre for Urban and Community Studies, University of Toronto.
Bird, Richard M. and Vaillancourt, François, eds. (1999) Fiscal Decentralization in
Developing Countries (Cambridge: Cambridge University Press).
Bird, Richard M. and Fiszbein, Ariel, (1999) "Columbia: The Central Role of the Central
Government in Fiscal Decentralization" in Richard M. Bird and François
Vaillancourt (eds.) Fiscal Decentralization in Developing Countries (Cambridge:
Cambridge University Press).
Brennan, G. and J. Buchanan. 1980. The Power to Tax: Analytical Foundations of a
Fiscal Constitution (Cambridge: Cambridge University Press).
Davoodi, Hamid and Heng-fu Zou, 1998. "Fiscal Decentralization and Economic Growth
A Cross-Country Study" Journal of Urban Economics 43: 244-257.
Dillinger, William and Webb, Steven B. (1999). "Fiscal Management in Federal
Democracies: Argentina and Brazil" World Bank Policy Research Working Paper
No. 2121.
Ebel, R. and K. Hotra. (1997). "World Bank Supports Fiscal Decentralization" Transition
8 (5): 11-12.
Ebel, R., Istvan Varfalavi, and Sandor Varga. 2000. "Sorting Out Government Roles and
Responsibilities in the Hungarian Transition" World Bank Institute Working
Paper No. 37156.
Ehdaie, J. (1994). "Fiscal Decentralization and the Size of Government An Extension
with Evidence from Cross-Country Data" World Bank Policy Research Working
Paper No. 1387.
Fiszbein, A. 1997. "Emergence of Local Capacity: Lessons from Columbia" World
Development 25(7): 1029-43.
Ford, J. 1999. "Constitutional, Legal, and Regulatory Framework for Decentralization" in
J. Litvack and J. Seddon (eds.) Decentralization Briefing Notes (Washington, DC:
World Bank Institute).
Fukuyama, F. 1995. Trust: The Social Virtues and the Creation of Prosperity
(Washington, DC: Free Press).

32
Gandhi, V. P. 1995. "Intergovernmental Fiscal Relations and Economic Performance" in
Jayanta Roy (ed.) Macroeconomic Management and Fiscal Decentralization, EDI
Seminar Series, The World Bank.
Grossman, P. J. 1989. "Fiscal Decentralization and Government Size: An Extension."
Public Choice 62: 63-69.
Grossman, P. J. and E. G. West, 1994. "Federalism and the Growth of Government
Revisited." Public Choice 79: 19-32.
Joulfaian, D. and M. Marlow, 1990. "Government Size and Decentralization: Evidence
from Disaggregated Data." Southern Economic Journal 56: 1094- 1102.
Levine, Ross and David Renelt. 1992. “A Sensitivity Analysis of Cross-Country Growth
Regressions” American Economic Review 82 (4): 942-63.
Marlow, M. L. 1988. "Fiscal Decentralization and Government Size." Public Choice 56:
259-269.
Martinez-Vazquez, Jorge and Robert McNab. 1997. “Fiscal Decentralization, Economic
Growth, and Democratic Governance” Georgia State University Andrew Young
School of Policy Studies Working Paper Series No. 97-6.
Musgrave, R. A. 1959. The Theory of Public Finance (New York: McGraw-Hill).
Narayan, Deepa and Lant Pritchett. 1997. "Cents and Sociability: Household Income and
Social Capital in Rural Tanzania" World Bank Policy Research Working Paper
No. 1796.
Nelson, M. A. 1986. "An Empirical Analysis of State and Local Tax Structure in the
Context of the Leviathan Model of Government." Public Choice 49: 283-294.
Oates, Wallace. 1972. Fiscal Federalism (New York: Harcourt, Brace, Jovanovich).
Oates, Wallace. 1985. "Searching for Leviathan: An Emprical Study." American
Economic Review 75: 748-757.
OECD. 1999. "The OECD 1999 Survey on Fiscal Design Across Levels of Government"
Directorate for Financial, Fiscal and Enterprise Affairs, OECD, Paris.
OECD. 2002. “fiscal Design Surveys Across Levels of Government”. Tax Policy Studies
No. 7, OECD, Paris.
Parker, A. N. (1995). "Decentralization: The Way Forward for Rural Development?"
World Bank Policy Research Working Paper No. 1475.
Pommerehne, Werner W. 1977. “Quantitative Aspects of Federalism: A Study of Six
Countries” in W. Oates (ed.) The Political Economy of Fiscal Federalism
(Lexington, Mass.: D.C. Heath).
Putnam, R., R. Leonardi, and R. Nanetti. 1993. Making Democracy Work: Civic
Traditions in Modern Italy (Princeton: Princeton University Press).
Rao, Govinda M. (1999). "India: Intergovernmental Fiscal relations in a Planned
Economy" in Richard M. Bird and François Vaillancourt (eds.) Fiscal
Decentralization in Developing Countries (Cambridge: Cambridge University
Press).
Rondinelli, D. (1999). "What is Decentralization?" in J. Litvack and J. Seddon (eds.)
Decentralization Briefing Notes (Washington, DC: World Bank Institute).
Rondinelli, D. (1981). "Government Decentralization in Comparative Perspective:
Theory and Practice in Developing Countries" International Review of
Administrative Sciences 47: 133-145.

33
Rood, Steven. (2000). "Decentralization, Democracy, and Development," in David G.
Timberman (ed.) The Philippines: New Directions in Domestic Policy and
Foreign Relations (New York: Asia Society).
Smoke, Paul. 1994. Local Government Finance in Developing Countries: The Case of
Kenya (University of Oxford: Oxford).
Spahn, Paul B. 1998. "Intergovernmental Relations, Macroeconomic Stability, and
Economic Growth" Paper presented at the Intergovernmental Fiscal Relations and
Local Financial Management Course of the World Bank Institute, Vienna.
Stigler, G. 1957. "The Tenable Range of Functions of Local Government” in US
Congress Joint Economic Committee. (ed.) Federal Expenditure Policy for
Economic Growth and Stability (Government Printing Office: Washington, DC).
Ter-Minassian, T. and J. Craig. (1997). “Control of Subnational Government Borrowing”
in Teresa Ter-Minassian (ed.) Fiscal Federalism in Theory and Practice
(Washington DC: IMF).
Tiebout, Charles M. 1956. "A Pure Theory of Public Expenditures" Journal of Political
Economy 64: 416-424.
USAID. 1999. “transition Economies and Fiscal Reforms”. Proceedings of the
Conference on Central and Eastern Europe and the New Independent States,
Istanbul. USAID, Washington, DC.
Wildasin, David. Ed. (1997). Fiscal Aspects of Evolving Federations (Cambridge:
Cambridge University Press).
Wildasin, David E. (1998). "Fiscal Aspects of Evolving Federations: Issues for Policy
and Research" World Bank Policy Research Working Paper No. 1884.
World Bank. 1999. World Development Report 1999/2000: Entering the 21st Century.
New York: Oxford University Press.
World Bank. 1995. "Azerbaijan: Baku Water Supply Rehabilitation Project"
Environment Department Paper Series, Assessment Series Paper 17, Washington,
DC.
World Bank. 1990. “Financial Systems and Development” Policy Research Series No.
15, Washington DC.
Xie, Danyang, Heng-fu Zou and Hamid Davoodi. 1999. "Fiscal Decentralization and
Economic Growth in the United States" Journal of Urban Economics 45: 228-39.
Zhang, Tao and Heng-fu Zou. 1998. "Fiscal Decentralization, Public Spending, and
Economic Growth on China" Journal of Public Economics 67:221-40.