The complex relationship between depressive symptoms and functional limitations in...
20
The Complex Relationship Between Depressive Symptoms and Functional Limitations in Community Dwelling Older Adults: The Impact of Subthreshold Depression Celia F. Hybels, PhD, Department of Psychiatry and Behavioral Sciences, Center for the Study of Aging and Human Development, Box 3003, Duke University Medical Center, Phone: (919) 660-7546, FAX: (919) 668-0453, E-mail: [email protected] Carl F. Pieper, DrPH, and Department of Biostatistics and Bioinformatics, Center for the Study of Aging and Human Development, Duke University Medical Center Dan G. Blazer, MD, PhD Department of Psychiatry and Behavioral Sciences, Center for the Study of Aging and Human Development, Duke University Medical Center Abstract Background—Depressive symptoms above screening thresholds have been shown to predict functional decline in older adults. Less is known about the impact of subthreshold depression, and whether more symptoms confer significantly greater risk compared to fewer symptoms. Methods—Using data from the Duke Established Populations for Epidemiologic Studies of the Elderly (EPESE) collected over ten years, we employed repeated measures mixed models to predict functional change by depression status at the prior (index) in-person interview. Depressive symptoms were measured using a modified version of the Center for Epidemiologic Studies-Depression (CES- D). Subthreshold depression was operationalized as 6–8 symptoms and CES-D defined depression as 9–20 symptoms the previous week. Three domains of functional status were assessed at the subsequent inperson interview: limitations in basic activities of daily living (ADLs), instrumental ADLs (IADLs) and mobility. Results—Controlling for race, sex, age, education, marital status, cognitive status, health status, self-perceived health, perceived social support, and functional status at the index interview, having 6+ depressive symptoms predicted an increase of 0.12 IADL limitations 3–4 years later (p=0.03). The incremental effect of CES-D defined depression (9+ symptoms compared to 6–8 symptoms) was not significant, suggesting that the effect of more symptomatic depression did not add to that of subthreshold depression. CES-D score modeled as a continuous variable predicted functional change for all domains, but the relationship was not linear, supporting a possible threshold effect. Conclusions—The relationship between depressive symptoms and functional change is complex, not necessarily linear, and may vary by tasks assessed. Correspondence should be addressed to: Celia F. Hybels, PhD, Duke University Medical Center, Box 3003, Durham, NC 27710. Telephone: (919) 660-7546; FAX: (919) 668-0453. Publisher's Disclaimer: This paper has been accepted for publication in Psychological Medicine and will appear in a revised form, subsequent to editorial input by Cambridge University Press. The copyright holder is Cambridge University Press. Please refer to http://journals.cambridge.org/. NIH Public Access Author Manuscript Psychol Med. Author manuscript; available in PMC 2010 October 1. Published in final edited form as: Psychol Med. 2009 October ; 39(10): 1677–1688. doi:10.1017/S0033291709005650. NIH-PA Author Manuscript NIH-PA Author Manuscript NIH-PA Author Manuscript
-
Upload
dukemedschool -
Category
Documents
-
view
0 -
download
0
Transcript of The complex relationship between depressive symptoms and functional limitations in...

The Complex Relationship Between Depressive Symptoms andFunctional Limitations in Community Dwelling Older Adults: TheImpact of Subthreshold Depression
Celia F. Hybels, PhD,Department of Psychiatry and Behavioral Sciences, Center for the Study of Aging and HumanDevelopment, Box 3003, Duke University Medical Center, Phone: (919) 660-7546, FAX: (919)668-0453, E-mail: [email protected]
Carl F. Pieper, DrPH, andDepartment of Biostatistics and Bioinformatics, Center for the Study of Aging and HumanDevelopment, Duke University Medical Center
Dan G. Blazer, MD, PhDDepartment of Psychiatry and Behavioral Sciences, Center for the Study of Aging and HumanDevelopment, Duke University Medical Center
AbstractBackground—Depressive symptoms above screening thresholds have been shown to predictfunctional decline in older adults. Less is known about the impact of subthreshold depression, andwhether more symptoms confer significantly greater risk compared to fewer symptoms.
Methods—Using data from the Duke Established Populations for Epidemiologic Studies of theElderly (EPESE) collected over ten years, we employed repeated measures mixed models to predictfunctional change by depression status at the prior (index) in-person interview. Depressive symptomswere measured using a modified version of the Center for Epidemiologic Studies-Depression (CES-D). Subthreshold depression was operationalized as 6–8 symptoms and CES-D defined depressionas 9–20 symptoms the previous week. Three domains of functional status were assessed at thesubsequent inperson interview: limitations in basic activities of daily living (ADLs), instrumentalADLs (IADLs) and mobility.
Results—Controlling for race, sex, age, education, marital status, cognitive status, health status,self-perceived health, perceived social support, and functional status at the index interview, having6+ depressive symptoms predicted an increase of 0.12 IADL limitations 3–4 years later (p=0.03).The incremental effect of CES-D defined depression (9+ symptoms compared to 6–8 symptoms)was not significant, suggesting that the effect of more symptomatic depression did not add to that ofsubthreshold depression. CES-D score modeled as a continuous variable predicted functional changefor all domains, but the relationship was not linear, supporting a possible threshold effect.
Conclusions—The relationship between depressive symptoms and functional change is complex,not necessarily linear, and may vary by tasks assessed.
Correspondence should be addressed to: Celia F. Hybels, PhD, Duke University Medical Center, Box 3003, Durham, NC 27710.Telephone: (919) 660-7546; FAX: (919) 668-0453.Publisher's Disclaimer: This paper has been accepted for publication in Psychological Medicine and will appear in a revised form,subsequent to editorial input by Cambridge University Press. The copyright holder is Cambridge University Press. Please refer tohttp://journals.cambridge.org/.
NIH Public AccessAuthor ManuscriptPsychol Med. Author manuscript; available in PMC 2010 October 1.
Published in final edited form as:Psychol Med. 2009 October ; 39(10): 1677–1688. doi:10.1017/S0033291709005650.
NIH
-PA Author Manuscript
NIH
-PA Author Manuscript
NIH
-PA Author Manuscript
KeywordsSubthreshold depression; functional status
IntroductionDepression is a leading cause of disability worldwide (Murray & Lopez, 1996). Among olderadults, the relationship between depression and physical functioning has been documented inboth cross-sectional and longitudinal studies, among patients with major depression and amongadults with depressive symptoms (Lenze et al., 2001). Penninx et al. followed a cohort of 6247community-dwelling adults 65 or older originally free from disability for six years, and foundthose who were depressed at baseline had an increased risk of incident self-reported disabilityin both activities of daily living (ADLs) and mobility, controlling for baseline chronicconditions and sociodemographic factors (Penninx et al., 1999). Depression was defined as ascore of 20 or more on the Center for Epidemiologic Studies Depression Scale (CES-D)(Radloff, 1977) to examine outcomes associated with more severe depression. Depressivesymptoms also predicted physical decline measured through objective tests of physicalperformance (Penninx et al., 1998). In a sample of high-functioning elders free of any disability,high levels of depressive symptoms predicted an increased risk of onset of disability in basicADLs over a 2.5-year interval (Bruce et al., 1994). In this study, depressive symptoms weremeasured on a continuous scale, and an increased risk was associated with increased symptoms.Depression has also been shown to accelerate the disablement process in older adults (van Goolet al., 2005). The Italian Longitudinal Study on Aging recently reported baseline depressivesymptoms were associated with higher rates of reported disability in men and women andperformance based disability in men over 3.5 years (Carbonare et al., 2009). In a systematicreview of variables predicting functional decline in community-dwelling older adults,depression was one of the key risk factors identified (Stuck et al., 1999).
Other studies, however, have found not found an association between depression and function.In a prospective study of low-functioning older adults, depressive symptoms did not predictchange in self-reported basic ADL limitations over two years (Kempen et al., 1999a). In anotherstudy, functionally independent older adults with symptoms more similar to major depressiondid not experience functional decline in basic ADLs over a multi-year follow-up (Kivela &Pahkala, 2001). Depressed mood was not associated with functional decline or improvementin a sample of adults 75 or older when the outcome was a global measure that included basicADLs, instrumental ADLs (IADLs), and mobility items (Hebert et al., 1999). Others havefound a cross-sectional but not longitudinal relationship. For example, Everson-Rose et al.found a cross-sectional relationship between depressive symptoms and physical performance,but depressive symptoms at baseline were not associated with greater functional decline overtime. These investigators modeled four levels of depressive symptoms and, while finding agraded relationship with physical performance, did not observe a threshold effect for depressivesymptoms in relation to change in physical performance (Everson-Rose et al., 2005). In alongitudinal study of the effect of depressive symptoms on the recovery of IADL function aftera fall-related injury, depressive symptoms at baseline were not predictive of recovery/disability(Kempen et al., 2003). Some researchers have suggested depressive symptoms can predictfunctional decline, but most likely through changes in physical health (Geerlings et al., 2001;Ormel et al., 2002). For example, in a study from the Netherlands, depression at the indexmeasurement was associated with functional limitations at the next measurement only in thepresence of chronic physical disease (Geerlings et al., 2001). In another study using structuralequation models, the investigators found a one-year lagged effect of depressive symptoms ondisability, but a stronger effect of disability on depressive symptoms (Ormel et al., 2002).
Hybels et al. Page 2
Psychol Med. Author manuscript; available in PMC 2010 October 1.
NIH
-PA Author Manuscript
NIH
-PA Author Manuscript
NIH
-PA Author Manuscript
In a discussion of this complex relationship between depression and disability, Bruce identifiedsome challenges raised by differing definitions of both constructs (Bruce, 2001). Expandingthe definition of depression has been informative. Gallo et al. reported that older adults whoreported depressive symptoms but no sadness or dysphoria were at increased risk forimpairments in ADLs and IADLs after a 13-year interval compared to those without symptoms(Gallo et al., 1997). Cronin-Stubbs et al. reported the likelihood of becoming disabled over sixyears increased with each additional symptom of depression at baseline, and this associationwas observed for basic ADL tasks, mobility, upper and lower body strength and basic motorfunctions (Cronin-Stubbs et al., 2000). These findings are consistent with others suggesting adose-response relationship. Using a sample of primary care patients, for example, Lyness etal. reported functional outcomes associated with subsyndromal or minor depression were notas poor as for those among patients with major depression but poorer than observed for thosewho were nondepressed (Lyness et al., 2006).
While the term 'depression' is primarily reserved for a clinical diagnosis of depression, therehas been much focus over the past decade on predictors, correlates and outcomes associatedwith depressive symptoms not meeting criteria for major depression or dysthymia. In previouswork, we examined the cross-sectional relationship between subthreshold depression andvariables known to be associated with more symptomatic depression in older adults, andreported that subthreshold depression was significantly associated with impairment in physicalfunctioning. We defined subthreshold depression as clinically significant depressive symptomsbelow the threshold used in depression screening (Hybels et al., 2001). This syndrome has beenvariously called subthreshold, subsyndromal or minor depression (Pincus et al., 1999), and hasbeen defined in a number of ways. Although not categorized by the current nomenclature, thesedepressive symptoms are thought to be of clinical relevance to older adults (Judd & Akiskal,2002), and have also been shown to be related to functional status in primary care patients(Lyness et al., 1999).
Studies examining functional outcomes related to depressive symptoms in community studieshave tended to focus on depressive symptoms as a continuous variable (Bruce et al., 1994;Cronin-Stubbs et al., 2000), at an identified threshold indicating more severe depression(Penninx et al., 1999), or at levels comparable to major depression (Kivela & Pahkala, 2001).Findings differ whether the outcome is incident disability or change in one or more of thedomains among those with or without functional impairment. Although in cross-sectionalstudies both major and minor depression are associated with disability (Beekman et al.,1997), less is known about longitudinal outcomes associated with subthreshold depression incommunity samples of older adults, and particularly whether outcomes differ by the type offunctional limitation.
The purpose of our research was to examine the impact of subthreshold depression on changein functional status in a sample of community-dwelling older adults followed for ten years.Using a cutpoint for subthreshold depression established in our prior work, we hypothesizedsubthreshold depression would be a predictor of decline in three domains of function: basicADLs, IADLs and mobility. We employed an innovative approach to examine the impact ofsubthreshold depression. Specifically, our aim was to determine the importance of subthresholddepression by exploring the incremental effect of more symptomatic depression over the effectsof lower levels of depressive symptomatology predicting functional change.
Given the complexity of the relationship between depressive symptoms and functional status,we had as a second objective to model the functional form of the relationship betweendepressive symptoms and functional change across the three outcomes. Specifically, assummarized above, the literature suggests as depressive symptoms increase, the likelihood offunctional limitations increases in a linear manner. Our previous work in the area of
Hybels et al. Page 3
Psychol Med. Author manuscript; available in PMC 2010 October 1.
NIH
-PA Author Manuscript
NIH
-PA Author Manuscript
NIH
-PA Author Manuscript
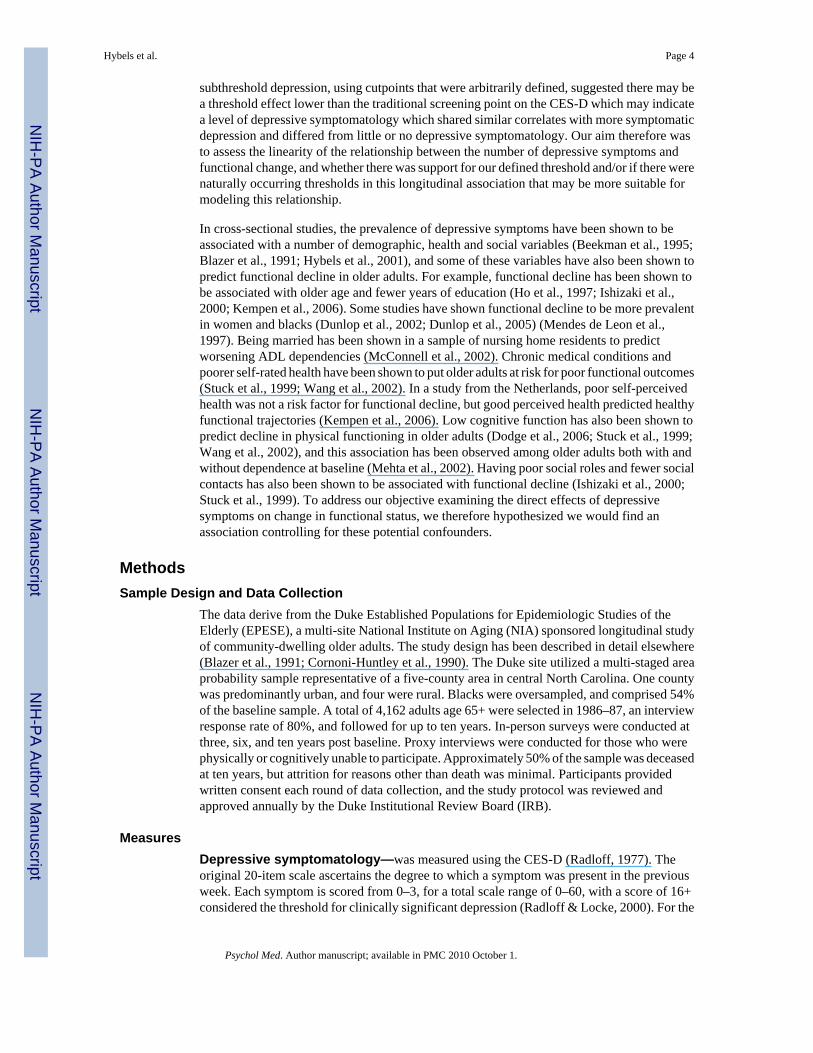
subthreshold depression, using cutpoints that were arbitrarily defined, suggested there may bea threshold effect lower than the traditional screening point on the CES-D which may indicatea level of depressive symptomatology which shared similar correlates with more symptomaticdepression and differed from little or no depressive symptomatology. Our aim therefore wasto assess the linearity of the relationship between the number of depressive symptoms andfunctional change, and whether there was support for our defined threshold and/or if there werenaturally occurring thresholds in this longitudinal association that may be more suitable formodeling this relationship.
In cross-sectional studies, the prevalence of depressive symptoms have been shown to beassociated with a number of demographic, health and social variables (Beekman et al., 1995;Blazer et al., 1991; Hybels et al., 2001), and some of these variables have also been shown topredict functional decline in older adults. For example, functional decline has been shown tobe associated with older age and fewer years of education (Ho et al., 1997; Ishizaki et al.,2000; Kempen et al., 2006). Some studies have shown functional decline to be more prevalentin women and blacks (Dunlop et al., 2002; Dunlop et al., 2005) (Mendes de Leon et al.,1997). Being married has been shown in a sample of nursing home residents to predictworsening ADL dependencies (McConnell et al., 2002). Chronic medical conditions andpoorer self-rated health have been shown to put older adults at risk for poor functional outcomes(Stuck et al., 1999; Wang et al., 2002). In a study from the Netherlands, poor self-perceivedhealth was not a risk factor for functional decline, but good perceived health predicted healthyfunctional trajectories (Kempen et al., 2006). Low cognitive function has also been shown topredict decline in physical functioning in older adults (Dodge et al., 2006; Stuck et al., 1999;Wang et al., 2002), and this association has been observed among older adults both with andwithout dependence at baseline (Mehta et al., 2002). Having poor social roles and fewer socialcontacts has also been shown to be associated with functional decline (Ishizaki et al., 2000;Stuck et al., 1999). To address our objective examining the direct effects of depressivesymptoms on change in functional status, we therefore hypothesized we would find anassociation controlling for these potential confounders.
MethodsSample Design and Data Collection
The data derive from the Duke Established Populations for Epidemiologic Studies of theElderly (EPESE), a multi-site National Institute on Aging (NIA) sponsored longitudinal studyof community-dwelling older adults. The study design has been described in detail elsewhere(Blazer et al., 1991; Cornoni-Huntley et al., 1990). The Duke site utilized a multi-staged areaprobability sample representative of a five-county area in central North Carolina. One countywas predominantly urban, and four were rural. Blacks were oversampled, and comprised 54%of the baseline sample. A total of 4,162 adults age 65+ were selected in 1986–87, an interviewresponse rate of 80%, and followed for up to ten years. In-person surveys were conducted atthree, six, and ten years post baseline. Proxy interviews were conducted for those who werephysically or cognitively unable to participate. Approximately 50% of the sample was deceasedat ten years, but attrition for reasons other than death was minimal. Participants providedwritten consent each round of data collection, and the study protocol was reviewed andapproved annually by the Duke Institutional Review Board (IRB).
MeasuresDepressive symptomatology—was measured using the CES-D (Radloff, 1977). Theoriginal 20-item scale ascertains the degree to which a symptom was present in the previousweek. Each symptom is scored from 0–3, for a total scale range of 0–60, with a score of 16+considered the threshold for clinically significant depression (Radloff & Locke, 2000). For the
Hybels et al. Page 4
Psychol Med. Author manuscript; available in PMC 2010 October 1.
NIH
-PA Author Manuscript
NIH
-PA Author Manuscript
NIH
-PA Author Manuscript

Duke EPESE, we used a modified version that coded whether each symptom was present theprevious week (Y/N), with a possible range of scores 0–20. Our modified scale showed goodinternal consistency in our baseline data (Cronbach’s coefficient alpha=0.82). To model thefunctional form of depressive symptoms as they impact functional change, we used the totalscore from the modified CES-D as a continuous variable. To assess subthreshold depressionwe created three levels of depressive symptoms (0–5, 6–8, and 9+ symptoms). We previouslyreported a score of 9+ on our modified scale corresponded to a score of 16+ on the originalscale (Blazer et al., 1991), and in earlier work defined subthreshold depression as a score of6–8 on the modified scale (Hybels et al., 2001). For the analyses presented in this current paper,we conducted a sensitivity analysis using data from the Yale EPESE (Cornoni-Huntley et al.,1986), where the CES-D was used in its traditional format, to identify a corresponding cutpointon the full scale that corresponded to our coding of subthreshold depression. Within the Yaledata, we recoded the Yale responses to Yes/No, and confirmed a code of 9 on the modifiedscale was comparable to a score of 16 on the traditional scale (sensitivity=92%,specificity=93%, c-index=0.98). Our cutpoint of 6 best corresponded to a score of 8 on thetraditional scale (sensitivity=94%, specificity=92%, c-index=0.98). Our definition ofsubthreshold depression, therefore, corresponds to a score of 8–15 on the traditional CES-Dscale.
Sociodemographic variables—included age as a continuous variable, race, years ofeducation as a continuous variable, marital status (1=not married, 0=married), and sex(1=female, 0=male). We classified sample members as African American (coded 0) or White/Other (coded 1), with less than 1% of our sample classified as Other.
Physical functioning—was measured using three scales. Basic ADL tasks were measuredas needing help with five items identified by Katz et al. (Katz et al., 1970): bathing, dressing,eating, getting from the bed to a chair, and toileting (scale range 0–5). IADL tasks weremeasured using five items from the OARS survey (Duke University Center for the Study ofAging and Human Development, 1978): driving car/travel alone, shopping for groceries/clothes alone, preparing own meals, doing own housework and handling own money (scalerange 0–5). Mobility was measured using three of the six items used by Rosow and Breslau(Rosow & Breslau, 1966): doing heavy work, ability to walk up and down stairs, and abilityto walk ½ mile (scale range 0–3). Missing items within a scale did not contribute toward thecount of limitations. Overall, the mean number of limitations at baseline was somewhat low -76% of the participants did not have any IADL limitations, 92% did not have any ADLlimitations, and 57% did not have any mobility limitations. For the regression models, thenumber of limitations was used as a continuous variable, with higher values corresponding tomore limitations.
Cognitive functioning—was measured using the Short Portable Mental StatusQuestionnaire (SPMSQ) (Pfeiffer, 1975). For our analyses, we used a continuous variableindicating the number of errors, with a possible range of 0 to 10.
Health status—was measured using a summary measure of chronic disease that recordedthe number and impact of conditions present (heart problems, hypertension, diabetes, stroke,and cancer) (Fillenbaum et al., 1998). We used the health index score as a continuous variablewith a possible range of 0 (no health conditions) to 189 (multiple conditions with high impact).We also included a measure of self-rated health modeled as an ordinal variable with excellent(coded 1) to poor (coded 4).
Perceived social support—was measured by asking sample members how much they feltthey could count on or talk about their deepest problems with family members and friends. The
Hybels et al. Page 5
Psychol Med. Author manuscript; available in PMC 2010 October 1.
NIH
-PA Author Manuscript
NIH
-PA Author Manuscript
NIH
-PA Author Manuscript

range of responses was 2 to 6, with higher levels indicating stronger perceived support (Hybelset al., 2001).
Data AnalysisWe first ran a repeated measures mixed model using depression score at the index wave as apredictor of functional change 3–4 years later. CES-D score was modeled as a continuousvariable and each of the three outcomes was modeled separately. Functional status at the indexinterview for the appropriate measure was entered for each interval (e.g., baseline mobilitystatus was included in the interval predicting three-year mobility status), resulting inresidualized change models. Some participants improved in function over the interval, othersdeclined in function, while the majority stayed primarily at the same level of function. Weplotted the residuals for the three mixed models, and the residuals appeared to follow a normaldistribution. We evaluated three possible error structures to adjust for the correlated measuresover time, and based on Bayesian Information Criteria (BIC) fit statistics, an unstructuredcovariance structure provided the best fit to these data.
Three intervals 3–4 years apart were incorporated into each model: baseline depressivesymptoms predicting function at the three year follow-up, three-year status predicting functionat the six year follow-up, and six-year status predicting function at the 10 year follow-up.Marital status, cognitive status, chronic health conditions, self-perceived health, and perceivedsocial support were entered as time varying covariates; that is, their status at the index interviewwas entered for each interval. To contribute data for a particular interval, sample members hadto have complete depression data at the index interview and complete function data at the indexand subsequent interview. Depression data were not collected from proxy respondents, butproxy information for functional status was accepted.
We modeled the functional form of the relationship between CES-D score and functionalchange in ADLs, IADLs, and mobility in several ways: 1) We checked for any naturallyoccurring thresholds or inflection points in the CES-D score. Specifically, using PROCMIXED, we output the residuals from a model which included all the covariates but not theCES-D score for each of the three outcomes. To examine the impact of CES-D score on theerror, we applied a smoothing algorithm using PROC LOESS; 2) We checked for the presenceand location of steps or thresholds using a mixed model that included the CES-D score as acontinuous variable and all possible cutpoints (e.g., score of 1 or less vs. 2 or more, 2 or lessvs. 3 or more, etc.) to identify any statistically significant thresholds above and beyond thelinear score for each outcome, removing nonsignificant CES-D terms through backwardelimination; 3) We assessed the impact of spline effects at the two cutpoints we defined in ourprevious work (6 and 9); and 4) We assessed the impact of higher order polynomials of theCES-D score on functional change.
To address our key research question, the impact of subthreshold depression on functionalchange, we used the CES-D thresholds defined as we had done in previous work. We wereinterested in this analysis in examining the importance of subthreshold depression (a score of6–8) by measuring the incremental effect of more symptomatic or CES-D defined depression(a score of 9 or more). Specifically, we were interested in comparing functional outcomes inthose with either subthreshold or CES-D defined depression compared to those who werenondepressed, and comparing outcomes among those with more symptomatic or CES-Ddefined depression to those with subthreshold depression. This type of analysis is slightlydifferent to what is often seen, and can be further explained as follows.
In a traditional model, we would look at the effect of both groups by creating two dummyvariables:
Hybels et al. Page 6
Psychol Med. Author manuscript; available in PMC 2010 October 1.
NIH
-PA Author Manuscript
NIH
-PA Author Manuscript
NIH
-PA Author Manuscript

Dummy 1 - coded 1 if the score was 6–8 and 0 if the score was <6 or 9+
Dummy 2 - coded 1 if the score was 9+ and 0 if the score was <6 or 6–8
By including both dummy variables in the model, the estimated effects for both groups wouldbe compared to those who were nondepressed (score <6 - the lowest group).
In this regression analysis, we are modeling the incremental effect of more symptomaticdepression, similar to the effect modeled using ordinal variables. Here, each effect is theincremental effect relative to the next lower group. We created two dummy variables:
Dummy 1 – coded 1 if the score is 6+ and 0 if the score is <6.
Dummy 2 – coded 1 if the score is 9+ and 0 if the score is <9
By including both these dummy variables in the regression model, the group with scores 6+would be compared to the nondepressed, and the group with scores 9+ would be compared tothe next lower group (those with scores 6–8).
There were at total of 4162 participants at baseline and 618 died during the first interval. Atotal of 3052 had complete depression and function data for the first interval. There were 3337participants at the second in-person survey three years after baseline, and a total of 663 diedduring the second interval. A total of 2209 had complete depression and function data for thesecond interval. There were 2569 participants in the third in-person survey six years afterbaseline, and a total of 867 died during the third interval. A total of 1408 had complete datafor the third interval. Among the participants, 1% or less were missing data for marital status,cognitive status, health status, self-perceived health, or perceived social support. A total of 237(3.6%) observations were dropped from the analysis because of missing data on one or moreof these variables, resulting in an analysis sample of 6432 observations (1–3 per participant)for the mixed models.
All analyses were run using SAS software (SAS Institute, 2004). Significance thresholds wereset at p<.05, and all tests were two-tailed. We did not adjust for the unequal probabilities ofselection in the sample design, but variables used in the stratification process were included inthe regression models (Korn & Graubard, 1991).
ResultsTable 1 shows the characteristics of the sample members who participated in the first two in-person interviews. While the mean depression score was quite low, a total of 19.9% of thesample had a number of depressive symptoms - 11.1% of the sample had subthresholddepression (a score of 6–8), while 8.8% had a CES-D score of 9 or greater. These prevalenceestimates are slightly different from those reported earlier from the baseline sample alone(Hybels et al., 2001). Limitations in mobility and IADLs were more common than limitationsin basic ADL function.
Prior to running the mixed models, we checked for collinearity among the predictors includingdepression. The variable with the lowest tolerance in each of the three models was maritalstatus (.74), suggesting there was not extreme correlation among the variables that could impactthe results.
The results of our models assessing the functional form of the relationship between depressivesymptoms and functional change were inconclusive. In our first assessment, there were novisibly apparent thresholds identified through the smoothing algorithm for any of the threeoutcomes. In our second assessment examining all possible cutpoints, we found differencesacross the three outcomes. For the IADL model, significant thresholds remaining in the model
Hybels et al. Page 7
Psychol Med. Author manuscript; available in PMC 2010 October 1.
NIH
-PA Author Manuscript
NIH
-PA Author Manuscript
NIH
-PA Author Manuscript
were at CES-D scores 1, 4 and 8. For ADL, the only significant threshold was 15, and formobility, the only significant threshold was a score of 1 or more vs. 0. These results suggestthat some score or scores less than our cutpoint of 9 may be a significant threshold fordepressive symptoms as they predict change in IADL function. The cutpoints of 1 and 15 forchange in mobility and ADL were less meaningful in defining a threshold for subthresholddepression. In our third assessment, the two spline effects at the cutpoints defined in ourprevious work were not significant for any of the three outcomes. Finally, for each of the threemodels where we assessed the impact of linear and higher order polynomials of CES-D scoreon the outcomes, the squared term was significant (the cubic term was not and was subsequentlyremoved). These results of these models are provided in Table 2. We plotted the quadraticterms and found for each of the three outcomes, an increase in CES-D score was associatedwith an increase in limitations until a score of around 8–10 and then an increase in CES-Dscore was associated with a decrease in limitations, suggesting a possible threshold effect.
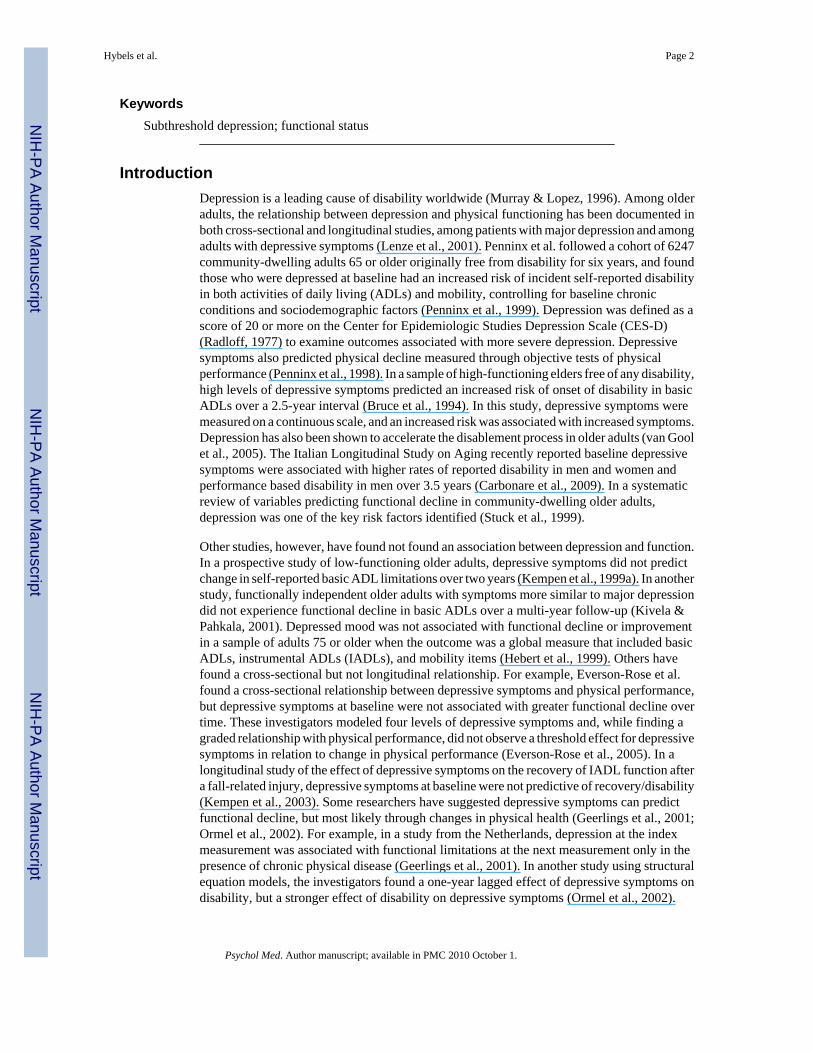
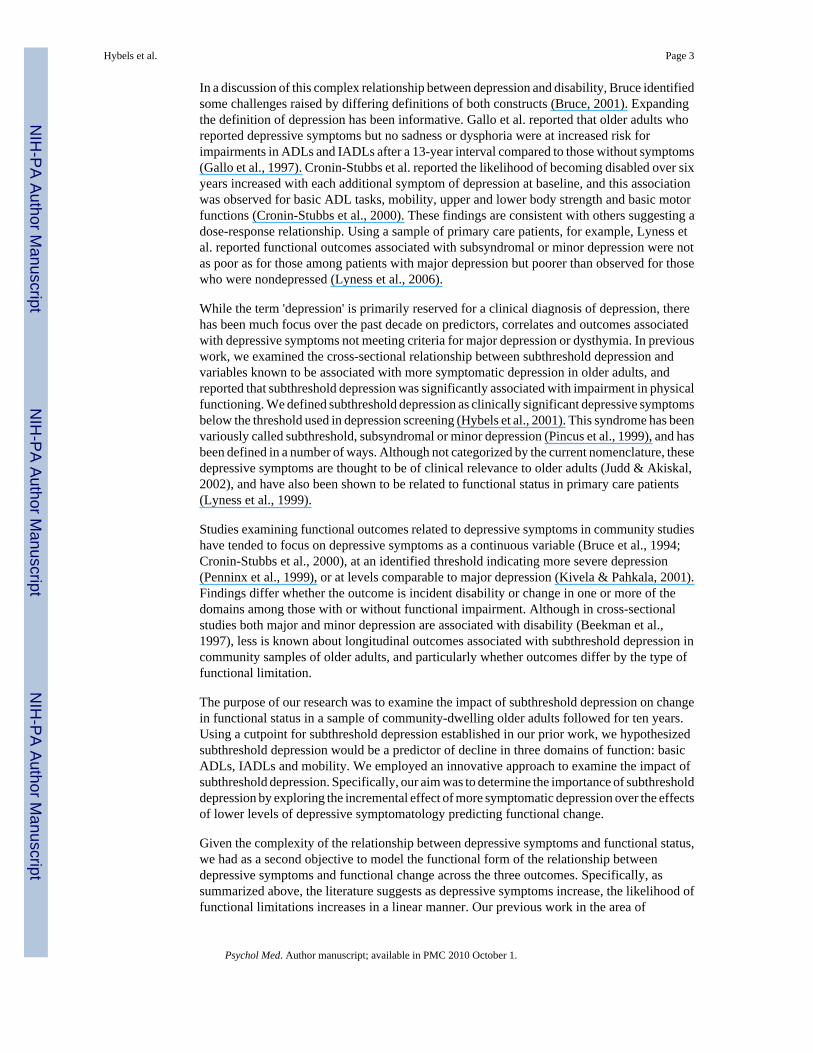
In the absence of consistently defined thresholds, we turned to our main objective of examiningthe impact of subthreshold depression on functional change using the cutpoints defined in ourearlier research. In Figure 1, we show the uncontrolled mean scores for IADL, ADL andmobility limitations by depression status (scores <6, scores 6–8, and scores 9+) at the previousin-person interview. It is important to note those who were nondepressed at baseline may ormay not be part of the group that was nondepressed at three years predicting six-year outcome.While there appears to be an expected overall increase in limitations over time, the figuressuggest there is no differential effect of depressive symptoms over time. The effect of 6–8symptoms appears to be similar to the effect of 9 or more symptoms.
In Table 3, we present the results of the three mixed models measuring the effect of subthresholddepression and the incremental effect of CES-D defined depression. We show bothuncontrolled models (with only the two depression variables, functional status at the indexwave, and time as predictors) and models examining the effect of depressive symptomscontrolling for other identified potential confounders as well. In uncontrolled analyses, a scoreof 6+ on the modified CES-D was a significant predictor of IADL, ADL, and mobilitylimitations 3–4 years later, while the incremental effect of CES-D defined depression was notsignificant. The parameter estimates changed when potential confounders were included in themodels. In controlled analyses, having six or more depressive symptoms predicted an increaseof 0.12 IADL limitations at the subsequent interview (p=0.0298). A score of 6 or greater wasnot a significant predictor of change in mobility or ADL function. The incremental effect ofmore symptomatic depression (a score of 9 or greater) compared to a score of 6–8 symptomswas not significant for any of the three outcomes when potential confounders were controlled.
For each of the three models, we also included two interaction terms, each of the two depressionterms *year, to see if the effect was consistent over time. The interaction terms were notsignificant in any of the three models, and were subsequently removed.
DiscussionWe present new findings in this work. First, we conclude the effect of depression on declinein IADL abilities occurs at low levels of depressive symptomatology, and that more symptomsmay not confer significantly greater risk of decline. Second, we conclude the relationshipbetween depressive symptoms and functional change is complex, may differ by domain offunction assessed, and may not necessarily be linear. That is, as the number of depressivesymptoms increases, the degree of functional decline may not correspondingly increase.
Using the cutpoints we identified in previous research, older adults with six or more depressivesymptoms had an increased risk of IADL limitations 3–4 years later, controlling for functional
Hybels et al. Page 8
Psychol Med. Author manuscript; available in PMC 2010 October 1.
NIH
-PA Author Manuscript
NIH
-PA Author Manuscript
NIH
-PA Author Manuscript
status at the index wave and the effects of other known predictors of change in functional status.Our key finding was that the incremental effect of more symptomatic depression was notsignificant in this model, suggesting the effect of more symptomatic depression did not add tothat of subthreshold depression. Our findings were consistent with those of other investigatorswho reported depressive symptoms not meeting criteria for major depression predictedfunctional decline in older adults (Gallo et al., 1997; Penninx et al., 1999), and support thoseof Cronin-Stubbs et al. that mild depressive symptoms can increase the likelihood of becomingdisabled (Cronin-Stubbs et al., 2000).
To the best of our knowledge, the incremental effect of more symptomatic depression comparedto fewer symptoms has not been previously examined in community populations. We wereable to show in these results that the effect of depressive symptoms predicting decline in IADLcan be seen at symptom levels far below those captured by traditional threshold scores on theCES-D. These findings are intriguing, and add to a growing body of evidence supporting theimportance of subthreshold depression in older adults.
There has been a considerable amount of research looking at depressive symptoms on acontinuous scale or above a designated screening threshold predicting functional decline, butwe were interested in looking at the risk of functional decline below a particular threshold.Cutpoints can be informative to both clinicians and researchers. These cutpoints are oftenchosen theoretically (e.g., systolic blood pressure >160) and then tested empirically to see ifthey have clinical meaning. Our intent was to choose a cutpoint below the usual screeningthreshold and explore outcomes associated with this level of symptomatology to see if thisparticular threshold had a meaningful clinical outcome. Specific guidelines are also oftenimportant for clinical interventions and prevention. Clinicians should be observant forfunctional decline even when depressive symptoms don't meet the severity of DSM-IV criteriaor even screening thresholds.
We believe this is the first study to explore the functional form of depressive symptoms as theyrelate to functional change in older adults. We modeled the functional form of the modifiedversion of the CES-D, and were unable to identify naturally occurring inflection points in thecurves or provide quantitative support for the cutpoints we had previously used. We conductedseveral analyses to identify thresholds in the continuous scale, but the findings wereinconsistent and varied somewhat across the three outcomes. The cutpoint of 6+ symptomstherefore was selected more on theoretical than statistical grounds. Our finding that depressivesymptoms and functional change were not linearly related is particularly interesting, andsuggests a greater number of symptoms is not necessarily associated with a significantly greaterrisk of decline. Both the quadratic model and the cutpoint model supported a nonlinearrelationship.
Our findings also suggest the relationship between depressive symptoms and functional statusmay differ by domains of function assessed. The analyses exploring optimal or naturallyoccurring thresholds indicated a possible step for changes in IADL function that would beconsistent with our categorization of subthreshold depression. Similarly, using our previouslyestablished thresholds, we found a significant effect of subthreshold depression for IADLchange but not change in mobility or basic ADLs. IADL tasks may have a stronger cognitivecomponent than basic ADLs or mobility, and this component may play a role in this association.Research by other investigators has shown through structural equation modeling in fact thatdepressive symptoms may affect IADL abilities through cognition (Gallo et al., 2003). We alsofound some similarities. In our repeated measures mixed models, we report a similar nonlineareffect for each of the three outcomes, with an increased risk of decline with fewer symptomsbut then a similar or decreased risk with more symptoms.
Hybels et al. Page 9
Psychol Med. Author manuscript; available in PMC 2010 October 1.
NIH
-PA Author Manuscript
NIH
-PA Author Manuscript
NIH
-PA Author Manuscript

Subthreshold depression may be a prodrome to a more serious form of depression or beindicative of a chronic condition which could eventually lead to functional change.Subthreshold depression may reflect an overall awareness that one’s health is not optimal. Ourfindings suggest that more symptomatic levels of depressive symptoms may indeed confergreater risk for future impairment, but that the incremental difference above the risk conferredby subthreshold depression is not significant. These findings build on our earlier work thatlevels below the threshold typically used to screen for depression can be informative.
Our study has several limitations. Previous research has suggested the validity of the CES-Din older adults is not affected by physical disabilities (Berkman et al., 1986), and others havereported depressive symptoms were not associated with poorer self-report of functional status(Sinclair et al., 2001), but we cannot rule out this potential bias. That is, because depressivesymptoms and functional status were simultaneously assessed at each of the index waves, thereis a potential validity issue. Persons with depressive symptoms may be more likely tomisrepresent self-reported functional status. We have relied on self-reported data to measureboth depressive symptoms and functional status as is frequently done in community basedepidemiologic surveys. Depression data was not available for those who participated by proxy,so a number of older adults in poorer health or with cognitive impairment may have beenexcluded from the analysis. If participants with cognitive impairment also had more depressivesymptoms, we may have underestimated the true effect of depressive symptoms on functionalchange. If depressive symptoms predict mortality, then persons with depressive symptoms mayhave been less likely to participate in future waves. The Duke EPESE also did not capture dataon psychiatric comorbidity which could contribute to the association between depressivesymptoms and functional change. Similarly, we did not control for psychological attributessuch as mastery which have been shown to be protective in older adults (Kempen et al.,1999b), and may interact with depressive symptoms.
We used a modified version of the CES-D, but conducted a sensitivity analysis comparing thisversion to the traditional version used in the Yale EPESE. Other investigators have successfullyused modified versions of this instrument to address this association (Penninx et al., 1998).For each interval, we assessed physical function in three areas at only one time point 3–4 yearsafter the index interview, but research has shown transitions from independence to disabilityas well as disability to independent mobility are dynamic (Gill et al., 2006). We used a measureof depressive symptoms at the index wave to predict change in functional status. By onlyinquiring about depressive symptoms in the previous week using intervals three to four yearsapart, we were unable to capture changes in depressive symptoms that occurred at other times.We also looked at functional change three to four years after the measure of depressivesymptoms, but we are aware depressive symptoms may have their effect on functional statuswithin a shorter interval.
To explore depressive symptoms as a predictor of functional status 3–4 years later, we used aresidualized change model that looked at change in functional status from the index interview.Our sample at baseline and the other index waves included persons who already had one ormore limitations, so we cannot separate incident and prevalent disability, only change infunctional status. While these persons with limitations could improve in function, there werea number of participants who already had the maximum number of limitations. Across the threeindex waves, the proportion of participants who were not at risk for decline was 2.4% for IADLlimitations, <1% for basic ADL limitations, and 12.8% for limitations in mobility. We cannotrule out the possibility of a Type I error in that we looked at three outcomes. In future work,we plan to explore the longitudinal relationship between these measures of depression and thethree functional outcomes in a multivariate model that would allow us to control for Type Ierror and adjust for the correlations among the three outcomes in one model.
Hybels et al. Page 10
Psychol Med. Author manuscript; available in PMC 2010 October 1.
NIH
-PA Author Manuscript
NIH
-PA Author Manuscript
NIH
-PA Author Manuscript

It is not known if interventions could reduce future functional disability. Meaningful reductionsin depressive symptoms that may help reduce future disability are difficult to measure whenso few symptoms are present at the index wave. Other investigators may wish to address theeffectiveness of interventions in community-dwelling older adults.
Strengths of the study include a large representative sample of community-dwelling olderadults followed for ten years. We had a low attrition rate for reasons other than death. Byincluding functional status and associates covariates at the time of the index interview to predictfunctional status 3–4 years later, we were able to establish change in function from one pointin time to 3–4 years later and therefore temporal ordering. This design is advantageous overstudies examining changes in depressive symptoms as predictors of functional change duringthe same time period (Lenze et al., 2005; Penninx et al., 2000), which address the challengesof this dynamic relationship but make it somewhat difficult to establish an antecedent-consequent relationship. Also, by exploring three different measures of physical functionseparately, we allowed depressive symptoms to have differential relationships with eachcomponent of function, since previous research has suggested use of an aggregate measuremay be misleading (Landerman & Fillenbaum, 1997).
In summary, these findings address an important problem regarding geriatric mental healthand functional outcomes, as the prevalence of subthreshold depression in both community andclinical samples is high (Blazer, 2003).
AcknowledgementsThe preparation of this manuscript was supported by NIMH grant K01 MH066380 and the Claude D. Pepper OlderAmericans Independence Center P30 AG028716. The data were gathered under NIA contract number N01 AG12102and grant R01 AG12765. The content of this publication does not necessarily reflect the views or policies of the USDepartment of Health and Human Services. Preliminary results were presented in a poster session at the 132nd AnnualMeeting of the American Public Health Association in Washington, DC in November 2004. The authors report nocompeting interests. Finally, we acknowledge the helpful comments provided by the three anonymous reviewers.
ReferencesBeekman ATF, Deeg DJH, Braam AW, Smit JH, van Tilberg W. Consequences of major and minor
depression in later life:A study of disability, well-being, and service utilization. PsychologicalMedicine 1997;27:1397–1409. [PubMed: 9403911]
Beekman ATF, Deeg DJH, van Tilberg T, Smit JH, Hooijer C, van Tilberg W. Major and minor depressionin later life: a study of prevalence and risk factors. Journal of Affective Disorders 1995;36:65–75.[PubMed: 8988267]
Berkman LF, Berkman CS, Kasl S, Freeman DH, Leo L, Ostfeld AM, Cornoni-Huntley J, Brody JA.Depressive symptoms in relation to physical health and functioning in the elderly. American Journalof Epidemiology 1986;124:372–288. [PubMed: 3740038]
Blazer D, Burchett B, Service C, George LK. The association of age and depression among the elderly:An epidemiologic exploration. Journal of Gerontology A: Biological Sciences and Medical Sciences1991;46(6):M210–M215.
Blazer DG. Depression in late life: Review and commentary. Journal of Gerontology A: BiologicalSciences and Medical Sciences 2003;58A:249–265.
Bruce ML. Depression and disability in late life: Directions for future research. American Journal ofGeriatric Psychiatry 2001;9(2):102–112. [PubMed: 11316615]
Bruce ML, Seeman TE, Merrill SS, Blazer DG. The impact of depressive symptomatology on physicaldisability: MacArthur Studies of Successful Aging. American Journal of Public Health 1994;84:1796–1799. [PubMed: 7977920]
Carbonare LD, Maggi S, Noale M, Giannini S, Rozzini R, Cascio VL, Crepaldi G. for the ILSA WorkingGroup. Physical disability and depressive symptomatology in an elderly population: A complex
Hybels et al. Page 11
Psychol Med. Author manuscript; available in PMC 2010 October 1.
NIH
-PA Author Manuscript
NIH
-PA Author Manuscript
NIH
-PA Author Manuscript

relationship - The Italian Longitudinal Study on Aging (ILSA). American Journal of GeriatricPsychiatry 2009;17:144–154. [PubMed: 19172682]
Cornoni-Huntley, J.; Blazer, DG.; Lafferty, ME.; Everett, DF.; Brock, DB.; Farmer, ME. EstablishedPopulations for Epidemiologic Studies of the Elderly: Resource Data Book. Vol. Volume II.Washington, D.C.: National Institutes of Health; 1990. p. 90-495.NIH Publication No.
Cornoni-Huntley, J.; Brock, D.; Ostfeld, A.; Taylor, JO.; Wallace, RB. Established Populations forEpidemiologic Studies of the Elderly: Resource Data Book. Bethesda, MD: National Institutes ofHealth; 1986. p. 86-2443.NIH Publication No.
Cronin-Stubbs D, Mendes de Leon CF, Beckett LA, Field TS, Glynn RJ, Evans DA. Six-year effect ofdepressive symptoms on the course of physical disability in community-living older adults. Archivesof Internal Medicine 2000;160:3074–3080. [PubMed: 11074736]
Dodge HH, Du Y, Saxton JA, Ganguli M. Cognitive domains and trajectories of functional independencein nondemented elderly persons. Journal of Gerontology: Medical Sciences 2006;61A:1330–1337.
Duke University Center for the Study of Aging and Human Development. Multidimensional FunctionalAssessment: The OARS Methodology. Vol. 2nd Edition. Durham, NC: Duke University; 1978.
Dunlop DD, Manheim LM, Sohn M, Liu X, Chang RW. Incidence of functional limitation in older adults:The impact of gender, race, and chronic conditions. Archives of Physical Medicine and Rehabilitation2002;83:964–971. [PubMed: 12098157]
Dunlop DD, Semanik P, Song J, Manheim LM, Shih V, Chang RW. Risk factors for functional declinein older adults with arthritis. Arthritis and Rheumatism 2005;52:1274–1282. [PubMed: 15818691]
Everson-Rose SA, Skarupski KA, Bienias JL, Wilson RS, Evans DA, Mendes de Leon CF. Do depressivesymptoms predict declines in physical performance in an elderly, biracial population? PsychosomaticMedicine 2005;67:609–615. [PubMed: 16046375]
Fillenbaum GG, Leiss JK, Pieper CF, Cohen HJ. Developing a summary measure of medical status. AgingClinical and Experimental Research 1998;10:395–400.
Gallo JJ, Rabins PV, Lyketsos CG, Tien AY, Anthony JC. Depression without sadness: Functionaloutcomes of nondysphoric depression in later life. Journal of the American Geriatrics Society1997;45:570–578. [PubMed: 9158577]
Gallo JJ, Rebok GW, Tennsted S, Wadley VG, Horgas A. The Advanced Cognitive Training forIndependent and Vital Elderly (ACTIVE) Study Investigators. Linking depressive symptoms andfunctional disability in late life. Aging and Mental Health 2003;7:469–480. [PubMed: 14578009]
Geerlings SW, Beekman ATF, Deeg DJH, Twisk JWR, Van Tilberg W. The longitudinal effect ofdepression on functional limitations and disability in older adults: an eight-wave prospectivecommunity-based study. Psychological Medicine 2001;31:1361–1371. [PubMed: 11722151]
Gill TM, Allore HG, Hardy SE, Guo Z. The dynamic nature of mobility disability in older persons. Journalof the American Geriatrics Society 2006;54:248–254. [PubMed: 16460375]
Hebert R, Brayne C, Spiegelhalter D. Factors associated with functional decline and improvement in avery elderly community-dwelling population. American Journal of Epidemiology 1999;150(5):501–510. [PubMed: 10472950]
Ho SC, Woo J, Yuen YK, Sham A, Chan SG. Predictors of mobility decline: the Hong Kong old-oldstudy. Journal of Gerontology: Medical Sciences 1997;52A:M356–M362.
Hybels CF, Blazer DG, Pieper CF. Toward a threshold for subthreshold depression: An analysis ofcorrelates of depression by severity of symptoms using data from an elderly community sample. TheGerontologist 2001;41:357–365. [PubMed: 11405433]
Ishizaki T, Watanabe S, Suzuki T, Shibata H, Haga H. Predictors for functional decline amongnondisabled older Japanese living in a community during a 3-year follow-up. Journal of the AmericanGeriatrics Society 2000;48:1424–1429. [PubMed: 11083318]
Judd LL, Akiskal HS. The clinical and public health relevance of current research on subthresholddepressive symptoms in elderly patients. American Journal of Geriatric Psychiatry 2002;10:233–238. [PubMed: 11994210]
Katz S, Downs TD, Cash HR, Grotz RC. Progress in development of the index of ADL. The Gerontologist1970;10:20–30. [PubMed: 5420677]
Hybels et al. Page 12
Psychol Med. Author manuscript; available in PMC 2010 October 1.
NIH
-PA Author Manuscript
NIH
-PA Author Manuscript
NIH
-PA Author Manuscript

Kempen GIJM, Ranchor AV, van Sonderen E, van Jaarsveld CHM, Sanderman R. Risk and protectivefactors of different functional trajectories in older persons: Are these the same? Journal ofGerontology Psychological Sciences 2006;61B:P95–P101.
Kempen GIJM, Sanderman R, Scaf-Klomp W, Ormel J. The role of depressive symptoms in recoveryfrom injuries to the extremities in older persons-A prospective study. International Journal ofGeriatric Psychiatry 2003;18:14–22. [PubMed: 12497552]
Kempen GIJM, Sullivan M, van Sonderen E, Ormel J. Performance based and self-reported physicalfunctioning in low-functioning older persons: Congruence of change and the impact of depressivesymptoms. Journal of Gerontology B: Psychological Sciences and Social Sciences 1999a;54B:P380–P386.
Kempen GIJM, van Sonderen E, Ormel J. The impact of psychological attributes on changes in disabilityamong low-functioning older persons. Journal of Gerontology Psychological Sciences 1999b;54B:P23–P29.
Kivela S-L, Pahkala K. Depressive disorder as a predictor of physical disability in old age. Journal of theAmerican Geriatrics Society 2001;49:290–296. [PubMed: 11300240]
Korn E, Graubard B. Epidemiologic studies utilizing surveys: Accounting for sampling design. AmericanJournal of Public Health 1991;81:1166–1173. [PubMed: 1951829]
Landerman LR, Fillenbaum GG. Differential relationships of risk factors to alternative measures ofdisability. Journal of Aging and Health 1997;9(2):266–279. [PubMed: 10182407]
Lenze EJ, Rogers JC, Martire LM, Mulsant BH, Rollman BL, Dew MA, Schulz R, Reynolds CF. Theassociation of late-life depression and anxiety with physical disability: A review of the literature andprospectus for future research. American Journal of Geriatric Psychiatry 2001;9(2):113–135.[PubMed: 11316616]
Lenze EJ, Schulz R, Martire L, Zdaniuk B, Glass T, Kop WJ, Jackson SA, Reynolds CF. The course offunctional decline in older people with persistently elevated depressive symptoms: Longitudinalfindings from the Cardiovascular Health Study. Journal of the American Geriatrics Society2005;53:569–575. [PubMed: 15817000]
Lyness JM, Heo M, Datto CJ, Ten Have TR, Katz IR, Drayer R, Reynolds CF, Alexopoulos GS, BruceML. Outcomes of minor and subsyndromal depression among elderly patients in primary caresettings. Annals of Internal Medicine 2006;144:496–504. [PubMed: 16585663]
Lyness JM, King DA, Cox C, Yoediono Z, Caine EC. The importance of subsyndromal depression inolder primary care patients: Prevalence and associated functional disability. Journal of the AmericanGeriatrics Society 1999;47:647–652. [PubMed: 10366161]
McConnell ES, Pieper CF, Sloane RJ, Branch LG. Effects of cognitive performance on change in physicalfunction in long-stay nursing home residents. Journal of Gerontology: Medical Sciences2002;57A:M778–M784.
Mehta KM, Yaffe K, Covinsky KE. Cognitive impairment, depressive symptoms, and functional declinein older people. Journal of the American Geriatrics Society 2002;50:1045–1050. [PubMed:12110064]
Mendes de Leon CF, Beckett LA, Fillenbaum GG, Brock DB, Branch LG, Evans DA, Berkman LF.Black-white differences in risk of becoming disabled and recovering from disability in old age: Alongitudinal analysis of two EPESE populations. American Journal of Epidemiology 1997;145(6):488–497. [PubMed: 9063338]
Murray, C.; Lopez, A. Summary: The Global Burden of Disease. Boston, MA: Harvard School of PublicHealth; 1996.
Ormel J, Rijsdijk FV, Sullivan M, von Sonderen E, Kempen GIJM. Temporal and reciprocal relationshipbetween IADL/ADL disability and depressive symptoms in late life. Journal of Gerontology B:Psychological Sciences and Social Sciences 2002;57B:P338–P347.
Penninx BWJH, Deeg DJH, van Eijk JT, Beekman ATF, Guralnik JM. Changes in depression and physicaldecline in older adults: a longitudinal perspective. Journal of Affective Disorders 2000;61:1–12.[PubMed: 11099735]
Penninx BWJH, Guralnik JM, Ferrucci L, Simonsick EM, Deeg DJH, Wallace RB. Depressive symptomsand physical decline in community-dwelling older persons. Journal of the American MedicalAssociation 1998;279(21):1720–1726. [PubMed: 9624025]
Hybels et al. Page 13
Psychol Med. Author manuscript; available in PMC 2010 October 1.
NIH
-PA Author Manuscript
NIH
-PA Author Manuscript
NIH
-PA Author Manuscript

Penninx BWJH, Leveille S, Ferrucci L, van Eijk JTM, Guralnik JM. Exploring the effect of depressionon physical disability: Longitudinal evidence from the Established Populations for EpidemiologicStudies of the Elderly. American Journal of Public Health 1999;89:1346–1352. [PubMed: 10474551]
Pfeiffer E. A short portable mental status questionnaire for the assessment of organic brain deficit inelderly patients. Journal of the American Geriatrics Society 1975;23(10):433–441. [PubMed:1159263]
Pincus HA, Davis WW, McQueen LE. 'Subthreshold' mental disorders: A review and synthesis of studieson minor depression and other 'brand names'. British Journal of Psychiatry 1999;174(4):288–296.[PubMed: 10533546]
Radloff LS. The CES-D scale: A self-report depression scale for research in the general population.Applied Psychological Measurement 1977;1(3):385–401.
Radloff, LS.; Locke, BZ. Handbook of Psychiatric Measures. Washington DC: American PsychiatricAssociation; 2000. Center for Epidemiologic Studies Depression Scale (CES-D).
Rosow I, Breslau N. A Guttman health scale for the aged. Journal of Gerontology 1966;21:556–559.[PubMed: 5918309]
SAS Institute. Statistical Analysis System, Version 9. Cary NC: SAS Institute; 2004.Sinclair PA, Lyness JM, King DA, Cox C, Caine ED. Depression and self-reported functional status in
older primary care patients. American Journal of Psychiatry 2001;158:416–419. [PubMed:11229982]
Stuck AE, Walthert JM, Nikolaus T, Bula CJ, Hohmann C, Beck JC. Risk factors for functional statusdecline in community-living elderly people: a systematic literature review. Social Science andMedicine 1999;48:445–469. [PubMed: 10075171]
van Gool CH, Kempen GIJM, Penninx BWJH, Deeg DJH, Beekman ATF, van Eijk JTM. Impact ofdepression on disablement in late middle aged and older persons: results from the Longitudinal AgingStudy Amsterdam. Social Science and Medicine 2005;60:25–36. [PubMed: 15482864]
Wang L, van Belle G, Kukull WB, Larson EB. Predictors of functional change: A longitudinal study ofnondemented people aged 65 and older. Journal of the American Geriatrics Society 2002;50:1525–1534. [PubMed: 12383150]
Hybels et al. Page 14
Psychol Med. Author manuscript; available in PMC 2010 October 1.
NIH
-PA Author Manuscript
NIH
-PA Author Manuscript
NIH
-PA Author Manuscript
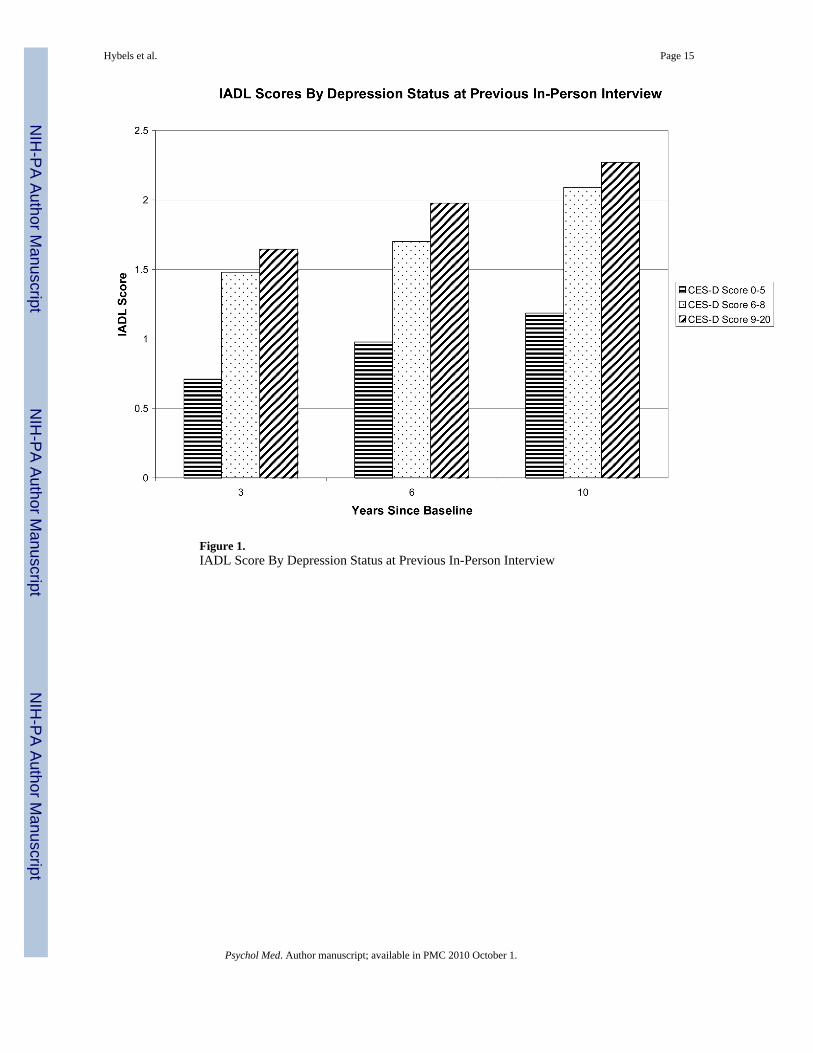
Figure 1.IADL Score By Depression Status at Previous In-Person Interview
Hybels et al. Page 15
Psychol Med. Author manuscript; available in PMC 2010 October 1.
NIH
-PA Author Manuscript
NIH
-PA Author Manuscript
NIH
-PA Author Manuscript
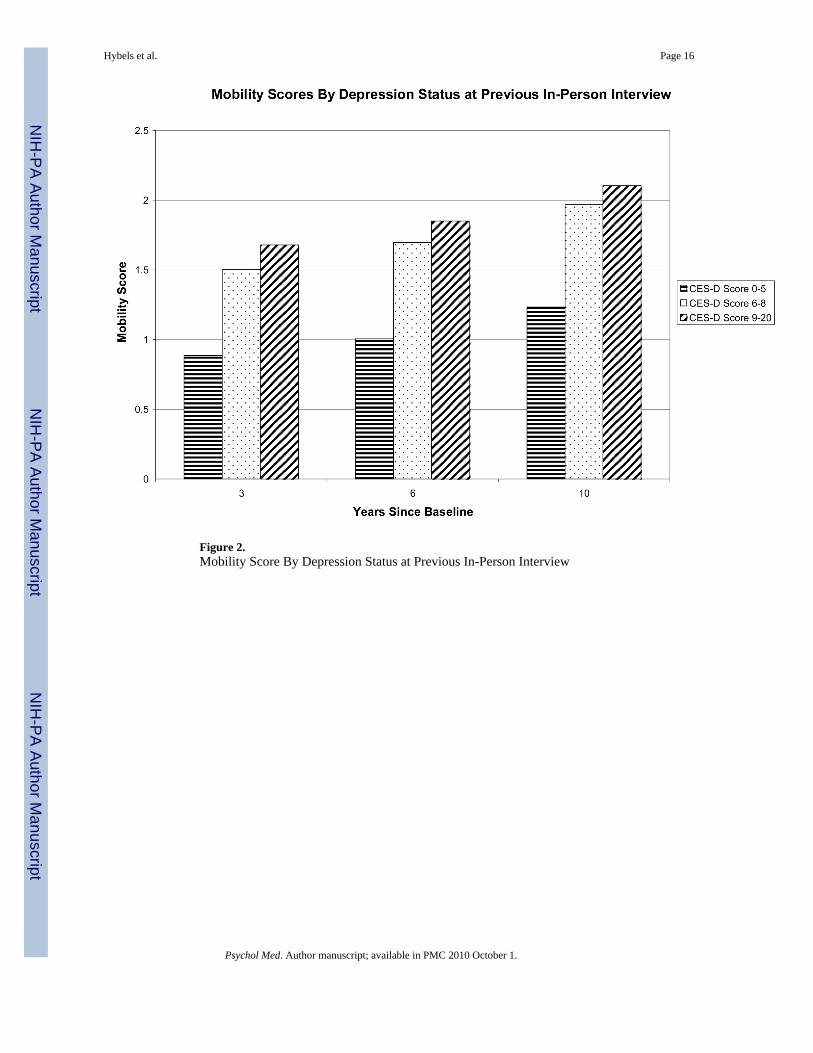
Figure 2.Mobility Score By Depression Status at Previous In-Person Interview
Hybels et al. Page 16
Psychol Med. Author manuscript; available in PMC 2010 October 1.
NIH
-PA Author Manuscript
NIH
-PA Author Manuscript
NIH
-PA Author Manuscript

Figure 3.ADL Score By Depression Status at Previous In-Person Interview
Hybels et al. Page 17
Psychol Med. Author manuscript; available in PMC 2010 October 1.
NIH
-PA Author Manuscript
NIH
-PA Author Manuscript
NIH
-PA Author Manuscript

NIH
-PA Author Manuscript
NIH
-PA Author Manuscript
NIH
-PA Author Manuscript
Hybels et al. Page 18
Table 1Characteristics of the respondents who participated in the first interval (n=3052)
Characteristic Mean (SD) Number (%)
CES-D Score 6+ at BL (%) 607 (19.9%)
CES-D Score 9+ at BL (%) 267 (8.8%)
Mean CES-D Score at BL (SD) 3.1 (3.32)
Mean Age at BL (SD) 72.8 (6.2)
Mean # Yrs Education (SD) 8.6 (4.1)
Mean # ADL Limitations at BL (SD) 0.15 (0.61)
Mean # ADL Limitations at P2 (SD) 0.43 (1.09)
Mean # IADL Limitations at BL (SD) 0.50 (1.11)
Mean # IADL Limitations at P2 (SD) 0.88 (1.54)
Mean # Mobility Limitations at BL (SD) 0.79 (1.07)
Mean # Mobility Limitations at P2 (SD) 1.03 (1.15)
Black Race (%) 1654 (54.2%)
Male Sex (%) 1017 (33.3%)
Not Married at BL (%) 1842 (60.1%)
Mean Number Errors SPMSQ at BL (SD) 1.6 (1.5)
Mean Health Conditions Score at BL (SD) 36.0 (29.9)
Mean Self-Rated Health at BL (SD) 2.4 (0.9)
Mean Perceived Social Support at BL (SD) 5.5 (0.9)
Psychol Med. Author manuscript; available in PMC 2010 October 1.

NIH
-PA Author Manuscript
NIH
-PA Author Manuscript
NIH
-PA Author Manuscript
Hybels et al. Page 19Ta
ble
2D
epre
ssiv
e sy
mpt
oms
as a
pre
dict
or o
f fu
nctio
nal l
imita
tions
usi
ng a
mix
ed m
odel
rep
eate
d m
easu
res
desi
gn a
nd C
ES-D
sco
re a
s a
cont
inuo
us v
aria
bles
IAD
L L
imita
AD
L L
imita
tions
Mob
ility
Lim
itatio
ns
Para
met
erE
stim
ate
Stan
dard
Err
orp-
valu
ePa
ram
eter
Est
imat
eSt
anda
rdE
rror
p-va
lue
Para
met
erE
stim
ate
Stan
dard
Err
orp-
valu
e
Inte
rcep
t−4
.088
70.
2470
<.00
01−2
.496
60.
1805
<.00
01−2
.250
20.
1692
<.00
01
CES
-D S
core
0.03
730.
0082
<.00
010.
0219
0.00
620.
0004
0.02
290.
0056
<.00
01
CES
-D S
core
Squ
ared
**−0
.003
60.
0011
0.00
11−0
.001
70.
0008
0.03
95−0
.002
40.
0007
0.00
13
Bla
ck R
ace
−0.0
936
0.03
350.
0053
−0.0
614
0.02
420.
0113
0.00
600.
0229
0.79
45
Mal
e Se
x−0
.039
10.
0378
0.30
120.
0172
0.02
740.
5288
−0.1
064
0.02
60<.
0001
Age
0.05
450.
0029
<.00
010.
0316
0.00
21<.
0001
0.03
240.
0020
<.00
01
Yrs
of E
duca
tion
0.00
190.
0045
0.67
260.
0068
0.00
330.
0394
−0.0
064
0.00
310.
0377
Not
Mar
ried
0.06
150.
0371
0.09
790.
0398
0.02
700.
1407
0.09
950.
0254
<.00
01
SPM
SQ E
rror
s0.
1925
0.01
26<.
0001
0.10
620.
0094
<.00
010.
0544
0.00
84<.
0001
Chr
onic
Hea
lth0.
0029
0.00
05<.
0001
0.00
070.
0004
0.07
660.
0024
0.00
04<.
0001
Con
ditio
ns S
core
Self-
Rat
ed H
ealth
0.11
820.
0207
<.00
010.
1053
0.01
55<.
0001
0.14
090.
0145
<.00
01
Perc
eive
d So
cial
Sup
port
−0.0
307
0.01
82.0
921
−0.0
236
0.01
390.
0895
−0.0
279
0.01
240.
0245
Func
tion
Scor
e at
Inde
x0.
6364
0.01
57<.
0001
0.76
310.
0190
<.00
010.
5601
0.01
20<.
0001
Inte
rvie
w*
Yea
r0.
1024
0.02
26<.
0001
0.05
980.
0190
.001
70.
0852
0.01
48<.
0001
* For m
odel
pre
dict
ing
IAD
L lim
itatio
ns, w
e co
ntro
lled
for I
AD
L sc
ore
at in
dex
inte
rvie
w, e
tc.
**Q
uadr
atic
term
is d
iffer
ence
bet
wee
n C
ES-D
scor
e an
d th
e m
ean
squa
red.
Psychol Med. Author manuscript; available in PMC 2010 October 1.

NIH
-PA Author Manuscript
NIH
-PA Author Manuscript
NIH
-PA Author Manuscript
Hybels et al. Page 20Ta
ble
3D
epre
ssiv
e sym
ptom
s as a
pre
dict
or o
f fun
ctio
nal l
imita
tions
usi
ng a
mix
ed m
odel
repe
ated
mea
sure
s des
ign
and
thre
e lev
els o
f dep
ress
ive
sym
ptom
s as p
redi
ctor
s
IAD
L L
imita
tions
AD
L L
imita
tions
Mob
ility
Lim
itatio
ns
Para
met
erE
stim
ate
Stan
dard
Err
orp-
valu
ePa
ram
eter
Est
imat
eSt
anda
rdE
rror
p-va
lue
Para
met
erE
stim
ate
Stan
dard
Err
orp-
valu
e
Unc
ontr
olle
d an
alys
es**
Inte
rcep
t0.
2194
0.04
18<.
0001
0.13
150.
0342
0.00
010.
2635
0.02
92<.
0001
CES
-D S
core
6+
0.30
480.
0590
<.00
010.
2297
0.04
41<.
0001
0.20
070.
0398
<.00
01
CES
-D S
core
9+
0.06
410.
0806
0.42
640.
0252
0.06
100.
6793
0.00
430.
0540
0.93
68
Func
tion
Scor
e at
Inde
x0.
8254
0.01
53<.
0001
0.88
310.
0191
<.00
010.
7295
0.01
08<.
0001
Inte
rvie
w*
Yea
r0.
1827
0.02
26<.
0001
0.08
580.
0191
<.00
010.
1297
0.01
47<.
0001
Con
trol
led
anal
yses
Inte
rcep
t−4
.057
00.
2464
<.00
01−2
.469
00.
1801
<.00
01−2
.222
30.
1687
<.00
01
CES
-D S
core
6+
0.12
340.
0568
0.02
980.
0722
0.04
370.
0989
0.06
720.
0387
0.08
26
CES
-D S
core
9+
0.00
740.
0761
0.92
26−0
.013
40.
0589
0.82
01−0
.018
60.
0518
0.71
90
Bla
ck R
ace
−0.0
885
0.03
340.
0082
−0.0
599
0.02
410.
0132
0.00
860.
0228
0.70
80
Mal
e Se
x−0
.050
30.
0376
0.18
140.
0093
0.02
730.
7335
−0.1
127
0.02
59<.
0001
Age
0.05
480.
0029
<.00
010.
0318
0.00
21<.
0001
0.03
250.
0020
<.00
01
Yrs
of E
duca
tion
0.00
100.
0045
0.82
740.
0062
0.00
330.
0604
−0.0
070
0.00
310.
0228
Not
Mar
ried
0.06
470.
0371
0.08
130.
0428
0.02
700.
1130
0.10
140.
0254
<.00
01
SPM
SQ E
rror
s0.
1926
0.01
26<.
0001
0.10
710.
0094
<.00
010.
0546
0.00
84<.
0001
Chr
onic
Hea
lth0.
0029
0.00
05<.
0001
0.00
070.
0004
0.06
370.
0024
0.00
04<.
0001
Con
ditio
ns S
core
Self-
Rat
ed H
ealth
0.13
070.
0203
<.00
010.
1161
0.01
52<.
0001
0.14
850.
0143
<.00
01
Perc
eive
d So
cial
Sup
port
−0.0
349
0.01
81.0
541
−0.0
280
0.01
380.
0426
−0.0
311
0.01
230.
0116
Func
tion
Scor
e at
Inde
x0.
6399
0.01
57<.
0001
0.76
660.
0190
<.00
010.
5658
0.01
19<.
0001
Inte
rvie
w*
Yea
r0.
0933
0.02
26<.
0001
0.05
460.
0189
.003
90.
0798
0.01
47<.
0001
* For m
odel
pre
dict
ing
IAD
L lim
itatio
ns, w
e co
ntro
lled
for I
AD
L sc
ore
at in
dex
inte
rvie
w, e
tc.
**Th
e un
cont
rolle
d m
odel
incl
udes
the
two
varia
bles
mea
surin
g de
pres
sion
and
tim
e as
pre
dict
ors i
n th
e sa
me
mod
el. I
nclu
ding
the
9+ v
aria
ble
in th
e m
odel
as w
ell a
s the
6+
allo
ws u
s to
mea
sure
the
incr
emen
tal e
ffec
t of C
ES-D
def
ined
dep
ress
ion
com
pare
d to
the
effe
ct o
f sub
thre
shol
d de
pres
sion
.
Psychol Med. Author manuscript; available in PMC 2010 October 1.