
Energy-based optimization of the material stock allowance for turning-grinding process sequence

This article was downloaded by: [Universitetbiblioteket I Trondheim NTNU]On: 29 January 2014, At: 06:20Publisher: RoutledgeInforma Ltd Registered in England and Wales Registered Number: 1072954 Registered office: Mortimer House,37-41 Mortimer Street, London W1T 3JH, UK
Building Research & InformationPublication details, including instructions for authors and subscription information:http://www.tandfonline.com/loi/rbri20
Dynamic material flow analysis for Norway's dwellingstockHåvard Bergsdal a , Helge Brattebø a , Rolf A. Bohne b & Daniel B. Müller ca Department of Hydraulic and Environmental Engineering/Industrial Ecology Programme ,Norwegian University of Science & Technology , N-7491, Trondheim, Norwayb Department of Civil and Transport Engineering , Norwegian University of Science &Technology , N-7491, Trondheim, Norwayc Yale School of Forestry & Environmental Studies , 205 Prospect Street, New Haven, CT,06511, USPublished online: 06 Jul 2007.
To cite this article: Håvard Bergsdal , Helge Brattebø , Rolf A. Bohne & Daniel B. Müller (2007) Dynamic material flowanalysis for Norway's dwelling stock, Building Research & Information, 35:5, 557-570, DOI: 10.1080/09613210701287588
To link to this article: http://dx.doi.org/10.1080/09613210701287588
PLEASE SCROLL DOWN FOR ARTICLE
Taylor & Francis makes every effort to ensure the accuracy of all the information (the “Content”) containedin the publications on our platform. However, Taylor & Francis, our agents, and our licensors make norepresentations or warranties whatsoever as to the accuracy, completeness, or suitability for any purpose of theContent. Any opinions and views expressed in this publication are the opinions and views of the authors, andare not the views of or endorsed by Taylor & Francis. The accuracy of the Content should not be relied upon andshould be independently verified with primary sources of information. Taylor and Francis shall not be liable forany losses, actions, claims, proceedings, demands, costs, expenses, damages, and other liabilities whatsoeveror howsoever caused arising directly or indirectly in connection with, in relation to or arising out of the use ofthe Content.
This article may be used for research, teaching, and private study purposes. Any substantial or systematicreproduction, redistribution, reselling, loan, sub-licensing, systematic supply, or distribution in anyform to anyone is expressly forbidden. Terms & Conditions of access and use can be found at http://www.tandfonline.com/page/terms-and-conditions

Dynamicmaterial £owanalysis forNorway’s dwelling stock
H �avard Bergsdal1,HelgeBratteb�1,Rolf A.Bohne2 andDaniel B.Mu« ller3
1Department of Hydraulic and Environmental Engineering/Industrial Ecology Programme,NorwegianUniversity of Science & Technology,N-7491Trondheim,NorwayE-mails: [email protected] and [email protected]
bDepartment of Civil and Transport Engineering,NorwegianUniversity of Science & Technology,N-7491Trondheim,Norway
E-mail: [email protected]
cYale School of Forestry & Environmental Studies, 205 Prospect Street,NewHaven,CT 06511,USE-mail: [email protected]
The architecture, engineering and construction industry is a major producer of waste, and a major consumer of primary
materials. This study presents a method for analysing the dynamics of both floor area and material use in residential
housing. The population’s demand for housing represents the driver in the system, and the subsequent effects on
stocks and flows of residential floor area and building materials in Norway are investigated from 1900 to the
projected demands for 2100. Results show that knowledge about past activity levels is important in projecting future
levels. Scenarios are applied to the input parameters in the dynamic model to investigate the impacts of changes in
these, including variations in material usage (concrete and wood) and material density. All but one scenario suggest a
continued increase in the residential housing stock, although at diminishing growth rates, and a substantial increase
in demolition, renovation and construction activity in the last half of the present century.
Keywords: building stock, demolition, dwelling stock, dynamic material flow analysis, materials demand, trends, waste
generation
Le secteur de l’architecture, de l’ingenierie et de la construction est un des principaux producteurs de dechets et figure
parmi les premiers consommateurs de matieres premieres. Cette etude presente une methode d’analyse de l’evolution
des surfaces de plancher et de l’utilisation des materiaux dans le logement residentiel. Le moteur du systeme est la
demande de la population en matiere de logement et l’etude examine les effets de cette demande sur les « stocks » et
les flux de surfaces residentielles et de materiaux de construction en Norvege depuis 1900 et, en projection, jusqu’en
2100. Les resultats montrent qu’une bonne connaissance des activites passees est importante pour prevoir les niveaux
a venir. Des scenarios appliques aux parametres d’entree du modele dynamique permettent d’etudier les consequences
de leurs variations, notamment en ce qui concerne l’utilisation des materiaux (beton et bois) et leur densite. Tous ces
scenarios, a l’exception d’un seul, prevoient une croissance continue du parc de logements residentiels – avec un
rythme toutefois moins soutenu – ainsi qu’une augmentation substantielle des activites de demolition, de renovation
et de construction au cours de la seconde moitie de ce siecle.
Mots cles: parc de batiments, demolition, parc de logements residentiels, analyse dynamique du flux des materiaux,
demande en materiaux, tendances, generation de dechets
BUILDING RESEARCH & INFORMATION (2007) 35(5), 557–570
Building Research & Information ISSN 0961-3218 print ⁄ISSN 1466-4321 online # 2007 Taylor & Francishttp: ⁄ ⁄www.tandf.co.uk ⁄journals
DOI: 10.1080/09613210701287588
Dow
nloa
ded
by [
Uni
vers
itetb
iblio
teke
t I T
rond
heim
NT
NU
] at
06:
20 2
9 Ja
nuar
y 20
14

IntroductionAnnual waste generation from the architecture, engin-eering and construction (AEC) industry in Norway isestimated to be 1.2 million tons in 2004, accordingto Statistics Norway (2006). Waste is generated as con-struction, renovation and demolition waste, termed‘C&D waste’. Waste generation from C&D activitiesis already a major contributor to society’s total wasteflows, but this and other studies indicate that themagnitude of C&D waste amounts can be expectedto increase substantially in the next decades. This isthe result of a combination of socio-economic anddemographic changes, and an ageing building stock(Fatta et al., 2003; Poon et al., 2004a, b; Muller,2006; Bergsdal et al., 2007).
The present paper applies a general approach todynamic long-term modelling of stocks and flows ofdwellings, following the model and method presentedby Muller (2006), and applied to the Norwegian resi-dential housing, or dwelling, stock. The term ‘dwelling’comprises all buildings used for residential purposes,such as single houses, terraced houses, apartmentbuildings and other buildings for permanent housing.The main objective of this work is to investigate thedynamics of the Norwegian dwelling stock, measuredby units of useful floor area, and its influence on thecorresponding stocks and flows of concrete andwood. The paper presents results from simulationsfor 1900–2100 of the Norwegian dwelling stock, andsubsequent results for the materials concrete andwood, which on a mass basis represent the two largestwaste fractions from the AEC industry (StatisticsNorway, 2006). The relationship between historicC&D activity and future projections is emphasized.The non-housing part of the building stock, comprisedby office buildings, industrial buildings, agriculturalbuildings, etc., is not considered, and the resultspresented here are valid for the dwelling stock only.
This work provides important information on not onlywaste generation, but also materials demand. Theresults are valuable for the evaluation and design offuture waste treatment systems with respect to bothwaste amounts and composition. The efficiency ofsuch systems will further influence the share of materialdemand covered by primary materials extraction. Thiswill not be discussed in detail in here, but will be thetopic of forthcoming publications.
MethodsThe model presented herein represents a material flowanalysis (MFA) for the floor area and selected buildingmaterials in the Norwegian residential building stock.Through knowledge about key parameters determiningstocks and flows of floor area, and subsequentlymaterials, the model illustrates how knowledge of
past activities is reflected in future projections aboutwaste generation and materials demand.
Projections of waste generation and materials demandoften neglect the dynamic behaviour of systems.Instead, trend analysis is assumed to represent anapproximation of the future amounts of buildingwaste (Kohler and Hassler, 2002). This might be suffi-cient and correct in a short-term perspective, but ininvestigating long-term trends, the dynamics play a sig-nificant role and can shift the expected results signifi-cantly from what would otherwise be suggested by acontinuation of trends. Other studies have also stressedthe importance of taking the dynamic behaviour ofsystems into consideration (e.g. Johnstone, 2001a;Hsiao et al., 2002; Kohler and Hassler, 2002; Salviaet al., 2002; Elshkaki et al., 2005; Bergsdal et al.,2007).
The conceptual outline of the stock dynamics model isdeveloped by Muller (2006), and its main aspects aredescribed in this section and presented in Figure 1. Pro-cesses are represented by rectangles, flows by ovals,and drivers and determinants by hexagons. Dashedlines represent influences between variables. Stocks ofpopulation, floor area and materials are denoted byP, A and M, respectively, and the net stock accumu-lation by dP/dt, dA/dt and dM/dt. Input flows tostock are given by Pin/dt, Ain/dt and Min/dt, whileoutput flows are represented correspondingly as Pout/dt, Aout/dt and Mout/dt.
Balance equations are given in equations (1) and (2) forfloor area and material stocks, respectively. It followsfrom equation (1) that floor area input (Ain/dt) has to
Figure 1 Conceptual outline of the stock dynamics model
Bergsdal et al.
558
Dow
nloa
ded
by [
Uni
vers
itetb
iblio
teke
t I T
rond
heim
NT
NU
] at
06:
20 2
9 Ja
nuar
y 20
14
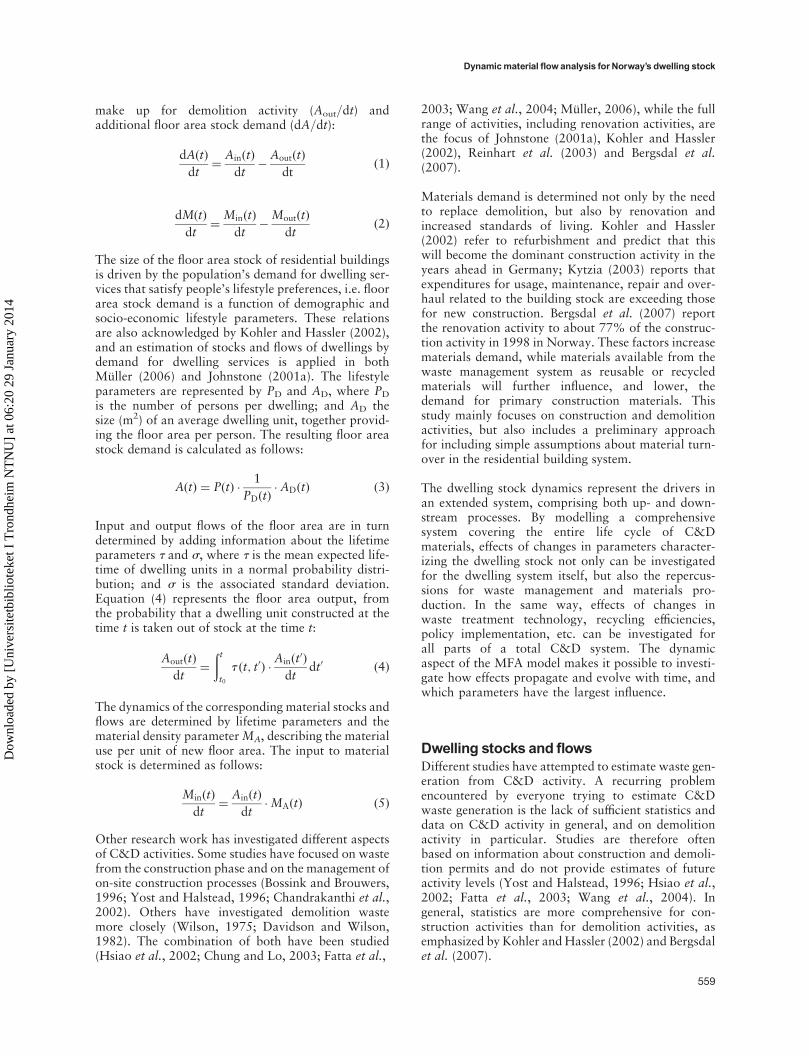
make up for demolition activity (Aout/dt) andadditional floor area stock demand (dA/dt):
dAðtÞ
dt¼
AinðtÞ
dt�AoutðtÞ
dtð1Þ
dMðtÞ
dt¼
MinðtÞ
dt�MoutðtÞ
dtð2Þ
The size of the floor area stock of residential buildingsis driven by the population’s demand for dwelling ser-vices that satisfy people’s lifestyle preferences, i.e. floorarea stock demand is a function of demographic andsocio-economic lifestyle parameters. These relationsare also acknowledged by Kohler and Hassler (2002),and an estimation of stocks and flows of dwellings bydemand for dwelling services is applied in bothMuller (2006) and Johnstone (2001a). The lifestyleparameters are represented by PD and AD, where PD
is the number of persons per dwelling; and AD thesize (m2) of an average dwelling unit, together provid-ing the floor area per person. The resulting floor areastock demand is calculated as follows:
AðtÞ ¼ PðtÞ �1
PDðtÞ� ADðtÞ ð3Þ
Input and output flows of the floor area are in turndetermined by adding information about the lifetimeparameters t and s, where t is the mean expected life-time of dwelling units in a normal probability distri-bution; and s is the associated standard deviation.Equation (4) represents the floor area output, fromthe probability that a dwelling unit constructed at thetime t is taken out of stock at the time t:
AoutðtÞ
dt¼
ðtt0
t ðt; t0Þ �Ainðt
0Þ
dtdt0 ð4Þ
The dynamics of the corresponding material stocks andflows are determined by lifetime parameters and thematerial density parameterMA, describing the materialuse per unit of new floor area. The input to materialstock is determined as follows:
MinðtÞ
dt¼
AinðtÞ
dt�MAðtÞ ð5Þ
Other research work has investigated different aspectsof C&D activities. Some studies have focused on wastefrom the construction phase and on the management ofon-site construction processes (Bossink and Brouwers,1996; Yost and Halstead, 1996; Chandrakanthi et al.,2002). Others have investigated demolition wastemore closely (Wilson, 1975; Davidson and Wilson,1982). The combination of both have been studied(Hsiao et al., 2002; Chung and Lo, 2003; Fatta et al.,
2003; Wang et al., 2004; Muller, 2006), while the fullrange of activities, including renovation activities, arethe focus of Johnstone (2001a), Kohler and Hassler(2002), Reinhart et al. (2003) and Bergsdal et al.(2007).
Materials demand is determined not only by the needto replace demolition, but also by renovation andincreased standards of living. Kohler and Hassler(2002) refer to refurbishment and predict that thiswill become the dominant construction activity in theyears ahead in Germany; Kytzia (2003) reports thatexpenditures for usage, maintenance, repair and over-haul related to the building stock are exceeding thosefor new construction. Bergsdal et al. (2007) reportthe renovation activity to about 77% of the construc-tion activity in 1998 in Norway. These factors increasematerials demand, while materials available from thewaste management system as reusable or recycledmaterials will further influence, and lower, thedemand for primary construction materials. Thisstudy mainly focuses on construction and demolitionactivities, but also includes a preliminary approachfor including simple assumptions about material turn-over in the residential building system.
The dwelling stock dynamics represent the drivers inan extended system, comprising both up- and down-stream processes. By modelling a comprehensivesystem covering the entire life cycle of C&Dmaterials, effects of changes in parameters character-izing the dwelling stock not only can be investigatedfor the dwelling system itself, but also the repercus-sions for waste management and materials pro-duction. In the same way, effects of changes inwaste treatment technology, recycling efficiencies,policy implementation, etc. can be investigated forall parts of a total C&D system. The dynamicaspect of the MFA model makes it possible to investi-gate how effects propagate and evolve with time, andwhich parameters have the largest influence.
Dwelling stocks and £owsDifferent studies have attempted to estimate waste gen-eration from C&D activity. A recurring problemencountered by everyone trying to estimate C&Dwaste generation is the lack of sufficient statistics anddata on C&D activity in general, and on demolitionactivity in particular. Studies are therefore oftenbased on information about construction and demoli-tion permits and do not provide estimates of futureactivity levels (Yost and Halstead, 1996; Hsiao et al.,2002; Fatta et al., 2003; Wang et al., 2004). Ingeneral, statistics are more comprehensive for con-struction activities than for demolition activities, asemphasized by Kohler andHassler (2002) and Bergsdalet al. (2007).
Dynamicmaterial £ow analysis for Norway’s dwelling stock
559
Dow
nloa
ded
by [
Uni
vers
itetb
iblio
teke
t I T
rond
heim
NT
NU
] at
06:
20 2
9 Ja
nuar
y 20
14
The modelling approach presented herein and byMuller (2006) applies material densities for calculationof C&D waste. The use of densities has also beenapplied in other studies. Wang et al. (2004) used ft2 ofselected materials per ft2 of building area as a startingpoint for calculating the total tonnage of C&D wastein Massachusetts, US. Fatta et al. (2003) first estimatethe generated volume of waste for a given area of con-struction or demolition, and combine this with arough average figure of C&D waste density to obtainresults for Greece. A similar approach is employed byHsiao et al. (2002) for Taiwan, although at a moredetailed level regarding different materials. Yost andHalstead (1996) and Reinhart et al. (2003) make useof monetary values in estimating C&D waste gener-ation. Material density for different activities (in kg/m2) was used earlier by Bergsdal et al. (2007), althoughfor a shorter period of time and with constant values.For the longer time period studied in the presentwork, thematerial density will evolve with time, requir-ing knowledge about time series for this. The sameapplies to the other input parameters, both historically,as well as for the projection period.
Statistics Norway (2003) has published projections andestimates for population numbers until 2100. Theavailable data on the remaining parameters areharder to obtain, and are less extensive. Historicaldata on the size of dwellings, number of persons perdwelling and material use densities are especiallyhard to find for the long time horizon needed for mod-elling the dwelling stock. Residential buildings have along lifetime and as knowledge of what has been putinto the dwelling stock is essential for the present andfuture situation, tracing the historical developmentand ageing phenomena is important. Statistical datasources concerning the input parameters are scarce,but sufficient to provide valuable insight about thisdevelopment. The model used for simulations is notaccurate with regard to year-to-year variations, butrather for the type of long time dynamics in thisstudy. Regression analysis is therefore used on theempirical data points in order to obtain smoothcurves that do not disturb the general results witherratic year-by-year fluctuations. Figures 2–4 showthe empirical data points obtained from statistics,and the corresponding regression curves for theperiod between 1800 and present. Historical datapoints indicate a sigmoidal growth for most of the par-ameters (population excluded), and a four-parametersigmoidal regression model is therefore applied.
When projecting possible future developments in thestocks and flows of dwellings, knowledge about thefuture situation is determined not only by past activitylevels, but also on future demand for dwellings andtheir standards. Developing robust scenarios for allinput parameters for a hundred-year period requiresextensive examination of a variety of economic,
social, technical, etc. changes, and goes beyond thescope of this study. Instead, this work focuses on therelative importance and influence of changes anduncertainties in the different input parameters, andhow this affects the total results for the dwellingstock until the end of the current century. A mediumscenario is developed as a base scenario for eachinput parameter towards a final value in 2100.Regression analysis is applied to the projections aswell in order to obtain smooth curves along thechosen path of development. To examine the influenceof changes in input parameters on simulation resultsof stocks and flows of dwellings, high- and low-development scenarios are developed. The high scen-ario represents a development for the input parametersthat will increase the future demand for dwelling stock,and vice versa for the low scenario. Scenarios are devel-oped for a final value in 2100 of+15% of the mediumscenario value.
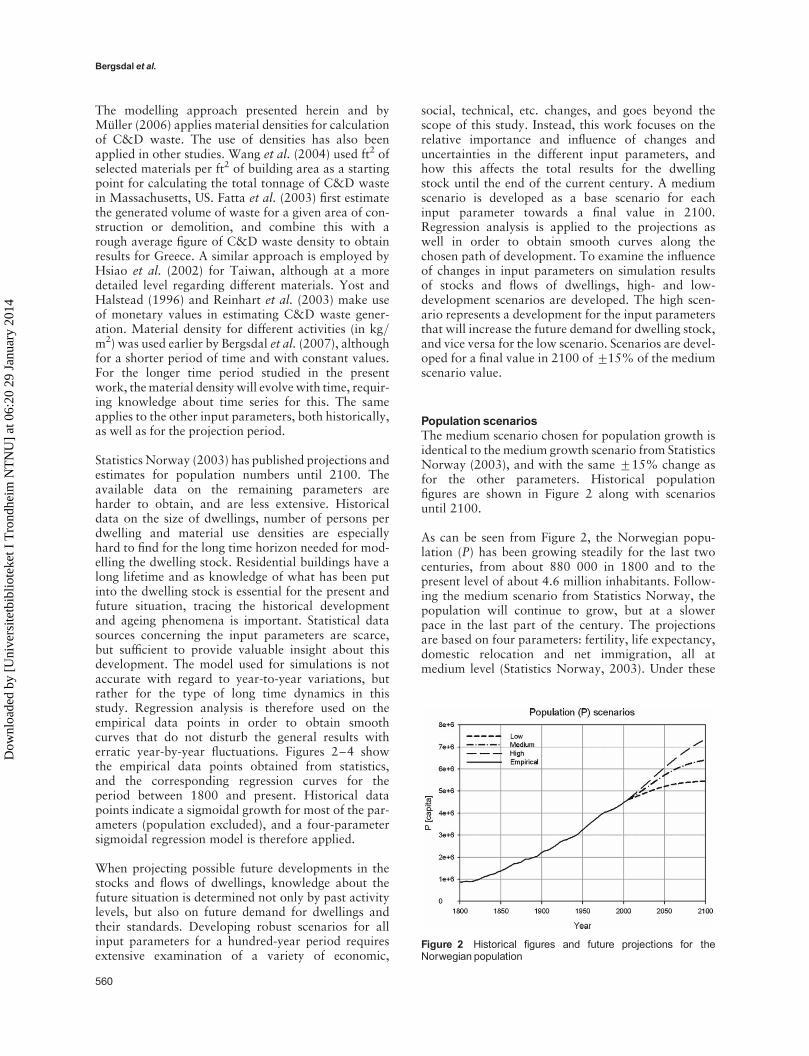
Population scenariosThe medium scenario chosen for population growth isidentical to the medium growth scenario from StatisticsNorway (2003), and with the same +15% change asfor the other parameters. Historical populationfigures are shown in Figure 2 along with scenariosuntil 2100.
As can be seen from Figure 2, the Norwegian popu-lation (P) has been growing steadily for the last twocenturies, from about 880 000 in 1800 and to thepresent level of about 4.6 million inhabitants. Follow-ing the medium scenario from Statistics Norway, thepopulation will continue to grow, but at a slowerpace in the last part of the century. The projectionsare based on four parameters: fertility, life expectancy,domestic relocation and net immigration, all atmedium level (Statistics Norway, 2003). Under these
Figure 2 Historical ¢gures and future projections for theNorwegian population
Bergsdal et al.
560
Dow
nloa
ded
by [
Uni
vers
itetb
iblio
teke
t I T
rond
heim
NT
NU
] at
06:
20 2
9 Ja
nuar
y 20
14

assumptions the Norwegian population will reach 6.4million, whereas the high and low scenarios will endat a little less than 7.4 million and a little more than5.4 million, respectively.
Personsper dwelling scenariosInformation about the number of persons per dwelling(PD) goes back to 1801, when the average Norwegiandwelling was inhabited by 5.4 people. As the 20thcentury approached, the number decreased to anaverage of 4.3 inhabitants. The decrease has beeneven more significant during the last century, and theaverage Norwegian dwelling is currently inhabited byonly 2.2 people. Progress in the Norwegian economy,especially in the last 30–40 years, and the subsequentincrease in living standards has been one of thedrivers for this development, but social changes havealso played an important role. Family structures havechanged, with smaller families in general, and differentgenerations no longer live together in the same house.Increased levels of education lead to people livingalone longer; and at the same time divorce rates haveincreased. All this has contributed to the considerabledecrease observed in the average number of personsper dwelling, as shown in Figure 3.
The decrease in persons per dwelling shows signs ofslowing for the last ten to 20 years. The number ofpersons per dwelling cannot decrease at the recentpace for much longer as there is a natural limit tohow low this number can be. The medium scenarioshown in Figure 3 therefore continues with a decreasein persons per dwelling, but at a slower pace, levellingof at two persons per dwelling in 2100. In the highscenario the same number decreases to 1.7 persons in2100; while in the low scenario the decreasing trendwill turn and the number of persons per dwellingincrease back to 2.3. Continued urbanization and a
growing share of immigrants with traditions forlarger families might support this scenario.
Floor area per dwelling scenariosWhile the number of persons per dwelling has decreased,the average size of Norwegian dwellings (AD) has at thesame time increased significantly. The increase in floorarea per dwelling was particularly strong after theSecond World War, as shown in Figure 4.
Historical sources on this parameter are very scarceuntil the last 30 years. The starting point used in thesimulations is not known from statistical sources, andis assumed according to estimates and best knowledge.A few additional points are added to reduce the depen-dency of the last few years where most observations arefound. The regression would otherwise produce anunreasonably steep slope and flat parts for the first150 years as well as for the projections, and wouldnot reflect a likely development.
Floor area per dwelling has indeed increased significantlyin the latter half of the last century, but the developmentin the last decade suggests that this rapid increase isslowing. The average size of Norwegian dwellings isassumed to level off towards a value in 2100 of 125 m2
in the medium scenario, compared with the presentvalue of 120 m2. Increasing urbanization with smallerurban apartments and more people living alone supportthis trend. In the high scenario the average size of dwell-ings increases to nearly 144 m2 in 2100, while the lowscenario implies an increase in size for the next decadeand a following decrease to about 106 m2 in 2100.
Lifetime scenariosThe building lifetime (t) will be an important factor inbuilding stock dynamics. A long functional lifetime
Figure 3 Historical ¢guresand futureprojections for theaveragenumberofpersonsperdwelling inNorway
Figure 4 Historical ¢gures and future projections for theaverage size of Norwegian dwellings
Dynamicmaterial £ow analysis for Norway’s dwelling stock
561
Dow
nloa
ded
by [
Uni
vers
itetb
iblio
teke
t I T
rond
heim
NT
NU
] at
06:
20 2
9 Ja
nuar
y 20
14

will delay the waste generation and reduce demand fornew construction. However, the lifetime of buildings isin general not well documented, and the availability ofreliable data is limited (Horvath, 2004; Bergsdal et al.,2007). Studies of the mortality of buildings are exam-ined by Johnstone (2001b), who concludes that in theabsence of suitable data, current life table models andstock and flow models of mortality have to be used.In the present study, the mortality of dwellingsfollows a normal distribution as in Muller’s (2006)study of Dutch housing. Information about the lifetimeof dwellings is very scarce, and there is no consensus inthe literature on what distribution best reflects theactual dwelling lifetime. For reasons of simplicity, anormal distribution was therefore applied by Muller,as well as in the present study.
Residential buildings constructed two centuries years agowere designed for a different and longer functional life-time than ones constructed today, and supposed toprovide housing for several generations. Adecreasing life-time of dwellings is therefore used in the medium scen-ario, starting with t ¼ 150 years for a dwellingconstructed in 1800, and ending at t ¼ 95 years in2100. Corresponding s-values are 30% and 20% of t.The assumed development is displayed in Figure 5.High and low scenarios use a constant t of 75 and 125years, respectively. The lifetime scenarios are differentfrom the other input parameters, as very little exact infor-mation exists about the historical development. Adecreasing lifetime is therefore compared with fixed life-times todemonstrate the impactof the lifetimeparameter.The scenario with decreasing lifetime is referred to as themedium one, even if this is not correct until about 1940.However, this scenario represents amediumdevelopmentfor the important projection period, as well as beingregardedas themost representative. For reasonsof simpli-city in scenario comparisons, the scenarios are referred toas high, medium and low.
Developments in persons per dwelling and floor areaper dwelling have been strong, both parameters reflect-ing increased living standards as a result of nationaleconomic progress and development. Population hasat the same time increased steadily, and the lifetimeof residential buildings has decreased. Consideringthe development in all these parameters, it is obviousthat the demand for dwelling stock and new construc-tion have increased considerably in the last century.
Scenario results for dwelling stocks and£owsThe main objective of this study is to investigate thepast, and especially the future, dwelling stocks andflows, and how changes and uncertainties in the inputparameters affect the results. Simulations are performedon the basis of the parameter variations discussed. Thebase case scenario is defined as the alternative applyingthe medium values for all input parameters, and theresults are shown in Figure 6. The nomenclature isequivalent to Figure 1, where A is the demand forfloor area of dwelling stock; dA/dt is the stock changeand derivative of A; Aout/dt is demolition activity; andAin/dt is construction activity. Stocks are measured onthe right axis and flows on the left.
National and private economic progress have providedan increase in living standards that is reflected in theinput parameters, which is in turn reflected in thedemand for floor area of dwellings and constructionactivity. The most significant growth is observed inthe period following the Second World War. Between1950 and 2000 the demand for dwelling stock by theNorwegian population increased by more than400%, while the population growth was only 38%.At the same time, demolition activity was close to neg-ligible and the stock change therefore follows approxi-mately the same path as the construction activity. The
Figure 5 Scenarios of the functional lifetime of Norwegianresidential buildings
Figure 6 Stocks and £ows of dwellings in themedium scenario(m2 of £oor area)
Bergsdal et al.
562
Dow
nloa
ded
by [
Uni
vers
itetb
iblio
teke
t I T
rond
heim
NT
NU
] at
06:
20 2
9 Ja
nuar
y 20
14

increased demand for dwelling stock has to be coveredby a corresponding increase in construction activity.The importance of the post-Second World War periodon construction activity and the current dwelling stockis also observed in earlier work (Bergsdal et al., 2007).
The input parameters predict a decrease in the futuregrowth rate of the dwelling stock compared with thelevel in the last 50 years; this is reflected in Figure 6.As the dwelling stock growth rate declines and demoli-tion activity is still relatively low, construction activityis expected to decrease in the next 15–20 years, untildemolition activity starts to cause significant impactson construction activity. As the large amount of dwell-ings constructed in the last 50–60 years start reachingtheir functional lifetime, the increase in demolitionactivity is expected to increase dramatically, producinga wave of demolition output in the last half of thepresent century. Expectancy of a decreasing functionallifetime further contributes to this development.Although at a slower pace, the demand for dwellingstock is still expected to increase throughout theentire century. In order to satisfy the additionaldemand and at the same time replace the large demoli-tion output, the construction activity has to increaseback to, and even surpass, post-war activity levels.Figure 6 clearly shows the importance of dynamics.Even if the parameter values used can be argued,there are considerable long-term fluctuations thatwould not be traced or well-understood by assuminga simple continuation of trends for demolition or con-struction activity.
The significant increase in both demolition andconstruction activity suggested by Figure 6 raisesimportant future challenges for the AEC industry,authorities and society in general. Main issuesconcern how the demand for residential buildingstock can be satisfied in a sustainable way regardingwaste treatment, materials production and use, andenergy requirements. Solutions should be as environ-mentally sound as possible, but at the same time econ-omically viable. The results will be important inputsfor future solutions for the entire life cycle of the resi-dential building system, for waste managementsystems and technologies, materials production,energy supply, greenhouse gases mitigation, etc.
Population scenario resultsFigure 7 shows the results from choosing high and lowscenarios for the different input parameters. Resultsfrom population growth scenarios are found in theupper part of Figure 7. The effects of changes in popu-lation are clearly seen from the developments in thetotal dwelling stock. In the low population scenariostock change will approach zero, while in the highpopulation scenario the dwelling stock will increasesignificantly. Changes in population assumptions
result in approximately a 10% higher demolitionactivity in the high scenario compared with the lowscenario in 2100. Looking at construction activity,the same number is about 35%. Demolition activityis determined by previous stock demand and construc-tion activity, and since the functional lifetime of dwell-ings is so long, the effects on demolition activity willnot be very strong. With small changes in demolitionactivity and an increasing demand for dwelling stock,the gap between demand and current stock has to becovered by additional construction, hence the largeincrease in construction activity.
Personsper dwelling scenario resultsThe difference between the high and low scenarios forpersons per dwelling in Figure 7 shows a differentpattern from the population scenarios. There isapproximately an 18% difference in the 2100 level ofdemolition activity, and a corresponding 29% differ-ence in construction activity. Stock change in the lowscenario is still approaching zero, while the demandfor dwelling stock continues to grow at rates similarto the current rate until the last half of the century,where growth is less pronounced. The most significantaspect of the scenarios of persons per dwelling is,however, not the end values in 2100, but rather thedevelopment from current levels towards the endvalues. While the low scenario shows similar trendsto both the medium scenario in Figure 6 and the popu-lation scenarios, the high scenario is considerablydifferent. Demolition activity only shows minor differ-ences in magnitude, but construction activity showssubstantial differences in the development character-istics. The low and medium scenarios have a significantdecrease in construction activity for the next 15–20years due to slower growth in stock demand, whichis in turn a result of less rapid changes in the futurevalues of the input parameters compared with thepast developments. However, due to continuedgrowth in stock demand at similar rates as thecurrent one, and with negligible changes in demolitionactivity, the construction activity will remain at a morestable level throughout the present century.
Floor area per dwelling scenario resultsScenario results for floor area per dwelling presented inFigure 7 show that demolition activity is only about8% higher in the high scenario, while the same figurefor construction activity is a considerable 50% differ-ence. Again, the reason is found in the way thechange in the input parameter affects the population’sdemand for dwelling stock. The stock change in thelow scenario is negative in the last quarter of the 21stcentury, meaning the stock demand is decreasing.Despite population and persons per dwelling contri-buting to increasing the stock demand, the decreasein the size of dwellings is significant enough to counter
Dynamicmaterial £ow analysis for Norway’s dwelling stock
563
Dow
nloa
ded
by [
Uni
vers
itetb
iblio
teke
t I T
rond
heim
NT
NU
] at
06:
20 2
9 Ja
nuar
y 20
14
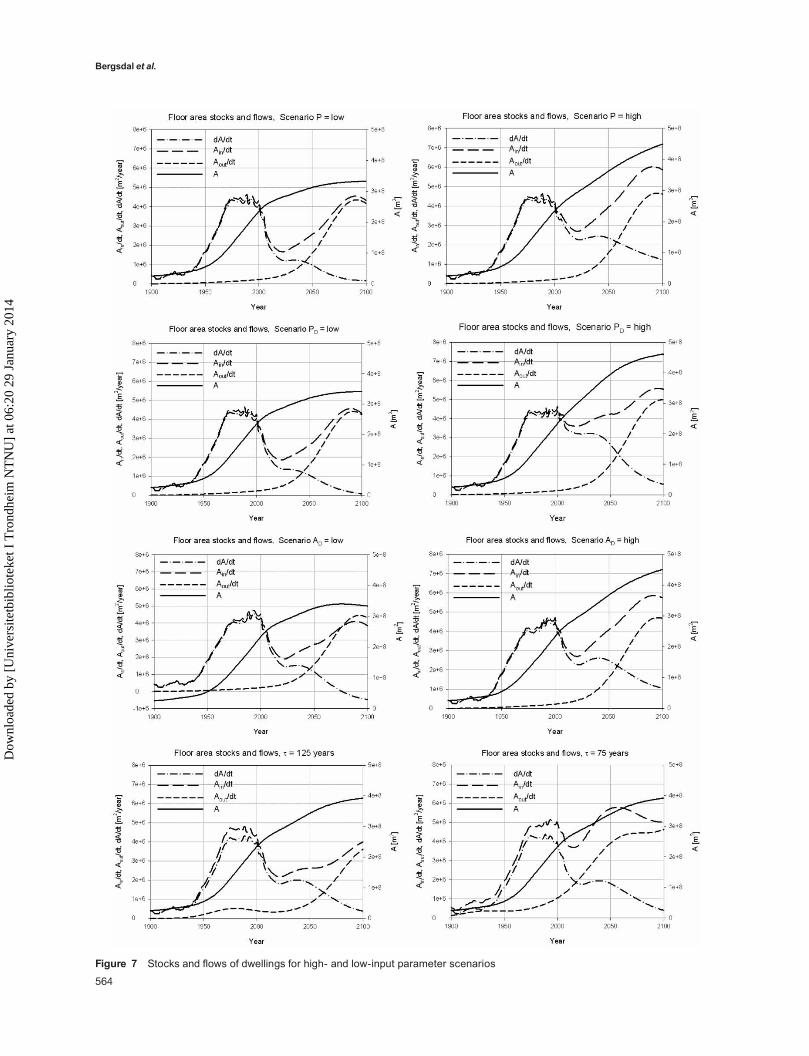
Figure 7 Stocks and £ows of dwellings for high- and low-input parameter scenarios
Bergsdal et al.
564
Dow
nloa
ded
by [
Uni
vers
itetb
iblio
teke
t I T
rond
heim
NT
NU
] at
06:
20 2
9 Ja
nuar
y 20
14

this and predict a situation where demolition activityexceeds construction activity. The strong influence ofchanges in dwelling size is also reflected in the high scen-ario with continued strong growth in stock demand andaccompanying growth in construction activity levels.
Lifetime scenario resultsStatistical data on the lifetime of Norwegian dwellingsdo not exist as for the other input parameters. Renova-tion activity prolongs the lifetime, and the lifetime par-ameter used does not separate between lifetime withor without renovation, hence the effects of renovationare included indirectly as the lifetime parameter is esti-mated from construction to final demolition. Simple life-time scenarios are used to investigate the influence of thelifetime parameter, and applied for historical data aswell as future projections. The results on stocks andflows of dwellings are given in the lower part ofFigure 7. Demand for dwelling stock is naturallyunchanged, as the lifetime of dwellings does not influ-ence the population’s demand for living space in themodel. However, the impacts on demolition and con-struction activity are considerable. A shorter buildinglifetime results in a higher turnover in the dwellingstock, and thus increased demolition activity and asubsequent increase in construction activity. For the75-year scenario the future wave of demolition and con-struction following the post-war wave of constructionwill come sooner than in the medium scenario, whilein the 125-years scenario it will be postponed andreach the peak in the start of the next century. Thedifferences in the 2100 levels of the scenarios areabout 28 and 26% for demolition and constructionactivity, respectively. However, around 2050 the samedifferences in the same numbers would be dramaticallyhigher, with nearly five times the demolition activity andmore than twice the construction activity. These areindeed considerable differences, and demonstrate theimportance of knowledge about building lifetime, withrespect to both magnitude and timing of activitylevels. Unfortunately, this is also the parameter whereinformation is hardest to obtain, and where statisticalsources offer the least data.
Renovation activity is not included in these simulationsof dwelling stock, but is linked to material use.Demand for floor area stock in dwellings will not beaffected by renovation, but renovation implies con-struction activities with input and output flows. Reno-vation will prolong the lifetime and postpone thedemolition and construction accordingly.
Results summary of dwelling stocks and£owsThe effects of changing the values of the input par-ameters give different results for stocks and flows, inparticular with respect to magnitudes. However,there are several similarities with respect to future
trends. The population’s demand for dwelling stockis expected to continue to grow, although at slowerrates towards the end of the current century. Further-more, the dynamic behaviour of the dwelling stock isdemonstrated, with the increasing construction activityfollowing the Second World War reflected in futureexpectations of growing demolition rates, with thetiming depending on lifetime assumptions. As stockdemand is increasing for all but one scenario, the con-struction activity will remain higher than the demoli-tion activity in order to replace retired dwellings andsatisfy additional demand.
Table 1 gives the magnitudes of stocks and flows forthe base scenario for 2050 and 2100. Results for thesame years are given for the high and low scenariosof all input parameters, with values presented as per-centages of the base scenario.
Scenarios about population, persons per dwelling andfloor area per dwelling show similar trends, whilechanges in lifetime affect both the magnitudes andthe development trends significantly. Results from thethree first input parameters give a range of 91–118%of the stock demand (A) in the base scenario. Due tothe long lifetime of residential buildings, the effects ofparameter changes on demolition activity (Aout/dt)are less pronounced, while the growth in stock demandleads to variations in construction activity (Ain/dt)within the range of 75 to 125% relative to the base scen-ario. The range of variation will be even larger for some
Table 1 Scenario results with values for stocks and £owsrelative to themedium scenario
Stocks/£ows Medium
2050 2100
A (m2) 3.43e8 3.93e8Floor area Aout/dt (m
2/year) 0.8e6 3.62e6Ain/dt (m
2/year) 2.62e6 4.00e6
Input parameter variation Low High
2050 2100 2050 2100
A (%) 91 85 106 115Population,P Aout/dt (%) 100 94 100 105
Ain/dt (%) 75 89 116 120
A (%) 93 87 116 118Persons/dwelling,
PD
Aout/dt (%) 100 96 100 113
Ain/dt (%) 78 89 125 114
A (%) 95 85 107 115m2/dwelling, AD Aout/dt (%) 100 98 100 106
Ain/dt (%) 81 79 120 118
A (%) 100 100 100 100Lifetime, t Aout/dt (%) 50 82 245 105
Ain/dt (%) 77 82 168 103
Dynamicmaterial £ow analysis for Norway’s dwelling stock
565
Dow
nloa
ded
by [
Uni
vers
itetb
iblio
teke
t I T
rond
heim
NT
NU
] at
06:
20 2
9 Ja
nuar
y 20
14

other periods than the two specific years presented inTable 1.
The strongest impacts are found from varying the life-time of dwellings, with demolition activity (Aout/dt)ranging from 50 to 245% of the base scenario values,and construction activity (Ain/dt) with a corresponding77–168%.
Stocks and £ows of buildingmaterialsSimulations and scenarios of developments in the stocksand flows of residential buildings are interesting in them-selves. However, with knowledge of the dwelling stock,the study can be expanded to both material and energyuse. This study will investigate the use of the two majorconstruction materials in Norway: concrete and wood.
As with the other input parameters, the material den-sities are developed by regression and scenario assump-tions. However, obtaining the densities is morecomplex. The residential building stock is comprisedof a variety of building types and vintage cohorts,both differing with respect to material composition,and detailed information about this is very limited. InTable 2, floor area, concrete density and wood densityare organized according to five different building typesand nine vintage cohorts. The residential buildingstock is classified into five categories, according to Stat-istics Norway (2005): detached houses (Type 1),chained houses (Type 2), multi-dwelling houses withfewer than three floors (Type 3), apartment blockswith three or more floors (Type 4), and commercialbuildings with dwelling units (Type 5). Only the dwell-ing units are accounted for in Type 5. Floor area infor-mation is based on the residential building stock in 2001(Statistics Norway, custom-made statistics, personalcommunication, 2005), while material densities are pro-vided by the Prognosis Centre for Norwegian Construc-tion Industry (personal communication, 2005) for1984–2001 and otherwise by qualified assumptionsby the authors and personal communication with theconstruction industry. Material densities representapproximate values. Statistics of material productionand consumption in the Norwegian economy could beused for calibration, but are currently too aggregatedto provide any meaningful comparison.
Material densities for Types 1–3 and 4–5 show verysimilar values for both concrete and wood, and aretherefore assumed to follow the same historicaltrends. By weighting according to the floor area distri-bution of the residential building stock, weightedaverages are calculated and reported in the bottomrow and far-right column of Table 2, for vintagecohorts and building types, respectively. Total floorarea is presented in the same way. Average weightedmaterial densities in the dwelling stock in 2001 arealso provided in the lower right-hand corner.
The cohort model used differentiates cohorts on a yearlybasis, as overall building stock data are available on aone-year basis. However, the building compositiondata from Table 2 are only available on a more aggre-gated level. For the calibration of the building compo-sition parameters, data from Table 2 were interpolated.The cohort approach allows one to account for thelong-term effects of changing building stock size andcomposition with respect to material demand andwaste or scrap generation. The cohort model thereforerepresents the building stockdynamics in amore realisticway andproducesmore accurate results thana one-stockmodel. Organizing the dwelling stock according to typeand year of construction facilitates the examination ofchanges in average material density due to changes inthe composition of the dwelling stock, with respect todwelling types, and changes in the material densitywithin dwelling types over time. A similar approach ispresented by Kohler and Hassler (2002), and a stockmodel based on vintage structures and residence timeof materials is applied by Kytzia (2003).
Figure 8 presents the historical and projected trends inweighted average material use per m2 of constructedfloor area (Ain/dt).
Material use in Norwegian residential buildings showsopposing trends for the two materials historically, withthe use of concrete increasing and the use of wooddecreasing. About 85%of the current Norwegian dwell-ing stock is small houses, constructed almost exclusivelywithwood as themain buildingmaterial.However, withthe introduction of concrete as a building material in thelatter part of the 19th century, concrete has becomeincreasingly important during the last 70–80 years.The favourable material properties made the construc-tion of larger buildings possible at a reasonable cost.The last century also brought urbanization anddemand for more living space within confined areas.Wood as a building material in dwellings has decreasedfor the same reasons. The future material densities until2100 are very hard to project, and the projectionsshould be considered with some caution as they merelyrepresent scenarios of possible developments. Materialsubstitution might affect the future projections andlead to less use of concrete. However, there are fewalternative materials available in such large quantitieswith competitive properties and prices. Projections arefurther complicated by the composition of the residentialbuilding stock and the factors influencing this, such asdemography, social structures, degree of urbanization,etc. Due to these uncertainties, the material use isassumed to continue the recent decades’ development,with decreasing year-to-year changes in growth rates.
A conceptually correct approach to include the renova-tion of residential buildings would relate renovationactivity directly to the individual building, or theyearly cohorts of new buildings. The lifetime
Bergsdal et al.
566
Dow
nloa
ded
by [
Uni
vers
itetb
iblio
teke
t I T
rond
heim
NT
NU
] at
06:
20 2
9 Ja
nuar
y 20
14
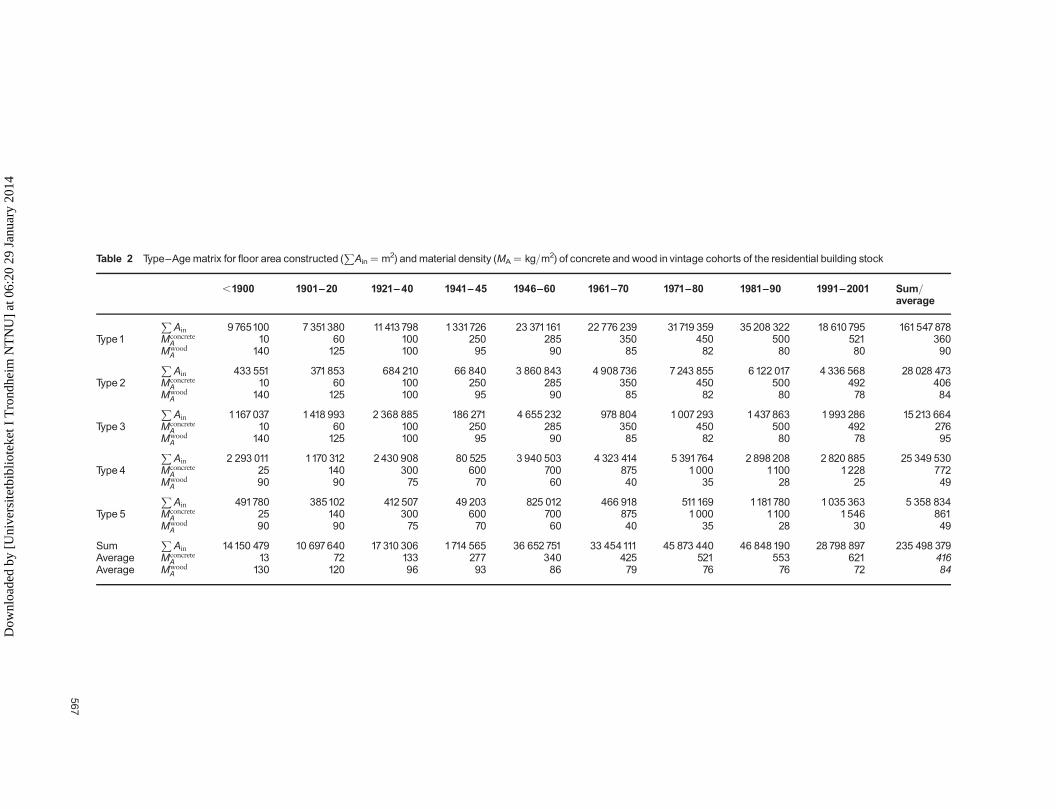
Table 2 Type^Agematrix for £oor area constructed (P
Ain ¼ m2) andmaterial density (MA ¼ kg/m2) of concrete and wood in vintage cohorts of the residential building stock
,1900 1901^20 1921^40 1941^45 1946^60 1961^70 1971^80 1981^90 1991^2001 Sum/average
PAin 9765100 7351380 11413798 1331726 23 371161 22776 239 31719 359 35 208 322 18 610795 161547878
Type1 MconcreteA 10 60 100 250 285 350 450 500 521 360
MwoodA 140 125 100 95 90 85 82 80 80 90
PAin 433 551 371853 684 210 66 840 3 860 843 4 908736 7243 855 6122 017 4 336 568 28 028 473
Type 2 MconcreteA 10 60 100 250 285 350 450 500 492 406
MwoodA 140 125 100 95 90 85 82 80 78 84
PAin 1167037 1418 993 2 368 885 186 271 4 655232 978 804 1007293 1437863 1993 286 15213 664
Type 3 MconcreteA 10 60 100 250 285 350 450 500 492 276
MwoodA 140 125 100 95 90 85 82 80 78 95
PAin 2 293 011 1170 312 2430 908 80 525 3 940 503 4 323 414 5 391764 2 898 208 2 820 885 25 349 530
Type 4 MconcreteA 25 140 300 600 700 875 1000 1100 1228 772
MwoodA 90 90 75 70 60 40 35 28 25 49
PAin 491780 385102 412 507 49 203 825 012 466 918 511169 1181780 1035 363 5 358 834
Type 5 MconcreteA 25 140 300 600 700 875 1000 1100 1546 861
MwoodA 90 90 75 70 60 40 35 28 30 49
SumP
Ain 14150 479 10 697640 17310 306 1714 565 36 652751 33 454111 45 873 440 46 848190 28798 897 235 498 379Average Mconcrete
A 13 72 133 277 340 425 521 553 621 416Average Mwood
A 130 120 96 93 86 79 76 76 72 84
567
Dow
nloa
ded
by [
Uni
vers
itetb
iblio
teke
t I T
rond
heim
NT
NU
] at
06:
20 2
9 Ja
nuar
y 20
14

distribution would be expected to have one peak forrenovation or several if there is more than one roundof renovation, and one for demolition. The peakswould be closer for wood than for concrete, as woodis more exposed to renovation than concrete. So farthe adoption of such an approach is hindered by alack of knowledge concerning the number of renova-tion rounds, the timing of these and the definition ofa renovation round with respect to scale.
In this study, a preliminary and simplified approach ischosen to include some effects of renovation activity,and this is linked to the turnover of materials. Theapproach is based on two parameters, a and b,where a is the share of the total material stock M inresidential housing exposed to renovation; and b
is the timing of the renovation and is the quotient ofthe average lifetime of materials exposed to renova-tion, relative to the average building lifetime t. Thisis translated into an average material lifetime (tM) for
the entire material stock, adjusted for renovation, asgiven by equation (6). The result is a higher turnoverof materials relative to buildings:
tM = ð1� ð1� bÞaÞt ð6Þ
A normal distribution is used for material lifetime aswell, with tM and sM varying according to the buildinglifetime parameters. aconcrete and awood are set to 0.02and 0.10, respectively, while the b-value is 0.5 for bothmaterials. Concrete is used mainly in the structure ofthe building and is thus less likely to be exposed torenovation, hence the low aconcrete-value. The a- andb-values are kept constant with time, but the b-valuevaries indirectly through the building lifetime t.
Figure 9 presents simulation results for stocks andflows of concrete and wood, based on the base scenariofor dwelling stocks and flows and material densitiesfrom Figure 8.
Figure 8 Weighted averagematerial density of concrete and wood in the construction of new buildings in the Norwegian dwelling stock
Figure 9 Stocks and £ows of concrete and wood for themedium scenario
Bergsdal et al.
568
Dow
nloa
ded
by [
Uni
vers
itetb
iblio
teke
t I T
rond
heim
NT
NU
] at
06:
20 2
9 Ja
nuar
y 20
14

Results for stocks and flows of concrete and woodshow the same general trends as for the floor arearesults. The wave of construction activity in the post-war period is reflected in the input of materials tostock (dM/dt), and so are the corresponding peaks indemolition (Mout/dt) and construction activity (Min/dt) in the last part of the present century.
Concrete stocks have been increasing throughout thelast century and are expected to continue at a fairlysimilar growth rate, despite the scenario fromFigure 8 with decreasing growth in the concretedensity of dwellings. The reason for this is the contin-ued increase in dwelling stock, and although thegrowth rate of concrete use will decline, the total usewill still increase.
Wood stocks are expected to experience continuedgrowth, but at lower growth rates towards the end ofthe present century, as the trend in material densityfrom Figure 8 enhances the expected development indwelling stock. Decreasing stocks lead to decreasingdifference between construction and demolitionactivity.
Results for flows of materials into and out of stock aremore different from the floor area results. Due to thelate introduction of concrete as a building materialand the low renovation activity for this material, theflow of demolished concrete is delayed. Flows ofwood show the opposite situation. Wood as a buildingmaterial has always been important in Norwegiandwellings, and even more so historically than today.Wood in buildings is also more exposed to renovation,and together this cause historically more output fromrenovation and demolition combined.
ConclusionsModelling the stocks and flows of dwellings andmaterials demonstrates how the present and futuresituation is influenced, and partly determined by, pastactivities. However, estimates of past activity levelscontain inherent uncertainties in the input parametersas statistical data are scarce and hard to obtain. In par-ticular, this is the case for the lifetime parameter ofbuildings, which is also the most influential one inthe scenarios developed in this study.
Scenarios are generated and compared with a basemedium scenario to investigate the impacts ofchanges in input parameters. The stocks and flowsvary according to this, but all scenarios show similargeneral trends. Stocks of residential buildings andbuilding materials will continue to increase, althoughat diminishing rates. The decades following theSecond World War brought a considerable increasein demand for dwellings, and a subsequent increase
in construction activity. As dwellings from this periodreach their functional lifetime in the next decades, sig-nificant growth in demolition activity can be expected.Along with continued growth in demand for dwellingstock, construction activity will grow in order toreplace retired dwellings and meet additionaldemand. The expected wave of growth in demolitionand construction activity will pose serious challengesto waste management systems, materials productionand energy supply, and to the way society fulfils theservice of living in a sustainable way, including soundrenovation strategies in order to prolong service life-times and resource utilization.
Future research on the residential building stock shouldfocus on the lifetime of buildings and building com-ponents, and the material composition in differentvintage cohorts and building types. The model couldbe calibrated based on statistics of material productionandmaterial use, thus providing a better understandingof the long-term dynamics of construction materials.However, current statistics are insufficient for thiskind of model validation, and would need a significantimprovement with respect to differentiating C&Dwaste according to source. This would mean differen-tiating between materials from buildings and infra-structure, between residential buildings and otherbuildings, and between residential building types andvintage cohorts. Furthermore, efforts should be madeto provide better informed projections for all input par-ameters, through collaboration and discussion withactors within the AEC industry, authorities and otherrelevant organizations.
Implications for down- and upstream systems also needto be addressed and evaluated according to economicand environmental performance. The remaining build-ing stock, comprised by all other buildings than resi-dential, should also be investigated in a similar way.
ReferencesBergsdal, H., Bohne, R.A. and Brattebø, H. (2007) Projection of
waste amounts from the AEC-industry in Norway. Journalof Industrial Ecology (forthcoming).
Bossink, B. and Brouwers, H. (1996) Construction waste: quanti-fication and source evaluation. Journal of ConstructionEngineering and Management 122(1), 55–60.
Chandrakanthi,M.,Hettiaratchi, P., Prado, B. andRuwanpura, J.(2002) Optimization of the waste management for construc-tion projects using simulation, in Proceedings of the WinterSimulation Conference, San Diego, CA, US, 2002.
Chung, S. and Lo, C. (2003) Evaluating sustainability in wastemanagement: the case of construction and demolition,chemical and clinical wastes in Hong Kong. Resources,Conservation and Recycling, 37, 119–145.
Davidson, T. and Wilson, D. (1982) U.S. building demolitionwastes: quantities and potential for resource recovery.Conservation and Recycling, 5, 113–132.
Elshkaki, A., Van der Voet, E., Timmermans, V. and VanHolder-beke, M. (2005) Dynamic stock modeling: a method for the
Dynamicmaterial £ow analysis for Norway’s dwelling stock
569
Dow
nloa
ded
by [
Uni
vers
itetb
iblio
teke
t I T
rond
heim
NT
NU
] at
06:
20 2
9 Ja
nuar
y 20
14
identification and estimation of future waste streams andemissions based on past production and product stockcharacteristics. Energy, 30(8), 1353–1363.
Fatta, D., Papadopoulos, A., Avramikos, E., Sgourou, E.,Moustakas, K., Kourmoussis, F., Mentzis, A. and Loizidou,M. (2003) Generation and management of construction anddemolition waste in Greece – an existing challenge.Resources, Conservation and Recycling, 40, 81–91.
Horvath, A. (2004) Construction materials and the environment.Annual Review of Environment and Resources, 29(1),181–204.
Hsiao, T., Huang, Y., Yu, Y. and Wernick, I. (2002) Modelingmaterials flow ofwaste concrete from construction and demoli-tion wastes in Taiwan. Resources Policy, 28(1), 39–47.
Johnstone, I. (2001a) Energy and mass flows of housing: a modeland example. Building and Environment, 36(1), 27–41.
Johnstone, I. (2001b) Energy and mass flows of housing: estimat-ing mortality. Building and Environment, 36(1), 43–51.
Kohler, N. and Hassler, U. (2002) The building stock as aresearch object. Building Research & Information, 30(4),226–236.
Kytzia, S. (2003) Material flow analysis as a tool for sustain-able management of the built environment, in M. Koll-Schretzenmayr, M. Keiner and G. Nussbaumer (eds) TheReal and the Virtual World of Spatial Planning, Springer-Verlag, Berlin.
Muller, D.B. (2006) Stock dynamics for forecasting materialflows – case study for housing in the Netherlands. EcologicalEconomics, 59, 142–156.
Poon, C., Yu, A., See, S. and Cheung, E. (2004a) Minimizingdemolition wastes in Hong Kong public housing
projects. Construction Management and Economics, 22,799–805.
Poon, C.S., Yu, A., Wong, S. and Cheung, E. (2004b) Manage-ment of construction waste in public housing projects inHong Kong. Construction Management and Economics,22, 675–689.
Reinhart, D., Townsend, T. and Heck, H. (2003) Generationand Composition of Construction and Demolition Wastein Florida. Technical Report No. 03-08, FloridaCenter for Solid and Hazardous Waste Management,Gainesville, FL.
Salvia,M., Cosmi, C., Macchiato,M. andMangiamele, L. (2002)Waste management system optimization for Southern Italywith MARKAL model. Resource, Conservation and Recy-cling, 34, 91–106.
Statistics Norway (2003) What Will the Population be in 2100?(available at: http://www.ssb.no/samfunnsspeilet/utg/200303/09/art-2003-06-2001.html).
Statistics Norway (2005) Statistical database (available at:http://www.ssb.no/fobbolig/tab-2002-09-23-04.html).
Statistics Norway (2006) Waste From Building Activities (avail-able at: http://www.ssb.no/emner/01/05/avfbygganl/).
Wang, J., Touran, A., Christoforou, C. and Fadlalla, H. (2004) Asystems analysis tool for construction and demolition wastesmanagement. Waste Management, 24, 989–997.
Wilson, D. (1975) The resource potential of demolition debris inthe United States. Resource Recovery and Conservation, 1,129–140.
Yost, P. and Halstead, J. (1996) A methodology for quantifyingthe volume of construction waste. Waste Management andResearch, 14(5), 453–461.
Bergsdal et al.
570
Dow
nloa
ded
by [
Uni
vers
itetb
iblio
teke
t I T
rond
heim
NT
NU
] at
06:
20 2
9 Ja
nuar
y 20
14
Copyright © 2022 FDOKUMEN