The complete mitochondrial genome of Cephalothrix simula (Iwata) (Nemertea: Palaeonemertea)
11
Provided for non-commercial research and education use. Not for reproduction, distribution or commercial use. This article appeared in a journal published by Elsevier. The attached copy is furnished to the author for internal non-commercial research and education use, including for instruction at the authors institution and sharing with colleagues. Other uses, including reproduction and distribution, or selling or licensing copies, or posting to personal, institutional or third party websites are prohibited. In most cases authors are permitted to post their version of the article (e.g. in Word or Tex form) to their personal website or institutional repository. Authors requiring further information regarding Elsevier's archiving and manuscript policies are encouraged to visit: http://www.elsevier.com/copyright
-
Upload
independent -
Category
Documents
-
view
0 -
download
0
Transcript of The complete mitochondrial genome of Cephalothrix simula (Iwata) (Nemertea: Palaeonemertea)
Provided for non-commercial research and education use. Not for reproduction, distribution or commercial use.
This article appeared in a journal published by Elsevier. The attached copy is furnished to the author for internal non-commercial research and education use, including for instruction at the authors institution
and sharing with colleagues.
Other uses, including reproduction and distribution, or selling or licensing copies, or posting to personal, institutional or third party
websites are prohibited.
In most cases authors are permitted to post their version of the article (e.g. in Word or Tex form) to their personal website or institutional repository. Authors requiring further information
regarding Elsevier's archiving and manuscript policies are encouraged to visit:
http://www.elsevier.com/copyright
Gene 442 (2009) 8-17
Contents lists available at ScienceDirect
Gene
journal homepage: www.elsevier.com/locate/gene
I: 'E
The complete mitochondrial genome of Cephalothrix Simula (Iwata) (Nemertea: Palaeonemertea)
Hai-Xia Chena, Per Sundberg b, Jon L Norenburgc, Shi-Chun Sun a,*
1 Mariculture Research Laboratory, Ocean University of China, 5 Yushan Road, Qingdao 266003, China ' Department of Zoology, Gbteborg University, PO Box 463, SE-405 30 Cbteborg, Sweden Department of Invertebrate Zoology, National Museum of Natural History, Smithsonian Institution, Washington, DC 20560-0K3, USA
ARTICLE INFO
Article history: Received 3 January 2009 Received in revised form 10 April 2009 Accepted 13 April 2009 Available online 3 May 2009
Received by P. Deininger
Keywords: mtDNA Nemertean Gene order Phytogeny
ABSTRACT
The first complete mitochondrial genome sequence for a nemertean, Cephalothrix Simula, was determined by conventional and long PCR and sequencing with primer walking methods. This circular genome is 16,296 bp in size and encodes 37 genes (13 protein-coding genes, 2 ribosomal RNAs, and 22 transfer RNAs) typically found in metazoans. All genes are encoded on H-strand except two tRNAs (trnT and trnP). It differs from those reported for other metazoans, but some gene junctions are shared with those of other protostomes. Structure of the mitochondrial genome of C Simula is mostly concordant with the partial mitochondrial genome known for Cephalothrix rufifrons, but notable differences include three large indel events and transposition of 2 tRNAs. Nucleotide composition of the mitochondrial genome of C Simula is highly A+T biased. The compositional skew is strongly reflected in the codon-usage patterns and the amino acid compositions of the mitochondrial proteins. An AT-rich noncoding region with potential to form stem-loop structures may be involved in the initiation of replication or transcription. Gene adjacencies and phylogenetic analysis based on the 12 concatenated amino acid sequences (except atp8) of mitochondrial protein-coding genes show that the nemertean is close to the coelomate lophotrochozoans, rather than the acoelomate platyhelminths.
© 2009 Elsevier B.V. All rights reserved.
1. Introduction
Metazoan mitochondrial genomes, ranging in size from 14 to 18 kb, are typically circular and usually encode 37 genes including 13 protein-coding genes (coxI-3, nadl-6, nad4L, atp6, atp8 and cob), two ribosomal RNA genes (rrnL and rrnS) and 22 tRNA genes (Wolstenholme, 1992; Boore, 1999). In addition, there usually is a noncoding (AT-rich, control or D-loop) region, which may contain elements that control the replication and transcription of the genome (Wolstenholme, 1992; Shadel and Clayton, 1997). With a few exceptions, the gene content of animal mitochondrial genomes is generally conserved (Boore, 1999), but gene order is more variable (Boore and Brown, 1998; Moret et al., 2001).
Abbreviations: atp6 and atp8, genes for ATP synthase subunits 6 and 8; cob, gene for cytochrome b; coxl-3, genes for subunits I—III of cytochrome c oxidase; nadl-6 and nad4L, NADH dehydrogenase subunits 1-6 and 41; rml and rmS, genes for the large and small subunits of ribosomal RNA; rrnX, genes encoding for transfer RNA molecules with corresponding amino acids denoted by the one-letter code and codon indicated in parentheses (xxx) when necessary; DHU, dihydrouridine loop; mtDNA, mitochondrial DMA; NC, noncoding region; PCR, polymerase chain reaction; TfC, pseudouridine loop; kb, kilobase; bp, base pair; BI, Bayesian inference; ML. Maximum likelihood. Nucleotide symbol combination R = A/G, Y = C/T, W = A/T, B = G/C/T.
* Corresponding author. Tel: +86 532 82032216. E-mail address: [email protected] (S.-C. Sun).
Complete mitochondrial genomes have been characterized from a variety of metazoan phyla and used for analyzing phylogenetic relationships. To date, there are over 1240 complete mitochondrial genomes of metazoans in GenBank, mainly for Arthropoda, Mollusca, Platyhelminthes, Nematoda and Chordata. Nemerteans (phylum Nemertea) are unsegmented worms possessing an eversible probos- cis that is the synapomorphy for the taxon (Turbeville, 2002). The phylum, currently contains 1275 described species (Kajihara et al., 2008), and for a long time was considered acoelomate and closely related to platyhelminths on the basis of mainly morphological and developmental similarities (e.g., Burger, 1897-1907; Hyman, 1951; Nielsen, 1995). The argument of a coelomate position for nemerteans was supported by ultrastructural similarity between the blood vessels of nemerteans and the coelom of spiralian coelomates (Turbeville and Ruppert, 1985; Turbeville, 1986; Jespersen and Liitzen, 1988). There is an increasing number of studies using molecular information to provide increasingly refined estimates of within-phylum phylogenetic relationships of nemerteans (e.g., Envall and Sundberg, 1998; Sundberg and Saur, 1998; Thollesson and Norenburg, 2003; Sundberg et al., 2003; Strand and Sundberg, 2005; Sundberg and Strand, 2007). Few studies have addressed the position of phylum Nemertea among metazoans. Whereas none have supported a platyhelminth + nemertea clade; recent molecular ana- lyses consistently place Nemertea within the coelomate Lophotro-
0378-1119/$ - see front matter« doi:10.1016/j.gene.2009.04.015
2009 Elsevier B.V. All rights reserved.
H.-X. Chen et al. I Gene 442 (2009) 8-17
chozoa, but at various positions—as sister to mollusks, brachiopods, entoprocts, etc. (e.g., Giribet et al., 2004; Turbeville and Smith, 2007; Struck et al., 2007; Bourlat et al., 2008; Dunn et al., 2008; Struck and Fisse, 2008). These findings have not been tested with nucleotide data and gene-order information from whole mitochondrial genome sequences. Turbeville and Smith (2007) published a continuous 10.1 kb fragment sequence for the palaeonemertean Cephalothrix rufifrons, and here we report for the first time a complete mitochon- drial genome for a nemertean, Cephalothrix Simula (Iwata, 1952). We present the genome structure, gene arrangement, nucleotide compo- sition, and codon usage and use this information to assess the phylogenetic position of Nemertea within the lophotrochozoans.
2. Materials and methods
2.1. Samples, mtDNA extraction, PCR amplification, cloning and sequencing
C. Simula was collected from the littoral zone in Qingdao, China, in December 2006. Genomic DNA was extracted from a single individual by a standard phenol-chloroform protocol (Sambrook and Russell, 2001). The complete mitochondrial genome sequence was obtained using a PCR-based strategy involving a combination of conventional PCR and long PCR to amplify overlapping mt genome fragments.
Initially, the small fraction rrnL-nadl, and the partial coxl and cox3 genes were amplified using universal primers (see Table 1). The PCR products were cloned and sequenced. The sequence data in conjunction with the genomes published for some metazoans were used to design taxon-specific PCR primers {nadl-nad4L, cox3-nad3, coxl-cox2, Table 1). Then the determined sequences were used to design three additional PCR primer pairs (Table 1) bridging the gaps between nad4L-cox3, nad3-coxl and cox2-rrnL. Fragments of 3 kb or less were amplified by conventional PCR and fragments greater than 3 kb were amplified by long PCR. The complete genome was amplified in nine overlapping fragments that were pieced together, annotated and analyzed.
Table 1 PCR primers used to amplify the complete mitochondrial genome of Cephalothrix Simula.
Primer name Sequence (5'—»3') References
Universal PCR primers rrnL-nadl
16SarL CGCCTGTTTATCAAAAACAT Palumbi, 1996 nadlR CCTGATACTAATTCAGATTCTCCTTC Boore, 2006
LCO-1490 GGTCAACAAATCATAAAGATATTGG Folmer et al., 1994 HCO-2198 TAAACTTCAGGGTGACCAAAAAATCA Folmer et al., 1994
cox3 cox3F TGCGWTGAGGWATAATTTTATTTATT Turbeville and Smith, 2007 cox3R ACCAAGCAGCTGCTTCAAAACCAAA Turbeville and Smith, 2007
Specific PCR primers nadl-nad4L Psnadl_F CACTACGCTCTGTTGGGTTCA Present study Psnad4L_R GCCGTCCTACTCTTGCTTCA Present study
nad4L-cox3 Psnad4L_Flong TCGGTTATTGCGGTGGTTCT Present study Pscox3_Rlong TGGAGGAGGTCAACTACAAC Present study
cox3-nad3 Pscox3_F GTAGACGGAGGTCGTTTAGGAGGAA Present study Psnad3_R GRCCAAAGCCACAYTCAAAAGGAGA Present study
nad3-coxl Psnad3_F CAGGACCACCTCGTTTACCBTTTTC Present study PscoxLR TAATACCGCACCAGGTTGTC Present study
coxl-cox2 PscoxLF GGGGTGTAGGAACTGGATGAA Present study Pscox2_R AGTTCGGARCAYTGHCCRTA Present study
cox2-rrnL Pscox2_Flong CATCGCACTGTAGTACCTTA Present study psrrnLRlong ACGCTGTTATCCCTATGGTA Present study
Conventional PCR reactions were carried out with 16.3 ul distilled H20, 2.5 ul 10 x reaction buffer, 2 ul MgCl2 (25 mM), 2 ul dNTPs (2.5 mM), 0.5 ul each primer (10 uM), 0.20 ul rTaq DNA polymerase (Takara) and 1 ul DNA template. Thermal cycling was performed in a thermal cycler (Bio-Rad MyCycler•), programmed for an initial denaturing step of 94 °C for 5 min, followed by 35 cycles at 94 °C for 40 s, 48-55 °C (depending on the targets) for 50 s, and 72 °C for 60 s, and final extension at 72 °C for 7-10 min.
For amplifications of two large fragments (nad4L-cox3, cox2-rrnL, approximately 4 kb), a long PCR was performed. The reactions were set up containing 18.3 ul distilled H20,2.5 ul 10 x LA PCR buffer II (Mg2+
plus, Takara), 2 ul dNTPs (2.5 mM), 0.5 ul of each primer (10 uM), 0.2 ul of LA-Tag polymerase (Takara), and 1 ul DNA template. Thermal cycling was programmed for an initial denaturing step of 95 °C for 3 min, and then 35 cycles with 98 °C for 10 s, 68 °C for 6 min, and final extension at 68 °C for 10 min.
All PCR products were inspected under UV transillumination and purified with the PCR Gel extraction kit (Takara). The fragments were cloned into PMD18-T vector (Takara) and sequenced in both directions by primer walking on an ABI 3730 Sequencer (Applied Biosystems, Foster, CA, USA). Two or more single clones were sequenced for each fragment.
2.2. Sequence alignments
All sequences were checked and aligned by visual inspection using the program Bioedit v. 7.0.1 (Hall, 1999). Analysis of transfer RNAs was conducted with tRNAscan-SE (Lowe and Eddy, 1997) using inverte- brate mitochondrial genetic code. The complete rRNA genes were identified by comparison with rrnl and rrnS genes from a range of metazoans through BLAST (http://www.ncbi.nlm.nih.gov/BLAST) searches and boundaries were determined by the terminal ends of adjacent genes. Protein-coding genes were identified through BLAST and then aligned with sequences of C. rufifrons and genes available in GenBank. Positions of start and stop codons of the coding genes were identified using the invertebrate mitochondrial genetic code and amino-acid reading frames were checked. Boundaries of noncoding regions were recognized by the range of the coding genes. Final nucleotide composition and codon usage were analyzed with the program MEGA ver.3 (Kumar et al., 2004), and the mitochondrial genome was visualized using the program CG View (Stothard and Wishart, 2005).
The complete sequence of C. Simula mtDNA is deposited in GenBank (FJ594739).
2.3. Phylogenetic analysis
The phylogenetic analyses are based on the complete mt sequence of C. Simula (this study) and complete or nearly complete mitochon- drial genomes of 32 species from GenBank (Table 2). Two arthropods, Limulus polyphemus and Drosophila yakuba, were used as outgroup. Gene atp8 was excluded from the analysis as most species of Platyhel- minthes, Acanthocephala, Rotifera and some species from the phylum Mollusca lack the gene. The nucleotides of 12 protein-coding genes were translated into amino acids using the invertebrate mitochondrial genetic code, and the translated amino acid sequences were aligned using the default parameters of CLUSTAL X version 1.83 (Thompson et al., 1997). Alignment ambiguities and gaps were excluded from phylogenetic analysis using GBLOCKS version 0.91b (Castresana, 2000) with default parameters. Finally, subsets of different genes for the same set of species were concatenated.
Phylogeny was estimated using Bayesian inference (BI; Huelsen- beck and Ronquist, 2001) and maximum likelihood (ML; Felsenstein, 1981). The best-fit models of amino acid substitutions were selected using ProtTest version 1.2.7 (Abascal et al., 2005). The Akaike Information Criterion was used to determine mtREV-t-G + l as the
10 H.-X. Chen et al. I Gene 442 (2009) 8-17
Table 2 List of the species whose mitochondria! genome sequences were used in the molecular phylogenetic analyses.
Species Abbreviation used in Fig. 5 Accession number
Mollusca Elysia chlorotica Ec NC010567 Graptacme eborea Ge NC006162 Haliotis rubra Hr NC005940 Katharina tunicata Kt NC001636 Loligo bleekeri Lb NC002507 Lampsilis ornata Lo NC005335 Mytilus edulis Me NC006161 Octopus vulgaris Ov NC006353 Siphonodentahum lobatum SI NC005840
Nemertea Cephalothrix Simula Cs This study
Ectoprocta Bugula neritina Bn NC010197 Flustrellidra hispida Fh NC008192
Entoprocta Loxocorone allax Lai NC010431 Loxosomella aloxiata La2 NC010432
Brachiopoda Laqueus rubellus Lr NC002322 Terebratalia transversa Tt NC003086 Terebratulina retusa Tr NC000941
Phoronida Phoronis psammophila Pp AY_368231
Annelida Clymenella torquata Ct NC006321 Lumbricus terrestris Ltl NC001673 Nephtys sp. Ns NC010559 Perionyx excavatus Pe NC009631 Platynereis dumerilii Pd NC000931 Orbinia latreillii 01 NC007933
Echiura Urechis caupo Uc NC006379
Platyhelminthes Echinococcus multilocularis Em NC000928 Fasciola hepatica Fh NC002546 Hymenolepis diminuta Hd NC002767 Schistosoma mekongi Sm NC002529 Taenia crassiceps Tc NC002547
Acanthocephala Leptorhynchoides thecatus Lt2 NC006892
Rotifera Brachionus plicatilis Bp NC010484
Arthropoda Limulus polyphemus NC003057 Drosophila yakuba NC001322
most appropriate substitution model, with a gamma shape (4 rate categories) parameter of y = 0.769 and a proportion of invariable sites of 0.095. These parameters were then used for BI and ML phylogenetic reconstructions. BI analysis was performed in MrBayes version 3.0b4 (Huelsenbeck and Ronquist, 2001; Ronquist and Huelsenbeck, 2003) with four (three hot, one cold) Markov chains. The Monte Carlo Markov chain (MCMC) length was 1,000,000 gene- rations with sampling every 100th generation chain. Burnin was set to 50% leaving the last 5000 sampled trees for estimating posterior probabilities (Bayesian support values, PPs). ML analysis was performed with the program PhyML (Guindon and Gascuel, 2003). Bootstrap values were determined from 1000 replicates. For phylo- genetic analysis of gene arrangements, a matrix of 74 characters corresponding to upstream and downstream position of 37 genes typical for bilaterian mtDNA, was constructed using the multiple encoding method (MPME, maximum parsimony of multiple encodings) of Wang et al. (2002, see Lavrov and Lang, 2005; Turbeville and Smith, 2007). The gene adjacency matrix was cons- tructed by hand with the matrix-editing functions of Mesquite v.2.5 (Maddison and Maddison, 2008). Missing gene boundaries for some species were treated as missing data. This matrix was sub- sequently used in PAUP 4.0 BetalO (Swofford, 2002) for maximum
parsimony and bootstrap (1000 replicates) analyses using a heuristic search with TBR branch swapping.
3. Results and discussion
3.1. Genome organization and structure
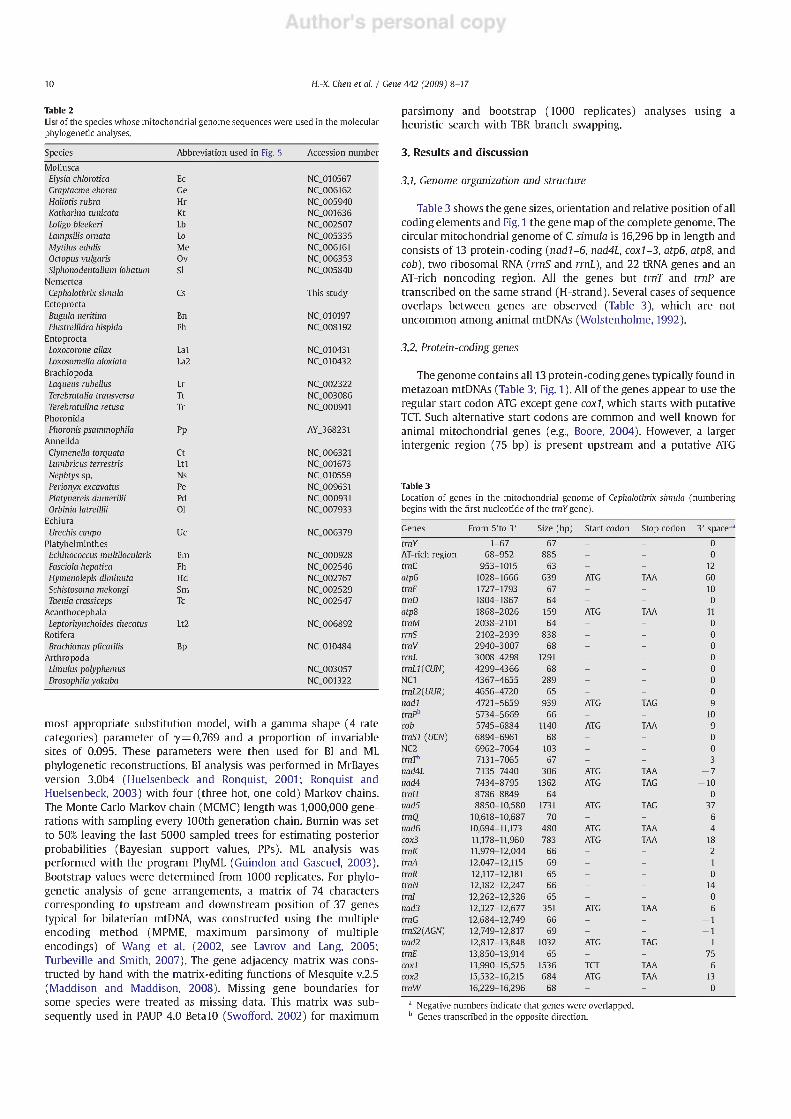
Table 3 shows the gene sizes, orientation and relative position of all coding elements and Fig. 1 the gene map of the complete genome. The circular mitochondrial genome of C. Simula is 16,296 bp in length and consists of 13 protein-coding (nadl-6, nad4L, coxl-3, atp6, atp8, and cob), two ribosomal RNA (rmS and rrnL), and 22 tRNA genes and an AT-rich noncoding region. All the genes but trnT and trnP are transcribed on the same strand (H-strand). Several cases of sequence overlaps between genes are observed (Table 3), which are not uncommon among animal mtDNAs (Wolstenholme, 1992).
3.2. Protein-coding genes
The genome contains all 13 protein-coding genes typically found in metazoan mtDNAs (Table 3; Fig. 1). All of the genes appear to use the regular start codon ATG except gene cox), which starts with putative TOT. Such alternative start codons are common and well known for animal mitochondrial genes (e.g., Boore, 2004). However, a larger intergenic region (75 bp) is present upstream and a putative ATG
Table 3 Location of genes in the mitochondrial genome of Cephalothrix Simula (numbering begins with the first nucleotide of the trnVgene).
Genes From 5'to 3' Size (bp) Start codon Stop codon 3' spacer3
rrnV 1-67 67 - - 0 AT-rich region 68-952 885 - - 0 rrnC 953-1015 63 - - 12 atp6 1028-1666 639 ATG TAA 60 trnF 1727-1793 67 - - 10 trnD 1804-1867 64 - - 0 atp8 1868-2026 159 ATG TAA 11 trnM 2038-2101 64 - - 0 rmS 2102-2939 838 - - 0 trnV 2940-3007 68 - - 0 vml 3008-4298 1291 - - 0 tmU{CUN) 4299-4366 68 - - 0 NCI 4367-4655 289 - - 0 tmL2{WR) 4656-4720 65 - - 0 nadl 4721-5659 939 ATG TAG 9 rrnJ* 5734-5669 66 - - 10 cob 5745-6884 1140 ATG TAA 9 trnSJ (UCN) 6894-6961 68 - - 0 NC2 6962-7064 103 - - 0 0717* 7131-7065 67 - - 3 nad4L 7135-7440 306 ATG TAA -7 nad4 7434-8795 1362 ATG TAG -10 trnH 8786-8849 64 - - 0 nad5 8850-10,580 1731 ATG TAG 37 trnQ 10,618-10,687 70 - - 6 nad6 10,694-11,173 480 ATG TAA 4 cox3 11,178-11.960 783 ATG TAA 18 trnK 11.979-12,044 66 - - 2 trnA 12,047-12,115 69 - - 1 trnR 12,117-12,181 65 - - 0 trnN 12,182-12,247 66 - - 14 trnl 12,262-12,326 65 - - 0 nad3 12,327-12,677 351 ATG TAA 6 trnG 12,684-12,749 66 - - -1 trnS2(AGN) 12.749-12,817 69 - - -1 nadl 12.817-13,848 1032 ATG TAG 1 trnE 13,850-13,914 65 - - 75 coxl 13,990-15,525 1536 TCT TAA 6 cox2 15,532-16,215 684 ATG TAA 13 tmW 16,229-16,296 68 - - 0
Negative numbers indicate that genes were overlapped. Genes transcribed in the opposite direction.
H.-X. Chen et al. I Gene 442 (2009) 8-17
„„2 trnWImV ST.nch
/ /*»6
Table 4 Base compositions of the mitochondria! genome of Cephalothrix Simula.
Fig. 1. Circular representation of the mtDNA of Cephalothrix Simula. Genes on the outer (H) strand are transcribed clockwise; those on the inner (L) strand are transcribed counter-clockwise. Transfer RNA genes are designated by the one-letter amino acid code for the corresponding amino acids; trnLl, trnL2, trnSl, and trnS2 differentiated on the basis of their codons CUN, UUR, UCN, and AGN, respectively. Three large noncoding regions are represented in grey. The other small noncoding regions are not marked.
starting site is in the frame (70 bp upstream in cox/), which would make the gene longer than those of C. rufifrons and other metazoans. We cannot rule out that this is used as a start site. Nine of the 13 genes are believed to use TAA as the stop codon, while the others (nadl, nad2, nad.4, and nad5) end with TAG (Table 3).
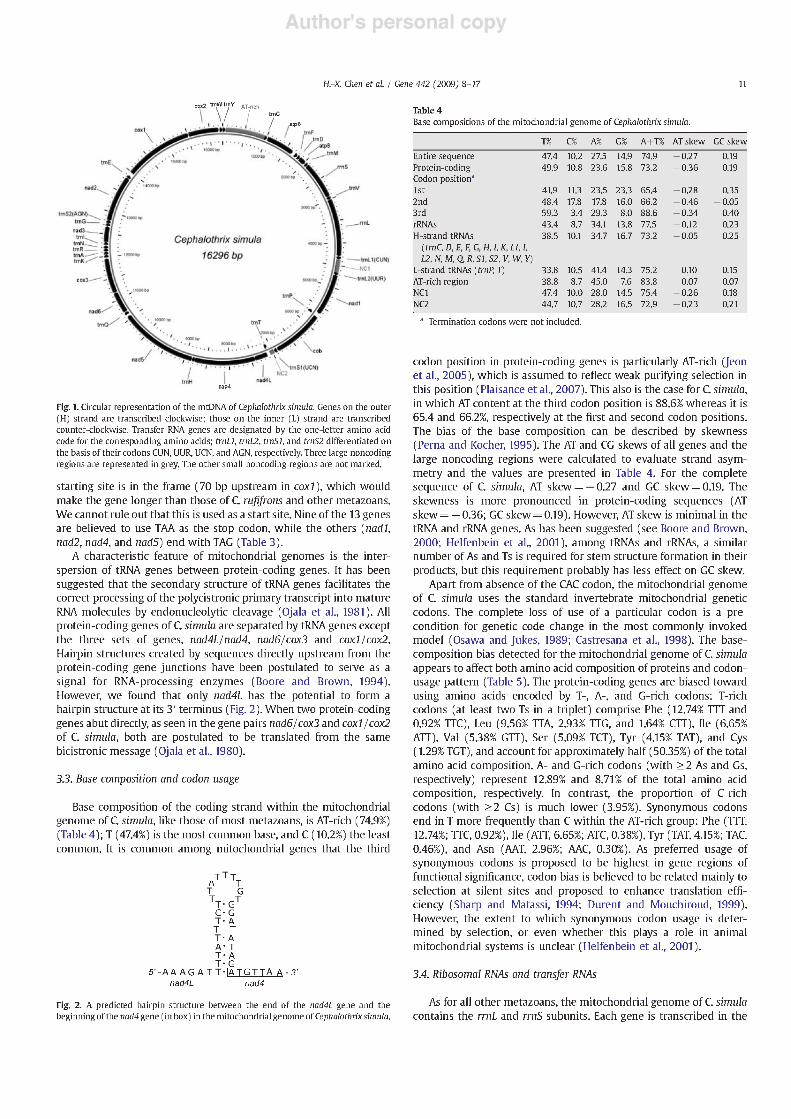
A characteristic feature of mitochondrial genomes is the inter- spersion of tRNA genes between protein-coding genes. It has been suggested that the secondary structure of tRNA genes facilitates the correct processing of the polycistronic primary transcript into mature RNA molecules by endonucleolytic cleavage (Ojala et al., 1981). All protein-coding genes of C. Simula are separated by tRNA genes except the three sets of genes, nad4L/nad4, nad6/cox3 and coxl/cox2. Hairpin structures created by sequences directly upstream from the protein-coding gene junctions have been postulated to serve as a signal for RNA-processing enzymes (Boore and Brown, 1994). However, we found that only nad4L has the potential to form a hairpin structure at its 3' terminus (Fig. 2). When two protein-coding genes abut directly, as seen in the gene pairs nad6/cox3 and coxl/cox2 of C. Simula, both are postulated to be translated from the same bicistronic message (Ojala et al., 1980).
3.3. Base composition and codon usage
Base composition of the coding strand within the mitochondrial genome of C Simula, like those of most metazoans, is AT-rich (74.9%) (Table 4); T (47.4%) is the most common base, and C (10.2%) the least common. It is common among mitochondrial genes that the third
TTT
T-A T-G
5'-AA AG ATT-IATGTTA AI-3' nad4L nad4
Fig. 2. A predicted hairpin structure between the end of the nad4L gene and the beginning of the nad4 gene (in box) in the mitochondrial genome of Cephalothrix Simula.
T% C% A% G% A+T% AT skew GC skew
Entire sequence 47.4 10.2 27.5 14.9 74.9 -0.27 0.19 Protein-coding 49.9 10.8 23.6 15.8 73.2 -0.36 0.19 Codon position3
1st 41.9 11.3 23.5 23.3 65.4 -0.28 0.35 2nd 48.4 17.8 17.8 16.0 66.2 -0.46 -0.05 3rd 59.3 3.4 29.3 8.0 88.6 -0.34 0.40 rRNAs 43.4 8.7 34.1 13.8 77.5 -0.12 0.23 H-strand tRNAs 38.5 10.1 34.7 16.7 73.2 -0.05 0.25
{trnC,D,E,F,G,H,l,K,LU, 12. N, M. Q, R. SI S2. V, W. Y)
L-strand tRNAs (rrnP, T) 33.8 10.5 41.4 14.3 75.2 0.10 0.15 AT-rich region 388 8.7 45.0 7.6 83.8 0.07 -0.07 NCI 47.4 10.0 28.0 14.5 75.4 -0.26 0.18 NC2 44.7 10.7 282 16.5 72.9 -0.23 0.21
Termination codons were not included.
codon position in protein-coding genes is particularly AT-rich (Jeon et al., 2005), which is assumed to reflect weak purifying selection in this position (Plaisance et al., 2007). This also is the case for C. Simula, in which AT content at the third codon position is 88.6% whereas it is 65.4 and 66.2%, respectively at the first and second codon positions. The bias of the base composition can be described by skewness (Perna and Kocher, 1995). The AT and CG skews of all genes and the large noncoding regions were calculated to evaluate strand asym- metry and the values are presented in Table 4. For the complete sequence of C. Simula, AT skew = — 0.27 and GC skew = 0.19. The skewness is more pronounced in protein-coding sequences (AT skew = — 0.36; GC skew = 0.19). However, AT skew is minimal in the tRNA and rRNA genes. As has been suggested (see Boore and Brown, 2000; Helfenbein et al., 2001), among tRNAs and rRNAs, a similar number of As and Ts is required for stem structure formation in their products, but this requirement probably has less effect on GC skew.
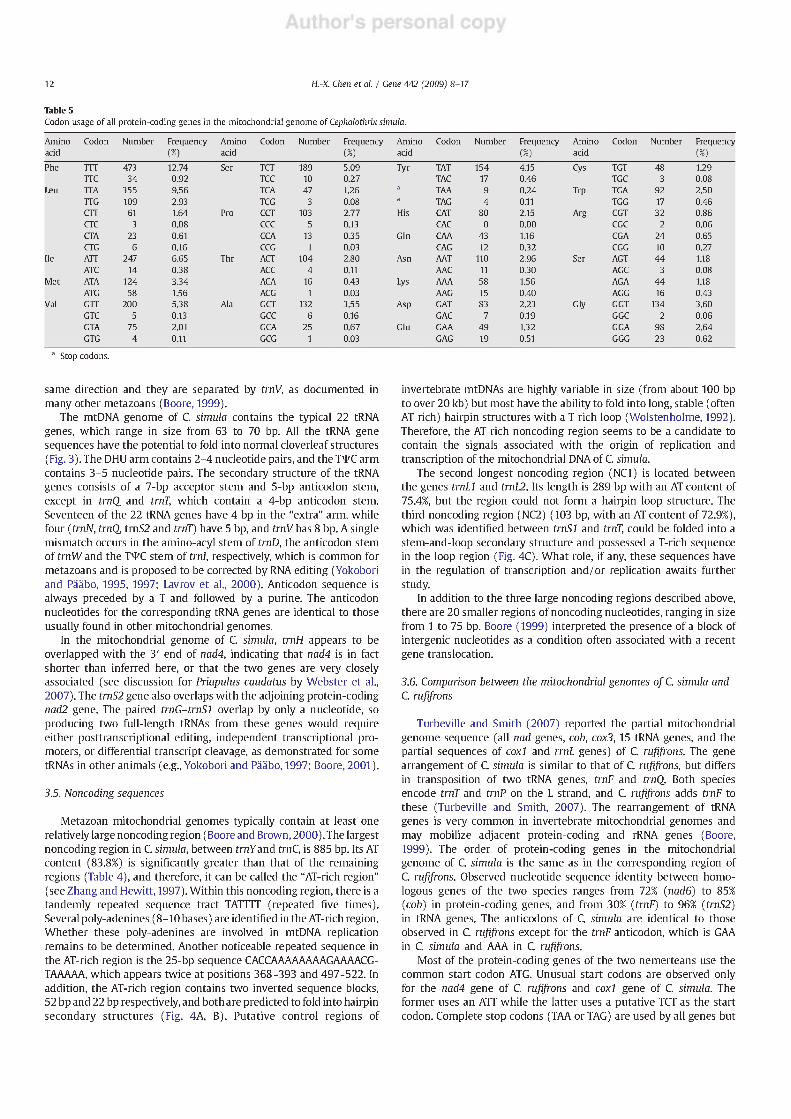
Apart from absence of the CAC codon, the mitochondrial genome of C. Simula uses the standard invertebrate mitochondrial genetic codons. The complete loss of use of a particular codon is a pre- condition for genetic code change in the most commonly invoked model (Osawa and Jukes, 1989; Castresana et al., 1998). The base- composition bias detected for the mitochondrial genome of C. Simula appears to affect both amino acid composition of proteins and codon- usage pattern (Table 5). The protein-coding genes are biased toward using amino acids encoded by T-, A-, and G-rich codons: T-rich codons (at least two Ts in a triplet) comprise Phe (12.74% 111 and 0.92% TTC), Leu (9.56% TTA, 2.93% TTG, and 1.64% CTT), He (6.65% ATT), Val (5.38% CTT), Ser (5.09% TCT), Tyr (4.15% TAT), and Cys (1.29% TCT), and account for approximately half (50.35%) of the total amino acid composition. A- and G-rich codons (with >2 As and Gs, respectively) represent 12.89% and 8.71% of the total amino acid composition, respectively. In contrast, the proportion of C-rich codons (with >2 Cs) is much lower (3.95%). Synonymous codons end in T more frequently than C within the AT-rich group: Phe (111, 12.74%; TTC, 0.92%), He (ATT, 6.65%; ATC, 0.38%), Tyr (TAT, 4.15%; TAC, 0.46%), and Asn (AAT, 2.96%; AAC, 0.30%). As preferred usage of synonymous codons is proposed to be highest in gene regions of functional significance, codon bias is believed to be related mainly to selection at silent sites and proposed to enhance translation effi- ciency (Sharp and Matassi, 1994; Durent and Mouchiroud, 1999). However, the extent to which synonymous codon usage is deter- mined by selection, or even whether this plays a role in animal mitochondrial systems is unclear (Helfenbein et al., 2001).
3.4. Ribosomal RNAs and transfer RNAs
As for all other metazoans, the mitochondrial genome of C. Simula contains the rrnL and rrnS subunits. Each gene is transcribed in the
12 H.-X. Chen et al. I Gene 442 (2009) 8-17
Table 5 Codon usage of all protein-coding genes in the mitochondria! genome of Cephalothrix Simula.
Amino Codon Number Frequency Amino Codon Number Frequency Amino Codon Number Frequency Amino Codon Number Frequency acid (%) acid (%) acid (%) acid (%) Phe TTT 473 12.74 Ser TCT 189 5.09 Tyr TAT 154 4.15 Cys TCT 48 1.29
TTC 34 0.92 TCC 10 0.27 TAC 17 0.46 TCC 3 0.08 Leu TTA 355 9.56 TCA 47 1.26
a TAA 9 0.24 Trp TCA 92 2.50
TTC 109 2.93 TCC 3 0.08 a
TAG 4 0.11 TCC 17 0.46 CTT 61 1.64 Pro CCT 103 2.77 His CAT 80 2.15 Arg CCT 32 0.86 CTC 3 0.08 CCC 5 0.13 CAC 0 0.00 CCC 2 0.06 CTA 23 0.61 CCA 13 0.35 Gin CAA 43 1.16 CCA 24 0.65 CTC 6 0.16 CCC 1 0.03 CAG 12 0.32 CCC 10 0.27
He ATT 247 6.65 Thr ACT 104 2.80 Asn AAT 110 2.96 Ser ACT 44 1.18 ATC 14 0.38 ACC 4 0.11 AAC 11 0.30 ACC 3 0.08
Met ATA 124 3.34 ACA 16 0.43 Lys AAA 58 1.56 ACA 44 1.18 ATC 58 1.56 ACC 1 0.03 AAC 15 0.40 ACC 16 0.43
Val CTT 200 5.38 Ala CCT 132 3.55 Asp GAT 83 2.23 Cly CCT 134 3.60 CTC 5 0.13 CCC 6 0.16 CAC 7 0.19 CCC 2 0.06 CTA 75 2.01 CCA 25 0.67 Glu CAA 49 1.32 CCA 98 2.64 CTC 4 0.11 CCC 1 0.03 GAG 19 0.51 GGG 23 0.62
Stop codons.
same direction and they are separated by trnV, as documented in many other metazoans (Boore, 1999).
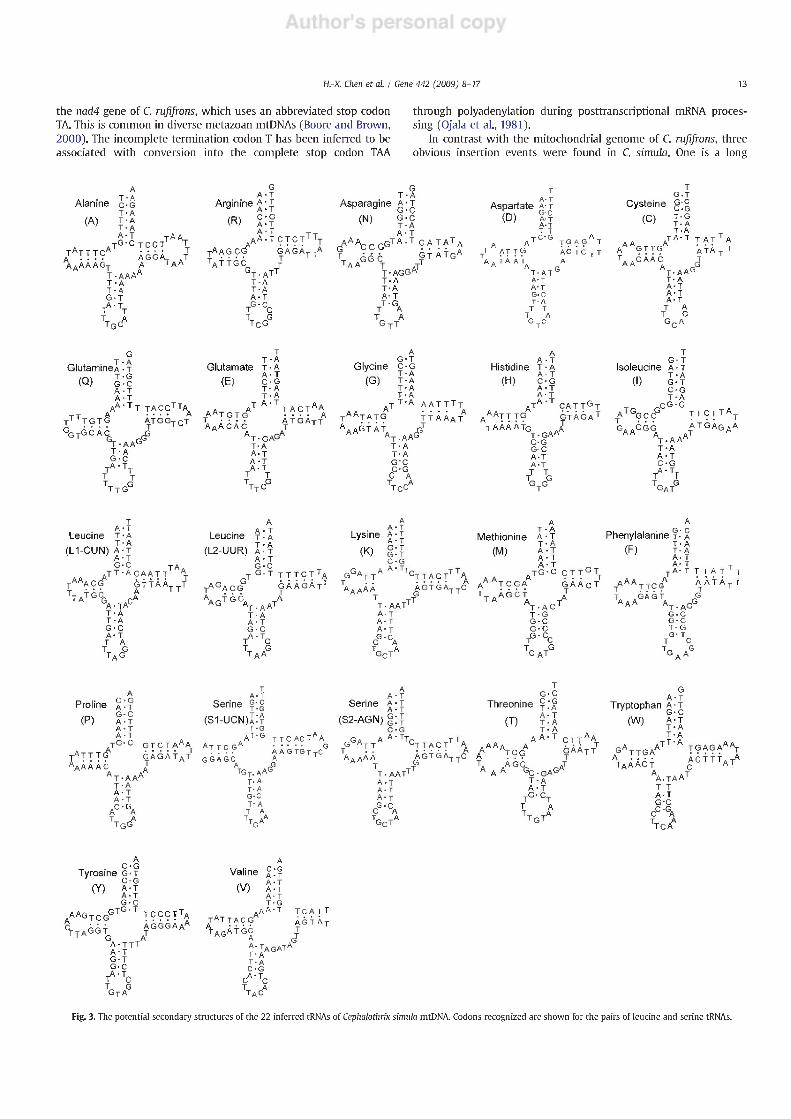
The mtDNA genome of C. Simula contains the typical 22 tRNA genes, which range in size from 63 to 70 bp. All the tRNA gene sequences have the potential to fold into normal cloverleaf structures (Fig. 3). The DHU arm contains 2-4 nucleotide pairs, and the TOC arm contains 3-5 nucleotide pairs. The secondary structure of the tRNA genes consists of a 7-bp acceptor stem and 5-bp anticodon stem, except in trnQ and tmT, which contain a 4-bp anticodon stem. Seventeen of the 22 tRNA genes have 4 bp in the "extra" arm, while four (trnN, trnQ, trnS2 and tmT) have 5 bp, and trnV has 8 bp. A single mismatch occurs in the amino-acyl stem of tmD, the anticodon stem of trnW and the T^C stem of trnl, respectively, which is common for metazoans and is proposed to be corrected by RNA editing (Yokobori and Paabo, 1995, 1997; Lavrov et al., 2000). Anticodon sequence is always preceded by a T and followed by a purine. The anticodon nucleotides for the corresponding tRNA genes are identical to those usually found in other mitochondrial genomes.
In the mitochondrial genome of 0. Simula, trnH appears to be overlapped with the 3' end of nad4, indicating that nad4 is in fact shorter than inferred here, or that the two genes are very closely associated (see discussion for Priapulus caudatus by Webster et al., 2007). The trnS2 gene also overlaps with the adjoining protein-coding nad2 gene. The paired tmC-trnSl overlap by only a nucleotide, so producing two full-length tRNAs from these genes would require either posttranscriptional editing, independent transcriptional pro- moters, or differential transcript cleavage, as demonstrated for some tRNAs in other animals (e.g., Yokobori and Paabo, 1997; Boore, 2001).
3.5. Noncoding sequences
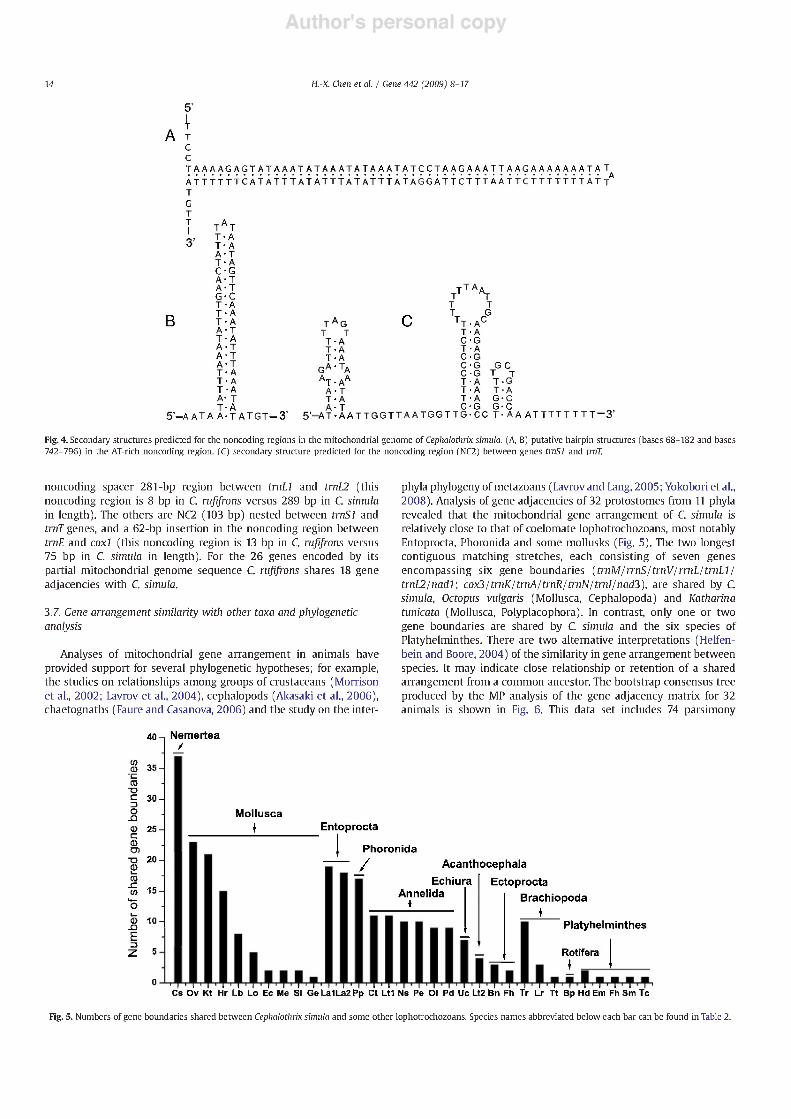
Metazoan mitochondrial genomes typically contain at least one relatively large noncoding region (Boore and Brown, 2000). The largest noncoding region in C. Simula, between trnVand tmC, is 885 bp. Its AT content (83.8%) is significantly greater than that of the remaining regions (Table 4), and therefore, it can be called the "AT-rich region" (see Zhang and Hewitt, 1997). Within this noncoding region, there is a tandemly repeated sequence tract TATTTT (repeated five times). Several poly-adenines (8-10 bases) are identified in the AT-rich region. Whether these poly-adenines are involved in mtDNA replication remains to be determined. Another noticeable repeated sequence in the AT-rich region is the 25-bp sequence CACCAAAAAAAAGAAAACG- TAAAAA, which appears twice at positions 368-393 and 497-522. In addition, the AT-rich region contains two inverted sequence blocks, 52 bp and 22 bp respectively, and both are predicted to fold into hairpin secondary structures (Fig. 4A, B). Putative control regions of
invertebrate mtDNAs are highly variable in size (from about 100 bp to over 20 kb) but most have the ability to fold into long, stable (often AT-rich) hairpin structures with a T-rich loop (Wolstenholme, 1992). Therefore, the AT-rich noncoding region seems to be a candidate to contain the signals associated with the origin of replication and transcription of the mitochondrial DNA of C. Simula.
The second longest noncoding region (NCI) is located between the genes tmLl and frnL2. Its length is 289 bp with an AT content of 75.4%, but the region could not form a hairpin loop structure. The third noncoding region (NC2) (103 bp, with an AT content of 72.9%), which was identified between trnSl and tmT, could be folded into a stem-and-loop secondary structure and possessed a T-rich sequence in the loop region (Fig. 4C). What role, if any, these sequences have in the regulation of transcription and/or replication awaits further study.
In addition to the three large noncoding regions described above, there are 20 smaller regions of noncoding nucleotides, ranging in size from 1 to 75 bp. Boore (1999) interpreted the presence of a block of intergenic nucleotides as a condition often associated with a recent gene translation.
3.6. Comparison between the mitochondrial genomes of C. Simula and C. rufifrons
Turbeville and Smith (2007) reported the partial mitochondrial genome sequence (all nad genes, cob, cox3, 15 tRNA genes, and the partial sequences of coxl and rmL genes) of C. rufifrons. The gene arrangement of C. Simula is similar to that of C. rufifrons, but differs in transposition of two tRNA genes, tmF and trnQ. Both species encode tmT and trnP on the L strand, and C. rufifrons adds tmF to these (Turbeville and Smith, 2007). The rearrangement of tRNA genes is very common in invertebrate mitochondrial genomes and may mobilize adjacent protein-coding and rRNA genes (Boore, 1999). The order of protein-coding genes in the mitochondrial genome of C. Simula is the same as in the corresponding region of C. rufifrons. Observed nucleotide sequence identity between homo- logous genes of the two species ranges from 72% (nad6) to 85% (cob) in protein-coding genes, and from 30% (tmF) to 96% (trnS2) in tRNA genes. The anticodons of C. Simula are identical to those observed in C. rufifrons except for the tmF anticodon, which is CAA in 0. Simula and AAA in C. rufifrons.
Most of the protein-coding genes of the two nemerteans use the common start codon ATC. Unusual start codons are observed only for the nad4 gene of C. rufifrons and coxl gene of C. Simula. The former uses an ATT while the latter uses a putative TCT as the start codon. Complete stop codons (TAA or TAG) are used by all genes but
H.-X. Chen et al. I Gene 442 (2009) 8-17 13
the nad4 gene of C. rufifrons, which uses an abbreviated stop codon TA. This is common in diverse metazoan mtDNAs (Boore and Brown, 2000). The incomplete termination codon T has been inferred to be
through polyadenylation during posttranscriptional mRNA proces- sing (Ojala et al., 1981).
In contrast with the mitochondrial genome of C. rufifrons, three associated with conversion into the complete stop codon TAA obvious insertion events were found in C. Simula. One is a long
TAAT TCCT T
A ., T-A Alanine C-G
T-A
A-T
.TG'C
ATATTT9A A6GAT AAAAAGT A TAA
T-AAAA
T-A T-A G-T
/'\ TTGCA
G A-T
Argmine A; T
(R) fci A-T TT
AA'TCTCTTTT
AAGCG^
GT-ATT
T -A T-A A-T
TG-CC
GAGATTA
T-A Asparagine A-T
(N) G-C G-C T-A A-T
TAA1
^CCGGTA'T9ATATA
IGGC GTATGA
TT-AGGAT
T-A T-A A-T T-G.
T A T„ A
GTT
A-T Aspartate AT
<D> !':T T T
A A1
T AT T G
AATAAVA
TAT A-T A- T G-C T-A
T T T A GTC
A T<3 AS T
AC TC TT A
G
T G.T
Cysteine g;| T-G T-A T-A
TA-T
(C)
AAAGTTGA
T A A
ATA ,CAAC
A AA& T-
T- A-T A-T A-T
T A T G
GlutamineA
(Q) G A A .A
G T-A
T
AA"TT TACCTTA
TTTTGTe G
GTGCAC
T G
TTTGG
ATGGTCT
• AA<^ •A c
Glutamate
(E)
TSTG* AA T AAACAC
A-T A-T
T T
V
TACT**
ATGATT
GAG* A T
Glycine
(G)
A A
AA^
A1
T ATG
V.AA£ T-A T-A G'C C-G
C A T „A TCC
AATTTT
TTAAAT
Histidine
(H)
AATTTGA
JAAAATQ T.GAA
C-G G-C A-T A-T T T
VG
CATTGT
GTAGAT
A
Isoleucine
TG,
T G-T A-T T-A G-T C-G T-A
.CG-C
GCC TTCTTA
,CGG ATGAGAA
-AAn
T-A A-T C-G
W
T A-T
Leucine T • A
(L1-CUN) A-T A-T G-C
JT-A CA AA AC <?'
'TATGCG
TA" A A C T A
GT A
„A
ATT TAA..
^A T
TT
Leucine
(L2-UUR)
/ G
'ACG
AG1
^T-AAT T-A A-T G-C
ATC TTAAG
TTT_CTTA
GAAGAj7
T A
Lysine
(K)
-,GA A
A A-T A-T A-T G-T G-T C-G A • TTr
^A A T
T A A
Methionine
(M)
AGTGA- G '
AAT1
AA ATCGA
T AGCT T A A
T G G
A T-A A-T T-A A- T A- T A-T
JG-C
Phenylalanine T
(F)
rG\ GAAcT
/
T°-CC TCAT°
TAAATT?GA
TA .GAGT AAA A
A AT A. T
AG c c c c G
,A
Proline
(P)
TATTT^ A
AAAAC
A C-G A-T G-C A-T
GTCT AAA,
CAGATjT
A A A' A T
A- T .C-G, A A T A
TGG
T A-T
Serine G;g
(SI-UCN)I:^ T-G
ATG
GGAGC
TTC ACT" A
AAGTGTTC A '
iAG
T-A T- A G-C T- A
T A TT,AA
A A-T
Serine A-T
(S2-AGN) S:J C-G
-GA A 3 AT T
^AAAA T
T A A
A'\TACTTTA
AAT 1
AGTGA- G T
TT
Threonine
(T)
,AA AT CG
AGC A G,
Tryptophan A
(W)
T-A
G-'
GAATT T J
TGr
rT GATTRAATT"A TGAGAAAr
ACTTTATA TTGA
"TAAAC T A
A T A G
TAA
T T
•C
CC"GA TTCAA
A
Tyrosine G-T
(Y) A^T A-T
AASTCGGT§-T
S-TAGGT
TCCCTTA
AGGGAAA
G A A-TTT A-T G-T G-C
ATc TGTAG
Valine
(V)
A C-G A- T
TATTACG ATAGAiGC
A A A T
.AA
A-TAGATA
T-A T-A C-G
\ACA
TC ATT
AGT AT
i
Fig. 3. The potential secondary structures of the 22 inferred tRNAs of Cephalothrix Simula mtDNA. Codons recognized are shown for the pairs of leucine and serine tRNAs.
14 H.-X. Chen et al. I Gene 442 (2009) 8-17
5!
I
ATT C C TAAAAGAGTATAAATATAAATATAAATATCCTAAGAAATTAAGAAAAAAATAT
ATTtTTTCAtATTTATAttTATATTTATAGGATtcTTtAAtTctTTTTTTATT T G
j TAT i. T-A j T-A
B A-T T-A A-T
rTA T T T
\ T G
Tf T T T T
GA'
T A A A TA A
A- A- T- T-A "T-A" T-A A-T A-T T-A
5'_AATA A-TATGT-3' 5-AT-AATTGGTTAATGGTTG-CC f-AAATTTTTTTT-3'
GC T T T-G T-A G-C G-C
Fig. 4. Secondary structures predicted for the noncoding regions in the mitochondrial genome of Cephalothrix Simula. (A, B) putative hairpin structures (bases 68-182 and bases 742-796) in the AT-rich noncoding region. (C) secondary structure predicted for the noncoding region (NC2) between genes rrnSl and trnT.
noncoding spacer 281 bp region between frnLI and tmL2 (this noncoding region is 8 bp in C. rufifrons versus 289 bp in C. Simula in length). The others are NC2 (103 bp) nested between tmSl and trnT genes, and a 62-bp insertion in the noncoding region between tmE and cox I (this noncoding region is 13 bp in C. rufifrons versus 75 bp in C. Simula in length). For the 26 genes encoded by its partial mitochondrial genome sequence C. rufifrons shares 18 gene adjacencies with C. Simula.
3.7. Gene arrangement similarity with other taxa and phylogenetic analysis
Analyses of mitochondrial gene arrangement in animals have provided support for several phylogenetic hypotheses; for example, the studies on relationships among groups of crustaceans (Morrison et al., 2002; Lavrov et al., 2004), cephalopods (Akasaki et al., 2006), chaetognaths (Faure and Casanova, 2006) and the study on the inter-
phyla phylogeny of metazoans (Lavrov and Lang, 2005; Yokobori et al., 2008). Analysis of gene adjacencies of 32 protostomes from 11 phyla revealed that the mitochondrial gene arrangement of C. Simula is relatively close to that of coelomate lophotrochozoans, most notably Entoprocta, Phoronida and some mollusks (Fig. 5). The two longest contiguous matching stretches, each consisting of seven genes encompassing six gene boundaries (trnM/rrnS/trnV/rrnL/trnLl/ trnUlnadl; cox3/trnK/trnA/trnR/trnN/trnI/nad3), are shared by C. Simula, Octopus vulgaris (Mollusca, Cephalopoda) and Katharina tunicata (Mollusca, Polyplacophora). In contrast, only one or two gene boundaries are shared by C. Simula and the six species of Platyhelminthes. There are two alternative interpretations (Helfen- bein and Boore, 2004) of the similarity in gene arrangement between species. It may indicate close relationship or retention of a shared arrangement from a common ancestor. The bootstrap consensus tree produced by the MP analysis of the gene adjacency matrix for 32 animals is shown in Fig. 6. This data set includes 74 parsimony
40
56 ->c 0) 35
m
C 30
o _Q
CU 25 C CD o>
T3 20 E TO is is
QJ 10-
Ncrncrtca
Mollusca t Entoprocta
I****
Phoronida
/ Acanthocephala
Echiura Annelida
t
Ectoprocta
Brachiopoda t
Platyhelminthes
I— I Rotifera
lllll,,!^^ Cs Ov Kt Hr Lb Lo Ec Me SI GeLa1La2 Pp Ct Lt1 Ns Pe Ol Pd Uc Lt2 Bn Fh Tr Lr Tt Bp Hd Em Fh Sm Tc
Fig. 5. Numbers of gene boundaries shared between Cephalothrix Simula and some other lophotrochozoans. Species names abbreviated below each bar can be found in Table 2.
H.-X. Chen et al. I Gene 442 (2009) 8-17 15
51
Schistosoma mekongi
Hymenolepis diminuta
Taenia crassiceps Fascioia hepatica
Echinococcus multilocularis Urechis caupo
471— Clymenella torquata '—Lumbricus terrestis
air-Nephtyssp. I— Orbinia latreiilii
HI—Perionyx excavalus
Platyheriinthes
| Echiura
Annelida
Platynereis dumerilli Bugula neritina
Flustrellidra hispida Elysia chlorotica
Ectoprocta
I Mollusca Leptortiynchoides thecatus I Acanthoeephala
CLaqueus rubellus L .. I , , .. , Brachiopoda Terebratalia transversa I
Brachbnus piicatiiis | Rotilera
Mytilus edulis
Lampsilis omata
Siphonodentalium lobatum
Graptacme eborea
Terebratulina retusa
Loiigo bieekeri
Haliotis rubra
Kattianna tvnicata
Octopus vulgaris
— Cephdothrix Simula
i—Loxocorene allax
'—Loxosomella aloxiata
—Phoronis psammophila
I— Limulus polyphemus
'— Drosaphila yakuba
JJ|-
Molljsca
I Brachiopoda
Mollusca
| Nemertea
| Entoprocta
I Phoronida
Arthropoda
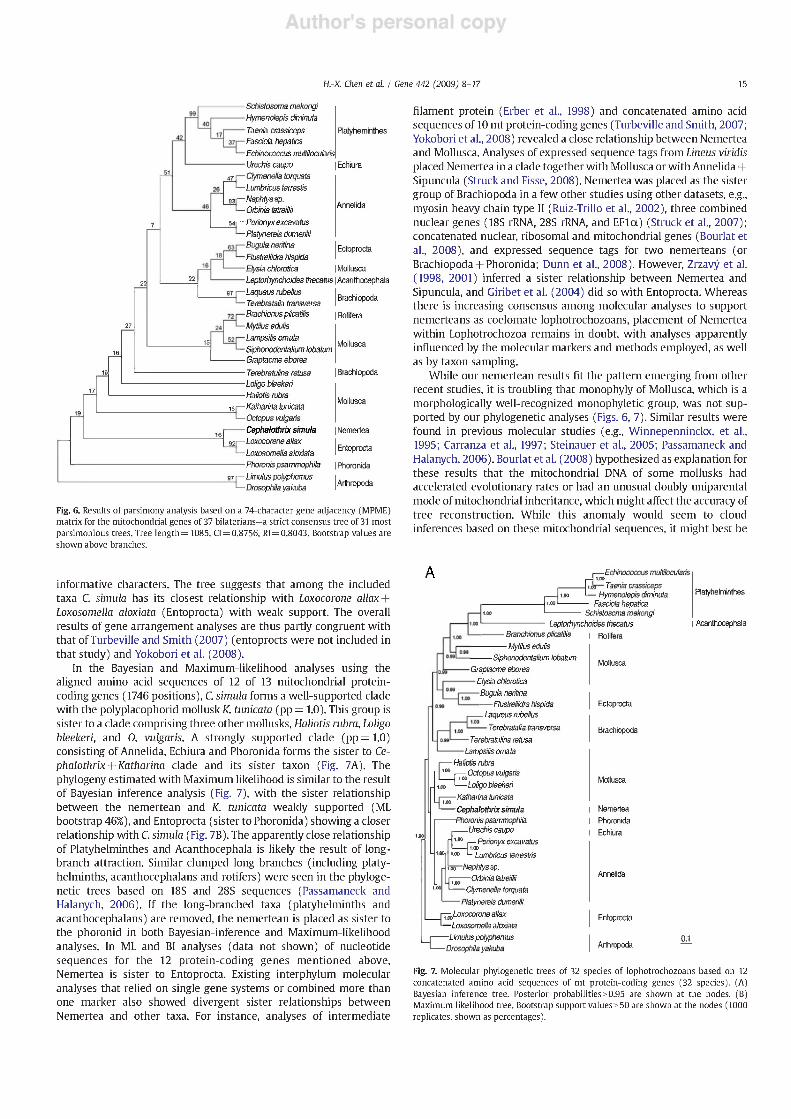
Fig. 6. Results of parsimony analysis based on a 74-character gene adjacency (MPME) matrix for the mitochondrial genes of 37 bilaterians—a strict consensus tree of 31 most parsimonious trees. Tree length = 1085. 0 = 0.8756, Rl = 0.8043. Bootstrap values are shown above branches.
filament protein (Erber et al., 1998) and concatenated amino acid sequences of 10 mt protein-coding genes (Turbeville and Smith, 2007; Yokobori et al., 2008) revealed a close relationship between Nemertea and Mollusca. Analyses of expressed sequence tags from Lineus viridis placed Nemertea in a clade together with Mollusca or with Annelida + Sipuncula (Struck and Fisse, 2008). Nemertea was placed as the sister group of Brachiopoda in a few other studies using other datasets, e.g., myosin heavy chain type II (Ruiz-Trillo et al., 2002), three combined nuclear genes (18S rRNA, 28S rRNA, and EFla) (Struck et al., 2007); concatenated nuclear, ribosomal and mitochondrial genes (Bourlat et al., 2008), and expressed sequence tags for two nemerteans (or Brachiopoda + Phoronida; Dunn et al., 2008). However, Zrzavy et al. (1998, 2001) inferred a sister relationship between Nemertea and Sipuncula, and Giribet et al. (2004) did so with Entoprocta. Whereas there is increasing consensus among molecular analyses to support nemerteans as coelomate lophotrochozoans, placement of Nemertea within Lophotrochozoa remains in doubt, with analyses apparently influenced by the molecular markers and methods employed, as well as by taxon sampling.
While our nemertean results fit the pattern emerging from other recent studies, it is troubling that monophyly of Mollusca, which is a morphologically well-recognized monophyletic group, was not sup- ported by our phylogenetic analyses (Figs. 6, 7). Similar results were found in previous molecular studies (e.g., Winnepenninckx, et al., 1995; Carranza et al., 1997; Steinauer et al., 2005; Passamaneck and Halanych, 2006). Bourlat et al. (2008) hypothesized as explanation for these results that the mitochondrial DNA of some mollusks had accelerated evolutionary rates or had an unusual doubly uniparental mode of mitochondrial inheritance, which might affect the accuracy of tree reconstruction. While this anomaly would seem to cloud inferences based on these mitochondrial sequences, it might best be
informative characters. The tree suggests that among the included taxa C. Simula has its closest relationship with Loxocorone allax + Loxosomella aloxiata (Entoprocta) with weak support. The overall results of gene arrangement analyses are thus partly congruent with that of Turbeville and Smith (2007) (entoprocts were not included in that study) and Yokobori et al. (2008).
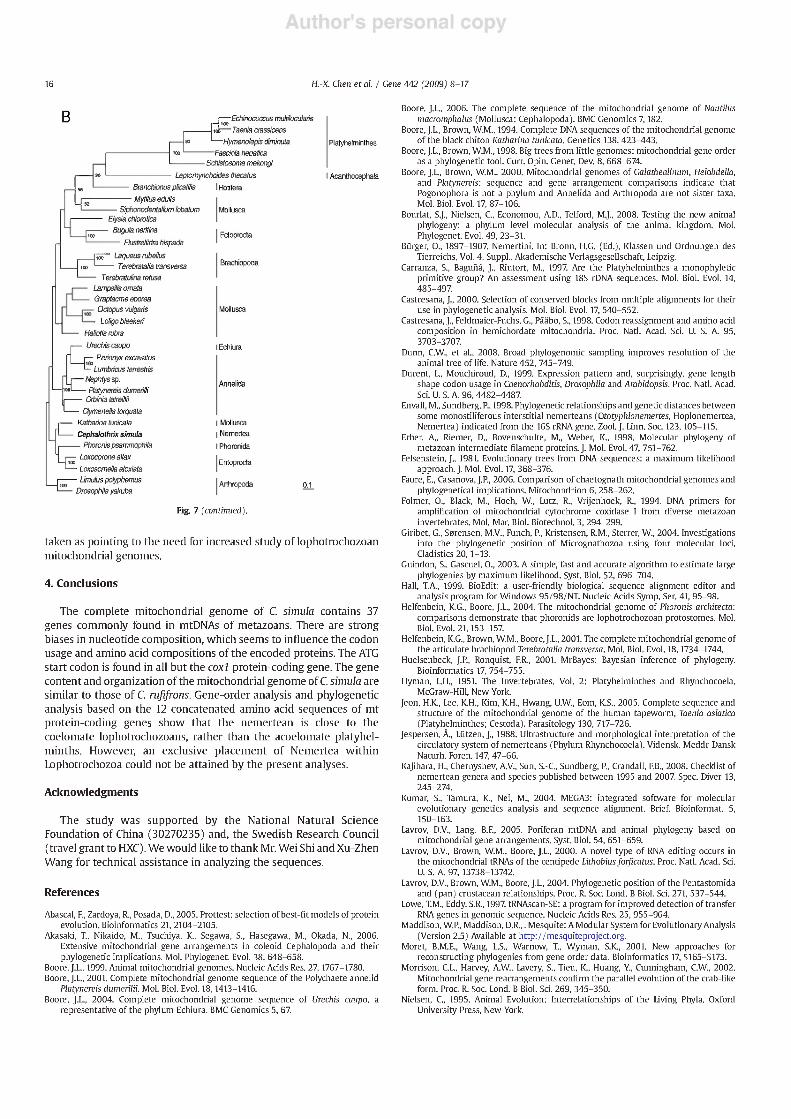
In the Bayesian and Maximum-likelihood analyses using the aligned amino acid sequences of 12 of 13 mitochondrial protein- coding genes (1746 positions), C. Simula forms a well-supported clade with the polyplacophorid mollusk K. tunicata (pp = 1.0). This group is sister to a clade comprising three other mollusks, Haliotis rubra, Loiigo bieekeri, and O. vulgaris. A strongly supported clade (pp = 1.0) consisting of Annelida, Echiura and Phoronida forms the sister to Ce- phalothrix + Katharina clade and its sister taxon (Fig. 7A). The phytogeny estimated with Maximum likelihood is similar to the result of Bayesian inference analysis (Fig. 7), with the sister relationship between the nemertean and K. tunicata weakly supported (ML bootstrap 46%), and Entoprocta (sister to Phoronida) showing a closer relationship with C. Simula (Fig. 7B). The apparently close relationship of Platyhelminthes and Acanthocephala is likely the result of long- branch attraction. Similar clumped long branches (including platy- helminths, acanthocephalans and rotifers) were seen in the phyloge- netic trees based on 18S and 28S sequences (Passamaneck and Halanych, 2006). If the long-branched taxa (platyhelminths and acanthocephalans) are removed, the nemertean is placed as sister to the phoronid in both Bayesian-inference and Maximum-likelihood analyses. In ML and Bl analyses (data not shown) of nucleotide sequences for the 12 protein-coding genes mentioned above, Nemertea is sister to Entoprocta. Existing interphylum molecular analyses that relied on single gene systems or combined more than one marker also showed divergent sister relationships between Nemertea and other taxa. For instance, analyses of intermediate
Echinococcus multilocutaris
Taenia crassiceps Hymenolepis diminuta
Fasdola hepatica Schistosoma mekongi
Platyhelminthes
Leptorhynchcides thecatus I Acanthocephala
— Branchionus piicatiiis
Mytilus edulis
Siphonodenialium lobatum
Graptacme eborea
Elysia chlorolica
Bugula neritina
— Flustrellidra hispida
Laqueus rubellus
Terebratalia transversa
Terebralulina retusa
Lampsilis omata
Haliotis rubra
Octopus vulgaris
—Loiigo bieekeri
Katharina tunicata
Ccphatothrix Simula
Phoronis psammophila Urechis caupo
Pehonyx excavalus
Lumbricus terrestris
•Nephtyssp.
r^—Orbinia latreillii
' Clymenella torquata
— Platynereis dumertlii
•^Loxocorone allax
- Loxosomella aloxiata
-Limulus polyphemus
Orosophila yakuba
I Rotifera
Mollusca
Ectoprocta
Brachiopoda
Mollusca
Nemertea
Phoranida
Echiura
Entoprocta
Arthropoda 0.1
Fig. 7. Molecular phylogenetic trees of 32 species of lophotrochozoans based on 12 concatenated amino acid sequences of mt protein-coding genes (32 species). (A) Bayesian inference tree. Posterior probabilities>0.95 are shown at the nodes. (B) Maximum likelihood tree. Bootstrap support values > 50 are shown at the nodes (1000 replicates, shown as percentages).
16 H.-X. Chen et al. I Gene 442 (2009) 8-17
B
_n
-Echinococcus multHocufaris
-Taeniacra$$icep$
-Hymenotepls diminufe
—Fasooia hepattca - Schistosoma mekongi
Lepto/tiyncftoictes thecatus
Platyhelminthes
l Acanthocephala
Brancfrionus pticatilis
- Mytilus edutis
- Siphonodgntalium lobatum
I— Uf
Efysia ctitorolica
Buguia n&itina
— F!ustrellidra hispada
Laqueus rubeltus
Terebrataiia traosversa
Terebratulina retusa
Lampstlts omata
Graptacme aborea
Octopus vulgans
Lciigo bleekeri
Hatiotis nibra
Urechis caupo
Perionyx excavatus
Lumbricus terrsstris
I Rotilera
Ectoprocta
Brachiopoda
Mollusca
M— Nephtys sp.
'—W Platynereis dumeriffi
Us"1 i— i
- Qbinia latieiltii
- Oymenellataquala
Katharina tunkafa
Cephalothrix Simula
Phoronis psammophila
Loxocorone atlax
Loxosomeiiaaioxiata
- Limuluspolyphemvs
Divsopnua yakuba
Anneiaa
I Molluscs
I Nemertea
I Phoronida
Entoprocta
Arthropada
Fig. 7 (continued).
taken as pointing to the need for increased study of lophotrochozoan mitochondria! genomes.
4. Conclusions
The complete mitochondria! genome of C. Simula contains 37 genes commonly found in mtDNAs of metazoans. There are strong biases in nucleotide composition, which seems to influence the codon usage and amino acid compositions of the encoded proteins. The ATG start codon is found in all but the coxl protein-coding gene. The gene content and organization of the mitochondria! genome of C. Simula are similar to those of C. rufifrons. Gene-order analysis and phylogenetic analysis based on the 12 concatenated amino acid sequences of mt protein-coding genes show that the nemertean is close to the coelomate lophotrochozoans, rather than the acoelomate platyhel- minths. However, an exclusive placement of Nemertea within Lophotrochozoa could not be attained by the present analyses.
Acknowledgments
The study was supported by the National Natural Science Foundation of China (30270235) and, the Swedish Research Council (travel grant to HXC). We would like to thank Mr. Wei Shi and Xu-Zhen Wang for technical assistance in analyzing the sequences.
References
Abascal, F.. Zardoya, R.. Posada. D., 2005. Prottest: selection of best-fit models of protein evolution. Bioinformatics 21, 2104-2105.
Akasaki, T., Nikaido, M., Tsuchiya, K., Segawa. S., Hasegawa, M., Okada, N., 2006. Extensive mitochondrial gene arrangements in coleoid Cephalopoda and their phylogenetic implications. Mol. Phylogenet. Evol. 38, 648-658.
Boore, J.L., 1999. Animal mitochondrial genomes. Nucleic Acids Res. 27,1767-1780. Boore, J.L., 2001. Complete mitochondrial genome sequence of the Polychaete annelid
Platynereis dumerilii. Mol. Biol. Evol. 18,1413-1416. Boore, J.L.. 2004. Complete mitochondrial genome sequence of Urechis caupo, a
representative of the phylum Echiura. BMC Genomics 5, 67.
Boore, J.L., 2006. The complete sequence of the mitochondrial genome of Nautilus macromphalus (Mollusca: Cephalopoda). BMC Genomics 7,182.
Boore, J.L., Brown, W.M., 1994. Complete DNA sequences of the mitochondrial genome of the black chiton Katharina tunicata. Genetics 138,423-443.
Boore, J.L.. Brown. W.M., 1998. Big trees from little genomes: mitochondrial gene order as a phylogenetic tool. Curr. Opin. Genet. Dev. 8, 668-674.
Boore, J.L., Brown. W.M., 2000. Mitochondrial genomes of Galathealinum, Helobdella, and Platynereis: sequence and gene arrangement comparisons indicate that Pogonophora is not a phylum and Annelida and Arthropoda are not sister taxa. Mol. Biol. Evol. 17. 87-106.
Bourlat, S.J., Nielsen, C. Economou. A.D., Telford, M.J., 2008. Testing the new animal phytogeny: a phylum level molecular analysis of the animal kingdom. Mol. Phylogenet. Evol. 49,23-31.
Burger, O., 1897-1907. Nemertini. In: Bronn, H.G. (Ed.), Klassen und Ordnungen des Tierreichs, Vol. 4, Suppl.. Akademische Verlagsgesellschaft, Leipzig.
Carranza, S., Baguna, J., Riutort, M., 1997. Are the Platyhelminthes a monophyletic primitive group? An assessment using 18S rDNA sequences. Mol. Biol. Evol. 14, 485-497.
Castresana, J., 2000. Selection of conserved blocks from multiple alignments for their use in phylogenetic analysis. Mol. Biol. Evol. 17. 540-552.
Castresana, J., Feldmaier-Fuchs, G., Paabo, S., 1998. Codon reassignment and amino acid composition in hemichordate mitochondria. Proc. Nad. Acad. Sci. U. S. A. 95, 3703-3707.
Dunn, C.W., et al., 2008. Broad phylogenomic sampling improves resolution of the animal tree of life. Nature 452, 745-749.
Durent, L, Mouchiroud, D., 1999. Expression pattern and, surprisingly, gene length shape codon usage in Caenorhabditis, Drosophila and Arabidopsis. Proc. Natl. Acad. Sci. U S. A. 96, 4482-4487.
Envall, M., Sundberg, P., 1998. Phylogenetic relationships and genetic distances between some monostiliferous interstitial nemerteans (Ototyphlonemertes, Hoplonemertea, Nemertea) indicated from the 16S rRNA gene. Zool. J. Linn. Soc. 123,105-115.
Erber, A.. Riemer, D., Bovenschulte, M., Weber, K., 1998. Molecular phytogeny of metazoan intermediate filament proteins. J. Mol. Evol. 47. 751-762.
Felsenstein, J., 1981. Evolutionary trees from DNA sequences: a maximum likelihood approach. J. Mol. Evol. 17, 368-376.
Faure, E., Casanova, J.P., 2006. Comparison of chaetognath mitochondrial genomes and phylogenetical implications. Mitochondrion 6. 258-262.
Folmer, O., Black, M., Hoeh, W., Lutz, R., Vrijenhoek, R., 1994. DNA primers for amplification of mitochondrial cytochrome coxidase I from diverse metazoan invertebrates. Mol. Mar. Biol. Biotechnol. 3. 294-299.
Giribet. G., Sorensen, M.V., Punch, P., Kristensen, R.M., Sterrer, W., 2004. Investigations into the phylogenetic position of Micrognathozoa using four molecular loci. Cladistics 20,1-13.
Guindon, S., Gascuel, O.. 2003. A simple, fast and accurate algorithm to estimate large phytogenies by maximum likelihood. Syst. Biol. 52, 696-704.
Hall, T.A.. 1999. BioEdit: a user-friendly biological sequence alignment editor and analysis program for Windows 95/98/NT. Nucleic Acids Symp. Ser. 41, 95-98.
Helfenbein. K.G., Boore, J.L., 2004. The mitochondrial genome of Phoronis architecta: comparisons demonstrate that phoronids are lophotrochozoan protostomes. Mol. Biol. Evol. 21,153-157.
Helfenbein. K.G., Brown, W.M., Boore, J.L., 2001. The complete mitochondrial genome of the articulate brachiopod Terebrataiia transversa. Mol. Biol. Evol. 18.1734-1744.
Huelsenbeck. J.P., Ronquist, F.R., 2001. MrBayes: Bayesian inference of phytogeny. Bioinformatics 17, 754-755.
Hyman, LH., 1951. The Invertebrates. Vol. 2: Platyhelminthes and Rhynchocoela. McGraw-Hill, New York.
Jeon, H.K., Lee, K.H., Kim, K.H., Hwang, U.W.. Eom, K.S., 2005. Complete sequence and structure of the mitochondrial genome of the human tapeworm, Taenia asiatica (Platyhelminthes; Cestoda). Parasitology 130, 717-726.
Jespersen, A., Lutzen, J., 1988. Infrastructure and morphological interpretation of the circulatory system of nemerteans (Phylum Rhynchocoela). Vidensk. Meddr Dansk Naturh. Foren. 147, 47-66.
Kajihara. H.. Chernyshev, A.V., Sun, S.-C, Sundberg, P., Crandall. F.B., 2008. Checklist of nemertean genera and species published between 1995 and 2007. Spec. Diver 13, 245-274.
Kumar. S., Tamura, K., Nei, M., 2004. MEGA3: integrated software for molecular evolutionary genetics analysis and sequence alignment. Brief. Bioinformat. 5, 150-163.
Lavrov, D.V., Lang, B.F., 2005. Poriferan mtDNA and animal phytogeny based on mitochondrial gene arrangements. Syst. Biol. 54, 651 -659.
Lavrov, D.V., Brown, W.M., Boore, J.L.. 2000. A novel type of RNA editing occurs in the mitochondrial tRNAs of the centipede Lithobius forflcatus. Proc. Natl. Acad. Sci. U. S. A. 97, 13738-13742.
Lavrov, D.V., Brown, W.M., Boore, J.L., 2004. Phylogenetic position of the Pentastomida and (pan) crustacean relationships. Proc. R. Soc. Lond. B Biol. Sci. 271. 537-544.
Lowe, T.M., Eddy, S.R., 1997. tRNAscan-SE: a program for improved detection of transfer RNA genes in genomic sequence. Nucleic Acids Res. 25, 955-964.
Maddison, W.P., Maddison, D.R.,. Mesquite: A Modular System for Evolutionary Analysis (Version 2.5) Available at http://mesquiteproject.org.
Moret, B.M.E.. Wang, L.S., Warnow, T, Wyman, S.K.. 2001. New approaches for reconstructing phytogenies from gene order data. Bioinformatics 17, S165-S173.
Morrison. C.L., Harvey, A.W., Lavery, S.. Tieu. K.. Huang, Y., Cunningham, C.W., 2002. Mitochondrial gene rearrangements confirm the parallel evolution of the crab-like form. Proc. R. Soc. Lond. B Biol. Sci. 269, 345-350.
Nielsen, C, 1995. Animal Evolution: Interrelationships of the Living Phyla. Oxford University Press, New York.
H.-X. Chen et al. I Gene 442 (2009) 8-17 17
Ojala, D., Merkel, C, Gelfand, R., Attardi, C, 1980. The transfer RNA genes punctuate the reading of genetic information in human mitochondrial DNA. Cell 22, 393-403.
Ojala, D., Montoya, J., Attardi, G., 1981. tRNA punctuation model of RNA processing in human mitochondria. Nature 290, 470-474.
Osawa, S., Jukes, T.H., 1989. Codon reassignment (codon capture) in evolution. J. Mol. Evol. 28,271-278.
Palumbi, S.R., 1996. Nucleic acids: II. The polymerase chain reaction, In: Hillis, D.M., Moritz, C, Mable, B.K. (Eds.), Molecular Systematics, 2nd ed. Sinauer, Inc., Massachusetts, pp. 205-247.
Passamaneck, Y., Halanych, K.M., 2006. Lophotrochozoan phytogeny assessed with LSU and SSU data: evidence of lophophorate polyphyly. Mol. Phylogenet. Evol. 40, 20-28.
Perna, N.T., Kocher, T.D., 1995. Patterns of nucleotide composition at fourfold degenerate sites of animal mitochondrial genomes. J. Mol. Evol. 41, 353-358.
Plaisance, L, Huyse, T, Littlewood, D.T.J., Bakke, T.A., Bachmann, L, 2007. The complete mitochondrial DNA sequence of the monogenean Gyrodactylus thymalli (Platyhel- minthes: Monogenea), a parasite of grayling (Thymallus thymallus). Mol. Biochem. Parasit. 154,190-194.
Ronquist, F., Huelsenbeck, J.P., 2003. MrBayes3: Bayesian phylogenetic inference under mixed models. Bioinformatics 19,1572-1574.
Ruiz-Trillo, I., et al., 2002. A phylogenetic analysis of myosin heavy chain type II sequences corroborates that Acoela and Nemertodermatida are basal bilaterians. Proc. Nat. Acad. Sci. U. S. A. 99,11246-11251.
Sambrook, J., Russell, D.W., 2001. Rapid isolation of yeast DNA. In: Sambrook, J., Russell, D.W. (Eds.), Molecular Cloning, a Laboratory Manual. Cold Spring Harbor Laboratory Press, New York, pp. 631-632.
Shade!, G.S., Clayton, D.A., 1997. Mitochondrial DNA maintenance in vertebrates. Annu. Rev. Biochem. 66, 409-435.
Sharp, P.M., Matassi, G., 1994. Codon usage and genome evolution. Curr. Opin. Genet. Dev. 4, 851-860.
Steinauer, M.L., Nickol, B.B., Broughton, R., Orti, G., 2005. First sequenced mitochondrial genome from the phylum Acanthocephala (Leptorhynchoides thecatus) and its phylogenetic position within Metazoa. J. Mol. Evol. 60, 706-715.
Stothard, P., Wishart, D.S., 2005. Circular genome visualization and exploration using CGView. Bioinformatics 21, 537-539.
Strand, M., Sundberg, P., 2005. Genus Tetrastemma Ehrenberg, 1831 (Phylum Nemertea) —a natural group? Phylogenetic relationships inferred from partial 18S rDNA sequences. Mol. Phylogenet. Evol. 37,144-152.
Struck, T.H., Fisse, F., 2008. Phylogenetic position of Nemertea derived from phylogenomic data. Mol. Biol. Evol. 25, 728-736.
Struck, T.H., et al., 2007. Annelid phytogeny and the status of Sipuncula and Echiura. BMC Evol. Biol. 7. 57.
Sundberg, P., Strand, M., 2007. Genetics do not reflect habitat differences in Riseriellus occultus (Heteronemertea, Nemertea) from Spain and Wales. Mar. Biol. Res. 3,117-122.
Sundberg, P., Gibson, R., Olsson, U, 2003. Phylogenetic analysis of a group of palaeonemerteans (Nemertea) including two new species from Queensland and the Great Barrier Reef, Australia. Zool. Scrip. 32, 279-296.
Sundberg, P., Saur, M., 1998. Molecular phytogeny of some European heteronemertean (Nemertea) species and the monophyletic status of Riseriellus, Lineus, and Micrura. Mol. Phylogenet. Evol. 10, 271-280.
Swofford, D.L, 2002. PAUP*. Phylogenetic Analysis Using Parsimony (* and Other Methods). Version 4. Sinauer Associates, Sunderland.
Thollesson, M., Norenburg, J.L., 2003. Ribbon worm relationships: a phytogeny of the phylum Nemertea. Proc. R. Soc. Lond. B Biol. Sci. 270,407-415.
Thompson, J.D., Gibson, T.J., Plewniak, F., Jeanmougin, F., Higgins, D.G., 1997. The Clustal X windows interface: flexible strategies for multiple sequence alignment aided by quality analysis tools. Nucleic Acids Res. 24,4876-4882.
Turbeville, J.M., 1986. An ultrastructural analysis of coelomogenesis in the hoplone- mertine Prosorhochmus americanus and the polychaete Magelona sp. J. Morphol. 187, 51-60.
Turbeville, J.M., 2002. Progress in nemertean biology: development and phytogeny. Integ. Comp. Biol. 42, 692-703.
Turbeville, J.M., Ruppert, E.E., 1985. Comparative ultrastructure and the evolution of nemertines. Amen Zool. 25, 53-71.
Turbeville, J.M., Smith, 0.M., 2007. The partial mitochondrial genome of the Cephalothrix rufifrons (Nemertea, Palaeonemertea): characterization and impli- cations for the phylogenetic position of Nemertea. Mol. Phylogenet. Evol. 43, 1056-1065.
Wang, LS., Jansen, R.K., Moret, B.M., Raubeson, LA., Warnow, T., 2002. Fast phylogenetic methods for the analysis of genome rearrangement data: an empirical study. Proceedings of Fifth Pacific Symposium of Biocomputing PSB'02. World Scientific Pub., pp. 524-535.
Webster, B.L., Mackenzie-Dodds, J.A., Telford, M.J., Littlewood, D.T.J., 2007. The mitochondrial genome of Priapulus caudatus Lamarck (Priapulida: Priapulidae). Gene 389, 96-105.
Winnepenninckx, B., Backeljau, T, DeWachter, R., 1995. Phytogeny of protostome worms derived from 18S rrnA sequences. Mol. Biol. Evol. 12, 641-649.
Wolstenholme, D.R., 1992. Animal mitochondrial DNA: structure and evolution. Int. Rev. Cyt. 141,173-216.
Yokobori, S.I., Paabo. S., 1995. tRNA editing in metazoans. Nature 377, 490. Yokobori, S.I., Paabo, S., 1997. Polyadenylation creates the discriminator nucleotide of
chicken mitochondrial tRNA (Tyr).J. Mol. Biol. 265, 95-99. Yokobori, S.I., et al., 2008. Complete nucleotide sequences of mitochondrial genomes of
two solitary entoprocts, Loxocorone allax and Loxosomella aloxiata: implications for lophotrochozoan phytogeny. Mol. Phylogenet. Evol. 47, 612-628.
Zhang, D.X., Hewitt, 0.M., 1997. Insect mitochondrial control region: a review of its structure, evolution and usefulness in evolutionary studies. Biochem. Syst. Evol. 25, 99-120.
Zrzavy, J., Mihulka, S., Kepka, P., Bezdek, A., Tietz, 0.. 1998. Phytogeny of the Metazoa based on morphological and 18S ribosomal DNA evidence. Cladistics 14, 249-285.
Zrzavy, J., Hyps, V., Tietz, D.F., 2001. Myzostomida are not annelids: molecular and morphological support for a clade of animals with anterior sperm flagella. Cladistics 17,170-198.