The clinical utility of nonword repetition for children living in the rural south of the US
11
The clinical utility of nonword repetition for children living in the rural south of the US Janna B. Oetting and Lesli H. Cleveland Department of Communication Sciences and Disorders, Louisiana State University, Baton Rouge, LA, USA Abstract Nonword repetition (NWR) tasks have been shown to minimize cultural biases in language assessment. In the current study, we further examined the clinical utility of NWR with 83 children who lived in the rural south of the US; 33 were African American and 50 were White, with 16 classified as specifically language impaired (SLI) 6-year-olds and 67 classified as either age- matched or younger controls. Main effects were found for group, with the children in the SLI group earning lower NWR scores than the controls. A main effect for syllable length but not race was also documented. The group and syllable length effects could not be explained by differences in the children’s articulation abilities or by potential differences in the children’s use of vernacular dialect. Discriminant analysis indicated that NWR had a diagnostic accuracy rate of 81% for the 6- year-olds, but sensitivity was low (56%). When combined with scores from one other nonbiased assessment tool, however, the diagnostic accuracy of NWR increased to 90%, with rates of sensitivity and specificity above 80%. Keywords Nonword repetition; test biases Introduction Language acquisition is linked to a child’s cultural upbringing. Unfortunately, most standardized tests that are available to speech-language clinicians have not been developed with socio-culturally neutral (i.e., un-biased) materials. Thus, it is not surprising that when children from minority backgrounds score lower than expected on a standardized tool, cultural biases within the test are often suggested as a possible explanation (Kayser, 1995; Pena & Quinn, 1997; Sattler & Altes, 1984; Teuber & Furlong, 1985, Washington & Craig, 1992). Although many different types of cultural biases can occur within an assessment, the two most often discussed relate to a test’s content and its format. Content biases occur when items on a test probe for information from a child that it is inappropriate or unfamiliar to the child’s culture. Format biases occur when the unfamiliar or inappropriate aspect of the test relates to the manner in which the test is constructed and/or administered. The goal of the current study was to evaluate the clinical utility of an experimental task that asks children to repeat nonsense words. Tasks that involve nonword repetition (NWR) are thought to minimize the effects of test content biases and test format biases by making some © 2006 Informa UK Ltd. Correspondence: Janna B. Oetting, Department of Communication Sciences and Disorders, 163 M&DA Bldg., Louisiana State University, Baton Rouge, LA 70803-2606, USA. [email protected]. NIH Public Access Author Manuscript Clin Linguist Phon. Author manuscript; available in PMC 2012 July 16. Published in final edited form as: Clin Linguist Phon. 2006 ; 20(0): 553–561. doi:10.1080/02699200500266455. NIH-PA Author Manuscript NIH-PA Author Manuscript NIH-PA Author Manuscript
-
Upload
independent -
Category
Documents
-
view
1 -
download
0
Transcript of The clinical utility of nonword repetition for children living in the rural south of the US
The clinical utility of nonword repetition for children living in therural south of the US
Janna B. Oetting and Lesli H. ClevelandDepartment of Communication Sciences and Disorders, Louisiana State University, Baton Rouge,LA, USA
AbstractNonword repetition (NWR) tasks have been shown to minimize cultural biases in languageassessment. In the current study, we further examined the clinical utility of NWR with 83 childrenwho lived in the rural south of the US; 33 were African American and 50 were White, with 16classified as specifically language impaired (SLI) 6-year-olds and 67 classified as either age-matched or younger controls. Main effects were found for group, with the children in the SLIgroup earning lower NWR scores than the controls. A main effect for syllable length but not racewas also documented. The group and syllable length effects could not be explained by differencesin the children’s articulation abilities or by potential differences in the children’s use of vernaculardialect. Discriminant analysis indicated that NWR had a diagnostic accuracy rate of 81% for the 6-year-olds, but sensitivity was low (56%). When combined with scores from one other nonbiasedassessment tool, however, the diagnostic accuracy of NWR increased to 90%, with rates ofsensitivity and specificity above 80%.
KeywordsNonword repetition; test biases
IntroductionLanguage acquisition is linked to a child’s cultural upbringing. Unfortunately, moststandardized tests that are available to speech-language clinicians have not been developedwith socio-culturally neutral (i.e., un-biased) materials. Thus, it is not surprising that whenchildren from minority backgrounds score lower than expected on a standardized tool,cultural biases within the test are often suggested as a possible explanation (Kayser, 1995;Pena & Quinn, 1997; Sattler & Altes, 1984; Teuber & Furlong, 1985, Washington & Craig,1992). Although many different types of cultural biases can occur within an assessment, thetwo most often discussed relate to a test’s content and its format. Content biases occur whenitems on a test probe for information from a child that it is inappropriate or unfamiliar to thechild’s culture. Format biases occur when the unfamiliar or inappropriate aspect of the testrelates to the manner in which the test is constructed and/or administered.
The goal of the current study was to evaluate the clinical utility of an experimental task thatasks children to repeat nonsense words. Tasks that involve nonword repetition (NWR) arethought to minimize the effects of test content biases and test format biases by making some
© 2006 Informa UK Ltd.
Correspondence: Janna B. Oetting, Department of Communication Sciences and Disorders, 163 M&DA Bldg., Louisiana StateUniversity, Baton Rouge, LA 70803-2606, USA. [email protected].
NIH Public AccessAuthor ManuscriptClin Linguist Phon. Author manuscript; available in PMC 2012 July 16.
Published in final edited form as:Clin Linguist Phon. 2006 ; 20(0): 553–561. doi:10.1080/02699200500266455.
NIH
-PA Author Manuscript
NIH
-PA Author Manuscript
NIH
-PA Author Manuscript
aspects of the task familiar to all children while making other aspects of the task equallyunfamiliar. The familiar aspect of NWR relates to the phonemic content of the test items.Unlike real words, NWR items can be created with phonemes that are present in a number oflanguages and dialects. The unfamiliar aspects of NWR relate to the semantic andgrammatical content of the test items and the manner in which the test is administered. Asnonsense words, they can be created so that they (and the syllables within them) do not carrymeaning or grammatical function. In addition, the task of repeating nonsense words isthought to be relatively unfamiliar to all children, regardless of their cultural background.Some scholars further describe NWR as assessing children’s processing abilities rather thanassessing their knowledge of specific language content (Campbell, Dollaghan, Needleman,& Janosky, 1997).
Although NWR tasks have now been included in a number of experiments, results from fivedemonstrate the potential of this tool for clinical practice. The first was completed byCampbell et al. (1997). This study included 156 children between the ages of 11 and 14years, with 31% classified as having majority racial status and 69% classified as havingminority status. Among other probes, each child was given one standardized language test,the Oral Language Scale (OLS) from the Woodcock Language Proficiency Battery-Revised(Woodcock, 1991) and an NWR task. Results indicated that unlike the OLS scores, theNWR scores did not differ as a function of the children’s minority vs. majority racial status.
In four other studies, the clinical usefulness of NWR was examined by comparing the scoresof children with language impairments to those of typically developing controls. Dollaghanand Campbell’s (1998) study included 40 children who were between the ages of 6 and 9years, Ellis Weismer, Tomblin, Zhang, Buckwalter, Chynoweth and Jones (2000) included581 children who were 7, Conti-Ramsden, Botting, and Faragher (2001) included 260children who were 10, and Conti-Ramsden (2003) included 64 children who were 5. In eachof these studies, the children with a language impairment earned lower NWR scores than thecontrols. Moreover, when Conti-Ramsden and colleagues examined NWR within adiscriminant function analysis, it showed fair diagnostic predictability (82%) for 10-year-olds, with a sensitivity rate of 78% and a specificity rate of 87%. For 5-year-olds, thespecificity of NWR was also good (100%) but its sensitivity was limited (59%).
In the current work, we further tested the clinical utility of NWR for a group of 4- and 6-year-olds who lived in the rural south of the US. With almost 20% of the children classifiedas specifically language impaired (SLI), the data allowed us to examine the usefulness ofNWR for distinguishing those with impairments from those without. In addition, with 40%of the children identified as African American (AA), the data allowed us to examine whetherNWR contained a cultural bias that related to the children’s race. The questions guiding theresearch were: (1) Does NWR distinguish children with SLI from children with typicallydeveloping language skills? and (2) does NWR contain a cultural bias that relates to thechildren’s race?
MethodsParticipants
Eighty-three children living in a rural area of Louisiana contributed data to the study. Therewere 33 AA children and 50 White (W) children. All of the children were judged to speak anonmainstream dialect of English by at least two examiners. Although other, more formal,measures of nonmainstream dialect use were not collected for these children, they wererecruited from the same schools as those studied by Oetting and McDonald (2001, 2002). Inour earlier studies, all children who were recruited from these schools were documented tospeak a variety of either southern White or southern African American English using a blind
Oetting and Cleveland Page 2
Clin Linguist Phon. Author manuscript; available in PMC 2012 July 16.
NIH
-PA Author Manuscript
NIH
-PA Author Manuscript
NIH
-PA Author Manuscript
listener judgment task and/or detailed coding of vernacular morphology (see Oetting &McDonald, 2002).
Sixteen children were classified as SLI, 36 were classified as typically developing 6-year-olds (6N), and 31 were classified as typically developing 4-year-olds (4N). The criteria forSLI were: (a) currently enrolled in speech-language services in the public schools, (b)designated as exhibiting language skills below his or her peers as determined by theclassroom teacher, (c) performed within one standard deviation of the mean on theColumbia Mental Maturity Scale (CMMS; Burgmeister, Blum, & Lorge, 1972), (d)performed below one standard deviation of the mean on the PPVT-R (Dunn & Dunn, 1981)and on the syntactic quotient of the Test of Language Development-Primary (TOLD-P: 2;Newcomer & Hammill, 1988), (e) did not demonstrate frank neurological impairments orsocial-emotional deficits per teacher report, and (f) passed a hearing screening within 6months of the study.
The children in the typically developing groups were recruited from the same schools andclassrooms (or day cares and preschools within close proximity to the schools) as those withSLI. All of these children were considered typically developing based on teacher report andnone had a history of speech or language impairments. Originally, these participants wererecruited as controls for two studies that examined children’s word learning abilities, butonly 36 of them met the subject selection and subject matching criteria of those studies (seeHorohov & Oetting, 2004; Oetting, 2003). Of those who were not included in the vocabularystudies, 25 earned a standard score that was below one standard deviation on either thePPVT-R (n=16), TOLD-P: 2 (n=16), or CMMS (n=6). For the PPVT-R and TOLD-P: 2,these results reflect a 21% fail rate by the controls, a finding that is consistent with previousdescriptions of these tools as culturally biased.
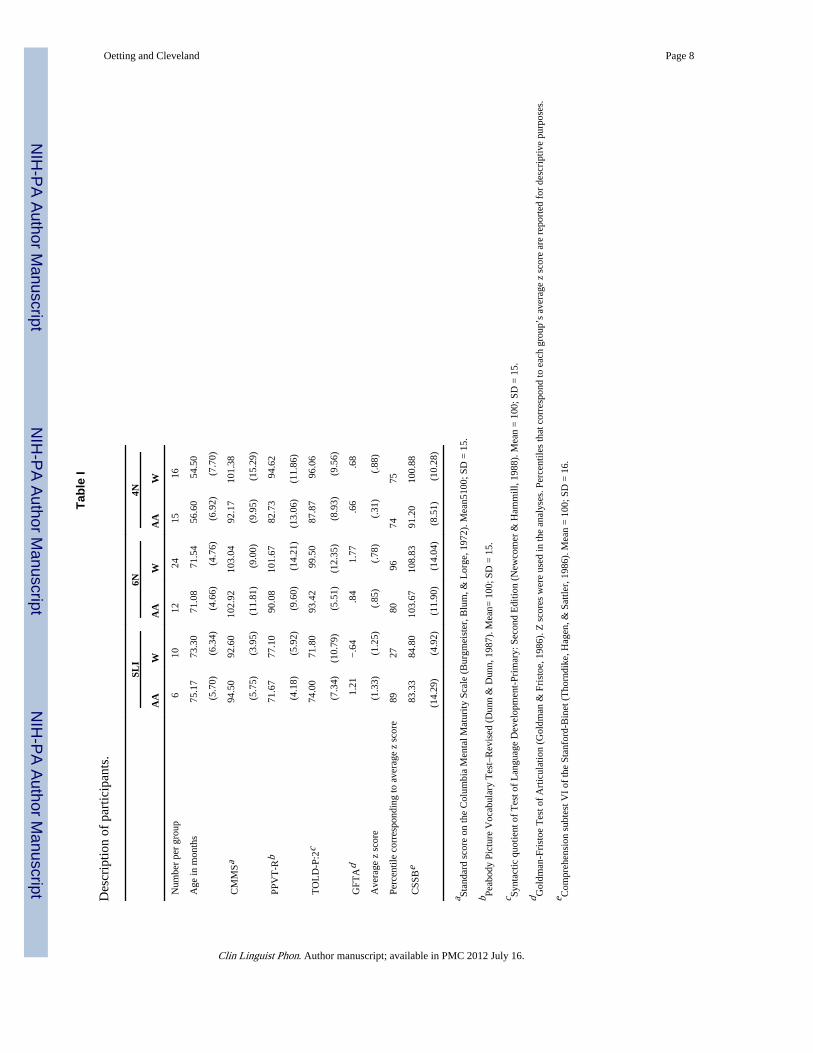
Participant profiles are provided in Table I. Also included are standardized z scores andcorresponding group percentile scores from the Goldman-Fristoe Test of Articulation(GFTA; Goldman & Fristoe, 1986) and standard scores from the Comprehension Subtest ofthe Stanford-Binet (CSSB; Thorndike, Hagen & Sattler, 1986). The GFTA was originallygiven to the children for descriptive purposes, and the CSSB was given as part of a master’sthesis by the second author (Habans, 2000). None of the controls scored below the 10thpercentile on the GFTA; six scored one standard deviation on the CSSB. Given the ordinalnature of the percentile scores on the GFTA, each child’s percentile on this test wasaveraged after it was first converted to a z score using a standardization table from Hinkle,Wiersma, & Jurs (1998, p. 633). The GFTA percentiles reported in Table I correspond toeach group’s averaged z score.
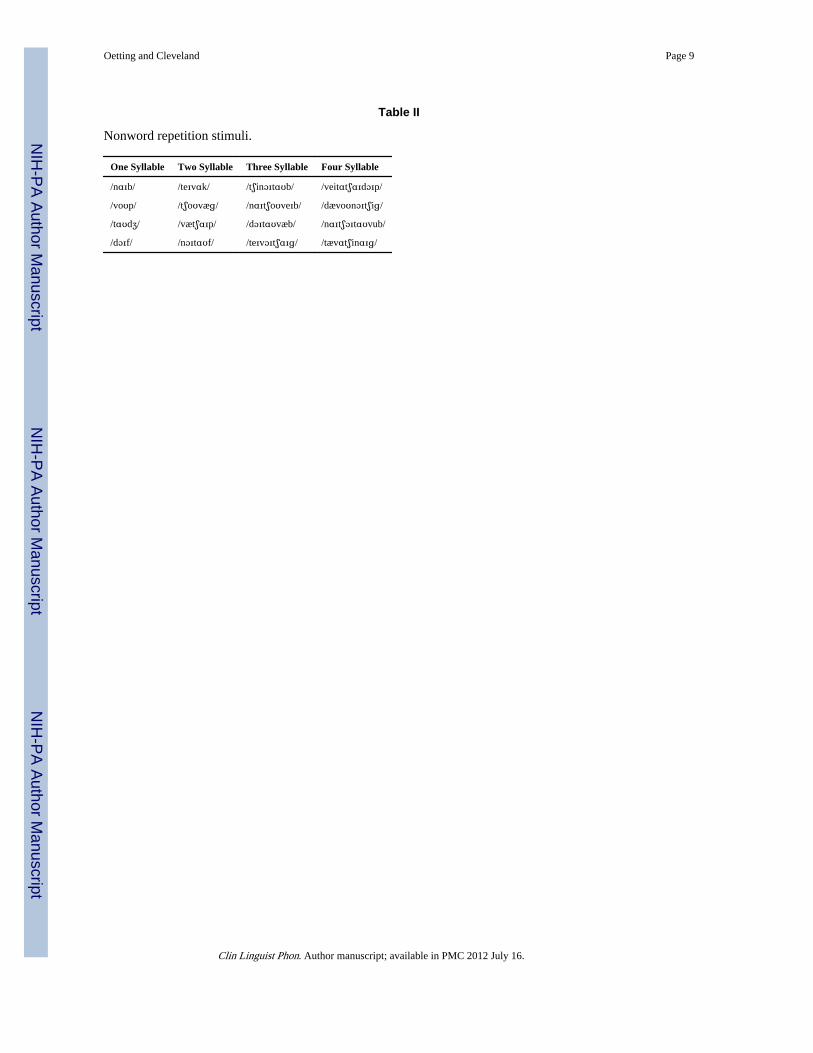
StimuliThe stimuli were Dollaghan and Campbell’s (1998) 16 nonce words (see Table II). Four ofthe words were one syllable in length while equal numbers of the others included two, three,and four syllables. The nonce words were created with 11 different consonants and ninevowels (three monophthongs and six diphthongs). These phonemes did not include laxvowels or consonants identified as the late eight by Shriberg and Kwiatkowski (1994). All ofthe words also began and ended with a consonant but not a consonant cluster, and none ofthe CV or CVC syllables within the words corresponded to an English word. Theseparticular features of the stimuli reduced the risk of the NWR results being confounded bydevelopmental differences in the children’s phonological systems or by possible dialectaldifferences in the children’s use of English. Indeed, of the 45 non-mainstream phonologicalpatterns of English that have been identified in the literature (see Bailey, 2001), only threewere possible with Dollaghan and Campbell’s stimuli. These included glide reduction of /ɑɪ/
Oetting and Cleveland Page 3
Clin Linguist Phon. Author manuscript; available in PMC 2012 July 16.
NIH
-PA Author Manuscript
NIH
-PA Author Manuscript
NIH
-PA Author Manuscript
and /ɔɪ/, deletion of unstressed initial and medial syllables, and final consonant devoicingof /b/ and /ɡ/.
The stimuli were recorded onto the audio track of a video-tape. The tape was edited to showa 5- to 7-second blue screen between the words and a flashing white bar in the corner of thescreen before each word. Children were asked to listen to each word and repeat it exactly asthey heard it. The children’s responses were audio recorded for later transcription andscoring. Following Dollaghan and Campbell, NWR was scored by calculating each child’spercent of phonemes correct for each syllable length and for the total set of nonce words.Phoneme omissions and substitutions were marked as errors. Phoneme additions weretranscribed but not scored.
ReliabilityNWR responses from 23 children were independently transcribed and scored by a secondexaminer (96 phonemes per NWR task X 23 children=2208). Rate of agreement at thephoneme level was above 95% (SLI=95.6%, 6N=96.4%, 4N=96.6%).
ResultsAnalyses of variance
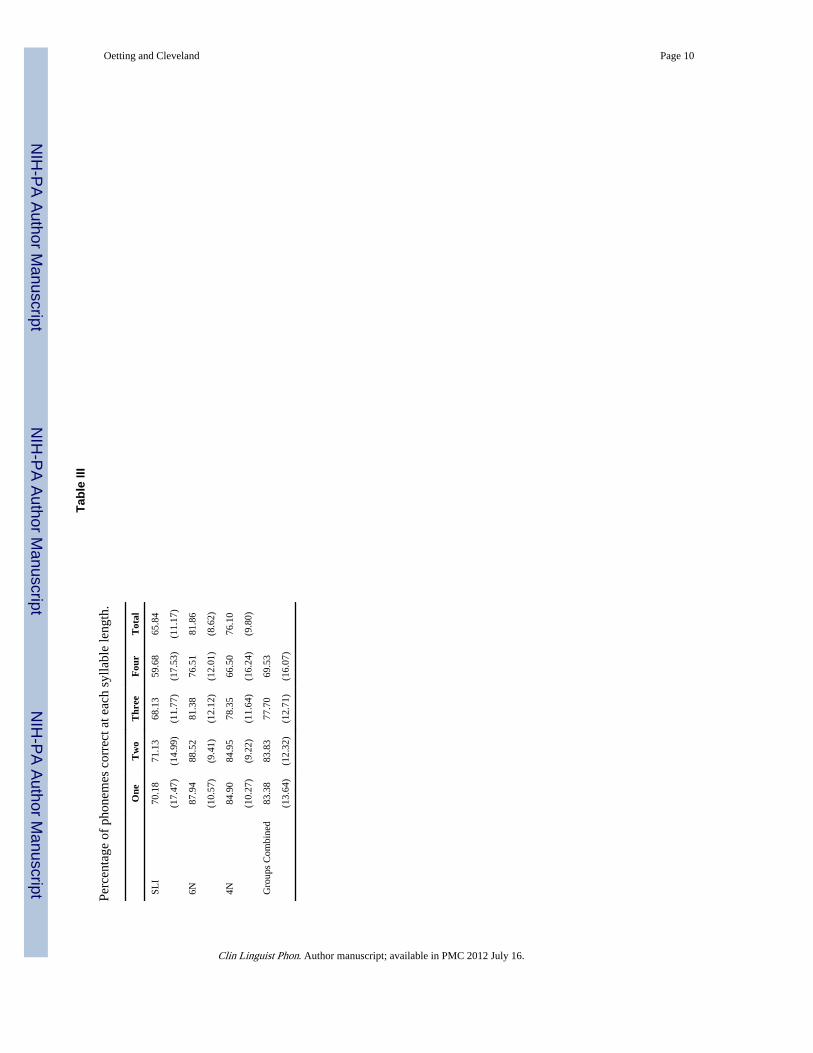
NWR scores were examined with a mixed ANOVA with group and race as the between-subjects variables and syllable length as the within-subjects variable. Only main effects forgroup and syllable length were significant; group F(2, 77)=16.12, p<.001, partial n2=.30,and syllable length F(3, 231)=30.02, p<.001, partial n2=.28 (see Table III). These maineffects remained even when a group by syllable length ANOVA was rerun with thechildren’s standardized z scores from the GFTA used as a covariate.
The group main effect was explored with Tukey t-tests and these indicated that scores of thechildren with SLI were significantly lower than both groups of controls. The syllable lengthmain effect was explored with six paired t-tests. These comparisons indicated that scores forthe one and two syllable lengths were significantly higher than the scores of the three andfour syllable lengths; one vs. three t(82)=3.53, p<.001, one vs. four, t(82)=6.82, p<.01, twovs. three t(82)=5.23, p<.001, two vs. four t(82)=8.13, p<.001. The three syllable length scorewas also significantly higher than the four syllable length score, t(82)=5.57, p<.001.
Discriminant analysisDiscriminant analysis is another way to evaluate the utility of a measure for classifyingchildren from different diagnostic groups. Following the work of Conti-Ramsden (2003) andothers, NWR was examined with discriminant analysis on the 52 6-year-olds in the sample.The 4N controls were not included in this analysis because within clinical practice, adiagnosis of language impairment is typically based on the age of the child rather than onlanguage expectations of a younger child. A discriminant function with NWR resulted in81% of the children being accurately classified as either SLI or typically developing.Although the sensitivity (i.e., the rate at which children with SLI were identified asimpaired) of NWR was low at 56%, the specificity (the rate at which children in the 6Ngroup were identified as typical) was high at 92%. In addition, the misclassified childrenwere not disproportionately AA or W. For both racial groups, two children with SLI weremisclassified as a 6N case, and for the misclassified 6N children, three were AA and fourwere W.
To determine whether we could improve the diagnostic accuracy of NWR, we also ranadditional discriminant analyses that included other test scores from the battery. Given that
Oetting and Cleveland Page 4
Clin Linguist Phon. Author manuscript; available in PMC 2012 July 16.
NIH
-PA Author Manuscript
NIH
-PA Author Manuscript
NIH
-PA Author Manuscript
the PPVT-R and TOLD-P2 were used to select all of the children in the SLI group and someof the children in the control groups, scores from these tests were excluded fromconsideration. Of those remaining, moderate correlations between them and the NWR totalswere found (NWR and CSSB: r=.56, p<.01; NWR and z scores of GFTA: r=.60, p<.01;CSSB and GFTA: r=.34, p<.05). A discriminant analysis with NWR and CSSB led to thehighest level of diagnostic predictability, correctly classifying 90% of the children(sensitivity=81% and specificity=94%). No other tool or combination of tools of the threelisted above (NWR, CSSB, z scores from the GFTA) achieved this level of diagnosticaccuracy.
Item analysisThe final analysis examined the NWR error patterns of the children. At the level of theindividual, none produced errors that were solely omissions or substitutions. Also, becauseall of the phonemes except /dʒ, k, u/ were repeated within the stimuli, we were able toconfirm that every child correctly produced each phoneme at least once within the stimuli.For the children who made an omission or substitution error with /dʒ, k, u/, their ability toproduce these targets was confirmed through visual inspection of the GFTA raw data.
We also searched the data for the three types of error patterns that may have been related tothe children’s use of a non-mainstream dialect of English (either southern White or southernAfrican American). Seventeen children produced 20 monophthongal variants of /ɑɪ/ and /ɔɪ/. The SLI group produced five of these patterns, the 6N group produced 11, and the 4Ngroup produced four, with the AA children producing 14 and the W children producing six.With a total of 1245 /ɑɪ/ and /ɔɪ/ contexts within the data (15 vowels × 83 children), afinding of 20 indicates that glide weakening of these diphthongs was rare (<2%). Syllabledeletion of unstressed initial and medial syllables was also rare as only two instances of thispattern were found in the children’s responses. Finally, for final consonant devoicing of /b/and /ɡ/, 12 examples were found. The SLI group produced one of these examples, the 6Ngroup produced five, and the 4N group produced six, with the AA children producing eightand the W children producing four. With 747 final /b/ and /ɡ/ contexts within the data (9 ×83 children), a finding of only 12 devoiced productions indicates that this pattern, like theothers, was rare (<2%).
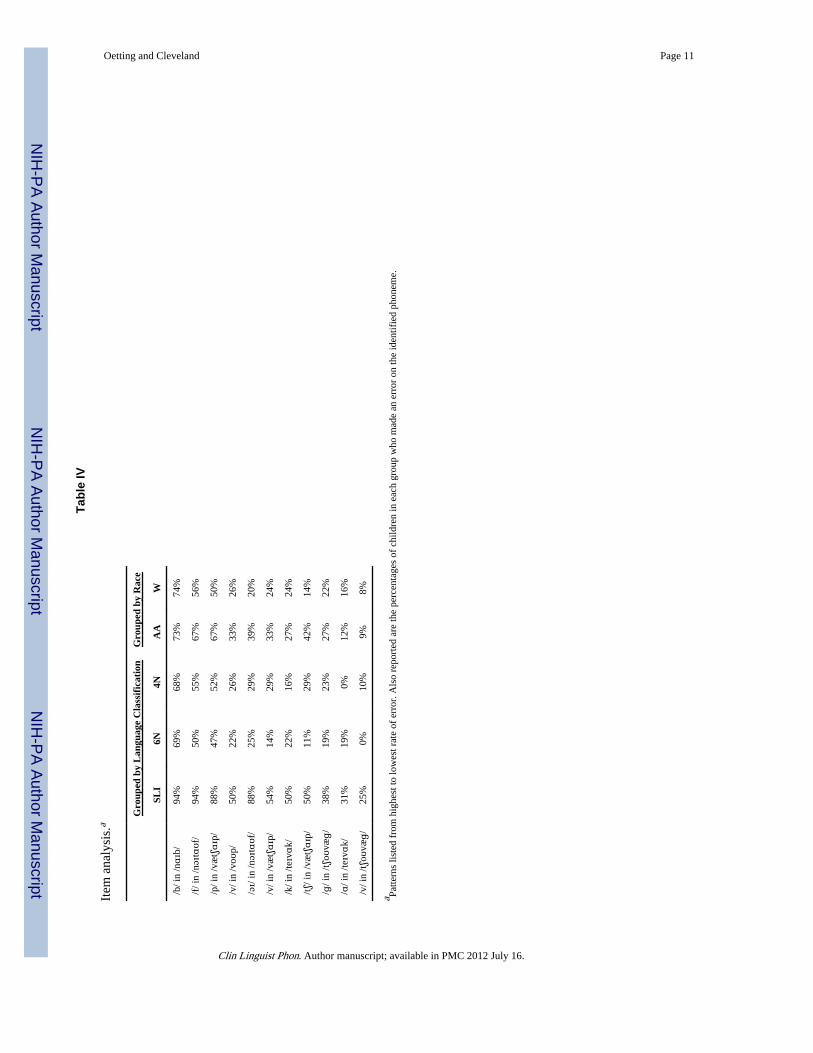
At the level of the groups, the phonemes that received the greatest numbers of errors werehighly similar across the children. To illustrate this finding, Table IV lists the phonemes onwhich an error was produced by 20% of more of the children in each group. This table wasgenerated using the children’s responses from the first eight words of the stimuli since mostof the phonemes (all but /i/ and /u/) within the entire set were included within these items.As can be seen, the rank ordering of these phonemes, from most often in error to least, wasrelatively similar across the groups.
Finally, for each of the phonemes listed in Table IV, an error analysis was completed. Ineach case, the patterns of error across the groups were similar. For example, the finalconsonant /b/ in /nɑɪb/ was most frequently produced as a /v/ for all three groups, withomissions and substitutions involving /f, d, t/ also occurring infrequently. For medial /tʃ/ in /vætʃɑɪp/, the errors were primarily substitutions involving /t/ and /s/, with omissions andsubstitutions involving /dʒ, θ, ð, ʒ, ʃ/ occurring infrequently. Finally, for the diphthong /ɔɪ/in /nɔɪtɑʊf/, the most frequent error pattern was the production of /oʊ/, with substitutionsinvolving /ɑɪ/ and /i/ occurring infrequently. None of these error patterns or others withinthe data suggested that the NWR results were directly tied to a developmental difference inthe children’s phonological systems. Moreover, none of these error patterns suggested aracial and/or possible non-mainstream English dialect bias within the stimuli.
Oetting and Cleveland Page 5
Clin Linguist Phon. Author manuscript; available in PMC 2012 July 16.
NIH
-PA Author Manuscript
NIH
-PA Author Manuscript
NIH
-PA Author Manuscript
DiscussionResults indicated that NWR is affected by a child’s diagnostic classification but not a child’srace. These findings are consistent with others that have examined NWR, but the currentstudy is the first to document both of these findings in the same study with children who areas young as six years of age. This study is also the first to report these findings while alsoexamining and ruling out phonological (as measured by single word articulation skill) anddialectal (as measured by non-mainstream pattern use) confounds within the results at thelevel of the individual items. Nevertheless, the results also indicated that for children whoare 6-years-old, NWR should not be used as the sole indicator of a child’s language ability.Although a discriminant function involving NWR accurately classified 92% of the controls,the classification accuracy of the children with SLI was only 56%. This low sensitivity rateis similar to Conti-Ramsden’s (2003) rate of 59% for 5-year-olds. Sensitivity rates in the50% range are too low to be useful in clinical practice.
When we combined NWR with scores from one other tool, however, the diagnosticpredictability of the discriminant function yielded a fair sensitivity rate (81%) and a goodspecificity rate (94%). Conti-Ramsden (2003) also reported rates of sensitivity andspecificity that were above 80% for 5-year-olds when NWR was combined with scores froma second language measure. Thus, the results from of these studies support the use of NWRas long as it is administered with other tools within an assessment.
The results of Conti-Ramsden’s research and ours underscore the need for future research toexamine the clinical utility of combining different testing batteries within an assessment. Inthe current study, the second tool included within the discriminant function was the CSSB,whereas in Conti-Ramsden’s study, the second tool was a measure of regular past tensemarking. Although items on the CSSB are very different from a probe of past tense, the useof these tools within the individual studies was based on previous findings. The CSSB wasexamined here because this tool has been shown to be culturally appropriate for US childrenfrom minority backgrounds (Pena & Quinn, 1997). For Conti-Ramsden’s children who livedin the UK, a number of studies in the US and UK have implicated past tense marking as aclinical marker of SLI for children who are Standard English speakers (Tager-Flusberg &Cooper, 1999). Whether similar or dissimilar combinations of tools are needed for thedifferent types of child language learners who live in the US, UK, and elsewhere is animportant topic for future study. To examine this issue, cross-validation studies should becompleted first to examine the robustness of our findings and those of others.
AcknowledgmentsThe project was made possible by a LEQSF grant from the LA Board of Regents and an RO3 grant from NIDCDawarded to the first author. The authors would like to thank the teachers, parents and children who participated inthe research, and Lesley Eyles, Anita Hall, and Karen Lynch for help with different aspects of the study.
ReferencesBailey, G. The relationship between African American vernacular English and White vernaculars in
the American South: A sociocultural history and some phonological evidence. In: Landhart, S.,editor. Sociocultural and historical contexts of African American English. Philadelphia, PA: JohnBenjamins; 2001.
Burgmeister, B.; Blum, H.; Lorge, I. Columbia Mental Maturity Scale. San Antonio, TX:Psychological Corp.; 1972.
Campbell T, Dollaghan C, Needleman H, Janosky J. Reducing bias in language assessment:Processing dependent measures. Journal of Speech, Language, and Hearing Research. 1997;40:519–525.
Oetting and Cleveland Page 6
Clin Linguist Phon. Author manuscript; available in PMC 2012 July 16.
NIH
-PA Author Manuscript
NIH
-PA Author Manuscript
NIH
-PA Author Manuscript
Conti-Ramsden G. Processing and linguistic markers in young children with specific languageimpairment. Journal of Speech, Language, and Hearing Research. 2003; 46:1029–1037.
Conti-Ramsden G, Botting N, Faragher B. Psycholinguistic markers for specificlanguage impairment.Journal of Child Psychology and Psychiatry. 2001; 42:741–748. [PubMed: 11583246]
Dollaghan C, Campbell T. Nonword repetition and child language impairment. Journal of Speech,Language, and Hearing Research. 1998; 41:1136–1146.
Dunn, L.; Dunn, L. Peabody Picture Vocabulary Test-Revised. Circle Pines, MN: American GuidanceService; 1981.
Ellis Weismer S, Tomblin J, Zhang X, Buckwalter P, Chynoweth J, Jones M. Nonword repetitionperformance in school-age children with and without language impairment. Journal of Speech,Language, and Hearing Research. 2000; 43:865–878.
Goldman, R.; Fristoe, M. Goldman-Fristoe Test of Articulation. Circle Pines, MN: American GuidanceServices; 1986.
Habans, L. Unpublished master’s thesis. Baton Rouge: Louisiana State University; 2000. Use of theStanford-Binet in language assessment of southern African American and white children.
Hinkle, D.; Wiersma, W.; Jurs, S. Applied statistics for the behavioral sciences. Boston, MA:Houghton Mifflin Company; 1998.
Horohov J, Oetting J. Effects of input manipulations on the word learning abilities of children with andwithout specific language impairment. Applied Psycholinguistics. 2004; 25:43–67.
Kayser, H. Intervention with children from linguistically and culturally diverse backgrounds. In: Fey,M.; Windsor, J.; Warren, S., editors. Language intervention: Preschool through the elementaryyears. Baltimore, MD: Paul H. Brookes; 1995. p. 315-331.
Newcomer, P.; Hammill, D. Test of Language Development-Primary: Second Edition. Austin, TX:ProEd; 1988.
Oetting, J. Children’s use of prepositions to learn verbs. Baton Rouge: Louisiana State University;2003. Unpublished manuscript
Oetting J, McDonald J. Non-mainstream dialect use and specific language impairment. Journal ofSpeech, Language, and Hearing Research. 2001; 44:207–223.
Oetting J, McDonald J. Methods for characterizing participants’ non-mainstream dialect use withinstudies of child language. Journal of Speech Language Hearing Research. 2002; 45:505–518.
Pena E, Quinn R. Task familiarity: Effects on the test performance of Puerto Rican and AfricanAmerican children. Language, Speech, and Hearing Services in the Schools. 1997; 28:323–332.
Sattler J, Altes L. Performance of bilingual and monolingual Hispanic children on the Peabody PictureVocabulary Test-Revised and the McCarthy Perceptual Performance Scale. Psychology in theSchools. 1984; 21:313–316.
Shriberg L, Kwiatkowski J. Developmental phonological disorders I: A clinical profile. Journal ofSpeech and Hearing Research. 1994; 37:1100–1126. [PubMed: 7823556]
Tager-Flusberg H, Cooper J. Present and future possibilities for defining a phenotype for specificlanguage impairment. Journal of Speech, Language, and Hearing Research. 1999; 42:1275–1278.
Teuber J, Furlong M. The concurrent validity of the Expressive One-Word Picture Vocabulary Test forMexican-American children. Psychology in the Schools. 1985; 22:296–273.
Thorndike, R.; Hagen, E.; Sattler, J. Stanford-Binet Intelligence Scale-Fourth Edition. Chicago, IL:Riverside; 1986.
Washington J, Craig H. Performances on low-income African American preschool and kindergartenchildren on the Peabody Picture Vocabulary Test-Revised. Language, Speech, and HearingServices in the Schools. 1992; 23:329–333.
Woodcock, RW. Woodcock Language Proficiency Battery-Revised. Allen, TX: DLM TeachingResources; 1991.
Oetting and Cleveland Page 7
Clin Linguist Phon. Author manuscript; available in PMC 2012 July 16.
NIH
-PA Author Manuscript
NIH
-PA Author Manuscript
NIH
-PA Author Manuscript
NIH
-PA Author Manuscript
NIH
-PA Author Manuscript
NIH
-PA Author Manuscript
Oetting and Cleveland Page 8
Tabl
e I
Des
crip
tion
of p
artic
ipan
ts.
SLI
6N4N
AA
WA
AW
AA
W
Num
ber
per
grou
p
6 1
0 1
2 2
4 1
5 1
6
Age
in m
onth
s 7
5.17
73.
30 7
1.08
71.
54 5
6.60
54.
50
(5
.70)
(6
.34)
(4
.66)
(4
.76)
(6
.92)
(7
.70)
CM
MSa
94.
50 9
2.60
102.
9210
3.04
92.
1710
1.38
(5
.75)
(3
.95)
(11
.81)
(9.
00)
(9.
95)
(15
.29)
PPV
T-R
b 7
1.67
77.
10 9
0.08
101.
67 8
2.73
94.
62
(4
.18)
(5
.92)
(9
.60)
(14
.21)
(13.
06)
(11.
86)
TO
LD
-P:2
c 7
4.00
71.
80 9
3.42
99.
50 8
7.87
96.
06
(7
.34)
(10.
79)
(5
.51)
(12.
35)
(8
.93)
(9
.56)
GFT
Ad
1
.21
−.6
4
.8
4
1.7
7
.6
6
.6
8
Ave
rage
z s
core
(1
.33)
(1
.25)
(
.85)
(
.78)
(
.31)
(
.88)
Perc
entil
e co
rres
pond
ing
to a
vera
ge z
sco
re 8
9 2
7 8
0 9
674
75
CSS
Be
83.
33 8
4.80
103.
6710
8.83
91.2
010
0.88
(14.
29)
(4
.92)
(11
.90)
(14
.04)
(8.
51)
(10
.28)
a Stan
dard
sco
re o
n th
e C
olum
bia
Men
tal M
atur
ity S
cale
(B
urgm
eist
er, B
lum
, & L
orge
, 197
2). M
ean5
100;
SD
= 1
5.
b Peab
ody
Pict
ure
Voc
abul
ary
Tes
t–R
evis
ed (
Dun
n &
Dun
n, 1
987)
. Mea
n= 1
00; S
D =
15.
c Synt
actic
quo
tient
of
Tes
t of
Lan
guag
e D
evel
opm
ent-
Prim
ary:
Sec
ond
Edi
tion
(New
com
er &
Ham
mill
, 198
8). M
ean
= 1
00; S
D =
15.
d Gol
dman
-Fri
stoe
Tes
t of
Art
icul
atio
n (G
oldm
an &
Fri
stoe
, 198
6). Z
sco
res
wer
e us
ed in
the
anal
yses
. Per
cent
iles
that
cor
resp
ond
to e
ach
grou
p’s
aver
age
z sc
ore
are
repo
rted
for
des
crip
tive
purp
oses
.
e Com
preh
ensi
on s
ubte
st V
I of
the
Stan
ford
-Bin
et (
Tho
rndi
ke, H
agen
, & S
attle
r, 1
986)
. Mea
n =
100
; SD
= 1
6.
Clin Linguist Phon. Author manuscript; available in PMC 2012 July 16.
NIH
-PA Author Manuscript
NIH
-PA Author Manuscript
NIH
-PA Author Manuscript
Oetting and Cleveland Page 9
Table II
Nonword repetition stimuli.
One Syllable Two Syllable Three Syllable Four Syllable
/nɑɪb/ /teɪvɑk/ /tʃinɔɪtɑʊb/ /veitɑtʃɑɪdɔɪp/
/voʊp/ /tʃoʊvæɡ/ /nɑɪtʃoʊveɪb/ /dævoʊnɔɪtʃiɡ/
/tɑʊdʒ/ /vætʃɑɪp/ /dɔɪtɑʊvæb/ /nɑɪtʃɔɪtɑʊvub/
/dɔɪf/ /nɔɪtɑʊf/ /teɪvɔɪtʃɑɪɡ/ /tævɑtʃinɑɪɡ/
Clin Linguist Phon. Author manuscript; available in PMC 2012 July 16.
NIH
-PA Author Manuscript
NIH
-PA Author Manuscript
NIH
-PA Author Manuscript
Oetting and Cleveland Page 10
Tabl
e III
Perc
enta
ge o
f ph
onem
es c
orre
ct a
t eac
h sy
llabl
e le
ngth
.
One
Tw
oT
hree
Fou
rT
otal
SLI
70.1
871
.13
68.1
359
.68
65.8
4
(17.
47)
(14.
99)
(11.
77)
(17.
53)
(11.
17)
6N87
.94
88.5
281
.38
76.5
181
.86
(10.
57)
(9.4
1)(1
2.12
)(1
2.01
)(8
.62)
4N84
.90
84.9
578
.35
66.5
076
.10
(10.
27)
(9.2
2)(1
1.64
)(1
6.24
)(9
.80)
Gro
ups
Com
bine
d83
.38
83.8
377
.70
69.5
3
(13.
64)
(12.
32)
(12.
71)
(16.
07)
Clin Linguist Phon. Author manuscript; available in PMC 2012 July 16.
NIH
-PA Author Manuscript
NIH
-PA Author Manuscript
NIH
-PA Author Manuscript
Oetting and Cleveland Page 11
Tabl
e IV
Item
ana
lysi
s.a
Gro
uped
by
Lan
guag
e C
lass
ific
atio
nG
roup
ed b
y R
ace
SLI
6N4N
AA
W
/b/ i
n /nɑɪ
b/94
%69
%68
%73
%74
%
/f/ i
n /nɔɪ
tɑʊf
/94
%50
%55
%67
%56
%
/p/ i
n /v
ætʃɑɪ
p/88
%47
%52
%67
%50
%
/v/ i
n /v
oʊp/
50%
22%
26%
33%
26%
/ɔɪ/
in /nɔɪ
tɑʊf
/88
%25
%29
%39
%20
%
/v/ i
n /v
ætʃɑɪ
p/54
%14
%29
%33
%24
%
/k/ i
n /teɪvɑk
/50
%22
%16
%27
%24
%
/tʃ/ i
n /v
ætʃɑɪ
p/50
%11
%29
%42
%14
%
/ɡ/ i
n /tʃ
oʊvæ
ɡ/38
%19
%23
%27
%22
%
/ɑ/ i
n /teɪvɑk
/31
%19
%0%
12%
16%
/v/ i
n /tʃ
oʊvæ
ɡ/25
%0%
10%
9%8%
a Patte
rns
liste
d fr
om h
ighe
st to
low
est r
ate
of e
rror
. Als
o re
port
ed a
re th
e pe
rcen
tage
s of
chi
ldre
n in
eac
h gr
oup
who
mad
e an
err
or o
n th
e id
entif
ied
phon
eme.
Clin Linguist Phon. Author manuscript; available in PMC 2012 July 16.