
THE CASE OF CIVIL SERVICE SECTOR IN ETHIOPIA Abu ...
44
Give to AgEcon Search The World’s Largest Open Access Agricultural & Applied Economics Digital Library This document is discoverable and free to researchers across the globe due to the work of AgEcon Search. Help ensure our sustainability. AgEcon Search http://ageconsearch.umn.edu [email protected] Papers downloaded from AgEcon Search may be used for non-commercial purposes and personal study only. No other use, including posting to another Internet site, is permitted without permission from the copyright owner (not AgEcon Search), or as allowed under the provisions of Fair Use, U.S. Copyright Act, Title 17 U.S.C.
-
Upload
khangminh22 -
Category
Documents
-
view
0 -
download
0
Transcript of THE CASE OF CIVIL SERVICE SECTOR IN ETHIOPIA Abu ...

Give to AgEcon Search
The World’s Largest Open Access Agricultural & Applied Economics Digital Library
This document is discoverable and free to researchers across the globe due to the work of AgEcon Search.
Help ensure our sustainability.
AgEcon Search http://ageconsearch.umn.edu
Papers downloaded from AgEcon Search may be used for non-commercial purposes and personal study only. No other use, including posting to another Internet site, is permitted without permission from the copyright owner (not AgEcon Search), or as allowed under the provisions of Fair Use, U.S. Copyright Act, Title 17 U.S.C.
1
TTHHEE DDIISSTTRRIIBBUUTTIIOONNAALL IIMMPPLLIICCAATTIIOONNSS OOFF PPEERRSSOONNAALL IINNCCOOMMEE TTAAXX RREEFFOORRMMSS:: TTHHEE CCAASSEE OOFF CCIIVVIILL SSEERRVVIICCEE SSEECCTTOORR IINN
EETTHHIIOOPPIIAA
Abu Girma Moges**
Abstract
The principles of horizontal and vertical equity are central in fiscal policy. The distributional implications of a taxation system are derived from how the tax codes incorporate these principles for a given pattern of income distribution. This paper examines the distributional issues and implications of personal income tax reforms in Ethiopia with reference to the civil service sector. The theoretical issues and policies are analyzed in light of the 1994 and 2002 income tax reforms. We argue that whereas the reform measures undertaken so far have addressed some problems in the fiscal system, further measures are needed to improve the capacity of the tax code to promote the principles of equity and to encourage capital accumulation and growth efforts. The built-in structure of the tax system, coupled with conventional approaches in tax policy design and implementation, has contributed towards policy stances that weaken the role that the tax system could play in promoting sustainable economic growth and address problems of chronic poverty. Key words: income tax, progressive tax rate, income distribution and redistribution, tax reform. JEL classification: H24

Abu Girma Moges: The Distributional Implications of Personal Income Tax....
2
1. INTRODUCTION Governments make use of fiscal policies to pursue a number of objectives. One of the most common uses of these policies is to mobilize revenue resources that would be used for financing public expenditure. A significant share of this revenue originates from income taxes. This is more apparent in the fiscal system of developed countries than in developing countries. In the developing countries, the fiscal system depends more on indirect taxes since their fiscal network has limited access to the direct sources of taxation. Nonetheless, income taxes are widely used by governments in developing countries for both revenue and non-revenue objectives. One of the objectives of taxation is to generate revenue to the government and perhaps influence the pattern of income distribution without creating costly disincentive factor for labor force participation and capital accumulation efforts. Policymakers combine taxation and government spending policies to address the competing objectives of who should get what from the national production process and how that would affect the incentives to economic agents to engage in economic activities. Changing the distribution of wealth and income, however, is a slow process and consistent and sound public policies are required to address distributional issues over time. The principle of equal sacrifice is at the center in the theory and practice of income taxation and its implications on distributional issues. The traditional rationale of the principle emphasize that those who are better off should pay at a higher rate because they can absorb the loss in utility with more ease than low income taxpayers(Young, 1994:99; Mitra and Ok, 1996:925). However, this rationale does not address and could not be extended to long term issues that shape the patterns of income distribution. The distribution of income is highly influenced by resource endowment, employment opportunities, labor market regulations, educational achievement, work experience, the growth dynamics of sectors, and government policies. The equity principles are commonly interpreted in tax codes as progressive income taxation, which levies tax liability at a progressive rate relative to income, and as a result would make the after-tax income distribution less unequal. Pursuing progressive tax schedule to improve income distribution, however, is problematic because not all differences in income are inequitable and after-tax income need to reflect the contribution of factors in the production process. When the factors market is not distorted and competition broadly guides the allocation and rewards for factors, factors are paid in line with their contribution in the production process. If individual agents work hard, invest on themselves through education, training and experience,

Ethiopian Journal of Economics, Volume IX, No. 2, October 2000
3
exert efforts to save and accumulate economic resources and engage in entrepreneurial activities, their remuneration should reflect these attributes. It is important that the incentive to engage in these activities should be preserved so as to have a healthy dynamics in the national economy. The principle of equal sacrifice has been widely used to formulate income tax policy and design tax schedules. The theoretical and policy debate about income taxes has primarily focused on the nature and magnitude of progressivity of income tax rate structure. The principle states that tax obligations should be distributed in such a way that different income units are treated differently according to their ability to pay. This is based on the premise that higher income groups have higher capacity and the tax-induced sacrifice in utility would decline with income. The principle of equal sacrifice implies not only progressive income taxes but also a stronger conditionality of progressive marginal tax rate (Mitra and Ok, 1996). The main issue is how far a government should pursue such principle and implement progressive income taxation on money income. Is it possible to reshape the distribution of income by tax policy without affecting the average level of income in the system? If not, what are the balancing mechanisms to achieve a compromised objective of equity oriented economic growth. Do equity principles in taxation help a country address the underlying factors that influence the distribution of income? These are some of the issues that need to be addressed from theoretical and policy perspectives. In the context of a poverty stricken and subsistence agriculture dominated economy, the choice of policy objectives between growth and equity is always contentious. In an economy where generalized poverty is dominant, the issue of increasing total output of the country takes precedence over the distribution issues. Economic policies should be geared towards increasing aggregate output and realizing the potentials of its economic agents and the national economy. In such economies, where redistribution has limited potential, the system simply does not have the capacity to generate resources and output that could ensure subsistence for all the population and public policy priorities need to focus on achieving sustainable economic growth that could open opportunities to an increasing portion of the population. In this regard, fiscal policy and other policies need to redirect their effort towards enabling economic agents realize their economic potential and in the process enable the economy achieve the essential capacity to generate sufficient output and employment opportunities that weaken the grips of chronic poverty in the country. The subject matter of this paper is to analyze the recent income tax reforms in Ethiopia and discuss their distributional implications. The central premise of this

Abu Girma Moges: The Distributional Implications of Personal Income Tax....
4
paper is that a country cannot force redistribution policies through income tax policies upon itself on a sustainable manner without hampering the very process of economic activity. We argue that an equitable distribution of income requires addressing the underlying economic, social and political constraints that give rise of uneven distribution of income and inequality in the system. Information on the Ethiopian civil service sector is used to illustrate the policy and practice of income taxation and recent reform measures. The choice the civil service sector was dictated not only the availability of a relatively better organized data but also for the sector represents one of the implementation organs of public policies. Moreover, relative to the rest of the economy, the sector commands high remuneration for its employees. We examine the remuneration structure and its distributional features, the taxation structure and its progressivity, and its distributional implications within the context of civil service reform program. A quantitative analysis of changes in the salary scale, amendments of the income tax proclamation, and their interactions is conducted. To this effect, the rest of the paper is organized as follows. Section two addresses the main theoretical issues of income taxation and its progression, section three observes the Ethiopian civil service sector and the distribution of remunerations across professional categories, taxable income, and tax liabilities and how the ability to pay and equal sacrifice are addressed in the tax laws. Section four examines the recent income tax reforms in comparative perspective and section five derives relative progression indices of recent tax reforms and their distributional implications. The final section draws concluding remarks. 2. INCOME DISTRIBUTION AND PROGRESSIVE INCOME
TAXATION A fair and egalitarian distribution of income is an important social objective that facilitates the provision of opportunities to all economic agents and to sustain the growth dynamics of an economy. Whereas there is wide agreement on the target of egalitarian distribution of income, the means to achieve such an objective is often times not clear and attempts to impose them involves significant cost to an economy. When markets are fairly competitive and government interventions are kept to the minimum, the distribution of income generally tends to reflect contributions of factor inputs in the production process. The more market forces and competition operate to solve the problem of distribution, the better not only for the sustainability of economic opportunities but also for increasing the size of aggregate output from which individuals would have to share from. These dual processes interact in the economy

Ethiopian Journal of Economics, Volume IX, No. 2, October 2000
5
and policies that influence the distribution of income would have important implications for the size of aggregate output and its growth rate. The ability of individual economic agents to improve their relative share of income in an economy involves a slow and gradual process. In a competitive system, the market allocates factors and income in a way that maximizes allocation efficiency. Differences in income hence basically reflect the underlying differences in the resource endowment, skill, experience, saving behavior of economic agents and perhaps luck. It is therefore difficult, at least in the short-term, to change the distribution of income significantly without distorting the size and growth of total production of goods and services. The implication of such factors in influencing the distribution of income hence is that public policies, including taxation and expenditure policies, should be targeted towards encouraging and creating the opportunities for economic agents acquire and equip themselves with these resources. The extent to which the distribution of income across economic agents reflects the respective contributions of factor inputs is an unsettled empirical issue. Factors markets are far from being perfect and returns to factor inputs are widely regulated in most economic systems. The extent and influence of government regulation on returns to factors varies significantly even if both market forces and regulations seem to play a role in the process. It is therefore an open issue as to what extent could tax policies be used to reshape the distribution of economic resources and income. 2.1 Distribution and Redistribution of Income The issue of distribution of income is closely related to the question of what the total and average levels of income are and how much the individual level of income differs from the average. An economy maximizes its efficiency by rewarding economic resources in line to the contribution of each economic agent. A system achieves a short-to-medium term optimum pattern of income distribution when it is not possible to improve productivity through changes in the relative distribution of rewards for factor inputs. Income distribution is efficient when it rewards factor contributions according to their relative productivity. If economic agents were endowed with and contribute fairly equal economic resources and factor inputs, the system of distribution with reference to either factor inputs or economic agents yields similar outcomes. However, economic agents in reality have different attributes and capabilities. Their factor contributions also vary making their earning capacity differ from the average. Enabling and empowering those economic agents with lower capacity relative to the average improves not only the distribution but also the average income and its growth rate. This is a long-term and slow process that

Abu Girma Moges: The Distributional Implications of Personal Income Tax....
6
requires addressing the underlying differences among economic agents through public policies and inclusive institutional arrangements. However, most governments in practice attempt to redistribute economic outcome instead of addressing the core problems behind capability differences. Such policies were pursued both in the factors markets by administrative control of returns to factor contributions and through fiscal policies that influence the net returns. In both approaches, distortions emerge that influence not only the rate of growth of the national economy but also the sustainability of the redistribution policy. We approach this issue from distribution and taxation perspectives separately and we turn to examine the interaction of the two processes. The size distribution of income, as a measure of dispersion of income relative to the overall average, could be summarized using the Gini-coefficient that measures the degree to which income distribution deviates from its perfectly equal distribution. For our purpose, we deal with discrete income, xi, and its distribution across N income recipients. Consider that the income of N income-units is arranged in an ascending order from x1 to xN: x1 ≤x2 ≤x3 ≤…≤xN [1]
And the corresponding frequency of income units is denoted by w1,w2, …,wN and the total of the income-units, W, is given by summing all income units. If total income is given by X (where X=∑i=1
N wixi ) and the total size of income-units is defined by W (where W=∑i=1
Nwi), then the share of each income-units and their corresponding income share, both relative and cumulative, is computed to observe the distributional patterns. The cumulative share of income of the lowest p percent of income units and the corresponding cumulative share of income is used to generate the Lorenz Curve, L(p). L(p) = ∑j
i=1(xi/X) where 1≤j ≤N [2] Note that L(0)=0 and L(1)=1. In the case of discrete income and with finite data points, the Lorenz curve is piece-wise linear and it broadly follows a convex curve (see figure 1). The Lorenz curve depicts how the distribution of income deviates from perfectly equal distribution as depicted by the diagonal 450 line. Moreover, whereas the 450-line has a constant slope of unity, the Lorenz curve has slopes, defined for each linear segment, that increase from almost zero at lower levels of p to unity that

Ethiopian Journal of Economics, Volume IX, No. 2, October 2000
7
corresponds to the average level of income and increases steadily afterwards. The Lorenz curve is parallel to and have the same slope with the 450-line at the point where the cumulative share of the population attains the overall average level of income. This is also the point where the two curves exhibit the highest vertical difference, captured by the Sultz-coefficient, which measures what it takes to achieve perfect equality starting from a given pattern of income distribution. In other words, perfect equality could be achieved by transferring income from those above the average to those below the average so as to remove deviation of income from the average. This imposed equity objective, however, might influence what the average income will be in the future. We will discuss later on whether it is prudent public policy to impose perfectly equal distribution of income through tax policies without addressing the forces behind such distributional structures. Gini Coefficient, G, summarizes in a single index number the characteristics of the Lorenz curve. It measures the degree by which the distribution of income deviates from perfectly egalitarian distribution. The coefficient is computed from the Lorenz curve. G = 0.5 –∑1
i=0 L(pi) [3] The area under the Lorenz curve for the case of discrete income data could be computed by separately calculating the marginal share of each income unit in terms of income share and population share. 2.2 Income Taxation and Redistribution Taxation is a system of reallocating economic resources from the private sector to the government. It does not necessarily redistribute income from one economic agent to another. When governments levy taxation as a legalized form of siphoning of resources from the public, they determine what is available at the disposal of individual economic agents. What the taxation system does is legalize the claim of resources by the government from the economy through a piece of legislation. Taxation takes the income away from those who earned it, transfers the purchasing power to the government and in the process creates a powerful agent with concentrated revenue power, and influences the behavior of economic agents in factor accumulation, investment, production, and consumption.

Abu Girma Moges: The Distributional Implications of Personal Income Tax....
8
In all fiscal systems, taxation is accompanied by public expenditure measures. However, it is important to note that independent processes and forces guide the taxation and the expenditure components of the fiscal system. Even if there is a tendency for public expenditure to redistribute the resources that were mobilized through taxation, there is little systematic relationship between revenue contribution and benefits. Unless the government is engaged in the public provision of private goods and services, public goods by their very nature do not discriminate across economic agents. Even in the extreme case of public provision of private goods, there is a problem of identifying the preferences and priorities of individuals. This generates inefficient use and allocation of economic resources. The impact of taxation on the pattern of after-tax income distribution, however, depends on the nature and structure of the tax system. It is possible that the government might levy heavy or light tax burden on economic agents and yet maintain the distribution of income intact if it pursues a proportional tax schedule on all income groups. A proportional income tax is neutral in its effect on distribution and a government can generate its revenue without changing the pattern of income distribution. A tax structure can change the relative share of after-tax income of individuals only if it has progressive or regressive tax schedule. In most countries, governments at least nominally pursue tax policies to influence the pattern of income distribution besides mobilizing revenue. To this effect, the income tax schedules have progressive tax rate structure with an increasing marginal tax rate. This practice of income taxation has an equalizing effect by levying a larger share of tax liability to higher income units and hence reducing the after-tax income gap across income groups relative to its pre-tax distribution. In this sense, progressive taxation is a method of levying a relatively higher tax liability on high-income than low-income units and in the process reduces the gap in after-tax income distribution. The distribution of after-tax income is influenced by a number of factors including the pattern of pre-tax income distribution, the level of income tax rate, the choice of tax units, the existence of tax allowances and deductions, the demographic and social consideration of the tax laws, the concept and scope of income for taxation purposes, and most importantly the degree of income tax progression. The degree of income tax progression can be measured in a number of alternative ways each varying in focus, scope and policy implication. The alternative approaches provide different information about the nature of income tax progression and how policies could be designed to shape their configurations.

Ethiopian Journal of Economics, Volume IX, No. 2, October 2000
9
Progressive income tax refers to a schedule where a higher proportion of income is taxed as the level of taxable income increases. There are two justifications behind the tendency of income tax regimes to pursue progressive income tax schedules, namely the principles of horizontal and vertical equity. Horizontal equity objectives require that income units with the same ability to pay should face the same tax obligation whereas the vertical equity principle upholds that income units with different income and capacity to pay should pay different levels of income taxes. This of course raises a number of relevant issues with respect to income tax policy and practice. The fact that the ability to pay is influenced by non-income attributes of income units, such as family size and wealth situations, suggests that the principles could be breached in practice. Moreover, the principle of vertical equity might be compromised if income units have ways to influence their reported taxable income. Even if these principles are upheld, practical challenges remain as to what degree of tax progression is justified on the horizontal and vertical equity considerations. This does not address the problem of what should be the degree of vertical and horizontal equity that fiscal policies should target. The determination of income tax schedules involves both distributive and normative issues. It is essentially a process of determining who should get how much out of total income as net reward to factor contribution in the production of goods and services. A progressive marginal tax structure can help reduce the pre-tax income disparities and in the process leaves all economic agents, except the government, with diminished purchasing power at their disposal. Unless the government is involved in the provision of private goods and services and their distribution is systematically related to tax contribution, which is unlikely and practically impossible, then the problems of resource allocation and efficiency will remain. Even if one is to make such a strong assumption that benefits from public expenditure are closely related to tax contributions, the fact that individuals are deprived of using their resources for purposes that they value the most generates inefficiency of resource utilization. Before we address the distributional effects of a progressive income tax schedule, it is instructive to examine its salient features. Progression could be either structural/local or effective/global in nature. The structural measure of progression focuses on the attributes of a tax schedule for changes in income across economic agents or over time for a given pattern of pre-tax income distribution. The effective or global measure of progression quantifies to what extent income taxation reshapes a given pattern of income distribution. These two aspects of income tax progression provide complementary perspectives that characterize an income tax schedule. To assess the nature and characteristics of income tax schedule with respect to the

Abu Girma Moges: The Distributional Implications of Personal Income Tax....
10
distribution of tax liabilities and after-tax income, we need to examine the main structure of income tax liability determination. The progression of a tax schedule is dependent on the proportion of income that is taxable, the provisions of lump sum allowances and income or expenditure related deductions, and the prevailing marginal tax rate and how it grows with respect to taxable income. The ability of the fiscal network to capture important components of the economic power of income units, such as non-cash compensations, fringe benefits, imputed income from owner occupied house and the like, is important from equity principles in the taxation system. Accurate measurement of such income flows is difficult and yet they are unevenly distributed with significant erosion on the tax base. If we consider gross income, Z, to measure cash and non-cash income, imputed income, and income derived from wealth endowments and the like, the equity principle is breached as far as taxation is not based on such a comprehensive concept of income. If the portion of gross income that is used for the purpose of income tax computation is denoted by y, then Z-y measures income and capacity to pay that escapes the taxation network altogether. Depending on the nature of the fiscal network, such erosion of the taxation base could be significant and plays an endogenous role in influencing tax policies and rates on reported income. Moreover, tax regimes in practice provide lump sum allowances, a, and income related deductions, d(y), further reducing taxable income. Taxable income, xi, is then determined by reducing income related deductions and allowances. xi=yi-a-d(yi) [4] The lump sum allowance, a, is equal and applies commonly across all income units and the rationale for its provision is to exempt subsistence income from paying taxation. This argument, however, is not compelling since the tax system has not negative taxation or subsidies for income units whose income falls short of the subsistence threshold. Applications of income-related deductions are limited for specific cases such as pension and other social security contributions and deductions are allowed at the same rate, d. Even if income tax regimes in practice have provisions based on non-income attributes of income units, for reasons that will be clear later on, we assume that all income units with equal taxable income are treated the same irrespective of other attributes. The fact that most income tax schedules are piece-wise linear in a given domain of taxable income bracket provides a way to summarize their features in tax equations.

Ethiopian Journal of Economics, Volume IX, No. 2, October 2000
11
This may provide a useful tool to computing the tax obligations as well as analyzing the salient features of the income tax schedules. Let the marginal tax rates for each class of taxable income brackets are denoted as follows:
0<α1<α2<α3<…<αn And the corresponding threshold of income in each tax bracket on which the marginal tax rates applies is denoted as:
β1<β2<β3<…<βn
The income tax function, t(x), for a given amount of taxable income, could be summarized for each income tax brackets as follows: 0 for x0 ∈ (0, β0] α1x1+ θ0 x1 ∈ (β0, β1] α2 x2+ θ1 x2 ∈ (β1, β2] t(xj) = … [5] …
αn xn +θn-1 xn ≥βn-1 Where α1, α2, …, αn denote the marginal tax rate for each tax bracket (with αj ≠αj+1); 0< αj < 1 ; and θj = t(βj) - αj+1βj for all j = 1,2, …, n-1. When the tax function is partitioned linear, progressive tax could be defined from two perspectives. The tax structure would be progressive if x⇒ [t(x)/x] is a non-decreasing mapping on R++. An alternative and stricter concept of progressive tax structure is marginal rate progression where marginal tax rate is non-decreasing everywhere suggesting convex tax function with α1< α2 < … < αn. Under such a setting, there are a number of fiscal provisions that are commonly practiced and might affect the effective progression of a tax schedule. As we mentioned above, the horizontal and vertical equity of a taxation system could be compromised and its effective progression altered whenever the concept of income for the purpose of taxation fails to measure income in a comprehensive manner. Income units with sources of income that escape the fiscal definition of income in effect evade part of their tax liability and hence breach the principle of horizontal equity. Moreover, the practice of providing allowance and income related deductions

Abu Girma Moges: The Distributional Implications of Personal Income Tax....
12
introduce elements of progression in the taxation system. First, lump-sum allowance for all income units irrespective of their income level provides a decreasing share of income as allowance as the level of income increases. This implies that, ceteris paribus, as the level of income, y, increases so does the proportion of income that is categorized as taxable income, x. In other words, if an income unit A has a 10 percent higher income than unit B, and similar amount of allowance is provided for both, then unit A will have more than 10 percent higher taxable income than unit B. Second, some taxation regimes allow expenditure and income related deductions or similar provisions for income units, in our notation, d(y). These provisions reduce the taxable income proportionately and hence reduce the progression of the tax schedule. Taxable income declines proportionate to income and partially reverse the progressive elements introduced by allowances. The interaction of these two provisions of allowances and deductions would ultimately determine how the tax burden is distributed across income units and constitute the base effect in the progression of a tax schedule. The other element in the tax function that influences the progression of the tax schedule is the marginal tax rate, αj, and how it varies across tax brackets. The marginal tax rate is a critical factor that determines the tax liability within each respective tax brackets and its increasing structure ensures the overall progressivity of the tax schedule. In most income tax regimes, the marginal tax rates are largely determined in an arbitrary manner with little theoretical justification. And yet, changes in the marginal tax rate constitute a core policy variable and arguments about income tax reform are largely intended to change the marginal tax rate for its rate effect is the dominant factor that influences progression (Young, 1994). Progressive income taxation also implies elastic revenue collection with respect to changes in the level of taxable income. This has important macroeconomic stability implications. Moreover, there is inflation tax that imposes implicit taxation on income units beyond the explicit cash based taxation. In most tax schedules, the determination of tax liability is based on nominal income of tax units. Even if the cross section observation of a taxation structure remains more or less intact, inflation introduces extra taxation on income units. When pre-tax income increases, in real or nominal terms, income tax revenue increases more than proportionately if the income tax structure is progressive. However, unless we assume indexation of income, changes in nominal and real incomes exhibit wide differences leading to extra taxation1. 1 Inflation also affects progression by altering the impact of and justification for allowances and deductions in the tax schedule on the overall progression. This concern poses the critical issue of what is the appropriate base of taxation and whether taxation should be based on nominal or real income.

Ethiopian Journal of Economics, Volume IX, No. 2, October 2000
13
We examine the properties of a progressive income tax schedule from its basic functional relation. Consider the following income tax function: ti = t(xi) [6] Where xi refers to taxable income of an income unit and t(.) is the corresponding tax liability function. If we further denote the average tax rate by ATRi = t(xi)/xi, and the marginal tax rate, MTR=d[t(x)]/dx, then we can express the different approaches to quantify the degree of progression in income taxation. The essential feature of a progressive income tax schedule is that the average tax rate increases steadily with the increase in taxable income. That is: d(t(x)/x)/dx > 0 for all x. [7] This is equivalent to the condition that the marginal tax rate should be higher than the average tax rate2. Progression can be measured in terms of either structural or distributional contexts. The structural progression measures the extent to which an income tax schedule distributes tax liability and hence after-tax income across income units. It is a measure of how average and marginal tax rates increase as the level of taxable income increases. A related approach of measuring tax progression, effective tax progression, quantifies how the distribution of tax liability and after-tax income are influenced by the taxation regime relative to the distribution of pre-tax income. Progressive income taxation implies deviation from proportional distribution of tax liability in a sense that average tax rate increases with the level of taxable income3. Progressive income tax implies tax burden is distributed in such a way that average tax liability increases with the level of taxable income so that after-tax income is distributed more equally than would have been the case in proportional tax regime. Departure from proportionality could emerge either because of the progression in tax liability, or looked from another perspective, regressive impacts on the residual or after-tax income distribution across income units. The tax liability progression, LP(x) which measures the elasticity of income tax with respect to a percentage change in
2 Expanding the inequality, we have: d(t(x)/x)/dx > 0 ⇒{[MTRx-t(x)]/x2 }>0 ⇒ {(MTR-ATR)/x}>0⇒MTR>ATR 3 Average tax rate can increase even if the marginal tax rate is constant or declining. Strictly speaking, the principle of equal sacrifice and progressive taxation requires progressive marginal tax rate.

Abu Girma Moges: The Distributional Implications of Personal Income Tax....
14
income, should be above unity to qualify for income tax progressivity. In other words, progressive income taxation implies that: LP(x) =εt(x), x =[∆t(x)/t(x)]/[∆x/x]=[∆t(x)/∆x]/[ t(x) /x]= MTR(x)/ATR(x) > 1 [8] A closely related measurement of tax progression is residual progression, RP(x), that measures the responsiveness of after-tax income relative to a percentage change in income. RP(x)= εx-t(x), x=[∆(x-t(x))/(x-t(x))]/[∆x/x]=[(1-MTR(x))/(1-ATR(x))]<1 [9] The implications of both measures of elasticity is that income tax liability is distributed in such a way that tax liability increases or after-tax income increases more (less) than respectively as the income of tax units increases by one percent. Besides these measures, it is also possible to quantify the degree of progression of a tax schedule by the structure and growth of the average and marginal tax rate with respect to income. As we mentioned earlier, the average tax rate and its growth with respect to income levels is an important indicator of progression. Average rate progression hence measures how the average tax rate changes when the level of taxable income changes. This condition could be expressed to mean that marginal tax rate should be greater than the average tax rate for income levels. The average rate progression, however, is not a strict criterion. Progressive income taxation requires a stricter condition that the rate of growth of the marginal tax rate should be greater than zero. The effective or global measure of income tax progression deals with how the distribution of pre-tax income has been reshaped by the adoption of a certain tax schedule. It compares the pre-tax Lorenz-curve with the concentration curves of after-tax income distribution and the concentration curve of tax liability distribution. These measurements of the structural and effective progression of a tax schedule relative to a given pattern of income distribution could also be complemented by measures of relative share adjustment that show how the income tax regime influences the relative share of income units in aggregate income and tax liability. The income tax schedule leads to relative share adjustments in the income and tax liability of income units and can be observed from two interrelated measurements, namely, the relative income share progressivity [RISP] and relative tax share progressivity[RTSP] (Baum, 1987; Agrawal, 1994).

Ethiopian Journal of Economics, Volume IX, No. 2, October 2000
15
The relative income share progressivity (RISP) measures the impact of income tax on the relative income share of a certain income group: RISP j = {[Yj - Tj]/[Y-T]} ÷ {Yj /Y} [10] Where Yj measures pre-tax gross income of group j; Tj is the tax obligation of group j; and j refers to the jth group of income earners and taxpayers. Y and T denote the aggregate income and tax of the population under consideration. Rearranging the terms and expressing the average tax rate, t = T/Y, we can express RISP as4 : RISPj = [1-tj]/[1-t] [11] A value of RISPj<1(>1) indicates that the jth group of taxpayers pays a higher (lower) relative share of taxes than they would have paid under a proportional tax, making the tax burden relatively heavier (lighter) on the group under consideration. The sequence RISPj (j =1,2, …, k) describes the overall progression of the income tax schedule. A decreasing RISP from low income to higher income groups of taxpayers indicates progressivity. Note that proportional income tax has RISPj = 1 for all j groups maintaining the pre-tax share of the respective groups. A related concept of measuring tax progressivity, the relative tax share progressivity (RTSP), measures how average tax rates are configure along the income ladder. This measurement compares for each income units their average tax burden relative to the overall tax liability of the whole income units. Hence: RTSPj = [Tj/T]/[Yj/Y] = tj/t [12] The two approaches of measuring tax progressivity are related to each other since we can express one in terms of the other. In notations, RISPj = [1- t (RTSPj)] / [1-t] [13]
4 RISP is related to the average rate progressivity (ARP) concept that measures the rate of change in average tax rate as income changes. That is: ARPj =dtj /dYj =d (T/Y)j /dYj = -Tj / Yj
2 and the rate of change in RISP with respect to pre-tax income is: dRISPj / dYj = d ({[Yj - Tj]/[Y-T]} ÷ {Yj /Y}) /dYj = [-Tj /Yj
2]/ (Y-T)/Y = ARPj /(1-t)

Abu Girma Moges: The Distributional Implications of Personal Income Tax....
16
The two concepts of income tax progressivity are systematically related since the average tax rate, ranging between zero and unity, could link them as a weighted average of the two measurements5. A change in average tax rate that alters all the after-tax income in the same proportion keeps the RISP unchanged. The RISP indicates the re-distributive impact of income taxes at disaggregated levels. This section has focused on the examination of the issues of how, for a given pattern of income distribution, the income tax regime and its progression shape the pattern of after-tax income distribution. We argued tax policies alone could not address the problem of inequality of income that is a reflection of economic, political and social forces in a system. However, the tax policies could be refocused towards encouraging economic agents in the accumulation of capital, employment generation and technological progress. In the subsequent sections, we deal with the issues with particular emphasis on the Ethiopian civil service sector. 3. THE ETHIOPIAN CIVIL SERVICE SECTOR The subsistence agriculture dominated economy of Ethiopia has left its imprints on the output, employment, export, and living standards in the country. The majority of the population earns its living from subsistence agriculture whose productivity can support only bare survival and leaves half of the population in chronic poverty. Income per capita and productivity is not only low but also has stagnated for a long period of time. Addressing the chronic poverty situation, creating the environment in which the pace of economic growth is fast and sustainable, and sharing economic opportunities to an increasing proportion of the population are fundamental policy challenges in the country. The role of the government in economic affairs is a controversial issue the rationale of which changes over time and depends on the level of development of the country under consideration and the development of market forces. However, it is clear that in the context of developing countries, governments and their prudent intervention in the economy could increase their developmental role and enable the private sector to realize its potentials. The role of the government in Ethiopia and its intervention in the economy exhibited remarkable shifts with the political regimes in power. The stance
This is simply quotient of the ARPj divided by the ratio of after-tax to before-tax income or one minus the overall average tax rate. Since (1-t) is a constant at a given point in time, the rate of change in RISP with respect to income of an income group is a constant proportion of the change in the average tax rate. 5 The notation could be put as a weighted average of RISP and RTSP since; (1-t). RISPj + t. RTSPj = 1

Ethiopian Journal of Economics, Volume IX, No. 2, October 2000
17
of government intervention was minimalist during the Imperial regime followed by rampant interventionist stance of the military regime. Since 1991, the country has been on the reverse and gradual course in terms of government policy stance. The civil service sector closely followed these patterns over its relatively short span of operation. Ethiopia has undertaken a number of reform measures in recent years that attempt to redefine, reorient, introduce and liberalize various factors that had impact on the economic, political and social sectors of the country. Several developments occasioned the need for reform measures and fresh start: the change in government, the end of the long civil war, serious and unsustainable macroeconomic imbalances, excessive domestic and external debt situation, under-capacity operation of public enterprises, weak and corrupt bureaucratic and civil service system, weak and depressed private sector, chronic and generalized poverty situation, and pressure from the international financial institutions. These factors created the opportunity to open a new chapter and have influenced the policy stance of the government. The broad tenet of the reform measures has been allowing market forces and the private sector play active role in the economy, and in the process, redefine the role of the government in economic affairs. Effective delivery of public services and implementation of economic policies are essential for the functioning of an economy and require the employment of skilled, motivated, honest, professional and responsible civil servants6. The civil sector of the country has been inefficient and its capacity to deliver public services has been weak and deteriorating over time. The accumulated problems and weaknesses of the civil service sector necessitated undertaking a comprehensive civil service reform measures. The main themes of the recent civil service reform measures consist of improving the efficiency and effectiveness of the civil service, improving the quality of public services and increasing the capacity of the sector to conduct core government functions. In most accounts, the size and quality of the civil service sector in Ethiopia indicate thinly distributed, centralized and urban concentrated patterns. The majority of the population has no access to basic public services. These problems necessitated ad hoc measures to address pressing issues in the civil service sector and yet addressing the problems of the sector on a sustainable manner required major reforms in civil service policies. The initial measures of redrawing the political
6 The concepts of civil service sector and civil servants do not have unambiguous and universally applicable definitions. The different interpretations of the concepts generate important distinctions in practice. We define the civil service sector in which career professionals at the federal, regional and local government levels and branches of

Abu Girma Moges: The Distributional Implications of Personal Income Tax....
18
map of the country, formation of states in a federal structure, and decentralization and devolution of decision making resulted in reallocation, retrenchment, and recruitment of civil servants. These initial measures, coupled with problems of transition and political interventions, stretched the already limited capacity of the civil service sector and threatened the capacity and willingness of civil servants to execute their professional responsibilities to administer and implement public policy decision at different hierarchy of government. The civil service sector has expanded from its small size over the years. However, the rapid expansion during the 1970s was closely related with the policy of the former military regime of Ethiopia to pursue socialist political ideology and its policy of economic management by central planning. This was also helped by the overriding influence of the policy thinking of the time in which the role of the government in economic affairs was widely acknowledged and countries pursued interventionist policies. The share of the public sector in the national economy increased dramatically, partly through the massive program of nationalization of privately owned manufacturing industries, land, financial institutions, wholesale and retail businesses, hotels, extra urban houses, health and educational institutions. New ministries, agencies, corporations and departments were created in the government sector to control and guide the economy. The public sector expanded rapidly replacing and displacing the private sector and the nascent competitive market mechanism. The process created large-scale demand for skilled labor force in these newly expanding sectors and the government became the dominant employer in the formal sector. Despite the fact that the formal sector provided employment to only about 5 percent of the labor force, the public sector maintained dominance with a share of more than 70 percent in the formal labor market. Moreover, trained manpower to execute the policies of the government was in high demand. The expansion was so rapid that there emerged apparent shortage of skilled manpower and lack of institutional capacity of the public sector to undertake its new responsibilities. The government attempted to address the problem by imposing restrictions on labor mobility, automatic employment and central allocation of graduates from higher education institutions for various public sector positions and allowing individuals to assume posts with lower qualification than technically required. These factors gave rise to inefficient civil service delivery and relatively high cost of public service provision. These approaches had their toll on the quality of services. It is also notable that the scope and quality of civil service has remained weaker than the average
government provide service to the public on permanent, contractual or temporary basis. The focus is on non-political

Ethiopian Journal of Economics, Volume IX, No. 2, October 2000
19
figure portrays because of its urban bias leaving the majority of the rural population without basic public services. The rapid expansion of civil service employment had budgetary implications and the government made use of socialist “wage equalization” policies such as salary ceilings, delays in promotions and freezing remuneration rate, and conducting implicit taxation on earnings to cope with the problem. For instance, the minimum wage remained at Birr 50 per month since 1975 until the salary scale adjustment raised the level to Birr 105 effective in 1993/47. These measures helped somewhat limit the expansion of payroll but created disincentive factors especially for highly skilled and experienced civil servants. And yet, in the context of high and rapidly increasing population, there is under provision of public services in Ethiopia. The country has a ratio of civil servants to population of about 5 per 1000 population, among the lowest ratios in Sub-Saharan Africa countries (Lienert and Modi, 1997). The civil service sector, however, should be observed in the context of the rest of the economy. In light of the agrarian dominated, low productive, and very low per capita income economy, the public sector in Ethiopia commands considerable premium in terms of income and employment opportunity to those who manage to secure employment in the sector (Taye, 1999). As an important component of the public sector, the civil service sector also commands wage premium especially for lower grade jobs. Even the minimum wages remained significantly higher than the average per capita income in the country. Moreover, civil servants enjoy higher wage premium than comparable positions in the infant private sector and this is especially true for the lower grade and less skilled workers. These features, coupled with developments in the labor market, have given rise to polarizing tendencies in the labor market. Whereas highly skilled and experienced civil servants have increasingly attractive offers from the non-government sector to which most, if not all, take the opportunity at the expense of privileges in the public sector, those with lower grade civil servants have little opportunity to benefit from joining the private sector. This process might have resulted in the concentration of less educated, less trained and inexperienced, and less motivated civil servants to remain within the civil service whereas others search for better opportunities elsewhere. This contributed to deterioration in the quality of public services,
civil servants, also excluding the military and the workers in corporations and government parastatals. 7 During the same period, the price level has increased by more than 330 percent that implies a real wage of only Birr 15.15 per month just before the salary adjustment. The salary adjustment effective in 1994 raised the minimum wage by 110 percent and yet could not even maintain the real wage of 1975. In other words, to just maintain the real wage of 1975, the minimum wage needed to increase to Birr 165 per month.

Abu Girma Moges: The Distributional Implications of Personal Income Tax....
20
expansion of corrupt and rent seeking practices, as well as inefficient use of public resources. Civil servants in the Ethiopian public sector8 constitute about a third of government employees. This class of employees consisted of 241,316 workers by 1992/3 and has grown gradually even if the main expansion was in the unskilled and clerical categories especially in the regional states (IMF, 1999). Professional and science service workers constituted about 8.2 percent. The administration service workers had a share of about 3.1 percent of the total whereas sub-professional service workers were the majority comprising about 43.3 percent of the total work force in civil service. The erosion of the real earning of civil servants has given rise to a number of consequences affecting the overall working environment and productivity in the provision of government services. Civil servants have lost their motivation, increasingly seeking moonlighting, rent-seeking, and corruptive activities. However, this window of opportunity was open only to those civil servants in key positions with some discretionary power of decision. The nature of official duties is such that different class of civil servants would have different access and success of averting the erosion in their real earnings. The moral ground and ethics of public duties and responsibilities have deteriorated to such an extent that the collective rule of the game tends to support abusive behavior than sense of public service in the face of wide spread poverty and destitution in the society. Professionals and scientists and to some extent other service workers benefit from some forms of fringe benefits making their remuneration higher than what it appears. The distribution of fringe benefits, however, is somewhat arbitrary and non-transparent that there is no clear account of how such benefits are used to compensate for the falling real wages of some of the civil servants. 3.1 The Distribution of Salary in the Civil Service Sector The distribution of earnings in the civil service sector reflects broadly human capital attribute, performance of the national economy, government policies, and forces in the labor market. The design of remuneration scheme needs to take into account the skill and professional requirements of the different positions in the civil service, the labor market situation of the country, the cost of living and inflationary conditions in
8 The civil service excludes the military, public parastatals, and Ethiopian delegations abroad in embassies and international organizations.

Ethiopian Journal of Economics, Volume IX, No. 2, October 2000
21
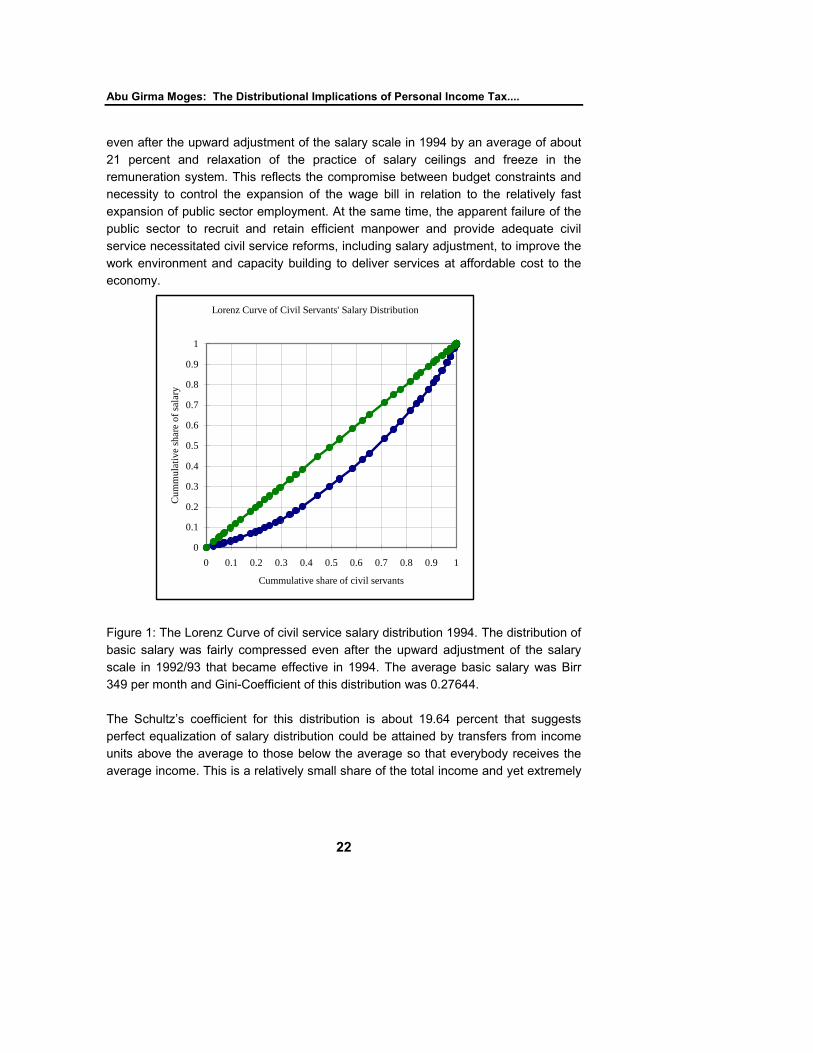
the economy, incentive preserving capacity of remuneration and the like. The differentiation of the remuneration according to skills, leadership qualities, competence and achievements of civil servants are important factors in attracting and maintaining efficient and motivated civil servants. The civil service sector in Ethiopia represents a small portion of the labor force and yet it enjoys remuneration package that is significantly above the average income in the country. Since most of the civil servants are skilled and experienced, the remuneration should reflect these attributes. The main issue of interest is what should be the principle that guides the design of remuneration package for civil servants. Whereas it is important that income distribution should reflect differentiations that are inherent in the human capital attributes of the labor force, ad hoc measures to adopt salary adjustments that do not reflect overall performance of the economy would cause problems. Unlike the private sector where performance and pay are largely guided by the forces of the labor market and negotiations between employers and employees, the public sector usually administratively determines the remuneration scheme. In a setting where the salary scale has been administratively and centrally determined, as is the case in civil service sector in Ethiopia, establishing transparent and clear criteria with reference to the remuneration system is a process that needs to balance fiscal constraints, the need to improve the remuneration system, and maintain the overall wage bill within affordable range to poverty-ridden taxpayers. The problem of valuation of civil service output, and the practice of measuring output of public services by the cost of providing the services, makes designing efficient and cost effective remuneration scheme difficult. Moreover, it is important to take into account the remuneration in the non-government sector in comparison to civil service payments of comparable positions since it reflects the opportunity cost to civil servants and for the social value of income depends on relative as well as absolute remuneration of economic agents. The policy of socialist wage equalization and excessive compression of the salary scale created significant distortions and failed to differentiate among civil service positions with different skill and expertise requirements. The current distribution of salary across civil servants in Ethiopia exhibits the remnants of wage equalization attempts and various constraints to address the problem in a comprehensive manner. As figure 1 portrays, the salary scale was highly compressed as reflected by the Gini-coefficient of about 0.276 for the salary scale regime during the early 1990s. The bottom 50 percent of the civil servants received about 30 percent of the total wages and salaries whereas the top 10 percent of civil servants had a share of about 20 percent of the total salary. This was the situation
Abu Girma Moges: The Distributional Implications of Personal Income Tax....
22
even after the upward adjustment of the salary scale in 1994 by an average of about 21 percent and relaxation of the practice of salary ceilings and freeze in the remuneration system. This reflects the compromise between budget constraints and necessity to control the expansion of the wage bill in relation to the relatively fast expansion of public sector employment. At the same time, the apparent failure of the public sector to recruit and retain efficient manpower and provide adequate civil service necessitated civil service reforms, including salary adjustment, to improve the work environment and capacity building to deliver services at affordable cost to the economy.
Lorenz Curve of Civil Servants' Salary Distribution
0
0.1
0.2
0.3
0.4
0.5
0.6
0.7
0.8
0.9
1
0 0.1 0.2 0.3 0.4 0.5 0.6 0.7 0.8 0.9 1
Cummulative share of civil servants
Cum
mul
ativ
e sh
are
of sa
lary
Figure 1: The Lorenz Curve of civil service salary distribution 1994. The distribution of basic salary was fairly compressed even after the upward adjustment of the salary scale in 1992/93 that became effective in 1994. The average basic salary was Birr 349 per month and Gini-Coefficient of this distribution was 0.27644. The Schultz’s coefficient for this distribution is about 19.64 percent that suggests perfect equalization of salary distribution could be attained by transfers from income units above the average to those below the average so that everybody receives the average income. This is a relatively small share of the total income and yet extremely

Ethiopian Journal of Economics, Volume IX, No. 2, October 2000
23
difficult to pursue as a public policy9. The attempt to bring everybody to the average in this manner without due consideration to the apparent and genuine differentiation of income units in terms of productivity and human capital attributes would not be prudent and is counterproductive. Instead of generating sustainable equity, it generates long lasting disincentive problems affecting the decision behavior of economic agents in terms of human capital accumulation and efforts towards higher productivity. All the same, the coefficient quantifies what it takes to bring about immediate equality across income units. In practice, there are differentiation of workers according to their skills and educational achievement and remunerations should at least partially reflect such attributes. There are political and economic factors, besides budget constraints, that hinder the adoption of transparent and efficient remuneration schemes. The adjustment of the remuneration scheme, liked with overall indicators of performance, should take into account further variables in the labor market to maintain appropriate incentive scheme. First, adjustment of the salary scale must evaluate the current salary scale from a number of perspectives. Does the remuneration system property reflect the difference in human capital among the work force? Are positions in the civil service filled by competent workers with appropriate educational background and experience? Are there appropriate mechanisms to evaluate performance of civil servants and reward them accordingly? Is the remuneration system transparent and merit based enough to provide incentive for current and future public servants to join and develop their career? Second, on the basis of these evaluations, and subject to budgetary implications, the salary scale adjustment needs to take into consideration how the measures affect the relative income of civil service positions. Adjustments should realistically reflect skill differentiations and efficiency of civil servants and due consideration should be taken both comparative and absolute level of payments. Third, the adjustment process should take into account changes in the cost of living between salary adjustments. Inflationary pressure creates arbitrary redistribution of purchasing power and erosion of real earnings leading to problems that could not be solved by adjustment of remuneration scheme alone. This requires broader macroeconomic stabilization policies and commitment of price stability in the economy.
9 Considering the fact that this implies only those earning above the average income, which consists about 41.9 percent of civil servants, should bear the cost of equalization, it indeed becomes a considerable burden. The cost involves progressive taxation (extortion) of earnings from those earning above the average ranging from 5.6 percent to 83.3 percent of basic salary or on average 32.05 percent of the basic salary of those above the average earnings.

Abu Girma Moges: The Distributional Implications of Personal Income Tax....
24
Turning to the issue of salary adjustment in the civil service sector of Ethiopia, two important scale adjustments for civil servants were undertaken in 1994 and 2002. First, the adjustments as components of the first generation of civil service reform program focused on salary adjustment to remove the accumulated erosion in real earnings. They have not addressed the problems of matching remuneration with the human capital and experience requirements of the various positions in the civil service. Since the current remuneration scheme does not reflect such differentiations, it requires comprehensive revision of the scheme. The marginal adjustments seem to emphasize, more for political reasons, on increasing wages for lower grade positions by a significant percentage than higher level positions. This can further distort the relative reward system and incentive for professionals and administrators with possible implications on service delivery, public resource utilization, and behavior of employees towards their career in the public sector. Second, the salary adjustments so far were not sufficient enough to clear the accumulated erosion of real earnings over time. The fact that the salary adjustments made only marginal adjustment for higher grades, the erosion in the real wage was more pronounced in the higher professional grades. As Appendix table 1 summarizes, the salary adjustment in 1994 increased the wages for the first 10 grades by an average rate of about 80 percent whereas grades 51-56 got salary increment of about only 5.2 percent. The salary adjustment hence was far short of removing the disincentives that the remuneration scheme generated. The average salary increment in 2002 was significant compared to the previous ones and stability of prices in recent years suggests considerable rise in the real earnings of civil servants. The administrative measures to adjust the salary scale at a lower rate for higher grade job positions, even if it was necessitated by financial constraints and political imperatives, exacerbates the disincentive factor. The low grades, such as high-school graduates and manual workers, the salary increment was significant making its wage premium even higher compared to comparable positions in the private sector. However, for the professional and scientific category, the salary increment in November 1994 was between 4.75 percent and 6.4 percent whereas the cost of living was increasing many folds. The measure has kept the expansion of the wages and salary bill in check. However, the determination of remuneration with limited consideration on merits and human capital attributes of civil servants is problematic and generates more serious problems. There were different reactions to such developments. Qualified and competent civil servants simply left for alternative and high salary paying jobs. Others responded by engaging in moon lighting activities that could provide additional resources to maintain their standard of living. And yet others learn the art of using their positions as a means of earning income even if that means

Ethiopian Journal of Economics, Volume IX, No. 2, October 2000
25
engaging in illegal and corrupt practices. And the rest, somewhat lost motivation of public service and translated their frustrations into refusal to provide timely and good quality service to the public. There is a real risk that the civil service sector might be left with demoralized, incompetent and corrupt workers unless the growing concern is addressed in time. Third, the erosion in the real wages and salaries of civil servants has not been evenly distributed. Some of the civil servants receive in-kind payments and fringe benefits that are not captured in the monetary payment data that we have discussed earlier10. The allocation and entitlement criteria for such benefits are not transparent and yet the imputed value of some of the fringe benefits could be even more than the basic salary of these employees. Such benefits consist of housing, chauffer driven cars, board directorship in various public enterprises, subsidized services and the like. The monetary value of these benefits is not imputed and conceals the distribution of remunerations and the real cost of running the civil service. This practice also creates a behavior among civil servants to seek compensation in the form of non-taxable and non-monetized benefits which might contribute towards inefficient use of public resources. The recent amendment of the income tax code and the provision that the imputed monetary value of fringe benefits would be included in the computation of income for the purpose of income taxation, if appropriately implemented, would help depict a better and clearer picture of the distribution of earnings across civil servants11. The remuneration structure and the distribution of monetary income in the civil service sector has been compressed and lacks realistic depiction of the actual cost of running the government bureaucracy and related institutions. The recent adjustments in the salary scale and the amendments in the income tax laws have had a decompression effect both on the distribution of before and after-tax income across the civil service sector. Considering the federal civil service sector alone, the gini-coefficient has reached 0.3807 compared to the index level of 0.2764 during the
10 Currently, there are an estimated 423,000 publicly owned houses in the country. Most of these houses were nationalized from private owners with the exception of a small number of houses built by the government over the years. Of the total occupants, 40 percent are civil servants. Around 15,000 of these houses are used rent free by politicians, civil servants, and other government officials. The remaining houses have rents far below the market rent indicating considerable subsidies and abuse of public property as well as a continuation of gross injustice with respect to the legitimate former owners of the houses. 11 Income tax proclamation no. 286/2002 promulgated and yet the Council of Ministers regulation exempted income derived from board directorship in public enterprises from income taxation. Such a practice might encourage most high ranking civil servants and political appointees to seek for such nominal positions and generate extra sources of remuneration with income tax exemption privileges. However, it is important for the tax policy of the country to recognize and incorporate the imputed value of in-kind remuneration to public servants and other tax payers for the purpose of income taxation.

Abu Girma Moges: The Distributional Implications of Personal Income Tax....
26
1990s. It is also important to note that while salary adjustment and pecuniary incentives are important factors in attracting and retaining skilled and efficient civil service sector, the work environment and the opportunities to develop career plans and freedom to exercise decision making on professional and ethical manner without excessive political intervention remain important elements of the overall remuneration and job satisfaction of career civil servants. In a number of countries in sub-Saharan Africa, including Ethiopia, external donors recommend for aid recipient governments to adopt a rule of thumb that attempts to contain the wage bill around 6 percent of GDP (Lienert and Modi, 1997; FDRE, 2004). This quantitative guidance serves as a broad parameter to set the total wage bill in the public sector, which constitutes roughly a third to half of their recurrent expenditure. This figure does not take a comprehensive view of the cost of running a government and the economic cost involved in the process. This is particularly the case when there are widespread cases of inefficient use of public resources, unreported non cash and in-kind remunerations, and under provision of quality public services. In the context of poor countries, where chronic poverty and stagnation is common, the wage bill and related payments in the public sector become relatively expensive for the economy. Addressing the issues in the public sector payment scheme hence depends ultimately on the performance of the rest of the economy and it becomes important to relate remuneration in the public sector with the performance of the rest of the economy. What better criteria could there be more than the performance of the non-government sector for which public servants suppose to serve. It is not affordable for an economy that suffers from hostile policy environment and stagnates over an extended period of time and yet its policymaking and implementing agencies to deserve improved remuneration scheme. It is necessary for the public sector in developing countries to pursue proactive measures and initiatives that facilitates and actively promotes the performance of the rest of the economy. Establishing this critical linkage forms the basis for all public servants to have a vested interest in exerting their best effort towards promoting the growth of the economy. 4. INCOME TAXATION OF CIVIL SERVANTS We have discussed in the last section the issue of the distribution of remuneration in the civil sector of Ethiopia. This section focuses on how taxation of income reshapes the pattern of distribution and other issues that arise in the process. The income tax regime of Ethiopia defines income from employment for the purpose of taxation as the basic salary of the individual and the taxation unit is the individual employee. Non
Ethiopian Journal of Economics, Volume IX, No. 2, October 2000
27
cash payments including fringe benefits largely escape the computation of taxable income. We examine the practice of income taxation in Ethiopia, and the various amendments to the tax laws, from the perspective of the definition of taxable income, allowances and deductions allowed for tax exemptions, the appropriate unit of taxation and as to whether income taxation should be based on nominal or real earnings of tax units. One of the weaknesses of the income tax regime is its failure to develop a comprehensive measurement of income for the purpose of taxation. This should in principle include resource inflows to the tax unit from various sources including employment income. Moreover, individual employees are considered as income units for taxation purpose. It is relevant to note, however, that in a country where family is an important unit of economic decision making and where family values are still strong, the practice of income taxation based on the income of the employed individual alone would breach important equity principles. The practice makes individuals with the same level of income, and yet with different family attributes and capacity to pay, liable for the same income tax obligation. With respect to income taxation on civil servants, it is possible to identify the main factors that are considered in the computation of tax liability and its progression. First, the level of taxable income is determined by reducing lump sum allowance from the basic salary and reducing pension contributions from the basic salary. The recent amendments in the income tax code and schedule in 1994 increased the amount of allowance from Birr 105 per month to Birr 120 per month. Furthermore, income tax proclamation 286/ 2002 has increased the level of monthly allowance to Birr 150 per month. These increments have significant base effect on the taxable income. Second, all civil servants contribute 4 percent of their basic salary in the form of pension contribution. This contribution is exempted from income taxation and income tax proclamation 286/2002 provides a provision that allows employees to contribute up to 15 percent of their basic salary in the form of provident fund12. These provisions, when they are available for employees, would provide a significant shield from taxation and the potential impact on the tax base might be rather significant. However, the validity of the argument that allowances are intended to provide relief for all
12 Such schemes were effectively used in some countries to encourage the public participate in planned pension scheme that also significantly increase the domestic saving rate of the economy. In such a setting, the provident fund is centrally administered by an independent body and every individual joining the national provident fund program has a defined account of contribution and withdrawal. If the scheme could be extended to all income units so that such contributions are exempted from income taxation, it could significantly improve the saving rate of the private sector from its recent distressingly low level. This effect could generate long lasting effects on the economy even more than the lost government revenue that such a scheme could result in. However, the practice of exempting provident fund contributions from income taxation without defined provident fund administration scheme would turn the provision into a taxation loophole without necessarily encouraging economic agents engage in saving and investment opportunities.

Abu Girma Moges: The Distributional Implications of Personal Income Tax....
28
income groups for basic subsistence does remain weak and unconvincing. Even if it is true that a certain threshold of income should be exempted from income taxation from welfare considerations, it is not a prudent policy to target welfare objectives through tax policies alone. Such exemptions after all are significant in a country where per capita income hovers around only a third of such basic allowances. If there is a strong reason to reduce the taxation burden of individuals and families whose income falls short of providing basic necessities, which I believe is justifiable argument across low income families, then it is prudent to exempt these families from taxation or even introduce negative taxation schedule. However, the practice of exempting an increasing magnitude of threshold of income across the board from tax liability introduces distortion in the fiscal system. To illustrate our case, we discuss the practice of exemption of a threshold income of Birr 120 per month from income taxation. In 1993/94, about 2.8 percent of the civil servants were exempted from income taxation because their wages were less than the minimum taxable income. Moreover, the income tax code allowed a zero marginal tax rate on the first slice of taxable income of Birr 120 per month for all income tax units whose income was beyond the threshold level. Of the total wage and salary bill, about 34.7 percent lies in this category of income slice that attracts a zero marginal income tax rate. Allowance to average salary ratio stood at 34.4 percent in 1994 indicating the relative significance of allowances in the setting of tax burdens in the fiscal system. This share is rather significant and is by no means a trivial magnitude to be ignored in light of the narrow income tax base of the Ethiopian fiscal system. The problem remains to be addressed. This built in feature of the schedule effectively erode the base of taxable income and tempts fiscal authorities to resort to all sorts of revenue generating schemes some of which have significant adverse effect on economic behavior and performance. This introduces a source of inefficiency in income tax mobilization which creates a strong leak to the taxation system. It is important to reconsider how to effectively use such allowance schemes towards promoting basic welfare and social objectives. Income tax is calculated according to the tax schedule that classifies the taxable income categories with the corresponding marginal tax rate. It is progressive in that a higher proportion of income is taxed as income increases. The overall computation of the tax obligation depends on the level of gross earnings, provisions for tax exemptions in the form of exemptions and allowances, and the corresponding marginal tax rate in each taxable slice of income. We turn our discussion of the assessment of the income taxation to examine the schedules and tax rate structure.

Ethiopian Journal of Economics, Volume IX, No. 2, October 2000
29
4.1 Income Tax Schedules The Ethiopian income tax code and schedule has recently been amended. A closer examination of the recent income tax schedules 13 will be used to develop our argument in the previous section in light of the repeated amendments of the schedules. The current income tax schedule (income tax proclamation no. 286/2002) is a further amendment of the 1992 (proclamation no. 30/1992) and 1994 income tax schedules (proclamation 107/1994). The amendments have had significant effects on the marginal tax rate, the structure of income taxes, and taxable income, and distributional issues14. The comparison of the recent three income tax schedules exhibits remarkable shifts in the structure of the income tax in which the tax brackets broadened considerably and the maximum marginal tax rate, adjusted for taxable income, reduced from 50 to 35 percent for twice taxable income of the appropriate category. The current income tax schedule departs from its predecessors in a number of ways. First, each taxable income bracket is broader with a reduced number of income brackets. The wider the tax bracket relative to the overall range of the taxable income, the tax structure move more towards flat tax rate structure. The more the income of civil servants falls within one tax bracket, the more the tax schedule approaches flat rate or proportional tax schedule. Second, the marginal tax rates were reduced at each segment of the taxable income brackets. The maximum marginal tax rate now is 35 percent as compared to 40 percent according to proclamation no 107/1994 and 50 percent according to proclamation no 30/1992. Each income tax amendment, however, increased the taxable income threshold for exemption as a result of which allowances increased from Birr 120 to the current Birr 150 per month15. The practice of exempting the first slice of income from taxation for all tax-payers irrespective of their earnings poses some problems in the context of the Ethiopian fiscal system. What makes the case typical in Ethiopia is that the allowance is significant relative to the average payroll of civil servants and average per capita income in the economy.
13 The income tax schedule of Ethiopia was amended in 1992(proclamation 30/1992) replacing a highly progressive income tax schedule (proclamation 155/1978) with the maximum marginal tax rate of 85 percent. Despite the staggering figures of the statutory schedule, however, the total number of civil servants whose salary exceeds the 20 percent marginal tax rate did not sum up to even one percent of the total. About 96.3 percent of the civil servants had income level less than or equal to the 15 percent marginal tax rate category. 14 Appendix Table 4 summarizes the main features of the recent income tax schedules. 15 The provision of proclamation no. 286/2002 to exempt from income taxation up to 15 percent of basic salary for provident fund contribution has even greater impact on the tax base.

Abu Girma Moges: The Distributional Implications of Personal Income Tax....
30
The progression properties of the income tax schedule indicate that the marginal tax rate is in all instances higher than the average tax rate. Moreover, tax liability progression, which measures the responsiveness of income tax for a percentage change in income, for each taxable income groups is positive and greater than unity. The elasticity ranges from 65.3 when income reaches beyond the threshold level and the income unit starts to pay income tax down to 1.3617 at the highest income brackets. The range, however, is not monotonous since the step wise marginal tax rate structure makes those income levels at the break points exhibit higher elasticity. In the same token, the residual progression of the income tax schedule for civil servants indicates that the elasticity falls below unity for all income range while there are oscillations around the higher marginal tax rate levels. This provides further support to the elasticity of tax liability progression since both indicate how the income tax shapes tax and after-tax income of income tax units. The comparison of relative earnings, their distribution and income taxation in the context of the Ethiopian civil service sector should take into consideration changes both in the salary scale and the income tax schedules. In this respect, we consider how the change in the income tax law affects tax liabilities and the distribution of income. As summarized in appendix table 4, there are important issues of interest that came into the fiscal network with the promulgation of the 2002 income tax proclamation: rise in the threshold level of allowance to Birr 150 per month from Birr 120, widening of the income tax brackets, effective reduction in marginal tax rates when adjustment is made for taxable income domain, the provision for a broader and comprehensive concept of income for the purpose of taxation, and provision for pension contribution in provident fund arrangements up to 15 percent of income. These important introductions to the income tax regime have effects both on the base, tax progression, and the after-tax distribution of income. 4. 2 Income Tax Equations One common feature of the income taxation system in the developing countries is its complexity and this feature has its bearings on the effective implementation of tax codes. There are justifiable reasons to make tax liability computation both simple and transparent so that both taxpayers and tax administrators have a better understanding of tax liabilities and also better chances to identify reform areas. The fact that personal income tax schedules are segmental linear implies that tax liabilities could be summarized in simplified forms as elaborated in equations [4] and [5] above. Appendix table 5 reports the tax equations under the 1994 and 2002 tax schedules. The table indicates that the income tax schedules are progressive with respect to

Ethiopian Journal of Economics, Volume IX, No. 2, October 2000
31
reported cash payments to civil servants. It is also evident that both allowances and deductions have important role in the determination of tax liability. The allowances are significant not only relative to the per capita income of the country but also relative to the average earnings of civil servants. In terms of deductions, so far only pension contributions were allowed for exemption from income taxation. However, the recent tax code provision for provident fund contributions suggests and reflected on the tax equations important impacts on tax liability and on the overall distributional attributes of the tax code. The discussion on the current income tax regime, and the reform measures that were incorporated in the amendments of the tax codes, reveals the weakness of the tax regime to play an important role in addressing core and long-term problems of the economy besides generating revenue to the government. First, the mechanism for provident fund contribution and administration requires establishing independent body that mobilizes and allocates resources from defined contributions for various development oriented and sustainable projects. Second, there is a strong reason to consider income tax exemption provisions to encourage saving and capital accumulation by allowing taxpayers to save aside a certain share, say 10 to 15 percent, of their basic salary in a defined saving program. This is particularly important in light of the very low and declining trend in private sector saving rate of the country. Third, there is unsettled issue with respect to the appropriate base of computing income taxation. Even if a comprehensive definition of income is used for the purpose of taxation, there is a need to determine tax liability based on real capacity to pay. This would not be an issue when indexation is practiced or inflation is literally zero. Even if inflation in Ethiopia has remained within manageable bounds, the computation of the tax liability on nominal earnings distorts important economic principles and exerts extra burdens and implicit taxation on taxpayers. To illustrate the point, we computed inflation rate adjusted income, allowances, and pension contributions and then recalculated income tax liability of average income of civil servants in Ethiopia from 1994 to 2002. We find that the tax liability on the average income was 8.4 percent higher than tax liability computed based on inflation adjusted figures. This indicates extra income tax burden due to implicit taxation and the rate is particularly high for higher income levels and some income groups that would be categorized into higher marginal tax rate due to the practice of using nominal income figures for the computation of income taxation. The income tax equations indicate how simplified tax computation can improve the administration of taxation as well as easily shed light on issues in the income tax system that require reform measures.

Abu Girma Moges: The Distributional Implications of Personal Income Tax....
32
5. INCOME TAX PROGRESSION INDICES In the previous sections, we discussed the distribution of remuneration in the civil service sector in Ethiopia and the practice of income taxation. The interactions of resource distribution and income taxation, coupled with reform measures, is used to analyze the extent to which such policy reforms impacted the capacity of the sector and by implication the economy to address its core challenges. This section addresses the progression properties and indices of the Ethiopian tax regime. The Ethiopian income tax schedule is marginal tax progressive. The rate exhibits an increasing statutory marginal rate. Common in most income tax schedules with progressive income taxes is a zero tax rate for the first slice of taxable income. This applies for all income categories irrespective of the group of income earners. The recent personal income tax reforms in Ethiopia share common features with fiscal reform measures undertaken elsewhere. There is a general tendency to reorient fiscal policy towards encouraging private sector led growth and reduce disincentive effects of taxes. The income tax amendments have reduced the marginal and average tax rates, reduced the number of taxable income brackets, and broadened the taxable income base (OECD, 1986; Wart and Ruggeri, 1991). These reforms have changed the progressivity of income tax rates and hence the distributional impact of income taxes (Agrawal, 1990, Wart and Ruggeri, 1991). The recent reform measures in Ethiopia have increasingly relegated the objective of using income taxes to influence the pattern of income distribution through income taxation mechanisms. The recent focus on reducing the disincentive implications of highly progressive income tax structures, broadening the tax base and reducing the marginal tax rate have become policy priorities that appeal to donors. The recent measures to amend the tax codes and also adjust the salary scale for civil servants provides important background to examine the impact of such measures on progression indices. The data is not comparable over time and its does not have panel attributes. And yet it indicates the structure and degree of progression across positions in the civil service sector and as a partial indicator of distributional changes across income groups and over time. To depict a broader picture, we constructed a consolidated income tax schedule from the recent three tax codes. We computed the relative income share progression (RISP) and relative tax share progression (RTSP) for groups reclassified according to the income tax schedules. The results are reported in appendix table 6. A number of interesting features emerge from the results. First, the average tax rate and the marginal tax rates declined for comparable income categories with each reform measures. Second, the salary adjustment in

Ethiopian Journal of Economics, Volume IX, No. 2, October 2000
33
2002 was significant making all civil servants, including the lowest grades, have income level higher than the allowance threshold for exemption making every civil servant liable for income taxation. Third, the relative income share progressivity, observed across income groups, indicates that under the three tax schedules progressive taxation shifted the relative income share of income groups. As income increases, so does the tax liability to such an extent that the relative income share declines whereas the relative tax share increases. Moreover, under all schedules, the relative tax share progression has been increasing with the level of income in a group. In the case of 1994 tax schedule, those who earned above Birr 4800 per year had RTSP more than unity indicating the increasing share of tax burden relative to the average. The provision under tax schedule 2002 moves the threshold to income above Birr 12,000 per annum beyond which the relative tax share progressivity increases. These features capture the essential and bottom-line impacts of the recent income tax reforms on the after-tax distribution of income. The relative distribution of civil servants in Ethiopia, as indicated in appendix table 4, exhibits high concentration in income groups that attract 10 percent marginal income tax rate. The percentage share varies with the salary scale regime and with the income tax schedule, ranging from 62.5 percent under the 1992 tax schedule, to 87.2 percent under the 1994 schedule and then falling marginally 82.6 percent under the 2002 tax schedule. The income bracket in this group expanded significantly over the reform cycles. Whereas the 1994 income tax reform increased the relative tax share progressivity of this group, the 2002 reform reduced the relative tax share and increased the relative income share of this group. These features suggest that not only is the effective marginal tax rate approaching proportional tax regime, perhaps flat tax rate would have marginal impact on the structure of income taxation. It might also provide further simplification to the taxation system and potentially increasing the effectiveness of tax administration. As Table 6 describes, this group has benefited significantly from the income tax reforms and witnessed its relative income share progressivity increasing and tax share progressivity declining in response to the tax reform measures. The main benefit of the recent personal tax reform accrued to higher salary groups in the civil service. This is clearly depicted by our measures of relative tax progressivity. The amendments in the income tax schedule feature a typical policy move from progressive tax structure to that of flattening the rate schedule. The measures have resulted in the reduction of both the marginal and average tax rates on taxable income. The policy stance unmistakably reflects the tendency among policymakers to discount the role of the tax system in reducing inequality in income distribution and

Abu Girma Moges: The Distributional Implications of Personal Income Tax....
34
instead indicates moves towards a flat tax rate regime that is close to proportional tax rate schedule. There are justifiable economic reasons to avoid using the tax system alone to pursue redistribution objectives since it involves considerable cost to the economy and creates significant distortions in resource allocation. And yet, the taxation system needs to maintain its core principles of horizontal and vertical equity. These principles make the adoption of efficient tax policy to be guided by combinations of equity, distribution, and revenue objectives. As far as the factors market operates reasonably well, the distribution of income should reflect the relative contribution of factors in the production process. It is costly to attempt to rectify problems that emerge from the inequality of opportunities and income in the factors market through taxation policy. Taxation, as is commonly practiced, is effective in siphoning off resources from those who earn it which does not necessarily translate into redistribution in favor of those who find themselves below the average income or opportunities. A sustainable approach to the problem ultimately rests in creating institutional arrangements and policies that promote the realization of the potentials of economic agents to compete and benefit from equal opportunities. The taxation system can address important public priority concerns especially when it is systematically combined with the public expenditure policies. There are serious limitations in the current taxation system that breaches the equity principles. The income tax regulations contain a number of loopholes that fail to assess comprehensively income and extra benefits that should have been included in the assessment of income for taxation. There are non-transparent and arbitrary distribution of fringe benefits, allowances, and subsidized services that never appear in the income tax returns. The underassessment of actual receipts and benefits would widen the inequality within the civil servants, and the rest of taxpayers, under a nominally highly progressive marginal tax rate. It is important to make the taxable income assessment comprehensive enough to reflect the capacity to pay and the tax liability should be determined accordingly.

Ethiopian Journal of Economics, Volume IX, No. 2, October 2000
35
0
0.1
0.2
0.3
0.4
0.5
0.6
0.7
0.8
0.9
1
0 0.1 0.2 0.3 0.4 0.5 0.6 0.7 0.8 0.9 1
Figure 2: Lorenz-and Concentration Curves for Civil Service sector 1994. Note: The Gini- coefficient of the blue curve is 0.27644 and the concentration index, the pink curve, measures 0.26535. A relevant issue in this context perhaps is to what extent has income taxation helped reshape the distribution of income besides generating government revenue. The answer is not very much. The effective tax schedule that is applicable to the majority of income units under our consideration is quite similar to proportional tax schedule and has limited progressive structure. This could be observed by comparing the before and after tax salary distribution among the civil servants. We cannot infer about the implication at national level and that requires a comprehensive study of all taxpayers in the economy. However, our examination of the overall distribution of civil servants’ salary exhibits little change before and after income taxation. Figure 2 depicts the Lorenz cure and the concentration cure. It depicts how much the pattern of income distribution has changed due to income taxation in the civil service sector. It is apparent from the graph that the change is rather marginal and the index of concentration stood at 0.26535 as compared to the Gini coefficient of 0.27644 which amounted to about 4 percent decline in the index. In effect, even at the nominal basis and without taking into account the difference between the reported and total benefits, the progressive income tax structure is not as progressive as its schedule seems to depict at face value. Most of the tax burden has mainly been absorbed by low and middle-income civil servants, and when provisions are made to unreported income, the overall structure tends in effect towards regressive tax structure.

Abu Girma Moges: The Distributional Implications of Personal Income Tax....
36
The distribution of the before and after tax salary of civil servants, for both before and after the 1994 income tax amendment, is depicted to shed a broad picture of the situation and examine the distributional effects of the reform measure. Civil servants were categorized by the nearest deciles. As appendix table 3 summarizes, the bottom 10 percent of the civil servants, which used to get only about 3.25 percent of the total pre-tax earnings, had a marginally higher share of after-tax income of 3.4 percent. The bottom 50 percent of the civil servants received around 29.8 percent of the total earnings and the after-tax income share stood around 30.7 percent and exhibited hardly any change despite the nominally significant reforms in the tax schedules. Extending the observation to take into consideration the income tax reform measure and provisions of proclamation 286/2002, we computed the index of concentration using the 1994 salary scale. Since the provision for provident fund contribution is relatively new to the system and is not being practiced widely, we avoided including it in the computation of taxable income and instead retained the standard deductions and exemptions. The index of concentration curve turned out to be 0.26408 relative to a Gini-coefficient of 0.27644 and a corresponding concentration ratio of 0.26535 under the previous income tax schedule. This would inform us what would have been the change in the after-tax income distribution had the salary scale was not adjusted and hence provides a better footing for comparison. It also provides a clear indication as to the limitations and ineffectiveness of the current income tax schedule to address distributional issues and concerns. The adoption of a revised salary scale and the income tax amendment of 2002 changed both the income and taxation sides of the equation. The scope of the data available for analysis became limited to civil servants in the federal government alone and hence it would not be comparable to the previous analysis. However, it provides some perspectives and general trends. As appendix figure 1 depicts, there is a decompression of the salary scale and changes in the pattern of income distribution is observable. The Gini-coefficient is 0.3807 and the corresponding concentration ratio is 0.36312 or about 4.6 percentage decline in the index. Note that the two indices are not directly comparable and yet it shows how limited effect the income tax reform alone has on the distribution of income. It is therefore apparent that the seemingly progressive tax structure did not change the distribution of salary in the Ethiopian civil service significantly. Moreover, the recent reform measures tend to deviate more from the equal sacrifice principle of income taxation and attempt to emphasize on reducing the disincentive effects of taxation without due emphasis on the overall distributional and equity considerations. This tendency of the income tax schedule to move effectively towards distribution neutrality and breaching the equity principles, coupled with the probable tendency of under reporting of taxable income

Ethiopian Journal of Economics, Volume IX, No. 2, October 2000
37
by higher income groups, suggests that the overall income tax system might share important attributes of regressive tax regime. 6. CONCLUDING REMARKS The design and appropriateness of income tax policy reforms depends on the extent to which it could be used to address priority problems in a national economy. Tax policies, in combination with public spending and other public policies, should encourage the accumulation of capital, promotion of sustainable growth, macroeconomic stability, reduction of poverty, and the realization of economic potentials of the country besides the objectives of revenue mobilization. This paper addresses the issues of income taxation and its distributional attributes based on data in civil service sector. The income tax regime of Ethiopia has progressive statutory tax schedule with nominally high and yet incentive preserving average and marginal income tax rates. However, income taxation was burdensome relative to the declining real income of the civil servants encouraging workers to seek alternative sources of compensation schemes that could easily evade the taxation network. And yet, the effective rate of marginal income tax rate was fairly low since most of the civil servants have wages and salaries that are concentrated within 15 percent or lower marginal tax rate categories. The recent income tax reform measures further reduced the marginal and average tax rates. Income taxation is an important policy instrument in a market oriented economic system. Its design and implementation should be such that it minimizes disincentives on the decision behavior of economic agents and should proactively encourage economic agents improve and realize their potentials. In such a setting, tax policy reforms need to reorient their priorities and change the practice of using income taxation to reshape the distribution of income. The practice of using income taxation as an instrument for redistribution, irrespective of genuine differences among tax units, has limited efficacy and involves considerable cost that hampers the growth of the average income. Tax policies should strengthen the principles of equity and reduce the disincentive effects of taxation. This could improve the capacity of tax policies to address core priorities of the economic system, such as poverty reduction, encourage capital accumulation and saving, and employment promotion. We identified that the taxation regime needs to adopt a comprehensive definition of income for the purpose taxation that reflects the actual capacity to pay, the need for changes in the appropriate unit of taxation, and the weakness of the tax code to provide incentives to economic agents engage in saving and capital accumulation efforts. These reforms can improve the equity attributes of the income tax regime and in the process improve the capacity of the economy to generate sustainable and shared economic growth and opportunities.
Abu Girma Moges: The Distributional Implications of Personal Income Tax....
38
REFERENCES Aggrawal, Pawan K. (1994). “A Local Distributional Measure of Tax Progressivity”
Public Finance, 49(1):1-11. _______. (1990). “An Empirical Analysis of Redistributive Impact of the Personal
Income Tax: A Case Study of India” Public Finance, 45(2):177-192. Baum, Sandra. (1987). “On the measurement of Tax Progressivity: Relative Share
Adjustment,” Public Finance Quarterly, 15(2): 166-187. International Monetary Fund. (IMF). (1999). Ethiopia: Recent Economic
Developments, Country Report No. 99/98, Washington D.C. Lienert, Ian and Jitendra Modi. (1997). “A Decade of Civil Service Reform in Sub-
Saharan Africa,” IMF Working Paper, WP/97/197. Mitra Tapan and Efe A. Ok. (1996). “Personal Income Taxation and the Principle of
Equal Sacrifice Revisited” International Economic Review, 37(4): 925-948. Federal Democratic Republic of Ethiopia (FDRE). (2002). “Income Tax Proclamation,
No. 286/2002”, Addis Ababa, Ethiopia. _______. (2004). Poverty Reduction Strategy Paper Annual Progress Report,
(www.worldbank.org) OECD. (1986). Personal Income Tax Systems under Changing Economic Conditions,
(organization for Economic Cooperation and Development), Paris. Taye Mengistae. (1999). “Wage rates and Job Queues: Does the Public Sector
Overpay in Ethiopia?” World Bank Policy Research Paper, No. 2105. Wart, D. Van and G.C. Ruggeri. (1991). “Tax Reform and the Progressivity of the
Personal Income Tax in Canada” Public Finance, 46(1):134-156. World Bank. (1994). Ethiopia: Public Expenditure Policy for Transition, Report No.
12992-ET. Young, P. (1994). Equity - in Theory and Practice, Princeton University Press.

Ethiopian Journal of Economics, Volume IX, No. 2, October 2000
39
Lorenz-Concentration Curves
0
0.1
0.2
0.3
0.4
0.5
0.6
0.7
0.8
0.9
1
0 0.1 0.2 0.3 0.4 0.5 0.6 0.7 0.8 0.9 1
Cumulative share of civil servants in federal government
Cum
ulat
ive
shar
e of
inco
me/
afte
r tax
inco
me
Appendix Figure 1: Lorenz – Concentration Curves of the Federal Civil Service Sector of Ethiopia, 2002. Note: The Gini-Coefficient for the federal civil service sector is about 0.380703 and the average tax rate was 9.38 percent. The corresponding concentration ratio is 0.36312. Appendix Tables Appendix Table 1: Civil Service Salary Distribution and Increments
Gra
des
Bef
ore
Nov
. 199
4
Afte
r Nov
. 19
94 Weighted
percentage increment in 1994
After 2002 salary
adjustment
Weighted percentage
increment (%)
1-10 11-20 21-30 31-40 41-50 51-56 51-60
50-105 115-247 265-472 500-835 880-1440 1530-2000
105-167 182-326 326-500 532-880 930-1520 1620-2095
79.56 36.65 17.77 5.93 5.71 5.22
200-325 342-560 595-990 1040-1565 1635-2325 - 2425-3575
97.54 66.12 88.75 93.66 73.58 - 32.57
Total range 50-2000 105-2095 200-3575 Average income
288.51 349.13 21.01 724.94 107.64
Note: The data for the 2002 was for the federal civil service sector only and we have no accurate data on the regional civil service sector and the percentage increments in the average salary of civil servants by grade categories is not strictly comparable. Sources: The Wage Board and the Federal Civil Service Commission

Abu Girma Moges: The Distributional Implications of Personal Income Tax....
40
Appendix Table 2: Cumulative percentage distribution of civil servants and their salary in Ethiopia in 1992/3 and 1994
Cumulative percentage of civil servants
Cumulative percentage of wages and salaries 1992
Cumulative percentage of wages and salaries 1994
2.79 5.04 9.63
17.87 19.79
0.48 0.91 1.97 4.49 5.19
0.84 1.58 3.25 6.78 7.70
25.34 29.58 38.49 44.65 49.2
7.66 10.0
16.01 20.92 24.82
10.85 13.53 20.23 25.62 29.87
58.36 65.25 71.35 74.97 81.56 85.78
33.58 41.06 48.4
53.04 62.40 69.05
38.72 46.21 53.55 58.17 67.09 72.91
91.08 96.27 97.78 99.30 100.0
78.47 89.37 93.07 97.49 100.0
81.19 90.73 93.96 97.81 100.0
Source: Wage Board of Ethiopia Appendix Table 3: Cumulative Percentage Distribution of Pre-tax and After-Tax salary in
Civil Service of Ethiopia 1994 Cumulative percentage
distribution of civil servants
1994
Cumulative before tax distribution of
civil servants’ salary 1994
Cumulative after-tax distribution of
income in 1992 tax schedule
Cumulative distribution of after tax income under 1994 tax schedule
Cumulative distribution of
after tax income under 2002 tax
schedule 2.791 5.037 9.628
0.839 1.579 3.249
0.910 1.706 3.486
0.900 1.694 3.475
0.891 1.676 3.448
21.335 29.584 38.488 49.204 62.504 71.348 81.563
8.508 13.533 20.232 29.868 43.112 53.554 67.085
8.999 14.174 21.003 30.758 44.119 54.581 68.022
8.982 14.136 20.930 30.626 43.899 54.304 67.741
9.008 14.198 21.018 30.728 44.006 54.397 67.802
91.081 81.188 81.924 81.704 81.720

Ethiopian Journal of Economics, Volume IX, No. 2, October 2000
41
96.274 99.304
100
90.732 97.811 100.0
91.214 97.972 100.0
91.073 97.917 100.0
91.081 97.921 100.0
Note: The last column is computed with the assumption that the salary for civil servants remained unchanged. It provides a perspective as to how the change in the income tax schedule affected the after-tax income, ceteris paribus, for tax payers whose income did not increase over the period under consideration. Moreover it is apparent that because of the salary scale there is little noticeable change in after-tax income share despite nominally significant changes in the tax schedule. Source: Author’s calculation based on data from Wage Board of Ethiopia.

Abu Girma Moges: The Distributional Implications of Personal Income Tax....
42
Appendix Table 4: Profile of Recent Personal Income Tax Schedules of Ethiopia 1992 tax schedule 1994 tax schedule 2002 tax schedule
Annu
al In
com
e Br
acke
ts
(In B
irr)
Mar
gina
l tax
ra
te (
%)
Civ
il se
rvan
ts
by in
com
e br
acke
t (%
)
Annu
al In
com
e Br
acke
ts 1
994
(In B
irr)
Mar
gina
l tax
ra
te (
%)
Civ
il se
rvan
ts
by in
com
e br
acke
t (%
)
Annu
al In
com
e Br
acke
ts (i
n Bi
rr)
Mar
gina
l Tax
ra
te (%
)
Civ
il Se
rvan
ts
by In
com
e Br
acke
t (%
)**
< 1260 1261 - 4800 4801 - 8400 8401 - 12000 12001 - 15600 15601 - 19200 19201 - 22800 22801 - 26400 26401 - 30000 > 30000
0 10 15 20 25 30 35 40 45 50
2.8 62.5 31.0 3.1 0.6 0.02 0.0034 0.0016 0.0025 na*
< 1440 1400 – 7200 7201 - 14400 14401 - 24000 24001 - 36000 > 36,000
0 10 15 20 30 40
5.04 87.21 7.56 0.191 0.003 na*
< 1,800 1801-7800 7801-16800 16801-28200 28201-42600 42601-60000 >60000
0 10 15 20 25 30 35
11.71 82.60 5.67 0.03 n.a. n.a. n.a.
Note: * na refers to not applicable since the maximum salary of civil servants did not fall in that income bracket. ** refers to the share only to civil servants in the federal government. The data on civil servants in the regional states is not comprehensive enough and yet it does not seem to change the picture as such since most of the civil servants in the regions fall in the lower grades of professional hierarchy. Sources: Ministry of Finance of Ethiopia and Ministry of Inland Revenue (Income Tax Proclamation 30/92; Income Tax Proclamation 107 /1994; Income Tax Proclamation 286/2002. Appendix Table 5: Linear Equation of Personal Income Tax from employment
Cash Income (y) Brackets
(Birr per annum)
Income tax equation with
respect to basic salary
1994
Income (cash + non-cash?)
Brackets (Birr per annum)
Income tax equation with
respect to basic salary 2002b
Income tax equation with respect to basic
salary and deductions for provident fund contributions
Below 1440 1,441- 7,200 7,201 - 14,400 14,400 - 24,000 24,000 - 36,000 More than 36000
0 0.096y1 - 288 0.144y2 - 720 0.192y3 - 1512 0.288y4 - 4056 0.384y5 -7800
Below 1,800 1,801-7,800 7,801-16,800 16,801-28,200 28,201-42,600 42,601-60,000 More than 60,000
0 0.096y1 – 360 0.144y2 – 840 0.192y3 - 1,770 0.24y4 – 3,270 0.288y5 – 5,490 0.336y6 – 8,580
0 0.085y1 – 360 0.1275y2 – 840 0.17y3 – 1,770 0.2125y4 – 3,270 0.255y5 – 5,490 0.2975y6 – 8,580
Source: Author’s computation. Note: Where taxable income xi =yi-1440-0.04yi, Birr 1,440 is annual allowance for each income unit and a 4 percent pension contribution under income tax proclamation 107/1994. Under proclamation 286/2002, there are two scenarios one with 4% pension contribution, the other 15%(the maximum) contribution in the form of provident fund.

Ethiopian Journal of Economics, Volume IX, No. 2, October 2000
43
Appendix Table 6: A Consolidated Income Tax Schedule for Civil Servants and Measures of Income tax progression
Income Group 36/1992 107/1994 286/2002*
Birr Per Year M
TR
ATR
RIS
P
RTS
P
MTR
ATR
RIS
P
RTS
P
MTR
ATR
RIS
P
RTS
P
up to 1260 1261 – 1440 1441 – 1800 1801 – 4800 4801 – 7200 7201 – 7800 7801 – 8400 8400 – 12000 12001 – 14400 14401 – 15600 15601 – 16800 16801 – 19200 19201 – 22800 22801 – 24000 24001 – 26400 26401 – 28200 28201 – 30000 30001 – 36000 36001 – 42600 42601 – 60000 >60000
0 10 10 15 15 20 25 25 30 35 40 40
0 0.87 5.4 8.87 10.3 12.2 14.4 15.8 17.5 19.8 21.8 23.0
0 1.158 1.105 1.065 1.047 1.026 1.000 0.984 0.964 0.937 0.914 0.899
0 0.060 0.375 0.616 0.718 0.847 1.000 1.097 1.215 1.375 1.514 1.597
0 0 10 10 10 15 15 15 15 20 20 20 20 20 30 30 30 30 40 40 40
0.000 0.000 0.443 5.232 7.090 7.713 7.814 8.937 10.373 10.984 11.323 12.237 13.334 13.976 14.331
1.067 1.067 1.062 1.011 0.991 0.985 0.984 0.972 0.956 0.950 0.946 0.937 0.925 0.918 0.914
0.000 0.000 0.071 0.832 1.128 1.227 1.243 1.422 1.650 1.747 1.801 1.947 2.121 2.223 2.280
0 0 0 10 10 10 15 15 15 15 15 20 20 20 20 20 25 25 25 30 35
- - - 4.391 6.512 7.219 7.332 8.748 10.101 10.615 10.891 11.498 12.548 13.146 13.562 14.009 14.309 15.171 16.540 17.262 -
- - - 1.055 1.032 1.024 1.023 1.007 0.992 0.986 0.983 0.977 0.965 0.958 0.954 0.949 0.946 0.936 0.921 0.913 -
- - - 0.468 0.694 0.770 0.782 0.933 1.077 1.132 1.161 1.226 1.338 1.401 1.446 1.494 1.526 1.617 1.763 1.840 -
Note: * the data for the 286/2002 refers to federal civil servants only. MTR, ATR, RISP and RTSP refer, respectively, to marginal tax rate, average tax rate, relative income share progressivity, and relative tax share progressivity. Since the practice of contribution to provident fund is not widely used currently, the computation of tax liability is based on the former procedure. The table consolidates the provisions in the three income tax schedules for income from employment that is applicable to the civil service sector. Source: Computed on the basis of income tax proclamations no 36/1992, 107/1994, and 286/2002 and data from the wage board as well as the Federal Civil Service Commission.