The carbon and nitrogen isotope composition of Australian grasses in relation to climate: Carbon and...
11
See discussions, stats, and author profiles for this publication at: https://www.researchgate.net/publication/230016029 The carbon and nitrogen isotope composition of Australian grasses in relation to climate Article in Functional Ecology · June 2009 DOI: 10.1111/j.1365-2435.2009.01576.x CITATIONS 28 READS 32 2 authors: Some of the authors of this publication are also working on these related projects: Fire and Man View project Brett Murphy Charles Darwin University 70 PUBLICATIONS 1,168 CITATIONS SEE PROFILE David M. J. S. Bowman University of Tasmania 417 PUBLICATIONS 9,110 CITATIONS SEE PROFILE All content following this page was uploaded by Brett Murphy on 26 October 2014. The user has requested enhancement of the downloaded file. All in-text references underlined in blue are added to the original document and are linked to publications on ResearchGate, letting you access and read them immediately.
Transcript of The carbon and nitrogen isotope composition of Australian grasses in relation to climate: Carbon and...

Seediscussions,stats,andauthorprofilesforthispublicationat:https://www.researchgate.net/publication/230016029
ThecarbonandnitrogenisotopecompositionofAustraliangrassesinrelationtoclimate
ArticleinFunctionalEcology·June2009
DOI:10.1111/j.1365-2435.2009.01576.x
CITATIONS
28
READS
32
2authors:
Someoftheauthorsofthispublicationarealsoworkingontheserelatedprojects:
FireandManViewproject
BrettMurphy
CharlesDarwinUniversity
70PUBLICATIONS1,168CITATIONS
SEEPROFILE
DavidM.J.S.Bowman
UniversityofTasmania
417PUBLICATIONS9,110CITATIONS
SEEPROFILE
AllcontentfollowingthispagewasuploadedbyBrettMurphyon26October2014.
Theuserhasrequestedenhancementofthedownloadedfile.Allin-textreferencesunderlinedinblueareaddedtotheoriginaldocument
andarelinkedtopublicationsonResearchGate,lettingyouaccessandreadthemimmediately.

The carbon and nitrogen isotope composition
of Australian grasses in relation to climate
Brett P. Murphy* and David M. J. S. Bowman
School of Plant Science, University of Tasmania, Hobart, Tasmania 7001, Australia
Summary
1. The carbon and nitrogen isotope composition of plants are known to be affected by environ-
mental factors, especially water availability. While d13C of C4 plants is generally assumed to be
much less responsive to environmental variables than that of C3 plants, it is unclear whether the
response of d15N differs between the two photosynthetic pathways.
2. Focussing on differences in the response of members of the C3 and C4 photosynthetic path-
ways to climate variables, we examined the foliar d13C and d15N of grasses collected from natural
vegetation in a wide range of climatic zones throughout Australia.
3. An index of water availability was clearly related to foliar d13C and d15N of both C3 and C4
grasses. There was a negative relationship between water availability and d13C of C3 grasses
(r2 = 0Æ21), similar to that documented extensively in other C3 plants. An opposite, positive
relationship was found between water availability and d13C in C4 grasses (r2 = 0Æ17), an effect
that has been reported only infrequently. Accounting for differences in d13C between the differ-
ent C4 types (NADP-ME, PCK, NAD-ME and Aristida) resulted in a substantial increase in the
fit of the model relating d13C to water availability (R2 = 0Æ48).4. There was a negative relationship between water availability and d15N (r2 = 0Æ40), that wassimilar in both C3 and C4 grasses, but temperature had no effect on d15N. This provides strong
support for the theory that water availability is the dominant factor determining soil and plant
d15N via its effect on the ‘openness’ of the nitrogen cycle.
5. We also found significant differences in d15N between the different C4 types, with the highest
values for PCK, followed by NADP-ME and NAD-ME, and the lowest values for Aristida. The
difference in d15N between PCK and Aristida was large, at 5Æ1&.
6. The importance of water availability as a predictor of d13C in both C3 and C4 grasses suggests
that variation in water availability should be considered when estimating C4 grass abundance
based on d13C measurements (e.g. in herbivore diets or as a contributor to biospheric carbon
sinks).
Key-words: C3, C4, photosynthetic pathway, Poaceae, rainfall, stable isotope, water availability
Introduction
Clear patterns can be seen in the stable carbon and nitrogen
isotope composition (expressed as d13C and d15N respec-
tively) of natural vegetation throughout the world, closely
reflecting climate and other environmental factors. Water
availability appears to be the most important factor, usually
showing a strong negative relationship with both d13C (e.g.
Stewart et al. 1995; Swap et al. 2004; Weiguo et al. 2005)
and d15N (e.g. Handley et al. 1999; Schuur & Matson 2001;
Swap et al. 2004). In the case of d13C however, the negative
relationship with water availability is usually only present
in plants using the C3 photosynthetic pathway. In C4 plants,
d13C is much less variable and relationships with climatic
factors are usually absent (Van Der Water et al. 2002; Swap
et al. 2004).
In C3 plants, d13C is primarily influenced by the ratio of
intercellular to ambient concentrations of CO2 (ci ⁄ ca) (Far-quhar et al. 1989a). Plants regulate ci ⁄ ca by opening and
closing their stomata, in response to a range of environmen-
tal factors, including light (Yakir & Israeli 1995), nutrients
(Raven & Farquhar 1990) and water availability (Winter
et al. 1982). A close relationship exists between ci ⁄ ca and
plant water use efficiency (WUE), which means that d13Ccan provide an estimate of the integrated long-term WUE
of a plant (Ehleringer 1989; Farquhar et al. 1989b). The
relationship between water availability and d13C of natural*Correspondence author. E-mail: brettpatrickmurphy@hotmail.
com
� 2009 The Authors. Journal compilation � 2009 British Ecological Society
Functional Ecology 2009, 23, 1040–1049 doi: 10.1111/j.1365-2435.2009.01576.x

vegetation arises in two ways. First, at an individual level,
plants respond to decreasing water availability by increasing
their WUE, and hence d13C (Farquhar et al. 1989b). Sec-
ondly, plants adapted to more arid environments tend to
have higher WUE, and hence d13C, than plants adapted to
more mesic environments, even when grown in the same
environment (Anderson et al. 1996).
In C4 plants, the effect of ci ⁄ ca on d13C is similar to that in
C3 plants, but greatly diminished, and confounded by post-
photosynthetic fractionation due to ‘leakiness’ of the bundle
sheath cells to CO2 (Farquhar 1983). Depending on the
degree of leakiness, the slope of the relationship between d13Cand water availability can range from positive (e.g. Weiguo
et al. 2005) to negative (e.g. Wang et al. 2005), but in general,
d13C in C4 plants tends to vary much less in response to envi-
ronmental factors than in C3 plants (Henderson et al. 1992).
Perhaps the largest source of variation in d13C in C4 plants is
biochemical subtype, with C4 plants generally divided into
three groups on the basis of biochemistry: NADP-ME,
NAD-ME and PCK, named after their respective C4 acid
decarboxylases. NADP-ME species tend to have the highest
d13C, followed by PCK and then NAD-ME species (Hatters-
ley 1982).
The causes of variation in d15N are much less clearly
understood than the causes of variation in d13C. Although
extensive fractionation may occur within plants (Evans
2001), foliar d15N tends to reflect soil d15N (Austin & Vito-
usek 1998; Handley et al. 1999), and a number of authors
have suggested that it is the ‘openness’ of the nitrogen cycle
that primarily influences soil d15N (Austin & Vitousek 1998,
Handley et al. 1999, Schuur & Matson 2001). In an open
nitrogen cycle, gains and losses of nitrogen are large relative
to the total nitrogen pool. This is typical of arid areas, where
water, rather than nitrogen, tends to be limiting. In more
mesic areas, nitrogen, rather than water, tends to be limiting,
such that it is efficiently recycled, with little leaving the nitro-
gen cycle.
Accurate prediction of foliar d13C and d15N has
numerous applications in ecological studies. Values of
d13C of plant and animal remains can be used to esti-
mate the proportion of plant biomass or diet that was
C4, but typical values of d13C for C3 and C4 plants must
be estimated (Vogel 1978; Witt et al. 1998; Cerling et al.
2006; Codron et al. 2007). Accurate estimates of d13C of
C3 and C4 vegetation are also required for use in global
carbon budgets that estimate the relative importance of
terrestrial and marine carbon sinks from d13C of atmo-
spheric CO2 (Lloyd & Farquhar 1994; Fung et al. 1997;
Suits et al. 2005). Values of d15N of animal remains can
be used to estimate trophic level, as animals tend to be
enriched by 1–5& with each increasing trophic level
(Hobson & Montevecchi 1991; Kwak & Zedler 1997).
However, variation in the d15N signature of plant mate-
rial at the base of the trophic structure must be
accounted for.
While most previous studies of variation in plant d13Cand d15N have focused on woody plants, grasses provide
an opportunity to directly compare the influence of the C3
and C4 photosynthetic pathways on the response of d13Cand d15N to environmental factors, within a single func-
tional group. This is not as readily achieved with woody
plants due to the limited occurrence of C4 photosynthesis
within this group. In this study, we examine the variation
in foliar d13C and d15N of grasses throughout the Austra-
lian continent, in relation to a range of environmental fac-
tors. Given the existing evidence for a close relationship
between water availability and both d13C and d15N in other
plants, we focus primarily on this factor, and evaluate three
hypotheses about isotopic variation in relation to water
availability:
1. there is strong a negative relationship between d13C and
water availability in C3 grasses;
2. there is no relationship between d13C and water availability
in C4 grasses; and
3. there is a negative relationship between d15N and water
availability, similar in both C3 and C4 grasses.
Materials and methods
S AM PL E C O L LE C T I ON A N D AN A L YS I S
Between March 2003 and November 2004, 408 grass specimens were
collected at 173 locations across Australia, encompassing a wide
range of climatic conditions, with locations accurately determined
using a global positioning system (Fig. 1). The vegetation at the col-
lection sites was relatively undisturbed; that is, the native woody vege-
tation had not been cleared. While many of the samples were
collected on land subject to pastoral grazing by sheep and cattle, dis-
turbance due to grazing was typically mild. We included exotic
grasses in our analysis, although these represent only a very small pro-
portion of specimens (Table 1).
Samples of live foliage were collected, pressed in newspaper and
air-dried. In about 25% of cases, no live foliage was available, so
senescent foliage was collected. A number of previous studies suggest
that both foliar d13C and d15N may change as leaves senesce, how-
ever reported trends are highly variable, ranging from negative (Cur-
rin et al. 1995; Cloern et al. 2002; Turney et al. 2002) to neutral
(Garten 1993; Currin et al. 1995; Kolb & Evans 2002) to positive
(Gebauer & Schulze 1991; Narholm 1991; Cloern et al. 2002) in vari-
ous taxa. While variation in d13C and d15N due to senescence is
clearly a potential source of error in this study, we consider it likely
that this would simply increase the overall variability in the data,
and not bias our results in any particular direction. Mature leaves
were selected from each sample, rinsed with deionized water, dried
and ground to a fine powder. Approximately 4 mg of each powdered
foliage sample was placed in tin capsules and analysed using an EA
1110 elemental analyser (CE Instruments, Rodano, Italy) coupled
with an IsoChrom mass spectrometer (Micromass, Manchester,
UK). d13C and d15N are expressed in per mil (&) units, relative
to the Vienna Pee Dee Belemnite and atmospheric N2 standards
respectively.
Specimens were classified as possessing either the C3 or C4 photo-
synthetic pathway (Table 1). If the specimen could be identified to
generic level, pathway classification was made on the basis of that
identification usingWatson&Dallwitz (1992 onwards). If a specimen
� 2009 The Authors. Journal compilation � 2009 British Ecological Society, Functional Ecology, 23, 1040–1049
Carbon and nitrogen isotopes in grasses 1041

could not be identified to genus, classification was made on the basis
of its foliar d13C. Those with d13C less than )19& were considered
C3, and those with d13C greater than )19& considered C4 (Cerling
et al. 1997). While the abundance of C4 grasses, in terms of both spe-
cies numbers and biomass, is sometimes assumed to be related to
water availability, with greater abundance of C4 grasses in arid areas
(Chazdon 1978), in Australia this is not the case. In Australia, C4
grasses are more closely associated with high growing season temper-
atures (Hattersley 1983;Murphy&Bowman 2007b).
Where possible, each C4 specimen was assigned to one of the three
C4 subtypes (NADP-ME, NAD-ME, or PCK), using the lists pro-
vided in Schulze et al. (1996a) and Watson & Dallwitz (1992
onwards). The subtypes are based on physiology and leaf anatomical
characteristics as defined by Prendergast et al. (1987). Following
Schulze et al. (1996a), we also included a fourth subtype, comprising
members of the genus Aristida. While this genus has typical NADP-
ME physiology, it is anatomically distinct from other NADP-ME
grasses, lacking a suberised lamella in its bundle sheath cells (Hatters-
ley 1992).
E N V I R O N M E N T A L D A T A
We examined variation in foliar d13C and d15N in relation to a num-
ber of climatic and environmental variables: a soil water availability
index (WAI), mean annual temperature (MAT), vegetation height
and canopy cover, chenopod abundance and proximity to coast. The
derivation of these variables, and the rationale behind their selection,
is provided below. These variables were selected because they were: (i)
the most likely to have large effects, based on the published literature
and (ii) were easily obtained, and relatively accurate, for each collec-
tion location.
Digital maps of mean annual areal actual evapotranspiration
(AET) and areal potential evapotranspiration (PET), covering Aus-
tralia at a resolution of 0Æ05�, were obtained from the Australian
Bureau ofMeteorology, Canberra. These maps had been constructed
following Morton (1983), and were used to estimate a soil WAI, cal-
culated as: 1 ) AET ⁄PET (Walker & Langridge 1997). MAT for
each collection location was estimated using the computer program
ANUClim 5.1 (Centre for Resource and Environmental Studies,
Australian National University, Canberra). As well as location co-
ordinates, ANUClim requires elevations, which were obtained from a
second resolution digital elevation model of Australia, obtained from
the Australian Spatial Data Directory (http://asdd.ga.gov.au/asdd/).
WAI ranged from 0Æ14 to 0Æ73, equivalent to a range in annual rainfallof 155–1605 mm, andMAT ranged from 6 to 26 �C.
Given that the presence of a tall, dense tree canopy can increase
d13C of understorey plants (Van Der Merwe & Medina 1989; Buch-
mann et al. 1997), we measured the average height of the surrounding
vegetation at each collection location using a clinometer, and esti-
mated canopy cover using a semi-quantitative index, ranging from 0
(no canopy) to 5 (overlapping crowns), based on crown separation
ratios (mean gap ⁄meanwidth:McDonald et al. 1998).
A useful indicator of site soil conditions in Australia is the presence
of chenopod (family Chenopodiaceae)-dominated vegetation, as it is
very closely associatedwith saline and sodic soils (Beadle 1981). These
Fig. 1. Locations of grass specimen collections within Australia. C3
and C4 specimens are indicated (grey and black circles respectively).
Contour lines refer to the water availability index (actual evapotrans-
piration ⁄ potential evapotranspiration).
Table 1. Number of specimens examined, broken down by
photosynthetic pathway and genus. Genera marked with an asterisk
are naturalized
Pathway Genus n
C3 Austrostipa 3
Elytrophorus 1
Hordeum* 1
Monachather 6
Thyridolepis 4
Vulpia* 2
Unidentified 41
Total 58
C4 Aristida 53
Astrebla 8
Bothriochloa 5
Brachyachne 5
Cymbopogon 4
Dactyloctenium 1
Dichanthium 1
Ectrosia 1
Enneapogon 25
Enteropogon 3
Eragrostis 7
Eriachne 3
Eulalia 1
Heteropogon 12
Hyparrhenia* 1
Iseilema 6
Melinis* 2
Mnesithea 8
Neurachne 2
Panicum 7
Perotis 2
Schizachyrium 5
Setaria 8
Sarga 7
Sporobolus 2
Thaumastochloa 2
Themeda 7
Tragus 2
Triodia 1
Uranthoecium 1
Urochloa* 2
Unidentified 156
Total 350
Total 408
� 2009 The Authors. Journal compilation � 2009 British Ecological Society, Functional Ecology, 23, 1040–1049
1042 B. P. Murphy & D. M. J. S. Bowman

soil types could be expected to affect plant d13C and d15N (Heaton
1987; Brugnoli & Lauteri 1991; Van Groenigen & Van Kessel 2002).
Each collection location was classified as either chenopod or non-
chenopod dominated. Chenopod sites were those where>50%of the
vegetation within a 1 km radius was described as ‘chenopod shrub-
land’, according to the National Vegetation Information System ver-
sion 1.0 (Department of Environment andHeritage, Australia, http://
www.deh.gov.au/erin/edd).
Given that previous studies have found elevated foliar d15N in close
proximity to the coast (Virginia & Delwiche 1982; Heaton 1987; but
see Vitousek et al. 1989 for absence of an effect), we calculated the
distance between each collection location and the nearest coastline
using a geographic information system. Collection locations were
classified as coastal if they were within 20 km of the coast. This dis-
tance was larger than that used in previous studies (8 km, Virginia &
Delwiche 1982; 2 km, Heaton 1987), simply because we had few col-
lection locations close to the coast.
S T A T I S T I C AL A N A L YS I S
We examined variation in d13C and d15N using least-squares linear
regression models. Water availability was thought to be the variable
of primary importance, so models containing only this variable were
constructed first. To examine the effect of additional environmental
variables, we added these to the models containing water availability.
All models were constructed in the computer program R (version
2.6.2) (Ihaka&Gentleman 1996).
Given that d13C is influenced by very different processes in C3 and
C4 plants, we analysed C3 and C4 specimens separately (Farquhar
1983; Farquhar et al. 1989a). In contrast, we could find no published
evidence that processes influencing d15N systematically vary between
C3 and C4 plants, and for this reason, we used a single analysis for
d15N. Visual inspection of foliar d13C of C4 grasses and foliar d15Nplotted againstWAI suggested a nonlinear relationship, sowe applied
an inverse transformation to WAI prior to any analysis, i.e. WAI)1.
The entire data set used in the analysis is provided in the Supporting
Information.
Results
G R A SS F O L I AR d 1 3 C
There were highly significant relationships between water
availability and foliar d13C for both C3 (P < 0Æ001,r2 = 0Æ21) and C4 grasses (P < 0Æ0001, r2 = 0Æ17). In the
case of C3 grasses, the relationship was negative, with a 2Æ8&difference between specimens from the wettest and driest sites
(Fig. 2a). In contrast, the relationship was positive for C4
grasses, with a 1Æ7& difference between specimens from the
wettest and driest sites.
Within C4 grasses, there were highly significant differences
in d13C between the four C4 types (P < 0Æ0001). While the
Aristida, NAD-ME and PCK types had similar d13C, theNADP-ME type had d13C about 1& higher than the other
types (Fig. 3a). Given that the NADP-ME type tends to be
associated with high rainfall areas (Hattersley 1992; Schulze
et al. 1996a), there is a possibility that the high d13C values
typical of this type may have been at least partly responsible
for the positive relationship between d13C and water
availability in C4 grasses. However, it is clear that the high
d13C values of the NADP-ME type were not entirely respon-
sible, because a significant positive relationship was present in
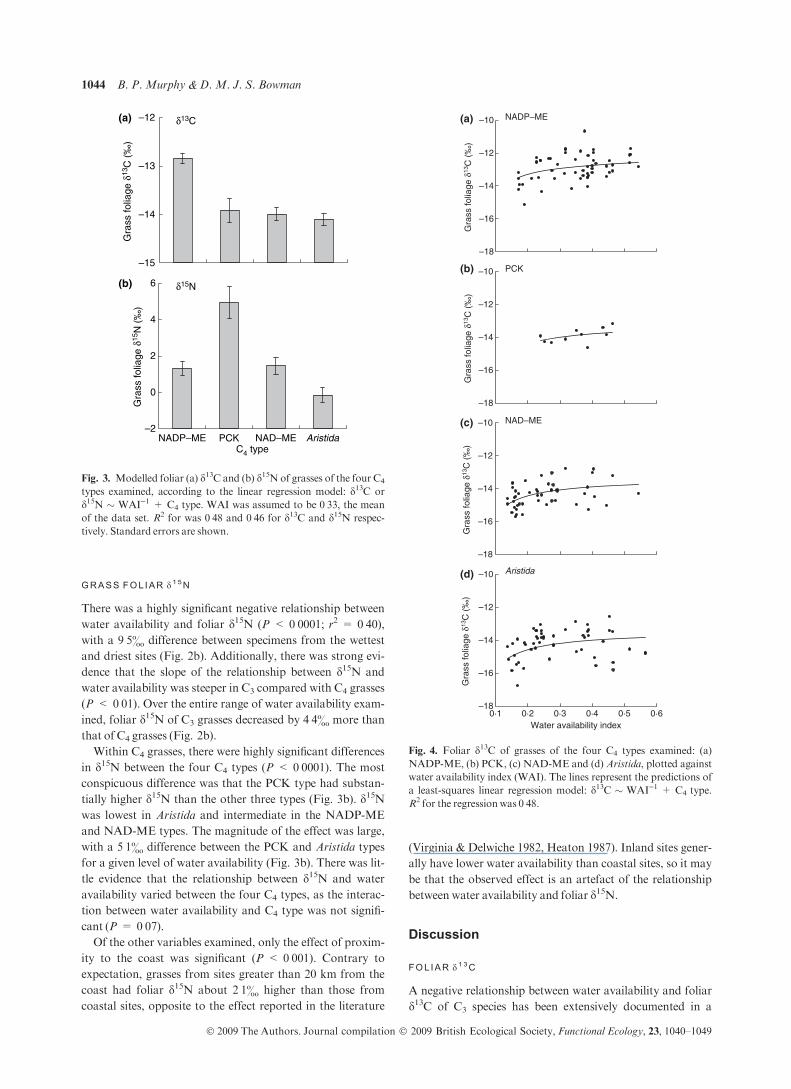
each of the C4 types, except PCK (NADP-ME P < 0Æ0001;NAD-MEP < 0Æ01;Aristida P < 0Æ01).There was little evidence that the relationship between d13C
and water availability varied between the four C4 types, as the
interaction between water availability and C4 type was not
significant (P = 0Æ82; Fig. 4). A simple linear model incorpo-
rating just water availability and C4 type was able to explain a
high proportion (48%) of the variation in foliar d13C of C4
grasses.
Neither vegetation height nor canopy cover had an effect
on d13C of C3 grasses (P = 0Æ98 and 0Æ22 respectively), but
both had a clear negative effect on d13C of C4 grasses
(P < 0Æ0001 and <0Æ01 respectively). For C4 grasses, d13Cdecreased by 1Æ4& between the shortest and tallest vegeta-
tion, and by 0Æ75& between the most open and closed vegeta-
tion. The presence of chenopod-dominated vegetation had no
clear effect on d13C of C4 grasses (P = 0Æ34).
–10 0·1 0·2 0·3 0·4 0·5 0·6 0·7 0·8
–5
0
5
10
15
20
Water availability index
–35
–30
–25
–20
–15
–10
Gra
ss fo
liage
δ13
C (
‰)
Gra
ss fo
liage
δ15
N (
‰)
δ13C
δ15N
C4 grasses
C3 grasses
P < 0·0001
r 2 = 0·17
WAI: P < 0·0001 WAI × pathway: P < 0·01
R 2 = 0·42
P < 0·001
r 2 = 0·21
(a)
(b)
Fig. 2. (a) d13C and (b) d15N of grass foliage collected throughout
Australia, plotted against water availability index (WAI). Filled cir-
cles represent C4 specimens; empty circles represent C3 specimens.
The lines represent the predictions of linear regressions of (a) d13Cand (b) d15N against WAI: the solid line is for C4 specimens; the
dashed line is for C3 specimens. For d13C, separate regressions wereused for C3 and C4 specimens, with r2 of 0Æ17 and 0Æ21 respectively.
For d15N, a multiple regression model was used:
d15N � WAI ·· photosynthetic pathway, for whichR2 was 0Æ42.
� 2009 The Authors. Journal compilation � 2009 British Ecological Society, Functional Ecology, 23, 1040–1049
Carbon and nitrogen isotopes in grasses 1043
G R A SS F O L I AR d 1 5 N
There was a highly significant negative relationship between
water availability and foliar d15N (P < 0Æ0001; r2 = 0Æ40),with a 9Æ5& difference between specimens from the wettest
and driest sites (Fig. 2b). Additionally, there was strong evi-
dence that the slope of the relationship between d15N and
water availability was steeper in C3 compared with C4 grasses
(P < 0Æ01). Over the entire range of water availability exam-
ined, foliar d15N of C3 grasses decreased by 4Æ4& more than
that of C4 grasses (Fig. 2b).
Within C4 grasses, there were highly significant differences
in d15N between the four C4 types (P < 0Æ0001). The most
conspicuous difference was that the PCK type had substan-
tially higher d15N than the other three types (Fig. 3b). d15Nwas lowest in Aristida and intermediate in the NADP-ME
and NAD-ME types. The magnitude of the effect was large,
with a 5Æ1& difference between the PCK and Aristida types
for a given level of water availability (Fig. 3b). There was lit-
tle evidence that the relationship between d15N and water
availability varied between the four C4 types, as the interac-
tion between water availability and C4 type was not signifi-
cant (P = 0Æ07).Of the other variables examined, only the effect of proxim-
ity to the coast was significant (P < 0Æ001). Contrary to
expectation, grasses from sites greater than 20 km from the
coast had foliar d15N about 2Æ1& higher than those from
coastal sites, opposite to the effect reported in the literature
(Virginia & Delwiche 1982, Heaton 1987). Inland sites gener-
ally have lower water availability than coastal sites, so it may
be that the observed effect is an artefact of the relationship
between water availability and foliar d15N.
Discussion
F O L I A R d 1 3 C
A negative relationship between water availability and foliar
d13C of C3 species has been extensively documented in a
–15
–14
–13
–12 δ13CG
rass
folia
ge δ
13C
(‰
)(a)
–2
0
2
4
6
AristidaNADP–ME PCK NAD–MEC4 type
δ15N
Gra
ss fo
liage
δ15
N (
‰)
(b)
Fig. 3. Modelled foliar (a) d13C and (b) d15N of grasses of the four C4
types examined, according to the linear regression model: d13C or
d15N � WAI)1 + C4 type. WAI was assumed to be 0Æ33, the mean
of the data set. R2 for was 0Æ48 and 0Æ46 for d13C and d15N respec-
tively. Standard errors are shown.
–18
–16
–14
–12
–10
Gra
ss fo
liage
δ13
C (
‰)
Gra
ss fo
liage
δ13
C (
‰)
Gra
ss fo
liage
δ13
C (
‰)
Gra
ss fo
liage
δ13
C (
‰)
NADP–ME
–18
–16
–14
–12
–10 PCK
–18
–16
–14
–12
–10 NAD–ME
–180·1 0·2 0·3 0·4 0·5 0·6
–16
–14
–12
–10
Water availability index
Aristida
(a)
(b)
(c)
(d)
Fig. 4. Foliar d13C of grasses of the four C4 types examined: (a)
NADP-ME, (b) PCK, (c) NAD-ME and (d) Aristida, plotted against
water availability index (WAI). The lines represent the predictions of
a least-squares linear regression model: d13C � WAI)1 + C4 type.
R2 for the regression was 0Æ48.
� 2009 The Authors. Journal compilation � 2009 British Ecological Society, Functional Ecology, 23, 1040–1049
1044 B. P. Murphy & D. M. J. S. Bowman

range of environments (Stewart et al. 1995; Korol et al.
1999; Van Der Water et al. 2002; Swap et al. 2004; Weiguo
et al. 2005). While most of these studies have focused on
woody plants, our results show that a similar pattern is pres-
ent in C3 grasses in Australia. Of greater significance, how-
ever, is the opposite, positive relationship we have clearly
demonstrated between water availability and foliar d13C of
C4 grasses. This relationship has been only infrequently
reported (Table 2), and certainly never on such a large geo-
graphical scale.
A positive relationship between water availability and
foliar d13C of C4 plants is clearly supported by physiological
theory. In C4 plants, the effect of ci ⁄ ca on d13C is confounded
by post-photosynthetic fractionation due to ‘leakiness’ of the
bundle sheath cells to CO2 (Farquhar 1983). The degree of
leakiness (F) affects the slope of the linear relationship
between ci ⁄ ca and d13C. When F is below about 0Æ35, d13C is
positively related to ci ⁄ ca, i.e. opposite to the relationship in
C3 plants, and F tends to remain below this level under a wide
range of environmental conditions and moderate levels of
stress (Henderson et al. 1992; Williams et al. 2001). For this
reason the relationship between water availability and d13C of
C4 species is usually positive, opposite to the direction of the
relationship in C3 species (Schulze et al. 1996a; Wang et al.
2005).
Within the C4 photosynthetic pathway, we found that the
NADP-ME type had d13C substantially higher than the other
three types. This is clearly consistent with the literature, with
numerous previous studies reporting high d13C values for
NADP-ME species (Hattersley 1982; Schulze et al. 1996a;
Cerling et al. 2003). Several previous studies have also
reported that the PCK type tends to have slightly higher d13Cthan the NAD-ME and Aristida types, although we did not
detect this difference. Importantly, a model of foliar d13C of
C4 grasses, incorporating both C4 type and water availability,
performed well (R2 = 0Æ48), substantially better than the bestmodel of foliar d13C of C3 grasses (r
2 = 0Æ21). Given that the
relative abundances of the four C4 types are closely related to
water availability (Hattersley 1992; Schulze et al. 1996a), it is
likely thatmean foliar d13C ofC4 grasses in a given geographi-
cal area could be reliably estimated, and such estimates are
commonly used in isotopic reconstructions of animal feeding
ecology and global carbon budgets, described under Implica-
tions, below.
Numerous authors have suggested that the relationship
between rainfall and foliar d13C of C3 plants is nonlinear
(Schulze et al. 1998; Korol et al. 1999; Miller et al. 2001; Van
Der Water et al. 2002; Weiguo et al. 2005). In these studies,
d13C increased rapidly at low levels of rainfall and then lev-
elled out at higher rainfall. From Australia, there have been
conflicting results. In eastern Australia, Stewart et al. (1995)
found a relationship between foliar d13C of woody species
and annual rainfall that was clearly linear. In contrast, over a
similar rainfall gradient in monsoonal northern Australia
both Schulze et al. (1998) and Miller et al. (2001) found that
the relationship between foliar d13C of Eucalyptus trees and
annual rainfall clearly levelled out at about 500–600 mm.
They suggested that this corresponded to the limit of a strong
monsoonal influence, and above this level, soils tend to be
uniformly saturated during the summer growing season when
foliar d13C is determined. The lack of C3 specimens from
intermediate levels of water availability in our study makes it
impossible to determine whether the relationship we observed
between d13C and water availability was also nonlinear.
Given that our specimens were collected from a range of areas
across the Australian continent, rather than from an unrepli-
cated water availability gradient, it is unlikely that a single
environmental feature, such as the limit of monsoon influence
Table 2. Summary of recently reported relationships between water availability (annual rainfall) and foliar d13C and d15N. Across each rainfall
gradient examined, the differences in d13C and ⁄ or d15N are specified. Differences in d13C and ⁄ or d15N were often visually estimated from figures
in the source literature, so are approximate only, rounded to the nearest 0Æ5&
Isotope Pathway Life forms
Rainfall
gradient (mm)
Isotopic
difference
(&) Location References
d13C C3 Grasses 220–640 )4Æ5 Chinese Loess Plateau Weiguo et al. (2005)
Trees, shrubs 350–1520 )4 NE Australia Stewart et al. (1995)
Trees, shrubs 230–970 )2Æ5 S Africa Swap et al. (2004)
Trees 220–1800 )2Æ5 N Australia Schulze et al. (1998)
Trees 630–1600 )2 SE Australia, New Zealand Korol et al. (1999)
Trees, shrubs 160–560 )3 to 0 SW United States Van Der Water et al. (2002)
Trees, shrubs, forbs, grasses 130–770 0 Patagonia Schulze et al. (1996b)
C4 Grasses 50–550 0 to 2 Namibia Schulze et al. (1996a)
Grasses 230–650 0 S Africa Swap et al. (2004)
Single shrub species 160–250 0 SW United States Van Der Water et al. (2002)
Single grass species 370–670 )2 Chinese Loess Plateau Weiguo et al. (2005)
d15N C3 Trees 220–1800 )5Æ5 N Australia Schulze et al. (1998), Austin &
Sala (1999)
Trees, shrubs 200–1300 )6Æ5 S Africa Swap et al. (2004)
Trees 500–5500 )4 Hawaii Austin & Vitousek (1998)
C3 + C4 All 20–2950 )9 Global Handley et al. (1999)
C4 Grasses 200–1300 )1 S Africa Swap et al. (2004)
� 2009 The Authors. Journal compilation � 2009 British Ecological Society, Functional Ecology, 23, 1040–1049
Carbon and nitrogen isotopes in grasses 1045

(e.g. Schulze et al. 1998; Miller et al. 2001), or a boundary
between major soil formations (e.g. Van Der Water et al.
2002) would result in a nonlinear relationship.
A number of studies have shown that d13C of plants grow-
ing beneath dense canopies tends to be lower than plants
growing in more open vegetation. This has been termed the
‘canopy effect’ and has been attributed to both the 13C deple-
tion of ambient CO2 during soil respiration (Van Der Merwe
& Medina 1989) and reduced light availability (Buchmann
et al. 1997).We found little evidence that vegetation height or
canopy cover affected foliar d13C of C3 grasses, but clearly
that of C4 grasses was affected, with a 0Æ7-1Æ3& decrease in
d13C between the shortest ⁄most open and tallest ⁄most closed
vegetation. This effect possibly reflects an increase in shade
with increasing vegetation height, demonstrated experimen-
tally by Buchmann et al. (1996). This explanation is more
likely than 13C depletion of ambient CO2 due to soil respira-
tion, which is typically associated with closed canopy vegeta-
tion that was not present in our data set. The effect is likely to
have been detectable in C4 but not C3 grasses because of their
much greater sample size (350 vs. 58).
F O L I A R d 1 5 N
The negative relationship between water availability and
foliar d15N that we have found throughout Australia is simi-
lar to that already recorded in northern Australia (Schulze
et al. 1998), on other continents (Heaton 1987; Schuur et al.
2001, Aranibar et al. 2004, Swap et al. 2004) and in an exten-
sive global synthesis (Handley et al. 1999). Many authors
now agree that the mechanism is the increased ‘openness’ of
nitrogen cycling in drier areas (Handley et al. 1999; Schuur
et al. 2001), a concept first developed by Austin & Vitousek
(1998). These authors suggested that where water is abun-
dant, nitrogen tends to be limiting, and is tightly recycled.
This limits the amount of nitrogen leaving the system through
fractionating pathways that would cause the system to
become enriched in 15N. In contrast, nitrogen is not recycled
so tightly in drier systems, because water is the limiting factor,
and nitrogen leaves the systemmore readily through fraction-
ating pathways.
The cause of the pattern in northern Australia has been the
subject of debate. Schulze et al. (1998) suggested that increas-
ing foliar d15N with increasing aridity may be due to higher
grazing pressure at arid sites, resulting in an acceleration of
nitrogen turnover and losses of 14N, although this hypothesis
has been disputed by Austin & Sala (1999). These authors
suggest that grazing intensity is in fact greater at wetter sites,
and that the pattern is more likely to be caused by the direct
effects of water availability on the ‘openness’ of the nitrogen
cycle, consistent with the hypothesis of Austin & Vitousek
(1998). Also working in northern Australia, Cook (2001)
added to the debate by demonstrating that grazing has only a
small effect on foliar d15N of grasses and trees, certainly not
sufficient to cause the large differences (�6&) observed
across the northern Australian rainfall gradient. Cook (2001)
also suggested that fire may play an important role, with fre-
quent fires, typical of the high rainfall end of the gradient,
possibly resulting in greater losses of 14N, and hence high
d15N. However, that the relationship between foliar d15N and
water availability holds across such a diverse range of climatic
and vegetation zones as examined in this study, clearly lends
support to the mechanism proposed by Austin & Vitousek
(1998) and Handley et al. (1999), that is, increased openness
of the nitrogen cycle in arid areas.
Recent work in the tropical forests of Hawaii by Houtton
et al. (2006) has provided additional insights into the mecha-
nism by which 14N is lost from relatively dry sites. Measuring
the isotopic composition of both inputs and hydrological out-
puts, these authors found that hydrological outputs from
drier sites were actually less enriched than inputs, suggesting
that 14N must be preferentially lost via another pathway, pre-
sumed to be gaseous loss via denitrification of NO3). While
nitrogen losses via denitrification were greater at wetter sites,
more complete consumption of NO3) was assumed to mini-
mize ecosystem enrichment with 15N. It remains unclear
whether the mechanism proposed by Houtton et al. (2006) is
also applicable outside tropical forest biomes, and particu-
larly whether denitrification remains an important pathway
of nitrogen loss in arid areas, where the globally maximum
values of ecosystem d15N tend to be found (Amundson et al.
2003).
Swap et al. (2004) concluded that the relationship between
plant d15N and rainfall in southern Africa was much stronger
and steeper in C3 than in C4 plants, but provided no
explanation for this phenomenon. Working in an arid
region of southern Africa, Aranibar et al. (2008) more
recently reported that d15Nwas higher in C3 than inC4 plants.
Unfortunately, from these two studies it is difficult to distin-
guish the direct effects of the photosynthetic pathway and
growth form on d15N, because C3 plants were almost always
non-grasses and C4 plants were almost always grasses. Our
finding that the response of d15N to increasing water avail-
ability is more negative in C3 grasses than in C4 grasses pro-
vides evidence that the effect previously reported by Swap
et al. (2004) and Aranibar et al. (2008) is directly related
to photosynthetic pathway, rather than growth form.
Discussions of the effects of photosynthetic pathway on plant
d15N are virtually absent from the published literature,
although there is abundant evidence of differences in nitrogen
metabolism between C3 and C4 plants, with substantially
higher nitrogen use efficiency in C4 plants, largely due to a
lower demand for Rubisco in leaves (Brown 1978; Schmidt
& Edwards 1981; Sage & Pearcy 1987; Makino et al. 2003).
Given these differences in nitrogen metabolism, and the large
fractionations that can occur within plants (Robinson 2001),
it is not unexpected that d15N may differ between the C3 and
C4 pathways. Similarly, differences in nitrogen metabolism
may also contribute to the differences we found in d15Nbetween C4 types, an effect that, to the best of our knowledge,
has not been previously reported. Work by Ghannoum et al.
(2005) suggests that there are clear differences in nitrogen
use efficiency and leaf nitrogen content between the NAD-
ME and NADP-ME types, although we found very little
� 2009 The Authors. Journal compilation � 2009 British Ecological Society, Functional Ecology, 23, 1040–1049
1046 B. P. Murphy & D. M. J. S. Bowman

difference in d15N between those types. The most notable
difference we found was between the PCK type and the other
three types, yet there is little in the published literature to sug-
gest that the PCK type differs substantially from the other
types in terms of nitrogenmetabolism. As such, we are unable
to provide an explanation for this effect at this stage, and it
clearly requires further investigation.
While it is well established that soil moisture is an impor-
tant determinant of soil and plant d15N (Austin et al. 1998,
Handley et al. 1999; Schuur et al. 2001), the effect of temper-
ature is poorly documented. Martinelli et al. (1999) were
among the first to note that tropical forests are enriched in15N relative to temperate forests, and Amundson et al. (2003)
analysed a global data set to conclude that soil and plant
d15N were more closely correlated with MAT than mean
annual rainfall. In contrast, we found no correlation between
MAT and foliar d15N. The lack of a relationship is probably
due to the limited temperature range over which samples were
collected in our study. In contrast, the study of Amundson
et al. (2003) utilized an extreme temperature range, from
tropical forests and deserts to high latitude boreal forest.
I M P L I C A T I O N S
Our findings also have implications for the use of d13C mea-
surements of plant and animal remains in ecological studies.
For example, in areas where most grass biomass is C4, d13Cmeasurements of herbivore remains are commonly used to
estimate the contribution of grass to the diet (Vogel 1978;
Witt et al. 1998; Cerling et al. 2006; Codron et al. 2007). Such
studies require accurate estimates of typical d13C values for
C3 and C4 plants, so-called ‘end-members’. In the majority of
cases, C3 and C4 end-members are each expressed as a single
mean, without accounting for effects such as water availabil-
ity (e.g. Witt et al. 1998; Sponheimer et al. 2003), while
recently, researchers have begun to account for such effects
and vary C3 end-members according to water availability
(e.g.Murphy et al. 2007a). However, in only several instances
have attempts been made to account for the effect of water
availability on C4 end-members (e.g. Cerling & Harris 1999;
Cerling et al. 2003). Our findings underscore the importance
of accounting for variation in foliar d13C of both C3 and C4
species in dietary studies, especially when attempting to make
precise estimates of parameters such as diet-tissue enrichment
factors, where errors of ±1& would be unacceptable (e.g.
Cerling &Harris 1999;Murphy et al. 2007a).
Models of 13C discrimination by terrestrial plants form an
important part of global carbon budgets. In these budgets,
changes in the isotopic concentration of atmospheric CO2 are
used to derive the location and magnitude of biospheric car-
bon sinks, particularly the relative contributions of the land
and oceans (Battle et al. 2000). However, the approach relies
on accurate estimates of 13C discrimination by terrestrial veg-
etation. While current models assume that discrimination by
C3 plants shows high spatial and temporal variability, espe-
cially in response to water availability, discrimination by C4
plants is assumed to be either constant, or vary little (Lloyd &
Farquhar 1994; Fung et al. 1997; Scholze et al. 2003; Suits
et al. 2005). We have shown that at a continental scale, 13C
discrimination by C4 plants is clearly influenced by water
availability. Indeed, the effect of water availability on d13C of
C4 grasses (1Æ7&) is of an order of magnitude similar to the
effect of water availability on d13C of C3 grasses (2Æ8&; this
study) and C3 plantsmore generally (2–4Æ5&; Table 2). Given
that the contribution of C4 grasses to terrestrial gross primary
production is high at about 23% globally (Still et al. 2003),
failure to account for the relationship between water avail-
ability and 13C discrimination by C4 grasses may represent an
important, yet easily corrected, source of error in current glo-
bal carbon budgets.
Acknowledgements
We thank Wendy Telfer, Lynda Prior and two anonymous referees for provid-
ing helpful comments on an early version of the manuscript, and Stephen
Clayton, Sue Wood and Hilary Stuart-Williams for assisting with the isotope
analysis. Grants from the Australian Research Council (DP0342788 and
DP0878177) supported this work.
References
Amundson, R., Austin, A.T., Schuur, E.A.G., Yoo, K., Matzek, V., Kendall,
C., Uebersax, A., Brenner, D. & Baisden,W.T. (2003) Global patterns of the
isotopic composition of soil and plant nitrogen. Global Biogeochemical
Cycles, 17, 1031.
Anderson, J.E., Williams, J., Kriedemann, P.E., Austin, M.P. & Farquhar,
G.D. (1996) Correlations between carbon isotope discrimination and climate
of native habitats for diverse eucalypt taxa growing in a common garden.
Australian Journal of Plant Physiology, 23, 311–320.
Aranibar, J.N., Otter, L., Macko, S.A., Feral, C.J.W., Epstein, H.E., Dowty,
P.R., Eckhardt, F., Shugart, H.H. & Swap, R.J. (2004) Nitrogen cycling in
the soil-plant system along a precipitation gradient in the Kalahari sands.
Global Change Biology, 10, 359–373.
Aranibar, J.N., Anderson, I.C., Epstein, H.E., Feral, C.J.W., Swap, R.J., Ra-
montsho, J. &Macko, S.A. (2008) Nitrogen isotope composition of soils, C3
and C4 plants along land use gradients in southern Africa. Journal of Arid
Environments, 72, 326–337.
Austin, A.T. & Sala, O.E. (1999) Foliar d15N is negatively correlated with rain-
fall along the IGBP transect in Australia. Australian Journal of Plant Physi-
ology, 26, 293–295.
Austin, A.T. & Vitousek, P.M. (1998) Nutrient dynamics on a precipitation
gradient inHawai’i.Oecologia, 113, 519–529.
Battle, M., Bender, M.L., Tans, P.P., White, J.W.C., Ellis, J.T., Conway, T. &
Francey, R.J. (2000) Global carbon sinks and their variability inferred from
atmospheric O2 and d13C. Science, 287, 2467–2470.Beadle, N.C.W. (1981) The Vegetation of Australia. Cambridge University
Press, Cambridge.
Brown, R.H. (1978) Difference in N use efficiency in C3 and C4 plants and its
implications in adaptation and evolution.Crop Science, 18, 93–98.
Brugnoli, E. & Lauteri, M. (1991) Effects of salinity on stomatal conductance,
photosynthetic capacity, and carbon isotope discrimination of salt-tolerant
(Gossypium hirsutum L.) and salt-sensitive (Phaseolus vulgaris L.) C3 non-
halophytes.Plant Physiology, 95, 628–635.
Buchmann, N., Brooks, J.R., Rapp, K.D. & Ehleringer, J.R. (1996) Carbon
isotope composition of C4 grasses is influenced by light and water supply.
Plant, Cell and Environment, 19, 392–402.
Buchmann, N., Guehl, J.M., Barigah, T.S. & Ehleringer, J.R. (1997) Intersea-
sonal comparison of CO2 concentrations, isotopic composition, and carbon
dynamics in an Amazonian rainforest (French Guiana). Oecologia, 110,
120–131.
Cerling, T.E. & Harris, J.M. (1999) Carbon isotope fractionation between diet
and bioapatite in ungulate mammals and implications for ecological and
paleoecological studies.Oecologia, 120, 347–363.
Cerling, T.E., Harris, J.M., Macfadden, B.J., Leakey, M.G., Quade, J., Eisen-
mann, V. & Ehleringer, J.R. (1997) Global vegetation change through the
Miocene ⁄ Pliocene boundary.Nature, 389, 153–158.
� 2009 The Authors. Journal compilation � 2009 British Ecological Society, Functional Ecology, 23, 1040–1049
Carbon and nitrogen isotopes in grasses 1047

Cerling, T.E., Harris, J.M. & Passey, B.H. (2003)Diets of East African Bovidae
based on stable isotope analysis. Journal ofMammalogy, 84, 456–470.
Cerling, T.E., Wittemeyer, G., Rasmussen, H.B., Vollrath, F., Cerling, C.E.,
Robinson, T.J. & Douglas-Hamilton, I. (2006) Stable isotopes in elephant
hair document migration patterns and diet changes. Proceedings of the
National Academy of Sciences of the United States of America, 103, 371–373.
Chazdon, R.L. (1978) Ecological aspects of the distribution of C4 grasses in
selected habitats.Biotropica, 10, 265–269.
Cloern, J.E., Canuel, E.A. & Harris, D. (2002) Stable carbon and nitrogen iso-
tope composition of aquatic and terrestrial plants of the San Francisco estu-
arine system.Limnology and Oceanography, 47, 713–729.
Codron, D., Lee-Thorp, J.A., Sponheimer, M., Codron, J., De Ruiter, D. &
Brink, J.S. (2007) Significance of diet type and diet quality for ecological
diversity of African ungulates. Journal of Animal Ecology, 76, 526–537.
Cook, G.D. (2001) Effects of frequent fires and grazing on stable nitrogen iso-
tope ratios of vegetation in northern Australia. Austral Ecology, 26, 630–
636.
Currin, C.A., Newell, S.Y. & Paerl, H.W. (1995) The role of standing dead
Spartina alterniflora and benthic microalgae in salt marsh food webs: consid-
erations on multiple stable isotope analysis.Marine Ecology Progress Series,
121, 99–116.
Ehleringer, J.R. (1989) Carbon isotope ratios and physiological processes in
aridland plants. Stable Isotopes in Ecological Research (eds P. W. Rundel, J.
R. Ehleringer &K.A.Nagy), pp. 41–54. Springer-Verlag, NewYork.
Evans, R.D. (2001) Physiological mechanisms influencing plant nitrogen iso-
tope composition.Trends in Plant Science, 6, 121–126.
Farquhar, G.D. (1983) On the nature of carbon isotope discrimination in C4
species.Australian Journal of Plant Physiology, 10, 205–226.
Farquhar, G.D., Ehleringer, J.R. & Hubick, K.T. (1989a) Carbon isotope dis-
crimination and photosynthesis. Annual Review of Plant Physiology and
PlantMolecular Biology, 40, 503–537.
Farquhar, G.D., Hubick, K.T., Condon, A.G. & Richards, R.A. (1989b) Car-
bon isotope fractionation and plant water-use efficiency. Stable Isotopes in
Ecological Research (eds P. W. Rundel, J. R. Ehleringer & K. A. Nagy), pp.
21–40. Springer-Verlag, NewYork.
Fung, I., Field, C.B., Berry, J.A., Thompson, M.V., Randerson, J.T., Malm-
strom, C.M., Vitousek, P.M., Collatz, G.J., Sellers, P.J., Randall, D.A.,
Denning, A.S., Badeck, F. & John, J. (1997) Carbon-13 exchanges
between the atmosphere and biosphere. Global Biogeochemical Cycles, 11,
507–533.
Garten, C.T. (1993) Variation in foliar 15N abundance and the availability of
soil nitrogen onWalker BranchWatershed.Ecology, 74, 2098–2113.
Gebauer, G. & Schulze, E.-D. (1991) Carbon and nitrogen isotope ratios in dif-
ferent compartments of a healthy and declining Picea abies forest in Fich-
telgebirge, NEBavaria.Oecologia, 87, 198–207.
Ghannoum, O., Evans, J.R., Chow, W.S., Andrews, J., Conroy, J.P. & Von
Caemerer, S. (2005) Faster Rubisco is the key to superior nitrogen-use effi-
ciency in NADP-malic enzyme relative to NAD-malic enzyme C4 grasses.
Plant Physiology, 137, 638–650.
Handley, L.L., Austin, A.T., Robinson, D., Scrimgeour, C.M., Raven, J.A.,
Heaton, T.H.E., Schmidt, S. & Stewart, G.R. (1999) The 15N natural abun-
dance (d15N) of ecosystem samples reflects measures of water availability.
Australian Journal of Plant Physiology, 26, 185–199.
Hattersley, P.W. (1982) d13C values of C4 types in grasses.Australian Journal of
Plant Physiology, 9, 139–154.
Hattersley, P.W. (1983) The distribution of C3 and C4 grasses in Australia in
relation to climate.Oecologia, 57, 113–128.
Hattersley, P.W. (1992) C4 photosynthetic pathway variation in grasses (Poa-
ceae): its significance for arid and semi-arid lands. Desertified Grasslands:
Their Biology and Management (ed. G. P. Chapman), pp. 181–212. Aca-
demic Press, London.
Heaton, T.H.E. (1987) The 15N ⁄ 14N ratios of plants in SouthAfrica andNami-
bia: relationship to climate and coastal ⁄ saline environments. Oecologia, 74,
236–246.
Henderson, S.A., Von Caemerer, S. & Farquhar, G.D. (1992) Short-term mea-
surements of carbon isotope discrimination in several C4 species. Australian
Journal of Plant Physiology, 19, 263–285.
Hobson, K.A. & Montevecchi, W.A. (1991) Stable isotopic determinations of
trophic relationships of great auks.Oecologia, 87, 528–531.
Houtton, B.Z., Sigman, D.M. & Hedin, L.O. (2006) Isotopic evidence for
large gaseous nitrogen losses from tropical rainforests. Proceedings of the
National Academy of Sciences of the United States of America, 103, 8745–
8750.
Ihaka, R. &Gentleman, R. (1996) R: a language for data analysis and graphics.
Journal of Computational and Graphical Statistics, 5, 299–314.
Kolb, K.J. & Evans, R.D. (2002) Implications of leaf nitrogen recycling on the
nitrogen isotope composition of deciduous plant tissues. New Phytologist,
156, 57–64.
Korol, R.L., Kirshbaum, M.U.F., Farquhar, G.D. & Jeffreys, M. (1999)
Effects of water status and soil fertility on the C-isotope signature in Pinus
radiata.Tree Physiology, 19, 551–562.
Kwak, T.J. & Zedler, J.B. (1997) Food web analysis of southern Californian
wetlands usingmultiple stable isotopes.Oecologia, 110, 262–277.
Lloyd, J. & Farquhar, G.D. (1994) 13C discrimination during CO2 assimilation
by the terrestrial biosphere.Oecologia, 99, 201–215.
Makino,A., Sakuma,H., Sudo, E. &Mae, T. (2003)Differences betweenmaize
and rice in N-use efficiency for photosynthesis and protein allocation. Plant
and Cell Physiology, 44, 952–956.
Martinelli, L.A., Piccolo, M.C., Townsend, A.R., Vitousek, P.M., Cuevas, E.,
Mcdowell, W., Robertson, G.P., Santos, O.C. & Treseder, K. (1999) Nitro-
gen stable isotope composition of leaves and soil: tropical versus temperate
forests.Biogeochemistry, 46, 45–65.
McDonald, R.C., Isbell, R.F., Hopkins, M.S., Walker, J. & Speight, J.G.
(1998)Australian Soil and Land Survey Field Handbook. Australian Collabo-
rative LandEvaluation Program, Canberra.
Miller, J.M., Williams, R.J. & Farquhar, G.D. (2001) Carbon isotope discrimi-
nation by a sequence of Eucalyptus species along a subcontinental rainfall
gradient in Australia.Functional Ecology, 15, 222–232.
Morton, F.I. (1983)Operational estimates of areal evapotranspiration and their
significance to the science and practice of hydrology. Journal of Hydrology,
66, 1–76.
Murphy, B.P. & Bowman, D.M.J.S. (2007b) Seasonal water availability pre-
dicts the relative abundance of C3 and C4 grasses in Australia. Global Ecol-
ogy and Biogeography, 16, 160–169.
Murphy, B.P., Bowman, D. &Gagan, M.K. (2007a) Sources of carbon isotope
variation in kangaroo bone collagen and tooth enamel. Geochimica et Cos-
mochimicaActa, 71, 3847–3858.
Narholm, T. (1991) Removal of nitrogen during needle senescence in Scots pine
(Pinus sylvestrisL.).Oecologia, 99, 290–296.
Prendergast, H.D.V., Hattersley, P.W. & Stone, N.E. (1987) New struc-
tural ⁄ biochemical associations in leaf blades on C4 grasses (Poaceae). Aus-
tralian Journal of Plant Physiology, 14, 403–420.
Raven, J.A. & Farquhar, G.D. (1990) The influence of N metabolism and
organic acid synthesis on the natural abundance of isotopes of carbon in
plants.NewPhytologist, 116, 505–529.
Robinson, D. (2001) d15N as an integrator of the nitrogen cycle.Trends in Ecol-
ogy and Evolution, 16, 153–162.
Sage, R.F. & Pearcy, R.W. (1987) The nitrogen use efficiency of C3 and C4
plants. I. Leaf nitrogen, growth, and biomass partitioning in Chenopo-
dium album (L.) and Amaranthus retroflexus (L.). Plant Physiology, 84, 954–
958.
Schmidt, M.R. & Edwards, D.E. (1981) Photosynthetic capacity and nitrogen
use efficiency of maize, wheat, and rice: a comparison between C3 and C4
photosynthesis. Journal of Experimental Botany, 32, 459–466.
Scholze,M., Kaplan, J.O., Knorr,W.&Heimann,M. (2003) Climate and inter-
annual variability of the atmosphere-biosphere 13CO2 flux. Geophysical
Research Letters, 30, 1097.
Schulze, E.-D., Ellis, R., Schulze,W., Trimborn, P. &Ziegler, H. (1996a) Diver-
sity, metabolic types and d13C carbon isotope ratios in the grass flora of
Namibia in relation to growth form, precipitation and habitat conditions.
Oecologia, 106, 352–369.
Schulze, E.-D., Mooney, H.A., Sala, O.E., Jobbagy, E., Buchmann, N., Bauer,
G., Canadell, J., Jackson, R.B., Loreti, J., Oesterheld, M. & Ehleringer, J.R.
(1996b) Rooting depth, water availability, and vegetation cover along an
aridity gradient in Patagonia.Oecologia, 108, 503–511.
Schulze, E.-D., Williams, R.J., Farquhar, G.D., Schulze, W., Langridge, J.,
Miller, J.M. &Walker, B.H. (1998) Carbon and nitrogen isotope discrimina-
tion and nitrogen nutrition of trees along a rainfall gradient in northern Aus-
tralia.Australian Journal of Plant Physiology, 25, 413–425.
Schuur, E.A.G. & Matson, P.A. (2001) Net primary productivity and nutrient
cycling across a mesic to wet precipitation gradient in Hawaiian montane
forest.Oecologia, 128, 431–442.
Sponheimer, M., Lee-Thorp, J.A., Deruiter, D.J., Smith, J.M., Van Der
Merwe, N.J., Reed, K., Grant, C.C., Ayliffe, L.K., Robinson, T.F., Heidel-
berger, C. & Marcus, W. (2003) Diets of southern African Bovidae: stable
isotope evidence. Journal ofMammalogy, 84, 471–479.
Stewart, G.R., Turnbull, M.H., Schmidt, S. & Erskine, P.D. (1995) 13C natural
abundance in plant communities along a rainfall gradient: a biological inte-
grator of water availability. Australian Journal of Plant Physiology, 22, 51–
55.
� 2009 The Authors. Journal compilation � 2009 British Ecological Society, Functional Ecology, 23, 1040–1049
1048 B. P. Murphy & D. M. J. S. Bowman

Still, C.J., Berry, J.A., Collatz, G.J. & Defries, R.S. (2003) Global distribution
of C3 and C4 vegetation: carbon cycle implications. Global Biogeochemical
Cycles, 17, 1006.
Suits, N.S., Denning, A.S., Berry, J.A., Still, C.J., Kaduk, J., Miller, J.B. &
Baker, I.T. (2005) Simulation of carbon isotope discrimination of the terres-
trial biosphere.Global Biogeochemical Cycles, 19, GB1017.
Swap, R.J., Aranibar, J.N., Dowty, P.R., Gilhooly,W.P. &Macko, S.A. (2004)
Natural abundance of 13C and 15 N in C3 and C4 vegetation of southern
Africa: patterns and implications.Global Change Biology, 10, 350–358.
Turney, C.S.M., Hunt, J.E. & Burrows, C. (2002) Deriving a consistent d13Csignature from tree canopy leaf material for palaeoclimatic reconstruction.
NewPhytologist, 155, 301–311.
Van Der Merwe, N.J. & Medina, E. (1989) Photosynthesis and 13C ⁄ 12C ratios
in Amazonian rain forests. Geochimica et Cosmochimica Acta, 53, 1091–
1094.
Van Der Water, P.K., Leavitt, S.W. & Betancourt, J.L. (2002) Leaf d13C vari-
ability with elevation, slope aspect, and precipitation in the southwest Uni-
ted States.Oecologia, 132, 332–343.
VanGroenigen, J.-W. &VanKessel, C. (2002) Salinity-induced patterns of nat-
ural abundance carbon-13 and nitrogen-15 in plant and soil. Soil Science
Society of America Journal, 66, 489–498.
Virginia, R.A. & Delwiche, C.C. (1982) Natural 15N abundance of presumed
N2-fixing and non-N2-fixing plants from selected ecosystems.Oecologia, 54,
317–325.
Vitousek, P.M., Shearer,G. &Kohl, D.H. (1989) Foliar 15N natural abundance
in Hawaiian rainforest: patterns and possible mechanisms. Oecologia, 78,
383–388.
Vogel, J.C. (1978) Isotopic assessment of the dietary habits of ungulates. South
African Journal of Science, 74, 298–301.
Walker, B.H. & Langridge, J.L. (1997) Predicting savanna vegetation struc-
ture on the basis of plant available moisture (PAM) and plant available
nutrients (PAN): a case study from Australia. Journal of Biogeography, 24,
813–825.
Wang, G., Han, J., Zhou, L., Xiong, X. &Wu, Z. (2005) Carbon isotope ratios
of plants and occurrences of C4 species under different soil moisture regimes
in arid region ofNorthwest China.Physiologia Plantarum, 125, 74–81.
Watson, L. & Dallwitz, M.J. (1992 onwards) Grass Genera of the World:
Descriptions, Illustrations, Identification, and Information Retrieval; Including
Synonyms, Morphology, Anatomy, Physiology, Phytochemistry, Cytology,
Classification, Pathogens, World and Local Distribution, and References.
http://delta-intkey.com/grass/www/index.htm, accessed 29 September 2006.
Weiguo, L., Xiahong, F., Youfeng, N., Qingle, Z., Yunning, C. & Zhisheng, A.
(2005) d13C variation of C3 and C4 plants across an Asianmonsoon gradient
in arid northwestern China.Global Change Biology, 11, 1094–1100.
Williams, D.G., Gempko, V., Fravolini, A., Leavitt, S.W., Wall, G.W., Kim-
ball, B.A., Pinter, P.J., Lamorte, R. & Ottman, M. (2001) Carbon isotope
discrimination by Sorghum bicolor under CO2 enrichment and drought.New
Phytologist, 150, 285–293.
Winter, K., Holtum, J.A.M., Edwards, G.E. & O’leary, M.H. (1982) Effects of
low relative humidity on d13C value in two C3 grasses and in Panicum milio-
ides, a C3-C4 intermediate species. Journal of Experimental Botany, 33, 88–
91.
Witt, G.B., Moll, E.J., Beeton, R.J.S. & Murray, P.J. (1998) Isotopes, wool,
and rangeland monitoring: let the sheep do the sampling. Environmental
Management, 22, 145–152.
Yakir, D. & Israeli, Y. (1995) Reduced solar irradiance effects on net primary
productivity (NPP) and the d13C and d18O values in plantations ofMusa sp.,
Musaceae.Geochimica et Cosmochimica Acta, 59, 2149–2151.
Received 22December 2008; accepted 2 April 2009
Handling Editor:Matthew Turnbull
Supporting information
Additional supporting information may be found in the online ver-
sion of this article.
Appendix S1.Grass foliar d13C and d15N data set used in the analysis.
Appendix S2. Regression equations relating grass d13C and d15N to
water availability.
Please note: Wiley-Blackwell is not responsible for the content or
functionality of any supporting information supplied by the authors.
Any queries (other than missing material) should be directed to the
corresponding author for the article
� 2009 The Authors. Journal compilation � 2009 British Ecological Society, Functional Ecology, 23, 1040–1049
Carbon and nitrogen isotopes in grasses 1049