Changes in soil organic carbon and nitrogen following forest expansion on grassland in the Southern...
42
1 Changes in soil organic carbon and nitrogen following forest expansion on grassland in the Southern Alps Claudia Guidi a,b* , Lars Vesterdal b , Damiano Gianelle a,c , Mirco Rodeghiero a a Department of Sustainable Agro-ecosystems and Bioresources, Research and Innovation Centre, Fondazione Edmund Mach, Via E. Mach 1, 38010 San Michele all'Adige (TN), Italy b Department of Geosciences and Natural Resource Management, University of Copenhagen, Rolighedsvej 23, DK-1958 Frederiksberg C, Denmark c Foxlab Joint CNR-FEM Initiative, Via E. Mach 1, 38010 San Michele all'Adige (TN), Italy E-mail addresses: [email protected] (C. Guidi), [email protected] (L. Vesterdal), [email protected] (D. Gianelle), [email protected] (M. Rodeghiero) *Corresponding Author: Claudia Guidi, [email protected] Tel.: +39 0461 615870 Department of Sustainable Agro-ecosystems and Bioresources, Research and Innovation Centre, Fondazione Edmund Mach, Via E. Mach 1, 38010 San Michele all'Adige (TN), Italy
Transcript of Changes in soil organic carbon and nitrogen following forest expansion on grassland in the Southern...
1
Changes in soil organic carbon and nitrogen following forest expansion on
grassland in the Southern Alps
Claudia Guidia,b*
, Lars Vesterdalb, Damiano Gianelle
a,c, Mirco Rodeghiero
a
aDepartment of Sustainable Agro-ecosystems and Bioresources, Research and Innovation Centre,
Fondazione Edmund Mach, Via E. Mach 1, 38010 San Michele all'Adige (TN), Italy
bDepartment of Geosciences and Natural Resource Management, University of Copenhagen,
Rolighedsvej 23, DK-1958 Frederiksberg C, Denmark
cFoxlab Joint CNR-FEM Initiative, Via E. Mach 1, 38010 San Michele all'Adige (TN), Italy
E-mail addresses: [email protected] (C. Guidi), [email protected] (L. Vesterdal),
[email protected] (D. Gianelle), [email protected] (M. Rodeghiero)
*Corresponding Author: Claudia Guidi, [email protected] Tel.: +39 0461 615870
Department of Sustainable Agro-ecosystems and Bioresources, Research and Innovation Centre,
Fondazione Edmund Mach, Via E. Mach 1, 38010 San Michele all'Adige (TN), Italy
2
Abstract
The dominant land-use change in the Southern Alps is grassland abandonment, followed by forest
expansion. Forest expansion is commonly thought to increase ecosystem C sequestration, but
contradictory results have been reported. Our objective was to investigate soil organic carbon (OC) and
nitrogen (N) changes after forest expansion on abandoned grasslands. A land use and management
gradient was identified in a subalpine area of Trentino (Italy) comprising four successional stages: i)
managed grassland (manG), mown and manured annually for more than 100 years; ii) grassland
abandoned 10 years ago (abanG), with shrubs and Picea abies saplings; iii) early-stage forest (earlyF),
dominated by P. abies established on grassland abandoned around 1970; and iv) old forest (oldF),
dominated by Fagus sylvatica and P. abies, representing a reference for long-term forest land use.
Organic and mineral soil layers were collected down to 30 cm at eight points within three plots for each
successional stage.
Significantly more OC was stored in organic layers of oldF compared with other successional stages and
the organic layer N stocks were higher in oldF compared with manG and abanG. The OC and N
concentrations were higher in the top 10 cm mineral soil of grassland plots compared with forest. The
earlyF and oldF stored, on average, 28% to 35% less OC in top 10 cm mineral soil compared with manG
and abanG when stocks were calculated using equivalent soil mass (ESM) and equivalent soil depth
(ESD) approaches respectively. OC stocks in mineral soil (0-30 cm) calculated with ESD decreased from
manG to oldF; when accounting for total stone content, OC stocks in earlyF and oldF were 40% and 50%
lower than in manG, respectively. The inclusion of organic layers offset mineral soil OC stock differences
when only stones <5 cm were accounted for, but when considering the total stone content, OC stocks in
earlyF remained significantly lower (-31%) than in manG. Tree biomass contributed to higher ecosystem
C stocks in oldF, which stored 82-93 Mg ha-1
of C more than grasslands.
Our study revealed a decrease in total soil OC stocks after forest expansion on abandoned subalpine
grasslands. Tree biomass development contributed to increasing C storage, especially in a long-term
forest land use. Forest management should consider that tree biomass and organic layer development

3
require a minimum time period following grassland abandonment to compensate for the decrease in
mineral soil OC stocks and contribute positively to climate change mitigation.
Keywords
carbon sequestration; mineral soil; forest succession; soil C/N ratio; land-use change; grassland
abandonment
Abbreviations
LUC: land use change; C: carbon; N: nitrogen; SOC: soil organic carbon; IC: inorganic carbon; manG:
managed grassland; abanG: abandoned grassland; earlyF: early-stage forest; oldF: old forest; DBH:
diameter at breast height; ESD: equivalent soil depth; ESM: equivalent soil mass
4
1. Introduction
Land-use change (LUC) plays a major role in global carbon (C) budgets, influencing the amount of C
stored both in vegetation and soil (Foley et al., 2005). Soil organic carbon (SOC) stocks are controlled by
the balance between C inputs and outputs from soils, and LUC may influence C input as well as output
fluxes from ecosystems (Guo and Gifford, 2002). Changes in SOC stocks can be harder to detect than
changes in aboveground plant biomass (Post et al., 2001) but cannot be overlooked since soil C dynamics
can alter predictions of total ecosystem C storage (Jackson et al., 2002). Changes in SOC stocks resulting
from LUC can be better explained if nitrogen (N) changes are also taken into account (Halliday et al.,
2003), given the close link between C and N in soil organic matter (SOM) pools.
Recently, large areas of agricultural land have been abandoned worldwide, such as in Europe (Fuchs et
al., 2013), East Asia (Zhang et al., 2010), eastern North America (Brown et al., 2005) and South America
(Grau and Aide, 2008). The abandonment of grasslands represents the dominant LUC pattern and the
main driver for the establishment of new forest areas in mountainous and subalpine regions of Europe
(Zimmermann et al., 2010). Land abandonment can be explained by a series of socio-economic changes,
which lead to agricultural specialization/intensification in the most fertile areas, whereas unproductive
and less accessible sites are abandoned (Tappeiner et al., 2008). As a consequence of grassland
abandonment, progressive forest expansion commonly takes place, especially where site conditions and
biotic factors are favorable (Haugo et al., 2013).
The expansion of forests on grasslands is widely thought to act as a C sink, which has mainly been based
on the obvious increase in C stored in aboveground biomass after forest establishment on grassland
(Risch et al., 2008), while changes in SOC stocks are uncertain (Schulze et al., 2009; Poeplau and Don,
2013). The direction and magnitude of SOC changes can be affected by a multitude of factors such as
climate, management history, tree species colonizing the grassland, soil type, and time since abandonment
(Thuille and Schulze, 2006). In some cases, a depletion in SOC stocks can even offset the increase in C
stored in plant biomass (Jackson et al., 2002).
Recent reviews have investigated the effect of grassland to forest conversions on SOC, focusing mainly
on human-induced afforestation (Laganiere et al., 2010; Poeplau et al., 2011). According to Laganiere et

5
al. (2010), afforestation of pastures and natural grasslands did not result in a significant increase in SOC
stocks. Also Poeplau et al. (2011) reported that afforestation of grasslands, in most cases, did not lead to
SOC accumulation: in fact 75% of observations showed SOC losses, even up to 100 years following
afforestation. Several factors can be responsible for the reduction of C stored in the mineral soil. Firstly, a
shift from grassland to forest leads to a change in rooting system: forests are characterized by roots with
slower turnover and lower fine root biomass compared with grasslands (Solly et al., 2013), which can
lead to a reduced rate of humus formation (Guo et al., 2007). Secondly, forest growth in grassland areas
causes a shift in the composition of soil fauna, with the development of a new fauna that is often less
capable of transferring the aboveground C input into the mineral soil (Seeber et al., 2005). However,
losses of SOC in the mineral soil can be counterbalanced through the build-up of organic layers, which
accumulate over time until a steady state condition between litterfall and decomposition is reached
(Hooker and Compton, 2003; Thuille and Schulze, 2006). The SOC stored in the organic layers, however,
responds faster to changes in environmental conditions and management than SOC in the mineral soil
(Gaudinski et al., 2000). Furthermore, the conversion from grassland to forest was shown to decrease
mineral SOC storage in stable aggregates while increasing particulate organic matter accumulation, thus
suggesting an overall decrease in physical stability of total SOC stocks (Poeplau and Don, 2013).
Natural forest expansion on abandoned grasslands may have a different impact on SOC storage than
human-induced afforestation. With afforestation, initial losses of SOC can be stimulated by site
preparation prior to tree planting, but this is absent in the process of natural forest expansion (Poeplau et
al., 2011). Site preparation can affect SOC through increased organic matter (OM) mineralization and via
the removal of grassland vegetation, thereby reducing net primary productivity and fine root input in the
first years following afforestation (Don et al., 2009). On the other hand, canopy cover occurs later and
with higher spatial variation after natural forest expansion compared with the establishment of
plantations. Land-use change can consequently take more time and therefore a longer period of time will
be needed to detect a change in SOC stocks.
Especially in cold and mountainous regions, OM dynamics are still unclear (Leifeld and Fuhrer, 2009). In
temperate and boreal regions, OM turnover is slower compared with tropical regions (Trumbore, 1993),

6
and the balance between input and output from soils takes a longer time to establish (Olson, 1963).
Carbon accumulation consequently lasts longer in cold than in warm regions (Laganiere et al., 2010), and
C sink saturation after LUC can take more than 100 years (Poeplau et al., 2011). Changes in SOC
following LUC in mountainous regions can therefore be expected to occur at lower rates compared with
warmer lowland regions. Despite the recent and current increase in forest area due to grassland
abandonment, only few studies have investigated its effect on SOC stocks.
Contrasting trends in SOC storage have been reported for mountainous regions following forest
expansion in abandoned grasslands. A decrease in mineral SOC stocks after forest expansion was shown
by Thuille et al. (2000) and Thuille and Schulze (2006) in the case of coniferous forest expansion in the
Italian Alps and Germany, and by Alberti et al. (2008) for deciduous forest expansion in the Italian
Prealps. However, other studies have reported an increase or no change in mineral SOC stock, such as
after shrub encroachment into mountain grasslands of the Iberian peninsula (Montane et al., 2007) and
conifer forest development in the Swiss Alps (Risch et al., 2008). In Trentino, a mountainous region of
the Southern Alps (Italy) where 55% of the total land (6207 km2) is currently occupied by forests
(Rodeghiero et al., 2010), the forest area increased by 5% from 1973 to 1999, mainly due to natural forest
expansion on previous grasslands (Sitzia, 2009). In our study, a typical case of forest expansion for that
region was selected based on the “Neoboschi” project (2002-2005) (Sitzia, 2009). A land use and
management gradient was identified at the selected study area, comprising a managed grassland, an old
mixed forest, and two transitional phases where abandonment of grasslands led to progressive forest
colonization. The objective of this study was to investigate changes in soil OC and N stocks after forest
expansion on alpine grasslands. Our specific aims were to: i) compare soil OC, N concentrations and C/N
ratio in mineral and organic soil layers, and ii) compare soil OC and N stocks in the mineral and organic
layers of managed grassland, old mixed forest, and transitional phases.
2. Materials and Methods
2.1. Study area
7
The Neoboschi project investigated forest expansion in Trentino (Southern Alps, Italy), through the
comparison of aerial photos taken in 1973 and 1999 and via field surveys (Sitzia, 2009). The forest
expansion areas are dominated by tree and shrub species: Norway spruce (Picea abies (L.) Karst.),
Common hazel (Corylus avellana L.), Green alder (Alnus viridis (Chaix.) D.C.), European larch (Larix
decidua Mill.), and Hop-hornbeam (Ostrya carpinifolia Scop.) (Sitzia, 2009). Recently expanded forests
examined by the Neoboschi project have the following common features: i) developed by natural
regeneration; ii) established on previous meadows or pastures; iii) located at an elevation of around 600-
1200 m a.s.l.; and iv) located on south-facing gentle slopes.
Our study area was selected among the areas identified by the Neoboschi project, ensuring that all four
common characteristics were included. This allowed us to investigate a forest expansion pattern typical
for Trentino. The study area (45.94584 N, 11.25148 E) was located in a mountainous region in the
municipality of Lavarone (Trentino, Italy), with an elevation of around 1150 m a.s.l (Fig. 1). In the period
1992-2011, the mean annual air temperature was 7.2°C and the mean annual precipitation was 1278 mm,
as recorded by the meteorological station located around 600 m from the study area
(http://www.meteotrentino.it/). The wettest months were October and November, while the driest month
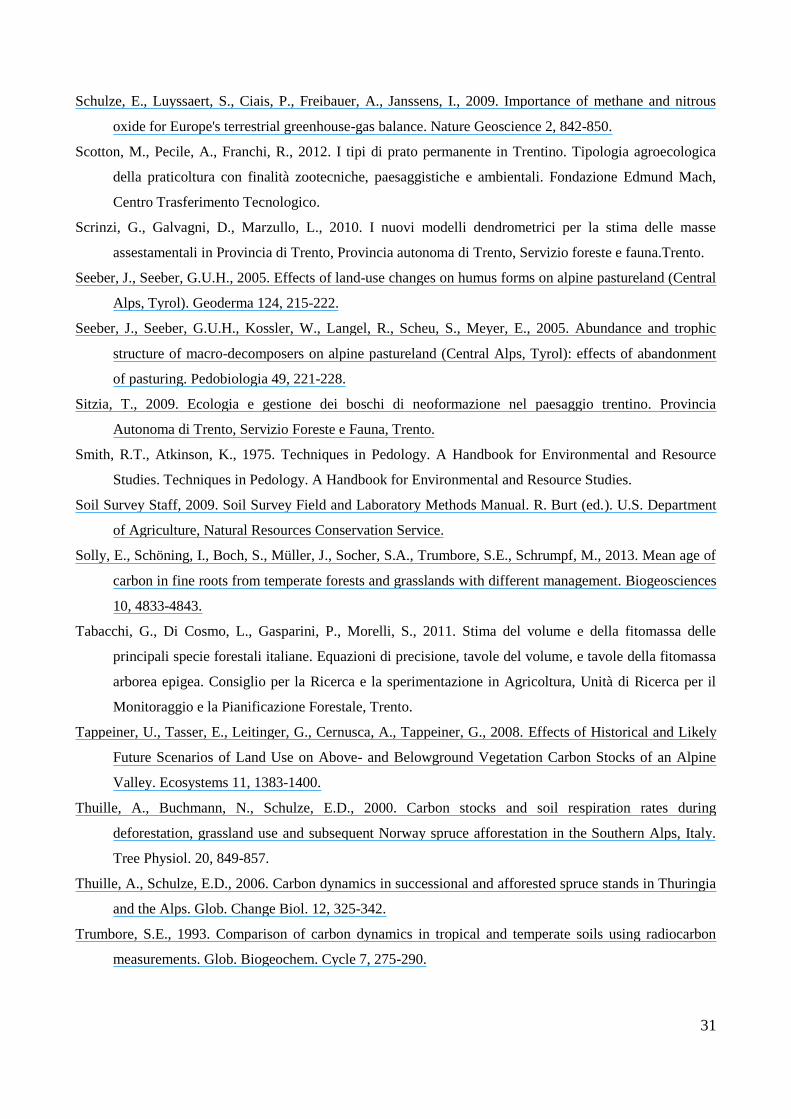
was February. The soil type was a Cambisol (IUSS, 2007), developed on calcareous parent material and
with soil texture ranging from clay loam to clay (Table 1). The mineral soil depth ranged from 15 to 50
cm, with an average of 30 cm. Eight representative grasslands in Lavarone (Trentino, Italy) were sampled
by Scotton et al., 2012, who found an average soil depth of 23 cm. A sampling depth of 30 cm therefore
allowed to investigate the majority of SOC and N stored in the soil profile.
The land use history at the study area was investigated through a comparison of orthorectified aerial
photos (taken in 1954, 1973, 2006), historical land registers (1861, 1940) and via interviews of local land
owners. A land use and management gradient was identified comprising (Fig. 1): i) a managed grassland
(manG), mown twice a year and fertilized once a year with the application of manure or slurry of cattle
manure for at least the past 100 years (c. 60 kg ha-1
year-1
of N and 0.65 Mg ha-1
year-1
of C), without
ploughing or intensive tillage; ii) an abandoned grassland (abanG), where a successional community of
8
shrubs and Norway spruce saplings has developed in a grassland abandoned approximately 10 years ago,
previously used for cattle grazing in the summer months; iii) an early-stage forest (earlyF), i.e. a ca. 35-
year-old forest dominated by Norway spruce established in a grassland abandoned around 1970,
previously used for cattle grazing; and iv) an old mixed forest that was not previously used as grassland
(oldF), composed mainly of European beech (Fagus sylvatica L.) and Norway spruce and already present
in the historical land register (1861). The managed grassland can be considered a long-term grassland
land use, the two transitional phases as stages of forest colonization on abandoned grasslands, whereas the
old forest is a reference that approximates long-term forest land use. Thus manG-abanG-earlyF can be
interpreted as phases of a LUC chronosequence, using a space for time substitution approach, with oldF
as a reference.
The manG was dominated by species belonging to the Poaceae family, such as Festuca pratensis Huds.,
Dactylis glomerata L. and Lolium perenne L. (Scotton et al., 2012). In abanG, the Poaceae family was
still prevalent but more Asteraceae species were present, such as Centaurea scabiosa L., Centaurea
nigrescens Willd., Carduus L. spp. and Carlina acaulis L. Moreover, shrubs and trees like Common
hazel, Juniperus communis L., Betula pendula Roth. and Norway spruce were colonizing abanG. In
earlyF, the dominant tree species was Norway spruce, with Common hazel shrubs and understory
vegetation such as Lonicera spp., Rubus spp., especially in small forest openings caused by natural tree
mortality. The oldF was dominated by European beech mixed with Norway spruce, Scots pine (Pinus
sylvestris L.) and European larch. The understory vegetation was characterized by the presence of
Vaccinium myrtillus L., Erica carnea L. and Cyclamen spp.
2.2. Soil sampling and processing
Within a 4 ha area (Fig. 1), three plots of similar topographic characteristics: elevation, low to medium
slope (from 4° to 15°) and south or south-east aspect were selected for soil sampling in each successional
stage, since topographic characteristics are known to affect OC and N storage in soil (Egli et al., 2009).
The investigated plots had the same soil type, geology and climatic conditions. As shown in Table 1, soil
9
texture was quite similar across the sampled plots: the clay content and the sum of silt and clay content
were not significantly different among the successional stages in all depth layers (P > 0.10).
In each plot eight soil samples were collected at the cardinal and ordinal points of a circle with a 5 m
radius (Mueller and Kogel-Knabner, 2009). This systematic sampling scheme provided a detailed
description of the spatial variability within each plot (Mueller and Kogel-Knabner, 2009), and according
to this scheme, forest soils were sampled both in between trees and close to tree stems. Soils were
sampled in August-October 2011 and 2012, just before foliar deciduous trees shed their leaves, that is,
when forest floor mass was at the annual minimum (Vesterdal et al., 2002).
The organic layers were collected at the eight sampling points, prior to mineral soil sampling. At earlyF
and oldF, the organic layers were collected using a 25x25 cm frame and separated in the field into LF
(litter and fermentation) and H (humified) layers. At manG and abanG, the organic layers were, in most
cases, thin (1-3 cm) and mixed with mineral material. These layers were collected from the same core
used for mineral soil sampling and initially separated based on visual assessment. The organic layers were
then re-classified based on their OC content measured in the laboratory: if they had an OC content lower
than 20%, they were considered part of the mineral soil (IUSS, 2007).
Following removal of the organic layer, the mineral soil was sampled to a depth of 30 cm, using a soil
corer with an internal diameter of 4.8 cm (Eijkelkamp, Giesbeek, The Netherlands). In the field, the core
was divided into four depth segments (0-5 cm, 5-10 cm, 10-20 cm, 20-30 cm) and packed into plastic
bags. When it was not possible to reach the maximum sampling depth due to the presence of bedrock or
boulders, the sampled depth was recorded and the remaining part of the core was considered to be
occupied by rock.
In the laboratory, the organic layers were cleaned by hand with the removal of herbaceous litter and
mineral soil particles that formed large aggregates. After cleaning, the LF samples were separated into
foliar and woody debris, while the H samples were separated into humified material and remains of
woody debris. The organic layer fractions were dried at 55°C for 48 hours or to constant weight and
weighed (Vesterdal et al., 2008). To determine the dry mass of the organic layers, a subsample of each
fraction was further dried at 105°C.
10
The mineral soil samples were air dried and then manually sieved at 2 mm. Roots were separated during
sieving and then dried at 105°C for the determination of dry mass. Root volume was estimated according
Rodeghiero et al. (2010), who determined the root density for different root diameter classes based on the
data collected in 150 sites in the Trentino region. The soil fraction <2 mm was dried at 55°C for 48 hours
or to constant weight and weighed. A subsample of soil fraction <2 mm was further dried at 105°C for the
determination of dry mass. The bulk density (Bd) of the soil fraction <2 mm was determined dividing the
dry weight of the soil fraction <2 mm by its volume.
The stone content was determined from the mineral soil cores and expressed as a percentage of total soil
volume. Stone volume was derived from their weight, considering an average stone density of 2.65 g cm-3
(Soil Survey Staff, 2009). Stones >5 cm (i.e. larger than the core diameter) were visually estimated from a
soil profile at least 40 cm wide and 30 cm deep, excavated in the centre of each plot.
2.3. Aboveground biomass
The main forest stand features were investigated in 600 m2 sampling areas (radius = 13.82 m), centered in
each plot, according to the procedure used for the regional and national forest inventory (Rodeghiero et
al., 2010; Gasparini and Tabacchi, 2011) (Table 2). All trees with diameter at breast height (DBH; 1.30
m) >2 cm were counted and identified at the species level. For each tree, two orthogonal DBH were
measured whereas the height was estimated from height-diameter functions developed for Trentino region
by Scrinzi et al. (2010). Tree aboveground biomass was estimated according to biomass equations
developed for Trentino by Tabacchi et al. (2011). The C stock in tree biomass was calculated using a C
concentration of 50% dry weight.
2.4. Soil chemical analysis
Before chemical analysis, the organic and mineral soil samples were ground to a fine powder using a ball
mill (RETSCH MM200, Haan, Germany). Samples were analyzed for C and N contents by dry
combustion with a PerkinElmer PE2400 CHNS/O elemental analyzer (Norwalk, CT, USA). Prior to dry
combustion, all mineral soil samples were treated with HCl (10%) for the removal of carbonates (Brodie

11
et al., 2011). The inorganic carbon (IC) content, soil pH (in 0.01 M CaCl2), and texture were measured on
a composite sample obtained by pooling the eight samples collected at the same depth in each plot. For
the estimation of the IC content, the pooled samples were measured by dry combustion before and after
treatment with HCl (Walthert et al., 2010). Soil texture was determined using the hydrometer method
(Smith and Atkinson, 1975) after removal of organic matter with hydrogen peroxide.
2.5. Stock calculations and statistical analysis
The C and N stored in the organic layers were calculated on an area basis (Sorg; Mg ha-1
) whereas the
mineral soil C and N stocks were calculated to an equivalent soil depth (ESD), according to the following
equation (Rodeghiero et al., 2010):
SESD = C*Bd*V*HF*10-1
where SESD is the element stock per unit area (Mg ha-1
); C is the element concentration (mg g-1
); Bd is the
bulk density of the soil fraction <2 mm (g cm-3
); V is the volume of the soil layer to a certain depth (cm3
cm-2
); HF is a dimensionless factor corrected for stone and coarse root volume, calculated as [1 - (stone
volume + root volume)/ V]; and 10-1
is a unit conversion factor.
The estimation of stocks according to the ESD approach can be influenced by variations in soil Bd, due to
seasonality or changes in land use and management intensity. To account for variation in soil Bd and
therefore in soil mass, the C and N stocks were also calculated using an equivalent soil mass approach
(ESM) (Ellert and Bettany, 1995). For each plot and soil depth, the average soil mass was calculated
(Schrumpf et al., 2011) and the lightest average soil mass was used as a reference for comparison of C
and N amounts across the sampled plots, according to the minimum ESM method suggested by Lee et al.
(2009). When soil OC and N concentrations are not uniform across the soil profile, the minimum ESM
method generally performs better than the maximum ESM, and it does not require soil mass to be added
from deeper soil layers (Lee et al., 2009).
To obtain equal soil masses, it was necessary to subtract a portion of soil from plots heavier than the
reference, according to the formula:
Msub = MESD - Mref

12
where Msub is the soil mass to be subtracted (Mg ha-1
); MESD is the soil mass calculated to a certain depth
(Mg ha-1
); Mref is the soil mass chosen as a reference (Mg ha-1
). Stocks of C and N per unit area were
calculated as:
Sequiv = SESD – Ssub
where Sequiv is the stock of element per unit area stored in the equivalent soil mass (Mg ha-1
); SESD is the
stock of element per unit area calculated to a certain depth (Mg ha-1
); Ssub is the stock of element in Msub
(Mg ha-1
).
In sites with stone content higher than 20%, the ESM stock calculation was shown to be unrealistic, due
to high variability of the soil fraction <2 mm (Schrumpf et al., 2011). Therefore, stocks were reported
using an ESM approach only for the upper soil layers (0-5 and 5-10 cm), where the total stone content
was lower than 20% for all plots.
Statistical analyses were performed with R (R Development Core Team, 2013). In each soil layer,
variables including OC concentration, N concentration, C/N ratio, and Bd were analysed with a linear
mixed-effect model, containing both fixed and random effects (Martinussen et al., 2012). The factor
successional stage comprising four levels (manG, abanG, earlyF, oldF) replicated with three plots, was
included as a fixed effect in the model. The random variation within each plot was further described by
eight sampling points, thus allowing the model to account for possible dependencies within the plot. The
model was built using the lme function contained in the R package nlme (Pinheiro et al., 2013). The P-
values of the fixed effect term were obtained on the basis of the likelihood ratio test (Martinussen et al.,
2012).The variables pH, OC and N stocks, for which a composite soil sample was considered, were tested
for differences among mean values with a one-way ANOVA, where successional stage was identified as
a factor with fixed effect.
The assumption of normal distribution of residuals was verified through quantile-quantile plots and
Shapiro-Wilk normality test. When the assumption was not met, a transformation (log or square root) was
applied to fulfill normality requirements. The assumption of homogenity of variances was then checked
13
with diagnostic plots and Levene´s test. Multiple range comparison of fixed effect mean values was
performed with the Tukey’s test, using the multcomp package (Hothorn et al., 2008).
When transformation did not fulfill the assumption of normality (OC concentration 20-30 cm; N
concentration 20-30 cm; Bd 10-20 cm; N concentration LF; C/N ratio LF), data were tested with a
Kruskal-Wallis rank sum test (H test). After Kruskal-Wallis, a multiple comparison of medians was
performed with the kruskalmc function in the R package pgirmess (Giraudoux, 2013).
The correlation between the C stock in the organic layers and mineral soil properties (C/N ratio, pH) was
obtained by computing the Pearson's product-moment correlation coefficient (r).
3. Results
3.1. Organic layer properties
The average OC and N concentrations in the non woody-fraction of organic layers significantly differed
among successional stages (Table 3). In oldF, the LF layers had higher OC and N concentrations than in
earlyF (P = 0.003 for OC concentration and P = 0.049 for N concentration). The H layers in oldF had
higher OC concentrations compared with abanG (P = 0.035), whereas the H layers in manG had higher N
concentrations compared with other successional stages (P = 0.002). The C/N ratio in the LF layer did not
differ among earlyF and oldF (P > 0.20), whereas the C/N ratio in the H layer was strongly affected by
the successional stage (P < 0.001) and increased significantly in the order manG < abanG < earlyF, oldF
(Table 3). The pH in the LF layer did not differ between earlyF and oldF (P > 0.10), whereas pH in the H
layer was higher (P < 0.001) in abanG than in earlyF and oldF, and the H layers in manG also had higher
pH compared with those in oldF (Table 3).
The amount of OC and N stored in the organic layers, as sum of LF and H layers, significantly differed
among successional stages (P < 0.001 for OC stocks and P = 0.002 for N stocks) (Fig. 2). The organic
layers in oldF stored significantly more OC than all other successional stages and earlyF had significantly
higher OC stocks than abanG. The organic layer N stocks were higher in oldF compared with manG and
abanG, whereas earlyF was not different from the other successional stages (Fig. 2).

14
As shown in Fig. 3, organic layer C stocks were positively related to C/N ratio in the H layer and
negatively related to pH in the H layer.
3.2. Mineral soil OC, N concentrations and other properties
Mineral soil OC concentration significantly differed among successional stages only in the 0-5 cm layer
(P = 0.002), whereas no significant difference emerged at lower depths (P > 0.17) (Fig. 4A). In the 0-5
cm layer, both manG and abanG had significantly higher OC concentrations compared with oldF,
whereas earlyF did not differ significantly from the other successional stages.
Mineral soil N concentration was affected by the successional stage in the 0-5 cm (P < 0.001) (Fig. 4B)
and 5-10 cm (P = 0.005) layers, whereas no significant difference was observed at lower depths (P >
0.18). In the 0-5 cm layer, N concentration increased significantly in the order oldF < earlyF < manG,
with abanG not significantly different from earlyF and manG. Grassland plots had mean values twice as
high as oldF. A similar trend was evident in 5-10 cm layer, where manG and abanG had significantly
higher N concentrations than oldF, but the concentration in earlyF was not different from the other
successional stages.
Mineral soil C/N ratio significantly differed among successional stages in all mineral soil layers (P <
0.001 in 0-5 cm, 5-10 cm, 10-20 cm and P = 0.006 in 20-30 cm) (Fig. 4C). In 0-5 and 5-10 cm layers, the
C/N ratio increased significantly in the order manG < abanG ≈ earlyF < oldF. At 10-20 cm depth, oldF
had significantly higher C/N ratio than other successional stages whereas at 20-30 cm the C/N ratio was
significantly higher in oldF than in manG and abanG.
Soil bulk density (Bd) did not differ among successional stages in the upper soil layers (P = 0.081 in 0-5
cm and P = 0.19 in 5-10 cm) and in 10-20 cm (P = 0.12). In the deepest soil layer (20-30 cm), Bd was
higher in manG than in abanG (P = 0.037) (Fig. 4D). No significant difference in soil pH emerged among
successional stages for all mineral soil layers (P > 0.20) (Fig. 4E).
Despite similar stone content was found in upper soil layers (0-10 cm), higher and more variable stone
content (> 5 cm) was found in deeper layers (10-30 cm) in the forest than in the grassland plots (Table 1).
However, no significant difference in stoniness emerged among successional stages for each depth

15
increment (P > 0.10), probably due to the high spatial variation of the stone content. Moreover, total
stoniness and OC concentration in the entire 0-30 cm soil profile were not significantly related (P > 0.20),
whereas soil Bd slightly decreased with increasing stoniness (P = 0.05, r = -0.571).
3.3. SOC and N stocks
The SOC stocks in the upper mineral soil layers were higher in manG and abanG compared with earlyF
and oldF when calculated with the ESD approach and considering the total stone volume (P < 0.001 at 0-
5 cm and P = 0.005 at 5-10 cm) (Fig. 5). EarlyF and oldF stored, on average, 35% less OC in the top 10
cm compared with manG and abanG. The SOC stocks in the upper mineral soil layers were also affected
by successional stages when calculated using the ESM approach (P = 0.012 at 0-5 cm and P = 0.022 at 5-
10 cm), but differences were less pronounced. Significantly more OC was stored in manG and abanG
compared with oldF in the 0-5 cm layer and in manG compared with oldF in the 5-10 cm layer. On
average, earlyF and oldF stored 28% less OC in the 0-10 cm layer than manG and abanG (Fig. 5B).
The N stocks in the upper mineral soil layers differed among successional stages (both ESD and ESM
approaches, P ≤ 0.001), with higher N stocks in manG and abanG compared with earlyF and oldF (Fig.
5C-D). The forest plots stored on average 48% and 41% less N in the top 10 cm compared with the
grassland plots when calculated with the ESD and ESM approaches respectively.
Considering only the volume of stones with diameter <5 cm, the mineral soil (0-30 cm) stored more OC
in manG compared with other successional stages (P < 0.001), with a significant decrease in the order
manG > abanG > oldF, and no differences between abanG and earlyF, or earlyF and oldF respectively
(Fig. 6A). Compared with manG, abanG stored, on average, 16% less OC, whereas earlyF and oldF
stored around 28% and 38% less OC than manG, respectively. When accounting for the total stone
content, the mineral soil showed a similar gradual decreasing trend from manG to oldF, with lower OC
stocks in earlyF (40%) and oldF (50%), respectively, compared with manG (Fig. 6B, P = 0.006).

16
The inclusion of the organic layers offset the mineral soil C stock difference when small stones were
accounted for (Fig. 6A, P = 0.20), but when accounting for the total stone content (Fig. 6B, P = 0.05),
earlyF had significantly lower OC stocks (-31%) compared with manG.
Soil N stocks in the entire 0-30 cm layer showed the same trend as OC stocks (Fig. 6C-D), but the relative
difference between grassland and forest successional stages was larger for N than for OC stocks. When
the organic layers were added to the mineral soil N stocks, the effect of successional stage remained
significant both when considering volume of stones <5 cm and the total stone content (P = 0.002).
3.4. Ecosystem OC stocks
Total ecosystem OC stocks significantly differed among successional stages (Fig. 7, P = 0.003). Higher
tree biomass (Table 2) contributed to greater OC stocks in oldF compared with other successional stages:
oldF stored 82 to 93 Mg ha-1
of C more than grassland plots and 60 Mg ha-1
of C more than earlyF.
Tree biomass, on average, accounted for 45% and 59% of ecosystem C stocks in earlyF and oldF
respectively, compared to only 4% in abanG. Organic layers contributed differently to total soil OC
stocks among successional stages. The organic layers contributed a mere 2% of total soil OC stocks in
manG and abanG, whereas the contribution increased to 16% and 38% in earlyF and oldF respectively.
4. Discussion
4.1. Changes in soil pH and C/N ratio
Due to the absence of fertilization and a change in plant species composition, the quality of litter input
generally decreases with grassland abandonment, with an increase in lignin and a decrease in N content
(Zeller et al., 2000; Gamper et al., 2007). The change in litter quality together with altered microclimatic
conditions (Hiltbrunner et al., 2013) have an impact on soil macro- and micro-fauna communities (Seeber
et al., 2005). The interaction among these factors can lead to a reduction of decomposition rates in both
organic layers and mineral soil (Seeber and Seeber, 2005; Gamper et al., 2007; Hiltbrunner et al., 2013).

17
In the H layer, LUC affected the C/N ratio and pH (Table 3), which respectively increased and decreased
with the expansion of forest on grasslands, in accordance with Thuille et al. (2000), Seeber and Seeber
(2005), and Gamper et al. (2007). The changes in these properties can be due to a change in litter quality
(Hiltbrunner et al., 2013) and decomposition processes within the organic layers (Gamper et al., 2007).
Litter quality and the decomposition stage of the organic layers are potentially involved in determining an
association between chemical properties of H layers and the C stored in the organic layers, which were
significantly correlated in our study (Fig. 3).
The pH in the H layer significantly decreased from abanG to earlyF and oldF (Table 3). This could have
been affected by increased organic acid production during decomposition processes or
extraction/exudation from plant tissues, to some extent neutralized by base cation mobilization (Dijkstra
et al., 2001). Moreover, increased N deposition associated with afforestation could have played a role in
the acidification of organic layers (de Schrijver et al., 2012). Burrowing earthworm species are generally
negatively affected by nutrient-poor, lignin-rich litter and increased soil acidity (Muys et al., 1992) as in
spruce-dominated forests. A decrease in earthworm activity can in turn contribute to organic layer buildup
and to a further slowdown of base cation circulation within the soil profile (de Schrijver et al., 2012).
Despite the fact that pH in the H layer significantly differed among successional stages, no significant
change in mineral soil pH was detected in our study (Fig. 4E): acidity could have been confined in the
organic layers or neutralized through base cation mobilization and mineral weathering in the nutrient-rich
soil, as shown by Dijkstra et al. (2001).
As forest developed on the former grassland plots in our study, C/N ratios in the H layers increased from
manG to earlyF, but did not differ significantly between earlyF and oldF (Table 3). In Seeber and Seeber
(2005), organic layer C/N ratios increased most soon after management intensity of alpine grasslands was
reduced, whereas our study showed that C/N ratio continued increasing until earlyF, when a stable C/N
ratio level seemed to be reached. Hooker and Compton (2003) showed that organic layer C/N ratio did
not significantly change with time since abandonment of cultivated land, whereas mineral soil C/N ratio
increased during 115 years of forest development. Mineral soil C/N ratio in our study similarly increased
from grassland to forest. In addition, C/N ratios significantly differed between earlyF and oldF down to

18
20 cm depth. We attribute the differences in C/N ratio among successional stages mainly to changes in
fertilization regime and litter quality, as both aboveground and belowground tree litter generally have
higher C/N ratios compared with grasses (Hiltbrunner et al., 2013).
Mineral soil C/N ratios are affected by LUC especially in the upper soil layers (Hooker and Compton,
2003; Vesterdal et al., 2008; Hiltbrunner et al., 2013). Deeper soil layers are usually affected to a lesser
extent by litter quality changes, especially in systems where little soil bioturbation leads to a slow transfer
of OM input from surface to deeper soil layers (Muys et al., 1992). However, oldF still had a higher C/N
ratio at 20-30 cm depth compared with manG and abanG (Fig. 4C), thus suggesting a difference in soil
properties as a result of different long-term use and management.
4.2. Changes in soil SOC and N stocks
Organic layers
The C stocks in the organic layers were affected by LUC, with more C stored under earlyF compared with
abanG, and highest C stocks were found under the oldF (Fig. 2). The above-ground biomass increased
due to expansion and growth of trees (Table 2), while harvesting of plant biomass no longer took place.
These factors could have led to an increase in aboveground litter input (Gamper et al., 2007). The C
accumulation in the organic layers may also have partly resulted from a shift in litter quality: when litter
input shifts from labile to recalcitrant, initial phases of decomposition usually slow down (Cotrufo et al.,
2013). Furthermore, application of manure in manG could also have played a role in determining litter
input decay rates in both direction and magnitude, interacting with ambient N deposition and litter quality
(Knorr et al., 2005). Intermediate N addition rates in sites with low ambient deposition and high quality
litter input (e.g. as in manG) often stimulate litter decomposition (Knorr et al., 2005).
Organic layer C sequestration rates after abandonment depend on several factors, such as tree species,
forest management, and soil type (Thuille and Schulze, 2006; Vesterdal et al., 2008). The earlyF
accumulated, on average, 0.20 Mg ha-1
year-1
of C since abandonment, which is consistent with previous
estimates of C accumulation following spruce development on alpine grasslands (0.24 Mg ha-1
year-1
)
(Thuille and Schulze, 2006). Forests in our study area were managed since 1950s mainly through
19
thinning, selective harvesting, according to close-to-nature silviculture, and were occasionally used for
cattle grazing. Moreover, organic layer C stocks at oldF in our study (27 Mg ha-1
of C) are in line with
organic layers of managed spruce- and beech-dominated forests growing on calcareous soils in the
Bavarian Alps, which stored on average 25 Mg ha-1
of C (Christophel et al., 2013).
Mineral and total soil
Our results revealed that, at the investigated study area, both OC and N concentrations and stocks in the
mineral soil were affected by a gradient in land use and management: manG and abanG showed highest
SOC concentrations and stocks, whereas earlyF and oldF had intermediate and lowest values,
respectively.
No difference in OC concentrations and stocks in the upper soil layers emerged between manG and
abanG, even though abanG, after a decade since abandonment, showed a tendency toward higher OC
concentrations in upper soil layers.
Based on studies dealing with grassland management, we expected that grasslands managed by mowing
or grazing would not differ in SOC stocks. Hassink (1994) could not identify any effect on SOC due to
management of grasslands based on mowing or grazing, and reviews typically have not differentiated
between these management types prior to LUC (Poeplau et al., 2011). The impact of mowing vs grazing
in the alpine region was investigated by Leifeld and Fuhrer (2009) who reported greater OC
concentrations in the upper layers (0-8 cm) under pasture compared with meadow. They attributed this
observation to the increased incorporation of plant material by animal treading or to different soil
properties in the paired plots.
Under decreasing management intensity of alpine grasslands, SOC stocks were slightly lower under the
high intensity (i.e. meadow) compared with low intensity management sites, probably due to a higher
aboveground biomass removal under the high intensity management (Meyer et al., 2012). In the Southern
Alps, Zeller et al. (2000) compared an intensively managed meadow and a meadow abandoned since 10
years, where dwarf shrubs had developed. They found higher SOC concentration in abandoned than in
managed meadow: the higher capacity for soil C sequestration in the first stages of grassland

20
abandonment can be due to a shift in litter quality (e.g. C/N ratio), which increases the capacity for C
accumulation at the same N content in soil.
Considering the outcomes of these studies, the slightly higher OC concentration found in abanG
compared with manG supports the idea that OC content tends to increase after the cessation of grassland
management. We cannot exclude, however, that differences in grassland management prior to
abandonment (haying vs grazing) could have affected the OC content observed in the transitional phases.
The earlyF had lower OC and N stocks in the upper soil layers (0-10 cm) and in the whole sampled layer
(0-30 cm) than manG and showed a tendency toward lower mean values also when compared with
abanG. Even when organic layers were included, total soil OC stocks remained significantly lower in
earlyF compared with manG when the total stone content was accounted for. Forest expansion on
abandoned grassland therefore led to a reduction in SOC stocks, even when accounting for the organic
layers.
Studies investigating the effect of grassland to forest LUC on SOC stocks, have mainly focused on
human-induced afforestation, reporting small changes in SOC stocks (Laganiere et al., 2010; Poeplau et
al., 2011). Poeplau and Don (2013) found no uniform trend in SOC changes in the majority of their
former grassland sites located throughout Europe, but reported a significant reduction in total SOC stocks
following Norway spruce afforestation at a site located in the Swiss Alps, with pedo-climatic conditions
similar to our study area. This reduction was attributed to lower belowground root litter input under forest
than under grassland. Hiltbrunner et al. (2013) analyzed a 120-year-long Norway spruce chronosequence
established on previously extensively-grazed pastures in the Swiss Alps. Similarly to our outcomes, they
reported lower SOC stocks under 40 and 45-year-old stands than under pasture, even when including the
organic layers.
When grasslands are afforested by tree planting, site preparation generally leads to soil disturbance and
therefore OM mineralization (Johansson, 1994), which in turn negatively affects the SOC content in the
afforested plot. The effect of forest growth alone is thus potentially masked. Studies focusing on forest
expansion due to land abandonment are therefore better suited to unravel the single effect of forest growth
on grasslands but, on the other hand, abandonment entails a longer transitional phase until the new forest

21
reaches canopy closure. Despite the fact that grassland abandonment is widespread in the Alps, only few
studies have been conducted in this region. In one of these studies, Alberti et al. (2008) reported that
development of Ash (Fraxinus excelsior L.) and Sycamore (Acer pseudoplatanus L.) on abandoned
meadows in the eastern Italian Prealps, characterized by high precipitation (2500 – 3000 mm), led to a
decrease in the total soil OC stock and to an exponential decrease in total soil N stocks with stand age.
Thuille et al. (2000) found no clear pattern in mineral soil OC stocks along a Norway spruce
chronosequence on abandoned meadows in the Southern Alps (Italy), despite a linear increase in organic
layer C stocks with stand age. In a later study, Thuille and Schulze (2006) showed that development of
Norway spruce on alpine meadows led to a decline in mineral soil OC stocks, ranging from 20 to 40%,
but losses were compensated by OC accumulation in developing organic layers. Similarly, we found that
mineral soil OC stocks in the top 10 cm of soil decreased by 28 to 40% (accounting for stones < 5 cm and
the total stone content, respectively) from manG to earlyF, but OC accumulation in the organic layers was
not sufficient to offset mineral SOC losses.
Our results showed lower mineral SOC stocks under oldF than manG. Also Thuille and Schulze (2006)
reported significantly lower mineral SOC stocks for both successional and permanent forests than under
managed meadows. These outcomes suggest that under similar long-term continuity, mineral SOC stocks
are lower under alpine forests than under alpine managed grasslands, but OC accumulation in the organic
layers can compensate for lower mineral SOC stocks under long-term forest management.
Changes in root dynamics can be partly responsible for the lower mineral SOC content found under
forests compared with grasslands (Guo et al., 2007). Root-derived C represents a substantial portion of
the SOC pool, through its large contribution to total soil C input and through mechanisms of preferential
stabilization in soil (Rasse et al., 2005). Shorter fine root length, lower mass and older fine root C age
were found under forest compared with grassland sites (Guo et al., 2007; Solly et al., 2013). Despite
higher aboveground litter input, fine root input decreased when conifers were planted in native pasture
(Guo et al., 2007). The decrease in fine root length can lead to a smaller contact area at the soil-root

22
interface, which plays a key role for C stabilization through root exudation processes and enhancement of
microbial activity (Guo et al., 2005).
A change in macrofauna composition is often reported after abandonment of grasslands (Seeber et al.,
2005) and in different phases of forest growth (Salmon et al., 2006). Incorporation of organic matter in
the mineral soil layers can be slower than loss of OM through respiration processes in the first stages of
abandonment (Clark et al., 2012), thus causing a decrease in OC content in the mineral soil.
Climatic conditions, such as precipitation and temperature, can influence SOC changes due to LUC
(Alberti et al., 2011; Poeplau et al., 2011). After woody plant invasion on grasslands, a negative
relationship was shown by Jackson et al. (2002) between precipitation rate and SOC stock changes.
Similarly, Guo and Gifford (2002) showed that pasture to forest conversions negatively affected SOC
stocks in high rainfall areas (>1200 mm), whereas the same land conversion had little effect on SOC
stocks in low rainfall areas. The effect of woody plant invasion on SOC stocks was examined along a
precipitation gradient in the Italian Alps and Sicily by Alberti et al. (2011). A mean annual rainfall of 900
mm was identified as the overall threshold between C gain and C loss, with drier sites increasing and
wetter sites losing C (Alberti et al., 2011). Our study area (on average: 1278 mm rainfall), which could be
classified as a high rainfall area both by Guo and Gifford (2002) and Alberti et al. (2011), similarly
showed a decrease in SOC stocks after forest expansion.
Responses of SOC to forest development could have been affected by grassland SOC content prior to
abandonment. Precipitation regimes positively affect the productivity of grasslands (Parton et al., 1993).
In a global dataset, the relationship between SOC and mean annual precipitation had a slope 2.6 times
higher for grasslands than for shrublands/woodlands, with woodlands having 43% less SOC than
grasslands at a precipitation level of 1000 mm (Jackson et al., 2002). Application of manure, as well as
precipitation regimes, could have increased the grassland SOC content in our study area, directly through
the input of additional C or indirectly through the enhancement of grassland productivity (Conant et al.,
2001). As application of manure is an inherent part of the grassland system, application of manure could
have had an effect on the specific trends we observed in SOC and N stocks during the LUC from
managed grassland to forest. Trends in SOC can be better understood if N changes are taken into account,

23
as C and N accumulation in SOM are closely related (Rastetter et al., 1992). A decrease in SOC can be
related to a reduction in soil N, which can be immobilized into the growing tree biomass (Kirschbaum et
al., 2008) or lost through leaching (Hansen et al., 2007). We attributed the higher N concentrations and
stocks in grasslands compared with forest plots mainly to the annual application of manure. Moreover,
with forest development, N is used for tree biomass build up, which can lead to a depletion of soil N
reservoirs. We have no estimates of N leaching losses, but N leaching can occur especially in the initial
phases of grassland abandonment and tree establishment, when tree N requirements are still low. Before
forest canopy closure, the high tree demand for N generally reduces N losses through leaching, whereas
in older stands N leaching tends to rise again due to increased N deposition and decreased tree N
requirements (Hansen et al., 2007).
4.3. Carbon distribution within the ecosystem
Despite lower amounts of OC in the mineral soil in the study area, the forest plots stored more C within
the ecosystem compared with grasslands due to the C sequestered in tree biomass, thus contributing
positively to atmospheric CO2 removal and to climate change mitigation.
With forest expansion, the contribution of organic layers to total SOC stocks was higher in earlyF and
oldF than in manG and abanG. However, the OC stored in the organic layers responds faster to changes in
environmental conditions and management compared with mineral SOC (Gaudinski et al., 2000;
Vesterdal et al., 2002) thus leading to a decrease in mean residence time of total soil OM and hence of its
overall stability (Gaudinski et al., 2000).
Considering climate change mitigation, a long-term forest can accumulate a greater amount of C than
grasslands and transitional phases. Nevertheless, the main part of the additional C is stored in tree
biomass and organic layers, which constitute less stable C pools due to external disturbances, such as
management, harvesting and environmental modifications, compared with C stored in mineral soil layers.
4.4. Methodological approaches for C stock calculation in alpine soils

24
Comparability among the sampled plots was ensured by similar soil type, geology and climatic
conditions. In the design of our study, we tried to avoid pseudoreplication as much as possible, through
interspersion of plots belonging to the same successional stage with plots of a different successional
stage. Despite plots of abanG tended to be clustered, we believe that they showed sufficient variation
among each other to ensure statistical independence.
Both ESD and ESM approaches revealed similar patterns in OC and N stocks for upper soil layers as
affected by successional stage. Relative changes in upper soil OC stocks (top 10 cm) were more marked
when computed to an equivalent depth then to an equivalent soil mass. As fine soil mass in the grasslands
was generally greater than that in forest plots, SOC stocks were reduced accordingly, thus resulting in the
reported differences among successional stages. The use of ESM instead of ESD can affect detection of C
and N changes (Lee et al., 2009), although in our study differences between manG and oldF were evident
using both stock calculation methods. This pattern is in agreement with detected differences in soil OC
and N concentration among successional stages.
The ESM approach was applicable only to the upper soil layers (0-5 and 5-10 cm), due to the high stone
content (> 20%) found in deeper layers. Despite the soil OC stocks (0-30 cm) calculated using an ESD
approach could have been affected by differences in Bd, the decrease in soil OC stocks from manG to
oldF was also found in upper soil layers calculated with ESM, thus supporting the validity of our results.
Different methods for accounting for stone volume can strongly influence estimates of element stocks in
soil. For the entire 0-30 cm layer, mineral SOC and N stocks decreased from grassland to forest plots
based on both stone volume accounting methods. However, when including organic layers and stones >5
cm in the mineral soil, significantly lower OC stocks were found in earlyF compared with grassland plots
while no significant difference emerged when considering only stones <5 cm. The total or partial
exclusion of stones from stock calculations can lead to an overestimation of C and N stored in a certain
area, or influence comparison of means between sites even for soil characterized by low to moderate
stoniness, adding large uncertainties to fine soil content estimation (Schrumpf et al., 2011). Therefore,
appropriate accounting of stone volume is especially relevant to quantify the C stored in stony
mountainous soils and to estimate the effect of LUC on soil C storage. However, the stoniness issue for

25
stock calculation is rarely taken into account: studies often do not report how stones were measured and
how different ways of stone inclusion can affect the final outcomes. In stony soils, the estimation of LUC
effect on SOC dynamics may be biased when stone content differs between land uses, not only because of
stock calculation and stone content determination, but also due to potential effects of stones and boulders
on plant growth and soil properties. High stone content can lead to a reduction in plant litter input to soil,
due to a negative effect of reduced fine soil volume on plant productivity. In other cases, high stone
content does not affect the OM input to the soil, because rock fragments subject to weathering can
significantly contribute to nutrient supply and water-holding capacity (Childs and Flint, 1990). In such
cases, SOM would be concentrated in a smaller soil volume, due to the presence of stones (Childs and
Flint, 1990), and this could theoretically lead to a higher final SOC concentration. High stone content in
soil can also cause a decrease in soil Bd (Childs and Flint, 1990; Poesen and Lavee, 1994), due to a
different physical packing of soil particles and to the concentration of OM input in a smaller volume of
soil (Poesen and Lavee, 1994). However, such information may be uncertain as bulk density is difficult to
assess in stony soils (Rodeghiero et al., 2010).
Despite that the investigated plots had the same soil type, geology and climatic conditions, we found
higher and more variable stone content (> 5 cm) in deeper layers (10-30 cm) in the forest than at the
grassland plots. This may be related to the stone removal which was performed in the past decades along
with grassland management, in order to improve soil physical conditions for plant growth. We found no
significant relationship between SOC and stoniness, but we cannot exclude that the higher stone content
in forest plots could have had an influence on site productivity and therefore led to lower OC
sequestration potential compared with the grassland plots. Moreover, the higher content of stones >5 cm
found in deeper layers (10-30 cm) at the forest than at the grassland plots could have influenced SOC
stocks (0-30 cm) calculated accounting for the total stone content, but a decrease in SOC stocks from
manG to oldF was also shown when accounting only for stones <5 cm (0-30 cm) and in upper soil layers
(0-5 and 5-10 cm), which were characterized by fairly homogeneous stone content across plots.
5. Conclusions

26
Our results revealed a decrease in total SOC stocks (including the organic layers) ca. 35 years after the
forest started to expand on abandoned subalpine grasslands within the investigated study area, whereas no
significant change was reported after a decade since grassland abandonment. Even if a long-term forest
land use (e.g. oldF) stored lower mineral SOC stock than a managed grassland, this was compensated by
OC accumulation in the organic layers. Appropriate quantification of stocks and stone volume play a key
role in the quantification of soil C storage and therefore in determining the potential LUC contribution to
climate change mitigation.
Development of tree biomass on former grasslands contributed to increasing ecosystem C storage,
especially following a long-term forest land use, which stored around 80 Mg ha-1
of C more than the
managed grassland. With respect to climate change mitigation, management of successional forests
developing on abandoned grasslands should consider that tree biomass development and organic layer
accumulation require a minimum time period following abandonment to compensate for the decrease in
mineral soil OC stocks. Older forest stands, in fact, positively contribute to ecosystem C storage, but C
sequestered in tree biomass and organic layers is stored in less stable forms compared with C in the
mineral soil.
Acknowledgements
We are grateful to Maurizio Bagnara, Mauro Cavagna, Lucio Di Cosmo, Lorenzo Frizzera and Roberto
Zampedri for their help in soil sampling and data collection, to Matteo Girardi for assistance in laboratory
analyses, and to Augusto Zanella for soil profile classifications. We also thank Francesco Gubert and
Angelo Pecile for providing information on alpine grassland management, Renato and Paolo Slaghenaufi
for sharing with us precious information on the land-use history, and Cristina Martinez for the English
proofreading. Finally, we acknowledge Tommaso Sitzia and the Autonomous Province of Trento, for
making the results of the Neoboschi project and cadastral data available to us.
27
References
Alberti, G., Leronni, V., Piazzi, M., Petrella, F., Mairota, P., Peressotti, A., Piussi, P., Valentini, R., Gristina,
L., La Mantia, T., 2011. Impact of woody encroachment on soil organic carbon and nitrogen in
abandoned agricultural lands along a rainfall gradient in Italy. Regional Environmental Change 11,
917-924.
Alberti, G., Peressotti, A., Piussi, P., Zerbi, G., 2008. Forest ecosystem carbon accumulation during a
secondary succession in the Eastern Prealps of Italy. Forestry 81, 1-11.
Brodie, C.R., Leng, M.J., Casford, J.S.L., Kendrick, C.P., Lloyd, J.M., Yongqiang, Z., Bird, M.I., 2011.
Evidence for bias in C and N concentrations and δ13C composition of terrestrial and aquatic organic
materials due to pre-analysis acid preparation methods. Chemical Geology 282, 67-83.
Brown, D.G., Johnson, K.M., Loveland, T.R., Theobald, D.M., 2005. Rural land use-trends in the
conterminous United States, 1950-2000. Ecol. Appl. 15, 1851-1863.
Childs, S.W., Flint, A.L., 1990. Physical properties of forest soils containing rock fragments. Sustained
productivity of forest soils, 95-121.
Christophel, D., Spengler, S., Schmidt, B., Ewald, J., Prietzel, J., 2013. Customary selective harvesting has
considerably decreased organic carbon and nitrogen stocks in forest soils of the Bavarian Limestone
Alps. For. Ecol. Manage. 305, 167-176.
Clark, J.D., Plante, A.F., Johnson, A.H., 2012. Soil Organic Matter Quality in Chronosequences Of
Secondary Northern Hardwood Forests In Western New England. Soil Sci. Soc. Am. J. 76, 684-693.
Conant, R.T., Paustian, K., Elliott, E.T., 2001. Grassland management and conversion into grassland: effects
on soil carbon. Ecol. Appl. 11, 343-355.
Cotrufo, M.F., Wallenstein, M.D., Boot, C.M., Denef, K., Paul, E., 2013. The Microbial Efficiency-Matrix
Stabilization (MEMS) framework integrates plant litter decomposition with soil organic matter
stabilization: do labile plant inputs form stable soil organic matter? Glob. Change Biol. 19, 988-995.
de Schrijver, A., de Frenne, P., Staelens, J., Verstraeten, G., Muys, B., Vesterdal, L., Wuyts, K., van Nevel,
L., Schelfhout, S., de Neve, S., Verheyen, K., 2012. Tree species traits cause divergence in soil
acidification during four decades of postagricultural forest development. Glob. Change Biol. 18, 1127-
1140.
Dijkstra, F.A., Geibe, C., Holmström, S., Lundström, U.S., Van Breemen, N., 2001. The effect of organic
acids on base cation leaching from the forest floor under six North American tree species. Eur. J. Soil
Sci. 52, 205-214.
Don, A., Rebmann, C., Kolle, O., Scherer-Lorenzen, M., Schulze, E.-D., 2009. Impact of afforestation-
associated management changes on the carbon balance of grassland. Glob. Change Biol. 15, 1990-
2002.
Egli, M., Sartori, G., Mirabella, A., Favilli, F., Giaccai, D., Delbos, E., 2009. Effect of north and south
exposure on organic matter in high Alpine soils. Geoderma 149, 124-136.

28
Ellert, B.H., Bettany, J.R., 1995. Calculation of organic matter and nutrients stored in soils under contrasting
management regimes. Can. J. Soil Sci. 75, 529-538.
Foley, J.A., DeFries, R., Asner, G.P., Barford, C., Bonan, G., Carpenter, S.R., Chapin, F.S., Coe, M.T.,
Daily, G.C., Gibbs, H.K., Helkowski, J.H., Holloway, T., Howard, E.A., Kucharik, C.J., Monfreda, C.,
Patz, J.A., Prentice, I.C., Ramankutty, N., Snyder, P.K., 2005. Global consequences of land use.
Science 309, 570-574.
Fuchs, R., Herold, M., Verburg, P.H., Clevers, J.G.P.W., 2013. A high-resolution and harmonized model
approach for reconstructing and analysing historic land changes in Europe. Biogeosciences 10, 1543-
1559.
Gamper, S.M., Tasser, E., Tappeiner, U., 2007. Short-time effects of land-use changes on O-horizon in
subalpine grasslands. Plant Soil 299, 101-115.
Gasparini, P., Tabacchi, G., 2011. L'inventario Nazionale delle Foreste e dei serbatoi forestali di Carbonio
INFC 2005. Secondo inventario forestale nazionale italiano. Metodi e risultati. Ministero delle
Politiche Agricole, Alimentari e Forestali, Corpo Forestale dello Stato; Consiglio per la Ricerca e la
Sperimentazione in Agricoltura, Unità di ricerca per il Monitoraggio e la Pianificazione Forestale. In.
Edagricole, Milano, p. 653.
Gaudinski, J.B., Trumbore, S.E., Davidson, E.A., Zheng, S., 2000. Soil carbon cycling in a temperate forest:
radiocarbon-based estimates of residence times, sequestration rates and partitioning of fluxes.
Biogeochemistry 51, 33-69.
Giraudoux, P., 2013. pgirmess: Data analysis in ecology. R package version 1.5.7. http://CRAN.R-
project.org/package=pgirmess.
Grau, H.R., Aide, M., 2008. Globalization and land-use transitions in Latin America. Ecology and Society
13, 16.
Guo, L., Wang, M., Gifford, R., 2007. The change of soil carbon stocks and fine root dynamics after land use
change from a native pasture to a pine plantation. Plant Soil 299, 251-262.
Guo, L.B., Gifford, R.M., 2002. Soil carbon stocks and land use change: a meta analysis. Glob. Change Biol.
8, 345-360.
Guo, L.B., Halliday, M.J., Siakimotu, S.J.M., Gifford, R.M., 2005. Fine root production and litter input: Its
effects on soil carbon. Plant Soil 272, 1-10.
Halliday, J.C., Tate, K.R., McMurtrie, R.E., Scott, N.A., 2003. Mechanisms for changes in soil carbon
storage with pasture to Pinus radiata land-use change. Glob. Change Biol. 9, 1294-1308.
Hansen, K., Rosenqvist, L., Vesterdal, L., Gundersen, P., 2007. Nitrate leaching from three afforestation
chronosequences on former arable land in Denmark. Glob. Change Biol. 13, 1250-1264.
Hassink, J., 1994. Effects of soil texture and grassland management on soil organic C and N and rates of C
and N mineralization. Soil Biology and Biochemistry 26, 1221-1231.
29
Haugo, R.D., Bakker, J.D., Halpern, C.B., 2013. Role of biotic interactions in regulating conifer invasion of
grasslands. For. Ecol. Manage. 289, 175-182.
Hiltbrunner, D., Zimmermann, S., Hagedorn, F., 2013. Afforestation with Norway spruce on a subalpine
pasture alters carbon dynamics but only moderately affects soil carbon storage. Biogeochemistry 115,
251-266.
Hooker, T.D., Compton, J.E., 2003. Forest ecosystem carbon and nitrogen accumulation during the first
century after agricultural abandonment. Ecol. Appl. 13, 299-313.
Hothorn, T., Bretz, F., Westfall, P., 2008. Simultaneous Inference in General Parametric Models.
Biometrical Journal 50, 346-363.
IUSS, 2007. World reference base for soil resources 2006, first update 2007. World Soil Resources Report
No. 103. FAO, Rome. In.
Jackson, R.B., Banner, J.L., Jobbagy, E.G., Pockman, W.T., Wall, D.H., 2002. Ecosystem carbon loss with
woody plant invasion of grasslands. Nature 418, 623-626.
Johansson, M.B., 1994. The influence of soil scarification on the turn‐ over rate of slash needles and nutrient
release. Scandinavian Journal of Forest Research 9, 170-179.
Kirschbaum, M.U., Guo, L., Gifford, R.M., 2008. Observed and modelled soil carbon and nitrogen changes
after planting a Pinus radiata stand onto former pasture. Soil Biology and Biochemistry 40, 247-257.
Knorr, M., Frey, S., Curtis, P., 2005. Nitrogen additions and litter decomposition: a meta-analysis. Ecology
86, 3252-3257.
Laganiere, J., Angers, D.A., Pare, D., 2010. Carbon accumulation in agricultural soils after afforestation: a
meta-analysis. Glob. Change Biol. 16, 439-453.
Lee, J., Hopmans, J.W., Rolston, D.E., Baer, S.G., Six, J., 2009. Determining soil carbon stock changes:
Simple bulk density corrections fail. Agriculture, Ecosystems & Environment 134, 251-256.
Leifeld, J., Fuhrer, J., 2009. Long-term management effects on soil organic matter in two cold, high-
elevation grasslands: clues from fractionation and radiocarbon dating. Eur. J. Soil Sci. 60, 230-239.
Martinussen, T., Skovgaard, I.M., Sørensen, H., 2012. A first guide to statistical computations in R.
Samfundslitteratur.
Meyer, S., Leifeld, J., Bahn, M., Fuhrer, J., 2012. Free and protected soil organic carbon dynamics respond
differently to abandonment of mountain grassland. Biogeosciences 9, 853-865.
Montane, F., Rovira, P., Casals, P., 2007. Shrub encroachment into mesic mountain grasslands in the Iberian
peninsula: Effects of plant quality and temperature on soil C and N stocks. Glob. Biogeochem. Cycle
21.
Mueller, C.W., Kogel-Knabner, I., 2009. Soil organic carbon stocks, distribution, and composition affected
by historic land use changes on adjacent sites. Biol. Fertil. Soils 45, 347-359.

30
Muys, B., Lust, N., Granval, P., 1992. Effects of grassland afforestation with different tree species on
earthworm communities, litter decomposition and nutrient status. Soil Biology and Biochemistry 24,
1459-1466.
Olson, J.S., 1963. Energy storage and the balance of producers and decomposers in ecological systems.
Ecology 44, 322-331.
Parton, W., Scurlock, J., Ojima, D., Gilmanov, T., Scholes, R., Schimel, D., Kirchner, T., Menaut, J.C.,
Seastedt, T., Garcia Moya, E., 1993. Observations and modeling of biomass and soil organic matter
dynamics for the grassland biome worldwide. Glob. Biogeochem. Cycle 7, 785-809.
Pinheiro, J., Bates, D., DebRoy, S., Sarkar, D., 2013. nlme: Linear and Nonlinear Mixed Effects Models. R
package version 3.1-109.
Poeplau, C., Don, A., 2013. Sensitivity of soil organic carbon stocks and fractions to different land-use
changes across Europe. Geoderma 192, 189-201.
Poeplau, C., Don, A., Vesterdal, L., Leifeld, J., Van Wesemael, B., Schumacher, J., Gensior, A., 2011.
Temporal dynamics of soil organic carbon after land-use change in the temperate zone - carbon
response functions as a model approach. Glob. Change Biol. 17, 2415-2427.
Poesen, J., Lavee, H., 1994. Rock fragments in top soils: significance and processes. CATENA 23, 1-28.
Post, W.M., Izaurralde, R.C., Mann, L.K., Bliss, N., 2001. Monitoring and verifying changes of organic
carbon in soil. In, Storing Carbon in Agricultural Soils: A Multi-Purpose Environmental Strategy.
Springer, pp. 73-99.
R Development Core Team, 2013. In. R Foundation for Statistical Computing, Vienna, Austria. URL
http://www.R-project.org/.
Rasse, D.P., Rumpel, C., Dignac, M.-F., 2005. Is soil carbon mostly root carbon? Mechanisms for a specific
stabilisation. Plant Soil 269, 341-356.
Rastetter, E.B., McKane, R.B., Shaver, G.R., Melillo, J.M., 1992. Changes in C storage by terrestrial
ecosystems: How C-N interactions restrict responses to CO2 and temperature. Water Air Soil Pollut
64, 327-344.
Risch, A.C., Jurgensen, M.F., Page-Dumroese, D.S., Wildi, O., Schutz, M., 2008. Long-term development of
above- and below-ground carbon stocks following land-use change in subalpine ecosystems of the
Swiss National Park. Can. J. For. Res.-Rev. Can. Rech. For. 38, 1590-1602.
Rodeghiero, M., Tonolli, S., Vescovo, L., Gianelle, D., Cescatti, A., Sottocornola, M., 2010. INFOCARB: A
regional scale forest carbon inventory (Provincia Autonoma di Trento, Southern Italian Alps). For.
Ecol. Manage. 259, 1093-1101.
Salmon, S., Mantel, J., Frizzera, L., Zanella, A., 2006. Changes in humus forms and soil animal communities
in two developmental phases of Norway spruce on an acidic substrate. For. Ecol. Manage. 237, 47-56.
Schrumpf, M., Schulze, E.D., Kaiser, K., Schumacher, J., 2011. How accurately can soil organic carbon
stocks and stock changes be quantified by soil inventories? Biogeosciences 8, 1193-1212.
31
Schulze, E., Luyssaert, S., Ciais, P., Freibauer, A., Janssens, I., 2009. Importance of methane and nitrous
oxide for Europe's terrestrial greenhouse-gas balance. Nature Geoscience 2, 842-850.
Scotton, M., Pecile, A., Franchi, R., 2012. I tipi di prato permanente in Trentino. Tipologia agroecologica
della praticoltura con finalità zootecniche, paesaggistiche e ambientali. Fondazione Edmund Mach,
Centro Trasferimento Tecnologico.
Scrinzi, G., Galvagni, D., Marzullo, L., 2010. I nuovi modelli dendrometrici per la stima delle masse
assestamentali in Provincia di Trento, Provincia autonoma di Trento, Servizio foreste e fauna.Trento.
Seeber, J., Seeber, G.U.H., 2005. Effects of land-use changes on humus forms on alpine pastureland (Central
Alps, Tyrol). Geoderma 124, 215-222.
Seeber, J., Seeber, G.U.H., Kossler, W., Langel, R., Scheu, S., Meyer, E., 2005. Abundance and trophic
structure of macro-decomposers on alpine pastureland (Central Alps, Tyrol): effects of abandonment
of pasturing. Pedobiologia 49, 221-228.
Sitzia, T., 2009. Ecologia e gestione dei boschi di neoformazione nel paesaggio trentino. Provincia
Autonoma di Trento, Servizio Foreste e Fauna, Trento.
Smith, R.T., Atkinson, K., 1975. Techniques in Pedology. A Handbook for Environmental and Resource
Studies. Techniques in Pedology. A Handbook for Environmental and Resource Studies.
Soil Survey Staff, 2009. Soil Survey Field and Laboratory Methods Manual. R. Burt (ed.). U.S. Department
of Agriculture, Natural Resources Conservation Service.
Solly, E., Schöning, I., Boch, S., Müller, J., Socher, S.A., Trumbore, S.E., Schrumpf, M., 2013. Mean age of
carbon in fine roots from temperate forests and grasslands with different management. Biogeosciences
10, 4833-4843.
Tabacchi, G., Di Cosmo, L., Gasparini, P., Morelli, S., 2011. Stima del volume e della fitomassa delle
principali specie forestali italiane. Equazioni di precisione, tavole del volume, e tavole della fitomassa
arborea epigea. Consiglio per la Ricerca e la sperimentazione in Agricoltura, Unità di Ricerca per il
Monitoraggio e la Pianificazione Forestale, Trento.
Tappeiner, U., Tasser, E., Leitinger, G., Cernusca, A., Tappeiner, G., 2008. Effects of Historical and Likely
Future Scenarios of Land Use on Above- and Belowground Vegetation Carbon Stocks of an Alpine
Valley. Ecosystems 11, 1383-1400.
Thuille, A., Buchmann, N., Schulze, E.D., 2000. Carbon stocks and soil respiration rates during
deforestation, grassland use and subsequent Norway spruce afforestation in the Southern Alps, Italy.
Tree Physiol. 20, 849-857.
Thuille, A., Schulze, E.D., 2006. Carbon dynamics in successional and afforested spruce stands in Thuringia
and the Alps. Glob. Change Biol. 12, 325-342.
Trumbore, S.E., 1993. Comparison of carbon dynamics in tropical and temperate soils using radiocarbon
measurements. Glob. Biogeochem. Cycle 7, 275-290.

32
Vesterdal, L., Ritter, E., Gundersen, P., 2002. Change in soil organic carbon following afforestation of
former arable land. For. Ecol. Manage. 169, 137-147.
Vesterdal, L., Schmidt, I.K., Callesen, I., Nilsson, L.O., Gundersen, P., 2008. Carbon and nitrogen in forest
floor and mineral soil under six common European tree species. For. Ecol. Manage. 255, 35-48.
Walthert, L., Graf, U., Kammer, A., Luster, J., Pezzotta, D., Zimmermann, S., Hagedorn, F., 2010.
Determination of organic and inorganic carbon, δ13C, and nitrogen in soils containing carbonates after
acid fumigation with HCl. Journal of Plant Nutrition and Soil Science 173, 207-216.
Zeller, V., Bahn, M., Aichner, M., Tappeiner, U., 2000. Impact of land-use change on nitrogen
mineralization in subalpine grasslands in the Southern Alps. Biol. Fertil. Soils 31, 441-448.
Zhang, K., Dang, H., Tan, S., Wang, Z., Zhang, Q., 2010. Vegetation community and soil characteristics of
abandoned agricultural land and pine plantation in the Qinling Mountains, China. For. Ecol. Manage.
259, 2036-2047.
Zimmermann, P., Tasser, E., Leitinger, G., Tappeiner, U., 2010. Effects of land-use and land-cover pattern
on landscape-scale biodiversity in the European Alps. Agriculture, Ecosystems & Environment 139,
13-22.
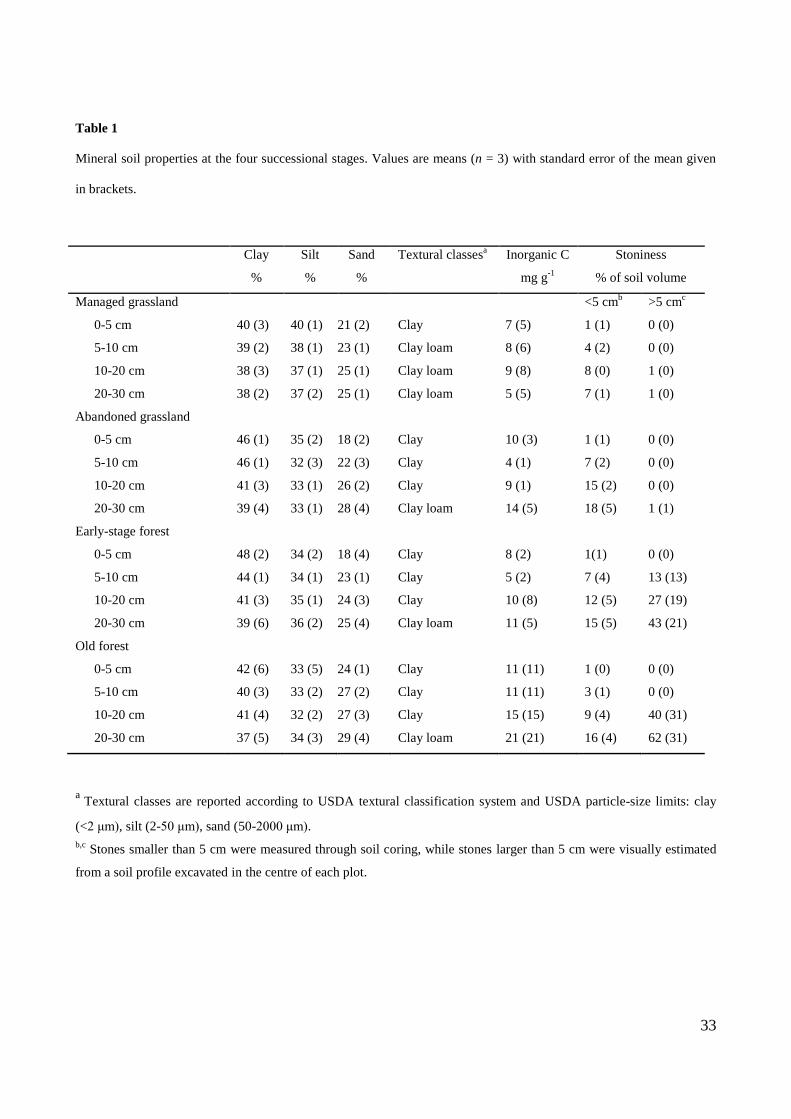
33
Table 1
Mineral soil properties at the four successional stages. Values are means (n = 3) with standard error of the mean given
in brackets.
Clay
%
Silt
%
Sand
%
Textural classesa Inorganic C
mg g-1
Stoniness
% of soil volume
Managed grassland <5 cmb >5 cm
c
0-5 cm 40 (3) 40 (1) 21 (2) Clay 7 (5) 1 (1) 0 (0)
5-10 cm 39 (2) 38 (1) 23 (1) Clay loam 8 (6) 4 (2) 0 (0)
10-20 cm 38 (3) 37 (1) 25 (1) Clay loam 9 (8) 8 (0) 1 (0)
20-30 cm 38 (2) 37 (2) 25 (1) Clay loam 5 (5) 7 (1) 1 (0)
Abandoned grassland
0-5 cm 46 (1) 35 (2) 18 (2) Clay 10 (3) 1 (1) 0 (0)
5-10 cm 46 (1) 32 (3) 22 (3) Clay 4 (1) 7 (2) 0 (0)
10-20 cm 41 (3) 33 (1) 26 (2) Clay 9 (1) 15 (2) 0 (0)
20-30 cm 39 (4) 33 (1) 28 (4) Clay loam 14 (5) 18 (5) 1 (1)
Early-stage forest
0-5 cm 48 (2) 34 (2) 18 (4) Clay 8 (2) 1(1) 0 (0)
5-10 cm 44 (1) 34 (1) 23 (1) Clay 5 (2) 7 (4) 13 (13)
10-20 cm 41 (3) 35 (1) 24 (3) Clay 10 (8) 12 (5) 27 (19)
20-30 cm 39 (6) 36 (2) 25 (4) Clay loam 11 (5) 15 (5) 43 (21)
Old forest
0-5 cm 42 (6) 33 (5) 24 (1) Clay 11 (11) 1 (0) 0 (0)
5-10 cm 40 (3) 33 (2) 27 (2) Clay 11 (11) 3 (1) 0 (0)
10-20 cm 41 (4) 32 (2) 27 (3) Clay 15 (15) 9 (4) 40 (31)
20-30 cm 37 (5) 34 (3) 29 (4) Clay loam 21 (21) 16 (4) 62 (31)
a Textural classes are reported according to USDA textural classification system and USDA particle-size limits: clay
(<2 μm), silt (2-50 μm), sand (50-2000 μm).
b,c Stones smaller than 5 cm were measured through soil coring, while stones larger than 5 cm were visually estimated
from a soil profile excavated in the centre of each plot.
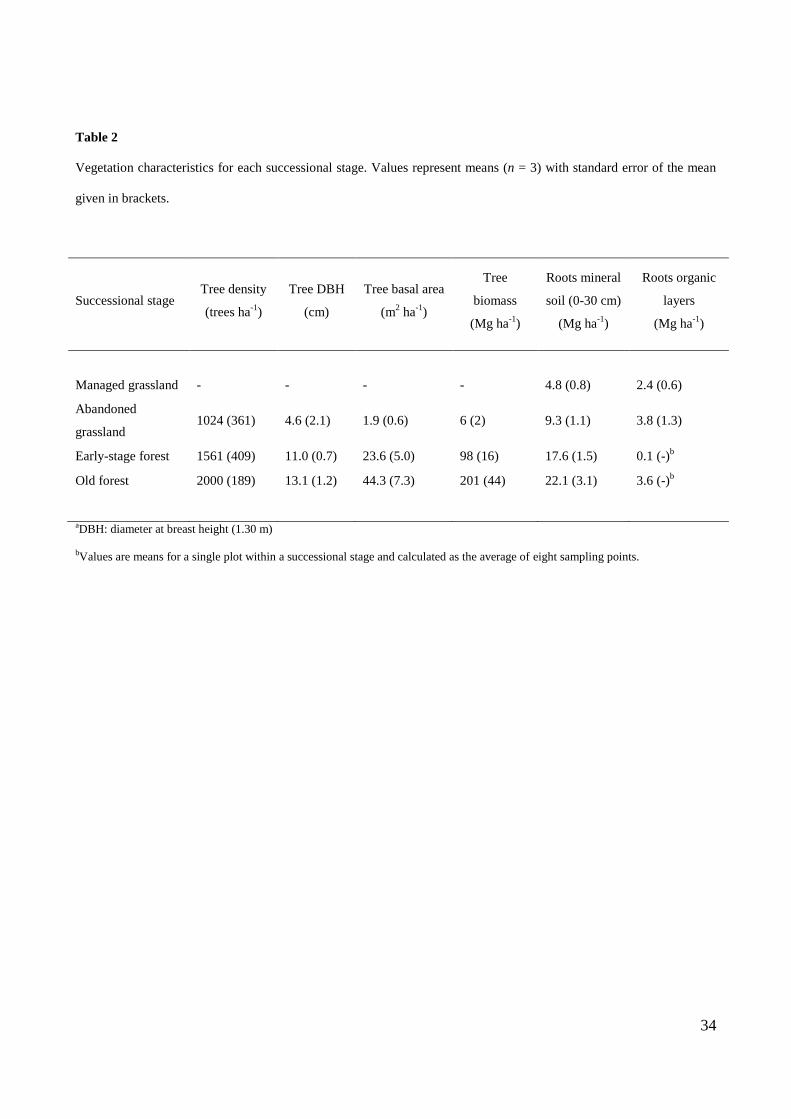
34
Table 2
Vegetation characteristics for each successional stage. Values represent means (n = 3) with standard error of the mean
given in brackets.
Successional stage Tree density
(trees ha-1
)
Tree DBH
(cm)
Tree basal area
(m2 ha
-1)
Tree
biomass
(Mg ha-1
)
Roots mineral
soil (0-30 cm)
(Mg ha-1
)
Roots organic
layers
(Mg ha-1
)
Managed grassland - - - - 4.8 (0.8) 2.4 (0.6)
Abandoned
grassland 1024 (361) 4.6 (2.1) 1.9 (0.6) 6 (2) 9.3 (1.1) 3.8 (1.3)
Early-stage forest 1561 (409) 11.0 (0.7) 23.6 (5.0) 98 (16) 17.6 (1.5) 0.1 (-)b
Old forest 2000 (189) 13.1 (1.2) 44.3 (7.3) 201 (44) 22.1 (3.1) 3.6 (-)b
aDBH: diameter at breast height (1.30 m)
bValues are means for a single plot within a successional stage and calculated as the average of eight sampling points.

35
Table 3
OC concentration, N concentration, C/N ratio and pH in the non-woody fraction of the organic layers (LF: litter and
fermentation layer; H: humified layer) at the four successional stages. For each organic layer and successional stage,
values represent means (n = 3) with standard error of the mean given in brackets. Within each organic layer, different
letters indicate significantly different means based on Tukey’s test, with P < 0.05. If no letters are present, means are
not significantly different among successional stages.
OC (mg g-1
) N (mg g-1
) C/N pH
LF layer
Managed grassland - - - -
Abandoned grassland - - - -
Early-stage forest 432 (13) b 16.3 (0.2) b 26.5 (0.6) 5.0 (0.1)
Old forest 481 (4) a 17.9 (0.6) a 26.9 (0.9) 4.7 (0.1)
H layer
Managed grassland 241 (29) ab 21.6 (2.4) a 11.2 (0.2) c 6.0 (0.3) ab
Abandoned grassland 218 (3) b 15.3 (0.5) b 14.3 (0.2) b 6.5 (0.1) a
Early-stage forest 260 (23) ab 12.8 (0.9) b 20.2 (0.6) a 5.2 (0.2) bc
Old forest 343 (37) a 15.4 (1.0) b 22.2 (0.9) a 4.5 (0.1) c
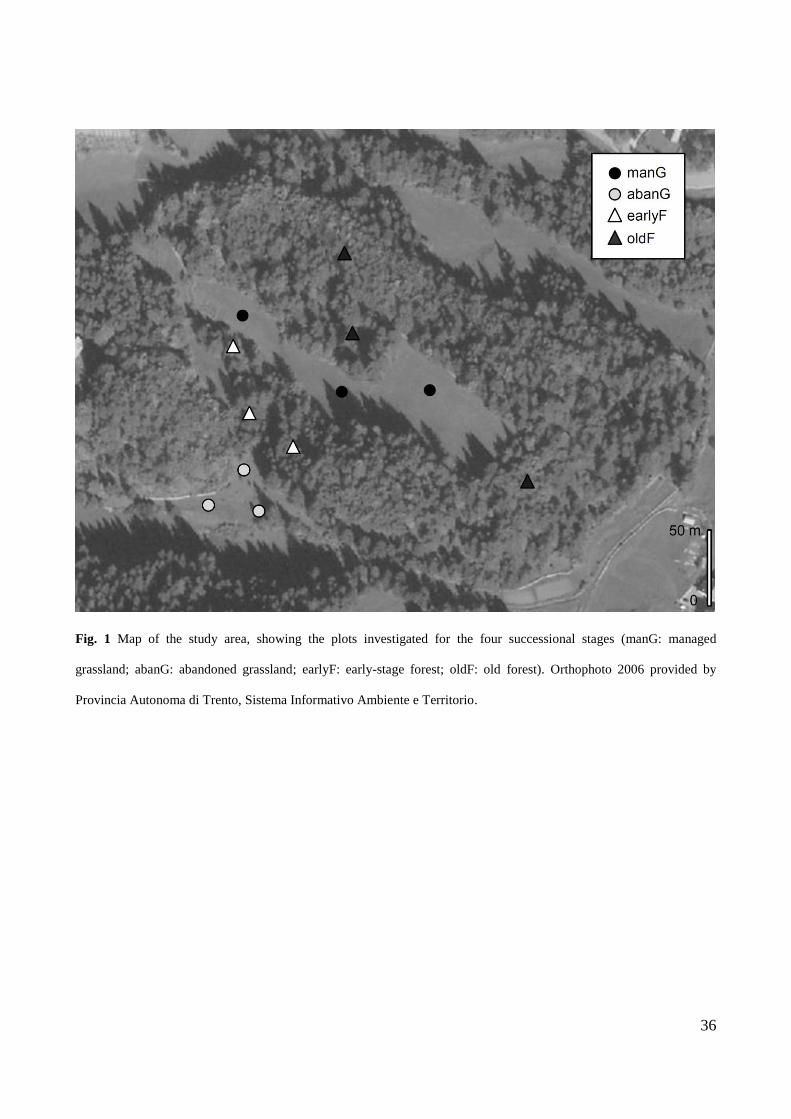
36
Fig. 1 Map of the study area, showing the plots investigated for the four successional stages (manG: managed
grassland; abanG: abandoned grassland; earlyF: early-stage forest; oldF: old forest). Orthophoto 2006 provided by
Provincia Autonoma di Trento, Sistema Informativo Ambiente e Territorio.

37
Fig. 2 Soil OC (A) and N stocks (B) stored in the organic layers (LF: litter and fermentation; H: humified layer) at the
four successional stages (manG: managed grassland; abanG: abandoned grassland; earlyF: early-stage forest; oldF: old
forest). Error bars represent the standard error of the mean (n = 3). For the sum of LF and H, different letters indicate
significantly different means based on Tukey’s test, with P < 0.05. If no letters are present, means are not significantly
different among successional stages.
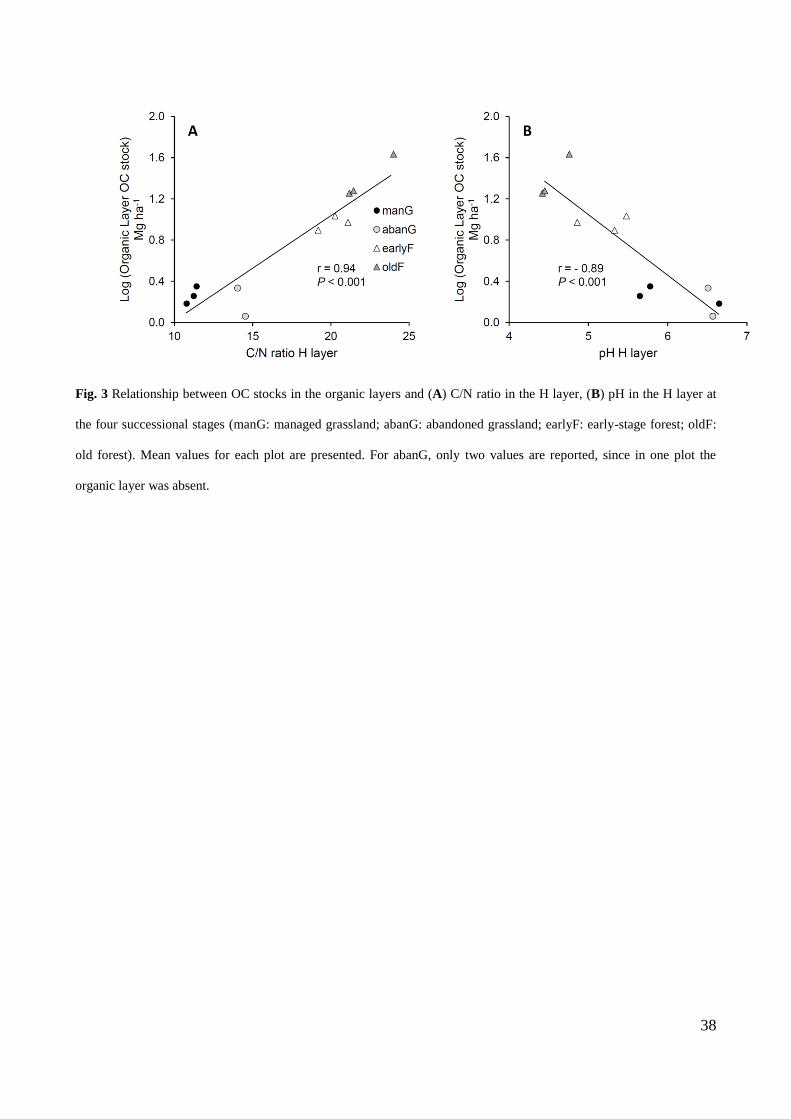
38
Fig. 3 Relationship between OC stocks in the organic layers and (A) C/N ratio in the H layer, (B) pH in the H layer at
the four successional stages (manG: managed grassland; abanG: abandoned grassland; earlyF: early-stage forest; oldF:
old forest). Mean values for each plot are presented. For abanG, only two values are reported, since in one plot the
organic layer was absent.

39
Fig. 4. Depth distribution in the mineral soil of (A) OC concentration, (B) N concentration, (C) C/N ratio, (D) bulk
density (Bd) and (E) pH at the four successional stages (manG: managed grassland; abanG: abandoned grassland;
earlyF: early-stage forest; oldF: old forest). Error bars represent the standard error of the mean (n = 3). Within each
depth, different letters indicate significantly different means based on Tukey’s test, with P < 0.05. If no letters are
present, means are not significantly different among successional stages.

40
Fig. 5 Upper mineral soil layers OC and N stocks (0-5 cm, 5-10 cm) at the four successional stages (manG: managed
grassland; abanG: abandoned grassland; earlyF: early-stage forest; oldF: old forest), considering total stone content. In
(A) and (C), OC stocks and N stocks in mineral soil were calculated with an equivalent soil depth approach (ESD),
whereas in (B), and (D) OC stocks were calculated with an equivalent soil mass approach (ESM). Error bars represent
the standard error of the mean (n = 3). Within each soil layer, different letters indicate significantly different means
based on Tukey’s test, with P < 0.05.

41
Fig. 6 Soil OC and N stocks at the four successional stages (manG: managed grassland; abanG: abandoned grassland;
earlyF: early-stage forest; oldF: old forest), calculated using an equivalent soil depth approach (ESD). In (A) and (C),
mineral soil OC and N stocks are calculated considering stones <5 cm only, whereas in (B) and (D), OC and N stocks
are calculated considering the total stone content. Error bars represent the standard error of the mean (n = 3). Within
each soil layer, different letters indicate significantly different means based on Tukey’s test, with P < 0.05. If no letters
are present, means are not significantly different among successional stages.

42
Fig. 7 Ecosystem OC stocks at the four successional stages (manG: managed grassland; abanG: abandoned grassland;
earlyF: early-stage forest; oldF: old forest). Error bars represent the standard error of the mean (n = 3). Mineral soil OC
stocks are calculated using an equivalent soil depth approach and considering the total stone content. For the sum of
mineral soil, organic layers and tree biomass OC stocks, different letters indicate significantly different means based on
Tukey’s test, with P < 0.05.