Changes in Soil Organic Carbon and Nitrogen Fractions with Duration of No-Tillage Management
10
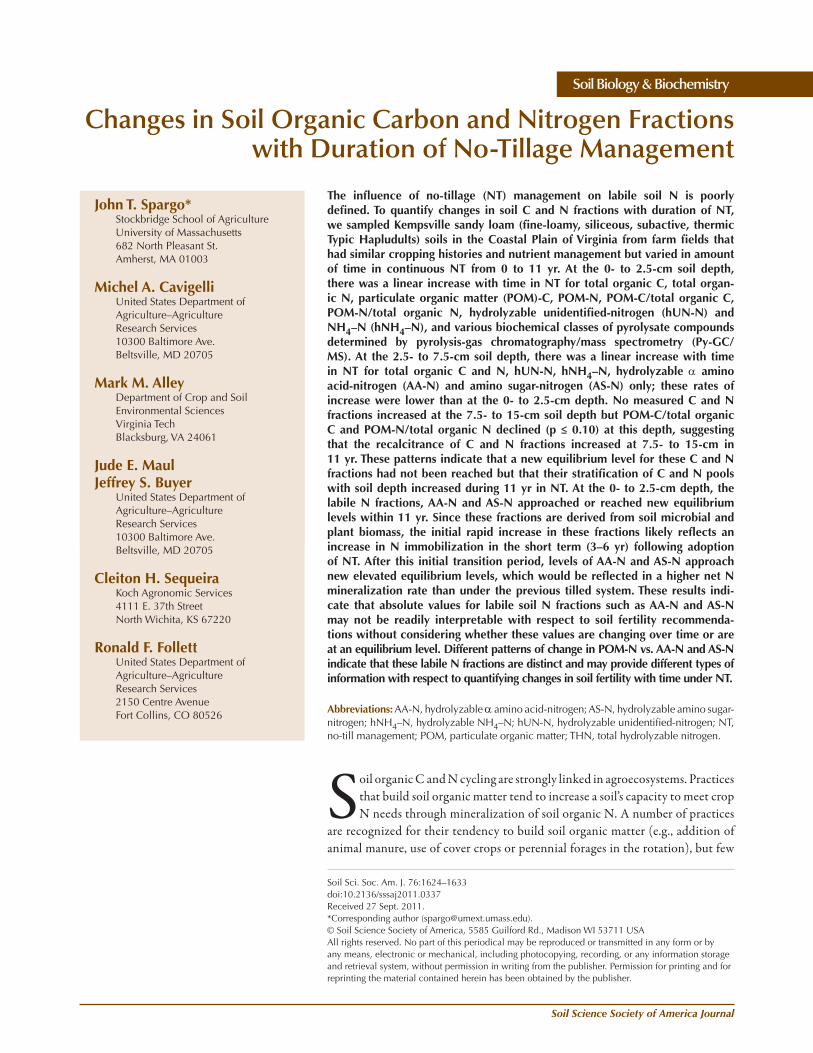
Soil Science Society of America Journal Soil Sci. Soc. Am. J. 76:1624–1633 doi:10.2136/sssaj2011.0337 Received 27 Sept. 2011. *Corresponding author ([email protected]). © Soil Science Society of America, 5585 Guilford Rd., Madison WI 53711 USA All rights reserved. No part of this periodical may be reproduced or transmitted in any form or by any means, electronic or mechanical, including photocopying, recording, or any information storage and retrieval system, without permission in writing from the publisher. Permission for printing and for reprinting the material contained herein has been obtained by the publisher. Changes in Soil Organic Carbon and Nitrogen Fractions with Duration of No-Tillage Management Soil Biology & Biochemistry S oil organic C and N cycling are strongly linked in agroecosystems. Practices that build soil organic matter tend to increase a soil’s capacity to meet crop N needs through mineralization of soil organic N. A number of practices are recognized for their tendency to build soil organic matter (e.g., addition of animal manure, use of cover crops or perennial forages in the rotation), but few John T. Spargo* Stockbridge School of Agriculture University of Massachusetts 682 North Pleasant St. Amherst, MA 01003 Michel A. Cavigelli United States Department of Agriculture–Agriculture Research Services 10300 Baltimore Ave. Beltsville, MD 20705 Mark M. Alley Department of Crop and Soil Environmental Sciences Virginia Tech Blacksburg, VA 24061 Jude E. Maul Jeffrey S. Buyer United States Department of Agriculture–Agriculture Research Services 10300 Baltimore Ave. Beltsville, MD 20705 Cleiton H. Sequeira Koch Agronomic Services 4111 E. 37th Street North Wichita, KS 67220 Ronald F. Follett United States Department of Agriculture–Agriculture Research Services 2150 Centre Avenue Fort Collins, CO 80526 The influence of no-tillage (NT) management on labile soil N is poorly defined. To quantify changes in soil C and N fractions with duration of NT, we sampled Kempsville sandy loam (fine-loamy, siliceous, subactive, thermic Typic Hapludults) soils in the Coastal Plain of Virginia from farm fields that had similar cropping histories and nutrient management but varied in amount of time in continuous NT from 0 to 11 yr. At the 0- to 2.5-cm soil depth, there was a linear increase with time in NT for total organic C, total organ- ic N, particulate organic matter (POM)-C, POM-N, POM-C/total organic C, POM-N/total organic N, hydrolyzable unidentified-nitrogen (hUN-N) and NH 4 –N (hNH 4 –N), and various biochemical classes of pyrolysate compounds determined by pyrolysis-gas chromatography/mass spectrometry (Py-GC/ MS). At the 2.5- to 7.5-cm soil depth, there was a linear increase with time in NT for total organic C and N, hUN-N, hNH 4 –N, hydrolyzable α amino acid-nitrogen (AA-N) and amino sugar-nitrogen (AS-N) only; these rates of increase were lower than at the 0- to 2.5-cm depth. No measured C and N fractions increased at the 7.5- to 15-cm soil depth but POM-C/total organic C and POM-N/total organic N declined (p ≤ 0.10) at this depth, suggesting that the recalcitrance of C and N fractions increased at 7.5- to 15-cm in 11 yr. These patterns indicate that a new equilibrium level for these C and N fractions had not been reached but that their stratification of C and N pools with soil depth increased during 11 yr in NT. At the 0- to 2.5-cm depth, the labile N fractions, AA-N and AS-N approached or reached new equilibrium levels within 11 yr. Since these fractions are derived from soil microbial and plant biomass, the initial rapid increase in these fractions likely reflects an increase in N immobilization in the short term (3–6 yr) following adoption of NT. After this initial transition period, levels of AA-N and AS-N approach new elevated equilibrium levels, which would be reflected in a higher net N mineralization rate than under the previous tilled system. These results indi- cate that absolute values for labile soil N fractions such as AA-N and AS-N may not be readily interpretable with respect to soil fertility recommenda- tions without considering whether these values are changing over time or are at an equilibrium level. Different patterns of change in POM-N vs. AA-N and AS-N indicate that these labile N fractions are distinct and may provide different types of information with respect to quantifying changes in soil fertility with time under NT. Abbreviations: AA-N, hydrolyzable α amino acid-nitrogen; AS-N, hydrolyzable amino sugar- nitrogen; hNH 4 –N, hydrolyzable NH 4 –N; hUN-N, hydrolyzable unidentified-nitrogen; NT, no-till management; POM, particulate organic matter; THN, total hydrolyzable nitrogen.
-
Upload
independent -
Category
Documents
-
view
5 -
download
0
Transcript of Changes in Soil Organic Carbon and Nitrogen Fractions with Duration of No-Tillage Management
Soil Science Society of America Journal
Soil Sci. Soc. Am. J. 76:1624–1633doi:10.2136/sssaj2011.0337 Received 27 Sept. 2011. *Corresponding author ([email protected]). © Soil Science Society of America, 5585 Guilford Rd., Madison WI 53711 USAAll rights reserved. No part of this periodical may be reproduced or transmitted in any form or by any means, electronic or mechanical, including photocopying, recording, or any information storage and retrieval system, without permission in writing from the publisher. Permission for printing and for reprinting the material contained herein has been obtained by the publisher.
Changes in Soil Organic Carbon and Nitrogen Fractions with Duration of No-Tillage Management
Soil Biology & Biochemistry
Soil organic C and N cycling are strongly linked in agroecosystems. Practices that build soil organic matter tend to increase a soil’s capacity to meet crop N needs through mineralization of soil organic N. A number of practices
are recognized for their tendency to build soil organic matter (e.g., addition of animal manure, use of cover crops or perennial forages in the rotation), but few
John T. Spargo*Stockbridge School of AgricultureUniversity of Massachusetts 682 North Pleasant St. Amherst, MA 01003
Michel A. CavigelliUnited States Department of Agriculture–Agriculture Research Services10300 Baltimore Ave.Beltsville, MD 20705
Mark M. AlleyDepartment of Crop and Soil Environmental SciencesVirginia TechBlacksburg, VA 24061
Jude E. MaulJeffrey S. Buyer
United States Department of Agriculture–Agriculture Research Services10300 Baltimore Ave.Beltsville, MD 20705
Cleiton H. Sequeira Koch Agronomic Services4111 E. 37th StreetNorth Wichita, KS 67220
Ronald F. FollettUnited States Department of Agriculture–Agriculture Research Services2150 Centre AvenueFort Collins, CO 80526
The infl uence of no-tillage (NT) management on labile soil N is poorly defi ned. To quantify changes in soil C and N fractions with duration of NT, we sampled Kempsville sandy loam (fi ne-loamy, siliceous, subactive, thermic Typic Hapludults) soils in the Coastal Plain of Virginia from farm fi elds that had similar cropping histories and nutrient management but varied in amount of time in continuous NT from 0 to 11 yr. At the 0- to 2.5-cm soil depth, there was a linear increase with time in NT for total organic C, total organ-ic N, particulate organic matter (POM)-C, POM-N, POM-C/total organic C, POM-N/total organic N, hydrolyzable unidentifi ed-nitrogen (hUN-N) and NH4–N (hNH4–N), and various biochemical classes of pyrolysate compounds determined by pyrolysis-gas chromatography/mass spectrometry (Py-GC/MS). At the 2.5- to 7.5-cm soil depth, there was a linear increase with time in NT for total organic C and N, hUN-N, hNH4–N, hydrolyzable α amino acid-nitrogen (AA-N) and amino sugar-nitrogen (AS-N) only; these rates of increase were lower than at the 0- to 2.5-cm depth. No measured C and N fractions increased at the 7.5- to 15-cm soil depth but POM-C/total organic C and POM-N/total organic N declined (p ≤ 0.10) at this depth, suggesting that the recalcitrance of C and N fractions increased at 7.5- to 15-cm in 11 yr. These patterns indicate that a new equilibrium level for these C and N fractions had not been reached but that their stratifi cation of C and N pools with soil depth increased during 11 yr in NT. At the 0- to 2.5-cm depth, the labile N fractions, AA-N and AS-N approached or reached new equilibrium levels within 11 yr. Since these fractions are derived from soil microbial and plant biomass, the initial rapid increase in these fractions likely refl ects an increase in N immobilization in the short term (3–6 yr) following adoption of NT. After this initial transition period, levels of AA-N and AS-N approach new elevated equilibrium levels, which would be refl ected in a higher net N mineralization rate than under the previous tilled system. These results indi-cate that absolute values for labile soil N fractions such as AA-N and AS-N may not be readily interpretable with respect to soil fertility recommenda-tions without considering whether these values are changing over time or are at an equilibrium level. Different patterns of change in POM-N vs. AA-N and AS-N indicate that these labile N fractions are distinct and may provide different types of information with respect to quantifying changes in soil fertility with time under NT.
Abbreviations: AA-N, hydrolyzable α amino acid-nitrogen; AS-N, hydrolyzable amino sugar-nitrogen; hNH4–N, hydrolyzable NH4–N; hUN-N, hydrolyzable unidentifi ed-nitrogen; NT, no-till management; POM, particulate organic matter; THN, total hydrolyzable nitrogen.
www.soils.org/publications/sssaj 1625
are as widely adopted as NT management. A recent report by Horowitz et al. (2010) estimates that about 35% of row-crop hectares in the United States were planted using NT in 2009 and that the median rate of adoption from 2000 to 2007 was roughly 1.5% yr–1, a trend that shows no sign of declining. No-till management is generally recognized as an eff ective strat-egy to sequester C (Franzluebbers, 2005; Uri, 2001; West and Post, 2002) and has also been shown to conserve soil organic N (Franzluebbers, 2004; House et al., 1984; Spargo et al., 2008a). However, the change in labile C and N through time in NT has not been well characterized.
A few reported studies have quantifi ed the impact of NT on mineralizable N. Franzluebbers et al. (1994a) found that poten-tially mineralizable N was 45% greater in the surface 20 cm of soil aft er 9 yr of NT compared to disk tillage in Texas. Wienhold and Halvorson (1999) observed that N mineralization in the sur-face 5 cm of soil managed with NT for 10 yr was 112 and 143% greater than in soils cultivated using minimal (sweep plow) or conventional tillage (chisel plow and a double disk), respectively, in a spring wheat (Triticum aestivum L.)–winter wheat–sun-fl ower (Helianthus annuus L.) crop rotation in North Dakota. Needlelman et al. (1999) evaluated the impact of tillage manage-ment on labile organic N aft er at least 5 yr in 36 fi elds in Illinois. Th ey found that tillage had no signifi cant eff ect on potentially mineralizable N when calculated for the 0- to 30-cm depth, However, fi elds managed using NT had 54% more potentially mineralizable N in the surface 0 to 5 cm compared to conven-tional tillage, illustrating the impact of NT on the stratifi cation of labile organic N.
Stratifi cation of soil organic matter with NT is similar to natural systems because crop residues are deposited and accu-mulate at the soil surface, rather than being incorporated with tillage. Diff erences in environmental conditions with depth are likely to impact both the rate of decomposition and the qual-ity of soil organic matter, with frequent wetting–drying cycles at the soil surface infl uencing microbial dynamics diff erently than at depth (Fierer and Schimel, 2002; Franzluebbers et al., 1994b; Kruse et al., 2004). Further characterization and quantifi cation of changes in labile organic C and N fractions by depth through time under continuous NT will improve our understanding of N dynamics in these cropping systems, allowing for improved fertilizer-N management recommendations and increased N use effi ciency.
Labile soil C and N fractions associated with potentially mineralizable N and soil microbial biomass are likely to be more sensitive to management changes than more recalcitrant frac-tions or total C and N. Various analytical methods have been used to characterize labile soil organic C and N. Particulate or-ganic matter, operationally defi ned as organic matter >53 μm in size (Sollins et al., 1999), consists of partially decomposed plant litter, is a site of increased microbial activity, and is viewed as a labile fraction of organic matter (Haynes, 2005). Particulate or-ganic matter is especially sensitive to management (Cambardella and Elliott, 1992; Marriott and Wander, 2006; Nissen and Wander, 2003; Sequeira and Alley, 2011) and is well correlated
with mineralizable N across a diverse range of management sce-narios (Spargo et al., 2011; Willson et al., 2001). Acid hydroly-sis has also been routinely employed to extract and characterize labile soil N fractions (Amelung et al., 2001; Greenfi eld, 2001; Xu et al., 2003). Improved hydrolyzable N fractionation meth-ods developed by Mulvaney and Khan (2001) allow for more ac-curate quantifi cation of α-amino acid and amino sugar N, both of which have been identifi ed as labile soil N fractions (Keeney and Bremner, 1966; Mengel, 1996; Mulvaney et al., 2001). Th ese improved methods may allow us to quantify changes in labile frac-tions of organic N that previously went undetected. However, the impact of NT management on these fractions is largely unknown.
Pyrolysis-gas chromatography/mass spectrometry has also proven useful for characterizing changes in soil organic C and N fractions (Leinweber and Schulten, 1999; Schulten and Schnitzer, 1997) in response to management (Bol et al., 2009; Bracewell and Robertson, 1987). Pyrolysis-gas chromatography/mass spectrometry can be used to characterize the biochemical composition of soil C and N compounds, which can be used to evaluate structural diversity of soil organic matter (Grandy and Neff , 2008). Bol et al. (2009) and Grandy and Neff (2008) each used Py-GC/MS to show that microbially-mediated decomposi-tion of plant-derived soil organic matter resulted in predictable transformation of soil organic matter over time from more com-plex long chain polymeric compounds (lignin and cellulose) to simpler carbohydrates indicative of soil microbial biomass. Using a combination of Py-GC and isotope ratio mass spectroscopy Steinbeiss et al. (2008) showed that increasing plant biodiversity in experimental grasslands can increase stability of soil organic carbon. Pyrolysis-gas chromatography/mass spectrometry may be a useful tool for quantifying changes in the biochemical com-position of soil organic C and N in response to NT.
Th e most common crop rotation in the middle coastal plain of Virginia is corn (Zea mays L.)–wheat (Triticum aestivum L.) or barley (Hordeum vulgare L.)–double-crop soybean [Glycine max (L.) Merr.]. Corn and soybean have been planted using NT on most farms since at least the early to mid-1980s; however, some shallow tillage (10–15 cm) is used before planting small grains (i.e., wheat or barley) on many farms. Th e growing trend, however, is for cropland to be managed using continuous NT. Th is research builds on our previous work where we quantifi ed the rate of soil C sequestration and total organic N conservation with continuous NT management of these intensively cropped soils (Spargo et al., 2008a, 2008b). While it is clear that NT tends to sequester C and conserve N in this environment, little is known about its eff ect on labile soil organic matter. Here, we consider change in the nature, or quality, of soil organic matter with NT. Th e objective of this research was to determine how labile fractions of organic C and N at various soil depths are infl uenced by the duration of continuous NT on farms in the middle coastal plain of Virginia. We used physical, chemical, and thermal soil fractionation techniques to quantify the change in labile C and N in soils with time under NT management.
1626 Soil Science Society of America Journal
MATERIALS AND METHODSExperimental Design
Th e Coastal Plain consists of deep, coarse-textured soils formed in fl uvial sediments occupying gently sloping, broad in-terstream areas. Th e seven sites used in this study were selected from a larger set of Coastal Plain soil samples used in our previ-ous work (Spargo et al., 2008a; Spargo et al., 2008b). Sites with similar cropping history and nutrient management that had been in NT management from 0 to 11 yr were chosen to represent a range of time in continuous NT (Table 1). All sites had a 2-yr crop rotation of corn–wheat or barley–double crop soybean. None of the sampling sites had ever received biosolids and none have a known history of manure use. Th e soil at all locations is Kempsville sandy loam.
Sampling and AnalysisSoil samples were collected in 2005 or 2006 shortly follow-
ing corn harvest except for Site 41 (duration of NT, dNT = 0 yr), which was tilled following corn harvest in preparation for small grain planting. Th is site was not sampled until 3 mo following tillage to allow for soil conditions to stabilize. Five intact soil cores were collected from each site to a depth of 15 cm at evenly spaced intervals along a 100-m transect using 5 cm diam. soil cores. Th e shallow sampling depth was chosen since the predom-inant form of tillage in the region is shallow double-disking that typically does not incorporate residues deeper than 10 cm. Intact soil cores were sealed in plastic wrap and stored on ice immedi-ately following collection. On returning to the lab the cores were separated into 0- to 2.5-, 2.5- to 7.5-, and 7.5- to 15-cm depth increments, and the soil was rapidly air-dried. Bulk density was determined on each core at each depth increment by obtaining an air-dry weight for each core and oven drying (105°C) a sub-sample to determine moisture content. Following bulk density measurements, air-dried soil samples were ground and sieved (2 mm). Soil from the fi ve cores for each site was composited by depth increment before analysis.
Total soil organic C and N concentrations were deter-mined in duplicate by dry combustion analysis using a VarioMax CNS macro elemental analyzer1 (Elementar, Mt. Laurel, NJ). Particulate organic matter was isolated from duplicate samples by dispersing duplicate 10-g subsamples of air-dry soil with 0.5% (w/v) (NaPO3)6 for 16 h on a reciprocating shaker and rinsing with deionized water through a 53 μm sieve (Sollins et al., 1999). Material remaining on the sieve was oven dried (60°C), weighed, and ground to a fi ne powder using a mortar and pestle. Th e con-centrations of C and N were determined as described above and expressed on a whole soil basis (i.e., mg POM-C and -N kg–1 soil).
Hydrolyzable soil N fractionation was conducted in duplicate using a hydrolysis/diff usion method developed by Mulvaney and Khan (2001). Duplicate 5-g samples were hydrolyzed with 20 mL of 6 M HCl plus two drops octyl alcohol heated to 110±2°C under
refl ux for 12 h. Aft er cooling, the hydrolysate was fi ltered through a Whatman no. 50 fi lter, neutralized (pH 6.5–6.8) with NaOH, and diluted to 100 mL. Total hydrolyzable nitrogen (THN) was determined by Kjeldahl digestion of duplicate 5-mL aliquots of the hydrolysate followed by diff usion of the digest with 10 mL of 10 M NaOH. Hydrolyzable NH4–N (hNH4–N) was quantifi ed by treating 5 mL of hydrolysate with 0.05 g of MgO and diff usion for 28 h in an incubator at 20±2°C. Hydrolyzable [NH4 + amino sugar]-N was determined by treating 10 mL of hydrolysate with 2 mL 10 M NaOH and diff usion for 5 h at 50±2°C. Th e AS-N fraction was determined as the diff erence between [NH4 + amino sugar]-N and hNH4–N. Amino acid-N was determined following diff usion of [NH4 + amino sugar]-N by adding 2.5 mL of 5 M H2SO4 and 1 mL of ninhydrine solution, heated to 20±2°C for 1.5 h, followed by treatment with 1 mL of 10 M NaOH and diff usion for 2 h at 50±2°C. Th e hUN-N was calculated as the diff erence between THN and the sum of [NH4 + amino sugar]-N and AA-N. All diff usions were performed in 473 mL Ball jars (Ball Corp., Broomfi eld, CO) fi tted with lids modifi ed to secure 60 mm diam. Pyrex Petri dishes (Corning Glass Works, Corning, NY) contain-ing 5.0 mL of 4% w/v H3BO3 as described by Khan et al. (1997). Following diff usion, the H3BO3 solution was diluted with 5.0 mL of deionized water and titrated with standardized 0.01 M H2SO4. Titrations were conducted using a Radiometer TIM 900 Titration Manager and ABU901 autoburette (Radiometer Analytical S.A., Lyon, France).
Pyrolysis-gas chromatography/mass spectrometry was con-ducted on ground whole soil samples using a Pyroprobe 5200 py-rolyzer (Chemical Data System Analytical, Oxford, PA) coupled, in-line, to a PerkinElmer Clarus 500 GC/MS (PerkinElmer, Waltham, MA). Duplicate aliquots of 25 mg of soil were loaded into quartz combustion cuvettes and pyrolyzed at 600°C for 20 s. Th e pyrolysate was analyzed on the GC–MS. Th e GC inlet was set to 320°C with a split ratio of 50:1. A DB-35MS column, 20 m × 0.18 mm × 180 microns, was used with 1 mL min–1 of helium carrier gas. Th e oven temperature was programmed at
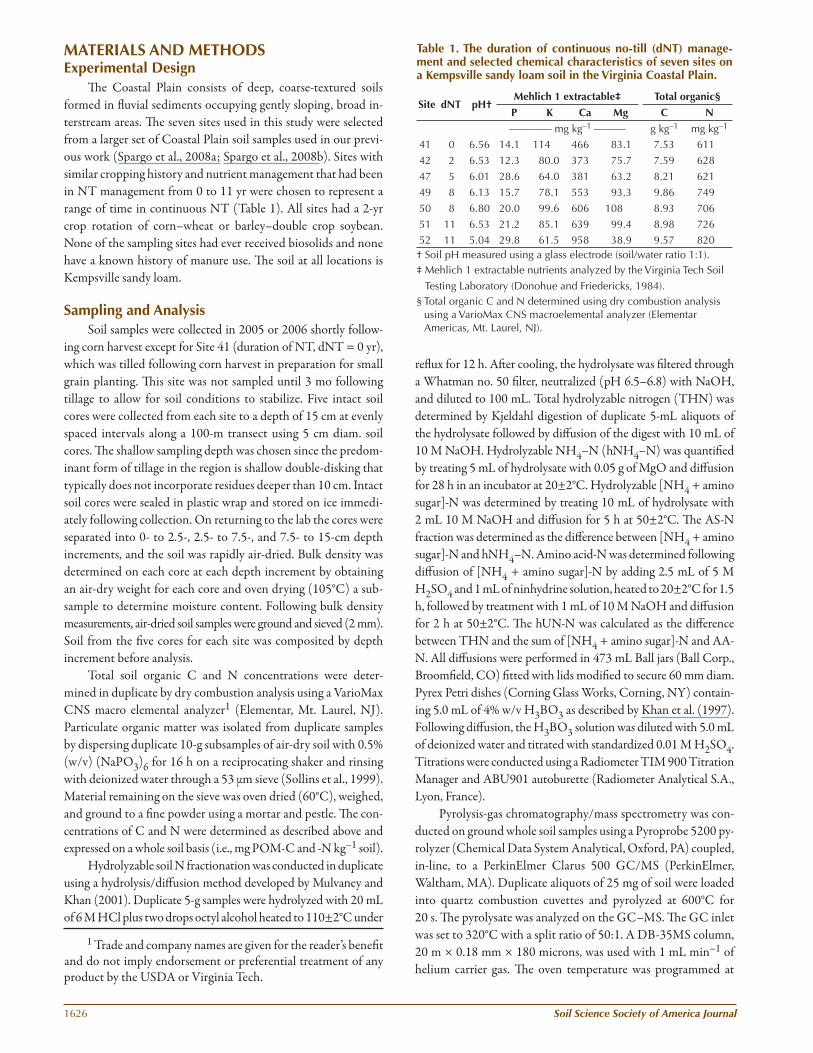
Table 1. The duration of continuous no-till (dNT) manage-ment and selected chemical characteristics of seven sites on a Kempsville sandy loam soil in the Virginia Coastal Plain.
Site dNT pH†Mehlich 1 extractable‡ Total organic§
P K Ca Mg C N
———— mg kg–1 ——— g kg–1 mg kg–1
41 0 6.56 14.1 114 466 83.1 7.53 611
42 2 6.53 12.3 80.0 373 75.7 7.59 628
47 5 6.01 28.6 64.0 381 63.2 8.21 621
49 8 6.13 15.7 78.1 553 93.3 9.86 749
50 8 6.80 20.0 99.6 606 108 8.93 706
51 11 6.53 21.2 85.1 639 99.4 8.98 72652 11 5.04 29.8 61.5 958 38.9 9.57 820† Soil pH measured using a glass electrode (soil/water ratio 1:1).‡ Mehlich 1 extractable nutrients analyzed by the Virginia Tech Soil
Testing Laboratory (Donohue and Friedericks, 1984).§ Total organic C and N determined using dry combustion analysis
using a VarioMax CNS macroelemental analyzer (Elementar Americas, Mt. Laurel, NJ).
1 Trade and company names are given for the reader’s benefi t and do not imply endorsement or preferential treatment of any product by the USDA or Virginia Tech.
www.soils.org/publications/sssaj 1627
50°C for 1 min followed by a 15 deg min–1 ramp to 325°C and held for 5 min. Th e mass range of 35 to 500 amu was scanned. Th e spectral scans were background subtracted, deconvoluted, and compounds identifi ed using AMDIS soft ware (NIST, Gaithersburg, MD) and a customized database created by CDS (Chemical Data System Analytical, Oxford, PA) designed to characterize plant material derivatives. Compounds not iden-tifi ed with the CDS database were then identifi ed using the NIST/EPA/NIH Mass Spectral Library (NIST, Gaithersburg, MD). Only compounds with mass spectral peak area within a 20% margin of variance among analytical replicates were used for data analysis. Compounds were grouped into broad biochemical classes: aldehydes and ketones, aliphatic, aromatic, carbohydrate, lignin derivatives, and N-containing compounds (Bracewell and Robertson, 1987).
Data AnalysisSoil N and C fractions, including those
identifi ed using Py-GC/MS, were quantifi ed for each location by sampling depth (0–2.5 cm, 2.5–7.5 cm, and 7.5–15 cm) and over the entire 0- to 15-cm sampling depth using depth-weighted values. Linear and nonlinear methods were used to determine the rate of change in soil C and N fractions with duration of continuous NT (years) using PROC REG (linear and quadratic) and PROC NLIN (Mitscherlich–Bray) of SAS (SAS Institute, 2002). All models were visually evaluated by plotting each one against the response vari-ables to determine quality of fi t. Th e model with the lowest residual mean square was deemed the most appropriate.
RESULTS AND DISCUSSIONMost studies that have quantifi ed the im-
pact of tillage management on soil organic C and N pools compare tillage systems using ob-servations made at a single point in time and are therefore unable to accurately determine the rate of change of these pools. A unique aspect of this study is that we were able to quantify the rate of change of organic C and N fractions at three depth increments with duration of NT.
Total Soil Organic Carbon and Nitrogen
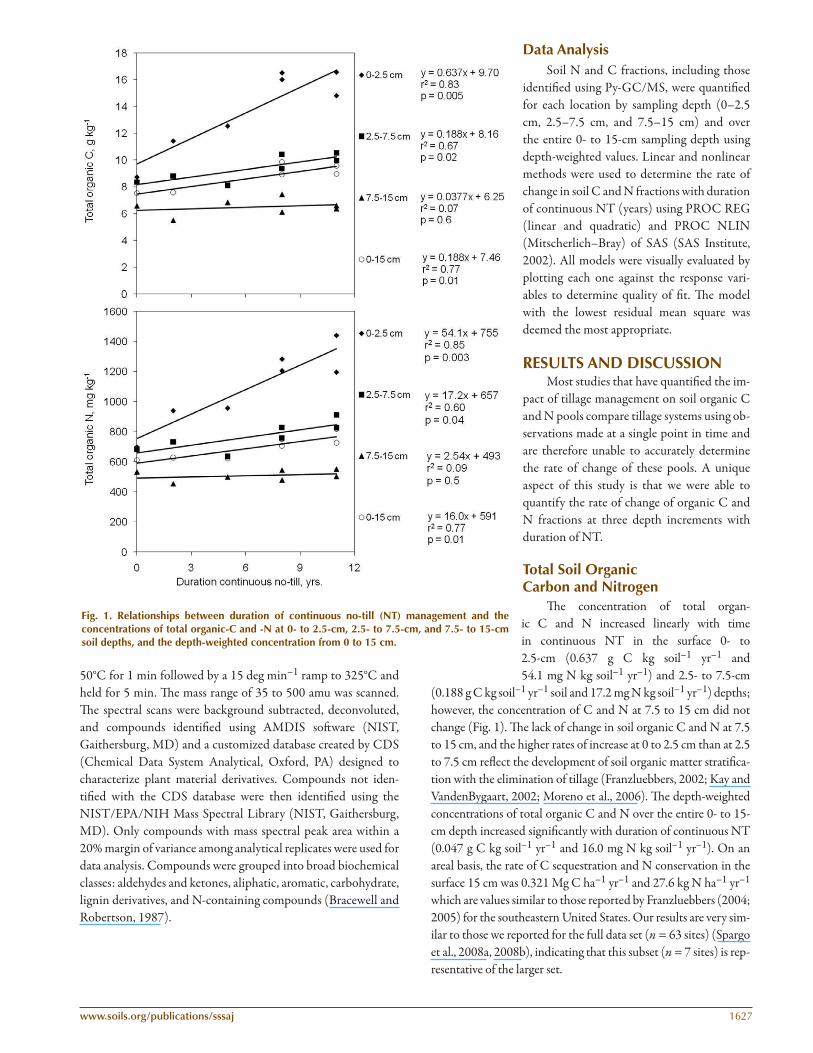
Th e concentration of total organ-ic C and N increased linearly with time in continuous NT in the surface 0- to 2.5-cm (0.637 g C kg soil–1 yr–1 and 54.1 mg N kg soil–1 yr–1) and 2.5- to 7.5-cm
(0.188 g C kg soil–1 yr–1 soil and 17.2 mg N kg soil–1 yr–1) depths; however, the concentration of C and N at 7.5 to 15 cm did not change (Fig. 1). Th e lack of change in soil organic C and N at 7.5 to 15 cm, and the higher rates of increase at 0 to 2.5 cm than at 2.5 to 7.5 cm refl ect the development of soil organic matter stratifi ca-tion with the elimination of tillage (Franzluebbers, 2002; Kay and VandenBygaart, 2002; Moreno et al., 2006). Th e depth-weighted concentrations of total organic C and N over the entire 0- to 15-cm depth increased signifi cantly with duration of continuous NT (0.047 g C kg soil–1 yr–1 and 16.0 mg N kg soil–1 yr–1). On an areal basis, the rate of C sequestration and N conservation in the surface 15 cm was 0.321 Mg C ha–1 yr–1 and 27.6 kg N ha–1 yr–1 which are values similar to those reported by Franzluebbers (2004; 2005) for the southeastern United States. Our results are very sim-ilar to those we reported for the full data set (n = 63 sites) (Spargo et al., 2008a, 2008b), indicating that this subset (n = 7 sites) is rep-resentative of the larger set.
Fig. 1. Relationships between duration of continuous no-till (NT) management and the concentrations of total organic-C and -N at 0- to 2.5-cm, 2.5- to 7.5-cm, and 7.5- to 15-cm soil depths, and the depth-weighted concentration from 0 to 15 cm.
1628 Soil Science Society of America Journal
Particulate Organic Matter Carbon and Nitrogen
Particulate organic matter is consid-ered to be an important source of energy for soil microorganisms and has been linked to short-term changes in soil C and N cycling (Cambardella and Elliott, 1992; Franzluebbers and Arshad, 1997; Hassink, 1995; Sequeira and Alley, 2011). Particulate organic matter contains much of the partially decomposed organic matter that fuels N mineralization. Spargo et al. (2011) found a strong correlation (r = 0.82, p < 0.0001) between POM-N and N mineralization potential across fi ve diverse cropping systems in Maryland. Willson et al. (2001) also found a signifi cant relationship between POM-N and potentially mineraliz-able N (r = 0.59, p < 0.001) across four diverse management systems in Michigan and suggested POM-N could be used to estimate N mineraliza-tion if combined with other climate and manage-ment information.
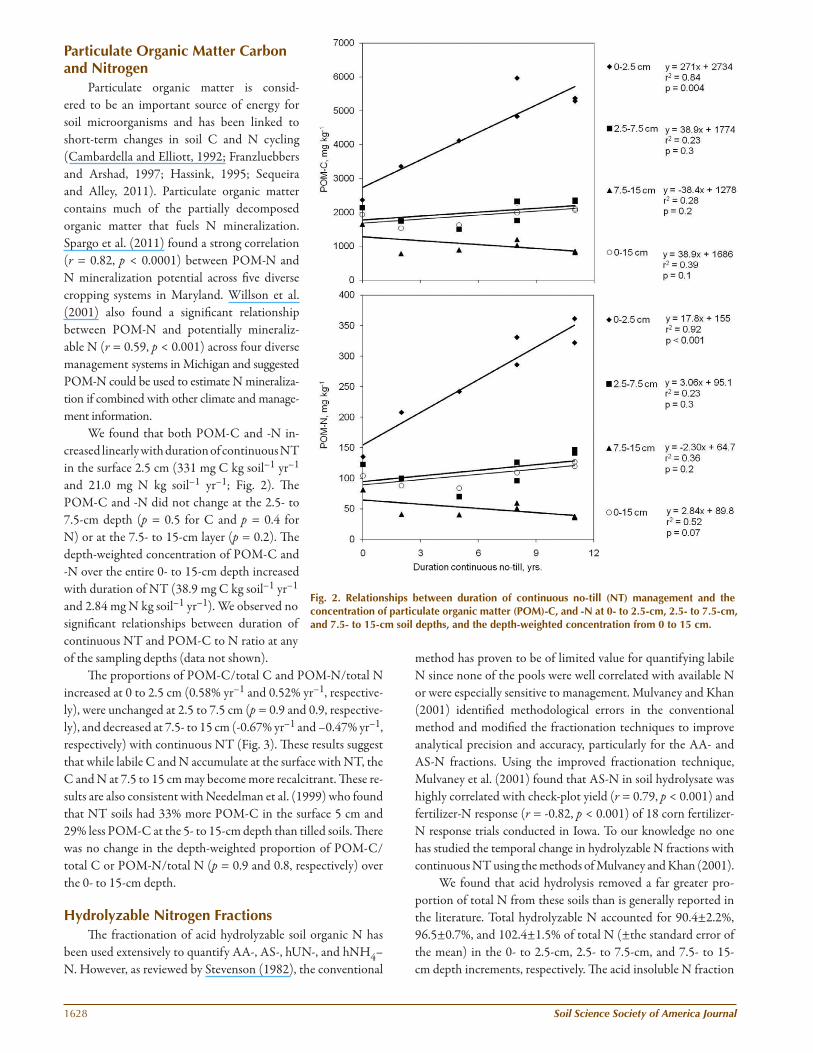
We found that both POM-C and -N in-creased linearly with duration of continuous NT in the surface 2.5 cm (331 mg C kg soil–1 yr–1 and 21.0 mg N kg soil–1 yr–1; Fig. 2). Th e POM-C and -N did not change at the 2.5- to 7.5-cm depth (p = 0.5 for C and p = 0.4 for N) or at the 7.5- to 15-cm layer (p = 0.2). Th e depth-weighted concentration of POM-C and -N over the entire 0- to 15-cm depth increased with duration of NT (38.9 mg C kg soil–1 yr–1 and 2.84 mg N kg soil–1 yr–1). We observed no signifi cant relationships between duration of continuous NT and POM-C to N ratio at any of the sampling depths (data not shown).
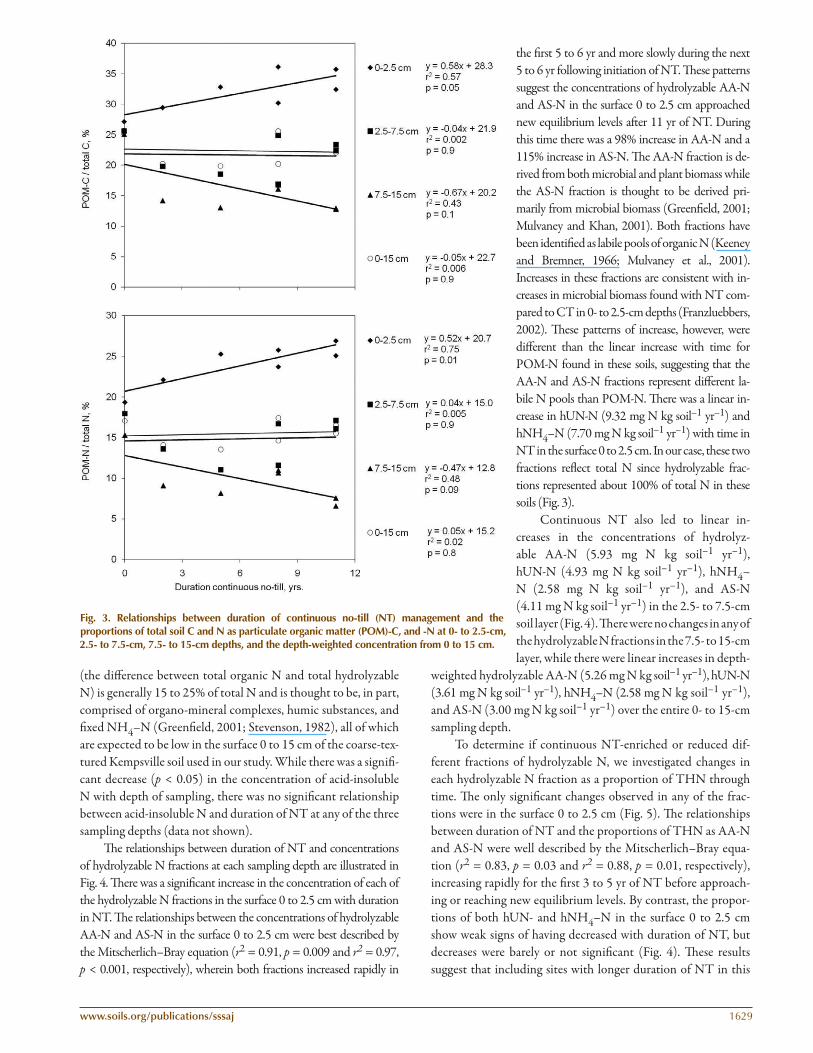
Th e proportions of POM-C/total C and POM-N/total N increased at 0 to 2.5 cm (0.58% yr–1 and 0.52% yr–1, respective-ly), were unchanged at 2.5 to 7.5 cm (p = 0.9 and 0.9, respective-ly), and decreased at 7.5- to 15 cm (-0.67% yr–1 and –0.47% yr–1, respectively) with continuous NT (Fig. 3). Th ese results suggest that while labile C and N accumulate at the surface with NT, the C and N at 7.5 to 15 cm may become more recalcitrant. Th ese re-sults are also consistent with Needelman et al. (1999) who found that NT soils had 33% more POM-C in the surface 5 cm and 29% less POM-C at the 5- to 15-cm depth than tilled soils. Th ere was no change in the depth-weighted proportion of POM-C/total C or POM-N/total N (p = 0.9 and 0.8, respectively) over the 0- to 15-cm depth.
Hydrolyzable Nitrogen FractionsTh e fractionation of acid hydrolyzable soil organic N has
been used extensively to quantify AA-, AS-, hUN-, and hNH4–N. However, as reviewed by Stevenson (1982), the conventional
method has proven to be of limited value for quantifying labile N since none of the pools were well correlated with available N or were especially sensitive to management. Mulvaney and Khan (2001) identifi ed methodological errors in the conventional method and modifi ed the fractionation techniques to improve analytical precision and accuracy, particularly for the AA- and AS-N fractions. Using the improved fractionation technique, Mulvaney et al. (2001) found that AS-N in soil hydrolysate was highly correlated with check-plot yield (r = 0.79, p < 0.001) and fertilizer-N response (r = -0.82, p < 0.001) of 18 corn fertilizer-N response trials conducted in Iowa. To our knowledge no one has studied the temporal change in hydrolyzable N fractions with continuous NT using the methods of Mulvaney and Khan (2001).
We found that acid hydrolysis removed a far greater pro-portion of total N from these soils than is generally reported in the literature. Total hydrolyzable N accounted for 90.4±2.2%, 96.5±0.7%, and 102.4±1.5% of total N (±the standard error of the mean) in the 0- to 2.5-cm, 2.5- to 7.5-cm, and 7.5- to 15-cm depth increments, respectively. Th e acid insoluble N fraction
Fig. 2. Relationships between duration of continuous no-till (NT) management and the concentration of particulate organic matter (POM)-C, and -N at 0- to 2.5-cm, 2.5- to 7.5-cm, and 7.5- to 15-cm soil depths, and the depth-weighted concentration from 0 to 15 cm.
www.soils.org/publications/sssaj 1629
(the diff erence between total organic N and total hydrolyzable N) is generally 15 to 25% of total N and is thought to be, in part, comprised of organo-mineral complexes, humic substances, and fi xed NH4–N (Greenfi eld, 2001; Stevenson, 1982), all of which are expected to be low in the surface 0 to 15 cm of the coarse-tex-tured Kempsville soil used in our study. While there was a signifi -cant decrease (p < 0.05) in the concentration of acid-insoluble N with depth of sampling, there was no signifi cant relationship between acid-insoluble N and duration of NT at any of the three sampling depths (data not shown).
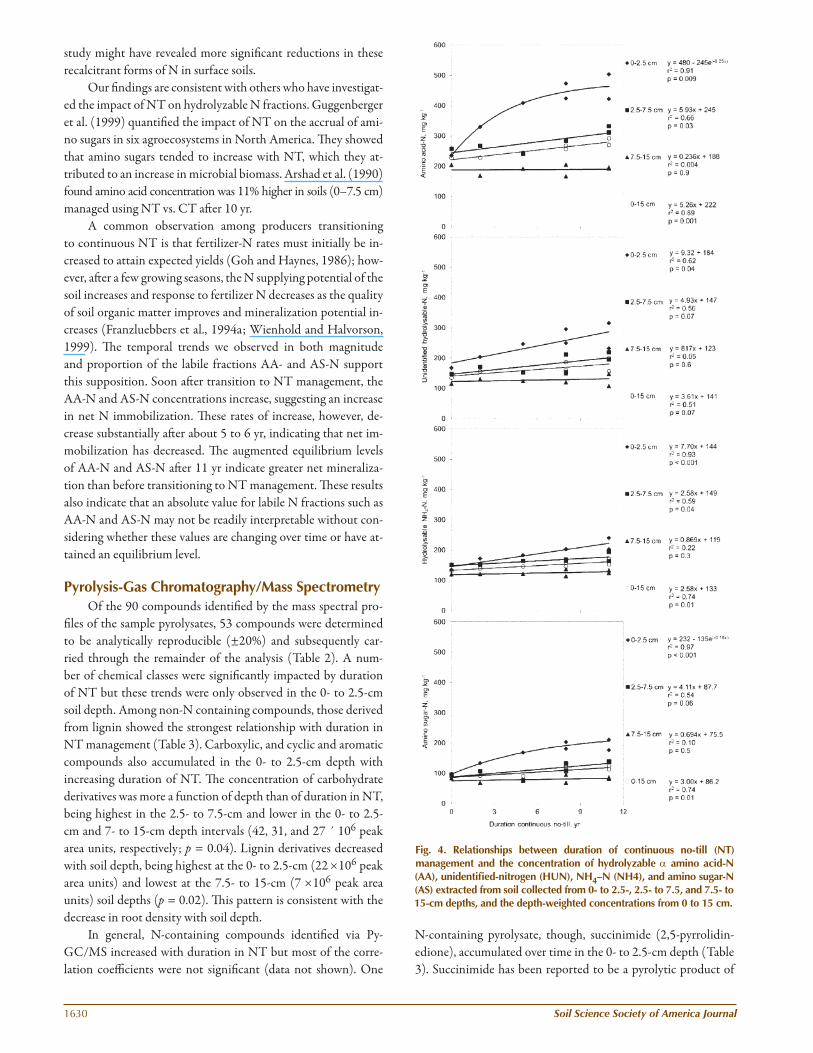
Th e relationships between duration of NT and concentrations of hydrolyzable N fractions at each sampling depth are illustrated in Fig. 4. Th ere was a signifi cant increase in the concentration of each of the hydrolyzable N fractions in the surface 0 to 2.5 cm with duration in NT. Th e relationships between the concentrations of hydrolyzable AA-N and AS-N in the surface 0 to 2.5 cm were best described by the Mitscherlich–Bray equation (r2 = 0.91, p = 0.009 and r2 = 0.97, p < 0.001, respectively), wherein both fractions increased rapidly in
the fi rst 5 to 6 yr and more slowly during the next 5 to 6 yr following initiation of NT. Th ese patterns suggest the concentrations of hydrolyzable AA-N and AS-N in the surface 0 to 2.5 cm approached new equilibrium levels aft er 11 yr of NT. During this time there was a 98% increase in AA-N and a 115% increase in AS-N. Th e AA-N fraction is de-rived from both microbial and plant biomass while the AS-N fraction is thought to be derived pri-marily from microbial biomass (Greenfi eld, 2001; Mulvaney and Khan, 2001). Both fractions have been identifi ed as labile pools of organic N (Keeney and Bremner, 1966; Mulvaney et al., 2001). Increases in these fractions are consistent with in-creases in microbial biomass found with NT com-pared to CT in 0- to 2.5-cm depths (Franzluebbers, 2002). Th ese patterns of increase, however, were diff erent than the linear increase with time for POM-N found in these soils, suggesting that the AA-N and AS-N fractions represent diff erent la-bile N pools than POM-N. Th ere was a linear in-crease in hUN-N (9.32 mg N kg soil–1 yr–1) and hNH4–N (7.70 mg N kg soil–1 yr–1) with time in NT in the surface 0 to 2.5 cm. In our case, these two fractions refl ect total N since hydrolyzable frac-tions represented about 100% of total N in these soils (Fig. 3).
Continuous NT also led to linear in-creases in the concentrations of hydrolyz-able AA-N (5.93 mg N kg soil–1 yr–1), hUN-N (4.93 mg N kg soil–1 yr–1), hNH4–N (2.58 mg N kg soil–1 yr–1), and AS-N (4.11 mg N kg soil–1 yr–1) in the 2.5- to 7.5-cm soil layer (Fig. 4). Th ere were no changes in any of the hydrolyzable N fractions in the 7.5- to 15-cm layer, while there were linear increases in depth-
weighted hydrolyzable AA-N (5.26 mg N kg soil–1 yr–1), hUN-N (3.61 mg N kg soil–1 yr–1), hNH4–N (2.58 mg N kg soil–1 yr–1), and AS-N (3.00 mg N kg soil–1 yr–1) over the entire 0- to 15-cm sampling depth.
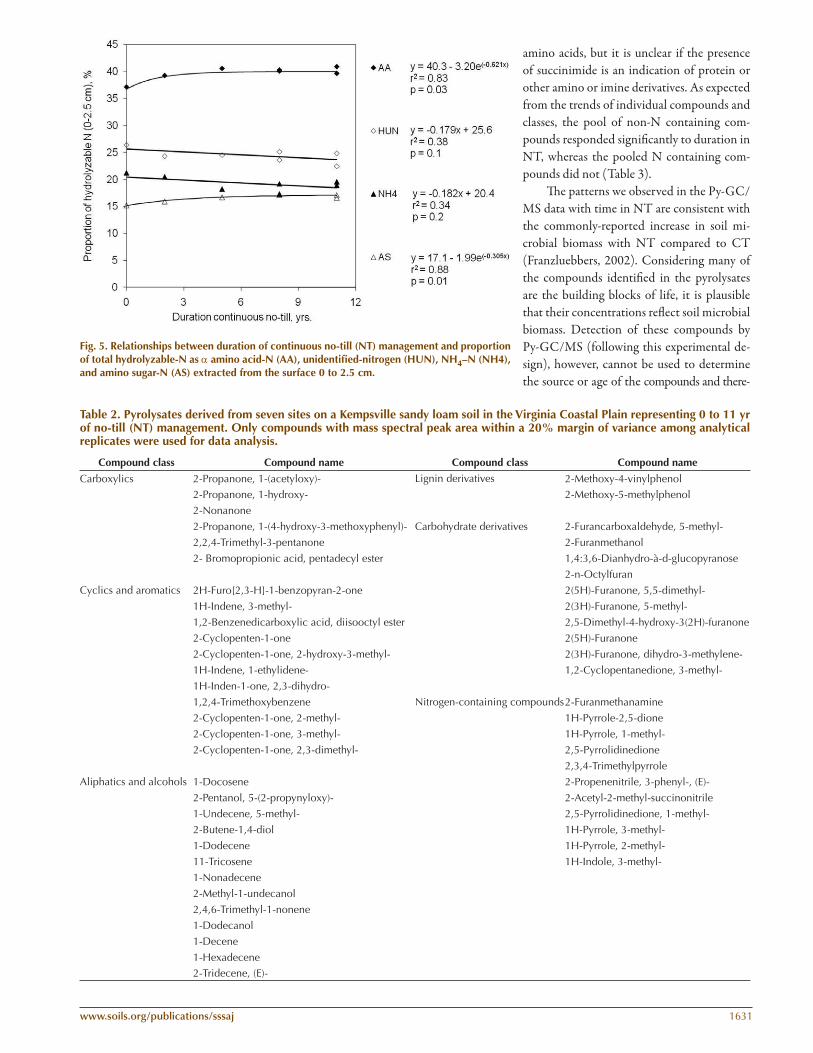
To determine if continuous NT-enriched or reduced dif-ferent fractions of hydrolyzable N, we investigated changes in each hydrolyzable N fraction as a proportion of THN through time. Th e only signifi cant changes observed in any of the frac-tions were in the surface 0 to 2.5 cm (Fig. 5). Th e relationships between duration of NT and the proportions of THN as AA-N and AS-N were well described by the Mitscherlich–Bray equa-tion (r2 = 0.83, p = 0.03 and r2 = 0.88, p = 0.01, respectively), increasing rapidly for the fi rst 3 to 5 yr of NT before approach-ing or reaching new equilibrium levels. By contrast, the propor-tions of both hUN- and hNH4–N in the surface 0 to 2.5 cm show weak signs of having decreased with duration of NT, but decreases were barely or not signifi cant (Fig. 4). Th ese results suggest that including sites with longer duration of NT in this
Fig. 3. Relationships between duration of continuous no-till (NT) management and the proportions of total soil C and N as particulate organic matter (POM)-C, and -N at 0- to 2.5-cm, 2.5- to 7.5-cm, 7.5- to 15-cm depths, and the depth-weighted concentration from 0 to 15 cm.
1630 Soil Science Society of America Journal
study might have revealed more signifi cant reductions in these recalcitrant forms of N in surface soils.
Our fi ndings are consistent with others who have investigat-ed the impact of NT on hydrolyzable N fractions. Guggenberger et al. (1999) quantifi ed the impact of NT on the accrual of ami-no sugars in six agroecosystems in North America. Th ey showed that amino sugars tended to increase with NT, which they at-tributed to an increase in microbial biomass. Arshad et al. (1990) found amino acid concentration was 11% higher in soils (0–7.5 cm) managed using NT vs. CT aft er 10 yr.
A common observation among producers transitioning to continuous NT is that fertilizer-N rates must initially be in-creased to attain expected yields (Goh and Haynes, 1986); how-ever, aft er a few growing seasons, the N supplying potential of the soil increases and response to fertilizer N decreases as the quality of soil organic matter improves and mineralization potential in-creases (Franzluebbers et al., 1994a; Wienhold and Halvorson, 1999). Th e temporal trends we observed in both magnitude and proportion of the labile fractions AA- and AS-N support this supposition. Soon aft er transition to NT management, the AA-N and AS-N concentrations increase, suggesting an increase in net N immobilization. Th ese rates of increase, however, de-crease substantially aft er about 5 to 6 yr, indicating that net im-mobilization has decreased. Th e augmented equilibrium levels of AA-N and AS-N aft er 11 yr indicate greater net mineraliza-tion than before transitioning to NT management. Th ese results also indicate that an absolute value for labile N fractions such as AA-N and AS-N may not be readily interpretable without con-sidering whether these values are changing over time or have at-tained an equilibrium level.
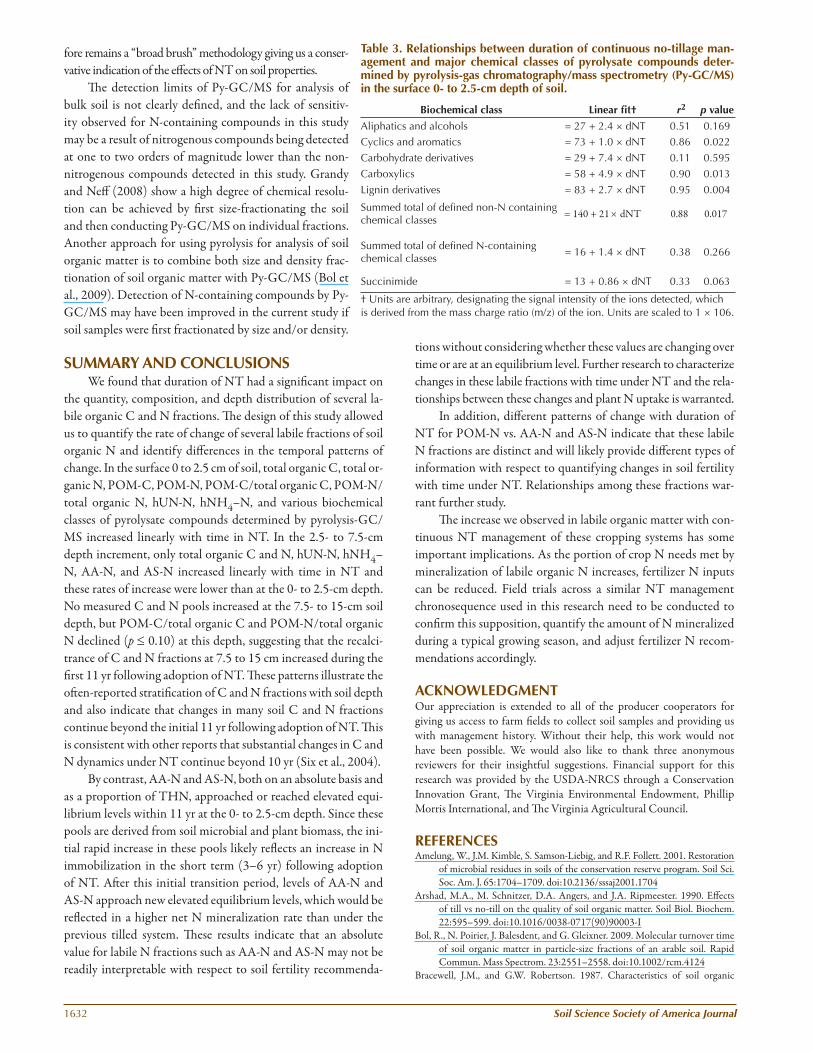
Pyrolysis-Gas Chromatography/Mass SpectrometryOf the 90 compounds identifi ed by the mass spectral pro-
fi les of the sample pyrolysates, 53 compounds were determined to be analytically reproducible (±20%) and subsequently car-ried through the remainder of the analysis (Table 2). A num-ber of chemical classes were signifi cantly impacted by duration of NT but these trends were only observed in the 0- to 2.5-cm soil depth. Among non-N containing compounds, those derived from lignin showed the strongest relationship with duration in NT management (Table 3). Carboxylic, and cyclic and aromatic compounds also accumulated in the 0- to 2.5-cm depth with increasing duration of NT. Th e concentration of carbohydrate derivatives was more a function of depth than of duration in NT, being highest in the 2.5- to 7.5-cm and lower in the 0- to 2.5-cm and 7- to 15-cm depth intervals (42, 31, and 27 ´ 106 peak area units, respectively; p = 0.04). Lignin derivatives decreased with soil depth, being highest at the 0- to 2.5-cm (22 ×106 peak area units) and lowest at the 7.5- to 15-cm (7 ×10⁶ peak area units) soil depths (p = 0.02). Th is pattern is consistent with the decrease in root density with soil depth.
In general, N-containing compounds identifi ed via Py-GC/MS increased with duration in NT but most of the corre-lation coeffi cients were not signifi cant (data not shown). One
N-containing pyrolysate, though, succinimide (2,5-pyrrolidin-edione), accumulated over time in the 0- to 2.5-cm depth (Table 3). Succinimide has been reported to be a pyrolytic product of
Fig. 4. Relationships between duration of continuous no-till (NT) management and the concentration of hydrolyzable α amino acid-N (AA), unidentifi ed-nitrogen (HUN), NH4–N (NH4), and amino sugar-N (AS) extracted from soil collected from 0- to 2.5-, 2.5- to 7.5, and 7.5- to 15-cm depths, and the depth-weighted concentrations from 0 to 15 cm.
www.soils.org/publications/sssaj 1631
amino acids, but it is unclear if the presence of succinimide is an indication of protein or other amino or imine derivatives. As expected from the trends of individual compounds and classes, the pool of non-N containing com-pounds responded signifi cantly to duration in NT, whereas the pooled N containing com-pounds did not (Table 3).
Th e patterns we observed in the Py-GC/MS data with time in NT are consistent with the commonly-reported increase in soil mi-crobial biomass with NT compared to CT (Franzluebbers, 2002). Considering many of the compounds identifi ed in the pyrolysates are the building blocks of life, it is plausible that their concentrations refl ect soil microbial biomass. Detection of these compounds by Py-GC/MS (following this experimental de-sign), however, cannot be used to determine the source or age of the compounds and there-
Fig. 5. Relationships between duration of continuous no-till (NT) management and proportion of total hydrolyzable-N as α amino acid-N (AA), unidentifi ed-nitrogen (HUN), NH4–N (NH4), and amino sugar-N (AS) extracted from the surface 0 to 2.5 cm.
Table 2. Pyrolysates derived from seven sites on a Kempsville sandy loam soil in the Virginia Coastal Plain representing 0 to 11 yr of no-till (NT) management. Only compounds with mass spectral peak area within a 20% margin of variance among analytical replicates were used for data analysis.
Compound class Compound name Compound class Compound name
Carboxylics 2-Propanone, 1-(acetyloxy)- Lignin derivatives 2-Methoxy-4-vinylphenol2-Propanone, 1-hydroxy- 2-Methoxy-5-methylphenol
2-Nonanone
2-Propanone, 1-(4-hydroxy-3-methoxyphenyl)- Carbohydrate derivatives 2-Furancarboxaldehyde, 5-methyl-
2,2,4-Trimethyl-3-pentanone 2-Furanmethanol
2- Bromopropionic acid, pentadecyl ester 1,4:3,6-Dianhydro-à-d-glucopyranose
2-n-Octylfuran
Cyclics and aromatics 2H-Furo[2,3-H]-1-benzopyran-2-one 2(5H)-Furanone, 5,5-dimethyl-
1H-Indene, 3-methyl- 2(3H)-Furanone, 5-methyl-
1,2-Benzenedicarboxylic acid, diisooctyl ester 2,5-Dimethyl-4-hydroxy-3(2H)-furanone
2-Cyclopenten-1-one 2(5H)-Furanone
2-Cyclopenten-1-one, 2-hydroxy-3-methyl- 2(3H)-Furanone, dihydro-3-methylene-
1H-Indene, 1-ethylidene- 1,2-Cyclopentanedione, 3-methyl-
1H-Inden-1-one, 2,3-dihydro-
1,2,4-Trimethoxybenzene Nitrogen-containing compounds2-Furanmethanamine
2-Cyclopenten-1-one, 2-methyl- 1H-Pyrrole-2,5-dione
2-Cyclopenten-1-one, 3-methyl- 1H-Pyrrole, 1-methyl-
2-Cyclopenten-1-one, 2,3-dimethyl- 2,5-Pyrrolidinedione
2,3,4-Trimethylpyrrole
Aliphatics and alcohols 1-Docosene 2-Propenenitrile, 3-phenyl-, (E)-
2-Pentanol, 5-(2-propynyloxy)- 2-Acetyl-2-methyl-succinonitrile
1-Undecene, 5-methyl- 2,5-Pyrrolidinedione, 1-methyl-
2-Butene-1,4-diol 1H-Pyrrole, 3-methyl-
1-Dodecene 1H-Pyrrole, 2-methyl-
11-Tricosene 1H-Indole, 3-methyl-
1-Nonadecene
2-Methyl-1-undecanol
2,4,6-Trimethyl-1-nonene
1-Dodecanol
1-Decene
1-Hexadecene2-Tridecene, (E)-
1632 Soil Science Society of America Journal
fore remains a “broad brush” methodology giving us a conser-vative indication of the eff ects of NT on soil properties.
Th e detection limits of Py-GC/MS for analysis of bulk soil is not clearly defi ned, and the lack of sensitiv-ity observed for N-containing compounds in this study may be a result of nitrogenous compounds being detected at one to two orders of magnitude lower than the non-nitrogenous compounds detected in this study. Grandy and Neff (2008) show a high degree of chemical resolu-tion can be achieved by fi rst size-fractionating the soil and then conducting Py-GC/MS on individual fractions. Another approach for using pyrolysis for analysis of soil organic matter is to combine both size and density frac-tionation of soil organic matter with Py-GC/MS (Bol et al., 2009). Detection of N-containing compounds by Py-GC/MS may have been improved in the current study if soil samples were fi rst fractionated by size and/or density.
SUMMARY AND CONCLUSIONSWe found that duration of NT had a signifi cant impact on
the quantity, composition, and depth distribution of several la-bile organic C and N fractions. Th e design of this study allowed us to quantify the rate of change of several labile fractions of soil organic N and identify diff erences in the temporal patterns of change. In the surface 0 to 2.5 cm of soil, total organic C, total or-ganic N, POM-C, POM-N, POM-C/total organic C, POM-N/total organic N, hUN-N, hNH4–N, and various biochemical classes of pyrolysate compounds determined by pyrolysis-GC/MS increased linearly with time in NT. In the 2.5- to 7.5-cm depth increment, only total organic C and N, hUN-N, hNH4–N, AA-N, and AS-N increased linearly with time in NT and these rates of increase were lower than at the 0- to 2.5-cm depth. No measured C and N pools increased at the 7.5- to 15-cm soil depth, but POM-C/total organic C and POM-N/total organic N declined (p ≤ 0.10) at this depth, suggesting that the recalci-trance of C and N fractions at 7.5 to 15 cm increased during the fi rst 11 yr following adoption of NT. Th ese patterns illustrate the oft en-reported stratifi cation of C and N fractions with soil depth and also indicate that changes in many soil C and N fractions continue beyond the initial 11 yr following adoption of NT. Th is is consistent with other reports that substantial changes in C and N dynamics under NT continue beyond 10 yr (Six et al., 2004).
By contrast, AA-N and AS-N, both on an absolute basis and as a proportion of THN, approached or reached elevated equi-librium levels within 11 yr at the 0- to 2.5-cm depth. Since these pools are derived from soil microbial and plant biomass, the ini-tial rapid increase in these pools likely refl ects an increase in N immobilization in the short term (3–6 yr) following adoption of NT. Aft er this initial transition period, levels of AA-N and AS-N approach new elevated equilibrium levels, which would be refl ected in a higher net N mineralization rate than under the previous tilled system. Th ese results indicate that an absolute value for labile N fractions such as AA-N and AS-N may not be readily interpretable with respect to soil fertility recommenda-
tions without considering whether these values are changing over time or are at an equilibrium level. Further research to characterize changes in these labile fractions with time under NT and the rela-tionships between these changes and plant N uptake is warranted.
In addition, diff erent patterns of change with duration of NT for POM-N vs. AA-N and AS-N indicate that these labile N fractions are distinct and will likely provide diff erent types of information with respect to quantifying changes in soil fertility with time under NT. Relationships among these fractions war-rant further study.
Th e increase we observed in labile organic matter with con-tinuous NT management of these cropping systems has some important implications. As the portion of crop N needs met by mineralization of labile organic N increases, fertilizer N inputs can be reduced. Field trials across a similar NT management chronosequence used in this research need to be conducted to confi rm this supposition, quantify the amount of N mineralized during a typical growing season, and adjust fertilizer N recom-mendations accordingly.
ACKNOWLEDGMENTOur appreciation is extended to all of the producer cooperators for giving us access to farm fi elds to collect soil samples and providing us with management history. Without their help, this work would not have been possible. We would also like to thank three anonymous reviewers for their insightful suggestions. Financial support for this research was provided by the USDA-NRCS through a Conservation Innovation Grant, Th e Virginia Environmental Endowment, Phillip Morris International, and Th e Virginia Agricultural Council.
REFERENCESAmelung, W., J.M. Kimble, S. Samson-Liebig, and R.F. Follett. 2001. Restoration
of microbial residues in soils of the conservation reserve program. Soil Sci. Soc. Am. J. 65:1704–1709. doi:10.2136/sssaj2001.1704
Arshad, M.A., M. Schnitzer, D.A. Angers, and J.A. Ripmeester. 1990. Eff ects of till vs no-till on the quality of soil organic matter. Soil Biol. Biochem. 22:595–599. doi:10.1016/0038-0717(90)90003-I
Bol, R., N. Poirier, J. Balesdent, and G. Gleixner. 2009. Molecular turnover time of soil organic matter in particle-size fractions of an arable soil. Rapid Commun. Mass Spectrom. 23:2551–2558. doi:10.1002/rcm.4124
Bracewell, J.M., and G.W. Robertson. 1987. Characteristics of soil organic
Table 3. Relationships between duration of continuous no-tillage man-agement and major chemical classes of pyrolysate compounds deter-mined by pyrolysis-gas chromatography/mass spectrometry (Py-GC/MS) in the surface 0- to 2.5-cm depth of soil.
Biochemical class Linear fi t† r2 p value
Aliphatics and alcohols = 27 + 2.4 × dNT 0.51 0.169Cyclics and aromatics = 73 + 1.0 × dNT 0.86 0.022
Carbohydrate derivatives = 29 + 7.4 × dNT 0.11 0.595
Carboxylics = 58 + 4.9 × dNT 0.90 0.013
Lignin derivatives = 83 + 2.7 × dNT 0.95 0.004
Summed total of defi ned non-N containing chemical classes
= 140 + 21 × dNT 0.88 0.017
Summed total of defi ned N-containing chemical classes
= 16 + 1.4 × dNT 0.38 0.266
Succinimide = 13 + 0.86 × dNT 0.33 0.063
† Units are arbitrary, designating the signal intensity of the ions detected, which is derived from the mass charge ratio (m/z) of the ion. Units are scaled to 1 × 10⁶.
www.soils.org/publications/sssaj 1633
matter in temperate soils by Curie-point pyrolysis-mass spectrometry, III. Transformations occurring in surface organic horizons. Geoderma 40:333–344. doi:10.1016/0016-7061(87)90042-5
Cambardella, C.A., and E.T. Elliott. 1992. Particulate soil organic-matter changes across a grassland cultivation sequence. Soil Sci. Soc. Am. J. 56:777–783. doi:10.2136/sssaj1992.03615995005600030017x
Donohue, S.J., and J.B. Friedericks. 1984. Laboratory procedures. Publ. 452-881. Virginia Coop. Ext. Serv., Blacksburg.
Fierer, N., and J.P. Schimel. 2002. Eff ects of drying-rewetting frequency on soil carbon and nitrogen transformations. Soil Biol. Biochem. 34:777–787. doi:10.1016/S0038-0717(02)00007-X
Franzluebbers, A.J. 2002. Soil organic matter stratifi cation ratio as an indicator of soil quality. Soil Tillage Res. 66:95–106. doi:10.1016/S0167-1987(02)00018-1
Franzluebbers, A.J. 2004. Tillage and residue management eff ects on soil organic matter. In: F.R. Magdoff and R.R. Weil, editors. Soil organic matter in sustainable agriculture. CRC Press, Boca Raton, FL. p. 227–268.
Franzluebbers, A.J. 2005. Soil organic carbon sequestration and agricultural greenhouse gas emissions in the southeastern USA. Soil Tillage Res. 83:120–147. doi:10.1016/j.still.2005.02.012
Franzluebbers, A.J., and M.A. Arshad. 1997. Particulate organic carbon content and potential mineralization as aff ected by tillage and texture. Soil Sci. Soc. Am. J. 61:1382–1386. doi:10.2136/sssaj1997.03615995006100050014x
Franzluebbers, A.J., F.M. Hons, and D.A. Zuberer. 1994a. Long-term changes in soil carbon and nitrogen pools in wheat management-systems. Soil Sci. Soc. Am. J. 58:1639–1645. doi:10.2136/sssaj1994.03615995005800060009x
Franzluebbers, K., R.W. Weaver, A.S.R. Juo, and A.J. Franzluebbers. 1994b. Carbon and nitrogen mineralization from cowpea plants part decomposing in moist and in repeatedly dried and wetted soil. Soil Biol. Biochem. 26:1379–1387. doi:10.1016/0038-0717(94)90221-6
Goh, K.M., and R.J. Haynes. 1986. Nitrogen and agronomic practices. In: R.J. Haynes, editor, Mineral nitrogen in the plant-soil system. Academic Press, Orlando, FL.
Grandy, A.S., and J.C. Neff . 2008. Molecular C dynamics downstream: Th e biochemical decomposition sequence and its impact on soil organic matter structure and function. Sci. Total Environ. 404:297–307. doi:10.1016/j.scitotenv.2007.11.013
Greenfi eld, L.G. 2001. Th e origin and nature of organic nitrogen in soil as assessed by acidic and alkaline hydrolysis. Eurasian Soil Sci. 52:575–583. doi:10.1046/j.1365-2389.2001.00419.x
Guggenberger, G., S.D. Frey, J. Six, K. Paustian, and E.T. Elliott. 1999. Bacterial and fungal cell-wall residues in conventional and no-tillage agroecosystems. Soil Sci. Soc. Am. J. 63:1188–1198. doi:10.2136/sssaj1999.6351188x
Hassink, J. 1995. Density fractions of soil macrooganic mater and microbial biomass as predictors of C and N mineralization. Soil Biol. Biochem. 27:1099–1108. doi:10.1016/0038-0717(95)00027-C
Haynes, R.J. 2005. Labile organic matter fractions as central components of the quality of agricultural soils: An overview. Adv. in Agron. 85:221–268.
Horowitz, J., R. Ebel, and K. Ueda. 2010. No-till farming is a growing practice. Econ. Info. Bull. 70. USDA-ERS, Washington, DC.
House, G.J., B.R. Stinner, D.A. Crossley, E.P. Odum, and G.W. Langdale. 1984. Nitrogen cycling in conventional and no-tillage agroecosystems in the southern piedmont. J. Soil Water Conserv. 39:194–200.
Kay, B.D., and A.J. VandenBygaart. 2002. Conservation tillage and depth stratifi cation of porosity and soil organic matter. Soil Tillage Res. 66:107–118. doi:10.1016/S0167-1987(02)00019-3
Keeney, D.R., and J.M. Bremner. 1966. Characterization of mineralizable nitrogen in soils. Soil Sci. Soc. Am. Proc. 30:714–718. doi:10.2136/sssaj1966.03615995003000060018x
Khan, S.A., R.L. Mulvaney, and C.S. Mulvaney. 1997. Accelerated diff usion methods for inorganic-nitrogen analysis of soil extracts and water. Soil Sci. Soc. Am. J. 61:936–942. doi:10.2136/sssaj1997.03615995006100030032x
Kruse, J.S., D.E. Kissel, and M.L. Cabrera. 2004. Eff ects of drying and rewetting on carbon and nitrogen mineralization in soils and incorporated residues. Nutr. Cycl. Agroecosyst. 69:247–256. doi:10.1023/B:FRES.0000035197.57441.cd
Leinweber, P., and H.R. Schulten. 1999. Advances in analytical pyrolysis of soil organic matter. J. Anal. Appl. Pyrolysis 49:359–383. doi:10.1016/S0165-2370(98)00082-5
Marriott, E.E., and M.M. Wander. 2006. Total and labile soil organic matter in organic and conventional farming systems. Soil Sci. Soc. Am. J. 70:950–959. doi:10.2136/sssaj2005.0241
Mengel, K. 1996. Turnover of organic nitrogen in soils and its availability to crops. Plant Soil 181:83–93. doi:10.1007/BF00011295
Moreno, F., J.M. Murillo, F. Pelegrin, and I.F. Giron. 2006. Long-term impact of conservation tillage on stratifi cation ratio of soil organic carbon and loss of total and active CaCO3. Soil Tillage Res. 85:86–93. doi:10.1016/j.still.2004.12.001
Mulvaney, R.L., and S.A. Khan. 2001. Diff usion methods to determine diff erent forms of nitrogen in soil hydrolysates. Soil Sci. Soc. Am. J. 65:1284–1292. doi:10.2136/sssaj2001.6541284x
Mulvaney, R.L., S.A. Khan, R.G. Hoeft , and H.M. Brown. 2001. A soil organic nitrogen fraction that reduces the need for nitrogen fertilization. Soil Sci. Soc. Am. J. 65:1164–1172. doi:10.2136/sssaj2001.6541164x
Needelman, B.A., M.M. Wander, G.A. Bollero, C.W. Boast, G.K. Sims, and D.G. Bullock. 1999. Interaction of tillage and soil texture: Biologically active soil organic matter in Illinois. Soil Sci. Soc. Am. J. 63:1326–1334. doi:10.2136/sssaj1999.6351326x
Nissen, T.M., and M.M. Wander. 2003. Management and soil-quality eff ects on fertilizer-use effi ciency and leaching. Soil Sci. Soc. Am. J. 67:1524–1532. doi:10.2136/sssaj2003.1524
SAS Institute. 2002. SAS/Statistical user’s guide. 6.03 ed. SAS Inst., Cary, NC.Schulten, H.R., and M. Schnitzer. 1997. Th e chemistry of soil organic nitrogen:
A review. Biol. Fertil. Soils 26:1–15. doi:10.1007/s003740050335Sequeira, C.H., and M.M. Alley. 2011. Soil organic matter fractions as indices of soil
quality changes. Soil Sci. Soc. Am. J. 75:1766–1773. doi:10.2136/sssaj2011.0067Six, J., S.M. Ogle, F.J. Breidt, R.T. Conant, A.R. Mosier, and K. Paustian. 2004.
Th e potential to mitigate global warming with no-tillage management is only realized when practised in the long term. Glob. Change Biol. 10:155–160. doi:10.1111/j.1529-8817.2003.00730.x
Sollins, P., C. Glassman, E.A. Paul, C.J. Swanton, K. Lajtha, J.W. Heil, and E.T. Elliot. 1999. Soil carbon and nitrogen pools and fractions. In: G.P. Robertson et al., editors. Standard soil methods for long-term ecological research. Oxford Univ. Press, New York. p. 89–105
Spargo, J.T., M.M. Alley, R.F. Follett, and J.V. Wallace. 2008a. Soil nitrogen conservation with continuous no-till management. Nutr. Cycling Agroecosyst. 82:283–297. doi:10.1007/s10705-008-9190-2
Spargo, J.T., M.M. Alley, R.F. Follett, and J.V. Wallace. 2008b. Soil carbon sequestration with continuous no-till management of grain cropping systems in the Virginia Coastal Plain. Soil Tillage Res. 100:133–144. doi:10.1016/j.still.2008.05.010
Spargo, J.T., M.A. Cavigelli, S.B. Mirsky, J.E. Maul, and J.J. Meisinger. 2011. Mineralizable soil nitrogen and labile soil organic matter in diverse long-term cropping systems. Nutr. Cycl. Agroecosyst. 90:253–266. doi:10.1007/s10705-011-9426-4
Steinbeiss, S., V.M. Temperton, and G. Gleixner. 2008. Mechanisms of short-term soil carbon storage in experimental grasslands. Soil Biol. Biochem. 40:2634–2642. doi:10.1016/j.soilbio.2008.07.007
Stevenson, F.J. 1982. Organic forms of soil nitrogen. In: F.J. Stevenson, editor, Nitrogen in agricultural soils. Agron. Monogr. 22. ASA, Madison, WI. p. 67–114
Uri, N.D. 2001. Conservation practices in US agriculture and their impact on carbon sequestration. Environ. Monit. Assess. 70:323–344. doi:10.1023/A:1010735510641
West, T.O., and W.M. Post. 2002. Soil organic carbon sequestration rates by tillage and crop rotation: A global data analysis. Soil Sci. Soc. Am. J. 66:1930–1946. doi:10.2136/sssaj2002.1930
Wienhold, B.J., and A.D. Halvorson. 1999. Nitrogen mineralization responses to cropping, tillage, and nitrogen rate in the Northern Great Plains. Soil Sci. Soc. Am. J. 63:192–196. doi:10.2136/sssaj1999.03615995006300010027x
Willson, T.C., E.A. Paul, and R.R. Harwood. 2001. Biologically active soil organic matter fractions in sustainable cropping systems. Appl. Soil Ecol. 16:63–76. doi:10.1016/S0929-1393(00)00077-9
Xu, Y.C., Q.R. Shen, and W. Ran. 2003. Content and distribution of forms of organic N in soil and particle size fractions aft er long-term fertilization. Chemosphere 50:739–745. doi:10.1016/S0045-6535(02)00214-X