THE CALTECH SOLAR SITE SURVEY, 1965-1967 1 ... - CORE
19
1988SoPh..115..183Z THE CALTECH SOLAR SITE SURVEY, 1965-1967 H. ZIRIN Big Bear Solar Observatory, California Institute of Technology, Pasadena, CA 91125, U.S.A. and JAMES M. MOSHER Newport Beach, CA 92660, U.S.A. (Received 18 August, 1987) Abstract. We describe the Caltech solar site survey in 1965-1967 directed by R. B. Leighton. The solar seeing at 102 locations in 34 sites in Southern California was evaluated by 6009 visual estimates with portable telescopes. Qoud cover and other meteorological factors were also measured, and sunlight recorders were operated at several sites. We have reanalyzed much of the data to determine its consistency and learn what else we could about the sites. The visual estimates show good internal consistency and correlation with photographic data. The seeing was found to be best at various sites associated with water, and we point out the importance of the Bowen ratio in determining the influence of water vapor on seeing. It was found that seeing at the different sites was not well correlated in time. The seeing was found to be best at Lake Elsinore, an inland sink. Good seeing was also found on the Caltech campus and at Big Bear Lake in the San Bernardino Mountains. Taking into account the better sky transparency and the feasibility of constructing an observatory in the lake, we chose Big Bear Lake for the site of a new observatory. The lack of correlation of seeing with transparency suggests the benefits of several smaller telescopes, targeted at specific goals, located at sites chosen for those goals. 1. Introduction Stellar astronomers may carry out their observations without fear of retribution by the stars, but the Sun obstructs the efforts of solar astronomers through heating of the ground and domes as well as by producing diurnal winds and photochemical smog. In the 1960's Kiepenheuer (1963, 1974) pushed for development of new solar observing sites, urging that we find windows in the turbulent atmosphere. He described some of the important factors in solar seeing, and even reported favorable results at Lake Qarun in Egypt. The site survey described here was one response, probably the most extensive carried out for a solar observatory up to that date. It resulted in the choice of Big Bear Lake for a new observatory. Since only a brief description of the survey (Zirin, 1970) has been published, we give a more detailed description here. The fact that a recent review article on astronomical seeing (Coulman, 1985) makes scant mention to the idea of locating solar observatories in lakes suggests that some discussion of the subject is timely. We have also critically examined the method of visual seeing estimates used in the present survey to understand their reliability and significance. Two surveys had been conducted previously in coastal Southern California. Hussey (1903) and Hale (1905) carried out the survey which led to the selection of Mt Wilson for a major solar facility, including the famous incident of observing from a tree at Solar Physics 115 (1988) 183-202. © 1988 by Kluwer Academic Publishers. © Kluwer Academic Publishers • Provided by the NASA Astrophysics Data System
-
Upload
khangminh22 -
Category
Documents
-
view
0 -
download
0
Transcript of THE CALTECH SOLAR SITE SURVEY, 1965-1967 1 ... - CORE

1988SoPh..115..183Z
THE CALTECH SOLAR SITE SURVEY, 1965-1967
H. ZIRIN
Big Bear Solar Observatory, California Institute of Technology, Pasadena, CA 91125, U.S.A.
and
JAMES M. MOSHER
Newport Beach, CA 92660, U.S.A.
(Received 18 August, 1987)
Abstract. We describe the Caltech solar site survey in 1965-1967 directed by R. B. Leighton. The solar seeing at 102 locations in 34 sites in Southern California was evaluated by 6009 visual estimates with portable telescopes. Qoud cover and other meteorological factors were also measured, and sunlight recorders were operated at several sites. We have reanalyzed much of the data to determine its consistency and learn what else we could about the sites. The visual estimates show good internal consistency and correlation with photographic data.
The seeing was found to be best at various sites associated with water, and we point out the importance of the Bowen ratio in determining the influence of water vapor on seeing. It was found that seeing at the different sites was not well correlated in time.
The seeing was found to be best at Lake Elsinore, an inland sink. Good seeing was also found on the Caltech campus and at Big Bear Lake in the San Bernardino Mountains. Taking into account the better sky transparency and the feasibility of constructing an observatory in the lake, we chose Big Bear Lake for the site of a new observatory. The lack of correlation of seeing with transparency suggests the benefits of several smaller telescopes, targeted at specific goals, located at sites chosen for those goals.
1. Introduction
Stellar astronomers may carry out their observations without fear of retribution by the stars, but the Sun obstructs the efforts of solar astronomers through heating of the ground and domes as well as by producing diurnal winds and photochemical smog. In the 1960's Kiepenheuer (1963, 1974) pushed for development of new solar observing sites, urging that we find windows in the turbulent atmosphere. He described some of the important factors in solar seeing, and even reported favorable results at Lake Qarun in Egypt. The site survey described here was one response, probably the most extensive carried out for a solar observatory up to that date. It resulted in the choice of Big Bear Lake for a new observatory. Since only a brief description of the survey (Zirin, 1970) has been published, we give a more detailed description here. The fact that a recent review article on astronomical seeing (Coulman, 1985) makes scant mention to the idea of locating solar observatories in lakes suggests that some discussion of the subject is timely. We have also critically examined the method of visual seeing estimates used in the present survey to understand their reliability and significance.
Two surveys had been conducted previously in coastal Southern California. Hussey (1903) and Hale (1905) carried out the survey which led to the selection of Mt Wilson for a major solar facility, including the famous incident of observing from a tree at
Solar Physics 115 (1988) 183-202. © 1988 by Kluwer Academic Publishers.
© Kluwer Academic Publishers • Provided by the NASA Astrophysics Data System

1988SoPh..115..183Z
184 H. ZIRIN AND JAMES M. MOSHER
Mt Wilson. Years later, after a necessarily restricted survey, Mayfield et al. (1964) selected the Upper Van Norman Reservoir for the Aerospace Corporation's San Fernando Observatory, currently operated by the California State University at Northridge. The Lockheed Solar Observatory (Carroll, 1970), no longer in existence, was located primarily on the basis of readily available land, but it had demonstrated the possibilities of high resolution solar observation in Southern California. By contrast we were dissatisfied with our location on Mt Wilson, where good seeing could only be obtained in the first hour of the day, before the Sun had heated the mountainside and produced the familiar orographic turbulence.
In 1964 R. B. Leighton obtained a grant from the Office of Naval Research to make a systematic search for a new site for solar observations, which was done with the collaboration of R. F. Howard and Zirin. The purpose of the Caltech site survey was twofold: to study the variation of solar seeing as a function of topography and to find a site suitable for extended high-resolution observation of solar phenomena. Although we sought good seeing, cloud cover and the possibility of coronal skies were also considerations. We preferred a site with longer duration of good seeing compared to one with occasional brilliant moments.
Our initial plan for five inexpensive automated 40-foot tower telescopes at fixed sites led to a prototype on Mt Wilson east of the 100" dome. We soon found that consistent automated operation was difficult and the quality of photographs made with the tower
.. was more a measurement of its stability and our optomechanical technique than of the local seeing. Our only success with portable telescopes was our use of a Carroll spar for broad-band Ha movies at Lake Elsinore, Big Bear, and Mt Wilson in the Fall of 1967. Our brief use of that instrument showed it to be a practical tool, but its cost and complexity prohibited deployment of more than one or two.
The Aerospace site survey (Mayfield et al., 1964) had used visual observations through two 8.75-cm Questar telescopes with full-aperture white-light filters to settle on the San Fernando reservoir site. The fact that they found consistent differences between sites led us to adopt the same technique. The only difference was that we had more time and could look for a site over a wider area. We quickly confirmed that experienced observers could obtain reliable results with the Questars and abandoned the idea of placing additional site survey towers. This greatly increased the number of sites we could exam.me.
Because we thought that weather patterns over the LA basin might produce good or bad seeing at all the sites, we tried to make simultaneous observations. Our subsequent analysis showed that the seeing at the different sites was not closely correlated. Many observations at many sites were more valuable in eliminating random variations. A program similar to the Aerospace Corp. survey was adopted, with two observers visiting a number of different sites each day.
Next to seeing we were interested in the transparency and cloud cover. Leighton designed a simple and accurate sunlight recorder consisting of a rotating stainless steel ball heliostat reflecting the Sun into a photodiode connected to a recorder. Five recorders were eventually built and sited. They worked very well with the exception of one
© Kluwer Academic Publishers • Provided by the NASA Astrophysics Data System
1988SoPh..115..183Z
THE CALTECH SOLAR SITE SURVEY, 1965-1967 185
near the seashore which rapidly became corroded. One operated at Big Bear until the recent installation of the GONG recorder. We also measured the solar aureole with coronal sky photometers, kindly lent by the High Altitude Observatory, at some of the sites~
2. Choice of Locations
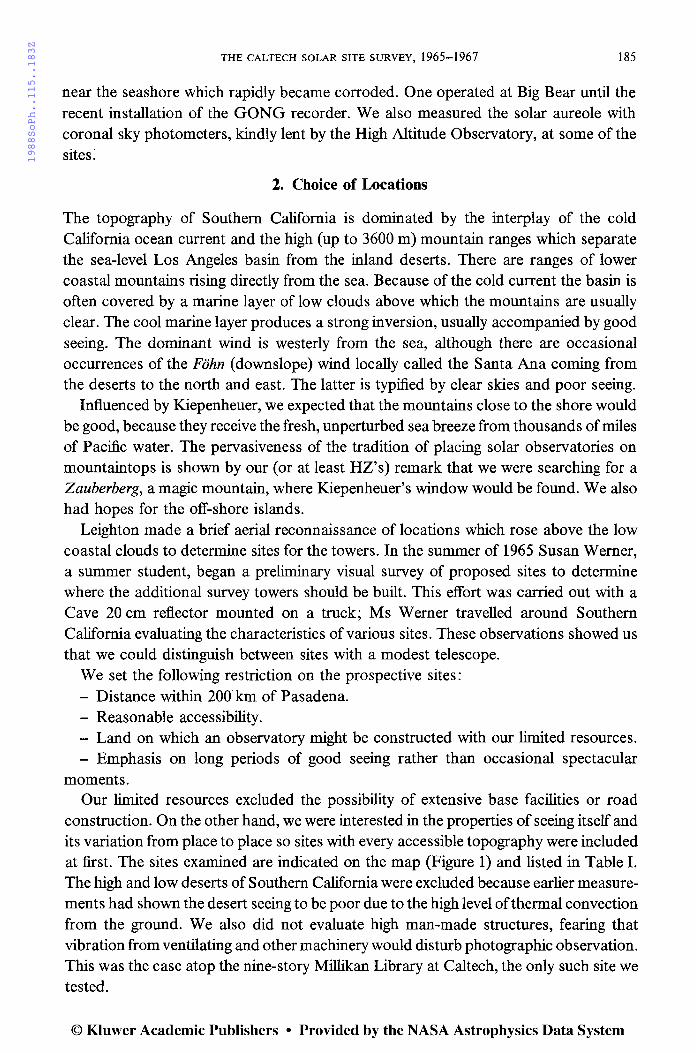
The topography of Southern California is dominated by the interplay of the cold California ocean current and the high (up to 3600 m) mountain ranges which separate the sea-level Los Angeles basin from the inland deserts. There are ranges of lower coastal mountains rising directly from the sea. Because of the cold current the basin is often covered by a marine layer of low clouds above which the mountains are usually clear. The cool marine layer produces a strong inversion, usually accompanied by good seeing. The dominant wind is westerly from the sea, although there are occasional occurrences of the Fohn (downslope) wind locally called the Santa Ana coming from the deserts to the north and east. The latter is typified by clear skies and poor seeing.
Influenced by Kiepenheuer, we expected that the mountains close to the shore would be good, because they receive the fresh, unperturbed sea breeze from thousands of miles of Pacific water. The pervasiveness of the tradition of placing solar observatories on mountaintops is shown by our (or at least HZ's) remark that we were searching for a Zauberberg, a magic mountain, where Kiepenheuer's window would be found. We also had hopes for the off-shore islands.
Leighton made a brief aerial reconnaissance of locations which rose above the low coastal clouds to determine sites for the towers. In the summer of 1965 Susan Werner, a summer student, began a preliminary visual survey of proposed sites to determine where the additional survey towers should be built. This effort was carried out with a Cave 20 cm reflector mounted on a truck; Ms Werner travelled around Southern California evaluating the characteristics of various sites. These observations showed us that we could distinguish between sites with a modest telescope.
We set the following restriction on the prospective sites: - Distance within 200-km of Pasadena. - Reasonable accessibility. - Land on which an observatory might be constructed with our limited resources. - Emphasis on long periods of good seeing rather than occasional spectacular
moments. Our limited resources excluded the possibility of extensive base facilities or road
construction. On the other hand, we were interested in the properties of seeing itself and its variation from place to place so sites with every accessible topography were included at first. The sites examined are indicated on the map (Figure 1) and listed in Table I. The high and low deserts of Southern California were excluded because earlier measurements had shown the desert seeing to be poor due to the high level of thermal convection from the ground. We also did not evaluate high man-made structures, fearing that vibration from ventilating and other machinery would disturb photographic observation. This was the case atop the nine-story Millikan Library at Caltech, the only such site we tested.
© Kluwer Academic Publishers • Provided by the NASA Astrophysics Data System

1988SoPh..115..183Z
186 H. ZIRIN AND JAMES M. MOSHER
12 13 • Los Angeles
Pacific Ocean
.33
t--- 50 miles
------- --San Diego
Fig. 1. Locations of the sites studied. The contours are at intervals of2500 feet (762 m). The numbers refer to Table I and the size of the circles is related to the number of visits to each site.
3. Site Evaluation
The main part of the site survey involved two full-time observers, Ernest Lorenz and John Cowley, for two years as well as some part-time participants. The most intensive activity was between January 3, 1966 and October 31, 1967, during which time 6009 observations were made. We have records for 209 days in 1966 and 177 days in 1967 (through October 31), indicating coverage on 57-58% of the available days.
A number of itineraries of sites were laid out on cards, each of which contained a number of sites that could be visited in a day. Each day each observer followed the itinerary on a randomly chosen card. The cycle of observations was completed in five or six weeks, after which the deck of cards was shuffied again and visited in different sequence. The day sequences were also varied somewhat. In all the ob~ervers visited 102 locations at 34 different sites. At each site the observers filled out cards with the following data: place, date, observer, time of observation, seeing, transparency, cloud cover and type, wind velocity and direction, and temperature and humidity.
The emphasis was on observations around mid-day, with fewer reports before 8 a.m. or after 4 p.m. Most are between 10 a.m. and 2 p.m., because the observers had to get prepared after arriving at Caltech at 8 a.m. and it took an hour or more to reach the start of his itinerary. On some occasions an overnight stay was arranged so that morning and evening observations could be obtained.
© Kluwer Academic Publishers • Provided by the NASA Astrophysics Data System

1988SoPh..115..183Z
THE CALTECH SOLAR SITE SURVEY, 1965-1967 187
TABLE I
List of sites studied
Map Name No. of Topo- Elev. First Last Number Number No. sub- graphya (m) visit visit of of
sites visits cards
Refugio Beach 3 Bch 0 9 June, 1965 27 Apr., 1967 57 284 2 Santa Ynez Mtns. 4 Cpk 1300 9 June, 1965 28 July, 1966 33 223 3 Reyes Peak 3 Ipk 2300 30 June, 1965 4 Jan., 1967 42 152 4 Mt Pinos 3 Ipk 2700 4 Sept., 1965 3 Oct., 1967 55 315 5 Lockwood Valley 9 Plat 1600 19 Aug., 1966 5 Dec., 1967 80 507 6 Frazier Pk. 1 Ipk 2400 3 Sept., 1965 3 Nov., 1966 17 64 7 Double Mt. 2 Ipk 1900 20 Fehr., 1966 24 May, 1966 6 1 8 Bouquet Cnyn Res 2 Llk 900 8 Aug., 1965 2 June, 1966 14 28 9 Rye Canyon Ipl 400 2 June, 1966 4 Jan., 1967 21 81
10 Oat Mtn Ipl 1100 11 July' 1966 29 July, 1966 3 7 11 San Fernando Obs 1 Llk 400 28 June, 1965 4 Jan., 1967 30 59 12 Laguna Peak 1 Cpk 400 27 July' 1965 24 Aug., 1966 24 40 13 Triunfo Lookout 2 Cpk 800 16 Sept., 1965 24 Aug., 1966 23 57 14 Malibu 2 Bch 0 24 Fehr., 1966 24 Aug., 1966 17 60 15 Briar Summit 1 Ipk 500 15 Sept., 1965 4 Jan., 1967 23 63 16 Flintridge L.O. 1 Ipk 1000 15 Sept., 1965 27 July, 1966 28 62 17 Caltech 3 Ipl 200 23 July, 1965 6 Oct., 1967 138 470 18 Altadena G.C. 1 Ipl 400 15 Mar., 1966 30 Dec., 1966 31 57 19 Mt Wilson 7 Ipk 1700 4 Jan., 1965 2 Oct., 1967 69 346 20 S toneyridge 1 Ipk 1600 4 May, 1966 23 Aug., 1966 8 16 21 Blueridge 2 Ipk 2600 4 Jan., 1965 28 June, 1966 12 62 22 Table Mtn 4 Ipk 2300 4 Jan., 1965 23 Aug., 1966 36 188 23 Lake Arrowhead 5 Mlk 1600 28 Oct., 1965 17 Jan., 1967 56 202 24 Heap's Peak 2 Ipk 1900 4 Jan., 1966 3 Jan., 1967 43 124 25 Big Bear Lake 7 Mlk 2000 14 July, 1966 5 Dec., 1967 107 937 26 Mt San Jacinto 2 Ipk 2600 4 Nov., 1965 9 Aug., 1966 4 6 27 Silverado Cnyn Ipl 600 5 Aug., 1965 29 June, 1966 19 13 28 Santiago Peak 1 Ipk 1700 5 Aug., 1965 29 June, 1966 19 35 29 Lake Elsinore 10 Llk 400 3 Sept., 1965 5 Dec., 1967 135 1048 30 Dana Point 1 Bch 100 19 July, 1966 8 Aug., 1966 3 9 31 Foot of Palomar 1 Ipl 300 11 Aug., 1965 21 Nov., 1966 30 39 32 Palomar Mtn. 6 Ipk 1700 11 Aug., 1965 13 Dec., 1966 52 146 33 Santa Catalina Isl. 4 Isl 300 20 July' 1965 11 Nov., 1965 3 0 34 San Clemente Isl. 7 Isl 300 9 Aug., 1965 7 Sept., 1966 27 308
a Bch =beach; Cpk =coastal peak; Ipk =inland peak; Ipl = inland plain; Isl =island; Llk = lowland lake; Mlk =mountain lake; Plat= plateau.
If an observer remained at a site, he typically filled out a card each half-hour; if he moved on, he filled one out at each site. An average of eight cards per day of observation was submitted by each observer. If the random cards sent both observers to the same site, this was used as a chance to intercompare the scales of the two observers. In most cases the observers did not communicate with one another when they were making such observations, but sometimes they did to clarify the observing scale and understand why
© Kluwer Academic Publishers • Provided by the NASA Astrophysics Data System

1988SoPh..115..183Z
188 H. ZIRIN AND JAMES M. MOSHER
differences arose in the evaluation of the seeing. The seeing was supposed to be estimated as the average over some minutes of visual observation.
The observers went out four days a week, and spent one day in Pasadena repairing equipment and meeting with the scientists. After the first six months, the data was reviewed and the frequency of visits to better sites was increased. By the end of 1966, we could see a clear pattern, and the survey concentrated on the most promising sites: Big Bear, Lake Elsinore, Mount Pinos, and the Lockwood Valley, with occasional observations at Caltech and Mt Wilson for reference. At the end of the survey visual data were taken almost exclusively at Big Bear and Elsinore, and we rented a spar from George Carroll that operated for 12 days at Big Bear and 14 days at Lake Elsinore.
Seeing was evaluated using a 10-point visual scale patterned after one in use at Mt Wilson at the time. In Table II we compare this to the 5-point Kiepenheuer (1963) scale; the two are similar except that the numbers run in the opposite direction and the separate evaluation of 'quietness' and 'sharpness' used by Kiepenheuer is merged. Totally overcast conditions were marked as 'seeing O'.
TABLE II
Comparison of Caltech and Kiepenheuer ( 1963) visual seeing scales
Kiepenheuer Caltech
8-10 2 6-8 3 3-6 4 2-3 5 1
The observers attempted to make the estimates in a consistent manner and a site rated '5' by many observations was almost certainly better than one rated '4'. When we plot the simultaneous, but independent, estimates at one site by the two observers against one another we find good correlation, with a scatter of about ± 1.5 units.
While we cannot recreate the conditions of the survey, we have an independent check in the high-resolution Ha cinematographic data obtained at the Lockheed Solar Observatory during the period of the site survey with a 17.5 cm refractor at Rye Canyon. On sixteen instances the Caltech observers made visual estimates at Rye Canyon simultaneously with Lockheed high-resolution observations. Assuming that the observers gave more weight to the best seeing, we selected the best frame from a ten-frame (two-min) sequence around the time of the visual observation. Figure 2 shows examples of that comparison at three typical seeing levels. We see that seeing of 6 or better would be required for what we now consider to be good data.
Naturally, not every frame is as good as the best. To get a feel for the variation in image quality occurring at each seeing level, the spacing of the closest resolvable dark
© Kluwer Academic Publishers • Provided by the NASA Astrophysics Data System

1988SoPh..115..183Z
THE CALTECH SOLAR SITE SURVEY, 1965-1967 189
Sept. 16, 1966 Dec. 19. 1966 >-¥
7.5 5.0
Dec. 27, 1966
1-2 arc min~ 2.5
Fig. 2. Three Ha frames from Lockheed Rye Canyon Observatory, with the seeing values estimated independently by the site survey observers given. The resolution limit of the pictures for fibrils is 1.2, 2.4, and 4.5 arc sec, respectively. Figure 3 shows that this quality is found in the best 10% of frames at each
of the three seeing values.
fibrils in each quadrant of each frame was measured. To give a number comparable to the 1-10 visual scale, this separation was divided into the Rayleigh limit {0.94 arc sec) of the telescope. Thus a photograph with a resolution of 5 arc sec was rated at 0.19. Figure 3 shows the distribution of photographic quality obtained at Lockheed within the two-min interval surrounding nine different visual estimates. The distribution is presented in terms of the fraction of frames exceeding various resolution values. Those wishing to compare the results reported in this paper to their own experience in other parts of the world may do so by means of these distributions coupled with the frequency of occurrence of the different seeing levels.
As the survey went on there was some narrowing of the values assigned to the seeing towards average values. This was partly due to the termination of visits to most of the mountaintop sites, where seeing was most variable. There may also have been a tendency for the observers to assign a narrower range of values near the end. Another curious property of the survey data is that it shows almost no seasonal effects, while it is well known that in Southern California summer seeing is considerably better than winter (partly because the Sun is high and partly because storms are fewer). This may
© Kluwer Academic Publishers • Provided by the NASA Astrophysics Data System

1988SoPh..115..183Z
190
(!) z Cl
-W w u (j .5 z 0 la:: 0 a...
H. ZIRIN AND JAMES M. MOSHER
Fig. 3. Plot of (ordinate) the fraction of time that a Rye Canyon (Lockheed) film resolved a given fraction of the Rayleigh limit (0.94 arc sec) of a 17.5 cm objective when the seeing was estimated at various values (curves) by the CIT observers. The abscissa is the quotient of the Rayleigh limit divided by the separation
of the most closely spaced fibrils.
have been due to a combination of a mild winter (for seeing) with some smoothing on the part of the observers.
Obviously it is impractical to use a site survey telescope as large as the one projected for construction. Yet we found a good correlation between observations with the 8.75 cm Questar and the 17.5 cm Lockheed telescope, and both Caltech and Aerospace surveys located sites that proved good with larger aperture telescopes. While the small telescope does not resolve what the large one does, seeing reduces the MTF at all spatial frequencies. Out of all 6000 and more observations made during the survey, not a single one required using the value of'lO' (indicating no perceptible image degradation) on the 10-point scale, and only seven '9's were recorded. This meant that there was always room for improvements in the small telescope images.
Subsequent visual observations with Questars at BBSO have confirmed the result of comparison with the Lockheed observations: a small telescope can give a good estimate of the seeing, even though one cannot detect features seen in the larger telescope. The atmospheric MTF for larger features is apparently correlated with that for the smallest.
The success of our technique depended on similarity of the height gradients of seeing close to the ground from place to place, so we made several tests of the dependence of seeing on height. One test was to compare the seeing at the foot and top of the 150-ft. (46 m) tower on Mt Wilson. While the seeing clearly improved with height, the conditions at the base of the tower seemed well correlated with those at the top suggesting that, at least at Mt Wilson, the degradation arising from heights above 46 m dominated the additional degradation imposed by the air between the ground and that height. To get additional data on the height dependence of seeing, we outfitted two portable towers borrowed from the U.S. Navy with microthermal recorders designed by Prof. J. Westphal. Thermistors were placed at 24, 17, 11, and 6 m above the ground, and
© Kluwer Academic Publishers • Provided by the NASA Astrophysics Data System

1988SoPh..115..183Z
THE CALTECH SOLAR SITE SURVEY, 1965-1967 191
thermal data recorded on a commutative basis on a single recorder. We also tried tethered balloons but found that the wind dragged them away. The thermistor strings on towers showed little difference between sites; in each case the fluctuations of temperature were greater at the surface than at the highest thermistor. We did not have adequate data to determine any relation between the temperature fluctuations and the seemg.
Some site surveys have used similar towers to infer the seeing at heights at which a telescope might be built. The relation of seeing properties to microthermal variations is discussed by Coulman ( 1969), but his measurements at that time omit the height gradient of water-vapor content, although he considered it in other publications (Coulman, 1980).
The actual seeing is due not only to temperature and pressure fluctuations but also to humidity variation along the line-of-sight and across the telescope aperture. There is substantial literature on these effects in connection with laser propagation and other practical problems, largely unknown to solar and stellar astronomers. Weseley and Alcaraz (1973) define an atmospheric refractive index structure coefficient Cc which is related to the temperature structure coefficient Cr, the pressure p, and the average temperature ( T) by
(1)
where A 1 ~ 79 x 10- 6 deg mB - 1. The difference produced by water-vapor effects is
precisely 1 + 0.16/3- 1, where f3 is Bowen's ratio, the ratio of the thermal to the latent
heat flux. Because the Earth's surface is either warming and evaporating or cooling and condensing, f3 is usually positive; over dry land it is typically 0.5. But when surface cooling and evaporation occur simultaneously, f3 < 0, en is decreased and the seeing is improved. Experimental evidence demonstrating the effect of water-vapor gradient has been presented by numerous authors (Wesely et al., 1975, 1976a, b, 1978; Friehe et al., 1975). Microthermal data alone can only be used to compare sites of the same water vapor conditions, while water sites can be better or worse than dry ones with the same microthermal properties, depending on the sign of {3.
4. Analysis of All Sites
Table III shows characteristics of the most frequently tested sites, ranked by the median seeing as given in the second column. In this average, cloudy observations are included as seeing 0. The third column gives the fraction of observations for which the seeing was excellent, 7 or better; the fourth gives the fraction of observations for which the seeing was terrible, 2 or less. The fifth column gives the fraction of observations for which the sky was completely clear, with no haze; column 6 gives the fraction when less than 0.3 of the sky was obscured, which is a reasonable definition of days when useful observation is possible. The last column gives the average wind speed for non-zero seeing conditions. Because of the wide range in number of visits to the different sites, the values given are not all equally significant. The fractions should be multiplied by the number
© Kluwer Academic Publishers • Provided by the NASA Astrophysics Data System

1988SoPh..115..183Z
192 H. ZIRIN AND JAMES M. MOSHER
TABLE III
Average site results
Site Median Frac Frac Frac Frac Wind seeing 789 012 clear CLDS < 0.3 (ms - 1)
Lake Elsinore 5.01 0.20 0.14 0.56 0.74 1.47 Big Bear Lake 4.60 0.03 0.16 0.71 0.63 3.43 Caltech 4.54 0.09 0.21 0.26 0.63 1.21 Arrowhead 4.41 0.18 0.28 0.52 0.77 1.57 Refugio Beach 4.34 0.07 0.35 0.29 0.46 0.72 Oat Mountain 4.25 0.00 0.29 0.29 0.71 4.96 Foot of Palomar 4.25 0.05 0.36 0.62 0.63 1.24 Heap's Peak 4.20 0.14 0.33 0.66 0.69 3.34 Silverado Canyon 4.00 0.23 0.39 0.69 0.92 1.75 Lockwood Valley 3.82 0.05 0.24 0.65 0.64 3.06 Rye Canyon 3.81 0.06 0.28 0.44 0.57 1.70 Mt Pinos 3.62 0.04 0.29 0.76 0.73 1.70 Frazier Peak 3.54 0.00 0.31 0.92 0.89 2.35 Reyes Peak 3.35 0.09 0.35 0.62 0.72 1.74 Table Mountain 3.35 0.00 0.35 0.58 0.66 2.09 Palomar Mountain 3.13 0.03 0.35 0.69 0.66 1.89 San Fernando Observ. 3.00 0.09 0.44 0.29 0.47 3.40 Altadena Golf Course 2.92 0.07 0.44 0.25 0.47 0.85 Mt Wilson 2.92 0.02 0.37 0.64 0.64 0.99 Triunfo Lookout 2.67 0.12 0.47 0.51 0.83 2.69 Briar Summit 2.67 0.08 0.48 0.30 0.56 2.97 Santiago Peak 2.67 0.06 0.57 0.63 0.77 3.36 Santa Ynez Mountains 2.66 0.13 0.48 0.45 0.52 3.39 Bouquet Canyon Res. 2.50 0.11 0.46 0.07 0.42 4.55 Stoneyridge Observ. 2.50 0.00 0.50 0.56 0.50 1.44 Dana Point 2.40 0.22 0.56 0.22 0.44 3.45 Malibu 2.30 0.05 0.52 0.35 0.64 4.34 Laguna Peak 2.30 0.00 0.53 0.40 0.56 4.05 Flintridge Lookout 1.14 0.00 0.74 0.11 0.56 1.50 Blueridge Ski Area 0.50 0.00 0.68 0.42 0.52 3.87 San Clemente Island 0.33 0.06 0.68 0.21 0.28 2.78
of cards indicated in the last column of Table I to get the number of observations fitting each criterion.
During the survey the data cards were analyzed in two different ways: statistical frequency distribution, and computer-ranked comparison. The computer gave the number of times a given site ranked better or worse than each other site. This comparison was carried out first to sort out the best sites for more detailed study. At the end of the survey these analyses were rerun. Separate intercomparison was carried out for limits between 10 a.m. and 2 p.m. and then for morning and afternoon hours.
In preparing this report, we have analyzed the data in two additional ways: (1) all seeing data was ranked relative to simultaneous ( ± 1 min) Rye Canyon photos; (2) a least-squares fit was determined for the matrices of differences in seeing, cloudiness and
© Kluwer Academic Publishers • Provided by the NASA Astrophysics Data System

1988SoPh..115..183Z
THE CALTECH SOLAR SITE SURVEY, 1965-1967 193
transparency at the different sites when simultaneous measurements were available. These methods, along with the first two, gave essentially the same ranking of sites.
4.1. SEEING
If all the observations (except O's) at all the sites are combined, then the average seeing for 1966 was 4.17 ± 0.04; and the average for 1967 was 4.61 ± 0.03 on the 10-point scale. The year-to-year change was due to dropping the poorer sites. The average (non-cloud) seeing at individual sites varies from 2.4 ± 0.3 for 38 observations on 21 days at the Flintridge Lookout to 5.12 ± 0.06 for 966 observations on 118 days at Lake Elsinore. By comparison the average seeing at Mt Wilson was 3.26 ± 0.11 for 305 observations on 53 days and at Big Bear was 4.68 ± 0.07 for 819 observations on 97 days. Elsinore showed the best average seeing, with Caltech close behind. The worst of the 102 locations was the Flintridge Lookout, a mountain about 10 km NW of Caltech; second worst was Mt Wilson. These are not small differences; although the seeing scale covered ten points, almost all estimates were between 3 and 7, and the difference between 5 and 3 encompasses the range between fairly good and mediocre seeing, as can be seen from Figure 2.
Lake Elsinore (29) Ref u io Beach ( I ) ~----~---------__..,~""T-ir-T"'I .. 10
Lake Arrowhead (23) . ............ .
5 ... . -.: : ;..i= ... ~ .. .
• ·:'=tL~t.:.,. - .. . . . ·==.:~: ~~\: ::: ... ,. . . . .
5 ·:.:;:~{.~~';. .. . ,.._ . 0 6 9 12 15 18
o--6 ...................... ~9---............ 1;-----~··~,5--"-....r-.&18_._,
Caltech ( 17) Bi Beer (25) 10-------------------
· ... ,··..:.:. . 5 .,,~~tH~~1~~f: .. · · ':(~.p~ ·:~;~;:;'..:'.·:·:· : : : ] . . ,,. . . .. "·. 0 6 9 12 15 18
:ls~~ ~'K:;:;,;~-;:--:(~~) :1 0 6 9 12 15 18
Mount Pinos ( 4) 10,..,....-,....._...._.....--.-.._...,.........;.._......, __ _
5
6 9 12 15 18
'f ~·n'. -~:;I:;,~~;;~:; : : :1 0
6 9 12 15 18
Local Time (hours)
Soota Ynez Lookout (2) 10---------..--.---------_..... .......... ...._..
5
0 6 9 12 15 18
10 Re es Peak (3)
5
6 9 12 15 18
10 Mount Wilson ( 19)
.. :· .... I••
:·~;kt~Fh~~ . .-. · . -~lo~-~~·:..:- ::1 ...
0""""-:6~~9~"""--:112~~15~~18--LJ
5
Local Time (hours)
0 6 9 12 15 18
~ Lockwood Valle ( 5)
10 Table Mountain (22)
10 Flintrid e Lookout ( 16)
5 . . : ..... ...........
0---6------9.....___.__1~2~-1~5."--l.~18~
Local Time (hours)
Fig. 4. Seeing data for various sites plotted as a function of time of day. Each dot is an observation and cloudy observations are excluded. The excellent morning seeing at Elsinore with afternoon fall-off are clear. By comparison, the data at Big Bear are fairly even. The numbers refer to the site location in Figure 1.
© Kluwer Academic Publishers • Provided by the NASA Astrophysics Data System

1988SoPh..115..183Z
194 H. ZIRIN AND JAMES M. MOSHER
The non-zero observations obtained during the survey period are plotted in Figure 4 as a function of time for the main sites. We see that there is a clear pattern in the data, at least for the most frequently visited sites. Elsinore had outstanding morning seeing, dropping off in the afternoon. Big Bear had rather uniform seeing, peaking at noon. That has been our subsequent experience there.
We had assumed that large-scale variations in climate would affect all sites, but found little correlation between tlie sites more than a few km apart (Figure 5). The same result was found for the correlation calculated for 811 simultaneous Lockheed large-scale photographs and Caltech site survey visual estimates at other sites. Some sites less than 50 km apart even show substantial anticorrelation. This shows how crucial local effects are.
4.2. CLOUDINESS
One day with seeing '1 O' and a cloudy day of seeing 'O' are not, in any sense, equivalent to two clear days with seeing '5'. We begged the question by taking averages with and without the cloudy days and looking at cloudiness as a separate consideration. Seeing data were averaged separately, one average simply rejecting the cloudy observations and giving the average seeing values for all days on which the Sun could be seen.
Comparison of the survey data with weather bureau records for the same period shows data only for 5 of the 28 days with significant general rainfall, so there is some underreporting of cloudy conditions. Of the 6018 observations, 1906 were marked 'O' for overcast. This probably is a reasonable indication of the fraction of cloudy days, since the 'O' entry was entered hourly, giving the same number of observations per day. In addition visual records of the degree of cloudiness or haze were kept.
The photoelectric sunlight recorders gave excellent cloudiness data for the sites at which they were located. For Big Bear the sunlight recorder gave 49% of the daylight hours as clear or coronagraph quality; only 26 % of the time was too cloudy for observation. Recent data from a GONG recorder show the Sun shining at full strength 58.5 % of the time. Caltech showed a considerable number of cloudy days, and Elsinore a substantial number of days with light haze. (Elsinore is on the fringe of the Los Angeles smog basin, and receives an increasing amount of smog from it.) While our survey placed the greatest weight on seeing, modern use of subtractive photoelectric observations for magnetic and Doppler field measurement require extremely stable light levels, as does accurate photoelectric tracking.
Observations with the HAO coronal sky photometers showed that all the mountain locations examined had good coronagraphic skies.
The definite conclusions of our work can be seen in Figure 4, where sites of different types are displayed, and Figure 6, where they are merged.
The superiority of lakes and the Los Angeles basin is clear. In retrospect we can understand the performance of the various sites in a fairly simple way. Since seeing is solely due to the atmosphere, one would like a point as high as possible with extremely stable atmosphere. While mountains may be quite good in windless conditions with no insolation, the normal flow of air produces serious orographic turbulence, while heating the upper levels of peaks stimulates convection. Thus the sites available in real life
© Kluwer Academic Publishers • Provided by the NASA Astrophysics Data System

1988SoPh..115..183Z
THE CALTECH SOLAR SITE SURVEY, 1965-1967 195
-1.0o 50 100 150 Separation between Sites (miles)
Fig. 5. Correlation between sites separated by different distances.
0 0 v
Inland Lakes v
Beaches -+-'
(2274 obs) -+-' (661 obs) c c Q) Q)
0 0 I.... 0 I.... 0 Q)
N Q)
N 0... 0...
0 0 0 1 2 3 4 5 6 7 8 9 0 1 2 3 4 5 6 7 8 9
Seeing Value Seeing Value
0 0 v Inland Valleys
v Coastal Peaks
-+-' ( 1115 obs) -+-' (320 obs) c c
Q) Q)
0 0 I.... 0 I.... 0 Q)
N Q)
N 0... 0...
0 0
0 1 2 3 4 5 6 7 8 9 0 1 2 3 4 5 6 7 8 9
Seeing Value Seeing Value
0 v Inland Peaks
-+-' (1632 obs) c Q)
0 I.... 0 Q)
0... N
0 1 2 3 4 5 6 7 8 9
Seeing Value
Fig. 6. Seeing data from various kinds of sites compared. The shore and mountain lakes are about one seeing step better than the mountains.
Correction added in proof: Inland Valleys had zero '9's'; Coastal Peaks had only 9% '5's', and Inland Peaks had only 14 % '5's'.
© Kluwer Academic Publishers • Provided by the NASA Astrophysics Data System

1988SoPh..115..183Z
196 H. ZIRIN AND JAMES M. MOSHER
represent a compromise between the stable atmospheric conditions of the sea-level plain and the decreased air mass above mountains.
The Los Angeles basin, with its strong inversion, showed good seeing but poor transparency. The excellent seeing and low transparency in Pasadena illustrates how the strong inversion due to the cold ocean produces a stable atmosphere in the coastal plain. The seeing was somewhat worse at Briar Summit, a low hill in this plain, or San Fernando Reservoir, a site in the plain with less inversion. All the mountains without lakes were inferior, and the seashore and off-shore islands are not particularly good either. The various lakes gave stable thermal conditions and smooth wind flow, but the mountain lakes could not completely avoid the turbulence which occurs as the air tumbles over the mountain ranges. The islands, which had originally appeared to be good, showed generally mediocre results, and the seashore showed only average seeing, with considerable clouds and fog, as well as severe corrosion of instruments.
The daily seeing pattern is a good key to local conditions at various sites. Dry mountain sites, where seeing is good in the morning and then declines during the day, are clearly under the influence of daily convection and to be rejected. Although one can improve matters a bit by building a high tower, most of the peaks are kilometers high, and towers even a hundred meters high would be small compared to the scale of airflow over the peak. Sites with the best seeing at noon are not being influenced by local heating and probably are good.
The best season for solar observing should be the summer, when the Sun is highest. Sites in parts of Asia as well as the southwestern United States suffer particularly from cloudiness associated with a summer monsoon, which wipes out what would otherwise be the best observing. In Southern California the summer monsoon is weaker and variable; in one year out of two it hardly occurs, while in others one can lose many days in August. It is important to locate at sites with clear weather in the summer months.
5. Final Site Selection and Subsequent Experience
There are always practical considerations associated with the final site selection; we live in a real world. Sacramento Peak was chosen near a supporting Air Force base, and Kitt Peak had a powerful senator from Arizona. In our case, we had to choose a site where we could obtain land and build an observatory without constructing a road or expensive facilities.
Lake Arrowhead, which had given good results, was eliminated because of the high cost of land and smog levels higher than Big Bear. The best and final sites were Caltech, Big Bear Lake, and Lake Elsinore, each of which had distinct advantages as sites for a solar observatory. They had the following characteristics:
Caltech: Located at the base of the San Gabriel Mountains on the plain of the Los Angeles basin. Observations were made from various places, mostly the playing fields south of the campus.
Big Bear Lake: An artificial lake in the San Bernardino Mtns. 100 km (160 km by road) east of Pasadena. At that time there was a serious problem of dropping lake level
© Kluwer Academic Publishers • Provided by the NASA Astrophysics Data System
1988SoPh..115..183Z
THE CALTECH SOLAR SITE SURVEY, 1965-1967 197
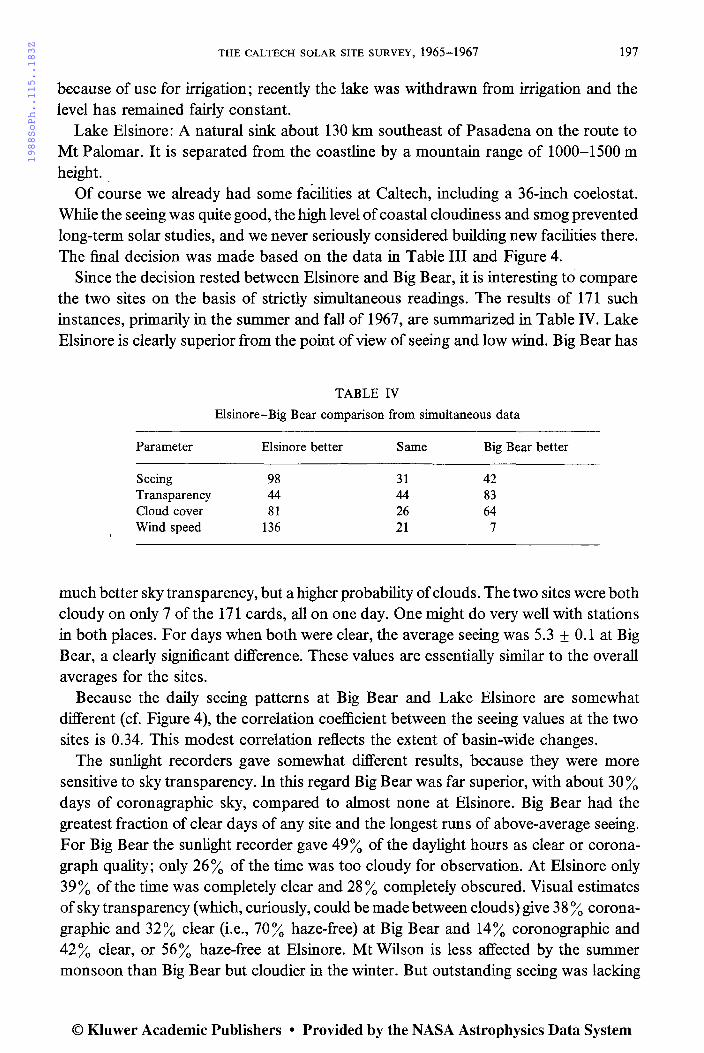
because of use for irrigation; recently the lake was withdrawn from irrigation and the level has remained fairly constant.
Lake Elsinore: A natural sink about 130 km southeast of Pasadena on the route to Mt Palomar. It is separated from the coastline by a mountain range of 1000-1500 m height. _
Of course we already had some facilities at Caltech, including a 36-inch coelostat. While the seeing was quite good, the high level of coastal cloudiness and smog prevented long-term solar studies, and we never seriously considered building new facilities there. The final decision was made based on the data in Table III and Figure 4.
Since the decision rested between Elsinore and Big Bear, it is interesting to compare the two sites on the basis of strictly simultaneous readings. The results of 171 such instances, primarily in the summer and fall of 1967, are summarized in Table IV. Lake Elsinore is clearly superior from the point of view of seeing and low wind. Big Bear has
TABLE IV
Elsinore-Big Bear comparison from simultaneous data
Parameter Elsinore better Same Big Bear better
Seeing 98 31 42 Transparency 44 44 83 Cloud cover 81 26 64 Wind speed 136 21 7
much better sky transparency, but a higher probability of clouds. The two sites were both cloudy on only 7 of the 171 cards, all on one day. One might do very well with stations in both places. For days when both were clear, the average seeing was 5.3 ± 0.1 at Big Bear, a clearly significant difference. These values are essentially similar to the overall averages for the sites.
Because the daily seeing patterns at Big Bear and Lake Elsinore are somewhat different (cf. Figure 4 ), the correlation coefficient between the seeing values at the two sites is 0.34. This modest correlation reflects the extent of basin-wide changes.
The sunlight recorders gave somewhat different results, because they were more sensitive to sky transparency. In this regard Big Bear was far superior, with about 30% days of coronagraphic sky, compared to almost none at Elsinore. Big Bear had the greatest fraction of clear days of any site and the longest runs of above-average seeing. For Big Bear the sunlight recorder gave 49% of the daylight hours as clear or coronagraph quality; only 26 % of the time was too cloudy for observation. At Elsinore only 39% of the time was completely clear and 28% completely obscured. Visual estimates of sky transparency (which, curiously, could be made between clouds) give 3 8 % coronagraphic and 32% clear (i.e., 70% haze-free) at Big Bear and 14% coronographic and 42% clear, or 56% haze-free at Elsinore. Mt Wilson is less affected by the summer monsoon than Big Bear but cloudier in the winter. But outstanding seeing was lacking
© Kluwer Academic Publishers • Provided by the NASA Astrophysics Data System

1988SoPh..115..183Z 198 H. ZIRIN AND JAMES M. MOSHER
at Big Bear. The chance of finding seeing 7 or better was 19% at Lake Elsinore and only 2 % at Big Bear; the chance of seeing 5 or better was 60 % at Elsinore and 53 % at Big Bear.
The broad-band Ha movies taken with the Carroll spar showed results similar to our visual data: the 14 films made at Elsinore were spectacular in the morning, the 12 made at Big Bear were good all day but suffered from wind shake. Observations obtained at Caltech (six days), Mt Wilson (two days), and Mt Pinos (one day) were poorer. All of the photographic seeing data correlated with simultaneous visual estimates. Exceptional frames were obtained on eight of the days at Elsinore and two of the days at Big Bear.
An important consideration at the time was the fact that the water levels at both Big Bear and Elsinore tended to fluctuate widely with rainfall. At the time of the survey both lakes were low, although Big Bear was higher than it had been for many years, recovering from an extended drought. Big Bear was subject to substantial withdrawals for irrigation. The water level in Lake Elsinore was being artificially maintained from deep wells. We had to locate far enough out in either to avoid being left high and dry as the lake levels fell, and build a substructure sufficient to raise the base of the observatory above the flood level. We knew that the dam fixed the maximum level of Big Bear Lake only four meters above the island we leased, but we could not determine the possible top of Elsinore (it was at least 10 m above the shoreline in 1966-1967). Severe flooding in 1980 confirmed our fears. Since then Big Bear is no lon~er used for irrigation and has remained full; Elsinore has fluctuated wildly, flooding and drying out. Record rainfall filled Big Bear Lake shortly after major construction was completed, and the dome and telescope were completed from boats; since then a causeway has been built. The lake is no longer used for irrigation and has remained nearly full.
Another problem was stability of construction. Big Bear Lake is artificial; the bottom is stable normal ground and the observatory could be constructed on a simple pad, about 250 m into the lake. Lake Elsinore is a natural sink with a deep layer of silt; construction of an observatory in the lake would be difficult and expensive. Both sites offered good access and infrastructure, including schools, shops, housing and services, and land was available at moderate or no cost. Earthquakes are a constant nuisance at both places.
The dominant considerations in our final decision were the possibility of coronagraph observations at Big Bear (which we have never made) and the difficulties of constructing a tower in Lake Elsinore, as well as the possibility that its level might rise greatly. At the end of 1967 the decision to locate at Big Bear was made, the observatory was built in 1968-1969 and has given excellent results since. Since Big Bear was not even included in the site survey until the middle of 1966, we were not confirming a preconceived idea.
Although the site survey estimated the seeing at Big Bear as good, but rarely excellent, outstanding data were obtained from the very first days of observation in 1969 (Zirin, 1971) and have continued over the years. The best frame in Figure 2 exhibits a resolution typical of many days at Big Bear, yet the site received very few 7 or 8 ratings. Placing the observatory on a tower in the middle of the lake obviously made a major improvement over the data acquired near the trees on the shore. Most of the survey data had been obtained at Moon Camp, a wooded point about 1 km to the west. It is possible
© Kluwer Academic Publishers • Provided by the NASA Astrophysics Data System

1988SoPh..115..183Z
THE CALTECH SOLAR SITE SURVEY, 1965-1967 199
that the forest barrier at the lake edge made the seeing there inferior to that out in the lake.
Mosher examined the seeing visually on the lake shore, where the original measures were made, on the island where the observatory is located 250 m from the shore and from the floor of the dome, 10 m above the lake. He found that the seeing on the island was considerably better than on the shore, about one full point on the seeing scale. In the dome the seeing was about a half point lower. The wall of trees at the shoreline stops the wind and generates turbulence, and the dome has sources of heat as well as turbulent flow when the wind flows past it. The installation of larger exhaust fans has remedied this somewhat, but obviously the best solution is the large domeless and wind-proof tower of the Sacramento Peak style.
We evaluated 41 film test strips from Big Bear from random seasons and times and classified them on the scale of Figure 1. The average value was 5.3 ± 1.5, about one step higher than the average values from the site survey. One can also compare the photographic data obtained in 1968 when the 25 cm telescope was operated on the roof of the Robinson Laboratory at Caltech with the 1969-1970 data at Big Bear. The latter were _significantly better, although some of the difference is due to improved technique. It is possible that the higher sky transparency plays a more important role in cinematography than visual estimates indicate.
The results from Lake Elsinore were so good that we think it merits further investigation by those interested exclusively in the best seeing for shorter periods. Although it would be quite expensive to build far into the lake, a moveable telescope could follow the shoreline as it goes up and down. Because of the low wind, a dome is not required, and it is possible that the seeing would be even better if one could go out into the lake.
5.1. IMPORTANCE OF SITES OVERLOOKING WATER
The Caltech Site Survey clearly established that lakes are very good for solar observation, and that mountain lakes negate the general bad convective effects in mountains and provide a combination of good seeing and clear skies. The idea that water was associated with better seeing had long been a part of the mythology of solar physics, with various reports of excellent seeing from coral atolls and P & 0 steamers. Quantitative support for this idea came for the first time with the site survey conducted by the Aerospace Corp. (Mayfield et al., 1964, 1969) which found the Upper Van Norman Reservoir to be a superior site and led to the establishment of the San Fernando Observatory there.
Since the establishment of BBSO, other surveys (Gaizauskas and Kryworuchko, 1973; Shi et al., 1976) led to the establishment of the Ottawa River and Huairou solar observatories on inland bodies of water; particularly good results have been obtained at Ottawa and also at Udaipur, which is situated on an island in a lake. Measurements of wind velocity around Lake Elsinore showed that there is a general subsidence of air above the lake and a general outward flow of air from the lake on its shores. This is only partly true of Big Bear Lake, where there is a rather steady westerly wind. The observers actually waded out into Lake Elsinore, which is relatively shallow, and made
© Kluwer Academic Publishers • Provided by the NASA Astrophysics Data System

1988SoPh..115..183Z 200 H. ZIRIN AND JAMES M. MOSHER
observations from some distance into the lake, but it was difficult to hold the telescope. Since we could not go far into the lakes, we made the opposite experiment of comparative observations at some distance inland from the lake shore. In all cases the seeing got worse as we increased the distance from the lake. The same was true with observations made from the south shore of Lake Elsinore where we looked over a path across land. Lorenz measured microthermals with two towers at Big Bear, one further from the lake. He found the landward tower showed more fluctuation, but the difference disappeared when the strong afternoon breeze came up, blowing in from the lake.
The importance of the water at sites like Big Bear and Elsinore was reaffirmed by the subsequent observation of deteriorated conditions at the Aerospace San Fernando Observatory after the reservoir surrounding the latter site had to be drained in the aftermath of the February 9, 1971 Sylmar earthquake (Chapman, 1986). The good performance of lakes appears due to lack of local heating and convection, laminar flow of the wind over the smooth surf ace, and, when the lake is cool, a negative Bowen ratio f3 reducing the effect of microthermals.
We were suprised at the mediocre performance of the seashore and island sites. It may result from local turbulence associated with the sea-land boundary; besides, severe corrosion and cloudiness ruled them out as practical sites. Moreover, the Friehe et al.
(1975) data suggest that at times in the Southern California daytime marine environment, the effect of humidity fluctuations may enhance, rather than cancel, the effects of temperature fluctuations on the refractive index.
6. Lessons Applicable to Future Site Surveys
We found that there is neither Zauberberg nor Zaubersee. Even the best sites had shortcomings and could be worse than the worst on occasion. They only look good compared to the places people have built solar observatories in the past. The fact that the two final sites had quite different advantages suggests that the idea of building one big telescope at a single site might give way to building smaller, more specialized instruments at several sites. This is particularly true because experience has shown that our 65 cm telescope, for example, only rarely shows diffraction-limited performance.
We were fortunate in that a wide range of topography in the generally fine Southern California climate was easily accessible, we had plenty of time, and the final choice was entirely up to us. While there are still some doubts as to the objectiveness of the visual estimates, the data compares well with photographic estimates from Rye Canyon, and we found two good sites. The availability of videotape and small CCD cameras might make it easier to carry out a more objective survey today.
While we could not distinguish well the resolution levels above seven, we could use image motion to infer them. In any event the number of observations of such excellent seeing were so few that its existence was the only important parameter. We should have utilized the Rye Canyon observations more as a baseline for comparison.
We started our survey expecting seashore peaks to be the best, and ended with two unexpected locations. This emphasizes the importance of comprehensive and objective
© Kluwer Academic Publishers • Provided by the NASA Astrophysics Data System

1988SoPh..115..183Z
THE CALTECH SOLAR SITE SURVEY, 1965-1967 201
site surveys. While the benefits of observing over water seem logical, there were enough unexpected results that one should test every possible topography and make many measurements. Because of the difficulty of measuring the water vapor gradient, one should give priority to measurements of actual solar images over surrogates.
Acknowledgements
The site survey would not have been possible without the hard work and energy of Ernest Lorenz and John Cowley, two men of unbelievable skill and resourcefulness. Both played important roles ip._ the subsequent construction and operation of the observatory. Sue Werner (now Dr Susan Kieffer of the U.S. Geological Survey) played a key role in getting the survey underway. The concept of the survey, the management and organization were all due to R. B. Leighton. The survey was supported by the Office of Naval Research, and we were particularly indebted to Mr Ben Cagle of that office for all sorts of logistic support.
References
Carroll, G. C.: 1970, Sky and Telesc. 40, 10. Chapman, G. A.: 1986, private communication. Coulman, C. E.: 1969, Solar Phys. 7, 122. Coulman, C. E.: 1980, Boundary-Layer Meteorol. 19, 403. Coulman, C. E.: 1985, Ann. Rev. Astron. Astrophys. 23, 19.
Friehe, C. A., LaRue, J.C., Champagne, F. H., Gibson, C.H., and Dreyer, G. F.: 1975, J. Opt. Soc. Am. 65, 1502.
Gaizauskas, V. and Kryworuchko, A.: 1973, J. Roy. Astron. Soc. Can. 67, 217. Hale, G. E.: 1905, Astrophys. J. 21, 124. Hussey, W. J.: 1903, Rpt. of the Comm. on Southern and Solar Observatories, Washington D.C.: Carnegie Inst. K.iepenheuer, K. 0.: 1963, !AU Symp. 19, 193. K.iepenheuer, K. 0.: 1974, in R. G. Athay (ed.), 'Chromospheric Fine Structure', !AU Symp. 56, 27. Mayfield, E. B., Rogers, E. H., and Vrabec, D.: 1964, Aerospace Corp. Report, ATR-65 (8102)-1. Mayfield, E. B., Vrabec, D., Rogers, E. Janssens, T., and Becker, R. A.: 1969, Sky Telesc. 37, 208. Shi, Z.-X., Ai, G.-X., Chen, C.-Y., Zhang, S.-L., and Wang, J.-M.: 1976, Acta Astron. Sinica 17, 193. Wesely, M. L.: 1976a, J. Appl. Meteorol. 15, 43. Wesely, M. L.: 1976b, J. Appl. Meteorol. 15, 1177. Wesely, M. L. and Derzko, Z. I.: 1975, Applied Optics 14, 847. Wesely, M. L. and Alcaraz, E. C.: 1973, J. Geophys. Res. 78, 6224. Wesely, M. L. and Hicks, B. B.: 1978, J. Appl. Meteorol. 17, 123. Zirin, H.: 1970, Sky Te/esc. 39, 215. Zirin, H.: 1971, Solar Phys. 20, 248.
© Kluwer Academic Publishers • Provided by the NASA Astrophysics Data System

![Gohisca [1967] - Internet Archive](https://static.fdokumen.com/doc/165x107/6337f08d1ef10984f505036d/gohisca-1967-internet-archive.jpg)