The C-OAR-SE procedure for scale development in marketing
63
University of Wollongong Research Online Faculty of Business - Papers Faculty of Business 2002 e C-OAR-SE procedure for scale development in marketing John R. Rossiter University of Wollongong, [email protected] Research Online is the open access institutional repository for the University of Wollongong. For further information contact the UOW Library: [email protected] Publication Details Rossiter, J. R. (2002). e C-OAR-SE procedure for scale development in marketing. International Journal of Research in Marketing, 19 (4), 305-335.
-
Upload
khangminh22 -
Category
Documents
-
view
0 -
download
0
Transcript of The C-OAR-SE procedure for scale development in marketing

University of WollongongResearch Online
Faculty of Business - Papers Faculty of Business
2002
The C-OAR-SE procedure for scale developmentin marketingJohn R. RossiterUniversity of Wollongong, [email protected]
Research Online is the open access institutional repository for theUniversity of Wollongong. For further information contact the UOWLibrary: [email protected]
Publication DetailsRossiter, J. R. (2002). The C-OAR-SE procedure for scale development in marketing. International Journal of Research in Marketing,19 (4), 305-335.

The C-OAR-SE procedure for scale development in marketing
AbstractConstruct definition, Object classification, Attribute classification, Rater identification, Scale formation, andEnumeration and reporting (C-OAR-SE) is proposed as a new procedure for the development of scales tomeasure marketing constructs. COAR- SE is based on content validity, established by expert agreement afterpre-interviews with target raters. In C-OAR-SE, constructs are defined in terms of Object, Attribute, andRater Entity. The Object classification and Attribute classification steps in C-OAR-SE produce a framework(six types of scales) indicating when to use single-item vs. multiple-item scales and, for multiple-item scales,when to use an index of essential items rather than selecting unidimensional items with a high coefficientalpha. The Rater Entity type largely determines reliability, which is a precision-of-score estimate for aparticular application of the scale.
Keywordsdevelopment, marketing, c, se, oar, scale, procedure
DisciplinesBusiness
Publication DetailsRossiter, J. R. (2002). The C-OAR-SE procedure for scale development in marketing. International Journal ofResearch in Marketing, 19 (4), 305-335.
This journal article is available at Research Online: http://ro.uow.edu.au/buspapers/196
The C-OAR-SE procedure for scale development in marketing
John R Rossiter
• School of Management, Marketing and Employment Relations, University of Wollongong,
Northfields Avenue, Wollongong NSW 2522, Australia
• Department of Marketing Management, Rotterdam School of Management, Erasmus University,
P.O. Box 1738, 3000 DR Rotterdam, The Netherlands
Abstract
Construct definition, Object classification, Attribute classification, Rater identification, Scale formation, and
Enumeration and reporting (C-OAR-SE) is proposed as a new procedure for the development of scales to
measure marketing constructs. C-OAR-SE is based on content validity, established by expert agreement
after pre-interviews with target raters. In C-OAR-SE, constructs are defined in terms of Object, Attribute,
and Rater Entity. The Object classification and Attribute classification steps in C-OAR-SE produce a
framework (six types of scales) indicating when to use single-item vs. multiple-item scales and, for multiple-
item scales, when to use an index of essential items rather than selecting unidimensional items with a high
coefficient alpha. The Rater Entity type largely determines reliability, which is a precision-of-score estimate
for a particular application of the scale.
Keywords: Construct definition; Validity of measures; Multiple-item indexes; Multiple-item scales; Single-
item scales; Reliability of scores

1. Introduction
This article proposes a new procedure for scale development—that is, the generation and selection of items
to form a scale to measure a construct. It is illustrated here for constructs commonly used in marketing,
although it is applicable within any of the social sciences. The new procedure is acronymically summarized
as C-OAR-SE:1 Construct definition, Object classification, Attribute classification, Rater identification,
Scale formation, and Enumeration and reporting. These are the six steps needed to develop a proper measure
of any construct. The C-OAR-SE procedure draws, in part, on the previous work of McGuire (1989) on the
conceptualization of constructs, and Blalock (1964), Bollen and Lennox (1991), Cohen, Cohen, Teresi,
Marchi, and Velez (1990), Edwards and Bagozzi (2000), Fornell and Bookstein (1982), and Law and Wong
(1999), among others, on attribute classification. The total procedure, though, is new.
A new scale development procedure is needed in marketing. Traditionally, the development of marketing
scales has followed the specific procedure advocated by Churchill (1979) but, in the present article, the
traditional procedure is shown to be only a subset (one cell of six cells) of the C-OAR-SE procedure. Almost
universal use of the traditional procedure, with its strict emphasis on factor analysis and internal-consistency
reliability (coefficient alpha), which in recent years has been encouraged by structural equations modeling
Bagozzi, 1994, Cohen et al., 1990 and Steenkamp & van Trijp, 1991, has led to some anomalous results in
scale development in marketing. These include the deletion of conceptually necessary items in the pursuit of
factorial unidimensionality (e.g., in SERVQUAL, Parasuraman, Zeithaml, & Berry, 1988, and in the Market
Orientation scale, Narver & Slater, 1990), the addition of unnecessary and often conceptually inappropriate
items to obtain a high alpha (e.g., in Taylor & Baker's, 1994 measure, and many others' measures, of
purchase intention), and the use of high alphas as the solitary evidence for scale validity (slightly more than
one in 10 of the scales in Bearden, Netemeyer, & Mobley's, 1993, well-known Handbook of Marketing
Scales do this, and the practice is commonplace for invented scales in journal articles). Examples of such
problems in widely used scales will be given, together with the scaling alternatives that C-OAR-SE would
recommend in their place.

The article is structured in two parts. In the first and main part, the six steps of C-OAR-SE (see Fig. 1) are
defined and the procedure for each step is explained, with examples. The second part addresses convention
and shows why construct validity and predictive validity are inappropriate for scale evaluation, and why
reliability should be regarded only as a precision-of-score estimate for a particular application.

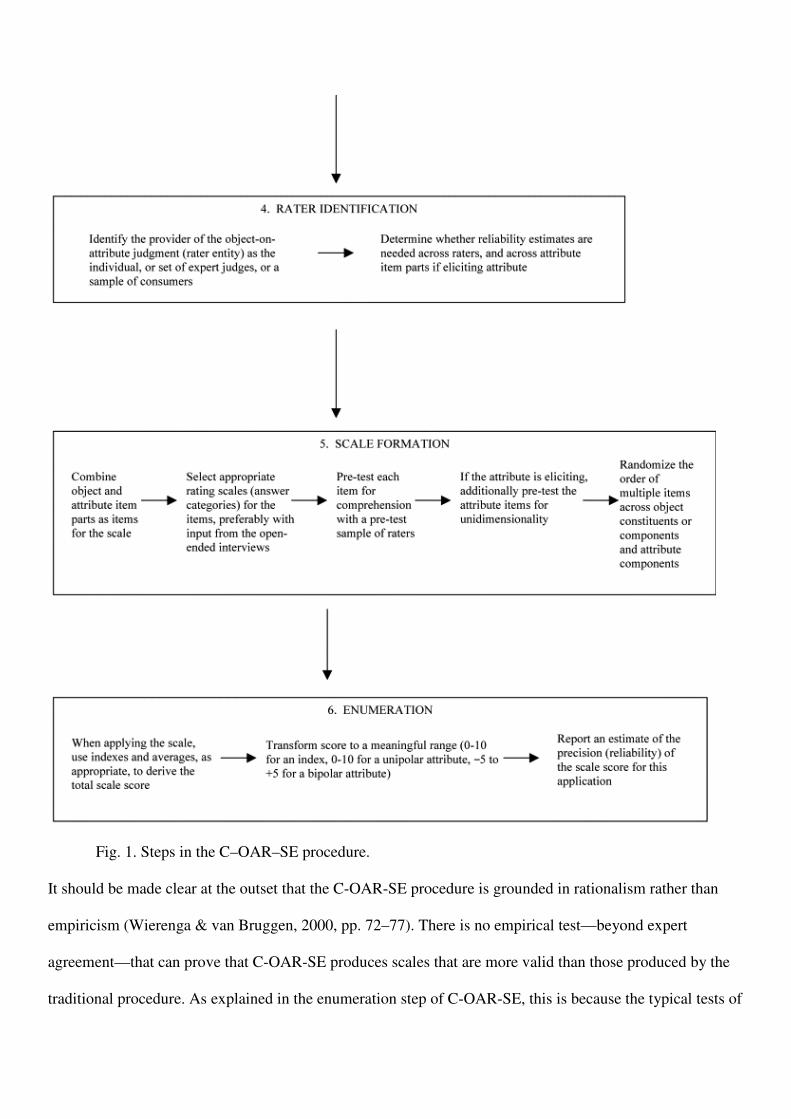
Fig. 1. Steps in the C–OAR–SE procedure.
It should be made clear at the outset that the C-OAR-SE procedure is grounded in rationalism rather than
empiricism (Wierenga & van Bruggen, 2000, pp. 72–77). There is no empirical test—beyond expert
agreement—that can prove that C-OAR-SE produces scales that are more valid than those produced by the
traditional procedure. As explained in the enumeration step of C-OAR-SE, this is because the typical tests of

construct validity, notably multitrait–multimethod (MTMM) analysis, and reliability, notably factor analysis
and coefficient alpha computation, all presume the theory underlying the traditional procedure, namely
domain sampling theory, to be the true state of nature. Nor is predictive validity an appropriate test, because
maximizing prediction usually reduces the validity of the measure. C-OAR-SE instead relies on logical
arguments, and the concurrence of experts, based usually on open-ended input from pre-interviews with
raters.
In C-OAR-SE, there is only one type of validity that is essential: content validity. Content validity is an
“appeal to reason,” conducted before the scale is developed, that the items will properly represent the
construct (Nunnally, 1978,2 p. 93). Content validity should not be confused with “face” validity (for
instance, Bearden et al., 1993 equate the two in their Handbook, p. 3). Face validity is a post hoc claim that
the items in the scale measure the construct (Nunnally, 1978, p. 111) and it is inadequate because you only
see the items that were included and have to infer what may have been omitted and why. In C-OAR-SE, it is
impossible to assert content validation, let alone face validation, without first having a comprehensive
definition of what the “construct” is. C-OAR-SE provides the framework—the OAR framework—for
construct definition.
2. C-OAR-SE: theory
2.1. Construct definition
A construct is “a conceptual term used to describe a phenomenon of theoretical interest” (Edwards &
Bagozzi, 2000, pp. 156–157).3 C-OAR-SE theory requires that constructs be conceptually defined
(described) in terms of (1) the object, including its constituents or components, (2) the attribute, including its
components, and (3) the rater entity. Failing this, the conceptual definition of the construct will be
inadequate for indicating how the construct should be (operationally) measured. Following a framework
suggested in McGuire (1989), all constructs can be conceptualized in terms of a focal object (hereafter
called “object,” be it physical or perceptual) and a dimension of judgment (or “attribute”); to these C-OAR-
SE adds a third term, the judges or rater(s) (or “rater entity”). (In the notation introduced in the present

article, objects, attributes, and rater entities will be written in capitals. An initial capital will be used to
denote constituents and components of objects and components of attributes. Scale items will be written in
quotation marks.) In the eyes of many, SERVICE QUALITY would be a construct, but C-OAR-SE sees this
only as an attribute. One cannot conceive of SERVICE QUALITY in the abstract; it has to have a focal
object, such as SERVICE QUALITY IN AMERICA, or IBM's SERVICE QUALITY. Furthermore,
according to C-OAR-SE, the construct has to specify a rater entity. IBM's SERVICE QUALITY AS
PERCEIVED BY IBM's MANAGERS is a different “phenomenon of theoretical interest” than IBM's
SERVICE QUALITY AS PERCEIVED BY INDUSTRY EXPERTS, or IBM's SERVICE QUALITY AS
PERCEIVED BY CUSTOMERS. To give another example, in measuring ostensibly the “same” construct of
the COMPANY's MARKET ORIENTATION, Kohli, Jaworski, and Kumar (1993) used as rater entities
SENIOR MARKETING EXECUTIVES and separately SENIOR NON-MARKETING EXECUTIVES,
Slater and Narver (1994) used SBU MANAGEMENT TEAMS, and Sigauw, Brown, and Widing (1994)
used SALESPEOPLE. With the different rater entities' perspectives, these constructs are not the same and
should not be so loosely described. The conceptual definition of the construct should specify the object, the
attribute, and the rater entity.
There are some examples of conceptual definitions of constructs in marketing that do follow this O-A-R
structure but most do not. The contrast is seen in a pair of examples. Zaichkowsky (1994) defined
INVOLVEMENT, the construct for her PERSONAL INVOLVEMENT INVENTORY, as “[a] person's
perceived relevance of the advertisement” (p. 61). This definition is basically adequate because it specifies
the object, the ADVERTISEMENT, the attribute, PERSONAL RELEVANCE, and the rater, a PERSON,
that is, a consumer. PERSONAL RELEVANCE, though, is conceptualized by that author as a complex
attribute comprising a Cognitive component and an Affective component, in which case its components
should be included in the definition. Also, note that alternative perspectives could be specified for the rater,
such as that of the CREATIVE TEAM who produced the advertisement in the first place, which is the only
perspective provided on an ad's “relevance” when the ad is recommended to the client without consumer

pre-testing. Schlinger (1979), on the other hand, defined the construct underlying the VIEWER RESPONSE
PROFILE as “affective reactions to advertisements” (p. 37). This is not a satisfactory conceptual definition,
because, firstly, the object is actually a single ADVERTISEMENT at a time, not ADVERTISING in
general; secondly, AFFECTIVE REACTIONS is an attribute but does not describe what is actually
measured (the VRP includes not only affective reactions but also cognitive reactions such as “The
commercial was very realistic—that is, true to life”); and, thirdly, the rater entity is not specified, though
presumably it would be VIEWERS of the advertisement, that is, a consumer sample.
The basic set of questions to be answered when writing the conceptual definition of a construct, therefore, is:
What is the object and does it have constituents or components? What is the attribute and does it have
components? Who is the rater entity? (A glossary of technical terms used in C-OAR-SE is provided in Table
1.) A complete conceptual definition of the construct then allows the remaining five steps in the C-OAR-SE
procedure to be implemented to develop the measurement scale. In practice, as shown in Fig. 1 earlier, an
initial definition is made in terms of object, attribute, and rater entity, and then steps 2 and 3 need to be
carried out to arrive at a complete definition that includes, when necessary, object constituents or
components, and attribute components.
Table 1. C-OAR-SE glossary of terms
Constructs
Construct definition: A phenomenon of theoretical interest described in terms of (1) the
object, including its constituents or components, (2) the attribute, including its components,
and (3) the rater entity.
Object: Focal object being rated.
Constituents: Sub-objects that form the parts of an abstract collective object, denoting what
the object includes.
Components: Parts of an abstract formed object, a formed attribute, or an eliciting attribute,

comprising what the object or attribute means, denotatively, to raters.
Attribute: Dimension of judgment.
Rater entity: The judges or rater(s).
Types of objects
Concrete: Nearly everyone (of a sample of raters) describes the object identically.
Abstract: The object suggests somewhat different things to the sample of raters. These
different things will be the constituents or the components.
Concrete singular object: Concrete, with only one object to be rated (e.g., COKE).
Abstract collective object: Set of concrete singular objects that collectively form a higher-
level category in the opinion of experts (e.g., SOFT DRINKS). The superordinate category
object is abstract but its sub-objects are concrete singular objects for the rater(s).
Abstract formed object: Object that suggests somewhat different things to the sample of
raters (e.g., MARKETING, as perceived by the GENERAL PUBLIC). These different things
will be the components (e.g., Selling, Advertising, Promotional events). Components must
be concrete singular objects (e.g., Advertising is regarded by this rater entity as concrete
singular). Experts decide main defining components to be included in the measure of the
abstract formed object.
Types of attributes
Concrete: Nearly everyone (of a sample of raters) describes the attribute identically.
Abstract: The attribute suggests somewhat different things to the sample of raters. These
different things will be the components.
Formed: (Abstract) attribute in which the main components add to form the attribute (e.g.,
SOCIAL CLASS). The components must be concrete (e.g., Occupational prestige, Education

level, Income, Area-of-residence prestige). All main components must be included in the
scale (definitive items).
Second-order formed attribute: Very abstract formed attribute that has formed attributes as
components (e.g., MARKET ORIENTATION). All main second-order components (e.g.,
Customer orientation, Competitor orientation, Interfunctional coordination, Long-term focus,
Profitability) and all main first-order components (e.g., Understanding customer needs,
Measuring customer satisfaction), the latter concrete, must be included in the scale.
Eliciting: (Abstract) attribute that is an internal trait or state that has outward manifestations,
which are mental or physical activities, as components (e.g., INNOVATIVENESS). The
components must be concrete (e.g., Being the first to try new products, Not relying on others
for opinions, Taking chances). A sample of components is sufficient (indicator items). They
must be shown to be unidimensional by a coefficient β(Revelle, 1979) of approximately 0.7
and internally consistent by a coefficient α of approximately 0.8.
Second-order eliciting attribute: Very abstract eliciting attribute that has eliciting attributes
as components (e.g., INVOLVEMENT). All main second-order components must be
included in the scale (e.g., Cognitive involvement, Affective involvement) and these in turn
each has a sample of outward manifestations as components. Recommended β=0.7 and
α=0.8 for each of the eliciting attributes as second-order components and β=0.5 and α=0.7
for the combined scale.
Types of rater entities
Individual rater: Self, as in self-rating of a personal attribute when the object is oneself.
Group raters: Sample of consumers, industrial buyers, managers, salespersons, or employees.
Most often used to rate an external object (not oneself) on an attribute.
Expert raters: Small group of judges with expertise regarding the construct. Used to rate any

external object (including other individuals) on an attribute. Also used in the C-OAR-SE
procedure to make final selection of (ratify) constituents or components, from ratings by a
sample of individual raters or group raters, and to rate content saturation of items for an
eliciting attribute.
Scale formation
General: Putting together object item parts with attribute item parts to form scale items. For
multiple-item scales, randomize items over both the object and the attribute.
Item stem: The “question” part of an item.
Item leaves: The “answer” alternatives for an item.
Enumeration
General: The rule for deriving a score from the scale.
Single-item score: The rating from a single-item scale in which a concrete singular object is
rated on a concrete attribute.
Index: Multi-item score over items for an abstract collective object, abstract formed object,
or formed attribute. Sum, sometimes with constituent or component scores weighted; or
profile, usually with conjunctive cutpoints on the component scores.
Eliciting attribute scale average: Multi-item mean score across attribute items in a scale for
measuring an eliciting attribute. Sometimes the mean of multiplied scores, if pairs of
components are multiplicative.
Note also double indexes, and averages which are then indexed (see the six cells of C-OAR-
SE in Table 3).
Validity
Content validity: A priori evidence that the items are a good representation of the construct

(from expert judges). Content validity established per the C-OAR-SE procedure is sufficient
for use of the scale.
Face validity: Post hoc evidence of content validity. Inadequate because of omitted-items
bias.
Construct validity: In C-OAR-SE, construct validity is content validity, properly established.
Multitrait–multimethod (MTMM) evidence of construct validity is inconclusive and
therefore irrelevant.
Predictive validity: Dependent on previously established content validity. A close
approximation of the population correlation between the scale and the criterion is needed, not
a maximized correlation.
Nomological validity: Multivariate extension of predictive validity in which population
partial correlations should be approximated for the scale.
Reliability
Reliability: A precision-of-score estimate for a particular application of the scale. Estimation
formula depends on the attribute type and the rater entity type (see Table 4).
2.2. Object classification
The object part of the construct can be singular, collective of constituents, or have multiple components.
However, there is another dimension involved here, namely concrete-abstract. The alternative object
classifications are: concrete singular, abstract collective, and abstract formed.
2.2.1. Concrete singular object
Concrete singular objects represent the case that is usually assumed in the traditional scale development
procedure. It is assumed that virtually all raters know what the object is and that, for them, there is only one
object. For instance, in rating IBM's SERVICE QUALITY, it is assumed that the object, IBM, is described

similarly by all raters (which makes it concrete) and that it is singular (that is, a single overall company,
rather than, say, a set of geographic divisions or departmental divisions). In applying C-OAR-SE, a group of
expert judges is used to ratify the classification of the object. Their judgments, for other than simple cases,
are best preceded by open-ended interviews with a sample of target raters (see Schwarz, 1999, and see
Deshpandé & Zaltman, 1984, for an excellent application). If the group of experts agree that the object is
indeed concrete singular, then only one item (or, strictly speaking, one item part, because there is still the
attribute part of the item to be decided) will be needed to represent the object. IBM, for example, would be
represented by only one item part: “IBM.”
There is another type of object that also would be classified as concrete singular. This is when the object is
not a single object but is singular in the sense that it is a set of reasonably homogeneous objects. The object
COCA-COLA (the drink), for instance, includes canned, bottled, and soda fountain forms, as well as
different sizes of each, but the construct CONSUMERS' EVALUATION OF COKE, for instance, would
assume that the object, COKE, is homogeneous, and thus concrete singular. Naturally, the researcher might
have a more specific purpose, such as to gauge consumer evaluations of a new container type or size of
Coca-Cola, in which case the specific object would be defined accordingly and would be concrete singular.
2.2.2. Abstract collective object
Abstract collective objects are objects that are heterogeneous in the eyes of the raters, that is, they are seen
as separate constituents, but form a set at a higher categorical level in the eyes of the researcher.
CARBONATED SOFT DRINKS would be an example. The advisable procedure would be to identify the
main types of carbonated soft drinks, such as COLAS, NON-COLAS, and CARBONATED MINERAL
WATER, for the purpose of CONSUMERS' ratings, with an item (again, an item part) for each of these
constituents. Thereafter, the RESEARCHER will aggregate the ratings. For example, if the attribute of
interest is LIKING, by CONSUMERS as the rater entity, then three items would be needed: COLA
LIKING, NON-COLA LIKING, and CARBONATED MINERAL WATER LIKING. Ratings on these three
items would form an index scale, summed across objects, of consumers' liking of CARBONATED SOFT

DRINKS. The researcher might decide to weight the ratings by the relative consumption incidence of the
three objects in the collective set. Note that the unidimensionality of the object scale and its internal
consistency are not relevant. What counts is content; that is, whether the items (again, item parts) are a valid
constitution (are representative constituents) of the abstract collective object.
An important application of the abstract collective object classification is to the constructs that produce
treatments (manipulations) in experiments. Experimental treatments usually are represented by just one
object item. For instance, when investigating the effect of FEAR APPEALS, the fear treatment (more
correctly, the threat treatment) may be represented by just one ad. This ad is a sample from a larger
collection (population) of such ads and, no matter how large the sample size of participants, the effective
sample size of the object is n=1. Journal reviewers are quite familiar with this problem but it is not widely
recognized by researchers (Wells & Windschitl, 1999). The issue is one of stimulus generalizability and this
becomes clear by realizing that an experimental treatment is measuring a construct. In the example above,
the object is FEAR (THREAT) ADS, the attribute is FEAR, and the rater entity is the INDIVIDUAL (self-
ratings by the experimental participants). The object of the construct is an abstract collective object.
Defining the construct thoroughly with the O-A-R framework helps to make more obvious that an
experimental manipulation using one object from the collection is relying on that object being a highly
typical exemplar of the collection because it is, in effect, a single-item measure of the experimental
treatment. A multiple-item sample of representative constituents (a range of fear ads) would provide safer
generalization of the results.
2.2.3. Abstract formed object
Abstract formed objects arise when people's interpretations of the object differ, that is, they see the object as
having different components. Objects are noun concepts that create “chunks of perceptual experience”
(Medin, Lynch, & Solomon, 2000, p. 125). For abstract objects, this experience is relatively heterogeneous
across people (raters). CAPITALISM would be an example. Some might associate it strongly with a
component such as Free enterprise, others with Profit-seeking, and still others with Material acquisition.

Expert judges must ratify the main components of CAPITALISM, assisted by open-ended interviews with
target raters, and write an item part for each component.
An abstract formed object is not simply a collection of concrete objects and therefore it is not abstract
collective. An abstract formed object has components, whereas an abstract collective object has constituents.
An abstract formed object's item parts must answer the question, “What does it mean?,” whereas an abstract
collective object's item parts must answer the usually easier question, “What does it include?”
If abstract formed objects have components, then it follows that objects, and not just attributes, can be
“multicomponential,” which is a perspective not widely recognized in the marketing literature.4 The
components of an abstract formed object do not have to be unidimensional with regard to the attribute on
which they are to be rated. Indeed, in the CAPITALISM example, raters might endorse some components of
CAPITALISM but not others. This means that the pursuit of a “high alpha” across item parts is precisely the
wrong way to go, because it would result in the deletion of items that form part of the definition of the
object. Instead, the component items form an index.
In buyer behavior research, the constructs known as VALUES are an important example of abstract formed
objects that are typically “undermeasured,” producing results of doubtful validity. Most often, VALUES
have been measured using the Rokeach Value Survey, RVS (Rokeach, 1973), or the popular abbreviated
version, the List of Values, LOV (Kahle, 1983). The attribute is usually IMPORTANCE IN MY DAILY
LIFE and the rater is the INDIVIDUAL. The RVS and the LOV scales, quite incredibly, employ just one
item to represent the complex object of a VALUE. The RVS does provide a brief explanation of each object
(e.g., “PLEASURE…an enjoyable, leisurely life”; “A SENSE OF ACCOMPLISHMENT…lasting
contribution”) but raters do not rate any components, just the overall object. The LOV just uses a single
word or phrase, without explanation, and with no component ratings. Qualitative research using open-ended
discussion with consumers from different cultures suggests that the varying interpretations of these brief
descriptions of VALUES, as objects for rating, make the results from single-item measures virtually

meaningless (Chan, 2001). C-OAR-SE would insist on multiple items, representing the components of the
VALUE, which would greatly mitigate the problem.5
To summarize: Object classification, the second step in the C-OAR-SE scale development procedure,
involves a group of experts, usually assisted by open-ended interviews with target raters, classifying the
object of the construct as either concrete singular (which will then require just a single-item part), abstract
collective (multiple-item parts identifying the main constituents), or abstract formed (multiple-item parts
identifying the main components that make up the object's meaning). The latter two classifications mean,
when it comes to Enumeration and reporting, which is the last step in C-OAR-SE, that the object item parts
will require an index.
2.3. Attribute classification
The third step in C-OAR-SE is to classify the attribute in the construct, which is the dimension on which the
object is being judged. Attribute classification is usually the most difficult step in C-OAR-SE because the
classification of some attributes, such as the widely used attribute, ATTITUDE, as explained later, can differ
depending on the construct's role in the broader theory or model of which the construct is a member. Also,
attribute classification has the most radical implications for the way scales should be developed in
marketing. The three alternative attribute classifications are: concrete (singular), (abstract) formed, and
(abstract) eliciting. The parenthesized terms are accurate but redundant for attribute classifications, so the
brief terms concrete, formed, and eliciting will be used.
2.3.1. Concrete attribute
Many of the attributes that we measure in marketing are concrete. As with a concrete singular object, a
concrete attribute has virtually unanimous agreement by raters as to what it is, and they clearly understand
that there is only one, or holistically one, characteristic being referred to when the attribute is posed, as in a
questionnaire or interview, in the context of the to-be-rated object. Examples would be LIKABILITY (e.g.,
of an advertisement), QUALITY of a familiar or easy-to-judge object (e.g., of a branded product or service),
PRICE PERCEPTION (e.g., “inexpensive…expensive”), and BUYING INTENTION.

When an attribute is judged to be concrete, there is no need to use more than a single item (part) to measure
it in the scale. Drolet and Morrison (2001) show that the now almost standard practice of attempting to
measure a concrete attribute by inserting multiple items to “capture” it (and to satisfy journal requirements
for multi-item measures) not only leads to wasteful redundancy, but the additional items usually “drift off”
the original conceptually defined attribute and start picking up the substance of other attributes. The problem
here is not that the additional items help to reduce “random error,” as if respondents are not sure what they
are responding to, as implied by the oft-heard view that “single items are unreliable” (e.g., Churchill,
1979 and Nunnally, 1978). Rather, it is a validity problem. This loss of validity is untenable and cannot be
offset by appealing to a high alpha. Take the example of a three-item measure of BUYING INTENTION
used in a study by Taylor and Baker (1994), which is quite typical (answer scales omitted for the present
purpose):
(1) The next time I need the services of a _____, I will choose XYZ.
(2) If I had needed the services of a _____ during the past year, I would have selected XYZ.
(3) In the next year, if I need the services of a _____, I will select XYZ.
Consumer responses to these items are highly correlated, as might be expected, and produce a high alpha of
over 0.90. However, why the need for multiple items here? What were the researchers interested in
measuring? Item 1 refers to IMMEDIATE INTENTION. Item 2 refers to PAST INTENTION. Item 3 refers
to FUTURE INTENTION. These are different questions (managerially anyway). Here, high reliability
(internal consistency) is meaningless and combining the items produces lower validity. If the researchers
were simply interested in measuring BUYING INTENTION, then surely the first item alone was sufficient.
As practitioners have long demonstrated (e.g., Rossiter & Eagleson, 1994 and Urban & Hauser, 1993), for
measuring concrete attributes such as AD LIKABILITY or PURCHASE INTENT, single-item measures are
definitely valid. This, of course, presumes that an accurate description of the attribute is selected for the
“stem” of the rating question and that the “leaves” (the response categories) are similarly clear, concrete and,
unless nominal, are psychologically equal interval (see Section 2.5.2).
2.3.2. Formed attribute
Another attribute type consists of those that are abstract (raters' answers differ moderately if asked what the
characteristic is) and formed (the main things that it refers to, its components, add up to what the attribute
means). Formed attributes are complex and multicomponential, and the important realization is that
responses to the components cause the attribute, that is, they “make the attribute appear.” Other
measurement theorists Bagozzi, 1994, Blalock, 1964, Bollen & Lennox, 1991, Diamantopoulos &
Winklhofer, 2001, Fornell & Bookstein, 1982 and Law & Wong, 1999 have also identified this type of
attribute. The term “formed attribute” is preferred to “formative attribute.”6 The term “composite attribute”
has the right connotation but is deficient insofar as all multiple-item attribute scores are necessarily
composites. Also, these previous writers refer to the entire construct as formative, rather than, as here, to just
the attribute. In C-OAR-SE, the attribute part of the construct can be formed but the object part can be any
of the classifications of concrete singular, abstract collective, or abstract formed.
An example of an attribute that can be a formed attribute is SERVICE QUALITY. From one rating
viewpoint, adopted for familiar or simple services, SERVICE QUALITY is concrete. From another rating
viewpoint, whenever the rater has to “think about it” before answering, SERVICE QUALITY is the sum
total of a number of specific activities (ratings of these) that make up the overall performance of a particular
industry's service. They are what might be called proximal antecedents as distinct from more remote
causes.7 If the experts decide that the target raters are likely to make this summative type of judgment, then
SERVICE QUALITY is a formed attribute.
For a formed attribute, the components that make it up have a number of properties. First, the components
themselves are attributes; they are subsidiary attributes of the focal attribute. SERVICE QUALITY is
actually a second-order formed attribute in that its components (Reliability, Assurance, etc.) are also formed
attributes. The components of these components, that is, the first-order components, must be concrete,

otherwise they cannot be rated consistently (e.g., “On-time delivery” might be a first-order component of
Reliability). The goal is to develop one good item for each first-order component. The reasons for this are
exactly the same as for using a single item to measure a concrete attribute. Second, the formed attribute need
only include its main components rather than every possible component and this calls for expert judgment
aided by a reasonable cutoff for inclusion (the aim of using a census of components is not practically
possible, contrary to the advice of Bollen & Lennox, 1991, and Diamantopoulos & Winklhofer, 2001,
because it would lead to an infinite search for low-incidence components that most raters would not include
in the attribute concept). Suppose that 20 target raters are interviewed in an open-ended manner about the
attribute so that its components are identified. Expert judgment is needed to categorize distinct components
and then a reasonable rule of mention of the component by, say, at least one-third of the interviewees can be
applied to select “main components.” No sort of ratings and factor analysis should be used, because the
“perceived dimensionality” of the components is not relevant; all that is needed is a set of distinct
components as decided by expert judgment. Third, once decided, these main components must all be present
in the scale because the items representing them are the defining items for the attribute. In other words, a
formed attribute does not follow the domain sampling model. This means that items are not interchangeable,
that is, items cannot be added or deleted from the scale. Item selection to increase the “reliability” of the
formed scale is definitely not appropriate. Fourth, the formed attribute scale will not be unidimensional
(because the focal attribute is not) and thus factorial unity in factor analysis and internal consistency, as
indicated by coefficient alpha, are not relevant (the components, and thus the item scores, are likely to be
positively correlated but not highly correlated and the researcher should not try to achieve this). The scale
items simply form an index obtained by combining the item scores. These points have been made several
times over the last 35 years (see Bollen & Lennox, 1991 and Diamantopoulos & Winklhofer, 2001; and
especially Bagozzi, 1994) but the theory supporting formed attributes has not been very clear and the most
unfortunate result has been that few have correctly identified this attribute type.

There are many examples of marketing constructs whose attribute is a formed attribute but which, due to the
emphasis in traditional scale development on factor analysis and alpha, have attribute scales that are wrongly
constituted. These include among the classic scales, as should now be evident, SERVQUAL (Parasuraman
et al., 1988; see also Mittal & Lassar, 1996 and Smith, 1999), MARKET ORIENTATION (Narver & Slater,
1990), CUSTOMER ORIENTATION (Saxe & Weitz, 1982), and the VIEWER RESPONSE PROFILE
(Schlinger, 1979). All these attributes should have had their main components agreed on (often this was
done originally but then empirically altered by factor analysis), should have had one good item per first-
order component chosen (not done), and the item scores summed as an index (not done). New scales often
make the same errors, as a careful check of recent issues of the best marketing journals readily reveals. Even
Diamantopoulos and Winklhofer (2001), who strongly advocate the use of index measures for certain
attributes, although their decision rule for attribute classification is not very clear, make the error of using
statistical analysis to delete items from formed-attribute scales. On the other hand, an excellent example of
the right procedure for developing index items for attributes can be found in the well-known study about
marketing managers' use of market research, by Deshpandé and Zaltman (1984). The choice between—the
classification of—formed and eliciting attributes, the latter described below, is critically important. There is
little doubt that Deshpandé and Zaltman's model and conclusions would be quite different had they used the
conventional item-selection procedure, which assumes that all attributes are of the eliciting type. Law and
Wong (1999) provide another example in which JOB CHARACTERISTICS (AS PERCEIVED BY
EMPLOYEES) and LIKING OF SUPERVISOR are significant causes of JOB SATISFACTION when all
three constructs' attributes are measured in the conventional factor-analytic, item-deletion manner. However,
when all three constructs' attributes are measured as formed attributes, which is correct according to C-
OAR-SE, then only JOB CHARACTERISTICS is a significant cause.
The theoretical and practical implications of the attribute classification decision are major, as indeed they are
in general for construct definition.8
Bagozzi (1994, p. 334) says that formative indicators (formed attributes)

are only “occasionally useful” in marketing measures. To the contrary, formed attributes are probably the
prevalent type in marketing constructs.
2.3.3. Eliciting attribute
There is a third type of attribute in some marketing constructs that can be called an eliciting attribute. In this
third type, the attribute is abstract (raters' answers would differ moderately if asked what the characteristic
is) but in this case, the attribute is an “internal” trait or state (a disposition). This type of attribute, according
to its theoretical function, causes the responses to its measurement items (hence the attribute is “eliciting”).9
The items are indicative manifestations of the trait or state.
Note that SERVICE QUALITY, for example, is not of this type: there is not something “in” the brand of
service that “causes” Reliability, Assurance, Tangibles and other componential responses. Rather, it is the
other way round: they cause the judgment of overall service quality, and that attribute is therefore a formed
attribute. In contrast, it could be reasoned that SERVICE EMPHASIS, as company policy, a vendor trait, is
an eliciting attribute: it causes the performance of a host of service activities.
Relatively few marketing constructs have attributes that are eliciting, yet the traditional scale development
procedure assumes that all attributes are of this type. All constructs that have an eliciting attribute are traits,
such as NEED FOR COGNITION (Cacioppo & Petty, 1982) and STYLE OF PROCESSING (Childers,
Houston, & Heckler, 1985), or else are shorter-term states, such as PERCEIVED EFFICACY (Rogers,
1975) and PERSONAL INVOLVEMENT (Zaichkowsky, 1994). The theorists who developed the scales for
these constructs posited them as internal dispositions that cause the responses to the items. However,
perhaps due to the tendency to anthropomorphize companies and brands as having “personalities,” it is all
too easy to fall into a trait-like interpretation of nontrait attributes. Two notable examples are MARKET
ORIENTATION (Narver & Slater, 1990) and CUSTOMER ORIENTATION (Saxe & Weitz, 1982). In
neither case did the authors define these attributes as traits. Rather, they were conceptualized as a set of
activities that compose the attribute (see Narver & Slater, 1990 and Saxe & Weitz, 1982). As defined, these
are formed attributes, not eliciting attributes, and the unnecessary use of factor analysis and coefficient alpha

to select and delete items means that these scales are not as valid as they could be. Many other examples
could have been singled out (marketers have vastly over-used the eliciting attribute assumption to develop
scales, borrowed from individual-differences psychology). Really, these earlier scales should be redesigned,
and certainly future scales must not make this error when the attribute is not of the eliciting type.
Eliciting attributes can be unidimensional in a first-order factorial manner, or they may have components
(sometimes called facets) which are themselves unidimensional and are intercorrelated as a second-order
factor; that is, the component scores are unidimensional when they are factor analyzed (Nunnally, 1978, pp.
431–432). Sometimes, a component is used alone as the attribute of theoretical interest; for example,
QUANTITATIVE ABILITY (Lumsden, 1957). In other cases, a more complex eliciting attribute is of
interest; for example, GENERAL MENTAL ABILITY, of which Quantitative ability is a component, with
the other main component being Verbal ability. The components are elicited mainly by a unidimensional
second-order factor (Spearman's, 1904G factor). An example of a componential eliciting attribute in
marketing is PERSONAL INVOLVEMENT (Cognitive involvement and Affective involvement as
components; Zaichkowsky, 1994). Second-order eliciting attributes are not common in marketing. For
example, STYLE OF PROCESSING (Verbal style and Visual style as components; Childers et al., 1985)
does not qualify, because STYLE is not a second-order eliciting common cause. Rather, VERBAL STYLE
and VISUAL STYLE are independent eliciting (trait) attributes. Nor does PAD (Mehrabian & Russell,
1974); its components of Pleasure, Arousal, and Dominance are not correlated (they are orthogonal). Its
components are separate eliciting (state) attributes, PLEASURE, AROUSAL, and DOMINANCE.
Items to measure eliciting attributes should be written as a set of distinct activities, mental or physical, that,
as items, are concrete. Particularly to be warned against is the tendency for academic marketing researchers
simply to generate, as items, synonyms of the main verb, for example, “I enjoy thinking,” “I like thinking,”
“I prefer thinking,” or synonyms of the main adjective, for example, “Thinking is enjoyable,” “Thinking is
pleasant,” “Thinking is preferable.” The multiple-adjectives criticism may be made, for example, of
Zaichkowsky's PERSONAL INVOLVEMENT scale, with its two components of Cognitive involvement

and Affective involvement. Use of synonyms is not a valid substitute for developing items that refer to
related but distinct activities. Paraphrases were certainly not what scale development pioneers such as
Thurstone and Likert had in mind and this approach should not be used today. The right approach is
illustrated by the NEED FOR COGNITION scale, where the items represent distinct, mainly mental,
activities, such as “I really enjoy a task that involves coming up with new solutions to problems,” “I usually
end up deliberating about issues even when they do not affect me personally,” and “I prefer watching
educational to entertainment programs” (Cacioppo & Petty, 1982, pp. 120–121). The items may
alternatively be physical activities, as are most of the items measuring OPINION LEADERSHIP, which
King and Summers (1970) conceptualized as a consumer trait (“Talking about,” “Giving information,”
“Being asked,” are some of the physical activities in the scale).
For an eliciting attribute, the items represent its specific manifestations—its proximal consequences.
Because there are many of these, and more than enough to “capture” the trait and be sure what is being
measured, the items are interchangeable to the extent that a reasonable sample of the items will do, as
domain sampling theory is appropriate for this one type of attribute. The items for an eliciting attribute are
thus indicative rather than defining as for a formed attribute. Moreover, since it is one trait that should be
causing responses to the items (Lumsden, 1961), it is necessary to demonstrate that the item scores are
unidimensional. There must be enough items to make sure the attribute scale is sampling the trait adequately
(Lumsden, 1978). Practically, this means three to five items overall, or per component if the eliciting
attribute is second-order, but 30 or so items would be quite usual for clinical applications or educational or
job entry tests, where very precise scores for individuals are required.
Pursuing the admirable goal of conciseness, Mowen (2000) has shown that eight fundamental personality
traits, which extend the well-known “big five” traits, can be efficiently measured with just three to five, and
typically four, carefully chosen manifestation-type items (see also Burisch, 1997 and Paunonen, 1984).10
Coefficient alphas derived from his samples for these scales were about 0.8, which is ideal (much above that
for a short scale, the items are likely to be redundant). Similarly, Steenkamp and Baumgartner (1995) have

shown that a 7-item measure of CHANGE-SEEKING TENDENCY, which is rather like Mowen's (2000)
NEED FOR AROUSAL, is better (similar high alpha and no social desirability bias) than the 95-item
original scale and indications are that a 6-item scale (dropping their sixth item) would do as well. Contrast
these efforts with the NEED FOR COGNITION scale, for instance, which has 34 items or, in a later version
(Cacioppo, Petty, & Kao, 1984), 18 items, too many for survey research applications.11
It is obviously
important, if eliciting-attribute measures such as personality traits are going to be adopted by practitioners,
that brief multiple-item scales be developed for them. Not only this, but “overmeasurement” of a construct
can spuriously inflate its correlation with other constructs via what Feldman and Lynch (1988) term “self-
generated validity.”
One difficult construct that warrants discussion, because of its ubiquitous use in marketing and consumer
research, is ATTITUDE. Depending on how it is conceptualized as a construct, always with an object and a
rater entity, which we will not discuss here, the attribute, ATTITUDE, can be either formed, concrete, or
eliciting (perhaps this is not surprising given its multiple roles in social science, including consumer
behavior theory). ATTITUDE is usually defined as the rater's overall evaluation of an object (e.g., Calder &
Ross, 1973 and Fishbein & Ajzen, 1975). If the researcher is studying attitude formation, in which there is
as yet no overall attitude, then the ATTITUDE attribute is clearly a formed attribute—it is a composite of
the various object beliefs or perceptions, and associated feelings or affect, that the rater experiences during
attitude formation (see Bodur, Brinberg, & Coupey, 2000, for belief and affect compositional models of
attitude, and Rossiter & Percy, 1997, p. 123). Once an attitude is learned and established, most theories of
attitude functioning regard it as concrete—an “overall evaluation”—and thus measure it with a single-item
rating scale. However, another influential line of attitude theory (e.g., Bagozzi & Burnkrant, 1979, Breckler
& Wiggins, 1989, Edwards, 1990 and Millar & Millar, 1990; and see Ajzen, 2001) posits that objects almost
always evoke thoughts and feelings separately (cognitive reactions and affective reactions) and that
phenomenologically there is not an overall evaluation. In this dual-state view, the ATTITUDE attribute
would be eliciting (a second-order eliciting attribute), with the Cognitive and Affective components also

being eliciting. Note that unlike in the attitude formation situation, the two components' items, those
measuring Cognitive attitude and those measuring Affective attitude, would be expected to be respectively
unidimensional by factor analysis and the two components' scores moderately positively correlated for most
attitude objects.
To summarize: The attribute part of the construct is the most complex to classify and undoubtedly requires
experts' agreement. Attributes can be classified as concrete (requiring just a single-item part), formed
(multiple-item parts identifying the main components, its proximal antecedents), or eliciting (multiple-item
parts representing an adequate sample of its manifest proximal consequences). Attribute classification is the
most difficult step in C-OAR-SE and often will be the largest determinant of the way the construct is
measured. The discussion turns now to identification of the rater entity.
2.4. Rater identification
The fourth step in C-OAR-SE is the final part of the construct's definition, which is identification of the rater
entity. Constructs differ depending on whose perspective they represent. Objects' ratings on attributes cannot
be divorced from the perceiver (the rater). This was illustrated earlier with the example of IBM's SERVICE
QUALITY as perceived, respectively, by MANAGERS, by INDUSTRY EXPERTS, or by CUSTOMERS.
The rater entity is part of the construct.
There are three types of rater entity: individual, experts, and group (the last a potentially broad category
including, in marketing, samples of consumers, buyers, managers, salespersons, and employees). These rater
classifications are explained as follows.
The type of rater entity has fundamental implications for the way scale-score reliability is estimated. This
will be taken up in Section 4.
2.4.1. Individual rater
One type of rater entity is the individual. The rater entity is the INDIVIDUAL for all individual-difference
constructs that involve self-reports. Of course, individual differences may alternatively be rated by
EXPERTS or by PEERS, who are a special type of group-rater entity. However, individual self-reports are
the most prevalent type of rater entity for constructs in marketing (a meta-analysis by Peterson, 1997, of 259
studies in the major journals found that just over half of the scales employed in these studies were
“respondent-centered,” that is, they required respondents' self-ratings). For self-reports, the rater entity is the
INDIVIDUAL, the object is the SELF (if a trait) or the EXTERNAL STIMULUS (if a state),12
and the
attribute is the INDIVIDUAL-DIFFERENCE DISPOSITION of interest.
Examples of constructs (here named by the attribute only) for which the rater type is the individual include,
as previously discussed, INVOLVEMENT, ATTITUDE, OPINION LEADERSHIP, and NEED FOR
COGNITION.
2.4.2. Expert raters
Some constructs require expert raters—trained judges—to perform the ratings. The expert raters are
essentially conducting a content analysis, and thus reliability of the ratings depends on achieving high inter-
judge agreement. (C-OAR-SE classification done by experts for purpose of content validation is content
analysis.)
Expert ratings may be applied to ADS as the objects (e.g., Domzal & Kernan, 1993 and Rossiter, 1981), or
to PRODUCTS as the objects (e.g., the product ratings in Consumer Reports). Expert ratings also can be
applied to COMPANIES as the objects. For instance, Steinman, Deshpandé, and Farley (2000) measured
EMPLOYEES' ratings of various companies' MARKET ORIENTATION and also CUSTOMERS' ratings,
finding differences, and could have collected INDUSTRY EXPERTS' ratings to provide a more independent
assessment.
2.4.3. Group raters
The third possible classification for the rater entity of a construct is the group. The group, in marketing, is
usually a sample of consumers or industrial buyers, but sometimes a sample of managers, salespersons, or
general employees. These are other than a group of experts (above).
The object for group ratings is usually a COMPANY or a PRODUCT or an AD and the purpose of the
construct is to derive an attribute score for the object (in Peterson's, 1997 meta-analysis, about four in 10 of

the scales were “stimulus-centered,” that is, they were used to rate an object). The score is projected to or
“based on” the population of which the group is a sample. As we will see, the reliability (precision) of scores
depends mainly on the group sample size.
Examples in which the rater entity for the construct is the group would be SATISFACTION among
CUSTOMERS of McDONALD'S RESTAURANTS; or the QUALITY of IVORY SOAP as perceived by
the NON-USERS OF THE BRAND; or the VRP of a new INTEL AD among typical TV VIEWERS.
In summary: The rater entity is an intrinsic component of a marketing construct. The rater entity can be
identified as the individual, experts, or a group. The rater entity largely determines how reliability (precision
of scale scores) should be assessed and reported. Reliability is discussed in Section 4.
An overall summary of object–attribute–rater (O-A-R) types in C-OAR-SE can now be made. The
classifications for object, attribute, and rater entity are shown in Fig. 2. A prototype expert judges' rating
form is provided in Table 2.

The arrow at the top indicates that the object is “projected onto” the attribute. The two arrows from the rater entity
indicated the rater is perceiving both the object and the attribute.
Fig. 2. Object–attribute–rater entity classifications.

Table 2. O-A-R expert judges’ rating form
2.5. Scale formation
2.5.1. Object item parts and attribute item parts
Scale formation in C-OAR-SE is a matter of putting together object item parts with their corresponding
attribute item parts to form scale items
alternatives or leaves have also to be added
concrete singular object and it is to be rated on SERVICE QUALITY regarded as a formed attribute
consisting of eight components such as Response time, Reasonable hourly rate, Solution satisfactio
forth, each represented by one concrete item part, then eight items (1×8) would result. If alternatively IBM
were for some reason to be regarded as an abstract collective object with, say, three branch offices of IBM
available for a typical customer in a large city to call for service, then 24 items (3×8) would result. To give
another example, if CAPITALISM is regarded as an abstract formed object with three components of Free
enterprise, Profit seeking, and Material gain and these could each be r
R expert judges’ rating form
2.5.1. Object item parts and attribute item parts
SE is a matter of putting together object item parts with their corresponding
attribute item parts to form scale items—technically, to form the stems of the scale items, as the response
have also to be added for each item (see next section). For example, if IBM is the
concrete singular object and it is to be rated on SERVICE QUALITY regarded as a formed attribute
consisting of eight components such as Response time, Reasonable hourly rate, Solution satisfactio
forth, each represented by one concrete item part, then eight items (1×8) would result. If alternatively IBM
were for some reason to be regarded as an abstract collective object with, say, three branch offices of IBM
mer in a large city to call for service, then 24 items (3×8) would result. To give
another example, if CAPITALISM is regarded as an abstract formed object with three components of Free
enterprise, Profit seeking, and Material gain and these could each be represented by, say, three concrete
SE is a matter of putting together object item parts with their corresponding
of the scale items, as the response
for each item (see next section). For example, if IBM is the
concrete singular object and it is to be rated on SERVICE QUALITY regarded as a formed attribute
consisting of eight components such as Response time, Reasonable hourly rate, Solution satisfaction, and so
forth, each represented by one concrete item part, then eight items (1×8) would result. If alternatively IBM
were for some reason to be regarded as an abstract collective object with, say, three branch offices of IBM
mer in a large city to call for service, then 24 items (3×8) would result. To give
another example, if CAPITALISM is regarded as an abstract formed object with three components of Free
epresented by, say, three concrete

items (in the opinion of the expert judges) and the attributes are ECONOMIC DESIRABILITY and
SOCIAL DESIRABILITY and are regarded as concrete, then 18 items (3×3×2) would result.
The number of items needed to form the scale is the same regardless of whether the rater entity is an
individual, a panel of experts, or a larger group of target population raters. However, the content (wording)
of the scale items is certainly not independent of the rater entity. The items must be easily comprehended by
the target raters, and pre-testing is needed to ensure this.
2.5.2. Pre-testing scale items
The best method for pre-testing scale items is cognitive interviewing, which includes extensive probing and
think-aloud answers to the rating questions, and to the answer categories, to ensure they are understood as
intended (Schwarz, 1999). An excellent application of cognitive interviewing to improve scales is detailed in
the study by Bolton (1993), in which this method resulted in higher validity and reduced data collection
costs.
Nevertheless, the important step of pre-testing items for meaning is hardly ever conducted for marketing
scales in academic research. Instead, apparently lured by the classic “true score plus random error” model,
scale developers tend to write a half-dozen or so “good enough” items in the vain hope that responses to
them will “converge on the truth” when the item scores are averaged (a high single-factor loading and alpha
are then usually produced to “prove” this has happened). The perceived need for multiple items is often
supported by citing Churchill's (1979) viewpoint that “single items are unreliable.” However, Churchill's
viewpoint is borrowed from ability-test theory in psychology, where the items differ in difficulty and there is
within-person variation in ability to answer them (see Lumsden, 1978). For ability tests, a single item cannot
provide a precise (reliable) estimate of the individual's ability. This is not the case for marketing constructs.
Consumers do not require “ability,” other than basic literacy, to answer marketing scale items. The items do
not and should not differ in “difficulty.” For completely concrete constructs, one concrete item is all that is
necessary. For abstract constructs, one concrete item for each constituent or first-order component is all that
is necessary. The multiple items are used to cover the constituents or components parsimoniously. Multiple

items should never be used to cover up lack of pre-testing for concreteness. Practitioners are far less subject
to this criticism (Bolton, 1993, for instance, conducted her study as a practitioner for GTE Laboratories).
Cost considerations force parsimony on practitioners and they are more likely to pre-test questions and
rating scales to find an unambiguous, efficient solution.
There is an additional type of pre-testing required when the scale includes items measuring a newly
conceptualized eliciting attribute. The candidate set of items for the eliciting-attribute scale should first be
rated by the expert judges for prototypicality with respect to the attribute. Burisch (1997) describes the
purpose of this procedure as to produce “content saturation” of the scale. Webb, Green, and Brashear (2000)
provide a good application of the content saturation procedure for developing two new attitude scales.
As mentioned previously in the conceptual discussion of eliciting attributes, an eliciting attribute may be
first-order unidimensional or it may be second-order unidimensional with correlated, unidimensional
components. For a first-order eliciting-attribute scale, where the remaining items from content saturation
screening are likely to be 10 or fewer, it is convenient to go straight to the computation of coefficient beta
(Revelle, 1979; see also John & Roedder, 1981), which is a conservative test of whether there is one general
factor (one dimension) in the items.13
A minimum β of 0.5 is needed to infer that there is a general factor accounting for at least 50% of the item
variance. To improve on this minimum, coefficient alpha can usefully be applied to delete items with low
item-total correlations (e.g., SPSS, 1988). The desirable targets for an eliciting-attribute scale are a β of 0.7
(70% general factor) and an α of 0.8.
For a second-order eliciting attribute, beta should be computed for the items intended to measure each
component and the same values for β and α as above sought for each component. To check the structure of
the components in relation to the second-order attribute, confirmatory factor analysis can be usefully applied
to all the items—principal components with oblique rotation, not Varimax rotation as suggested by John and
Roedder (1981) as this would imply uncorrelated components. This will require a fairly large pre-test sample
of raters: a minimum of 20 raters for each factor, that is, component, to be extracted (Arrindell & van der

Ende, 1985). The factor structure should represent the conceptualized components. Component scores (not
item scores) can then be further beta-checked and β should be at least 0.5 for the total attribute scale,
indicating the second-order general factor underlying the components. Note that the β value here is lower
than the 0.7 minimum recommended for components because of the oblique structure. The α value for the
total score will undoubtedly be high and should be at least 0.7. The problem with omitting beta (or prior
confirmatory factor analysis) is that alpha can be high even if the components are zero-correlated, that is,
when there is no general factor (see also Cortina, 1993).
Beta (the minimum of all possible split halves) is a lower-bound estimate of internal consistency and alpha
(the average of all possible split halves) an upper bound assuming that there is a general factor, so alpha is
only properly interpretable contingent on a sufficiently high value of beta. Alpha then provides a best
summary estimate of precision. The recommended values are β=0.7 and α=0.8 for components and β=0.5
and α=0.7 for a second-order eliciting attribute with components.
2.5.3. Response (answer) formats
Likert response formats should not be used—they cannot provide unambiguous, precise item scores
(Rossiter & Percy, 1987, p. 547). In the usual item for which Likert responses are used, the intensity is built
into the item stem, that is, into the question itself. Example: “I never attend social events.” However, in the
Likert answer format, “strongly disagree” could mean the rater always attends social events, attends many
social events, or is simply emphatic that it is not true that he or she never attends them.14
Even a change of
the stem wording to “I seldom attend social events” does not help, because the response is still ambiguous.
A further problem due to putting intensity into the stem of Likert items (cf. “never attend” or “seldom
attend” in the two versions of the question above) is that the psychological zero or neutral point is lost
because “neither agree nor disagree” cannot signify the same neutrality in both versions and in fact does not
do so in either. This poses a major problem for the interpretation of Likert-format scale scores. The problem
worsens when Likert ratings are summed or averaged over items whose stems vary in intensity (Foddy,
1993, pp. 168–170) because the intensity of the total score is obscured irretrievably.

A better practice is to build intensity of response into the leaves of the item, the response alternatives. Items
in a multiple-item scale should be worded with intensity-free stems and minimum intensity to maximum
intensity answer categories. It does not seem to matter much whether the categories between the minimum
and maximum anchoring descriptions are labeled with words, that is, adverbs of intensity, or with sequential
numbers (although, for an interesting series of empirical studies suggesting that verbal labels more validly
represent people's discriminable states of mind, see Windschitl & Wells, 1996). Basically, there are three
response dimensions that characterize attributes: probability (unipolar), frequency (unipolar), or degree
(which can be unipolar or bipolar). In all cases, one should clearly identify the psychological zero category,
allow separately for a “don't know” category where this is a legitimate answer, and make the adjoining
categories has close to equal interval as possible. This is not just an argument in favor of allowing the use of
parametric statistical tests but more than this: with a valid psychological zero, a valid minimum and
maximum, and equal-interval categories, we have a good approximation of a ratio or “magnitude” scale.
Responses in marketing are interpreted as magnitude estimates all the time; for instance, if COKE is rated 10
out of 10 and PEPSI is rated 5 out of 10, consumers, and managers, are likely to interpret that result as
meaning that COKE is twice as good as PEPSI, and they would be justified in acting on this interpretation.
Also see Nunnally, 1978, Chapters 1 and 2, for the argument that we should grant at least interval properties
to carefully constructed scales. He is overly cautious about the existence of psychological zero points needed
for ratio scales but the scaling studies referenced below show clearly that these points are interpreted as zero
by raters.
For numerical scales, which can be used for probability, frequency, or degree, five to seven categories seems
to best fit the number of psychological discriminations that most consumers can make with regard to an
attribute.15
For unipolar ratings, there is also a common-sense case for the numerical scale of 0 to 10, an 11-
point decile scale, because we have been so well trained to discriminate in decimal degrees. (Later, in the
Enumeration step of C-OAR-SE, it is recommended that all scale results be transformed to a 0 to 10 scale
for reporting purposes, and this linear transformation does require an interval scale of the original.)

For verbal response categories, equal-interval adverbs should be employed or, for probability, equal-interval
adjectival phrases. The verbal response categories, of course, have to be converted to numbers for data
analysis.
For probability ratings, the descriptors “impossible” (0), “unlikely” (0.15), “slight chance” (0.30), “toss up”
(0.50), “likely” or “good chance” (0.70), “pretty sure” (0.80), and “certain” (1.00) provide interval-scalable
equivalents for US students, as found by Wallsten, Budescu, and Zwick (1993). This is a valuable finding
given many people's discomfort with expressing numerical probabilities (yet they seem to have little
difficulty with the probability-equivalent decile scale). For relative frequency ratings, the adverbs “never”
(0), “sometimes” (1), “usually” (2) and “always” (3) provide equal intervals by magnitude estimation, again
for US students (Bass, Cascio, & O'Connor, 1974). Absolute frequencies (e.g., “seen the ad n times”) or
rates (e.g., “once a year,” “twice a year,” etc.) could alternatively be used provided that reasonably accurate
recall by respondents can be assumed. For ratings of degree, the adverbs “not at all” (0), “slightly” (1),
“quite” (2), and “extremely” (3) provide equal intervals by the method of successive-intervals scaling (see
Cohen's, 1987 summary of the ratings obtained by Cliff, 1959, again with US college students). It is
noteworthy that these are the three recommended adverbs for the scale categories on either side of “neither”
in the classic semantic differential technique and are scored −3 to +3 (Osgood, Suci, & Tannenbaum,
1957).16
An appropriate verbally labeled, bipolar, single-item attitude scale, again with the numbers shown
only to indicate scale values, would be: “My overall evaluation of this brand is: (−3) extremely negative,
(−2) quite negative, (−1) slightly negative, (0) decidedly neutral, (+1) slightly positive, (+2) quite positive,
(+3) extremely positive, □ don't know.” Attribute scales should carry a box next to them for raters to
indicate “don't know” when this is a legitimate response alternative to the “decidedly neutral” response that
0 implies. With bipolar attributes, in particular, failure to allow for these two different responses is a large
source of score error Grichting, 1994 and Voss et al., 2000. “Don't know” respondents should be analyzed
separately as this response signifies unawareness, as compared with an aware but neutral attitude.
2.5.4. Randomized order

Finally, with multiple-item scales, the order of the items should be randomized to minimize response-set
artifacts in the obtained scores. This means randomized presentation across multiple items for objects
(constituents or components) as well as for attributes (items within components should be separated). This is
quite a strict requirement but necessary if the response correlation or “methods variance” artifact, which is
especially likely if the same answer format is used for multiple items, is to be held to a minimum (Andrews,
1984). If both the object and the attribute have multiple-item parts, randomization of the complete set of
items should be used, and the items are best presented in separate batteries of no more than five items each
(Andrews, 1984).
2.6. Enumeration
2.6.1. Indexes, averages, and single-item scores
Because of the different object and attribute types that it is possible to combine in a construct, the
enumeration rules (procedures for deriving a total score from the scale items) will vary. These are
summarized in Table 3. It can be seen that they range from a single-item score equaling the total score, to
two types of index, a double index, an average, and averages which are then indexed. In only two of the six
cells is coefficient alpha relevant and one of these, a concrete singular object rated on an eliciting attribute,
corresponds with the traditional (Churchill, 1979) procedure.
Table 3. Scale enumeration rules for the six object-on-attribute cells
Attribute
Object
Concrete singular Abstract collective or abstract formed
Concrete Single item score Index over Oi
Formed Index over Aj Index (doubly) over OiAj
Eliciting Average (mean) over Aj Average (mean) over Aj, and index over Oj
O=object, and subscript i's are item parts for constituents or components. A=attribute, and subscript
j's are item parts for components.

An index is usually, but not always, a summation of item scores. An alternative combination rule to the
summation rule when using formed attributes is the profile rule (Law, Wong, & Mobley, 1998). The profile
rule is most often the noncompensatory conjunctive rule, which applies a minimum level for each
component that must be exceeded. An example of the conjunctive rule is Parnes' (1961) index of the
CREATIVITY attribute, which is enumerated as scores above the mid-point of the Originality component
scale plus scores above the mid-point of the Usefulness component scale. BUYCLASS (Anderson, Chu, &
Weitz, 1987) is a scale that should use a conjunctive index. To qualify as a “new task buy,” for instance, a
buying situation should be rated conjunctively as “new” on the Newness component, “extensive” on the
Information requirements component, and as having “one or more suppliers, all of which are new to the
account” on the Consideration of alternatives component. Instead, the investigators, using the conventional
approach, factor analyzed the items, reduced the three theorized components to two, employed Likert
answer scales, and then just added the two components' scores, so it is not at all clear what the total
BUYCLASS score means. Also, there are some complex profile rules that use upper and lower bounds (e.g.,
the VALS LIFESTYLE typology; Mitchell, 1983).
There is also an alternative combination rule to the usual averaging rule when using eliciting attributes,
which is the multiplicative rule (again see Law et al., 1998). Perhaps the best-known multiplicative score in
marketing would be for MULTIATTRIBUTE ATTITUDE measures; here, Belief-item scores are multiplied
by the corresponding Importance-item scores or Evaluation-item scores for each attribute, and then
averaged. Another example of the multiplicative rule comes from the fear-appeal literature, where the
MESSAGE ACCEPTANCE attribute is predicted by multiplying PERCEIVED THREAT scores by
PERCEIVED EFFICACY scores (e.g., Rogers, 1983 and Witte, 1994).
2.6.2. Reporting scale scores
The enumeration rules imply that indexes will receive absolute total scores and items for eliciting attributes
will receive averaged scores. Although this distinction is arbitrary, it is useful as a reminder that the items
for indexes are all in the scale by definition (they cannot be added to or deleted), whereas the items (actually

the item parts) for eliciting attributes are a sample of interchangeable items, and averaging them “back” to
the range of the common rating scale preserves this (that is, the score is a sample mean). For indexes, it is
useful to transform the absolute scores to a scale of 0 to 10, where 10 is the maximum score. This
circumvents the problem of open-ended total scores with indexes by putting all index scores on a common
scale that facilitates interpretation and comparison. Actually, there is a good case for transforming eliciting
attribute scores also to 0 to 10 scales, if unipolar, and −5 to +5 scales, if bipolar. This would greatly improve
understanding of results by nontechnical readers, whose everyday numerical decisions are usually made on a
number base of 10. A more exact solution is to convert all scales to standard scores but the above is pretty
close and more straightforward to interpret.
When the conceptual definition calls for it, the components (or constituents for a abstract collective object)
should be weighted before computing the index score. In Coleman's (1983) four-component measure of
SOCIAL CLASS, for instance, Education, Occupation, Income, and Residential area are rated on different
numbers of answer categories and will therefore contribute differently to the total score if they are not
weighted. Education and Occupation are each given double weight in the index, in accordance with the
construct definition that says these are the more important components. Components in formed measures
(abstract formed objects or formed attributes) should not be empirically weighted, as is typically done in
partial least squares analysis by weighting the components by their correlation with the total score. Firstly,
this would be tantamount to using statistics to define the construct, which C-OAR-SE definitely opposes,
and, secondly, such weighting rarely makes any difference to the total score in that the weighted score
correlates very highly with the unweighted score (Nunnally, 1978, p. 606).
The scale's minimum and maximum attainable scores, the theoretical minimum and maximum, should
always be explicitly stated when the scale is used in a study. For example, is a “seven-point” scale, as is
often used for answer categories when rating eliciting attributes, a 0 to 6 scale, or a 1 to 7 scale, or a −3 to
+3 scale? It matters when interpreting the reported scores. Graphical presentations of scale scores also
should indicate the theoretical minimum and maximum; articles abound in which the reader learns, after

close inspection, that the obtained mean difference was, say, 5% of the scale length, or that both means were
absolutely so low as to be of little practical import. Behavior intention scales are notorious for this; in many
studies, the low mean results indicate that hardly anyone in the experimental group would buy the product
(or take other action) even if the mean is significantly higher than that of the control group. Also, behavior
intention scores should be weighted using empirically proven weights (see Rossiter & Percy, 1997, pp. 567–
568).
It is also preferable to indicate the polarity of the scale (see specifically Schwarz, 1999). It is quite clear that
a mid-point score of 0 on a −3 to +3 bipolar attitude scale is the psychological zero, but the psychological
zero on a scale marked 0 (would not buy) to 6 (definitely would buy) is not at the mid-point, 3, but at the
minimum, 0, as this is a unipolar attribute. A reliability (precision) estimate should also be reported for each
scale's scores in the particular study; see Section 4. This indicates how accurate the results are. The
calculation and reporting of effect size also helps to indicate practical importance when scale results are
being compared.
Marketing researchers could do a lot more to give enumeration of scales a common-sense meaning, as the
above recommendations suggest.
3. Construct validity and predictive validity
The C-OAR-SE procedure for scale development relies totally on content validity to prove that it provides
better measures than does the traditional procedure. Traditionalists will ask: what about tests of construct
validity (the multitrait–multimethod test particularly) and predictive validity (does the C-OAR-SE-produced
measure correlate more highly with a criterion measure)? As will be shown in the next two sections, both
these widely used types of validity are not conclusive.
3.1. Construct validity (MTMM)
The multitrait–multimethod matrix (MTMM) cannot be used to decide whether a C-OAR-SE measure is
better than a traditional measure. MTMM poses a paradox because it presumes the old measures are
themselves valid. To show convergent validity, the new measure would have to show that it is highly

correlated with the very measure it claims to be superior to; not only this, but a high correlation would not
show which of the two measures is valid—it could be the old or it could be the new. As an example of this,
Smith (1999) created a modified SERVQUAL scale in which 40% of the items were attributes that a
literature search indicated were important in consumers' evaluations of the service object: FAMILY-
PLANNING CLINICS. Despite its logically greater content validity, the new scale correlated very highly
with the original scale, thus showing “convergent” validity but not showing which was the more valid scale.
For the same reason, “divergent” validity, if it pits the C-OAR-SE measure against traditional measures of
other constructs, would not be conclusive. Indeed, there is no point in conducting MTMM even if all the
measures being compared have correctly been produced by C-OAR-SE.17
Validity should be established for
a scale independently, and as far as possible, absolutely, not relatively via its correlation or lack of
correlation with other measures.
The failure of MTMM construct validation to prove validity is seen most acutely with scales that measure
abstract collective objects, abstract formed objects, or formed attributes, which do not adhere to the classical
domain sampling model. For these, the component items are in the scale by definition; they are not
interchangeable. It is therefore impossible for other measures—other combinations of items—to be
equivalent to the C-OAR-SE measure. In C-OAR-SE, one measure is always better than others because it is
more content valid.
3.2. Predictive validity
Predictive validity, the extent to which a C-OAR-SE measure correlates with some criterion or outcome
measure, is also inappropriate if predictive validity is interpreted in its usual sense of trying to maximize that
correlation. For a multiple-item measure, a “pruning” procedure in which items are selected because of their
ability to increase the correlation with a criterion, as in the traditional approach, reduces the validity of the
measure. This is because the ultimate would be a predictive measure which measures the same construct as
the criterion (it would predict it with r=1.0) and which thereby ignores the fact that there is, presumably, a
true construct-to-construct correlation (like a population score) that is definitely not 1.0. For example, from
meta-analysis, the true correlation between high-involvement ATTITUDE and subsequent BEHAVIOR is
estimated to be r=0.4 (Kraus, 1995; see also Rossiter & Percy, 1997, p. 271). To then seek other measures of
the predictor construct (like taking sample statistics) that try to improve on the population correlation would
be improper. For example, by adding BEHAVIOR INTENTION items to the ATTITUDE measure, the
correlation could be raised above 0.4, but then this “predictively more valid” measure would be drifting
away from the original construct of ATTITUDE, defined as an overall evaluation. As argued by O'Grady
(1982), the targeted magnitude of explained variance between two constructs should be “limited to the
relation between the constructs as postulated by the theory” (p. 775). He points out, moreover, that predictor
variable correlations of considerably less than unity are to be expected whenever the criterion has multiple
determinants, which is usual in marketing.18
Furthermore, predictive validity has been suggested as the “only way” to validate index measures of
constructs (read: any measure that is not based on a concrete object and an eliciting attribute, the two
classifications presumed in Churchill's procedure and in structural equations modeling [though not partial
least squares—see Fornell and Cha, 1994]). Thus, the formidable authority Bagozzi (1994, p. 333)
comments that “the best we can do to assess reliability and validity [of index measures] is to examine how
well the index relates to measures of other variables (e.g., test–retest reliability [which is not another
variable!]; criterion-related validity [predictive validity]).” Diamantopoulos and Winklhofer, for example,
recommended and followed the predictive validity approach in their 2001 paper on index measures. This
“bootstrapping” approach to validity assessment is just not rational. A scale's validity should be established
independently for the construct, by using the C-OAR-SE expert judgment procedure.
Predictive validity, if desired in addition to content validity, is relevant in only one sense: a new measure,
such as produced by C-OAR-SE, can be evaluated as predictively valid if one knows the true construct-to-
construct population correlation and reconceptualizes the test as one of coming closest to achieving that
correlation. This is hardly ever the situation in marketing, because the correlation is usually sampled with
imperfect measures. The same argument—that of approximating population correlations—applies to so-

called nomological or “theoretical nextwork” validity (Bagozzi, 1994) although here, the population
correlation is usually a partial correlation after removing the contributions of other determinant constructs to
the criterion construct's score. The measures produced by C-OAR-SE—shown first to have very good
content validity by the C-OAR-SE procedure—should enable better estimates of these population
correlations or partial correlations, which will contribute to marketing and buyer behavior theory.
4. Reliability
The rater entity makes a fundamental difference to the way reliability is assessed. Reliability is an estimate
of the precision of a score obtained from a scale (Weiss & Davison, 1981). A score from a scale can be
assessed for reliability (precision) but not the scale itself. To be useful, both theoretically and practically, the
score has to come from a valid scale. Highly precise, reliable scores can be obtained from nonvalid scales,
and high reliability, per se, says nothing about validity. This well-known fact bears repeating because of the
quite widespread tendency, mentioned at the outset of this article, for users of the traditional scale
development procedure to report a high alpha as implying high validity, in that alpha is the sole justification
provided for employing the scale. Content validity of the scale must be convincingly established before
precise scores can be taken to mean what they are supposed to mean.
Test–retest reliability can be dismissed immediately. If people give different answers to the same items on
two occasions for no good reason, then all this says is that items are ambiguous and not sufficiently
concrete, a content validity issue. Testing and retesting is appropriate when the purpose is to measure change
in the person or other object taking the test but the two sets of scores presume the validity of the test
(Lumsden, 1978). Test–retest reliability provides no information about the precision of scores obtained from
the test.
The reliability of scores from a particular application of the scale is the correct interpretation of the term
“reliability.” There is no general reliability statistic that is an inherent property of the scale. In particular,
coefficient alpha, when used appropriately for an eliciting attribute, does affect precision but never alone, as

the discussion below will make clear. On the other hand, the nature of the rater entity always affects the way
precision is estimated.
4.1. Individual rater
With individual self-ratings, the reliability implications depend on the type of attribute. If the attribute is
concrete, as in a self-report of AGE or INCOME, there is no question of unreliability. The individual gives a
precise score, assuming he or she is not lying or incompetent, and multiple items are not needed.
If the attribute is formed, such as an individual SALESPERSON's self-rating on items that measure
CUSTOMER ORIENTATION, a different argument applies but it leads to the same conclusion. Presume
here that a finite set of activities has been identified that “add up to,” that is, form the attribute of,
CUSTOMER ORIENTATION. This is not a sample of activities, as implied in the conventional scale
development procedure employed by Saxe and Weitz (1982), but a comprehensive list of the main
component activities (ratified by expert agreement). For a formed attribute, there is also no question of
unreliability. Assuming that the salesperson understands the items and rates himself or herself truthfully, the
individual's score will be perfectly precise and thus reliable. It may be commented here that the truthfulness
consideration is one of validity, namely, whether the self-report question measures what it is supposed to
measure.19
No number of additional items, the standard way to increase reliability, would compensate for
lack of validity and produce a “better” score. Again, when the rater entity is the individual, who is
performing self-ratings on items making up a formed attribute, the individual's score on the scale has to be
regarded as completely precise.
If the attribute is eliciting, as in a PERSONALITY TRAIT or a PERSONAL STATE, the reliability estimate
is not so straightforward. The items are a sample of the eliciting attribute's proximal consequences and
thereby of the attribute itself. It follows that precision, as in all sample estimates, depends on sample size
(number of items). For the purpose of estimating how precisely the items sample the attribute, the eliciting
case is the only case among constructs where coefficient alpha is helpful.20
Given content-valid items, given
unidimensionality, and given that the items measure activities and not trivial synonyms, alpha can be taken

as an estimate of how precisely the underlying trait has been sampled. For example, α=0.7 means that the set
of items in the scale are a 70% precise sample of the trait, whereas α=0.9 means 90% precision (for the
reliability coefficient of correlation, alpha in this case, the simple correlation r is used, not r-squared; this the
“true score=observed score×scale reliability” correction recommended by Nunnally, 1978, p. 240)21
An
implication of this is that alphas of at least 0.67 should be sought if no more than a third of the contribution
to obtained scores is to be due to the influences of other constructs. For measuring an eliciting attribute,
three to five good items that yield α between 0.7 and 0.8 is ideal. Short scales with alphas higher than 0.8
(rounded) are suspicious because the items are almost surely overly synonymous.
4.2. Experts
In content analysis, each attribute of the object (e.g., an AD, or perhaps an INDIVIDUAL, as in experts'
assessments of an individual's personality) is represented by a single item rated on multiple answer
categories. The precision of the item's score depends on the degree of agreement between the experts (the
analogy with inter-item consistency in coefficient alpha should be evident when it is realized that the experts
are, in effect, “multiple items” that are sampling the content category). The degree of agreement in turn
depends firstly on the number of experts (more judges means more items, in effect, and this provides a better
estimate of agreement, up to a fairly rapid asymptote), secondly on the concreteness of the rating categories
specified for the attribute (concreteness being earlier defined as the degree of lack of disagreement across
individuals, so that if concrete categories are selected expertly in the first place, inter-judge agreement
should be high), and thirdly on the number of categories for the attribute, to correct for chance agreement.
Rust and Cooil (1994) provide a very good formula, the Proportional Reduction in Loss formula, for making
the precision estimate, and they point out that alpha is a special case of PRL.
Because the scarce availability of experts usually means they are few in number for a particular study, it is
imperative to strive for concrete wording of the rating categories and to include as many categories as can
meaningfully be distinguished. With C-OAR-SE, for instance, there are three categories for each of the
judgments O, A, and R. If an average of 67% agreement across experts can be attained, as seems reasonable,

then 88% reliability (precision) would be likely with three experts, 91% with four, rising to 100% with 11
experts (Rust & Cooil, 1994, p. 8, Table 4).
4.3. Group
Because the projection is to the population of people, the reliability (precision) of the score, assuming a
random sample of persons, depends almost entirely on the size of the rater group, that is, sample size in the
everyday meaning of the term, because the n (actually √n) is the divisor in the standard error of the estimate.
The larger the sample of raters, the smaller the confidence interval around the observed score and the more
precise it is. For instance, in general, with a 95% (of scores) confidence interval, scores from a sample of 25
consumers will be up to ±20% imprecise, whereas those from a sample of 500 consumers will be up to ±4%
imprecise, the “up to” referring to the nearness of the observed score to the middle of the possible score
range, e.g., 50% on a percentage scale, where standard errors are largest (see Rossiter & Percy, 1997, p. 552,
and note that they provide averaged “look-up” tables whereas, strictly speaking, the confidence interval
should be estimated from the standard deviation of the data). The 95% CI is arbitrary, of course, though it is
becoming widely accepted in the biomedical sciences, where serious health decisions are made. Market
research practitioners, notably Information Resources, often use an 80% confidence interval (e.g., Lodish,
Abraham, Kalmenson, Livelsberger, Lubetkin, Richardson, Stevens, 1995) which carries a 20% Type I error
risk; so when comparing two scores, such as sales results from an experimental sample and a control sample,
there is a 20% chance of wrongly detecting a significant difference. This seems like too little confidence or,
the same thing, an unjustifiably high level of precision in reporting the scores. On the other hand, 99%
seems unrealistically conservative for most scale-score applications in marketing. Hence, the recommended
95% CI. A common-sense way to make the confidence-interval precision estimate comparable to the 0 to
100% type of estimate, as in the PRL, would be to refer to plus-or-minus in terms of 100 minus the
maximum error that can occur; thus + or −20% becomes a maximum error of 40%, and thus 60% precise, +
or −4% becomes 92% precise, and so forth.22

There is one important additional precision factor when groups are rating an object in terms of an eliciting
attribute. An example would be CONSCIENTIOUSNESS, one of the big five personality traits, as a national
trait of CHINESE PEOPLE as rated by NORTH AMERICANS. The additional factor, from the foregoing
discussion, is the precision of the scale for the eliciting attribute itself, which is typically estimated by alpha.
Although such a combined precision estimate has not, apparently, been attempted, a good guide might be
sample size precision divided by α (e.g., a±4% error for a sample size of 500 would become, if α=0.8,
±4%/0.8, or ±5%). Again, the 100% minus maximum error, rounded, interpretation can be reported.
The reliability estimation formulas according to C-OAR-SE are given in Table 4. The appropriate method
for estimating scale-score reliability differs according to the rater entity and the type of attribute in the
construct. If the rater entity is the self (self-ratings) and the attribute is either concrete or formed, then the
reliability of the individual's score is 100% (and in these two cases, reliability does not vary with the
application of the scale). If experts are the rater entity, the reliability of the object's mean score increases
with the number of experts and number of answer categories in the rating of the attribute. If a group is the
rater entity, the reliability of the object's mean score increases with group sample size and decreases with the
standard deviation of the ratings, which together provide a confidence interval for the object's mean score on
the attribute. Coefficient alpha is incorporated in the reliability estimate only if the attribute is of the eliciting
type, as the accuracy of scores is sensitive to the number of items used to sample the eliciting attribute,
given that the items have been shown to be unidimensional, though usually over the remarkably small range
of three to five items for most eliciting-attribute scales in marketing.

Table 4. Reliability (percentage precision-of-score) estimates for rater entities by type of attribute
Attribute
Rater entity
Individual(self-
rating) (%)
Panel of experts
Group (of
consumers, etc.)
Concrete 100 Average PRLa (over object items) 100–95% CI
Formed 100 Average PRL (over object and attribute items) 100–95% CI
Eliciting 100 (α)b
Average PRL (over object items, and over
average of attribute items multiplied by α)c
100–(95% CI/α)d
a PRL is Proportional Reduction in Loss calculation (Rust & Cooil, 1994).
b E.g., if α=0.8, then Precision=100 (0.8)=80%.
c E.g., if there are several object items and their average PRL is 85%, and any number of attribute items and
their average PRL is 90% and their α=0.8, then Precision=[85+90(0.8)]/2=[85+72]/2=78.5%=78%, rounded
down.
d E.g., if the 95% confidence interval around an observed score based on a sample of 200 people is ±7% and
α=0.8, then Precision=100−(14/.8)=100−17.5=82.5%=82%, rounded down.
5. Conclusions
The message of this article is not going to be popular among academic researchers in marketing, at least not
initially. It alleges that much of what we have achieved to date in terms of defining and measuring major
constructs in marketing is of suspect validity, which has hindered development of adequate theories and
models and produced many fuzzy and untrustworthy findings. Findings based on objectively measured
inputs and outputs, such as TV-to-scanner purchase panels, are exempt from this criticism. However, self-
report data, which constitute the bulk of our attempts to find out the “why” of marketing behavior as well as
to record much of the “what,” remain severely threatened.
C-OAR-SE is offered as a theoretical and procedural solution to the problems of developing scales to
measure marketing constructs. C-OAR-SE is primarily a rationalist procedure, asking researchers to think

carefully about the nature of constructs (to properly define them), to work much harder up front to generate
and select items, often multiple but sometimes just one, for their scales (and not leave it to computers to
select items from a pool of items of dubious content), and when designing answer categories and reporting
scale results, to give much more consideration to what they really mean (meanings that are too often hidden
in statistics that may well be correct procedurally but convey little to other than the authors).
The main lessons from C-OAR-SE can be summarized as follows:
1. A construct, a “phenomenon of theoretical interest” (Edwards & Bagozzi, 2000), must be conceptually
defined in terms of the following elements: the object, including its main constituents or components if
abstract; the attribute, including its main components if abstract; and the rater entity, the perceiver's
perspective being an inherent part of the construct. If any of these definitional elements is missing, scale
development to operationally measure the construct cannot properly proceed. Open-ended interviews with
a sample of target raters are usually needed to contribute to the concept definition, especially to identify
components that may be involved. A panel of several experts must then ratify the object, attribute, and
rater entity classifications.
2. The object of the construct can be concrete singular (one-item part needed for it in the scale), or abstract
collective (multiple-item parts, one per constituent), or abstract formed (multiple-item parts, one per main
component). The scale's object, therefore, and not just the attribute, can be multicomponential. Consumer
values are a noteworthy example of multicomponential, abstract formed objects that have been measured
completely inadequately with a single item each.
3. The attribute of the construct can be concrete (one-item part). A concrete singular object to be rated in
terms of a concrete attribute needs only a single-item scale. Insistence by journals on multiple-item
measures for all attributes has led to the practice of adding attempted synonyms that actually decrease the
content validity of the measure. On the other hand, many attributes, particularly those in the more complex
constructs, are abstract and do require multiple items (multiple-item parts, one per component if formed
and several for the attribute, representing its proximal consequences, if eliciting). A majority of attributes
in marketing are formed “composite” attributes, requiring an index of defining items, rather than eliciting
“trait or state” attributes, requiring an average of unidimensional indicative items. Failure to correctly
classify formed attributes has led to the wrong structure for identifying components and the omission of
crucial items. Most of the measures of classic constructs in marketing and also most measures of new
constructs in the past five years make this error, and so it continues. C-OAR-SE gives guidelines for
correcting these measures.
4. Rating scales' answer categories also need improvement, so as to lessen ambiguity for raters and for users
of the research. Likert “agree–disagree” ratings should be abandoned in favor of building degrees of the
attribute into the rating categories. Unipolar or bipolar ratings should be chosen appropriate to the
psychological zero of the attribute. Bipolar ratings should include a separate “don't know” category.
Reporting of scale scores should be improved by giving the theoretical minimum and maximum of the
scale in tables and graphs so that effect size is more apparent.
5. From a metatheory-of-measurement standpoint, the recommendations in C-OAR-SE are radical. One is
that content validity, which is what C-OAR-SE is based on, is all-important, necessary, and sufficient for
use of a scale. A second is that the multitrait, multimethod assessment of construct validity should be
discontinued because it cannot be used to decide the validity superiority of alternative measures of a
construct. A third is the re-thinking of predictive validity as not being to maximize prediction, but to try to
come closest to the true theoretical correlation between the predictor construct and the criterion construct.
Finally, reliability, which has become ersatz evidence of validity for many scales, should be regarded as no
more than a precision-of-score estimate, reportable not in general, but for each application of the scale.
References
Ajzen, I. (2001). Nature and operation of attitudes. Annual Review of Psychology, 52, 27–58.
Anderson, E., Chu, W., & Weitz, B. (1987). Industrial purchasing: an empirical exploration of the buyclass
framework. Journal of Marketing, 51(3), 71–86.
Andrews, F. M. (1984). Construct validity and error components of survey measures. Public Opinion
Quarterly, 48(2), 409– 442.

Arndt, J., & Crane, E. (1975). Response bias, yea-saying, and the double negative. Journal of Marketing
Research, 12(2), 218– 220.
Arrindell, W. A., & van der Ende, J. (1985). An empirical test of the utility of the observations-to-variables
ratio in factor and components analysis. Applied Psychological Measurement, 9(2), 165– 178.
Baddeley, A. (1994). The magical number seven: still magic after all these years? Psychological Review,
101(2), 353– 356.
Bagozzi, R. P. (1994). Structural equation models in marketing research: basic principles. In R. P. Bagozzi
(Ed.), Principles of marketing research (pp. 317– 385). Cambridge, MA: Blackwell.
Bagozzi, R. P., & Burnkrant, R. E. (1979). Attitude organization and the attitude– behavior relationship.
Journal of Personality and Social Psychology, 37(6), 913– 919.
Bass, B. M., Cascio, W. F., & O’Connor, E. J. (1974). Magnitude estimations of expressions of frequency and
amount. Journal of Applied Psychology, 59(3), 313– 320.
Baumgartner, H., & Steenkamp, J. -B. E. M. (2001). Response styles in marketing research: a cross-national
investigation. Journal of Marketing Research, 38(2), 143– 156.
Bearden, W. O., Netemeyer, R. G., & Mobley, M. F. (1993). Handbook of marketing scales: multi-item
measures for marketing and consumer behavior research. Newbury Park, CA: Sage.
Bettman, J. R. (1970). Information processing models of consumer behavior. Journal of Marketing Research,
7(3), 370–376.
Blalock, H. M. (1964). Causal inferences in nonexperimental research. Chapel Hill, NC: University of North
Carolina Press.
Bodur, H. O., Brinberg, D., & Coupey, E. (2000). Belief, affect and attitude: alternative models of the
determinants of attitude. Journal of Consumer Psychology, 9(1), 17– 28.
Bollen, K., & Lennox, R. (1991). Conventional wisdom on measurement: a structural equation perspective.
Psychological Bulletin, 110(2), 305–314.
Bolton, R. N. (1993). Pretesting questionnaires: content analyses of respondents’ concurrent verbal protocols.
Marketing Science, 12(3), 280–303.
Breckler, S. J., & Wiggins, E. C. (1989). Affect versus evaluation in the structure of attitudes. Journal of
Experimental Social Psychology, 25(3), 253– 271.
Burisch, M. (1997). Test length and validity revisited. European Journal of Personality, 11(4), 303–315.
Cacioppo, J. T., & Petty, R. E. (1982). The need for cognition. Journal of Personality and Social Psychology,
42(1), 116– 131.
Cacioppo, J. T., Petty, R. E., & Kao, C. F. (1984). The efficient assessment of need for cognition. Journal of
Personality Assessment, 48(3), 306–307.
Calder, B. J., & Ross, M. (1973). Attitudes and behavior. Morristown, NJ: General Learning Press.
Chan, A. M. (2001). Unpublished research for doctoral dissertation. Sydney, Australia: Australian Graduate
School of Management, University of New South Wales.

Childers, T. L., Houston, M. J., & Heckler, S. (1985). Measurement of individual differences in visual versus
verbal information processing. Journal of Consumer Research, 12(2), 125– 134.
Churchill Jr., G. A. (1979). A paradigm for developing better measures of marketing constructs. Journal of
Marketing Research, 16(1), 64– 73.
Cliff, N. (1959). Adverbs as multipliers. Psychological Review, 66(1), 27– 44.
Cohen, B. (1987). Some observations on rating scales. Marketing Review, 42(4), 25–27.
Cohen, J. (1977). Statistical power analysis for the behavioural sciences (Revised ed.). New York: Academic
Press.
Cohen, P., Cohen, J., Teresi, J., Marchi, M., & Velez, C. N. (1990). The problems in the measurement of
latent variables in structural equations causal models. Applied Psychological Measurement, 14(2),
183–196.
Coleman, R. P. (1983). The continuing significance of social class to marketing. Journal of Consumer
Research, 10(3), 265–280.
Cook, T. D., & Campbell, D. T. (1979). Quasi-experimentation: design and analysis issues for field settings.
Chicago: RandMcNally.
Cortina, J. M. (1993). What is coefficient alpha? An examination of theory and applications. Journal of
Applied Psychology, 78(1), 98–104.
Cronbach, L. J. (1951). Coefficient alpha and the internal structure of tests. Psychometrika, 16(3), 297– 334.
Cronbach, L. J., Gleser, G. C., Nanda, H., & Rajaratnam, N. (1972). The dependability of behavioral
measurements: theory of generalizability for scores and profiles. New York: Wiley.
Deshpande´, R., & Zaltman, G. (1984). A comparison of factors affecting researcher and manager perceptions
of market research use. Journal of Marketing Research, 21(1), 32–38.
Diamantopoulos, A., & Winklhofer, H. M. (2001). Index construction with formative indicators: an alternative
to scale development. Journal of Marketing Research, 38(2), 269– 277.
Domzal, T. J., & Kernan, J. B. (1993). Variations on the pursuit of beauty: toward a corporal theory of the
body. Psychology and Marketing, 10(6), 496–511.
Drolet, A., & Morrison, D. (2001). Do we really need multiple-item measures in service research? Journal of
Service Research, 3(3), 196– 204.
Dunlap, W. P. (1994). Generalizing the common language effect size indicator to bivariate normal
correlations. Psychological Bulletin, 116(3), 509– 511.
Edwards, J. R., & Bagozzi, R. P. (2000). On the nature and direction of relationships between constructs and
measures. Psychological Methods, 5(2), 155–174.
Edwards, K. (1990). The interplay of affect and cognition in attitude formation and change. Journal of
Personality and Social Psychology, 59(2), 202–216.
Feldman, J. M., & Lynch Jr., J. G. (1988). Self-generated validity and other effects of validity on belief,
attitude, intention, and behavior. Journal of Applied Psychology, 73(3), 421– 435.

Finn, A., & Kayande´, U. (1997). Reliability assessment and optimization of marketing measurement. Journal
of Marketing Research, 34(2), 262– 275.
Fishbein, M., & Ajzen, I. (1975). Belief, attitude, intention, and behavior. Reading, MA: Addison-Wesley.
Foddy, W. (1993). Constructing questions for interviews and questionnaires: theory and practice in social
research. Cambridge, UK: Cambridge Univ. Press.
Fornell, C., & Bookstein, F. L. (1982). Two structural equation models: LISREL and PLS applied to
consumer exit-voice theory. Journal of Marketing Research, 19(4), 440– 452.
Fornell, C., & Cha, J. (1994). Partial least squares. In R. P. Bagozzi (Ed.), Principles of marketing research
(pp. 52 – 78). Cambridge, MA: Blackwell.
Gardner, D. G., Cummings, L. L., Dunham, R. B., & Pierce, J. L. (1998). Single-item versus multiple-item
measurement scales: an empirical comparison. Educational and Psychological Measurement, 58(6),
898– 915.
Grichting, W. L. (1994). The meaning of ‘‘I don’t know’’ in opinion surveys: indifference versus ignorance.
Australian Psychologist, 29(1), 71– 75.
Heise, D. R. (1969). Some methodological issues in semantic differential research. Psychological Bulletin,
72(6), 406– 422.
John, G., & Roedder, D. L. (1981). Reliability assessment: coefficients alpha and beta. In K. Bernhardt, & W.
J. Kehoe (Eds.), The changing marketing environment: new theories and applications ( pp. 354– 357).
Chicago: American Marketing Association.
Kahle, L. R. (1983). Social values and social change: adaptation to life in America. New York: Praeger.
Kenny, D. A. (1979). Correlation and causality. New York: Wiley.
King, C. W., & Summers, J. O. (1970). Overlap of opinion leaders across product categories. Journal of
Marketing Research, 7(1), 43– 50.
Kohli, A. K., Jaworski, B. J., & Kumar, A. (1993). MARKOR: a measure of market orientation. Journal of
Marketing Research, 30(4), 467– 477.
Kraus, S. J. (1995). Attitudes and the prediction of behavior: a meta-analysis of the empirical literature.
Personality and Social Psychology Bulletin, 21(1), 59–75.
Law, K. S., & Wong, C. S. (1999). Multidimensional constructs in structural equation analysis: an illustration
using the job perception and job satisfaction constructs. Journal of Management, 25(2), 143– 154.
Law, K. S., Wong, C. S., & Mobley, W. H. (1998). Toward a taxonomy of multidimensional constructs.
Academy of Management Review, 23(4), 741– 755.
Lewis, R. M. (1977). The conscious interlude. Kingsport, TN: Kingsport Press.
Lodish, L. M., Abraham, M., Kalmenson, S., Livelsberger, J., Lubetkin, B., Richardson, B., & Stevens, M. E.
(1995). How advertising works: a meta-analysis of 389 real world split cable TV advertising
experiments. Journal of Marketing Research, 32(2), 125– 139.
Lumsden, J. (1957). A factorial approach to unidimensionality. Australian Journal of Psychology, 9(2), 105–
111.

Lumsden, J. (1961). The construction of unidimensional tests. Psychological Bulletin, 58(2), 122– 131.
Lumsden, J. (1976). Test theory. Annual Review of Psychology, 27, 251– 280.
Lumsden, J. (1978). Tests are perfectly reliable. British Journal of Mathematical and Statistical Psychology,
31(1), 19– 26.
Lumsden, J., & Ross, J. (1973). Validity as theoretical equivalence. Australian Journal of Psychology, 25(3),
191–197.
McGuire, W. J. (1989). The structure of individual attitudes and attitude systems. In A. R. Pratkanis, S. J.
Breckler, & A. G. Greenwald (Eds.), Attitude structure and function ( pp. 37–68). Hillsdale, NJ:
Erlbaum.
Medin, D. L., Lynch, E. B., & Solomon, K. O. (2000). Are there kinds of concepts? Annual Review of
Psychology, 51, 121–147.
Mehrabian, A., & Russell, J. (1974). An approach to environmental psychology. Cambridge, MA: MIT Press.
Meyer, G. J., Finn, S. E., Eyde, L. D., Kay, G. G., Moreland, K. L., Dies, R. R., Eisman, E. J., Kubiszyn, T.
W., & Reed, G. M. (2001). Psychological testing and psychological assessment: a review of evidence
and issues. American Psychologist, 56(2), 128–165.
Michaels, R. E., & Day, R. L. (1985). Measuring customer orientation of salespeople: a replication with
industrial buyers. Journal of Marketing Research, 22(4), 443–446.
Millar, M. G., & Millar, K. U. (1990). Attitude change as a function of attitude type and argument type.
Journal of Personality and Social Psychology, 59(2), 217–228.
Miller, G. A. (1956). The magical number seven, plus or minus two: some limits on our capacity for
processing information. Psychological Review, 63(1), 81– 97.
Mitchell, A. (1983). The nine American lifestyles: who we are and where we’re going. New York: Macmillan.
Mittal, B., & Lassar, W. M. (1996). The role of personalization in service encounters. Journal of Retailing,
72(1), 95– 109.
Mowen, J. C. (2000). The 3M model of motivation and personality: theory and empirical applications to
consumer behavior. Norwell, MA: Kluwer Academic Publishing.
Narver, J. C., & Slater, S. F. (1990). The effect of market orientation on business profitability. Journal of
Marketing, 54(4), 20– 35.
Novak, T. P., Hoffman, D. L., & Yung, Y. -F. (2000). Capturing the customer experience in online
environments: a structural modelling approach. Marketing Science, 19(1), 22– 42.
Nunnally, J. C. (1978). Psychometric theory (2nd ed.). New York: McGraw-Hill.
O’Grady, K. E. (1982). Measures of explained variance: cautions and limitations. Psychological Bulletin,
92(3), 766–777.
Osgood, C. E., Suci, G., & Tannenbaum, P. H. (1957). The measurement of meaning. Urbana, IL: University
of Illinois Press.
Ozer, D. J. (1985). Quantitative methods in psychology: correlation and the coefficient of determination.
Psychological Bulletin, 97(2), 307– 315.
Parasuraman, A., Zeithaml, V. A., & Berry, L. L. (1988). SERVQUAL: a multiple-item scale for measuring
consumer perceptions of service quality. Journal of Retailing, 64(1), 12–40.
Parnes, S. J. (1961). Effects of extended effort in creative problem solving. Journal of Educational
Psychology, 52(3), 117– 122.
Paunonen, S. V. (1984). Optimizing the validity of personality assessments: the importance of aggregation
and item content. Journal of Research in Personality, 18(4), 411– 431.
Peterson, R. A. (1994). A meta-analysis of Cronbach’s coefficient alpha. Journal of Consumer Research,
21(2), 381–391.
Peterson, R. A. (1997). A quantitative analysis of rating-scale response variability. Marketing Letters, 8(1), 9–
21.
Rentz, J. O. (1987). Generalizability theory: a comprehensive method for assessing and improving the
dependability of marketing measures. Journal of Marketing Research, 24(1), 19– 28.
Revelle, W. (1979). Hierarchical clustering and the internal structure of tests. Multivariate Behavioral
Research, 14(1), 57–74.
Rogers, R.W. (1975). A protection motivation theory of fear appeals and attitude change. Journal of
Psychology, 91(5), 93–114.
Rogers, R. W. (1983). Cognitive and physiological processes in fear appeals and attitude change: a revised
theory of protection motivation. In J. Cacioppo, & R. E. Petty (Eds.), Social psychophysiology ( pp.
153– 176). New York: Guilford.
Rokeach, M. (1973). The nature of human values. New York: Free Press.
Rossiter, J. R. (1981). Predicting starch scores. Journal of Advertising Research, 21(5), 63– 68.
Rossiter, J. R., & Eagleson, G. (1994). Conclusions from the ARF’s copy research validity project. Journal of
Advertising Research, 34(3), 19–32.
Rossiter, J. R., & Percy, L. (1987). Advertising and promotion management. New York: McGraw-Hill.
Rossiter, J. R., & Percy, L. (1997). Advertising communications and promotion management (2nd ed.). New
York: McGraw-Hill.
Rust, R. T., & Cooil, B. (1994). Reliability measures for qualitative data: theory and implications. Journal of
Marketing Research, 31(1), 1 –14.
Saxe, R., & Weitz, B. A. (1982). The SOCO scale: a measure of the customer orientation of salespeople.
Journal of Marketing Research, 19(3), 343– 351.
Schaffer, J. (2001). Causes as probability raisers of processes. The Journal of Philosophy, 98(2), 75–92.
Schlinger, M. J. (1979). A profile of responses to commercials. Journal of Advertising Research, 19(2), 37–
46.
Schwarz, N. (1999). Self-reports: how questions shape the answers. American Psychologist, 54(2), 93– 105.
Sherrard, M. (2001). Personal communication. February 21.
Sigauw, G. B., Brown, G., & Widing II, R. E. (1994). The influence of the market orientation of the firm on
sales force behavior and attitudes. Journal of Marketing Research, 31(1), 106– 116.

Slater, S. F., & Narver, J. C. (1994). Does competitive environment moderate the market orientation –
performance relationship? Journal of Marketing, 58(1), 46– 55.
Smith, A. M. (1999). Some problems when adopting Churchill’s paradigm for the development of service
quality measurement scales. Journal of Business Research, 46(2), 109–120.
Spearman, C. (1904). General intelligence objectively determined and measured. American Journal of
Psychology, 15, 201–293.
SPSS (1988). SPSS-X user’s guide (3rd ed.). Chicago, IL: SPSS.
Steenkamp, J. -B. E. M., & Baumgartner, H. (1995). Development and cross-cultural validation of a short
form of CSI as a measure of optimum stimulation level. International Journal of Research in
Marketing, 12(2), 97–104.
Steenkamp, J. -B. E. M., & van Trijp, H. C. M. (1991). The use of LISREL in validating marketing constructs.
International Journal of Research in Marketing, 8(4), 283– 299.
Steiger, J. H., & Ward, L. M. (1987). Factor analysis and the coefficient of determination. Psychological
Bulletin, 101(3), 471– 474.
Steinman, C., Deshpande´, R., & Farley, J. U. (2000). Beyond marketing orientation: when customers and
suppliers disagree. Journal of the Academy of Marketing Science, 28(1), 109–119.
Taylor, S. A., & Baker, T. L. (1994). An assessment of the relationship between service quality and customer
satisfaction in the formation of consumers’ purchase intentions. Journal of Retailing, 70(2), 163–178.
Urban, G. L., & Hauser, J. R. (1993). Design and marketing of new products (2nd ed.). Englewood Cliffs, NJ:
Prentice Hall.
Voss, K. E., Stem Jr., D. E., & Fotopoulos, S. (2000). A comment on the relationship between coefficient
alpha and scale characteristics. Marketing Letters, 11(2), 177– 191.
Wallsten, T. S., Budescu, D. V., & Zwick, R. (1993). Comparing the calibration and coherence of numerical
and verbal probability judgments. Management Science, 39(2), 176–190.
Webb, D. J., Green, C. L., & Brashear, T. G. (2000). Development and validation of scales to measure
attitudes influencing monetary donations to charitable organizations. Journal of the Academy of
Marketing Science, 28(2), 299– 309.
Weiss, D. J., & Davison, M. L. (1981). Test theory and methods. Annual Review of Psychology, 32, 629–658.
Wells, G. L., & Windschitl, P. D. (1999). Stimulus sampling and social psychological experimentation.
Personality and Social Psychology Bulletin, 25(9), 1115– 1125.
Wierenga, B., & van Bruggen, G. (2000). Marketing management support systems: principles, tools and
implementation. Boston, MA: Kluwer Academic Publishing.
Windschitl, P. D., & Wells, G. L. (1996). Measuring psychological uncertainty: verbal versus numeric
methods. Journal of Experimental Psychology: Applied, 2(4), 343– 364.
Witte, K. (1994). Fear control and danger control: a test of the extended parallel process model (EPPM).
Communication Monographs, 61(2), 113–134.
Woodside, A. G., & Fleck Jr., R. A. (1979). The case approach to understanding brand choice. Journal of
Advertising Research, 19(2), 23– 30.
Zaichkowsky, J. L. (1994). The personal involvement inventory: reduction, revision, and application to
advertising. Journal of Advertising, 23(4), 59– 70.
Zaltman, G., LeMasters, K., & Heffring, M. (1982). Theory construction in marketing—some thoughts on
thinking. New York: Wiley.
Notes
1. The C-OAR-SE acronym is appropriate in that the new procedure is looser and broader than the overly
narrow previous procedure. The O-A-R part is set off in the acronym to indicate the three defining elements
on a construct: object, attribute, and rater entity.
2. The author is well aware of the later, 1994, edition of Nunnally's classic book but prefers the 1978 edition,
where the points relevant to the present discussion are made.
3. One could regard relationships between constructs as also being constructs in that they are also
phenomena of theoretical interest. However, relationships are usually inferred from prior theory, or from
qualitative (phenomenological) research (see Bettman, 1970 and Woodside & Fleck, 1979), or from
experiments, and presume constructs and therefore their measurement scales. Thus, relationships between
constructs is a topic excluded from scale development. Also excluded is qualitative research measurement
of constructs, in which the nature of objects and especially of attributes is “to-be-discovered” and rater
entities are initially consumers and ultimately the qualitative research analyst.
4. We do not mean “multidimensional,” a term referring to an attribute as having projections of its
components “outwards” as “continua” (the dimensions). This term is correct, in C-OAR-SE, only for a
second-order eliciting attribute (see Section 2.3.3). The term “multicomponential” is preferred in general
because it includes the more prevalent situation of components adding “inwards” to form the result, as in an
abstract formed object or a formed attribute (see Section 2.3.2). Note that components can be nominal; they
do not have to be continua.

5. An interesting proposal to circumvent the need for multiple component items when rating an abstract
formed object, reminiscent of the RVS, was made by Gardner, Cummings, Dunham, and Pierce (1998).
These researchers developed a single-item (though elaborate) measure for each of several job-related
constructs. An example is for the object JOB FACTORS, where the attribute is FREQUENCY OF
THINKING ABOUT THEM AT WORK, and the rater entity is the INDIVIDUAL EMPLOYEE. The
“single item” was achieved by priming the respondent with the object's components via a lead-in to the
question. Here is the lead-in for rating of JOB FACTORS: “Job factors. These are the things directly related
to the work you perform. This includes all of your job duties, the challenge of your job, the activities you
engage in, the decisions you make as part of your job, and your job responsibilities” (p. 901). Their prime-
the-components approach probably results in a more content-valid rating than use of simply the object, JOB
FACTORS. A similar approach was used recently by Novak, Hoffman, and Yung (2000) to measure the
FLOW experience, an abstract formed object, among Web users. However, the time required to rate the
components would be little more than the time needed to read them and remember them and would be more
valid.
6. The description “formative attribute” is not correct because it suggests that it is the attribute that is doing
the forming rather than, correctly, that it is the items that are doing so. For the opposite reason, the earlier
terms “cause indicators” (Blalock, 1964), or “formative indicators” (Fornell & Bookstein, 1982), are not
suitable because they refer to the items rather than to the resulting attribute. Also, describing both types of
items as “indicators” is confusing because in the case of formed attributes, and abstract formed objects, the
items are defining, not merely indicants. In C-OAR-SE, the indicator description of items is applicable only
for attributes that are classified as eliciting.
7. Law and Wong (1999) give a good example of this distinction for the formed attribute of JOB
SATISFACTION. The proximal antecedents of JOB SATISFACTION are satisfactions with specific aspects
of the job, such as Satisfaction with Co-workers, Satisfaction with Supervisor, Satisfaction with Pay, and
Satisfaction with Facilities. The more remote causes, or distal antecedents, are separate constructs, such as

SUPERVISOR'S LEADERSHIP QUALITY AS PERCEIVED BY THE EMPLOYEE, RELATIVE PAY
LEVEL, and probably several others.
8. In no way can the classification of an attribute be determined post hoc by the use of statistical analysis.
For instance, discovery of a low alpha for multiple items does not mean that the attribute can be ex post
facto redefined as “formed” and this interpretation would be a blatant mis-use of C-OAR-SE. Constructs
must be defined a priori by expert judgment. Constructs are never produced by statistics except for the
contribution of single frequency counts when deciding inclusion of main constituents or components.
9. “Cause” here is meant in the strongest sense of micromediation(Lewis, 1977), that is, the “process-
linkage” view of causation rather than just the “probability-raising” view. See Cook and Campbell (1979),
Zaltman, LeMasters, and Heffring (1982, chapter 3), and Schaffer (2001).
10. Peterson's (1994) meta-analysis of multiple-item scales in marketing also found no gain in alpha beyond
five items. He excluded “aggregated” scales from his analysis, that is, he examined only “component” scales
(for example, he would exclude SERVQUAL but include its component scales of Reliability, Assurance,
etc.), so his finding is relevant to the present issue. The fact that his study would include formed-attribute
scales, for which alpha is not relevant but is likely to be lower than for eliciting-attribute scales, means that
his number-of-items result is conservative, so that five items is a safe upper limit for measuring a single
component of an eliciting attribute. He also found that several more items may be needed if the answer
categories are dichotomies (e.g., Yes–No), a finding that fits the discussion in Section 4 of the present article
regarding score precision.
11. Mowen (2000) developed a 6-item measure of NEED FOR COGNITION (NFC) that compared very
well (in his study, α=0.81) with the 18-item version (α=0.84). However, from a content validity standpoint,
Mowen's short scale and the original scale have problems. Mowen's scale, obtained with some difficulty by
eventually extracting a one-factor solution from correlations of the 18 items and eliminating items with
item-total correlations of less than 0.5 (see Mowen, 2000, p. 74), consists of six items that are each negative
in the stem (e.g., “I only think as hard as I have to”; “Thinking is not my idea of fun”) and the Likert agree–

disagree answer format is used as the leaf. Whereas agreement with these negative items would indicate low
need for thinking, it is by no means clear that disagreement would indicate high need (see criticism of the
Likert answer format in Section 2.5.3). Further, in cognitive interviewing on the items in the long NFC
scale, a frequent difficulty was that respondents said, “it depends on the situation,” which defeats the
rationale for a stable trait measure (Sherrard, 2001). Finally, the conceptual definition of the NFC construct
as “the tendency for the individual to engage in and enjoy thinking” suggests that there are two components
involved—Frequency of thinking and Enjoyment of thinking—and that perhaps “need” for cognition should
be measured by the multiplicative product of the two responses (see Section 2.6). NFC has been little used in
psychology, though it is popular with consumer behavior researchers, and does not appear as a basic trait in
the big five or big eight typologies.
12. For state constructs, the direct object is the EXTERNAL STIMULUS that causes the state (this stimulus
elicits the eliciting attribute), and the SELF becomes the indirect object (which is incorporated in the self-
statement in the attribute item part). For example, for the construct PERSONAL RELEVANCE OF THE
AD, the grammatical classifications are of the form: “I (subject and rater entity) rate this AD (AD as object)
as PERSONALLY (SELF as indirect object) RELEVANT (adjectival completion of the attribute).” For trait
constructs, being general, there is no external stimulus, and the object is the SELF.
13. The formula for coefficient beta is β=min [(ni+nj)2σ̄ij/σT
2], where ni and nj are the numbers of items in
any and all split-halves of the items, half with items i and half with items j (they need not be exactly equal
halves, as they cannot be for an odd number of total items), σ̄ij is the average between-halves item
covariance, and σT2 is the variance of the total scale score. It would be convenient to have software written
to calculate beta as the combinations of split-halves increase rapidly with the total number of items.
14. In an empirical demonstration of this phenomenon, Arndt and Crane (1975) found significant differences
in Likert responses to equivalent positively and negatively worded items for 15 of the 20 items in their
study. A recent major investigation by Baumgartner and Steenkamp (2001), using items of the typical Likert
item type with the attribute intensity in the stem and an agree–disagree response format, found severe

“response style” effects, such as acquiescence tendency and mid-point tendency, which altered scale scores
by up to 29% and inflated or deflated correlations between scale scores by more than 50% if the two scales
had the same bias. They recommended using balanced item pairs (a positively and a negatively worded item,
thus two items instead of one) or else post-correcting for response-style variance statistically. Neither
recommendation is practical or likely to be widely followed. The problems may be peculiar to Likert-stem,
Likert-leaf items and is a further reason for not using this type of item.
15. See Miller's (1956), famous “magical number seven plus or minus two.” Miller concluded that “there is
a span of attention that will encompass about six objects at a glance…and a span of absolute judgment that
can distinguish about seven categories” (p. 91). This conclusion has held remarkably well for the types of
single-dimension discriminations that are required for rating scales (Baddeley, 1994). Perhaps the safest
recommendation is five to seven categories for unipolar ratings (or a jump to the 11-point decile scale) and
seven categories for bipolar ratings, three each side of the neutral category (which is usual for semantic
differential ratings).
16. “Semantic differential” refers to the theoretical factor structure of connotative meaning and not to just
any double-anchored answer scale. Heise (1969, p. 414) explains why bipolar adjectival scales are used for
semantic differential ratings, rather than unipolar scales or scales with longer descriptive anchors:
“…unipolar ratings may have a markedly different nature from bipolar ratings. When only one adjective is
presented, its denotative meaning may have more impact on ratings than when it is used with another
adjective, and it may be easier to rate peripheral or fleeting aspects of the stimulus. For example, someone
asked if dogs are bad may say ‘some dogs are bad’ and asked separately if dogs are good may say ‘most
dogs are good,’ whereas if asked whether dogs are good or bad, he would have to make a single summary
statement.”
17. Long before C-OAR-SE, a theoretical critique of MTMM was provided in an important but little-known
paper by Lumsden and Ross (1973), who concluded that construct validity is impossible to prove. Their
argument was repeated in Lumsden's (1976) more accessible review of test theory in the Annual Review of

Psychology; it has not been refuted, yet MTMM testing continues unabated. As Lumsden commented wryly
regarding the paradox of logic it is based on: “The multi-trait multi-method procedure seems to require that
a test have an identical twin of the opposite sex” (p. 270). He foresaw the solution to the “validity problem”
as “via an extension of…content validity” by forcing test constructors to write clear a priori specifications
for the set of items (pp. 270–271). James Lumsden passed away not long after his landmark review was
published. C-OAR-SE, with its insistence on up-front concept definition and classification of object,
attribute, and rater entity, continues very much in his spirit.
18. Kenny (1979) goes further in claiming that there is an inherently unpredictable aspect of any behavior
and that “one is fooling oneself if more than 50% of the variance [by r-squared] is predicted…the remaining
unexplained variance is fundamentally unknowable and unexplainable. Human freedom may rest in the
error term” (p. 9, emphasis in the original). This, of course, is an opinion based on multivariate prediction,
referring to r's above 0.7. Univariate predictions (one predictor and one criterion) in the psychological and
medical sciences almost always are in the range 0.01–0.4, just occasionally reaching 0.5 or higher (Cohen's
large effect size) and then mainly in controlled experiments rather than field studies (Meyer, Finn, Eyde,
Kay, Moreland, Dies, Eisman, Kubiszyn, Reed, 2001). Univariate predictive relationships in marketing are
unlikely to be exceptional in this respect.
19. In the case of CUSTOMER ORIENTATION, there is evidence that SALESPERSONS tend to overrate
themselves, averaging about 8 on the 1 to 9 (low to high) scale, compared with INDUSTRIAL
CUSTOMERS' ratings of them, which average about 6 on the scale (Michaels & Day, 1985). However, in
C-OAR-SE, the rater entity is an inherent part of the construct, and so SALESPERSONS' and
CUSTOMERS' ratings would be different constructs.
20. Little known is that Cronbach (1951), shortly after his paper on it, abandoned coefficient alpha in favor
of generalizability coefficients. The idea of generalizability is represented in C-OAR-SE via item selection
for objects and attributes and specification of the rater entity. See Cronbach, Gleser, Nanda, and Rajaratnam,
1972, and for marketing applications of generalizability calculations see Finn and Kayandé, 1997, and

Rentz, 1987. Nevertheless, coefficient alpha remains specifically useful for assessing scales for eliciting
attributes, in C-OAR-SE, when preceded by coefficient beta (see Section 2.5.2).
21. See Ozer (1985) for an explanation of why r is the appropriate statistic for the coefficient of
determination, although for a conservative reply favoring r-squared, see Steiger and Ward (1987). Basically,
it is a matter of whether one prefers the “common elements” model (r) or the “proportion of variance” model
(r2). Effect size estimates (Cohen, 1977, pp. 78–83) use r.
22. The argument for the simplified estimates is as follows. Practitioners rarely understand confidence
intervals and they tend to regard a statistic as “the best estimate” anyway and treat it as though it were the
population figure, that is, the exact true figure. The debates over TV and magazine audience rating figures
obtained from somewhat different survey methodologies are serious testimony to this. It seems better, if not
entirely correct, to encourage them to say “this rating is 85% accurate—it could be off by 15%” than to
ignore precision altogether. For the same reason, correlation coefficients, which mystify many academics,
not just practitioners, should be translated into the Common Language Indicator of effect size (Dunlap,
1994). The CLI for a Pearson bivariate r of 0.5, for instance, is 67%, meaning that if the score on X is above
average, there is 67% chance, or odds of 67:33, that the score on Y will also be above average. For those
interested, the CLIs for r's of .1, 0.3, and 0.7 are 53%, 60%, and 75%, respectively (Dunlap, 1994, p. 510,
Table 1).