The basis for the decreased response to proton pump inhibitors in gastro-oesophageal reflux disease...
15
The basis for the decreased response to proton pump inhibitors in gastro-oesophageal reflux disease patients without erosive oesophagitis J. D. GARDNER*, H. GALLO-TORRES , S. SLOAN à , M. ROBINSON§ & P. B. MINER JR§ *Science for Organizations, Inc., Chatham, NJ, USA; United States Food and Drug Administration, Rockville, MD, USA; àJanssen Pharmaceutica Inc., Titusville, NJ, USA; §Oklahoma Foundation for Digestive Research, University of Oklahoma Health Sciences Center, Oklahoma City, OK, USA Accepted for publication 28 August 2003 SUMMARY Background: The reason why heartburn in gastro-oeso- phageal reflux disease subjects without oesophagitis is less responsive to proton pump inhibitors than heartburn in those with erosive oesophagitis is not known. Methods: Gastric and oesophageal pH were determined in 26 subjects with gastro-oesophageal reflux disease at baseline and on days 1, 2 and 8 of treatment with 20 mg omeprazole or 20 mg rabeprazole in a random- ized, two-way cross-over fashion. The presence or absence of erosive oesophagitis at baseline was docu- mented by upper gastrointestinal endoscopy. Results: At a given value of the integrated gastric acidity during treatment with a proton pump inhibitor, the probability of pathological oesophageal reflux was significantly higher in subjects with no oesophagitis than in those with erosive oesophagitis. This occurred because the post-prandial gastric acidity in subjects with no oesophagitis showed a decreased response to the antisecretory agent. Conclusions: Compared with gastro-oesophageal reflux disease subjects with erosive oesophagitis, those with no oesophagitis are relatively refractory to the pharmaco- dynamic effects of proton pump inhibitors on the post- prandial integrated gastric acidity. INTRODUCTION In patients with gastro-oesophageal reflux disease (GERD), the inhibition of gastric acid secretion with a proton pump inhibitor is the mainstay of treatment of oesophageal pathology and symptoms. 1, 2 These drugs decrease oesophageal as well as gastric acidity and reduce the frequency and severity of heartburn. 1–3 We and others have reported that GERD subjects with erosive oesophagitis have higher values of oesophageal acid exposure than GERD subjects without erosive oesophagitis. 4, 5 On the other hand, heartburn in subjects without erosive oesophagitis is less responsive to proton pump inhibitors than heartburn in subjects with erosive oesophagitis. 6 In the present study, we examined the relationship between oesophageal reflux and gastric acidity in an attempt to establish a basis for the reduced responsiveness to proton pump inhibitors in GERD subjects without erosive oesophagitis — a group that would be expected to have an increased respon- siveness to proton pump inhibitors because of their lower oesophageal acidity. 4, 5 One reason for the lack of information regarding the relationship between the effect of antisecretory treat- ment on gastric acid secretion or gastric acidity and the effect on other features in GERD has been the lack of suitably precise analytical techniques. Previously, we have described techniques using recordings of gastric Correspondence to: Dr J. D. Gardner, Science for Organizations, Inc., 156 Terrace Drive, Chatham, NJ 07928, USA. E-mail: [email protected] Aliment Pharmacol Ther 2003; 18: 891–905. doi: 10.1046/j.1365-2036.2003.01777.x Ó 2003 Blackwell Publishing Ltd 891
Transcript of The basis for the decreased response to proton pump inhibitors in gastro-oesophageal reflux disease...

The basis for the decreased response to proton pump inhibitorsin gastro-oesophageal reflux disease patients without erosiveoesophagitis
J . D. GARDNER*, H. GALLO-TORRES� , S . SLOAN� , M. ROBINSON§ & P. B. MINER JR§
*Science for Organizations, Inc., Chatham, NJ, USA; �United States Food and Drug Administration, Rockville, MD, USA;
�Janssen Pharmaceutica Inc., Titusville, NJ, USA; §Oklahoma Foundation for Digestive Research, University of Oklahoma
Health Sciences Center, Oklahoma City, OK, USA
Accepted for publication 28 August 2003
SUMMARY
Background: The reason why heartburn in gastro-oeso-
phageal reflux disease subjects without oesophagitis is
less responsive to proton pump inhibitors than heartburn
in those with erosive oesophagitis is not known.
Methods: Gastric and oesophageal pH were determined
in 26 subjects with gastro-oesophageal reflux disease at
baseline and on days 1, 2 and 8 of treatment with
20 mg omeprazole or 20 mg rabeprazole in a random-
ized, two-way cross-over fashion. The presence or
absence of erosive oesophagitis at baseline was docu-
mented by upper gastrointestinal endoscopy.
Results: At a given value of the integrated gastric acidity
during treatment with a proton pump inhibitor, the
probability of pathological oesophageal reflux was
significantly higher in subjects with no oesophagitis
than in those with erosive oesophagitis. This occurred
because the post-prandial gastric acidity in subjects
with no oesophagitis showed a decreased response to
the antisecretory agent.
Conclusions: Compared with gastro-oesophageal reflux
disease subjects with erosive oesophagitis, those with no
oesophagitis are relatively refractory to the pharmaco-
dynamic effects of proton pump inhibitors on the post-
prandial integrated gastric acidity.
INTRODUCTION
In patients with gastro-oesophageal reflux disease
(GERD), the inhibition of gastric acid secretion with a
proton pump inhibitor is the mainstay of treatment of
oesophageal pathology and symptoms.1, 2 These drugs
decrease oesophageal as well as gastric acidity and
reduce the frequency and severity of heartburn.1–3 We
and others have reported that GERD subjects with
erosive oesophagitis have higher values of oesophageal
acid exposure than GERD subjects without erosive
oesophagitis.4, 5 On the other hand, heartburn in
subjects without erosive oesophagitis is less responsive
to proton pump inhibitors than heartburn in subjects
with erosive oesophagitis.6 In the present study, we
examined the relationship between oesophageal reflux
and gastric acidity in an attempt to establish a basis for
the reduced responsiveness to proton pump inhibitors in
GERD subjects without erosive oesophagitis — a group
that would be expected to have an increased respon-
siveness to proton pump inhibitors because of their
lower oesophageal acidity.4, 5
One reason for the lack of information regarding the
relationship between the effect of antisecretory treat-
ment on gastric acid secretion or gastric acidity and the
effect on other features in GERD has been the lack of
suitably precise analytical techniques. Previously, we
have described techniques using recordings of gastric
Correspondence to: Dr J. D. Gardner, Science for Organizations, Inc., 156
Terrace Drive, Chatham, NJ 07928, USA.
E-mail: [email protected]
Aliment Pharmacol Ther 2003; 18: 891–905. doi: 10.1046/j.1365-2036.2003.01777.x
� 2003 Blackwell Publishing Ltd 891

and oesophageal pH that can quantify acidity over
time.4, 7 A previous paper illustrated how these approa-
ches can be used to demonstrate the extent to which
gastric acidity has to be decreased to prevent
pathological oesophageal reflux in GERD subjects who
are being treated with a proton pump inhibitor.8
In the present study, we analysed data from 24-h
recordings of oesophageal and gastric pH during
treatment with a proton pump inhibitor to examine
possible relationships between gastric and oesophageal
acidity in GERD subjects stratified on the basis of
whether or not they had erosive oesophagitis. We found
that, at a given value of the integrated gastric acidity
during treatment with a proton pump inhibitor, GERD
subjects with no oesophagitis were significantly more
likely to experience pathological oesophageal reflux
than those with erosive oesophagitis.
Previously, we have found the following: (i) subjects
with GERD have increased meal-stimulated gastric acid
secretion; (ii) the post-prandial integrated gastric acidity
between 09.00 and 22.00 h is a good surrogate
measure for meal-stimulated gastric acid secretion;
and (iii) post-prandial, but not nocturnal, integrated
gastric acidity is significantly increased in GERD sub-
jects.9 In view of these findings, we examined whether
GERD subjects with no erosive oesophagitis were
refractory to the pharmacodynamic effects of proton
pump inhibitors on the post-prandial gastric acidity,
nocturnal gastric acidity or both. We found that the
reduced response to proton pump inhibitors in GERD
subjects with no oesophagitis occurred primarily with
regard to the post-prandial integrated gastric acidity.
METHODS
This study was approved by and conducted in compli-
ance with good clinical practices as supervised by the
Western Institutional Review Board, Olympia, WA,
USA. All subjects enrolled in the study gave written
informed consent.
The analyses reported in this paper are based on the
same data for gastric and oesophageal pH that have
been analysed previously.8, 9
Subjects
The subjects included 59 adults with a history of GERD
who had experienced heartburn at least four times per
week for at least 6 months (36 males, 23 females; age,
18–69 years). These subjects had no history of a serious
medical condition, no other clinically significant gas-
trointestinal illness, including peptic ulcer, no difficulty
swallowing thought to be due to a pathological process
other than simple oesophageal reflux, and no history of
a gastrointestinal haemorrhage, upper gastrointestinal
surgery, stricture or oesophageal dilation. Subjects had
not been treated with an investigational drug within
30 days prior to study entry. Subjects had not used
sucralfate, histamine H2-receptor antagonists, misopr-
ostol, proton pump inhibitors, pro-motility drugs or any
other medication that can alter gastric acid secretion or
gastrointestinal motility within 1 week of baseline pH
recording. Subjects had not used systemic corticoster-
oids, anticholinergics, antineoplastic agents, metoclopr-
amide, anticoagulants, tetracycline or cisapride within
1 month of baseline pH recording.
All subjects had a negative serology test for Helicobacter
pylori.
Study design
The study was conducted at the Oklahoma Foundation
for Digestive Research on the campus of the University
of Oklahoma Health Sciences Center.
Baseline 24-h gastric pH and oesophageal pH were
measured in 59 GERD subjects. Twenty-seven subjects
with oesophageal pH £ 4 for at least 10% of the 24-h
baseline recording period were then randomized to
receive eight consecutive daily doses of 20 mg omepraz-
ole or 20 mg rabeprazole in a cross-over fashion with a
14-day washout between the treatment periods. Of these
subjects, 26 underwent upper gastrointestinal endo-
scopy and oesophagitis was rated using the Hetzel–Dent
rating scale.10 Eight subjects had no erosive oesophagitis
(six grade 0; two grade 1) and 18 had erosive oesopha-
gitis (seven grade 2, seven grade 3 and four grade 4).
Gastric pH and oesophageal pH were measured for 24 h
on days 1, 2 and 8 with each treatment. The purpose of
the present analyses was to assess the effects of treatment
with a proton pump inhibitor, not to compare the results
obtained with omeprazole vs. rabeprazole.
Subjects fasted from approximately 22.00 h the even-
ing before until the beginning of pH recording the
following morning at 08.00 h. Standardized meals were
provided at breakfast, lunch, dinner and bedtime.
Smoking and the ingestion of food other than the test
meals were prohibited during the pH recording periods.
The caloric content and amounts of fat, carbohydrate
892 J. D. GARDNER et al.
� 2003 Blackwell Publishing Ltd, Aliment Pharmacol Ther 18, 891–905

and protein in one portion of each meal were obtained
from the providers of the meals. Subjects were allowed to
ingest up to two portions of each meal, and the amounts
of each meal ingested were recorded. Subjects were
required to ingest the same amounts of food during all
24-h pH recording sessions. Meal 1 was ingested at
09.00 h and consisted of one McDonald’s sausage, egg,
cheese, biscuit with 30 g onions, 8 oz chocolate milk
and one peppermint patty. One portion contained 555
calories, with 31 g fat, 43 g carbohydrate and 27 g
protein. Meal 2 was ingested at 12.00 h and consisted of
one Wendy’s 8 oz chilli, one small frosty and 12 oz cola.
One portion contained 670 calories, with 15 g fat, 113 g
carbohydrate and 23 g protein. Meal 3 was ingested at
18.00 h and consisted of one Wendy’s hamburger with
cheese, one small French fries and 12 oz cola. One
portion contained 820 calories, with 33 g fat, 108 g
carbohydrate and 29 g protein. At bedtime (22.00 h)
subjects ingested a snack consisting of two Hostess
chocolate cupcakes and 8 oz whole milk.
Gastric pH and oesophageal pH values were collected
using an ambulatory, dual-channel pH recording system
(Medtronic Synectics) with antimony electrodes. One
electrode was placed in the stomach 10 cm below and the
second was placed in the oesophagus 5 cm above the
manometrically defined upper border of the lower oeso-
phageal sphincter. Electrodes were calibrated to pH 1 and
pH 7, and connected to a portable data storage unit
(Digitrapper, Medtronic Synectics). Recordings began at
08.00 h and continued for 24 h. Data were transferred
from the portable data storage unit and processed using
software designed for pH recordings (Polygram for
Windows, Version 2.04, Medtronic Synectics).
Analytical procedures
Polygram software takes the individual pH values that
are recorded every 4 or 8 s and fills in the same value
for the other seconds, resulting in one value for every
second of the recording period for each electrode. These
pH data were used for all calculations.
The integrated gastric and oesophageal acidity were
calculated for each hour of the recording period as
described previously.4, 7, 8
Statistical analyses
Statistical analyses were performed using GraphPad for
InStat version 3.01 for Windows. Curve fitting was
performed using GraphPad Prism version 4.00 for
Windows.
A step-by-step description of the analytical procedures
and the resulting graphs are given in Appendix A.
RESULTS
At baseline, the 24-h integrated oesophageal acidity in
subjects with erosive oesophagitis (median, 37.7
mmol.h/L; interquartile range, 17.5–74.5 mmol.h/L)
was not significantly different (P ¼ 0.080 by Mann–
Whitney test) from that in subjects with no oesophagitis
(18.5 mmol.h/L; 14.3–27.8 mmol.h/L). Typically,
GERD subjects with erosive oesophagitis have higher
oesophageal exposure than those without oesophagi-
tis;4, 5 however, the present study only included
subjects without oesophagitis who had oesophageal
pH £ 4 for at least 10% of the 24-h baseline recording
period. The value of the 24-h integrated gastric acidity
at baseline in GERD subjects with erosive oesophagitis
(1952 mmol.h/L; 1611–2204 mmol.h/L) was not sig-
nificantly different (P ¼ 0.177) from that in subjects
with no oesophagitis (1685 mmol.h/L; 1482–
1833 mmol.h/L).
Figure 1 compares subjects with erosive oesophagitis
with those with no oesophagitis with respect to the
distribution of values of the integrated oesophageal
acidity and integrated gastric acidity at baseline and
during treatment with a proton pump inhibitor. For
both oesophageal acidity and gastric acidity, the
distribution of values in GERD subjects with erosive
oesophagitis was not significantly different from that in
subjects with no oesophagitis (P ¼ 0.256 for oesopha-
geal acidity and P ¼ 0.522 for gastric acidity).
Furthermore, the area under the receiver operating
characteristic (ROC) curve11–14 was not significantly
different from 0.50 for both the oesophageal acidity
(area, 0.54; 95% confidence interval, [0.46, 0.64]) and
gastric acidity (0.52 [0.44, 0.62]).
It might be concluded that the lack of a significant
difference between GERD subjects with and without
erosive oesophagitis with respect to the oesophageal or
gastric acidity illustrated in Figure 1 indicates that these
two groups of subjects respond similarly to treatment
with a proton pump inhibitor. However, as the effect of
a proton pump inhibitor on the oesophageal acid
exposure results from the effect of the drug on the
gastric acidity, it is important to consider the oesopha-
geal acidity in relation to the accompanying value of the
PPI RESPONSIVENESS IN GERD WITHOUT OESOPHAGITIS 893
� 2003 Blackwell Publishing Ltd, Aliment Pharmacol Ther 18, 891–905

gastric acidity when comparing subjects with and
without erosive oesophagitis.
To compare the two groups of GERD subjects with
respect to the effect of the proton pump inhibitors on the
gastric acidity, we stratified all values of the integrated
gastric acidity for the accompanying value of the
integrated oesophageal acidity, using 8.1 mmol.h/L as
a cut-off point to define pathological oesophageal
acidity. From previous analyses of oesophageal pH
recordings from 26 healthy subjects and from the
baseline pH recordings from the 59 GERD subjects in the
present study, we found that a value of 8.1 mmol.h/L
for the 24-h integrated oesophageal acidity gives
maximal values of the sensitivity and specificity in
distinguishing between GERD subjects and healthy
subjects.8 The steps in this previous analysis are given
in Appendix A. Based on this analysis, we defined
pathological oesophageal reflux as a 24-h integrated
oesophageal acidity of greater than 8.1 mmol.h/L in the
present study. All subjects in the present study had
pathological oesophageal reflux at baseline, with a 24-h
integrated oesophageal acidity in the range 10.7–
120.4 mmol.h/L. This occurred because subjects were
selected on the basis of an oesophageal pH £ 4 for at
least 10% of the 24-h baseline recording period.
Figure 2 (left) illustrates that, in GERD subjects with
erosive oesophagitis, the percentage of values of the
integrated gastric acidity with pathological oesophageal
reflux (integrated oesophageal acidity above
8.1 mmol.h/L) is significantly higher than the percent-
age of values with no pathological oesophageal reflux
(integrated oesophageal acidity below 8.1 mmol.h/L)
across all values of the integrated gastric acidity
(P < 0.0001). The area under the ROC curve is 0.90
[0.85, 0.95] which, as pointed out previously,11–14
gives the probability that a randomly selected subject
with pathological oesophageal reflux will have a higher
value of the integrated gastric acidity than a randomly
selected subject with no pathological oesophageal
reflux.
Figure 2 (right) illustrates that, in GERD subjects with
no oesophagitis, the percentage of values of the
integrated gastric acidity with pathological oesophageal
reflux is also significantly higher than the percentage of
values with no pathological oesophageal reflux at all
values of the integrated gastric acidity (P < 0.0001).
When Figure 2 (left) is compared with Figure 2 (right),
however, there is a greater separation of the curves for
GERD subjects with erosive oesophagitis than for
subjects with no oesophagitis.
The area under the ROC curve in Figure 2 (right)
(0.68 [0.53, 0.82]) is significantly lower than the area
under the ROC curve in Figure 2 (left) (P ¼ 0.0046).
These differences between the areas under the ROC
0
10
20
30
40
50
60
70
80
90
100
0 20 40 60 80 100 120
Integrated Oesophageal Acidity (mmol.h/L)
Rec
ord
ing
s w
ith
Inte
gra
ted
Oes
op
hag
eal A
cid
ity
Ab
ove
Val
ue
Giv
en o
n X
-axi
s (%
)
Erosive Oesophagitis No Erosive Oesophagitis
0
10
20
30
40
50
60
70
80
90
100
0 500 1000 1500 2000 2500 3000
Integrated Gastric Acidity (mmol.h/L)
Rec
ord
ing
s w
ith
I nte
gra
ted
Gas
tric
Aci
dit
y A
bo
ve V
alu
e G
iven
on
X-a
xis
(%)
Erosive Oesophagitis No Erosive Oesophagitis
Figure 1. Values of the 24-h integrated oesophageal acidity (left panel) and integrated gastric acidity (right panel) from gastro-
oesophageal reflux disease (GERD) subjects stratified for the presence or absence of erosive oesophagitis. Both panels plot the percentage of
subjects with values of the integrated acidity above the value indicated on the X-axis. Results are from 24-h measurements in 18 subjects
with erosive oesophagitis and eight subjects with no erosive oesophagitis at baseline and during treatment with each of two different
proton pump inhibitors for 1, 2 and 8 days.
894 J. D. GARDNER et al.
� 2003 Blackwell Publishing Ltd, Aliment Pharmacol Ther 18, 891–905

curves indicate that the integrated gastric acidity
discriminates better between pathological and normal
oesophageal reflux in subjects with erosive oesophagitis
than in subjects with no oesophagitis. This difference, in
turn, reflects the difference between GERD subjects with
and without erosive oesophagitis in terms of their
response to proton pump inhibitors.
Previously, we described a method to determine the
probability that a subject with a particular value of the
integrated gastric acidity will have no pathological
oesophageal reflux.8 With this method, we calculated
the probability of no pathological reflux by dividing the
number of records with an integrated oesophageal
acidity below 8.1 mmol.h/L by the total number of
records at each value of the integrated gastric acidity.
The details of this method are given in Appendix A. We
used this same approach in the present study to
compare the results from GERD subjects with and
without erosive oesophagitis. Figure 3 illustrates the
probability of no pathological reflux as a function of the
integrated gastric acidity for GERD subjects with and
without erosive oesophagitis.
Both curves in Figure 3 have the same configuration
in that, at relatively low values of the integrated gastric
acidity, there is an initial plateau at 100% on the X-axis,
i.e. where the probability of no pathological reflux is
100%. This plateau extends to values of the integrated
gastric acidity of 301 mmol.h/L in subjects with erosive
oesophagitis and 125 mmol.h/L in subjects with no
erosive oesophagitis. At higher values of the integrated
gastric acidity, the curve decreases in a curvilinear
fashion to a second plateau at 60–65%. This second
plateau reflects the overall prevalence of records with no
pathological oesophageal reflux in the two groups of
subjects. That is, 64% of the pH recordings from subjects
with erosive oesophagitis have values of the integrated
oesophageal acidity below 8.1 mmol.h/L and 61% of
the recordings from subjects with no oesophagitis have
values of the integrated oesophageal acidity below this
same value. At values between the two plateaux, the
curve for the subjects with no oesophagitis is below that
for the subjects with erosive oesophagitis.
The results in Figure 3 indicate that, during treatment
with a proton pump inhibitor, the prevention of patho-
logical oesophageal reflux requires a greater decrease in
the integrated gastric acidity in subjects without
oesophagitis than in subjects with erosive oesophagitis.
This interpretation is supported by the finding that the
0
10
20
30
40
50
60
70
80
90
100
0 500 1000 1500 2000 2500 3000
Integrated Gastric Acidity (mmol.h/L)
Rec
ord
ing
s w
ith
Inte
gra
ted
Gas
tric
Aci
dit
yA
bo
ve V
alu
e G
iven
on
X-a
xis
(%)
Above 8.1 Below 8.1
0
10
20
30
40
50
60
70
80
90
100
0 500 1000 1500 2000 2500 3000
Integrated Gastric Acidity (mmol.h/L)
Rec
ord
ing
s w
ith
Inte
gra
ted
Gas
tric
Aci
dit
yA
bo
ve V
alu
e G
iven
on
X-a
xis
(%)
Above 8.1 Below 8.1
Figure 2. Values of the 24-h integrated gastric acidity stratified for 24-h integrated oesophageal acidity above or below 8.1 mmol.h/L in
gastro-oesophageal reflux disease (GERD) subjects with erosive oesophagitis (left panel) or without erosive oesophagitis (right panel). Both
panels plot the percentage of records with values of the integrated gastric acidity above the value indicated on the X-axis. The area under
the receiver operating characteristic curve [95% confidence interval] for the data in the left panel is 0.899 [0.846, 0.952] and for the data
in the right panel is 0.675 [0.530, 0.821]. Results are from 24-h measurements in 18 subjects with erosive oesophagitis and eight
subjects with no erosive oesophagitis at baseline and during treatment with each of two different proton pump inhibitors for 1, 2 and
8 days.
PPI RESPONSIVENESS IN GERD WITHOUT OESOPHAGITIS 895
� 2003 Blackwell Publishing Ltd, Aliment Pharmacol Ther 18, 891–905

initial plateau of the curve for subjects with erosive
oesophagitis extends to a higher value (301 mmol.h/L)
than that for subjects with no oesophagitis (125 mmol.h/
L). Figure 3 also illustrates that the overall prevalence of
no pathological oesophageal reflux is the same in the two
groups, and excludes a difference in overall prevalence as
an explanation for the different sensitivity to proton pump
inhibitors between the two groups.
The data in Figure 3 can be fitted by an equation with
an initial plateau and then an exponential decrease to a
second plateau with increasing integrated gastric acid-
ity. The parameters for this equation are given in
Table 1. The high values of R2 indicate that both curves
give good fits of the data illustrated in Figure 3. The
curve for GERD subjects without erosive oesophagitis is
significantly lower than the corresponding curve for
subjects with erosive oesophagitis (P < 0.0001).
Next, we examined the pharmacodynamic effects of
proton pump inhibitors on the post-prandial gastric
acidity and nocturnal gastric acidity and their associ-
ation with pathological oesophageal reflux. At baseline,
the median post-prandial integrated gastric acidity in
GERD subjects with erosive oesophagitis (552 mmol.h/
L) was not significantly different (P ¼ 0.177) from that
in subjects with no oesophagitis (406 mmol.h/L).
Similarly, at baseline, the median nocturnal integrated
gastric acidity in GERD subjects with erosive oesopha-
gitis (1321 mmol.h/L) was not significantly different
(P ¼ 0.495) from that in subjects with no oesophagitis
(1287 mmol.h/L). Furthermore, the distributions of the
values of the post-prandial and nocturnal gastric acidity
at baseline and during treatment with a proton pump
inhibitor in subjects with erosive oesophagitis were not
significantly different from the corresponding distribu-
tions in subjects with no oesophagitis (P ¼ 0.994 for
post-prandial acidity and P ¼ 0.306 for nocturnal
acidity). The area under the ROC curve was not
significantly different from 0.50 for both post-prandial
acidity (area, 0.50; 95% confidence interval, [0.41,
0.59]) and nocturnal acidity (0.55 [0.46, 0.64]).
40
50
60
70
80
90
100
0 400 800 1200 1600 2000 2400 2800 3200
Integrated Gastric Acidity (mmol.h/L)
Pro
bab
ility
of
No
Pat
ho
log
ical
Oes
op
hag
eal
Ref
lux
Erosive Oesophagitis No Erosive Oesophagitis
Figure 3. Probability of no pathological oesophageal reflux with
different values of the integrated gastric acidity in subjects with or
without erosive oesophagitis. Each value is the percentage of
records with no pathological reflux at the indicated value of the
integrated gastric acidity. Results are from 24-h measurements in
18 subjects with erosive oesophagitis and eight subjects with no
erosive oesophagitis at baseline and during treatment with each of
two different proton pump inhibitors for 1, 2 and 8 days. Notice
that the vertical axis is truncated at 40. The full lines are the best-
fit lines using the equation and parameters given in Table 1.
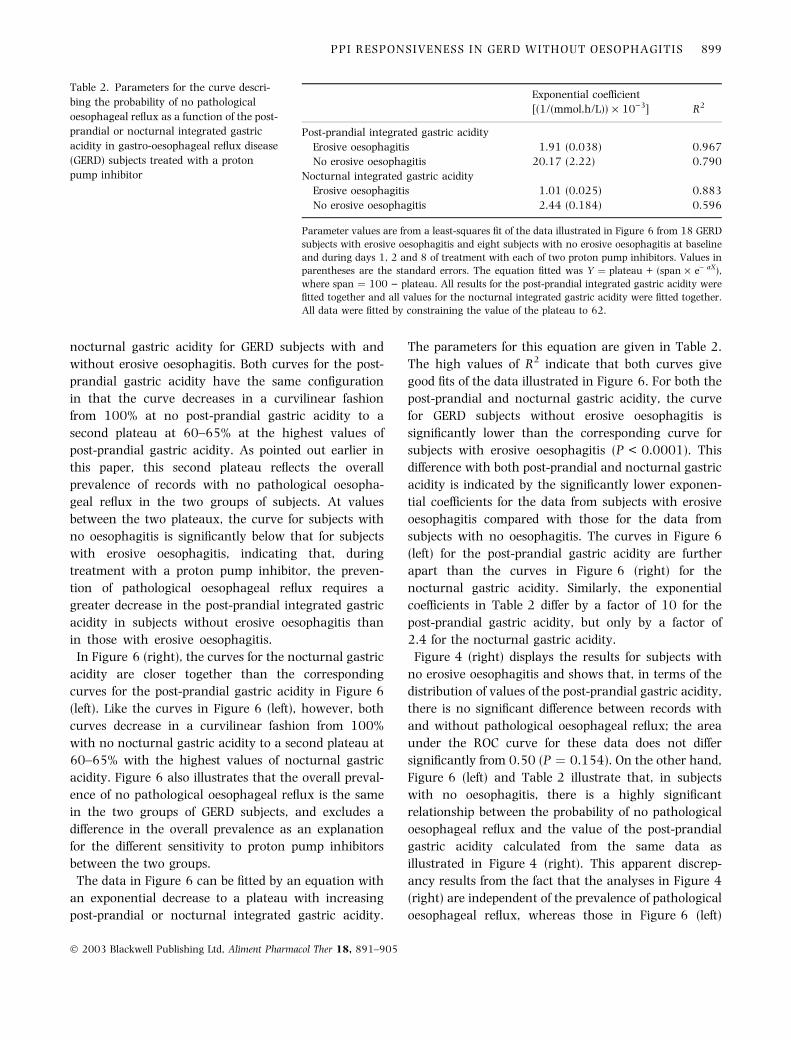
Table 1. Parameters for the curve descri-
bing the probability of no pathological
oesophageal reflux as a function of the
integrated gastric acidity in gastro-oeso-
phageal reflux disease (GERD) subjects
treated with a proton pump inhibitor
Parameter Erosive oesophagitis No erosive oesophagitis
Initial plateau (%) 100 [99.6, 100.4] 103 [98, 109]
X0 (mmol.h/L) 235 [206, 264] 0
Final plateau (%) 30 [20, 41] 66 [64, 68]
Exponential coefficient
(1/mmol.h/L)
3.1 · 10)4 [2.5, 3.8 · 10)4] 3.2 · 10)3 [2.3, 4.0 · 10)3]
R2 0.992 0.818
Parameter values are from a least-squares fit of the data illustrated in Figure 3 from 18 GERD
subjects with erosive oesophagitis and eight subjects with no erosive oesophagitis at baseline
and during days 1, 2 and 8 of treatment with each of two proton pump inhibitors. X0 is the
value on the X-axis that represents the upper boundary of the initial plateau. The values in
square brackets are the 95% confidence intervals. The equation fitted was: when X < X0,
Y ¼ initial plateau; when X > X0, Y ¼ final plateau + (span · e– a(X ) X0)), where
span ¼ initial plateau ) final plateau.
896 J. D. GARDNER et al.
� 2003 Blackwell Publishing Ltd, Aliment Pharmacol Ther 18, 891–905

Figure 4 (left) illustrates that, in all GERD subjects
considered together during treatment with a proton
pump inhibitor, the percentage of values of the post-
prandial integrated gastric acidity with pathological
oesophageal reflux is significantly higher than the
percentage of values with no pathological oesophageal
reflux (P < 0.0001). The area under the ROC curve for
these data is 0.86 and indicates that the post-prandial
gastric acidity distinguishes between pathological and
non-pathological oesophageal reflux as well as or better
than the 24-h integrated gastric acidity.
Figure 4 (middle) illustrates that, in GERD subjects
with erosive oesophagitis, the percentage of values of the
post-prandial gastric acidity with pathological oesopha-
geal reflux is significantly higher than the percentage of
values with no pathological oesophageal reflux
(P < 0.0001). The area under the ROC curve is 0.89
[0.83, 0.95]. Figure 4 (right) illustrates that, in GERD
subjects with no erosive oesophagitis, the percentage of
values of the post-prandial gastric acidity with patholo-
gical oesophageal reflux is not significantly higher than
the percentage of values with no pathological oesopha-
geal reflux (P ¼ 0.156). The area under the ROC curve
for the data in Figure 4 (right) is 0.61 [0.47, 0.76] — a
value that is not significantly different from 0.50 and
that is significantly lower than the area under the ROC
curve in Figure 4 (middle) (P ¼ 0.00062). This differ-
ence between the areas under the ROC curves indicates
that the post-prandial gastric acidity discriminates
between pathological and normal oesophageal reflux
in subjects with erosive oesophagitis, but not in subjects
with no oesophagitis. This difference, in turn, reflects the
difference between GERD subjects with and without
erosive oesophagitis in their response to proton pump
inhibitors. In other words, in subjects with erosive
oesophagitis treated with a proton pump inhibitor, on
average 89% of records with pathological oesophageal
reflux will have a higher value of the post-prandial
gastric acidity than records with normal oesophageal
reflux. In contrast, in subjects with no oesophagitis
treated with a proton pump inhibitor, the likelihood that
records with pathological oesophageal reflux will have a
higher value of the post-prandial gastric acidity than
records with normal oesophageal reflux is not signifi-
cantly different from chance alone.
Figure 5 (left) illustrates that, in all GERD subjects
considered together during treatment with a proton
pump inhibitor, the percentage of values of the nocturnal
integrated gastric acidity with pathological oesophageal
reflux is significantly higher than the percentage of
values with no pathological oesophageal reflux
(P < 0.0001). Figure 5 (middle) illustrates that, in GERD
subjects with erosive oesophagitis, the percentage of
values of the nocturnal gastric acidity with pathological
oesophageal reflux is significantly higher than the
percentage of values with no pathological oesophageal
reflux (P < 0.0001). The area under the ROC curve for
these data is 0.84 [0.76, 0.92]. Figure 5 (right) illustrates
that, in GERD subjects with no erosive oesophagitis, the
percentage of values of the nocturnal gastric acidity with
pathological oesophageal reflux is significantly higher
than the percentage of values with no pathological
0
10
20
30
40
50
60
70
80
90
100
0 200 400 600 800 1000 1200
Post-prandial Integrated Gastric Acidity(mmol.h/L)
Rec
ord
ing
s w
ith
Inte
gra
ted
Gas
tric
Aci
dit
yA
bo
ve V
alu
e G
iven
on
X-a
xis
(%)
Above 8.1 Below 8.1
0
10
20
30
40
50
60
70
80
90
100
0 200 400 600 800 1000 1200Post-prandial Integrated Gastric Acidity
(mmol.h/L)
Rec
ord
ing
s w
ith
Inte
gra
ted
Gas
tric
Aci
dit
yA
bo
ve V
alu
e G
iven
on
X-a
xis
(%)
Above 8.1 Below 8.1
0
10
20
30
40
50
60
70
80
90
100
0 200 400 600 800 1000 1200
Above 8.1 Below 8.1
Rec
ord
ing
s w
ith
Inte
gra
ted
Gas
tric
Aci
dit
yA
bo
ve V
alu
e G
iven
on
X-a
xis
(%)
Post-prandial Integrated Gastric Acidity(mmol.h/L)
Figure 4. Values of the post-prandial integrated gastric acidity stratified for 24-h integrated oesophageal acidity above or below
8.1 mmol.h/L. Results are from all subjects (left panel) (n ¼ 26), subjects with erosive oesophagitis (middle panel) (n ¼ 18) and subjects
with no erosive oesophagitis (right panel) (n ¼ 8). Each panel plots the percentage of records with values of the integrated gastric acidity
above the value indicated on the X-axis. The area under the receiver operating characteristic curve [95% confidence interval] for results
in the left panel is 0.855 [0.779, 0.894], in the centre panel is 0.892 [0.833, 0.952] and in the right panel is 0.614 [0.466, 0.762].
Results are from measurements at baseline and during treatment with each of two different proton pump inhibitors for 1, 2 and 8 days.
PPI RESPONSIVENESS IN GERD WITHOUT OESOPHAGITIS 897
� 2003 Blackwell Publishing Ltd, Aliment Pharmacol Ther 18, 891–905

oesophageal reflux (P < 0.0001). The area under the
ROC curve for these data is 0.69 [0.55, 0.84].
Thus, in subjects with erosive oesophagitis treated
with a proton pump inhibitor, normal oesophageal
reflux is significantly more likely than pathological
oesophageal reflux to be accompanied by lower values
of both the post-prandial (Figure 4) and nocturnal
(Figure 5) gastric acidity. In contrast, in subjects with
no oesophagitis, normal oesophageal reflux is signifi-
cantly more likely to be accompanied by lower values of
nocturnal (Figure 5), but not post-prandial (Figure 4),
gastric acidity.
Figure 6 illustrates the probability of no patholo-
gical reflux as a function of the post-prandial and
0
10
20
30
40
50
60
70
80
90
100
0 300 600 900 1200 1500 1800 2100
Nocturnal Integrated Gastric Acidity (mmol.h/L)
Rec
ord
ings
with
Inte
gra
ted
Gas
tric
Aci
dity
Ab
ove
Val
ue
Giv
eno
n X
-axi
s (%
)
Above 8.1 Below 8.1
0
10
20
30
40
50
60
70
80
90
100
0 300 600 900 1200 1500 1800 2100
Nocturnal Integrated Gastric Acidity (mmol.h/L)
Rec
ord
ing
sw
ith
Inte
grat
edG
astr
icA
cidi
tyA
bove
Val
ueG
iven
onX
-axi
s (%
)
Above 8.1 Below 8.1
0
10
20
30
40
50
60
70
80
90
100
0 300 600 900 1200 1500 1800 2100
Nocturnal Integrated Gastric Acidity (mmol.h/L)
Rec
ord
ing
sw
ith
Inte
gra
ted
Gas
tric
Aci
dity
Ab
ove
Val
ueG
iven
onX
-axi
s (%
)
Above 8.1 Below 8.1
Figure 5. Values of the nocturnal integrated gastric acidity stratified for 24-h integrated oesophageal acidity above or below 8.1 mmol.h/L.
Results are from all subjects (left panel) (n ¼ 26), subjects with erosive oesophagitis (middle panel) (n ¼ 18) and subjects with no erosive
oesophagitis (right panel) (n ¼ 8). Each panel plots the percentage of records with values of the integrated gastric acidity above the value
indicated on the X-axis. The area under the receiver operating characteristic curve [95% confidence interval] for results in the left panel is
0.836 [0.775, 0.896], in the centre panel is 0.837 [0.759, 0.915] and in the right panel is 0.691 [0.547, 0.835]. Results are from
measurements at baseline and during treatment with each of two different proton pump inhibitors for 1, 2 and 8 days.
Post-prandial Gastric Acidity Nocturnal Gastric Acidity
40
50
60
70
80
90
100
0 200 400 600 800 1000 1200
Integrated Post-prandial Gastric Acidity(mmol.h/L)
Pro
bab
ility
of
No
Pat
ho
log
ical
Oes
op
hag
eal
Ref
lux
Erosive Oesophagitis No Erosive Oesophagitis
40
50
60
70
80
90
100
0 300 600 900 1200 1500 1800 2100
Integrated Nocturnal Gastric Acidity (mmol.h/L)
Pro
bab
ility
of
No
Pat
ho
log
ical
Oes
op
hag
eal
Ref
lux
Erosive Oesophagitis No Erosive Oesophagitis
Figure 6. Probability of no pathological oesophageal reflux with different values of the integrated gastric acidity in subjects with or
without erosive oesophagitis. Each value is the percentage of records with no pathological reflux at the indicated value of the integrated
gastric acidity. Results are from 24-h measurements in 18 subjects with erosive oesophagitis and eight subjects with no erosive
oesophagitis at baseline and during treatment with each of two different proton pump inhibitors for 1, 2 and 8 days. Notice that the
vertical axis is truncated at 40. The full lines are the best-fit lines using the equation and parameters given in Table 2.
898 J. D. GARDNER et al.
� 2003 Blackwell Publishing Ltd, Aliment Pharmacol Ther 18, 891–905
nocturnal gastric acidity for GERD subjects with and
without erosive oesophagitis. Both curves for the post-
prandial gastric acidity have the same configuration
in that the curve decreases in a curvilinear fashion
from 100% at no post-prandial gastric acidity to a
second plateau at 60–65% at the highest values of
post-prandial gastric acidity. As pointed out earlier in
this paper, this second plateau reflects the overall
prevalence of records with no pathological oesopha-
geal reflux in the two groups of subjects. At values
between the two plateaux, the curve for subjects with
no oesophagitis is significantly below that for subjects
with erosive oesophagitis, indicating that, during
treatment with a proton pump inhibitor, the preven-
tion of pathological oesophageal reflux requires a
greater decrease in the post-prandial integrated gastric
acidity in subjects without erosive oesophagitis than
in those with erosive oesophagitis.
In Figure 6 (right), the curves for the nocturnal gastric
acidity are closer together than the corresponding
curves for the post-prandial gastric acidity in Figure 6
(left). Like the curves in Figure 6 (left), however, both
curves decrease in a curvilinear fashion from 100%
with no nocturnal gastric acidity to a second plateau at
60–65% with the highest values of nocturnal gastric
acidity. Figure 6 also illustrates that the overall preval-
ence of no pathological oesophageal reflux is the same
in the two groups of GERD subjects, and excludes a
difference in the overall prevalence as an explanation
for the different sensitivity to proton pump inhibitors
between the two groups.
The data in Figure 6 can be fitted by an equation with
an exponential decrease to a plateau with increasing
post-prandial or nocturnal integrated gastric acidity.
The parameters for this equation are given in Table 2.
The high values of R2 indicate that both curves give
good fits of the data illustrated in Figure 6. For both the
post-prandial and nocturnal gastric acidity, the curve
for GERD subjects without erosive oesophagitis is
significantly lower than the corresponding curve for
subjects with erosive oesophagitis (P < 0.0001). This
difference with both post-prandial and nocturnal gastric
acidity is indicated by the significantly lower exponen-
tial coefficients for the data from subjects with erosive
oesophagitis compared with those for the data from
subjects with no oesophagitis. The curves in Figure 6
(left) for the post-prandial gastric acidity are further
apart than the curves in Figure 6 (right) for the
nocturnal gastric acidity. Similarly, the exponential
coefficients in Table 2 differ by a factor of 10 for the
post-prandial gastric acidity, but only by a factor of
2.4 for the nocturnal gastric acidity.
Figure 4 (right) displays the results for subjects with
no erosive oesophagitis and shows that, in terms of the
distribution of values of the post-prandial gastric acidity,
there is no significant difference between records with
and without pathological oesophageal reflux; the area
under the ROC curve for these data does not differ
significantly from 0.50 (P ¼ 0.154). On the other hand,
Figure 6 (left) and Table 2 illustrate that, in subjects
with no oesophagitis, there is a highly significant
relationship between the probability of no pathological
oesophageal reflux and the value of the post-prandial
gastric acidity calculated from the same data as
illustrated in Figure 4 (right). This apparent discrep-
ancy results from the fact that the analyses in Figure 4
(right) are independent of the prevalence of pathological
oesophageal reflux, whereas those in Figure 6 (left)
Table 2. Parameters for the curve descri-
bing the probability of no pathological
oesophageal reflux as a function of the post-
prandial or nocturnal integrated gastric
acidity in gastro-oesophageal reflux disease
(GERD) subjects treated with a proton
pump inhibitor
Exponential coefficient
[(1/(mmol.h/L)) · 10)3] R2
Post-prandial integrated gastric acidity
Erosive oesophagitis 1.91 (0.038) 0.967
No erosive oesophagitis 20.17 (2.22) 0.790
Nocturnal integrated gastric acidity
Erosive oesophagitis 1.01 (0.025) 0.883
No erosive oesophagitis 2.44 (0.184) 0.596
Parameter values are from a least-squares fit of the data illustrated in Figure 6 from 18 GERD
subjects with erosive oesophagitis and eight subjects with no erosive oesophagitis at baseline
and during days 1, 2 and 8 of treatment with each of two proton pump inhibitors. Values in
parentheses are the standard errors. The equation fitted was Y ¼ plateau + (span · e– aX),
where span ¼ 100 ) plateau. All results for the post-prandial integrated gastric acidity were
fitted together and all values for the nocturnal integrated gastric acidity were fitted together.
All data were fitted by constraining the value of the plateau to 62.
PPI RESPONSIVENESS IN GERD WITHOUT OESOPHAGITIS 899
� 2003 Blackwell Publishing Ltd, Aliment Pharmacol Ther 18, 891–905

depend critically on the prevalence of oesophageal
reflux at all values of the post-prandial gastric acidity.
We have discussed this phenomenon previously,8, 15
and it is described in detail elsewhere.16, 17
If we examine the values of the post-prandial gastric
acidity below 200 mmol.h/L in Figure 4 (right), it is
clear that values with no pathological oesophageal
reflux are consistently below those with pathological
reflux (even though the overall distributions are not
significantly different). These differences correspond to
and account for the increasing probability of no
pathological oesophageal reflux at values of the post-
prandial gastric acidity below 200 mmol.h/L in Figure 6
(left).
DISCUSSION
The main purpose of the present analyses was to
compare the relationship between gastric acidity and
oesophageal acidity during treatment with a proton
pump inhibitor in GERD subjects with and without
erosive oesophagitis. In previous studies, we have found
that GERD subjects exhibit increased meal-stimulated
gastric acid secretion as well as increased post-prandial
gastric acidity.9 We considered the possibility that,
during treatment with a proton pump inhibitor, GERD
subjects with no erosive oesophagitis might have
increased gastric acidity and an accompanying increase
in oesophageal acidity that could account for their
reduced symptomatic response to treatment. We exam-
ined the distribution of values of oesophageal and
gastric acidity in GERD subjects with and without
erosive oesophagitis during treatment with a proton
pump inhibitor, and found no difference between the
groups for either oesophageal or gastric acidity. These
results indicate that the reduced symptomatic response
to proton pump inhibitor treatment in subjects with no
oesophagitis6 cannot be attributed to increased oeso-
phageal or gastric acidity per se.
Previously, we have found that, at a given value of the
integrated gastric acidity during treatment with a
proton pump inhibitor, the proportion of GERD subjects
with pathological oesophageal reflux is significantly
higher than the proportion of GERD subjects without
pathological oesophageal reflux.8 In addition, there is a
precise quantitative relationship between the integrated
gastric acidity and the probability of pathological
oesophageal reflux. In the present study, we found that
these previous findings also applied to GERD subjects
stratified on the basis of whether or not they had erosive
oesophagitis. That is, at a given value of the integrated
gastric acidity during treatment with a proton pump
inhibitor, the percentage of values of the integrated
gastric acidity with pathological oesophageal reflux was
significantly higher than the percentage of values with
no pathological oesophageal reflux in both groups of
GERD subjects. We also found that the probability of
pathological oesophageal reflux could be predicted with
high precision from the value of the integrated gastric
acidity using an equation that gave the probability of
pathological oesophageal reflux as an exponential
function of the integrated gastric acidity.
However, the magnitude of the quantitative relation-
ship between the integrated gastric acidity and the
prevalence of pathological oesophageal reflux differed
significantly between the two groups of GERD subjects.
First, the area under the ROC curve for pathological vs.
no pathological oesophageal acidity for subjects with
erosive oesophagitis was significantly higher than that
for subjects with no oesophagitis. These results indicate
that, in subjects with erosive oesophagitis, the probab-
ility that a randomly selected subject with pathological
oesophageal reflux will have a higher value of the
integrated gastric acidity than a randomly selected
subject with no pathological oesophageal reflux is
significantly higher than the probability in subjects
with no oesophagitis. Second, we found that, at a given
value of the integrated gastric acidity during treatment
with a proton pump inhibitor, GERD subjects with no
oesophagitis were significantly more likely than subjects
with erosive oesophagitis to experience pathological
oesophageal reflux.
As mentioned previously, compared with subjects with
erosive oesophagitis, the response to proton pump
inhibitors in GERD subjects without erosive oesophagitis
is paradoxical in that these subjects generally have
lower oesophageal acid exposure,4, 5 but have less relief
of heartburn during treatment with a proton pump
inhibitor.6 The present findings resolve this paradox by
showing that GERD subjects with no oesophagitis are
relatively refractory to the pharmacodynamic effects of
proton pump inhibitors on gastric and oesophageal
acidity. Previous analyses of oesophageal and gastric
acidity, as well as the effects of proton pump inhibitors
on these measures, have lacked suitable techniques for
quantifying acidity. Traditionally, the time at pH £ 4
has been used to assess oesophageal as well as gastric
acidity.1, 18, 19 In the present study, we did not use
900 J. D. GARDNER et al.
� 2003 Blackwell Publishing Ltd, Aliment Pharmacol Ther 18, 891–905

these measures because they are less sensitive than the
integrated acidity for evaluating gastric and oesopha-
geal pH recordings and for assessing the relationship
between the integrated gastric acidity and the probab-
ility of no pathological oesophageal reflux during
treatment with a proton pump inhibitor.4, 7, 8
The present results, however, may apply only to GERD
subjects treated with a proton pump inhibitor. Studies
in similar subjects treated with a histamine H2-receptor
antagonist might give different results, because these
agents have a different duration of action on gastric acid
secretion, different effects on gastric pH during fasting
and inhibit fasting gastric acid secretion to a greater
extent than meal-stimulated secretion.20–22
It is important to recognize that the two groups of GERD
subjects were not selected on the basis of matching
features, such as age, gender, weight, previous medica-
tions, etc., and contained unequal numbers of subjects
(18 vs. 8). These characteristics of the study may have
introduced bias that influenced our results. In addition, it
is important to recognize that the present findings apply
only to the subset of GERD subjects with no oesophagitis
who have pathological oesophageal acid exposure,
because subjects selected for the present study had
oesophageal pH £ 4 for at least 10% of the 24-h
baseline recording period. (Approximately 50% of GERD
subjects with no oesophagitis have pathological oeso-
phageal acid exposure.1) The selection of subjects with
pathological oesophageal acid exposure resulted in two
groups of GERD subjects that were similar in terms of
gastric acidity, oesophageal acidity and the overall
prevalence of pathological oesophageal reflux at baseline
and during treatment with a proton pump inhibitor.
These similarities made it possible to analyse the rela-
tionship between pathological oesophageal reflux and the
integrated gastric acidity during treatment with a proton
pump inhibitor without having to adjust for between-
group differences in gastric or oesophageal acidity or the
overall prevalence of pathological oesophageal reflux.
We found that the post-prandial integrated gastric
acidity and nocturnal integrated gastric acidity were at
least as effective as the 24-h integrated gastric acidity in
distinguishing between pathological and non-patholo-
gical oesophageal reflux. This finding was anticipated,
because proton pump inhibitors act on gastric acid
secretion for at least 24-h and are highly effective in
reducing post-prandial as well as nocturnal gastric
acidity.1, 2 The distribution of the values of the post-
prandial and nocturnal gastric acidity in GERD subjects
with erosive oesophagitis did not differ from that in
subjects with no oesophagitis. These results indicate
that the reduced symptomatic response to proton pump
inhibitor treatment in subjects with no erosive oesopha-
gitis6 cannot be attributed to a difference in post-
prandial or nocturnal gastric acidity per se.
Previously, we have found that the meal-stimulated
gastric acid secretion and post-prandial integrated
gastric acidity from 09.00 to 22.00 h are significantly
higher in GERD subjects than in control subjects.9 The
integrated gastric acidity during the entire 24-h record-
ing period and during the nocturnal period from 22.00
to 09.00 h does not differ significantly between GERD
subjects and control subjects. As pathological oesopha-
geal reflux during the post-prandial period is common in
GERD,1 and as we have found that, in GERD subjects,
gastric acidity and secretion are significantly increased
during the post-prandial period,9 it seems likely that this
increased gastric acidity is an important aetiological
factor in GERD. Moreover, the oesophageal acid con-
centration during oesophageal reflux episodes correlates
with the post-prandial gastric acidity in GERD subjects,
but not in control subjects.9
The present analyses indicate that the reduced respon-
siveness to proton pump inhibitors in subjects with no
oesophagitis occurs primarily with regard to the post-
prandial gastric acidity. In these subjects, reducing the
post-prandial gastric acidity with a proton pump
inhibitor is significantly less effective in reducing the
likelihood of pathological oesophageal reflux than in
subjects with erosive oesophagitis. Although a similar
phenomenon occurs with the nocturnal gastric acidity,
the difference in the probability of pathological oeso-
phageal reflux between subjects with and without
erosive oesophagitis is clearly less than that found with
the post-prandial gastric acidity. The finding that most
subjects with GERD experience heartburn after a meal,1
and that the post-prandial gastric acidity in subjects
with no erosive oesophagitis is less responsive to proton
pump inhibitors, is consistent with and can account for
the reduced symptomatic response to proton pump
inhibitors in this group of GERD subjects.
The effect of gastric antisecretory agents on gastric
acid secretion can be partitioned into the effect on
volume secretion and the effect on the acid concentra-
tion in the secreted fluid. The finding that GERD subjects
with no erosive oesophagitis are relatively resistant to
the effects of proton pump inhibitors on the pathological
oesophageal reflux, and that this resistance occurs
PPI RESPONSIVENESS IN GERD WITHOUT OESOPHAGITIS 901
� 2003 Blackwell Publishing Ltd, Aliment Pharmacol Ther 18, 891–905

primarily during meal-stimulated gastric acid secretion,
raises the possibility that proton pump inhibitors have a
smaller effect on the post-prandial volume secretion in
subjects with no oesophagitis than in subjects with
erosive oesophagitis. The resulting increased volume
could predispose these subjects to post-prandial oeso-
phageal reflux. A smaller effect of proton pump
inhibitors on the post-prandial volume alone should
also lead to increased post-prandial gastric acidity
resulting from greater meal-stimulated gastric acid
secretion (higher volume secreted with the same acid
concentration). In the present analyses, however, we
found that the post-prandial integrated gastric acidity
in subjects with no oesophagitis was not significantly
different from that in subjects with erosive oesopha-
gitis under basal conditions or during treatment with
a proton pump inhibitor. It may be that, although the
post-prandial integrated gastric acidity is a good
surrogate for meal-stimulated gastric acid secretion
under basal conditions,9 this may not be the case
during treatment with a proton pump inhibitor. As
pointed out previously,9 during treatment with a
proton pump inhibitor, it is often not possible to
measure meal-stimulated gastric acid secretion by
in vivo autotitration.23 With proton pump inhibitor
treatment, the post-prandial gastric pH frequently fails
to return to below pH 2, making it impossible to
calculate secretion.
Another possible explanation for our findings is that,
during proton pump inhibitor treatment of GERD
subjects with no oesophagitis, there is no absolute
increase in post-prandial gastric volume secretion, but
only an increase in volume secretion relative to the acid
concentration in the secreted fluid. Such a situation
could result in pathological oesophageal reflux in
subjects with no oesophagitis, but not in subjects with
erosive oesophagitis, even though both groups have the
same value of the post-prandial integrated gastric
acidity.
An anonymous reviewer pointed out that it is
important to consider the possible effect of transient
lower oesophageal sphincter relaxations, which are
thought to be the main mechanism underlying post-
prandial gastro-oesophageal reflux,24–30 on the differ-
ences between subjects with and without erosive
oesophagitis observed in the present study. The reviewer
pointed out that transient lower oesophageal sphincter
relaxations are probably triggered by accommodation
differences between GERD patients and normal subjects,
resulting in a vagal reflex that causes such relaxations
without a swallow stimulus from above. Thus, GERD
subjects without oesophagitis may have more post-
prandial transient lower oesophageal sphincter relaxa-
tions than those with erosive oesophagitis due to a
larger post-prandial gastric fluid secretion. Subjects with
erosive oesophagitis may have more fundamental lower
oesophageal sphincter dysfunction that causes excessive
oesophageal acid exposure at times other than the post-
prandial period and results in erosive injury to the
oesophageal mucosa.
The data for the probability of no pathological
oesophageal reflux as a function of the 24-h integrated
gastric acidity were fitted with an equation that
included an initial plateau when the probability of
no pathological oesophageal reflux was 100%, fol-
lowed by an exponential decrease in the probability to
a second plateau that reflected the overall prevalence
of no pathological oesophageal reflux (62%). On the
other hand, with both the post-prandial and nocturnal
gastric acidity, the data for the probability of patho-
logical oesophageal reflux were fitted by an equation
that did not include an initial plateau at a probability
of 100%. As the data for the prevalence of patholo-
gical oesophageal reflux were the same in the two
analyses, the different equations reflect different distri-
butions of the values for the probability of pathological
oesophageal reflux with respect to the different meas-
ures of integrated gastric acidity. In the analyses of the
post-prandial and nocturnal gastric acidity, although
there were a number of lower values of gastric acidity
where the probability of no pathological oesophageal
reflux was 100%, these values did not have a
sufficiently large impact on the fit of the entire data
set to require an initial plateau in the equation. It is
important to emphasize, however, that the equations
used to relate the gastric acidity to the probability of
no pathological oesophageal reflux have no patho-
physiological significance that we are aware of. They
simply give the mathematical relationships that best
describe the data.
ACKNOWLEDGEMENTS
We thank the anonymous reviewer who made major
contributions to this paper by suggesting the current
layout of the figures and tables and by pointing out the
potential role of transient lower oesophageal sphincter
relaxations in our findings.
902 J. D. GARDNER et al.
� 2003 Blackwell Publishing Ltd, Aliment Pharmacol Ther 18, 891–905

This work was supported by grants from the Janssen
Pharmaceutica Research Foundation to the Oklahoma
Foundation for Digestive Research and to Science for
Organizations, Inc.
REFERENCES
1 Dent J. Gastro-oesophageal reflux disease. Digestion 1998; 59:
433–45.
2 Robinson M. Medical management of gastroesophageal reflux
disease. In: Castell DO, Richter JE, eds. The Esophagus, 3rd
edn. Philadelphia: Lippincott Williams & Wilkins, 1999: 447–
62.
3 Chiba N, De Gara CJ, Wilkinson JM, Hunt RH. Speed of healing
and symptom relief in grade II to IV gastroesophageal reflux
disease: a meta-analysis. Gastroenterology 1997; 112: 1798–
810.
4 Gardner JD, Rodriguez-Stanley S, Robinson M. Integrated
acidity and the pathophysiology of GERD. Am J Gastroenterol
2001; 96: 1363–70.
5 Robertson D, Aldersley M, Shepherd H, Smith CL. Patterns of
acid reflux in complicated oesophagitis. Gut 1987; 28: 1484–8.
6 Carlsson R, Dent J, Watts R, et al. Gastro-oesophageal reflux
disease in primary care: an international study of different
treatment strategies with omeprazole. Eur J Gastroenterol
Hepatol 1998; 10: 119–24.
7 Gardner JD, Perdomo C, Sloan S, et al. Integrated acidity and
rabeprazole pharmacology. Aliment Pharmacol Ther 2002;
16: 455–64.
8 Gardner JD, Sloan S, Miner PB Jr, Robinson M. Determination
of the reduction in gastric acidity necessary to prevent path-
ologic oesophageal reflux in GERD patients treated with a
proton pump inhibitor. Aliment Pharmacol Ther 2003; 17:
955–64.
9 Gardner JD, Sloan S, Miner PB Jr, Robinson M. Meal-stimu-
lated gastric acid secretion and integrated gastric acidity in
gastro-oesophageal reflux disease. Aliment Pharmacol Ther
2003; 17: 945–53.
10 Hetzel DJ, Dent J, Reed WD, et al. Healing and relapse of severe
peptic esophagitis after treatment with omeprazole. Gastro-
enterology 1988; 95: 903–12.
11 Swets JA. Measuring the accuracy of diagnostic systems.
Science 1988; 240: 1285–93.
12 McNeil BJ, Keeler E, Adelstein SJ. Primer on certain elements
of medical decision making. N Engl J Med 1975; 293:
211–5.
13 Hanley JA, McNeil BJ. A method of comparing the areas under
a receiver operating characteristic (ROC) curve. Radiology
1982; 143: 29–36.
14 Hanley JA, McNeil BJ. The meaning and use of the area under
receiver operating characteristic curves derived from the same
cases. Radiology 1983; 148: 839–43.
15 Gardner JD, Sloan S, Robinson M, Miner PB Jr. Heartburn
severity can predict pathologic oesophageal reflux in GERD
patients treated with a proton pump inhibitor. Aliment
Pharmacol Ther 2003; 18: 133–40.
16 Motulsky H. Interpreting laboratory tests: introduction to
Bayesian thinking. In: Intuitive Biostatistics. New York:
Oxford University Press, 1995: 129–39.
17 Hoffrage U, Lindsey S, Hertwig R, Gigerenzer G. Communi-
cating statistical information. Science 2000; 290: 2261–2.
18 Schindlbeck NE, Heinrich C, Konig A, Dendorfer A, Pace F,
Muller-Lissner SA. Optimal thresholds, sensitivity, and
specificity of long-term pH-metry for detection of gastr-
oesophageal reflux disease. Gastroenterology 1987; 93:
85–90.
19 Jamieson JR, Stein HJ, DeMeester TR, et al. Ambulatory 24-h
esophageal monitoring: normal values, optimal thresholds,
specificity, sensitivity, and reproducibility. Am J Gastroenterol
1992; 87: 1102–11.
20 Hurlimann S, Abbuhl B, Inauen W, Halter F. Comparison of
acid inhibition by either oral high-dose ranitidine or omep-
razole. Aliment Pharmacol Ther 1994; 8: 193–201.
21 Hedenstrom H, Alm C, Kraft M, Grahnen A. Intragastric pH
after oral administration of single doses of ranitidine effer-
vescent tablets, omeprazole capsules and famotidine fast-dis-
solving tablets to fasting healthy volunteers. Aliment
Pharmacol Ther 1997; 11: 1137–41.
22 Hatlebakk JG, Berstad A. Pharmacokinetic optimisation in the
treatment of gastro-oesophageal reflux disease. Clin Pharma-
cokinet 1996; 31: 386–406.
23 Gardner JD, Ciociola AA, Robinson M. Measurement of meal-
stimulated gastric acid secretion by in vivo gastric autotitra-
tion. J Appl Physiol 2002; 92: 427–34.
24 Holloway RH, Bryant W, Dent J. Failure of transient lower
oesophageal sphincter relaxation in response to gastric dis-
tension in patients with achalasia: evidence for neural medi-
ation of transient lower oesophageal sphincter relaxations.
Gut 1989; 30: 762–7.
25 Holloway RH, Koeyan P, Dent J. Provocation of transient lower
esophageal sphincter relaxation by meals with symptomatic
gastroesophageal reflux. Dig Dis Sci 1991; 36: 1034–9.
26 Boulant J, Mathieu S, D’Amato M, Abergel A, Dapoigny M,
Bommelaer G. Cholecystokinin in transient lower esophageal
sphincter relaxation due to gastric distension in humans. Gut
1997; 40: 575–81.
27 Boeckxstaens GE, Hirsch DP, Fakhry N, Holloway RH,
D’Amato M, Tytgat GNJ. Involvement of cholecystokininA
receptors in transient lower esophageal sphincter relaxation
triggered by gastric distension. Am J Gastroenterol 1998; 93:
1823–8.
28 Clave P, Gonzalez A, Moreno A, et al. Endogenous cholecy-
stokinin enhances postprandial gastroesophageal reflux in
humans through extrasphincteric receptors. Gastroenterology
1998; 115: 597–604.
29 Hirsch DP, Holloway RH, Tytgat GN, Boeckstaens GE.
Involvement of nitric oxide in human transient lower eso-
phageal sphincter relaxations and esophageal primary peri-
stalsis. Gastroenterology 1998; 115: 1374–80.
30 Zerbib F, Bruley Des Varannes S, Scarpignato C, Leray V,
D’Amato M, Roze C. Endogenous cholecystokinin in post-
prandial esophageal sphincter function and fundic tone in
humans. Am J Physiol 1998; 275: G1266–73.
PPI RESPONSIVENESS IN GERD WITHOUT OESOPHAGITIS 903
� 2003 Blackwell Publishing Ltd, Aliment Pharmacol Ther 18, 891–905

APPENDIX A
This appendix describes the analytical methods used
in the present paper. The data used are from a
previous publication in which we determined the
value of the 24-h integrated oesophageal acidity that
gave optimal sensitivity and specificity for distinguish-
ing between GERD subjects and normal subjects (see
Table A1).8
Description of values in Table A1
(a) Values of the integrated oesophageal acidity from
GERD subjects were ordered from lowest to highest.
The values are recorded in column A and the ranks
(1–57) are recorded in column B.
(b) Values of the integrated oesophageal acidity from
normal subjects were ordered from lowest to
highest. The values are recorded in column A
immediately following those from GERD subjects
and the ranks (1–26) are recorded in column B.
(c) All values of the integrated oesophageal acidity in
column A were ordered from lowest to highest
whilst maintaining the rank values recorded in
columns B and C.
(d) Each value in columns B and C was carried down
the column to the next recorded value. Blanks
before the first recorded value in column B or C
were assigned a value of zero.
(e) The values in column B now indicate the number of
GERD subjects with values of the integrated oeso-
phageal acidity equal to or less than the corres-
ponding value in column A.
(f) The values in column C now indicate the number of
normal subjects with values of the integrated
oesophageal acidity equal to or less than the
corresponding value in column A.
(g) Each value in column B was divided by the total
number of GERD subjects (57), subtracted from 1,
multiplied by 100 and the result recorded in the
corresponding space in column D. The values in
column D give the percentage of GERD subjects with
Table A1. Integrated oesophageal acidity
providing optimal sensitivity and specificity
for distinguishing between subjects with
gastro-oesophageal reflux disease (GERD)
and normal subjects
A
Integrated oesophageal
acidity (mmol.h/L)
B
Rank
GERD
C
Rank
normal
D
Per cent
GERD
E
Per cent
normal
F
Difference
G
Per cent
GERD
H
Curve
fit
0.33 0 1 100 96 4 0 3
0.70 0 2 100 92 8 0 6
0.71 0 3 100 88 12 0 6
0.71 1 3 98 88 10 25 6
1.05 1 4 98 85 14 20 9
1.06 1 5 98 81 17 17 9
1.55 1 6 98 77 21 14 13
1.73 1 7 98 73 25 13 14
1.79 1 8 98 69 29 11 15
1.80 1 9 98 65 33 10 15
1.82 1 10 98 62 37 9 15
1.87 1 11 98 58 41 8 15
1.92 2 11 96 58 39 15 16
2.06 2 12 96 54 43 14 17
2.11 2 13 96 50 46 13 17
2.26 3 13 95 50 45 19 18
2.63 3 14 95 46 49 18 20
n n n n n n n n
8.1 16 23 72 12 60 41 44
n n n n n n n n
95.20 55 26 4 0 4 68 64
98.15 56 26 2 0 2 68 64
120.38 57 26 0 0 0 69 64
Column A gives results for the 24-h integrated oesophageal acidity from 26 healthy subjects
and 57 subjects with gastro-oesophageal reflux disease (GERD). To reduce the size of the table,
values indicated by n have been omitted.
904 J. D. GARDNER et al.
� 2003 Blackwell Publishing Ltd, Aliment Pharmacol Ther 18, 891–905

values of the integrated oesophageal acidity greater
than the corresponding value of the integrated
oesophageal acidity given in column A. These
values give the sensitivity that is associated with
the corresponding value in column A.
(h) Each value in column C was divided by the total
number of normal subjects (26), subtracted from 1,
multiplied by 100 and the result recorded in the
corresponding space in column E. The values in
column E give the percentage of normal subjects
with values of the integrated oesophageal acidity
greater than the corresponding value of the integ-
rated oesophageal acidity given in column A. These
values give 100 ) specificity or the percentage of
false positives associated with the corresponding
value in column A.
(i) The values in column E were subtracted from the
corresponding values in column D and the results
recorded in column F. The largest value in column
F corresponds to the value of the integrated
oesophageal acidity in column A that gives the
optimal sensitivity and specificity. In this study, this
value of the integrated oesophageal acidity was
8.1 mmol.h/L.
(j) The value in column B was divided by the sum of
the corresponding values in columns B and C,
multiplied by 100 and the result recorded in
column G. The values in column G give the
percentage of subjects with GERD, or the positive
predictive value, at each value of the integrated
oesophageal acidity given in column A. The values
in column C can also be used to calculate the
negative predictive value.
(k) The values in column H represent the best fit of the
values in column G as a function of the values in
column A using the equation Y ¼ Ymax(1 ) e– KX),
where Ymax ¼ 63.8 [62.1, 65.5], K ¼ 0.1454
[0.1333, 0.1575] and R2 ¼ 0.958 (see Figure A1).
Values in square brackets give the 95% confidence
interval.
00
1020
20
3040
40
5060
60
7080
80
90100
100 120Column A Column E Column A
Co
lum
n D
GE
RD
(%)
Integrated Oesophageal Acidity (mmol.h/L)
Rec
ord
ing
s w
ith
Inte
gra
ted
Oes
op
hag
eal
Aci
dit
y A
bo
ve V
alu
e o
n X
-axi
s (%
)
GERD - ColumnD Normal - Column E
0
10
20
30
40
50
60
70
80
90
100
0 10 20 30 40 50 60 70 80 90 100
Normal (%)
Probability of GERD with Different Values forIntegrated Oesophageal Acidity
0102030405060708090
100
Integrated Oesophageal Acidity (mmol.h/L)
Co
lum
n G
Pro
bab
ility
of
GE
RD
(%
)
0 20 40 60 80 100 120
Figure A1. Graphs of values in Table A1. Left panel. The values in columns D and E are plotted on the Y-axis as a function of the
corresponding value in column A on the X-axis. These graphs give the cumulative distributions of the values of the integrated
oesophageal acidity in gastro-oesophageal reflux disease (GERD) (column D) and normal (column E) subjects. Middle panel. The values for
GERD subjects in column D are plotted on the Y-axis as a function of the corresponding value for normal subjects in column E on
the X-axis. This plot gives the receiver operating characteristic curve. The values in column E are plotted on the Y-axis as a function of the
corresponding value in column E on the X-axis. This plot gives the identity line. Right panel. The values in column G are plotted on the
Y-axis as a function of the corresponding value in column A for the integrated oesophageal acidity on the X-axis. This plot gives the
probability of GERD (or the positive predictive value) for each value of the integrated oesophageal acidity. The full line is the best-fit
equation whose parameter values are given in item (k) (see text).
PPI RESPONSIVENESS IN GERD WITHOUT OESOPHAGITIS 905
� 2003 Blackwell Publishing Ltd, Aliment Pharmacol Ther 18, 891–905