Optimizing the treatment of oesophageal cancer
263
Optimizing the treatment of oesophageal cancer Citation for published version (APA): Van De Voorde, L. (2020). Optimizing the treatment of oesophageal cancer: New insights and the role of hypoxia. [Doctoral Thesis, Maastricht University]. Maastricht University. https://doi.org/10.26481/dis.20200506lv Document status and date: Published: 01/01/2020 DOI: 10.26481/dis.20200506lv Document Version: Publisher's PDF, also known as Version of record Please check the document version of this publication: • A submitted manuscript is the version of the article upon submission and before peer-review. There can be important differences between the submitted version and the official published version of record. People interested in the research are advised to contact the author for the final version of the publication, or visit the DOI to the publisher's website. • The final author version and the galley proof are versions of the publication after peer review. • The final published version features the final layout of the paper including the volume, issue and page numbers. Link to publication General rights Copyright and moral rights for the publications made accessible in the public portal are retained by the authors and/or other copyright owners and it is a condition of accessing publications that users recognise and abide by the legal requirements associated with these rights. • Users may download and print one copy of any publication from the public portal for the purpose of private study or research. • You may not further distribute the material or use it for any profit-making activity or commercial gain • You may freely distribute the URL identifying the publication in the public portal. If the publication is distributed under the terms of Article 25fa of the Dutch Copyright Act, indicated by the “Taverne” license above, please follow below link for the End User Agreement: www.umlib.nl/taverne-license Take down policy If you believe that this document breaches copyright please contact us at: [email protected] providing details and we will investigate your claim. Download date: 12 Jul. 2022
-
Upload
khangminh22 -
Category
Documents
-
view
3 -
download
0
Transcript of Optimizing the treatment of oesophageal cancer

Optimizing the treatment of oesophageal cancer
Citation for published version (APA):
Van De Voorde, L. (2020). Optimizing the treatment of oesophageal cancer: New insights and the role ofhypoxia. [Doctoral Thesis, Maastricht University]. Maastricht University.https://doi.org/10.26481/dis.20200506lv
Document status and date:Published: 01/01/2020
DOI:10.26481/dis.20200506lv
Document Version:Publisher's PDF, also known as Version of record
Please check the document version of this publication:
• A submitted manuscript is the version of the article upon submission and before peer-review. There canbe important differences between the submitted version and the official published version of record.People interested in the research are advised to contact the author for the final version of the publication,or visit the DOI to the publisher's website.• The final author version and the galley proof are versions of the publication after peer review.• The final published version features the final layout of the paper including the volume, issue and pagenumbers.Link to publication
General rightsCopyright and moral rights for the publications made accessible in the public portal are retained by the authors and/or other copyrightowners and it is a condition of accessing publications that users recognise and abide by the legal requirements associated with theserights.
• Users may download and print one copy of any publication from the public portal for the purpose of private study or research.• You may not further distribute the material or use it for any profit-making activity or commercial gain• You may freely distribute the URL identifying the publication in the public portal.
If the publication is distributed under the terms of Article 25fa of the Dutch Copyright Act, indicated by the “Taverne” license above,please follow below link for the End User Agreement:
www.umlib.nl/taverne-license
Take down policyIf you believe that this document breaches copyright please contact us at:
providing details and we will investigate your claim.
Download date: 12 Jul. 2022

Optimizing the treatment of oesophageal cancerNEW IN SIGHTS AND THE ROLE OF HYPOXIA
Lien Van De Voorde

Optimizing the treatment of oesophageal cancer:New insights and the role of hypoxia
© Lien A. D. Van De Voorde, 2020
ISBN: 978-94-6380-772-2
Book design & lay-out: Wendy Schoneveld, www.wenziD.nlPrint: ProefschriftMaken

Optimizing the treatment of oesophageal cancerNew insights and the role of hypoxia
ACADEMISCH PROEFSCHRIFT
Ter verkrijging van de graad Doctoraan de Universiteit van Maastricht , op gezag van
de rector Magnificus, Prof. dr. Rianne M. Letschert,volgens het besluit van het College van Decanen,
In het openbaar te verdedigen op 6 mei 2020
door
Lien Agnes Dymphna Van De Voorde
Geboren 28 mei 1982 te Brugge

Promotor: Prof. Dr. Philippe Lambin
Copromotoren: Dr. Maaike Berbée Dr. Ir. Wouter van Elmpt
Beoordelingscommissie: Prof. dr. M. Van Engeland Prof. dr. D. De Ruysscher
Prof. B.M.P. Aleman Dr. Lieven Depypere


CONTENTS
General introduction and outline of the thesis 11
PART I The best preparation for tomorrow is doing your best today
Chapter 1 A qualitative synthesis of the evidence behind elective lymph node irradiation in oesophageal cancer
29
Chapter 2 The influence of gastric filling instructions on dose delivery in patients with oesophageal cancer: A prospective study
55
Chapter 3 Cervical esophageal cancer: a gap in cancer knowledge 73
PART II New life for old drugs or data?
Chapter 4 4D-CT imaging to assess radiomics feature stability: an investigation for thoracic cancers
105
Chapter 5 Can metformin improve ‘the tomorrow’ of patients treated for oesophageal cancer ?
151
PART III Exploiting hypoxia in oesophageal cancer
Chapter 6 Hypoxia and hypoxia response-associated molecular markers in esophageal cancer: a systematic review
169
Chapter 7 A phase 1 ‘window-of-opportunity’ trial testing evofosfamide (TH-302), a tumour-selective hypoxia-activated cytotoxic prodrug, with preoperative chemoradiotherapy in oesophageal adenocarcinoma patients
199

Discussion
Chapter 8 General discussion and future perspectives 217
Chapter 9 Summary/samenvatting 241
Chapter 10 AppendicesValorization addendumCurriculum vitae & PhD PortfolioPersonal acknowledgements
251

ABBREVIATIONS
AC AdenocarcinomaAJCC American Joint Committee on cancerAMPK Adenosine monophosphate-activated protein kinaseAnti-PD-1 Anti-programmed cell death-1ART Adaptive radiation therapyART DECO A Randomized Trial of Dose Escalation in definitive Chemoradiotherapy
for patients with Oesophageal cancerASCO American society of clinical oncologyATP Adenosine triphosphateBMI Body mass indexBr-IPM Bromo-isophosporamide mustardCA IX Carbonic anhydrase 9CAT Computed assisted theragnosticsCCC Concordance correlation coefficientCEC Cervical oesophageal cancerCT Computed TomographyCTLA4 Cytotoxic T-lymphocyte–associated antigen 4CTV Clinical target volumeCROSS ChemoRadiotherapy for Oesophageal cancer followed by Surgery Study4D-CT Four-dimensional computed tomography3DCRT Three-dimensional conformal radiotherapydCRT Definitive chemoradiotherapyDFS Disease-free survivalDICOM Digital Imaging and Communications in MedicineDMFS Distant metastasis free survivalDW MRI Diffusion-weighted Magnetic Resonance ImagingD5 Dose to 5% of the target volumeD95 Dose to 95% of the target volume D99 Dose to 99% of the target volumeD107 Dose to 107% of the target volumeDmax Dose maximumDmin Dose minimumDmean Mean doseECF Epirubicin, cisplatin and 5-FUENI Elective nodal irradiation ESCC Oesophageal squamous cell cancerEUS Endoscopic Ultrasound18F-FAZA 18F-fluoroazomycin arabinosideFDG-PET CT Fluorodeoxyglucose positron emission computed tomography 18F-FETNIM 18F- fluoroerythronitroimidazole

18F-HX4 18F-fluortanidazoleFLOT4 5-fluorouracil, leucovorin, oxaliplatin and docetaxelFMISO PET Fluoromisonidazole positron emission tomographyFOLFOX Folinic acid, fluorouracil and oxaliplatin 5FU 5-fluorouracilGEJ Gastro-oesophageal junctionGLUT-1 Glucose transporter 1GTV Gross tumour volumeHAP Hypoxia-activated prodrug HF Hypoxic fractionHIF-1α Hypoxia-inducible factor 1-alphaIHC ImmunohistochemistryIMRT Intensity modulated radiotherapykV CBCT Kilovoltage cone beam computed tomographyMAGIC MRC Adjuvant Gastric Infusional Chemotherapymm MillimetreMRC Medical Research CouncilNADPH Nicotinamide adenine dinucleotide phosphatenCT Neoadjuvant chemotherapynCRT Neoadjuvant chemoradiotherapyOS Overall survivalpCR Pathologic complete responsePICOS Patient Intervention Comparison Outcome Study typepTNM Pathologic tumour node metastasis staging PTV Planning target volumeRLHC Rapid Learning Health CareSANO Surgery As Needed for Oesophageal cancerSCC Squamous cell cancerTBR Tumour-to-background ratioTNM Tumour-node-metastasesTH-302 Former abbreviation of evofosfamideTOC Thoracic oesophageal cancerUICC International union against cancerUK United KingdomUSA United States of AmericaVMAT Volumetric arc therapyypTNM Post neoadjuvant Tumour-node-metastasis staging

10

11
GENERAL INTRODUCTION AND OUTLINE OF THE THESIS
BACKGROUND AND EPIDEMIOLOGY
Oesophageal cancer is the eight most common cancer worldwide, and the sixth most common cause of cancer death1. In 2018, more than 2500 patients were diagnosed with oesophageal cancer in the Netherlands. Among patients with this malignancy, the percentage of males is higher, as is the percentage of patients in their 60-70s. Complaints of dysphagia, progressive weight loss or nausea often lead to the diagnosis of this disease. Unfortunately, most patients have already advanced stage at diagnosis making curative treatment a challenge. There are two main histopathological subtypes in oesophageal cancer: squamous cell carcinoma (SCC) and adenocarcinoma (AC) with a striking etiologic heterogeneity. Smoking, alcohol intake and chronic inflammation of the mucosa are well-known risk factors in the development of squamous cell carcinoma. These tumours are predominately found in the middle or high part of the oesophagus. Only a minority of SCC are cervical oesophageal carcinomas located between the musculus cricopharyngeus and the sternal notch. In the Western world there is a rapidly rising incidence of the adenocarcinoma subtype due to changed life style factors. Obesity and lifetime risk factors such as gastro-oesophageal reflux with the occurrence of Barrett’s oesophagus predispose development of oesophageal adenocarcinoma. These histological subtypes are found in the distal part of the oesophagus or located at the gastro-oesophageal junction2. Althoug most studies do not differentiate between both histologies, there is increasing evidence that they differ in terms of epidemiology, tumour biology and behavior.
STAGING
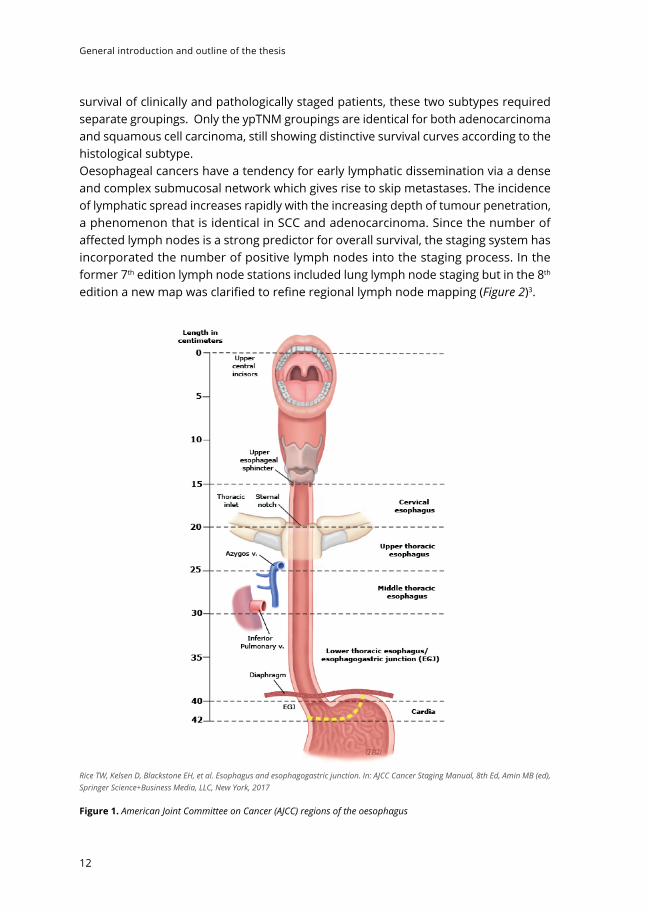
The first diagnostic approach is most often gastro-oesophagoscopy to demonstrate abnormal oesophageal mucosa, strictures or ulcerations and signs of Barrett’s oesophagus. Figure 1 shows the anatomy of oesophageal cancer primary site, including typical endoscopic measurements of each region measured from the incisors. Biopsies are taken for histopathologic examination. PET/CT imaging is performed to assess locoregional spread and distant metastases. An endoscopic ultrasound (EUS) is acquired for additional information on local tumour invasion and loco-regional lymph node status. Since January 1st 2017, oesophageal cancer is staged with the uniform 8th edition of the International Union Against Cancer (UICC) Tumour-Node-Metastasis (TNM) guidelines. This edition presents separate classifications for pathologic (pTNM), and postneoadjuvant (ypTNM) stage groups. As histopathologic cell type markedly affects
General introduction and outline of the thesis
12
survival of clinically and pathologically staged patients, these two subtypes required separate groupings. Only the ypTNM groupings are identical for both adenocarcinoma and squamous cell carcinoma, still showing distinctive survival curves according to the histological subtype.Oesophageal cancers have a tendency for early lymphatic dissemination via a dense and complex submucosal network which gives rise to skip metastases. The incidence of lymphatic spread increases rapidly with the increasing depth of tumour penetration, a phenomenon that is identical in SCC and adenocarcinoma. Since the number of affected lymph nodes is a strong predictor for overall survival, the staging system has incorporated the number of positive lymph nodes into the staging process. In the former 7th edition lymph node stations included lung lymph node staging but in the 8th edition a new map was clarified to refine regional lymph node mapping (Figure 2)3.
Rice TW, Kelsen D, Blackstone EH, et al. Esophagus and esophagogastric junction. In: AJCC Cancer Staging Manual, 8th Ed, Amin MB (ed), Springer Science+Business Media, LLC, New York, 2017
Figure 1. American Joint Committee on Cancer (AJCC) regions of the oesophagus

General introduction and outline of the thesis
13
The classification of oesophagogastric junction adinocarcinomas has also evolved over time. Historically, gastro-oesophageal junction (GEJ) tumours were most often classified according to the Siewert classification system. Siewert type I tumours have their epicenter located between 1 cm and 5 cm above GEJ. Siewert type II tumours are centered from 1 cm above to 2 cm below GEJ. In the current 8th revision of the AJCC/UICC staging classification, tumours involving the GEJ with the tumour epicenter no more than 2 cm into the proximal stomach are staged as oesophageal cancers. Those tumours which extend further are staged as gastric cancer. Clinically, the epicenter is determined from upper and lower border measurements, which also provide cancer length.
TREATMENT
Oesophageal cancer is a treatable disease, but it is rarely curable. The EUROCARE study (1999-2007) reported a mean 5-year survival for oesophageal cancer of 12.4%4. For
The original source for this information is the AJCC Cancer Staging Manual, Eighth Edition (2017) published by Springer International Publishing.
Figure 2. Lymph node maps for oesophageal cancer (8th TNM). Regional lymph node stations for staging oesophageal cancer from the left (A), right (B), and anterior (C). 1R/1L, right/left lower cervical paratracheal nodes; 2R/2L, right/left upper paratracheal node; 4R/4L, right/left lower paratracheal nodes; 7, subcarinal nodes; 8U/8M/8Lo, upper/middle/lower thoracic paraoesophageal lymph nodes; 9R/L, right/left pulmonary ligament nodes; 15, diaphragmatic nodes; 16, paracardial nodes; 17, left gastric nodes; 18, common hepatic nodes; 19, splenic nodes; 20, celiac nodes. Cervical perioesophageal level VI and level VII lymph nodes are named as per the head and neck map.

General introduction and outline of the thesis
14
clinically resectable locally advanced oesophageal cancer the 5-year overall survival reaches only up to 40% 5,6.
Historically, results with surgery alone were unfavorable which led to interest in the role of multimodality treatment. Neoadjuvant treatment has the possibility to downstage the primary tumour, increase the resectability and eliminating micrometastases. Chemotherapy and radiotherapy are effective against different tumour cell populations (additive effect) with the chemotherapy being effective against distant micrometastases while radiation is active loco-regionally (“spatial cooperation”). A meta-analysis of 24 randomised trials has shown a significant survival benefit in favour of neoadjuvant therapy over surgery alone, as well as a trend favouring neoadjuvant chemoradiotherapy (nCRT) over neoadjuvant chemotherapy (nCT)7,8.
The timing between completion of neoadjuvant therapy and resection is at least a five to seven-week interval, allowing resolution of acute inflammation and tumour regression while minimizing the chronic fibrotic changes in the surgical field. There is a growing interest in an active surveillance approach after completion of neoadjuvant chemoradiotherapy (nCRT) for carcinoma of the oesophagus. In the SANO (i.e. Surgery As Needed for Oesophageal cancer) trial, surgical resection is offered only to patients in whom a locoregional regrowth is highly suspected or proven, without distant dissemination. Such an organ-preserving strategy can have great advantages, but is only justified if long-term survival is non-inferior to that of the current standard trimodality approach comprising neoadjuvant chemoradiotherapy followed by standard surgery 9.
There are still remarkable disparities in the treatment of oesophageal cancer between the different countries.
In the UK, most centres use neoadjuvant chemotherapy with cisplatin and 5-fluorouracil following the Medical Research Council (MRC) oesophageal working group (OEO2) trial10. The use of the epirubicin,cisplatin and 5-fluorouracil regimen (ECF) is based on the MRC Adjuvant Infusional Chemotherapy (MAGIC) trial and is used only for oesophageal adenocarcinoma 10,11. To further improve the results of the ECF regimen, the FLOT4 trial was designed. This phase III trial randomised 716 patients with resectable gastric or gastro-oesophageal junction adenocarcinoma to perioperative FLOT or ECF. The triplet regimen used in the FLOT4 trial is fluorouracil or capecitabine, leucovorin, oxaliplatin and docetaxel. It decreased toxicity by replacing epirubicin with low-dose docetaxel, and using oxaliplatin instead of cisplatin. FLOT is also more convenient to use, with one 24-hour infusion every two weeks rather than continuous infusion of fluorouracil in the ECF protocol. The study reported superior results for all efficacy endpoints including curative resection rates, progression-free survival and overall survival. The superiority of this docetaxel based triplet therapy over standard care in patients with resectable oesophago-gastric adenocarcinoma has been confirmed in late-breaking results presented at the ESMO 2017 Congress in Madrid 12 and the final results have recently been published by the group of Al-Batran et al13.
It is important to state that former mentioned studies recruited mixed patients with oesophageal junctional as well as gastric tumours.

General introduction and outline of the thesis
15
In contrast to the UK, many other patients in Europe and the USA commonly receive neoadjuvant chemoradiotherapy. There have been many trials investigating different radiation doses and systemic therapy but the strategy of neoadjuvant chemoradiotherapy in the treatment of oesophageal cancer has been cemented by the Chemoradiotherapy for Oesophageal Cancer Followed by Surgery Study (CROSS) trial6. The CROSS trial is a multicenter randomized trial performed in the Netherlands randomly assigning patients with resectable oesophageal cancers to undergo surgery alone or receive weekly carboplatin (area under the curve, 2) and paclitaxel (50 mg/m2) for 5 weeks and concurrent radiotherapy (41.4 Gray), followed by surgery. The study population analyzed included 366 patients with a mix of histologies: 275 (75%) had adenocarcinoma, 84 (23%) had squamous cell carcinoma, and 7 (2%) had large-cell undifferentiated carcinoma. This trial confirmed that preoperative chemoradiation for resectable oesophageal cancer is safe and, compared with surgery alone, is associated with pathological complete responses, higher rates of R0 resection, and prolonged survival of 13% . In 2015, Shapiro et al. published the 5-year long-term results of the CROSS study which confirms the use of neoadjuvant chemoradiotherapy as a standard of care for patients with resectable locally advanced oesophageal or oesophagogastric junctional cancers14.
For patients who are inoperable or who have irresectable tumours, concurrent chemoradiotherapy with or without consequent consolidation chemotherapy is considered a curative treatment option15. Definitive chemoradiotherapy is also recommended for cervical localized tumours.
The Radiation Therapy Oncology Group 85-01 trial implemented this conservative approach, namely the Herskovic regimen15, in this patient group. The Herskovic regimen consists of a combination of radiotherapy (50 Gy/2 Gy daily dose during weeks 1 -5) and chemotherapy. Chemotherapy is administered on weeks 1, 5, 8 and 11 with Cisplatin (75mg/m2) being administered on day 1 en 5-fluorouracil (5-FU 1000mg/m2) being given by continuous infusion on days 1-4. Multiple retrospective studies indicate that carboplatin/paclitaxel is similar in efficacy to cisplatin/5-FU with less toxicity17. Consequently, in the Netherlands the weekly carboplatin/paclitaxel is preferred for definitive chemoradiation. Oxaliplatin/FU/folinic acid (FOLFOX) can also be delivered as a safe alternative of cisplatin/5-fluorouracil, following the results of the PRODIGE-5 trial18.
Not unimportant is that up to half of the patients in the chemoradiotherapy group had locally recurrent or persistent disease in the oesophagus at 12 months. We are looking forward to the results from the Dutch ART-DECO trial (https://www.trialregister.nl/trial/3383) in which patients with irresectable or inoperable M0 patients are randomized between definitive chemoradiotherapy with or without additional radiotherapy boost to diminish this local recurrence rate.
Until now, there are no firm data comparing neoadjuvant CRT + surgery versus definitive CRT and salvage surgery on demand. In fact, two older randomized controlled trials have found similar survival when omitting surgery after definitive chemoradio-

General introduction and outline of the thesis
16
therapy for SCC patients with treatment response 19,20. However, other retrospective studies have reported improved survival outcomes with the addition of surgery to chemoradiotherapy21-23. In a recent cohort the difference in DFS and OS between dCRT en trimodality treatment were likely driven by worse local control in the definitive CRT group23.
Despite the improvement in accurate staging, advanced surgical techniques and systemic approaches, survival for oesophageal cancer remains poor. A pathologic complete response (pCR) seems to be correlated with increased overall survival in patients undergoing neoadjuvant therapy. Hence, the rationale is to intensificate preoperative therapy to augment the patient number with pCR. Different new treatment strategies have been developed to improve locoregional tumour control and survival but until now these efforts did not result in the long wanted improvement in outcome.
RADIOTHERAPY
Radiotherapy adds benefit in achieving pathological complete response and improvement in locoregional relapse in oesophageal cancer. Former guidelines for radiotherapy for oesophageal cancer are derived from traditional two-dimensional fields based on bony landmarks. Nowadays, we can sculpt the dose in a conformal manner around targets away from healthy tissue with intensity modulated radiation therapy (IMRT) and volumetric modulated arc therapy (VMAT). Consequently, target volumes need to be defined with greater specificity when using CT-derived anatomy. This places a greater responsibility on the radiation oncologist to appropriately delineate GTV, CTV and PTV. The gross tumour volume (GTV) is the volume defined by the primary tumour and any enlarged regional lymph nodes. All available information (physical examination, endoscopy, EUS, PET-CT) is used for delineation of this GTV. Given the microscopic tumour extension, the clinical target volume (CTV) is commonly defined as the primary tumour plus 3-5 cm proximal and distal margins and a radial margin of 1-2.5 cm. Untill now there is no consensus for delineation of the Clinical Target Volume (CTV) whether some schools advocate to include elective nodal regions whether other perform only involved-field irradiation. With respect to the planning target volume (PTV) delineation, it is recommended to expand the CTV by 0.5-1cm (abdominal 1.5 cm) in all directions, depending on institutional guidelines (Figure 3). The PTV volume takes into account organ motion, patient motion and setup uncertainties.
For tumours involving the distal oesophagus and GEJ, it is critical that respiratory motion is taken into account when using highly conformal techniques such as IMRT. The combination of more sophisticated radiation techniques and the introduction of the CROSS regimen with lower dose radiation dosage (41.4 Gy) both lead to reduced mean lung and heart dose. Consequently, pulmonary and gastrointestinal postoperative complication rates are reduced to a minimum 24. Untill now, there are no data that embrace the concept for dose escalation in oesophageal cancer25. Novel therapies in

General introduction and outline of the thesis
17
combination with radiotherapy are needed to improve the overall survival of patients with oesophageal cancer.
TUMOUR HYPOXIA
As in many solid tumours, oesophageal cancer can show a significant heterogeneity in biologic characteristics, such as hypoxia, perfusion and proliferation. The relative resistance to radiotherapy and anticancer chemotherapy and even immunotherapy in oesophageal cancer might be the result of a hypoxic niche in the tumour regions. These low oxygen levels are rarely observed in normal tissues. Intratumour hypoxia can be chronic, arising as the tumour outgrows the limits of blood supply, or acute, when there is a disruption in microregional bloodflow. There is limited evidence that even dormant micrometastases (<1mm) can be intensely hypoxic26,27. Hypoxic tumour
Figure 3. Target volume delineation for oesophageal cancer. Red = gross target volume; Yellow= clinical target volume and PTV= planning target volume. (upper figure). In the lower figure treatment planning simulation and dose distribution is presented with at the right the dose-volume histogram of the treatment plan.

General introduction and outline of the thesis
18
cells are approximately three times less radiosensitive than oxygenated tumour cells. In addition, most standard chemotherapeutics are cytotoxic only to the normoxic part of the tumours 28.
Exploiting therapeutic interventions to overcome hypoxic treatment resistance is an interesting pathway to explore. Different signaling pathways are impacted by hypoxia, e.g. angiogenesis, glucose transport and pH regulation. Modifying the tumour microenvironment by using hyperbaric oxygen or carbogen has not gained access to clinic due to practical limitations, toxicity and modest clinical benefit. An alternative strategy could be to decrease cellular oxygen consumption by using hypoxia-activated prodrugs (HAP) or metformin’s activity as a respiration inhibitor29.

General introduction and outline of the thesis
19
OUTLINE AND OBJECTIVES OF THIS THESIS MANUSCRIPT
As locoregional and systemic relapse rates in oesophageal cancer treatment are still high, improved radiotherapy application but also more effective drugs are needed. If multimodality treatment becomes so effective the question even arises whether surgery can be planned only as needed in clinically complete responders.
A lack of standardization in radiotherapy contouring allows variation in current practice and future studies. There is a need to improve the consistency of contouring the radiotherapy target volume for oesophageal cancer. This thesis provides a standardized resource for information regarding the target volume for each oesophageal tumour site. In this way we improve accuracy in radiation oncology treatment.
Another aim of the research in this thesis is to address new possibilities for improved treatment to ameliorate outcome in patients with oesophageal cancer. New routes of hypoxia modification in oesophageal cancer towards a tailored treatment approach are explored.
The main objectives of this thesis are threefold
1. Standardization of the radiotherapy target volume and treatment regimen depending on the location of the tumour
2. Improvement of the value of prognostic models based on radiotherapy planning CT imaging and derived quantative features
3. Exploration of possibilities to broaden the therapeutic index of oesophageal cancer by influencing the hypoxia pathway using metformin or hypoxia activated prodrugs (HAP’s)

General introduction and outline of the thesis
20
Figure 4. Outline of the thesis.

General introduction and outline of the thesis
21
PART ITHE BEST PREPARATION FOR TOMORROW IS DOING YOUR BEST TODAY
Since radiotherapy remains to play a crucial role in oesophageal cancer treatment strategy, accurate delineation of the target volume is of paramount importance. With the development of intensity-modulated radiotherapy and more precise motion management and irradiation techniques, the determination of the tumour has become even more and more crucial for radiotherapy planning.
We also know that any viable microscopic remnant outside the radiotherapy target volume has an impact on overall survival30. However, the topic of to in-or exclude the elective lymph node basin in the radiation treatment plan is still subject of debate in the radiation oncology community. “Chapter 1 A qualitative synthesis of the evidence behind elective lymph node irradiation in oesophageal cancer” describes recommendations for reconstructing the radiotherapy target volume considering potential microscopic lymph node spread to elective lymph node regions for different tumour location.Another challenge associated with the safe delivery of tumouricidal doses of radiation therapy to oesophageal cancer includes tumour position, gastrointestinal filling and peristalsis. In chapter 2 “The influence of gastric filling instructions on dose delivery in patients with oesophageal cancer: A prospective study” we evaluate the impact of food and fluid instructions to asses potential geographic miss. We evaluate whether giving patients food and fluid instructions for treatment of GEJ cancers offers any clinical benefit.
In “chapter 3 Cervical esophageal cancer: a gap in cancer knowledge” we give an overview of literature regarding the current organ-sparing treatment options in patients with cervival oesophageal cancer (CEC). To avoid debilitating surgery, cervical oesophageal cancer current treatment strategy is definitive chemoradiation with curative intent. These treatment regimens are often according either lower oesophageal carcinoma or head and neck squamous cell carcinoma. Given the location nearby the larynx and trachea, the quest of optimal treatment accompanied by little side-effects is crucial. We provide an overview of the current knowledge and controversies surrounding CEC and suggest several recommendations for future investigational studies.
PART I INEW LIFE FOR OLD DRUGS OR DATA ?
Extracting features from medical images with bioinformatics approaches to aid in diagnosis or predict treatment outcome, also called radiomics, is a new way to provide personalized therapy. Advanced image characterization may also reveal additional information on tumour biology and behavior. In chapter 4 “4D CT imaging to assess radiomics feature stability: an investigation for thoracic cancers” the use of radiotherapy 4D CT data to assess stability of radiomics features for patients with thoracic cancer

General introduction and outline of the thesis
22
is reported. These radiomics or quantitative tissue characteristics derived from CT images might enable phenotypic profiling of tumours and contain prognostic information in several tumour sites e.g. oesophageal cancer. Metformin is a cheap and long-standing drug in the treatment of diabetes.There are numerous epidemiological studies that have put forth evidence suggesting the utility of metformin as an anti-cancer agent in gastrointestinal cancer31,32. Its notorious antineoplastic action can be explained by a direct effect on cancer cells as well as an indirect effect on the host.
Chapter 5 “Can metformin improve ‘the tomorrow’ of patients treated for oesophageal cancer?” evaluates the potential correlation of metformin with tumour characteristics and outcome in oesophageal cancer patients. We reasoned that if metformin causes increased tumour oxygenation and radiation response, patients with diabetes taking metformin might have better outcome. This might lead to the untapped potential of repurposing metformin in oesophageal cancer treatment.
PART I I IPOTENTIAL FUTURE IMPROVEMENTS OF THE TREATMENT: EXPLOITING HYPOXIA
Most oesophageal carcinomas contain hypoxic areas with hypoxia being a marker for bad tumour differentiation. This paves the avenue for new drugs which target hypoxia and potentially increase the therapeutic effect of current oesophageal cancer treatment. In Chapter 6 “Hypoxia and hypoxia response-associated molecular markers in oesophageal cancer: a systematic review” we give an overview of the role of hypoxia-associated biomarkers in the treatment response and outcome in patients with oesophageal cancer.
In Chapter 7 “A phase 1 ‘window-of-opportunity’ trial testing evofosfamide (TH-302), a tumour-selective hypoxia-activated cytotoxic prodrug, with preoperative chemoradiotherapy in oesophageal adenocarcinoma patients” we propose a clinical phase I dose-escalation trial with a hypoxia-activated bioreductive prodrug. The main objective of the trial is to test this innovative therapeutic initiative to increase the efficacy of the treatment. Currently, evofosfamide has already been tested both as monotherapy and in combination with chemotherapy or other targeted cancer drugs in over 1,500 patients. Up to now, the drug has not been used in oesophageal cancer patients.
In Chapter 8, a general discussion and future perspectives are provided. After summarizing and discussing the main findings of our studies in this thesis, strengths and limitations, implications for clinical practice and recommendations for future research will be discussed. Finally, in Chapter 9 and 10 the summary and valorization on the topics presented within this thesis are provided.

General introduction and outline of the thesis
23
REFERENCES
1. Murphy G., McCormack V., Abedi-Ardekani B., A. M. International cancer seminars: a focus on esophageal squamous cell carcinoma. Ann. Oncol. 28, 2086–2093 (2017).
2. Lagergren, J., Smyth, E., Cunningham, D. & Lagergren, P. Oesophageal cancer. Lancet 390, 2383–2396 (2017).
3. Rice, T. W., Patil, D. T. & Blackstone, E. H. 8th edition AJCC/UICC staging of cancers of the esophagus and esophagogastric junction: application to clinical practice. Ann. Cardiothorac. Surg. 6, 119–130 (2017).
4. Anderson, L. A. et al. Survival for oesophageal, stomach and small intestine cancers in Europe 1999-2007: Results from EUROCARE-5. Eur. J. Cancer 51, 2144–2157 (2015).
5. Allum, W. H., Stenning, S. P., Bancewicz, J., Clark, P. I. & Langley, R. E. Long-term results of a randomized trial of surgery with or without preoperative chemotherapy in esophageal cancer. J. Clin. Oncol. (2009). doi:10.1200/JCO.2009.22.2083.
6. van Hagen, P. et al. Preoperative Chemoradiotherapy for Esophageal or Junctional Cancer. N. Engl. J. Med. 366, 2074–2084 (2012).
7. Sjoquist, K. M. et al. Survival after neoadjuvant chemotherapy or chemoradiotherapy for resectable oesophageal carcinoma: An updated meta-analysis. Lancet Oncol. (2011). doi:10.1016/S1470-2045(11)70142-5.
8. Montagnani, F., Fornaro, L. et al. Multimodality treatment of locally advanced squamous cell carcinoma of the oesophagus: A comprehensive review and network meta-analysis. Critical Reviews in Oncology/Hematology, vol. 114,24-32 (2017).
9. Noordman, BJ., Spaander, MCW et al. Detection of residual disease after neoadjuvant chemoradiotherapy for oesophageal cancer (preSANO): a prospective multicenter, diagnostic cohort study. Lancet Oncol., 19, 965-974 (2018).
10. Allum, W. H., Stenning, S. P., Bancewicz, J., Clark, P. I. & Langley, R. E. Long-term results of a randomized trial of surgery with or without preoperative chemotherapy in esophageal cancer. J. Clin. Oncol. (2009). doi:10.1200/JCO.2009.22.2083.
11. Cunningham, D. et al. Perioperative Chemotherapy versus Surgery Alone for Resectable Gastroesophageal Cancer. N. Engl. J. Med. (2006). doi:10.1056/NEJMoa055531
12. Al-Batran, S.-E. et al. Perioperative chemotherapy with docetaxel, oxaliplatin, and fluorouracil/leucovorin (FLOT) versus epirubicin, cisplatin, and fluorouracil or capecitabine (ECF/ECX) for resectable gastric or gastroesophageal junction (GEJ) adenocarcinoma (FLOT4-AIO): A mul. in Journal of Clinical Oncology 35, 4004 (2017).
13. Al Batran, S.-E. et al. Perioperative chemotherapy with fluorouracil/leucovorin, oxaliplatin and docetaxel versus capecitabine plus cisplatin and epirubicin for locally advanced, resectable gastric or gastro-oesophageal junction adenocarcinoma (FLOT4): a randomized, phase 2/3 trial. Lancet (2019), 393, 1948-57.
14. Shapiro, J. et al. Neoadjuvant chemoradiotherapy plus surgery versus surgery alone for oesophageal or junctional cancer (CROSS): Long-term results of a randomised controlled trial. Lancet Oncol. 16, (2015).
15. Wong, R. & Malthaner, R. Combined chemotherapy and radiotherapy (without surgery) compared with radiotherapy alone in localized carcinoma of the esophagus. Cochrane Database Syst. Rev. CD002092 (2006). doi:10.1002/14651858.CD002092.pub2
16. Cooper, J. S. et al. Chemoradiotherapy of locally advanced esophageal cancer: long-term follow-up of a prospective randomized trial (RTOG 85-01). Radiation Therapy Oncology Group. JAMA : the journal of the American Medical Association 281, (1999).

General introduction and outline of the thesis
24
17. Honing, J. et al. A comparison of carboplatin and paclitaxel with cisplatin and 5-fluorouracil in definitive chemoradiation in esophageal cancer patients. Ann Oncol.Mar 25(3): 638-643 (2014).
18. Conroy, T. et al. Definitive chemoradiotherapy with FOLFOX versus fluorouracil and cisplatin in patients with oesophageal cancer (PRODIGE5/ACCORD17): Final results of a randomised, phase 2/3 trial. Lancet Oncol. 15, 305–314 (2014).
19. Stahl, M. et al. Chemoradiation with and without surgery in patients with locally advanced squamous cell carcinoma of the esophagus. J Clin Oncol; 23 : 2310-7 (2005).
20. Bedenne, L. et al. Chemoradiation followed by surgery compared with chemoradiation alone in squamous cancer of the esophagus: FFCD 9102. J. Clin. Oncol. (2007). doi:10.1200/JCO.2005.04.7118.
21. Liao Z. Zhang, Jin J. Ajani JA et al. Esophagectomy after concurrent chemoradiotherapy improves locoregional control in clinical stage II or III esophageal cancer patients. Int. J. Radiat. Oncol. Biol. Phys. 2004; 60: pp 1484-93.
22. Liu SL, Qui B. et al. TNM staging matched-pair comparison of surgery after neoadjuvant chemoradiotherapy, surgery alone and definitive chemoradiotherapy for thoracic esophageal squamous cell carcinoma. J Cancer. 2017; 8: 683-90.
23. Barbetta A., Meier Hsu et al. Definitive chemoradiotherapy versus neoadjuvant chemoradiotherapy followed by surgery for stage II to III esophageal squamous cell carcinoma. J of Thorac Cardiovasc Surg. 2018; 155: 2710-21.
24. Wang, J. et al. Predictors of postoperative complications after trimodality therapy for esophageal cancer. Int. J. Radiat. Oncol. Biol. Phys. 86, 885–891 (2013).
25. Brower, J. V. et al. Radiation Dose Escalation in Esophageal Cancer Revisited: A Contemporary Analysis of the National Cancer Data Base, 2004 to 2012. Int. J. Radiat. Oncol. Biol. Phys. 96, 985–993 (2016).
26. Li, X. F. et al. Visualization of hypoxia in microscopic tumors by immunofluorescent microscopy. Cancer Res. 67, 7646–7653 (2007).
27. Li, X. F. & O’Donoghue, J. A. Hypoxia in microscopic tumors. Cancer Letters 264, 172–180 (2008).
28. Teicher, B. A., Lazo, J. S. & Sartorelli, A. C. Classification of Antineoplastic Agents by their Selective Toxicities toward Oxygenated and Hypoxic Tumor Cells. Cancer Res. 41, 73–81 (1981).
29. Scharping, N. E., Menk, A. V., Whetstone, R. D., Zeng, X. & Delgoffe, G. M. Efficacy of PD-1 Blockade Is Potentiated by Metformin-Induced Reduction of Tumor Hypoxia. Cancer Immunol. Res. 5, 9–16 (2017).
30. Muijs C., Smit J., Karrenbeld A., et al. Residual tumor after neoadjuvant chemoradiation outside the radiation therapy target volume: a new prognostic factor for survival in esophageal cancer. Int J Radiat Oncol Biol Phys 2014; 88: pp. 845-852.
31. Joo M., Park J., et al. Additional benefits of routine drugs on gastrointestinal cancer: statins, metformin, and proton pump inhibitors. Dig Dis 2018; 36: 1-14.
32. Liang F, Wang YG et al. Metformin inhibited growth, invasion and metastasis of esophageal squamous cell carcinoma in vitro and in vivo. 2018; 51(3): 1276-1286.

25


The best preparation for tomorrow
is doing your best today
PART I


Lien Van De Voorde, Ruben T.H.M. Larue, Madelon Pijls, Jeroen Buijsen, Esther G.C. Troost, Maaike Berbée, Meindert Sosef, Wouter van Elmpt, Marie-Céline Schraepen, Ben Vanneste, Michel Öllers, Philippe Lambin
A qualitative synthesis of the evidence behind elective
lymph node irradiation in oesophageal cancer
Radiotherapy and Oncology 2014; 113: 166-174
Chapter 1

PART I | Chapter 1
30
ABSTRACT
Background and purposeOesophageal cancer is the sixth leading cause of cancer death worldwide and radiotherapy plays a prominent role in its treatment. The presence of lymph node (LN) metastasis has been demonstrated to be one of the most significant prognostic factors related to oesophageal cancer. The use of elective lymph node irradiation (ENI) is still a topic of persistent controversy. The conservative school is to irradiate positive lymph nodes only; the other school is to prophylactically irradiate the regional lymph node area according to different tumour sites. This review investigated the justification for including ENI in the treatment of patients with oesophageal cancer.
Material and methodsWe performed a systematic literature search to find surgical data about lymph node distribution depending on different tumour subgroups: early, cervical, thoracic and gastroesophageal junction cancer. Furthermore, we performed a qualitative assessment of recurrence patterns in patients treated with or without ENI to derive estimates of the potential area at risk for lymph node harvest.
ResultsWe identified and reviewed 49 studies: 10 in early, 8 in cervical, 10 in thoracic and the remaining 21 in gastroesophageal junction cancer. In general, these studies were conclusive in incidence and location of pathologic lymph nodes for different subgroups. Data for lymph node recurrence patterns are scarce and contributed little to our review.
ConclusionsThis review resulted in five recommendations for radiation oncologists in daily practice. We used the available evidence about metastatic lymph node distribution to develop a careful reasonable radiation protocol for the corresponding tumour subgroups.
Keywords: Oesophageal cancer, radiotherapy, lymph node, surgery, review, elective

PART I | Chapter 1
31
1Oesophageal cancer is the sixth leading cause of cancer death worldwide and radiotherapy plays a prominent role in its treatment. Adenocarcinoma of the oesophagogastric junction (AEG) is increasingly common in the Western world and its prevalence now equals or surpasses that of squamous cell carcinoma (SCC) [1,2]. Reports have shown better [3–5], similar [6,7] or inferior long-term survival [8–10] rates for patients with SCC compared to those with AEG.
There is evidence that complete response to neoadjuvant chemoradiotherapy (nCRT) is associated with significant improved outcome with five-year overall survival rates up to 55% [11,12]. Regardless of the histological subtype, oesophageal cancer (EC) is notorious for its submucosal “skip” invasion because of the extensive and longitudinal interconnecting system of lymphatics in the oesophagus [13–15]. Although Stahl’s study [16] was closed early and statistical significance was not achieved, it found that patients treated with chemoradiotherapy (CRT) had a significant higher probability of showing tumour-free lymph nodes (64.4% vs. 37.7%) at resection than patients treated with chemotherapy alone.
A recent study by Muijs [17] demonstrated that microscopic tumour outside the clinical target volume (CTV) is associated with markedly worse overall survival after nCRT. There is no doubt that effort should be made to optimise preoperative treatment schedules in order to convert patients to the group with complete histopathological response [18,19]. One rationale for using CRT before surgery is the elimination of micrometastases (MM). Micrometastases and “isolated tumour cells” are not detected by routine histological examination and definitions may vary in the literature [20]. Micrometastases can be detected in up to 50% of radical resected oesophageal tumours without overt nodal involvement [21]. A growing body of evidence suggests that immunohistochemically detected micrometastatic deposits in oesophageal cancer are associated with reduced survival [22,23] and increased risk of disease recurrence [21,24], even in patients with pathologic node-negative disease. The neoadjuvant approach is able to significantly reduce nodal micrometastasis (even up to 30%) regardless of SCC or adenocarcinoma [25]. The clinical relevance of these MM may depend on environmental, interpersonal or intermodal variation, but this remains difficult to predict. Although a host’s immune system may be able to remove a single tumour cell, it may be reasonable to advocate inclusion of the elective node region to eradicate or diminish residual cells with metastatic potential [22,26]. This underlines the importance of accurate tumour delineation and the need to justify elective lymph node irradiation (ENI).
There are still concerns about the adverse perioperative effects of ENI and its long-term toxicity because of the potential unnecessarily large treatment volumes [27,28]. Most studies have found little association between the risk of postoperative mortality (in-hospital or 30-day postoperative death) and the neoadjuvant interventions, even when the elective node region is included [29–31]. However, a recent study showed that oesophagogastric anastomosis placed within the preoperative radiation field (gastric margin) was a very strong predictor for anastomotic leaks in oesophageal

PART I | Chapter 1
32
cancer patients treated with trimodality therapy. These finding emphasise the need for critical evaluation of the radiotherapy field [32,33]. The use of intensity-modulated radiotherapy can reduce the associated burden on the organs at risk, but it also leads to a reduction of the historical incidental irradiation of nearby high-risk nodal regions [34]. Besides more sophisticated radiation techniques, also nodal staging became more accurate in the past decades due to improved imaging modalities. However, the sensitivity of positron emission tomography (PET), computed tomography (CT), endoscopic ultrasound (EUS) and more recently even magnetic resonance imaging (MRI) remains poor. The additional value of EUS depends strongly on the distance from the probe to the lymph node which can be problematic in adenocarcinoma. In up to 30% of oesophageal cancers the probe is not able to pass the tumour. We expect promising results from MRI but overcoming image artefacts due to respiratory and cardiac motion will be challenging [35]. Metastatic lymph nodes are often only slightly larger in than non-involved nodes (6.7 mm vs. 5 mm) [36]. Correct assessment of metastatic lymph nodes is important because complete local response may be accompanied by residual locoregional metastatic lymph nodes in up to 10% of patients with pathological complete response (pCR) [37]. Detailed knowledge of LN patterns from LN dissections as provided in this overview manuscript can contribute to correct radiation target volume delineation.
In this review, we will give insight into the frequency of involved nodes in several surgical specimens and define the areas at greatest risk for disease spread for different tumour groups: early, cervical, thoracic and gastroesophageal junction tumours. Since the success of the local effect of radiotherapy has to be judged foremost on locoregional tumour control, we also evaluated the pattern of recurrence to clarify the rationale and benefits in terms of outcome for ENI.
METHODS
We searched the Medline/PubMed database using the following primary keywords: ‘lymph node’, ’elective or neoadjuvant therapy’, ‘oesophagus or oesophageal or esophageal cancer or carcinoma’, ‘surgery or operation or oesophagectomy’, ‘radiotherapy or irradiation’. Only English-language articles published between January 1992 and September 2014 were included. Studies that included metastatic disease were not included. We reviewed the reference lists of all the identified trials, review articles and meeting abstracts. We also performed a manual search of relevant studies to complete this review. If trial results were subsequently updated, we used the information from the more recent publication. Literature data that were already addressed in meta-analyses were not added separately to our analysis.Two reviewers independently extracted data and transferred it into a table documenting the number of patients in the trial, the proportion with squamous cell and adenocarcinoma, radiation details (dose, field, fractionation, duration), chemotherapy details, the number

PART I | Chapter 1
33
1of patients undergoing surgery and lymph nodes retrieved, the topography of the lymph nodes, overall survival (median, two, three and five years), relapse and regional recurrence. For the purpose of this overview, we excluded small trials that treated fewer than 15 patients. Several lymph node classifications and nomenclatures have been used to facilitate the identification of lymph nodes, e.g., RTOG lymph node map [38], the classification of Akiyama [39] and Japanese Society for Oesophageal Diseases (Supplementary Appendix).
RESULTS
The original search retrieved 112 hits. Of those, 42 papers were identified as potentially relevant. Duplicates and clearly irrelevant references were excluded. An additional manual search found 17 more papers, resulting in a total of 59 references for inclusion in this review. They are categorised as follows: early (n = 10), cervical (n = 8), thoracic (n = 10) and gastroesophageal junction tumour (n = 21). We also included 10 articles that described recurrence patterns in patients with oesophageal cancer who were treated with CRT with (n = 4) or without ENI (n = 6) to complete the review.
Early oesophageal cancerEarly oesophageal cancers are classified into the following subcategories: Tis (high-grade dysplasia), T1a or T1b. Endoscopic mucosal resection (EMR) has been recognised as a safe and feasible procedure for treating T1a tumours. Before extending indications of this endoscopic treatment, a thorough search in literature with prediction of lymph node invasion is obligate [40]. Once submucosal invasion is present, there is a substantial risk of lymph node metastasis (LNM): it ranges from 10% to 30% when infiltrating the upper and middle submucosal layer, but up to 60% once it reaches the third layer [41–50]. Lymphovascular invasion (LVI), poor differentiation, non-flat shape and tumour length are associated with a higher risk for lymph node metastasis [42,49].
In 2000, the Japanese Society for Radiation Oncology (JASTRO) published a consensus guideline for standard radiotherapy and chemoradiotherapy, describing it as a safe and effective method for treating superficial oesophageal cancer [51]. They found three-year survival rates of mucosal cancer and submucosal cancer patients that were 90% and 70%, respectively. These survival rates are comparable with those of patients treated with surgery [52,53]. An ongoing randomised trial is comparing definitive chemoradiotherapy with surgery for patients with stage I disease who are not candidates for endoscopic resection (JCOG 0502).The surgical data in Table 1 show that lymph node metastases are predominantly located near the primary tumour. Skipping the adjacent lymph node stations is rare, especially in early oesophageal adenocarcinoma [54]. Studies that included ENI support this approach and assert that it prevented any regional recurrence [53]. Studies in which no ENI was performed reported an incidence of regional failure up to 15%.

PART I | Chapter 1
34
In general, no significant improvement of overall survival was reported for using ENI [51,55,56]. One could advocate for irradiating a substantial area of the regional lymph nodes when observing poor salvage treatment results and cure rates for lymph node recurrence after definitive chemoradiotherapy (dCRT) [57].
Cervical oesophageal cancerMalignant tumours of the cervical oesophagus are uncommon and account for only 2–10% of all carcinomas of the oesophagus [58]. These tumours behave usually very aggressive as they grow in an area of abundant lymphatic drainage and fail to produce early symptoms. Carcinoma of the cervical oesophagus easily and frequently extends upward to the hypopharynx or downward to the thoracic oesophagus. Definitive chemoradiation is a standard treatment option that has similar overall survival rates to surgery but does not dramatically alter the patient’s quality of life [59]. Conducting a literature search is complicated by the fact that tumours of different origins are pooled under the same denomination: primary neoplasms of the cervical oesophagus, primary neoplasms of the hypopharynx (pyriform fossae, posterior wall and retrocricoid region), and even recurrences of laryngeal tumours. Specific reports about neck and mediastinal metastasis in cervical oesophageal cancer remain scarce in the English-
Table 1. Location of lymph node metastasis in early oesophageal cancer
Tumour location Year N Cervical node (%)
Mediastinal node (%)
Abdominalnode(%)
Any node (%)
Upper thoracicIgaki [103]Stein [54]Shimada [49]Tahimori [104]Li [47]Kosugi [105]
200020052006201120132013
156222222017
33182714541
NR1919591530
NR199006
59Δ
36555426Δ
47
Middle thoracicIgaki [103]Shimada [49]Tahimori [104]Li [47]Kosugi [105]
20002006201120132013
5670678459
16612012
NR16372337
NR1124 (perigastric)2027
59Δ
332426Δ
47
Lower thoracic/AEGIgaki [103]Stein [54]Shimada [49]Tahimori [104]Li [47]Kosugi [105]Gertler [106]
2000200520062011201320132014
30157*3138381027
10100000
NR7024183011
NR143540 (perigastric)244040
59Δ
21353926Δ
4727
* Exclusive adenocarcinoma Δ for all tumour locationsN = number of patients; AEG = oesophago-gastric junction; NR = not reported

PART I | Chapter 1
35
1
language literature [60].Summary of results of surgical series show that lymph node metastases often occur in the upper mediastinum, as well as in the neck regardless of tumour stage (Table 2) [60–63]. Hirano et al. asserts that upper mediastinal dissection is crucial to improve the cure rate [60]. Metastases below the tracheal carina were rare and extending the radiation field beyond the carina seemed to offer no benefit. Other studies found that lymph node recurrence after extensive three-field lymphadenectomy ranged from 15% to 45% [58,64]. Among series with definitive radiotherapy or chemoradiotherapy, the recurrence of regional lymph nodes varied from 0% [65] to 25% with ENI [66,67] and at least 25% without ENI [58]. In the study of Burmeister et al. survival of patients treated with ENI was excellent with five-year overall survival rates up to 55% [65]. Although data are scarce, treatment intensification and correct coverage of the lymph nodes seems necessary to prevent early locoregional failure that has a negative impact on quality of life. Thoracic oesophageal cancerThoracic oesophageal cancer (TOC) is most often SCC with a possible lymphatic drainage to all three fields. Usually there is one predominant area of drainage, depending on the location of the tumour. However, when tumours are poorly differentiated, large and deeply invasive, a higher incidence of skip metastases can be present.
Table 3 summarises surgical series with investigations of lymph node distribution. The majority of oesophageal cancer patients listed in Table 3 had stage II or III disease. The largest series, from Ding et al., investigated 18,415 patients in 45 observational studies to determine which node level should be included in the target volume for
Table 2. Surgical data of Hirano et al. with subsites of cervical and upper mediastinal lymph nodes in patients with cervical oesophageal cancer (n=21) and cervical oesophageal cancer extending to the upper thoracic part (n=9).
Tumour location Cervical lymph nodes (%) Upper mediastinum lymph nodes (%)
Cervical 87 3362a
Level II to III 43 Paraoesophageal 24
Level IV 38 Paratracheal 543b
71c
Level Vb 19 Bifurcation 0
Cervical + upper thoracic 100 56
Level II to III 44.4 Paraoesophageal 44
Level IV 22.2 Paratracheal 22
Level Vb 22.2 Bifurcation 11
n= number of patients. aMartins [61] (n=34). bTimon [62] (n=50). cWeber [63] (n=14)

PART I | Chapter 1
36
patients undergoing dCRT therapy [68]. Metastatic lymph nodes of the upper thoracic oesophagus were mainly observed in the cervical and paratracheal regions, in particular along the recurrent nerves. Tumours of the lower thoracic oesophagus metastasised to the adjacent oesophagus, gastric cardia and gastric artery. LNM of cervical and upper mediastinal sites for lower TOC was only 11.0%. The metastatic lymph nodes of middle thoracic oesophageal cancer are bidirectional, hampering the establishment of distinct recommendations for inclusion of afferent lymph nodes.
Most of the studies that have investigated the recurrence of thoracic oesophageal cancer included extended surgery or dCRT. Lu et al. provided evidence with the same findings as Ding et al. for determining the extent of prophylactic postoperative radiotherapy after radical surgery in thoracic oesophageal cancer [68,69]. Murakami et al. investigated if intraoperative radiotherapy (IORT) for the abdominal lymphatic
Table 3. Lymph node distribution in thoracic squamous cell oesophageal carcinoma.
Location Year
Pati
ents
(N)
Cerv
ical
(%)
101,
102,
103,
104
Upp
er m
edia
stin
al (%
)10
5,10
6
Mid
dle
med
iast
inal
(%)
107,
108
, ,11
2
Low
er m
edia
stin
al (%
)11
0,11
1
Abd
omin
al (%
)
1-3,
7, 8
Any
nod
e (%
)
Upper TOCAkiyama [107]Tsurumaru [108]Shimada [49]Wei-Jie Cai [109]Ding [68]Li [110]Hsu [111]
1994200120062010201220122014
2906329723508737
46464829312413
4652NR43424224
2220NR141310NR
78NR03319
1215NR091011
71Δ
7134NR62Δ
56NR
Middle TOCAkiyama [107]Tsurumaru [108]Shimada [49]Wei-Jie Cai [109]Ding [68]Li [110]Hsu [111]
1994200120062010201220122014
1682661048611366818165
29312841171110
3634NR38211935
3332NR372824NR
1618NR118841
40363213212527
71Δ
6538NR62Δ
51NR
Lower TOCAkiyama [107]Tsurumaru [108]Shimada [49]Wei-Jie Cai [109]Ding [68]Li [110]Hsu [111]
1994200120062010201220122014
811146747469945653
272713281157
3027NR19111219
4033NR212011NR
3634 NR9232136
74666136404047
71Δ
8127NR
62Δ
55NR
Δ for all tumour locations; N = number of patients; NR = not reported

PART I | Chapter 1
37
1system could prevent relapse [70]. They found not a single abdominal lymph node recurrence in the IORT group. In contrast to patients treated with IORT, the nodal recurrence rate was 24% in the non-IORT group (p = 0.048), even if abdominal lymph node dissection was performed and chemotherapy was administered. In terms of survival, there was no benefit in the IORT group.
After trimodality therapy, patients with no residual cancer in the resection specimen had the lowest rates of local and distant failure with, consequently, the best survival rates. Survival for patients with residual cancer in nodes appears to be extremely poor, with an inherent associated distant failure in the majority of patients [71]. Hsu et al. conducted the only comparative effectiveness study for ENI in patients with Stage II to III oesophageal SCC (n = 118) who received preoperative CRT followed by radical oesophagectomy [72]. Of them, 73 patients (62%) had ENI and 45 patients (38%) had no ENI. ENI significantly reduced the regional nodal failure rate (p = 0.05) but was not associated with improved survival in patients undergoing preoperative CRT for oesophageal SCC. Still, pathological nodal metastasis predicted poor outcome. Localised irradiation without ENI was concluded to be preferred only for older patients to minimise treatment-related complications.
Oesophagogastric junctionIn 1998, Siewert et al. proposed a new classification for adenocarcinoma of the oesophagogastric junction, which is based on the anatomical characteristics and location of the tumour centre [73]. They demonstrated that AEG was divided into three types, each of which had different characteristics that influenced the selection of the most appropriate surgical strategy. Matzinger et al. developed guidelines for defining the radiotherapy target volume based on a systematic literature review of the location and frequency of local recurrences and lymph node involvement in adenocarcinoma of the gastroesophageal junction and the stomach [74].Another method initially developed to evaluate the priority of nodal dissection is to calculate the therapeutic value index by multiplying the frequency of metastasis to each station and the five-year survival rate of patients with metastasis to that station. Among the lymph nodes that had a metastatic incidence exceeding 10%, the stations showing the highest index were the paracardial and lesser curvature nodes (Nos. 1, 2 and 3) and the node at the root of the left gastric artery (No. 7). Table 4 summarises the results of surgical studies investigating the topographic location of involved lymph node regions. Most studies investigated patients with stage II or III disease but also included a reasonable percentage of patients with pT1 disease. In large patient series, involvement of nodes along the coeliac artery, common hepatic artery, splenic artery and hilum seems to be found in a minority of patients and we recommend to exclude these from the CTV when not involved [75,76]. In addition, the splenic hiatal vessels seem to be the major blood supply for the anastomosis after oesophagectomy [77]. Fewer series have analysed mediastinal lymph node involvement, with rates varying from 16% to 54% for the smallest series. In general, mediastinal lymph node involvement is associated

PART I | Chapter 1
38
Tabl
e 4.
Lym
ph n
ode
dist
ribut
ion
in g
astr
oeso
phag
eal j
unct
ion
carc
inom
a.
Loca
tion
NYe
arA
bdom
inal
(%)
Med
iast
inal
(%)
Any
nod
e (%
)
12
3 4
7
910
& 1
119
2011
011
1O
ther
AEG
typ
e I
Nig
ro [1
12]
Van
de V
en [7
9]Fe
ith [1
13]
Pedr
azza
ni [1
14]
Mat
zing
er [7
4]
37 20 621
20 NR
1999
1999
2006
2007
2009
NR
NR
53 30 +
NR
NR
50 16 +
53 59 32 45 NR
22 NR
5 5 NR
22 20 8 20 +
NR
35 NR
5 +
6 17 5 0 &
5N
R
NR
NR
NR
NR
+
56 NR
NR
NR
+
33 NR
50 25 +
NR
NR
10 23 +
8 (1
07)
25(1
07)
(112
)
41 100
52 65 NR
AEG
typ
e II
Wan
g [1
15]
Siew
ert [
116]
Schr
öder
[117
]Fe
ith [1
13]
Pedr
azza
ni [1
14]
Mat
zing
er [7
4]Ya
mas
hita
[76]
Min
e [1
02]
Got
o [7
5]
42 186
51 485
62 NR
225
150
92
1993
2000
2002
2006
2007
2009
2011
2013
2014
NR
57 64 67 50 + 38 45 39
NR
68 32 63 32 + 23 35 13
73 68 43 66 53 + 35 46 37
32 16 NR
14 4 + 5 3 4
46 15 57 25 31 + 21 28 22
NR
7 29 NR
17 + 10 13 17
23 &
32
5 NR
14 4 &
8+ 4
& 1
85
& 1
76
& 1
6
NR
NR
NR
NR
NR
+ NR
NR
17
18 NR
NR
NR
NR
+ NR
NR
9
18 16 54 11 14 + 7 18 NR
NR
NR
NR
1 7 + 3 NR
NR
68 (1
&2)
11 (
107)
53 69 55 65 71 NR
NR
70 64
Mix
edH
ulsc
her
[118
]La
gard
e [1
19]
Ielp
o [1
20]
Kake
ji [1
21]
74 50 64 129
2001
2005
2010
2012
NR
NR
39 46
NR
NR
39 24
50 NR
12 40
NR
NR
7 14
36 NR
8 23
20 50 5 15
NR
NR
NR
7 &
11
NR
NR
NR
NR
NR
NR
NR
NR
NR
NR
22 2
NR
NR
NR
19 (1
07)
22 (1
06,1
07&
112)
36 92 65 N
R
N =
num
ber
of p
atie
nts;
NR
= no
t rep
orte
d; A
EG =
Ade
noca
rcin
oma
of th
e oe
soph
agog
astr
ic ju
nctio
n

PART I | Chapter 1
39
1with poor survival [78]. As for cervical node involvement, Van De Ven et al. and Lerut et al. found positive cervical lymph nodes in the order of 15% or less [64,79].
Although surgical data are quite uniform regarding topography of the lymph node, less is clear when collecting literature about the frequency of ENI failure. In general, locoregional relapse is observed in about 10% of patients with or without ENI [80]. Oppedijk et al. (n = 418, 75% adenocarcinoma) analysed the recurrence pattern in patients from the previous published CROSS I and II trials where no ENI was applied [80]. Only 3.3% of patients had an isolated locoregional relapse (LRR), but pathologic nodal stage N1 was significantly associated with an increased risk of developing LRR. In the CROSS trial the planning target volume (PTV) was defined as the gross tumour volume (GTV) with a radial margin of 1.5 cm and a craniocaudal of 3 to 4 cm [11]. No clinical target volume (CTV) was defined and it is not ruled out that there is potential accidental elective lymph node irradiation using these definitions. We emphasise that the CROSS study did not include tumours with lengths greater than 8 cm and a radial diameter greater than 5 cm, or patients with inadequate fluid or caloric intake or greater than 10% weight loss. Caution must be used when interpreting data for the subgroups of excluded patients with potentially more aggressive tumour biology nature [19]. Obviously, these studies raise the question of whether prevention of locoregional recurrence can ever result in better outcomes, since the majority of relapses are accompanied by distant metastasis [72,81–83]. LRRs are rare after trimodality therapy, but the salvage strategies are not highly beneficial. Radiotherapy has been proven to have a beneficial effect on preventing recurrence on regional lymph nodes [84]. One could believe that it remains crucial to obtain primary local and potential occult regional tumour control to avoid progression to disseminated disease, supporting the self-seeding theory [85]. However, patients may have variable tumour sensitivity and the persistence of micrometastases in elective lymph node regions may be the cause of distant tumour recurrence.
Definitive chemoradiotherapyDefinitive chemoradiotherapy is considered to be an optional and safe treatment for each stage of oesophageal cancer, especially in comorbid patients with tumour locations above the tracheal bifurcation. Some authors suggest that resection may not always be a required component of combined modality treatment, especially in patients who respond to chemoradiotherapy [12,16,86,87]. In the group of responders or “good risk” patients, both the lymph node vulnerable to metastasis and the node with perceptible or imperceptible metastasis are potential targets to improve outcome.
Reid et al. performed a large prospective study to analyse the stage-for-stage recurrence pattern of dCRT compared with nCRT followed by surgery [88]. In the dCRT treatment arm, where no ENI was planned, locoregional recurrence was two and half times more common than after surgery (p < 0,001). Other data confirmed the concern about locoregional control in this group of patients [16,87]. ENI resulted in a lower percentage of isolated regional failure, ranging from 0% to 2% compared to up to up

PART I | Chapter 1
40
to 30% when ENI is omitted [89–93]. Studies including ENI reported three-year survival rates of 43% which were better or comparable to studies where no ENI was performed [89–91,93]. There are concerns about associated cardiopulmonary toxicity in these ENI studies but both studies used large T-shaped extended radiation fields which we do not longer recommend to use.
Omitting ENI may be not reasonable for locally advanced stage patients, especially if the primary tumours are located in lymphatic-rich regions. The incidence of regional failure in the CRT arm of RTOG 85-01 [94] with ENI was lower than for the standard dose arm of INT0123 [95] with no ENI (46% vs. 55%), but the two-year OS rates were similar for both groups (14.1 months (36%) vs. 18.1 months (40%)). A recent report by Amini et al. found no difference in coeliac nodal failure for patients with dCRT when the CTV did or did not include lymph nodes along the coeliac artery [96]. The coeliac node may act as a gateway for metastatic spread, and OS in patients with coeliac node failure is poor. In general, one must aim to avoid any residual disease in lymph nodes, especially if surgery is not part of the treatment.
DISCUSSION
Lymph node status remains one of the most important factors in predicting the prognosis for patients with oesophageal cancer. Regardless of the histological subtype, once submucosal invasion is present, there is a substantial risk of lymph node metastases especially in the presence of poor tumour differentiation, large tumour size and lymphovascular invasion [46,97]. With perspectives of tailored treatment to individuals for the best possible outcome, we need to improve the reliability of pretherapeutic nodal staging for radiotherapy target delineation. No universally accepted opinion regarding the extent of radiotherapy field has been established. Elective lymph node irradiation still encounters criticism from people suspicious of its efficacy on survival benefit.
Intensity modulated radiotherapy (IMRT) and volumetric intensity modulated arc therapy (VMAT) are implemented for sparing normal organs and tight PTV planning but will not provide historious unintended ENI as with conformal planning. Therefore, reductionist views held by radiation oncologists are potentially dangerous for the patient, and the different components of treatment have to complement each other. Although a randomised controlled trial would provide the ideal means of comparing outcomes between ENI and no ENI, this would be difficult to achieve given the large sample size required to compare overall mortality between the two groups. Currently only one registered trial is investigating ENI in patients with thoracic oesophageal cancer after oesophagectomy who have a pathological stage of T1–2, N positive, M0. In the absence of direct evidence from high-quality randomised clinical trials, indirect comparisons may be necessary. In future, institutions worldwide should collaborate to participate in an umbrella protocol for the follow-up in oesophageal cancer to

PART I | Chapter 1
41
1standardise data collection. An important strategy could be the research line Computer Aided Theragnostics (CAT) to improve knowledge discovery in large databases to develop individual prognostic models [98,99]. In this way we might be able to select patients with improved outcome through ENI by eliminating microscopic disease.
In this study, we investigated the rationale for ENI by analysing the literature of LN distributions from LN dissections, combined with additional information of relapse patterns. A limitation of this literature review is that detection of lymph node metastases is restricted to the specimens obtained from surgery, which can be different between studies. This review is a compilation of single institution series, which have the potential risks of patient selection bias, heterogeneity in operative and radiation techniques, and histopathological workup. Furthermore, an inter-study comparison of recurrence patterns suffers from bias, such as different inclusion criteria or staging protocols, since they are performed during different time periods. The strength of our study is that we tried to limit these drawbacks by analysing objective outcome criteria like prevalence and topography of lymph node metastases. It remains unclear how much of the potential improved distant control with the addition of ENI is caused by the effect on micrometastasis or secondarily results from the improved local tumour control.Future studies should look at patient tumour characteristics (e.g. tumour length, differentiation, lymph node ratio, lymphovascular invasion) in order to create a rational approach for ENI in individual patients. The ultimate goal would be to create a model for risk estimation to provide radiation oncologists with quantifiable information and facilitate decision making about whether regional nodes should be included in the radiation field. This review can already provide a framework for reducing variability in the setting of future clinical trials, with the following recommendations (see also Figure 1):
• With the available evidence, the rationale to include ENI is to prevent regional nodal relapse rather than to improve survival. Locoregional recurrence in oesophageal cancer is notorious for its unsuccessful salvage strategy with negative impact on quality of life. In future we should augment the number of patients having pathological complete tumour but also nodal response [100]. In this way, ENI could potentially be of benefit by eliminating micrometastatic disease.
• The risk of skip metastases in early oesophageal cancer appears to be low, which suggests that only nearby lymph node regions should be included when patients are treated with definitive chemoradiotherapy especially for early adenocarcinoma.
• For patients with cervical oesophageal cancer treated with definitive chemoradiotherapy, we recommend extending the elective lymph node irradiation field from the cervical to the trachea bifurcation. The locoregional recurrence rate is known to be higher than in thoracic or junction tumours.
PART I | Chapter 1
42
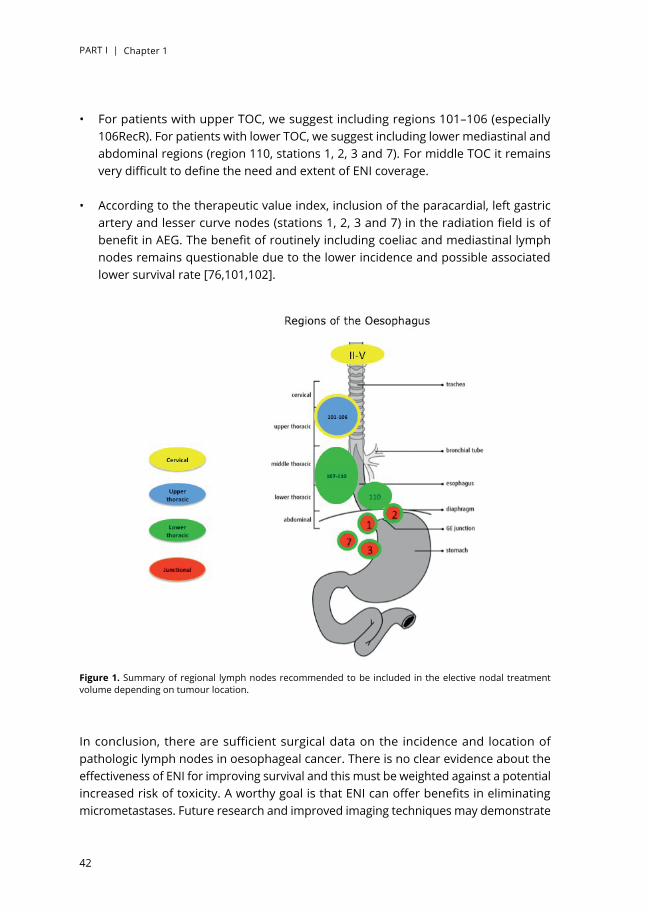
• For patients with upper TOC, we suggest including regions 101–106 (especially 106RecR). For patients with lower TOC, we suggest including lower mediastinal and abdominal regions (region 110, stations 1, 2, 3 and 7). For middle TOC it remains very difficult to define the need and extent of ENI coverage.
• According to the therapeutic value index, inclusion of the paracardial, left gastric artery and lesser curve nodes (stations 1, 2, 3 and 7) in the radiation field is of benefit in AEG. The benefit of routinely including coeliac and mediastinal lymph nodes remains questionable due to the lower incidence and possible associated lower survival rate [76,101,102].
In conclusion, there are sufficient surgical data on the incidence and location of pathologic lymph nodes in oesophageal cancer. There is no clear evidence about the effectiveness of ENI for improving survival and this must be weighted against a potential increased risk of toxicity. A worthy goal is that ENI can offer benefits in eliminating micrometastases. Future research and improved imaging techniques may demonstrate
Figure 1. Summary of regional lymph nodes recommended to be included in the elective nodal treatment volume depending on tumour location.

PART I | Chapter 1
43
1a model based on several factors that would improve our ability to predict the risk of lymph node involvement and the potential benefit of ENI. Until then, radiation oncologists need to use the best available evidence to optimise the radiation target volume.
Conflict of interestNone declared.

PART I | Chapter 1
44
APPENDIX
Terminology of regional lymph nodes in oesophageal carcinoma by the Japanese Society for Oesophageal Diseases
Number Cervical and mediastinal lymph nodes
100 Superficial cervical100-spf Superficial cervical lymph nodesLymph nodes along the external jugular veins and anterior jugular veins beneath the superficial cervical fascia.100-sm Submandibular lymph nodesLymph nodes located around submandibular glands and parotid glands, and anterior to the mylohyoid muscle.100-tr Cervical pretracheal lymph nodesLymph nodes located in the pretracheal fatty tissue, extending from the hyoid bone superiorly to the left brachiocephalic vein inferiorly, including prethyroidal lymph nodes and prelaryngeal lymph nodes.100-ac Accessory nerve lymph nodesLymph nodes located along the accessory nerve(s) and anterior to the trapezius muscle.
101 Cervical paraooesophagealLymph nodes located around the cervical oesophagus, including lymph nodes located along the recurrent laryngeal nerve and the cervical paratracheal lymph nodes. The lateral boundary is the medial border of the carotid sheath.
102 Deep cervicalLymph nodes located around the internal jugular vein and common carotid artery.102-up Upper deep cervical lymph nodesLymph nodes located from the caudal border of the digastric muscle superior to the carotid artery bifurcation.102-mid Middle deep cervical lymph nodesLymph nodes located from the carotid artery bifurcation superiorly to the lower border of the cricoid cartilage inferiorly.
103 PeripharygealLymph nodes located medial to the carotid sheath, extending from the caudal border of the digastric muscle superiorly to the lower border of the cricoid cartilage inferiorly. Postpharyngeal and parapharyngeal lymph nodes are included.
104 SupraclavicularLymph nodes located in the supraclavicular fossa, extending from the lower border of the cricoid cartilage superiorly to the clavicle inferiorly, including the lower internal deep cervical lymph nodes. The medial boundary is the medial border of the carotid sheath.
105 Upper thoracic paraooesophagealLymph nodes located around the upper thoracic oesophagus posterior to the right vagus nerve on the right side.Lymph nodes located along the azygos vein arch and the right bronchial artery are included. The superior boundary is drawn from the cephalic border of the subclavian arteries to the suprasternal notch.
106 Thoracic paratracheal106-rec Recurrent nerve lymph nodesLymph nodes located along the recurrent laryngeal nerves in the mediastinum. The superior boundary is drawn from the cephalic border of the subclavian arteries to the suprasternal notch, and the inferior boundary is the caudal border of the recurrent laryngeal nerve curving upward on both sides.106-rec L Left recurrent nerve lymph nodesLymph nodes located along the left recurrent laryngeal nerve.106-rec R Right recurrent nerve lymph nodesLymph nodes located along the right recurrent laryngeal nerve.106-pre Pretracheal lymph nodes
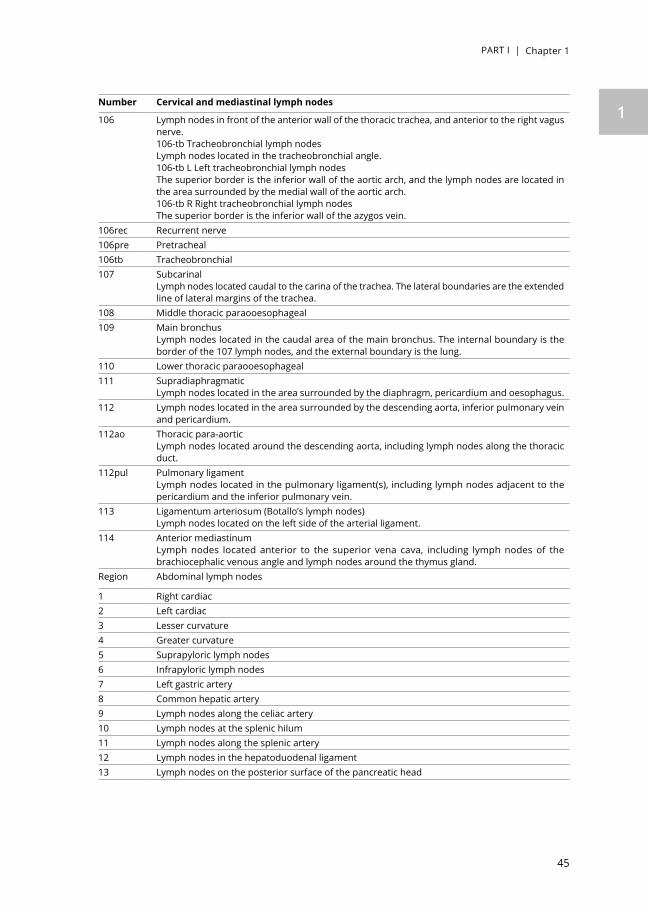
PART I | Chapter 1
45
1Number Cervical and mediastinal lymph nodes
106 Lymph nodes in front of the anterior wall of the thoracic trachea, and anterior to the right vagus nerve.106-tb Tracheobronchial lymph nodesLymph nodes located in the tracheobronchial angle.106-tb L Left tracheobronchial lymph nodesThe superior border is the inferior wall of the aortic arch, and the lymph nodes are located in the area surrounded by the medial wall of the aortic arch.106-tb R Right tracheobronchial lymph nodesThe superior border is the inferior wall of the azygos vein.
106rec Recurrent nerve106pre Pretracheal106tb Tracheobronchial107 Subcarinal
Lymph nodes located caudal to the carina of the trachea. The lateral boundaries are the extended line of lateral margins of the trachea.
108 Middle thoracic paraooesophageal109 Main bronchus
Lymph nodes located in the caudal area of the main bronchus. The internal boundary is the border of the 107 lymph nodes, and the external boundary is the lung.
110 Lower thoracic paraooesophageal111 Supradiaphragmatic
Lymph nodes located in the area surrounded by the diaphragm, pericardium and oesophagus.112 Lymph nodes located in the area surrounded by the descending aorta, inferior pulmonary vein
and pericardium.112ao Thoracic para-aortic
Lymph nodes located around the descending aorta, including lymph nodes along the thoracic duct.
112pul Pulmonary ligamentLymph nodes located in the pulmonary ligament(s), including lymph nodes adjacent to the pericardium and the inferior pulmonary vein.
113 Ligamentum arteriosum (Botallo’s lymph nodes)Lymph nodes located on the left side of the arterial ligament.
114 Anterior mediastinumLymph nodes located anterior to the superior vena cava, including lymph nodes of the brachiocephalic venous angle and lymph nodes around the thymus gland.
Region Abdominal lymph nodes
1 Right cardiac2 Left cardiac3 Lesser curvature4 Greater curvature5 Suprapyloric lymph nodes6 Infrapyloric lymph nodes7 Left gastric artery8 Common hepatic artery9 Lymph nodes along the celiac artery10 Lymph nodes at the splenic hilum11 Lymph nodes along the splenic artery12 Lymph nodes in the hepatoduodenal ligament13 Lymph nodes on the posterior surface of the pancreatic head

PART I | Chapter 1
46
Number Cervical and mediastinal lymph nodes
14 Lymph nodes at the root of the mesentery14A Lymph nodes along the superior mesenteric artery14V Lymph nodes along the superior mesenteric vein
15 Lymph nodes along the middle colic artery16 Lymph nodes around the abdominal aorta17 Lymph nodes on the anterior surface of the pancreatic head18 Lymph nodes along the inferior margin of the pancreas19 Infradiaphragmatic lymph nodes20 Lymph nodes in the oesophageal hiatus of the diaphragm

PART I | Chapter 1
47
1REFERENCES
[1] Daly J.M., Fry W.A., Little A.G., et al: Esophageal cancer: results of an American college of surgeons patient care evaluation study. J Am Coll Surg 2000; 190: pp. 562-572
[2] Dresner S.M., Lamb P.J., Bennett M.K., et al: The pattern of metastatic lymph node dissemination from adenocarcinoma of the esophagogastric junction. Surgery 2001; 129: pp. 103-109
[3] Griffith J.L., and Davis J.T.: A twenty-year experience with surgical management of carcinoma of the esophagus and gastric cardia. J Thorac Cardiovasc Surg 1980; 79: pp. 447-452
[4] Matthews H.R., and Steel A.: Left-sided subtotal oesophagectomy for carcinoma. Br J Surg 1987; 74: pp. 1115-1117
[5] Mueller J.D., Stein H.J., Oyang T., et al: Frequency and clinical impact of lymph node micrometastasis and tumor cell microinvolvement in patients with adenocarcinoma of the esophagogastric junction. Cancer 2000; 89: pp. 1874-1882
[6] Lerut T., De Leyn P., Coosemans W., et al: Surgical strategies in esophageal carcinoma with emphasis on radical lymphadenectomy. Ann Surg 1992; 216: pp. 583-590
[7] Mariette C., Finzi L., Piessen G., et al: Esophageal carcinoma: prognostic differences between squamous cell carcinoma and adenocarcinoma. World J Surg 2005; 29: pp. 39-45
[8] Fiorica F., Di Bona D., Schepis F., et al: Preoperative chemoradiotherapy for oesophageal cancer: a systematic review and meta-analysis. Gut 2004; 53: pp. 925-930
[9] Holscher A.H., Bollschweiler E., Schneider P.M., and Siewert J.R.: Prognosis of early esophageal cancer. Comparison between adeno- and squamous cell carcinoma. Cancer 1995; 76: pp. 178-186
[10] Siewert J.R., Stein H.J., Feith M., et al: Histologic tumor type is an independent prognostic parameter in esophageal cancer: lessons from more than 1000 consecutive resections at a single center in the Western world. Ann Surg 2001; 234: pp. 360-367
[11] van Hagen P., Hulshof M.C., van Lanschot J.J., et al: Preoperative chemoradiotherapy for esophageal or junctional cancer. N Engl J Med 2012; 366: pp. 2074-2084
[12] Klautke G., and Fietkau R.: Significance of radiation therapy for adenocarcinomas of the esophagus, gastroesophageal junction and gastric cancer with special reference to the MAGIC trial. Strahlenther Onkol 2007; 183: pp. 163-169
[13] Bollschweiler E., Schroder W., Holscher A.H., and Siewert J.R.: Preoperative risk analysis in patients with adenocarcinoma or squamous cell carcinoma of the oesophagus. Br J Surg 2000; 87: pp. 1106-1110
[14] Prenzel K.L., Bollschweiler E., Schroder W., et al: Prognostic relevance of skip metastases in esophageal cancer. Ann Thorac Surg 2010; 90: pp. 1662-1667
[15] Tachibana M., Dhar D.K., Kinugasa S., et al: Esophageal cancer with distant lymph node metastasis: prognostic significance of metastatic lymph node ratio. J Clin Gastroenterol 2000; 31: pp. 318-322
[16] Stahl M., Walz M.K., Stuschke M., et al: Phase III comparison of preoperative chemotherapy compared with chemoradiotherapy in patients with locally advanced adenocarcinoma of the esophagogastric junction. J Clin Oncol 2009; 27: pp. 851-856
[17] Muijs C., Smit J., Karrenbeld A., et al: Residual tumor after neoadjuvant chemoradiation outside the radiation therapy target volume: a new prognostic factor for survival in esophageal cancer. Int J Radiat Oncol Biol Phys 2014; 88: pp. 845-852
[18] Rohatgi P.R., Swisher S.G., Correa A.M., et al: Histologic subtypes as determinants of outcome in esophageal carcinoma patients with pathologic complete response after preoperative chemoradiotherapy. Cancer 2006; 106: pp. 552-558
PART I | Chapter 1
48
[19] Fakhrian K., Ordu A.D., Lordick F., et al: Long-term outcomes of trimodality treatment for squamous cell carcinoma of the esophagus with cisplatin and/or 5-FU: more than 20 . Strahlenther Onkol 2014; undefined:
[20] Natsugoe S., Yoshinaka H., Shimada M., et al: Number of lymph node metastases determined by presurgical ultrasound and endoscopic ultrasound is related to prognosis in patients with esophageal carcinoma. Ann Surg 2001; 234: pp. 613-618
[21] Izbicki J.R., Hosch S.B., Pichlmeier U., et al: Prognostic value of immunohistochemically identifiable tumor cells in lymph nodes of patients with completely resected esophageal cancer. N Engl J Med 1997; 337: pp. 1188-1194
[22] Thompson S.K., Ruszkiewicz A.R., Jamieson G.G., et al: Isolated tumor cells in esophageal cancer: implications for the surgeon and the pathologist. Ann Surg 2010; 252: pp. 299-306
[23] Wang D., Smit J.K., Zwaan E., et al: Neoadjuvant therapy reduces the incidence of nodal micrometastases in esophageal adenocarcinoma. Am J Surg 2013; 206: pp. 732-738
[24] Matsumoto M., Natsugoe S., Nakashima S., et al: Clinical significance of lymph node micrometastasis of pN0 esophageal squamous cell carcinoma. Cancer Lett 2000; 153: pp. 189-197
[25] Prenzel K.L., Konig A., Schneider P.M., et al: Reduced incidence of nodal micrometastasis after major response to neoadjuvant chemoradiation in locally advanced esophageal cancer. Ann Surg Oncol 2007; 14: pp. 954-959
[26] Bonavina L., Ferrero S., Midolo V., et al: Lymph node micrometastases in patients with adenocarcinoma of the esophagogastric junction. J Gastrointest Surg 1999; 3: pp. 468-476
[27] Rades D., Schulte R., Yekebas E.F., et al: Radio(chemo)therapy plus resection versus radio(chemo)therapy alone for the treatment of stage III esophageal cancer. Strahlenther Onkol 2007; 183: pp. 10-16
[28] Toita T., Ogawa K., Adachi G., et al: Concurrent chemoradiotherapy for squamous cell carcinoma of thoracic esophagus: feasibility and outcome of large regional field and high-dose external beam boost irradiation. Jpn J Clin Oncol 2001; 31: pp. 375-381
[29] Lee J.L., Park S.I., Kim S.B., et al: A single institutional phase III trial of preoperative chemotherapy with hyperfractionation radiotherapy plus surgery versus surgery alone for resectable esophageal squamous cell carcinoma. Ann Oncol 2004; 15: pp. 947-954
[30] Vallbohmer D., Holscher A.H., DeMeester S., et al: A multicenter study of survival after neoadjuvant radiotherapy/chemotherapy and esophagectomy for ypT0N0M0R0 esophageal cancer. Ann Surg 2010; 252: pp. 744-749
[31] Leibl B.J., Vitz S., Schafer W., et al: Adenocarcinoma of the esophagogastric junction: neoadjuvant radiochemotherapy and radical surgery: early results and toxicity. Strahlenther Onkol 2011; 187: pp. 231-237
[32] Juloori A., Tucker S.L., Komaki R., et al: Influence of preoperative radiation field on postoperative leak rates in esophageal cancer patients after trimodality therapy. J Thorac Oncol 2014; 9: pp. 534-540
[33] Vande Walle C., Ceelen W.P., Boterberg T., Vande Putte D., Van Nieuwenhove Y., Varin O., and Pattyn P.: Anastomotic complications after Ivor Lewis esophagectomy in patients treated with neoadjuvant chemoradiation are related to radiation dose to the gastric fundus. Int J Radiat Oncol Biol Phys 2012; 82: pp. e513-e519
[34] Ji K., Zhao L., Yang C., et al: Three-dimensional conformal radiation for esophageal squamous cell carcinoma with involved-field irradiation may deliver considerable doses of incidental nodal irradiation. Radiat Oncol 2012; 7: pp. 200
[35] Alper F., Turkyilmaz A., Kurtcan S., et al: Effectiveness of the STIR turbo spin-echo sequence MR imaging in evaluation of lymphadenopathy in esophageal cancer. Eur J Radiol 2011; 80: pp. 625-628
PART I | Chapter 1
49
1[36] Schroder W., Baldus S.E., Monig S.P., et al: Lymph node staging of esophageal squamous cell carcinoma
in patients with and without neoadjuvant radiochemotherapy: histomorphologic analysis. World J Surg 2002; 26: pp. 584-587
[37] Blom R.L., Steenbakkers I.R., Lammering G., et al: PET/CT-based metabolic tumour volume for response prediction of neoadjuvant chemoradiotherapy in oesophageal carcinoma. Eur J Nucl Med Mol Imaging 2013; 40: pp. 1500-1506
[38] Korst R.J., Rusch V.W., Venkatraman E., et al: Proposed revision of the staging classification for esophageal cancer. J Thorac Cardiovasc Surg 1998; 115: pp. 660-669
[39] Akiyama H.: Surgery for carcinoma of the esophagus. Curr Probl Surg 1980; 17: pp. 53-120
[40] Tajima Y., Nakanishi Y., Ochiai A., et al: Histopathologic findings predicting lymph node metastasis and prognosis of patients with superficial esophageal carcinoma: analysis of 240 surgically resected tumors. Cancer 2000; 88: pp. 285-293
[41] Ancona E., Rampado S., Cassaro M., Battaglia G., Ruol A., Castoro C., Portale G., Cavallin F., and Rugge M.: Prediction of lymph node status in superficial esophageal carcinoma. Ann Surg Oncol 2008; 15: pp. 3278-3288
[42] Barbour A.P., Jones M., Brown I., et al: Risk stratification for early esophageal adenocarcinoma: analysis of lymphatic spread and prognostic factors. Ann Surg Oncol 2010; 17: pp. 2494-2502
[43] Bollschweiler E., Baldus S.E., Schroder W., et al: High rate of lymph-node metastasis in submucosal esophageal squamous-cell carcinomas and adenocarcinomas. Endoscopy 2006; 38: pp. 149-156
[44] Buskens C.J., Westerterp M., Lagarde S.M., et al: Prediction of appropriateness of local endoscopic treatment for high-grade dysplasia and early adenocarcinoma by EUS and histopathologic features. Gastrointest Endosc 2004; 60: pp. 703-710
[45] Endo M., Yoshino K., Kawano T., Nagai K., and Inoue H.: Clinicopathologic analysis of lymph node metastasis in surgically resected superficial cancer of the thoracic esophagus. Dis Esophagus 2000; 13: pp. 125-129
[46] Leers J.M., DeMeester S.R., Oezcelik A., Klipfel N., Ayazi S., Abate E., Zehetner J., Lipham J.C., et al: The prevalence of lymph node metastases in patients with T1 esophageal adenocarcinoma a retrospective review of esophagectomy specimens. Ann Surg 2011; 253: pp. 271-278
[47] Li B., Chen H., Xiang J., Zhang Y., Kong Y., Garfield D.H., et al: Prevalence of lymph node metastases in superficial esophageal squamous cell carcinoma. J Thorac Cardiovasc Surg 2013; 146: pp. 1198-1203
[48] Sepesi B., Watson T.J., Zhou D., Polomsky M., Litle V.R., Jones C.E., Raymond D.P., Hu R., and Qiu X.: Are endoscopic therapies appropriate for superficial submucosal esophageal adenocarcinoma? An analysis of esophagectomy specimens. J Am Coll Surg 2010; 210: pp. 418-427
[49] Shimada H., Nabeya Y., Matsubara H., et al: Prediction of lymph node status in patients with superficial esophageal carcinoma: analysis of 160 surgically resected cancers. Am J Surg 2006; 191: pp. 250-254
[50] Westerterp M., Koppert L.B., Buskens C.J., Tilanus H.W., ten Kate F.J., Bergman J.J., Siersema P.D., van Dekken H., and van Lanschot J.J.: Outcome of surgical treatment for early adenocarcinoma of the esophagus or gastro-esophageal junction. Virchows Arch 2005; 446: pp. 497-504
[51] Nemoto K., Yamada S., Nishio M., et al: Results of radiation therapy for superficial esophageal cancer using the standard radiotherapy method recommended by the Japanese Society of Therapeutic Radiology and Oncology (JASTRO) study group. Anticancer Res 2006; 26: pp. 1507-1512
[52] Kato H., Igaki H., Tachimori Y., et al: Assessment of cervical lymph node metastasis in the staging of thoracic esophageal carcinoma. J Surg Oncol 2000; 74: pp. 282-285

PART I | Chapter 1
50
[53] Okawa T., Tanaka M., Kita-Okawa M., et al: Superficial esophageal cancer: multicenter analysis of results of definitive radiation therapy in Japan. Radiology 1995; 196: pp. 271-274
[54] Stein H.J., Feith M., Bruecher B.L., et al: Early esophageal cancer: pattern of lymphatic spread and prognostic factors for long-term survival after surgical resection. Ann Surg 2005; 242: pp. 566-573
[55] Ishikawa H., Sakurai H., Tamaki Y., et al: Radiation therapy alone for stage I (UICC T1N0M0) squamous cell carcinoma of the esophagus: indications for surgery or combined chemoradiotherapy. J Gastroenterol Hepatol 2006; 21: pp. 1290-1296
[56] Sasaki T., Nakamura K., Shioyama Y., et al: Treatment outcomes of radiotherapy for patients with stage I esophageal cancer: a single institute experience. Am J Clin Oncol 2007; 30: pp. 514-519
[57] Motoori M., Yano M., Ishihara R., et al: Comparison between radical esophagectomy and definitive chemoradiotherapy in patients with clinical T1bN0M0 esophageal cancer. Ann Surg Oncol 2012; 19: pp. 2135-2141
[58] Cao C.N., Liu S.Y., Luo J.W., et al: Pattern of failure in surgically treated patients with cervical esophageal squamous cell carcinoma. Otolaryngol Head Neck Surg 2014; 151: pp. 260-264
[59] Tong D.K., Law S., Kwong D.L., et al: Current management of cervical esophageal cancer. World J Surg 2011; 35: pp. 600-607
[60] Hirano S., Nagahara K., Moritani S., et al: Upper mediastinal node dissection for hypopharyngeal and cervical esophageal carcinomas. Ann Otol Rhinol Laryngol 2007; 116: pp. 290-296
[61] Martins A.S.: Neck and mediastinal node dissection in pharyngolaryngoesophageal tumors. Head Neck 2001; 23: pp. 772-779
[62] Timon C.V., Toner M., and Conlon B.J.: Paratracheal lymph node involvement in advanced cancer of the larynx, hypopharynx, and cervical esophagus. Laryngoscope 2003; 113: pp. 1595-1599
[63] Weber R.S., Marvel J., Smith P., et al: Paratracheal lymph node dissection for carcinoma of the larynx, hypopharynx, and cervical esophagus. Otolaryngol Head Neck Surg 1993; 108: pp. 11-17
[64] Lerut T., Nafteux P., Moons J., et al: Three-field lymphadenectomy for carcinoma of the esophagus and gastroesophageal junction in 174 R0 resections: impact on staging, disease-free survival, and outcome: a plea for adaptation of TNM classification in upper-half esophageal carcinoma. Ann Surg 2004; 240: pp. 962-972
[65] Burmeister B.H., Smithers B.M., Gebski V., et al: Surgery alone versus chemoradiotherapy followed by surgery for resectable cancer of the oesophagus: a randomised controlled phase III trial. Lancet Oncol 2005; 6: pp. 659-668
[66] Gkika E., Gauler T., Eberhardt W., et al: Long-term results of definitive radiochemotherapy in locally advanced cancers of the cervical esophagus. Dis Esophagus 2013; 27: pp. 678-684
[67] Yamada K., Murakami M., Okamoto Y., et al: Treatment results of radiotherapy for carcinoma of the cervical esophagus. Acta Oncol 2006; 45: pp. 1120-1125
[68] Ding X., Zhang J., Li B., et al: A meta-analysis of lymph node metastasis rate for patients with thoracic oesophageal cancer and its implication in delineation of clinical target volume for radiation therapy. Br J Radiol 2012; 85: pp. e1110-9
[69] Lu J.C., Tao H., Zhang Y.Q., et al: Extent of prophylactic postoperative radiotherapy after radical surgery of thoracic esophageal squamous cell carcinoma. Dis Esophagus 2008; 21: pp. 502-507
[70] Murakami M., Kuroda Y., Nakajima T., et al: Intraoperative radiotherapy for the abdominal lymphatic system in patients with esophageal carcinoma. Dis Esophagus 1999; 12: pp. 270-275
[71] Denham J.W., Steigler A., Kilmurray J., et al: Relapse patterns after chemo-radiation for carcinoma of the oesophagus. Clin Oncol (R Coll Radiol) 2003; 15: pp. 98-108

PART I | Chapter 1
51
1[72] Hsu F.M., Lee J.M., Huang P.M., et al: Retrospective analysis of outcome differences in preoperative
concurrent chemoradiation with or without elective nodal irradiation for esophageal squamous cell carcinoma. Int J Radiat Oncol Biol Phys 2011; 81: pp. e593-9
[73] Siewert J.R., and Stein H.J.: Classification of adenocarcinoma of the oesophagogastric junction. Br J Surg 1998; 85: pp. 1457-9
[74] Matzinger O., Gerber E., Bernstein Z., et al: EORTC-ROG expert opinion: radiotherapy volume and treatment guidelines for neoadjuvant radiation of adenocarcinomas of the gastroesophageal junction and the stomach. Radiother Oncol 2009; 92: pp. 164-175
[75] Goto H., Tokunaga M., Miki Y., et al: The optimal extent of lymph node dissection for adenocarcinoma of the esophagogastric junction differs between Siewert type II and Siewert type III patients. Gastric Cancer 2014; undefined:
[76] Yamashita H., Katai H., Morita S., et al: Optimal extent of lymph node dissection for Siewert type II esophagogastric junction carcinoma. Ann Surg 2011; 254: pp. 274-280
[77] Rino Y., Yukawa N., Sato T., et al: Visualization of blood supply route to the reconstructed stomach by indocyanine green fluorescence imaging during esophagectomy. BMC Med Imaging 2014; 14: pp. 18
[78] Tachimori Y., Kato H., Watanabe H., et al: Difference between carcinoma of the lower esophagus and the cardia. World J Surg 1996; 20: pp. 507-510
[79] van de Ven C., De Leyn P., Coosemans W., et al: Three-field lymphadenectomy and pattern of lymph node spread in T3 adenocarcinoma of the distal esophagus and the gastro-esophageal junction. Eur J Cardiothorac Surg 1999; 15: pp. 769-773
[80] Oppedijk V., van der Gaast A., van Lanschot J.J., et al: Patterns of recurrence after surgery alone versus preoperative chemoradiotherapy and surgery in the CROSS trials. J Clin Oncol 2014; 32: pp. 385-391
[81] Koshy M., Greenwald B.D., Hausner P., Krasna M.J., Horiba N., Battafarano R.J., Burrows W., and Suntharalingam M.: Outcomes after trimodality therapy for esophageal cancer: the impact of histology on failure patterns. Am J Clin Oncol 2011; 34: pp. 259-264
[82] Meguid R.A., Hooker C.M., Taylor J.T., et al: Recurrence after neoadjuvant chemoradiation and surgery for esophageal cancer: does the pattern of recurrence differ for patients with complete response and those with partial or no response? J Thorac Cardiovasc Surg 2009; 138: pp. 1309-1317
[83] Sudo K., Taketa T., Correa A.M., et al: Locoregional failure rate after preoperative chemoradiation of esophageal adenocarcinoma and the outcomes of salvage strategies. J Clin Oncol 2013; 31: pp. 4306-4310
[84] Smit J.K., Guler S., Beukema J.C., et al: Different recurrence pattern after neoadjuvant chemoradiotherapy compared to surgery alone in esophageal cancer patients. Ann Surg Oncol 2013; 20: pp. 4008-4015
[85] Comen E., and Norton L.: Self-seeding in cancer. Recent Results Cancer Res 2012; 195: pp. 13-23
[86] Adenis A., Tresch E., Dewas S., et al: Clinical complete responders to definite chemoradiation or radiation therapy for oesophageal cancer: predictors of outcome. BMC Cancer 2013; 13: pp. 413
[87] Bedenne L., Michel P., Bouche O., et al: Chemoradiation followed by surgery compared with chemoradiation alone in squamous cancer of the esophagus: FFCD 9102. J Clin Oncol 2007; 25: pp. 1160-1168
[88] Reid T.D., Davies I.L., Mason J., et al: Stage for stage comparison of recurrence patterns after definitive chemoradiotherapy or surgery for oesophageal carcinoma. Clin Oncol (R Coll Radiol) 2012; 24: pp. 617-624
[89] Onozawa M., Nihei K., Ishikura S., et al: Elective nodal irradiation (ENI) in definitive chemoradiotherapy (CRT) for squamous cell carcinoma of the thoracic esophagus. Radiother Oncol 2009; 92: pp. 266-269

PART I | Chapter 1
52
[90] Yamashita H., Okuma K., Wakui R., et al: Details of recurrence sites after elective nodal irradiation (ENI) using 3D-conformal radiotherapy (3D-CRT) combined with chemotherapy for thoracic esophageal squamous cell carcinoma – A retrospective analysis. Radiother Oncol 2011; 98: pp. 255-260
[91] Zhao K.L., Ma J.B., Liu G., et al: Three-dimensional conformal radiation therapy for esophageal squamous cell carcinoma: is elective nodal irradiation necessary? Int J Radiat Oncol Biol Phys 2010; 76: pp. 446-451
[92] Morota M., Gomi K., Kozuka T., et al: Late toxicity after definitive concurrent chemoradiotherapy for thoracic esophageal carcinoma. Int J Radiat Oncol Biol Phys 2009; 75: pp. 122-128
[93] Zhang X., Li M., Meng X., et al: Involved-field irradiation in definitive chemoradiotherapy for locally advanced esophageal squamous cell carcinoma. Radiat Oncol 2014; 9: pp. 64
[94] Cooper J.S., Guo M.D., Herskovic A., et al: Chemoradiotherapy of locally advanced esophageal cancer: long-term follow-up of a prospective randomized trial (RTOG 85–01). Radiation Therapy Oncology Group. JAMA 1999; 281: pp. 1623-1627
[95] Minsky B.D., Pajak T.F., Ginsberg R.J., et al: INT 0123 (Radiation Therapy Oncology Group 94–05) phase III trial of combined-modality therapy for esophageal cancer: high-dose versus standard-dose radiation therapy. J Clin Oncol 2002; 20: pp. 1167-1174
[96] Amini A., Xiao L., Allen P.K., et al: Celiac node failure patterns after definitive chemoradiation for esophageal cancer in the modern era. Int J Radiat Oncol Biol Phys 2012; 83: pp. e231-9
[97] Meier I., Merkel S., Papadopoulos T., Sauer R., Hohenberger W., and Brunner T.B.: Adenocarcinoma of the esophagogastric junction: the pattern of metastatic lymph node dissemination as a rationale for elective lymphatic target volume definition. Int J Radiat Oncol Biol Phys 2008; 70: pp. 1408-1417
[98] Meldolesi E., van Soest J., Dinapoli N., et al: An umbrella protocol for standardized data collection (SDC) in rectal cancer: A prospective uniform naming and procedure convention to support personalized medicine. Radiother Oncol 2014; 112: pp. 59-62
[99] Roelofs E., Persoon L., Nijsten S., et al: Benefits of a clinical data warehouse with data mining tools to collect data for a radiotherapy trial. Radiother Oncol 2013; 108: pp. 174-179
[100] Gu Y., Swisher S.G., Ajani J.A., et al: The number of lymph nodes with metastasis predicts survival in patients with esophageal or esophagogastric junction adenocarcinoma who receive preoperative chemoradiation. Cancer 2006; 106: pp. 1017-1025
[101] Hasegawa S., Yoshikawa T., Rino Y., et al: Priority of lymph node dissection for Siewert type II/III adenocarcinoma of the esophagogastric junction. Ann Surg Oncol 2013; 20: pp. 4252-4259
[102] Mine S., Sano T., Hiki N., et al: Lymphadenectomy around the left renal vein in Siewert type II adenocarcinoma of the oesophagogastric junction. Br J Surg 2013; 100: pp. 261-266
[103] Igaki H., Kato H., Tachimori Y., and Nakanishi Y.: Cervical lymph node metastasis in patients with submucosal carcinoma of the thoracic esophagus. J Surg Oncol 2000; 75: pp. 37-41
[104] Tachimori Y., Nagai Y., Kanamori N., et al: Pattern of lymph node metastases of esophageal squamous cell carcinoma based on the anatomical lymphatic drainage system. Dis Esophagus 2011; 24: pp. 33-38
[105] Kosugi S., Kawaguchi Y., Kanda T., Ishikawa T., Sakamoto K., Akaike H., Fujii H., et al: Cervical lymph node dissection for clinically submucosal carcinoma of the thoracic esophagus. Ann Surg Oncol 2013; 20: pp. 4016-4021
[106] Gertler R., Stein H.J., Schuster T., et al: Prevalence and topography of lymph node metastases in early esophageal and gastric cancer. Ann Surg 2014; 259: pp. 96-101
[107] Akiyama H., Tsurumaru M., Udagawa H., and Kajiyama Y.: Radical lymph node dissection for cancer of the thoracic esophagus. Ann Surg 1994; 220: pp. 364-372

53
[108] Tsurumaru M., Kajiyama Y., Udagawa H., and Akiyama H.: Outcomes of extended lymph node dissection for squamous cell carcinoma of the thoracic esophagus. Ann Thorac Cardiovasc Surg 2001; 7: pp. 325-329
[109] Cai W.J., and Xin P.L.: Pattern of relapse in surgical treated patients with thoracic esophageal squamous cell carcinoma and its possible impact on target delineation for postoperative radiotherapy. Radiother Oncol 2010; 96: pp. 104-107
[110] Li B., Chen H., Xiang J., Zhang Y., Li C., and Hu H.: Pattern of lymphatic spread in thoracic esophageal squamous cell carcinoma: A single-institution experience. J Thorac Cardiovasc Surg 2012; 144: pp. 778-785
[111] Hsu P.K., Huang C.S., Hsieh C.C., et al: Role of right upper mediastinal lymph node metastasis in patients with esophageal squamous cell carcinoma after tri-incisional esophagectomies. Surgery 2014; undefined:
[112] Nigro J.J., Hagen J.A., DeMeester T.R., et al: Prevalence and location of nodal metastases in distal esophageal adenocarcinoma confined to the wall: implications for therapy. J Thorac Cardiovasc Surg 1999; 117: pp. 16-23
[113] Feith M., Stein H.J., and Siewert J.R.: Adenocarcinoma of the esophagogastric junction: surgical therapy based on 1602 consecutive resected patients. Surg Oncol Clin N Am 2006; 15: pp. 751-764
[114] Pedrazzani C., de Manzoni G., Marrelli D., et al: Lymph node involvement in advanced gastroesophageal junction adenocarcinoma. J Thorac Cardiovasc Surg 2007; 134: pp. 378-385
[115] Wang L.S., Wu C.W., Hsieh M.J., et al: Lymph node metastasis in patients with adenocarcinoma of gastric cardia. Cancer 1993; 71: pp. 1948-1953
[116] Rudiger Siewert J., Feith M., Werner M., and Stein H.J.: Adenocarcinoma of the esophagogastric junction: results of surgical therapy based on anatomical/topographic classification in 1002 consecutive patients. Ann Surg 2000; 232: pp. 353-361
[117] Schroder W., Monig S.P., Baldus S.E., et al: Frequency of nodal metastases to the upper mediastinum in Barrett’s cancer. Ann Surg Oncol 2002; 9: pp. 807-811
[118] Hulscher J.B., Van Sandick J.W., Offerhaus G.J., et al: Prospective analysis of the diagnostic yield of extended en bloc resection for adenocarcinoma of the oesophagus or gastric cardia. Br J Surg 2001; 88: pp. 715-719
[119] Lagarde S.M., Cense H.A., Hulscher J.B., et al: Prospective analysis of patients with adenocarcinoma of the gastric cardia and lymph node metastasis in the proximal field of the chest. Br J Surg 2005; 92: pp. 1404-1408
[120] Ielpo B., Pernaute A.S., Elia S., et al: Impact of number and site of lymph node invasion on survival of adenocarcinoma of esophagogastric junction. Interact Cardiovasc Thorac Surg 2010; 10: pp. 704-708
[121] Kakeji Y., Yamamoto M., Ito S., et al: Lymph node metastasis from cancer of the esophagogastric junction, and determination of the appropriate nodal dissection. Surg Today 2012; 42: pp. 351-358


Lien Van De Voorde, Ruben Larue, Lucas Persoon, Michel Öllers, Sebastiaan Nijsten, Geert Bosmans, Maaike Berbée, Ans Swinnen,
Wouter van Elmpt, Ben Vanneste, Frank Verhaegen, Philippe Lambin
Chapter 2
The influence of gastric filling instructions on dose
delivery in patients with oesophageal cancer:
A prospective study
Radiotherapy and Oncology 2015;117 : 442-447

PART I | Chapter 2
56
ABSTRACT
PurposeTo evaluate whether adaptive radiotherapy for unaccounted stomach changes in patients with adenocarcinoma of the gastroesophageal junction (GEJ) is necessary and whether dose differences could be prevented by giving patients food and fluid instructions before treatment simulation and radiotherapy.
Material and methodsTwenty patients were randomly assigned into two groups: patients with and without instructions about restricting food and fluid intake prior to radiotherapy simulation and treatment. Redelineation and offline recalculation of dose distributions based on cone-beam computed tomography (n = 100) were performed. Dose–volume parameters were analysed for the clinical target volume extending into the stomach.
ResultsFour patients who did not receive instructions had a geometric miss (0.7–12 cm3) in only one fraction. With instructions, 3 out of 10 patients had a geometric miss (0.1–1.9 cm3) in one (n = 2) or two (n = 1) fractions. The V95%was reduced by more than 5% for one patient, but this underdosage was in an in-air region without further clinical importance.
ConclusionsGiving patients food and fluid instructions for the treatment of GEJ cancer offers no clinical benefit. Using a planning target volume margin of 1 cm implies that there is no need for adaptive radiotherapy for GEJ tumours.
Keywords: Oesophageal cancer, Adaptive radiotherapy, Dose-guided radiotherapy

PART I | Chapter 2
57
2
A high level of evidence currently suggests that neoadjuvant chemoradiation (CRT) followed by surgery is the most efficient combination for improving survival in patients with oesophageal cancer [1]. In the Western world, a rise in the incidence of adenocarcinoma is observed, mostly located in the distal oesophagus or at the gastroesophageal junction (GEJ). The oesophagus is drained by a dense plexus of lymphatics, and disease readily spreads microscopically along this plexus, both superiorly and inferiorly from the primary tumour. Because of this behaviour, it is standard treatment planning practice to apply generous margins (30–50 mm) in the direction of mucosal tumour spread when defining the clinical target volume (CTV) [2]. The importance of this margin was recently shown in a study by Muijs et al. [3] that found that any microscopic remnant outside the radiotherapy field has a high impact on overall survival and disease free survival. For GEJ tumours, the CTV will inevitably extend into the stomach.
Over the course of radiotherapy, the dose delivery will be influenced by a number of factors: e.g. patient setup, anatomical changes and respiratory motion. The latter can be better controlled by implementing four-dimensional computed tomography (4D CT) for treatment simulation. Furthermore, several studies [4–6] have reported that dosimetric errors introduced by respiratory motion tend to average out with fractionation. Unfortunately, even the best gated treatment or breath holding or tracking technique does not take into account interfractional anatomical changes over the course of a treatment. It is recognised that heterogeneous variations in stomach shape and volume occur which may complicate target localisation and reproducibility during simulation and treatment [7–9]. Intake of food or carbonated drinks can cause gastric distension with a consequent shift of the CTV extending along the mucosal wall of the stomach. This shift could potentially influence dose coverage. In the ideal setting stomach shape and volume are conserved during radiotherapy, which could be assured by restricting food and carbonated drinks three hours before treatment. On the other hand, patients with oesophageal cancer often have problems maintaining their calorie intake and it is not preferable to change their dietary habits. With the implementation of image-guided radiotherapy (IGRT) and dose recalculation based on the kilovoltage cone-beam computed tomography (kV CBCT), we can calculate the delivered dose to the target volume during treatment and eventually adjust treatment if necessary [10,11].
This study has two main objectives: (1) to investigate the necessity of adaptive radiotherapy for patients with GEJ tumours in case of unaccounted stomach changes e.g. gas pockets in the stomach; (2) to evaluate the impact of food and fluid instructions to assess verification of geographic miss due to variation in gastric volume. A quantitative analysis is performed by comparing the dose distributions recalculated on cone-beam CT images (dose-of-the-day) of the patients’ anatomy during the radiotherapy sessions compared to the planned dose.

PART I | Chapter 2
58
MATERIALS AND METHODS
PatientsThis prospectively designed study had the approval of our Internal Review Board; our clinical protocol was registered at https://clinicaltrials.gov/ct2/show/NCT02130011. Twenty patients with pathologically confirmed GEJ tumours were included. They were treated with (neoadjuvant) CRT between May 2013 and July 2014. All patients had tumour stage cT2–3N1–3. No patient needed gastrostomy or nasal tube feeding before starting treatment.We randomly assigned patients to two groups:(1) Ten patients received food and fluid instructions before treatment simulation and
radiotherapy treatment. They were asked to fast (ingest no food or carbonated drinks) for at least three hours before treatment simulation and radiotherapy planning.
(2) Ten patients received no instructions for gastric emptying or filling.
CT scanningPatients were scanned in a supine position and immobilised using an adjustable cranial and upper arm support (Civco, Posirest-2, USA) and a kneefix cushion device (Civco, Posirest-2, USA). All patients underwent a respiratory-correlated 4D CT scan (Sensation Open, Siemens Erlangen, Germany) using 140 kV and 800 mAs with 3 mm reconstructed slice thickness to incorporate intrafractional mobility of the target volume. The CT number to electron density calibration of the 4D-CT scan was undertaken using a Gammex CT phantom with tissue-equivalent inserts (Gammex Inc., Wisconsin, USA).
Target volume delineationThe gross tumour volume (GTV) was delineated by experienced radiation oncologists on the mid-expiration phase of the 4D CT scan, using all available diagnostic information. An expansion of the GTV by 3 cm is used in the superior and inferior direction to define the thoracic (CTV_thor) and abdominal (CTV_abd) part of the CTV, respectively. We applied a 1 cm margin in the radial dimension, excluding normal tissue. In terms of radiotherapy fields, our institution irradiated prophylactic nodal areas according to the primary tumour site [12]. For this study, only the CTV_abd was of particular interest, compatible with extension of the target volume along the gastric wall. The abdominal planning target volume (PTV_abd) was generated by expanding the CTV_abd with a 1 cm margin to account for setup uncertainties. For the thoracic part of the tumour we applied a 5 mm PTV margin (PTV_thor). In this way we limit the volume of lung irradiation and consequently treatment-related complications.
Treatment planning and verificationRadiotherapy consisted of administering a radiation dose of 41.4 Gy or 50.4 Gy in 23 or 28 daily fractions of 1.8 Gy, five times per week. We used the Eclipse treatment planning system (Varian Medical Systems, Palo Alto, USA) to generate a RapidArc plan

PART I | Chapter 2
59
2
that ensured PTV coverage by the 95% isodose in accordance with the International Commission on Radiation Units and Measurements report 83 and fulfilled the planning constraints for the critical organs [13,14]. One patient (Appendix A: patient n°3) had a seven-field intensity-modulated radiotherapy plan for which the Anisotropic Analytical Algorithm (AAA version 10.0.28) in Eclipse was used to calculate dose. For the other patients, dose was calculated by the Acuros XB algorithm in Eclipse version 10.0.28 (Varian Medical Systems, Palo Alto, USA).
All beam deliveries had pretreatment verification with an electronic portal imaging device which is an important part of our in-house patient-specific quality assurance programme for these advanced treatment techniques [15].
Workflow of dose-guided radiotherapyTo determine the estimated delivered dose and investigate the influence of potential gastric and consequent CTV_abd variation during radiation treatment, we developed the following procedure (Figure 1).
Step 1: After positioning the patient on the couch for treatment, we acquired a kV CBCT image (125 kV, 262 mAs, 13 s acquisition time) to align the patient as closely as possible to the planned position using a match of bony structures. After the automatic image rigid registration based on mutual information, the radiation therapists could perform an additional manual rigid image registration to ensure proper alignment of soft tissue in the CTV_abd region. We performed IGRT on a daily basis throughout the treatment course for on-line setup correction and for visual detection of anatomical changes.
Step 2: The GTV was copied to the kV CBCT of fractions 1, 6, 11, 16 and 21 for all patients and after visual inspection there was no need to adjust the GTV delineation. Furthermore, redelineation of the CTV_abd was performed on the kV CBCT and a second radiation oncologist reviewed delineation on these 100 kV CBCTs. The PTV_abd of the initial planning CT was copied without alteration to the respective kV CBCT. No other structures were redelineated because they were of no further relevance for this study. Geographic miss was defined as expansion of the redelineated CTV_abd outside the initial planned PTV_abd. This was checked by visual inspection and calculated as the volume of the CTV_abd subtracted from the existing planned PTV_abd.
Step 3: Due to the limited field of view (FOV) of the kV CBCT acquisition, total PTV length systematically oversised the kV CBCT. We developed a validated automated method for accurately stitching the three-dimensional CT data to the kV CBCT data, using an image registration scheme (Appendix B). Preliminary experimental results demonstrated that “3D data stitching” provides a good solution to the voxel mismatch caused by limited FOV length in the craniocaudal direction [16]. For the treatment of oesophageal cancer, radiotherapy fields are often large and stitching is a suitable solution for features like CTV_abd near a field boundary especially when part of the beam is out of the field geometry.

PART I | Chapter 2
60
Step 4: We performed a registration of the stitched kV CBCT to the initial planning CT and recalculated the 3D dose distribution to the patient on the kV CBCT. To achieve higher accuracy in kV CBCT image-based dose calculation, we used a calibration method with the Computerized Imaging Reference Systems (CIRS) water equivalent electron density phantom (model 062, Norfolk, Virginia). Although high density inhomogeneities still are challenging for the reconstruction process, there is evidence that clinically acceptable agreement in key dose–volume parameters between CT-based and kV CBCT-based planning calculation exists [17]. The same calculation algorithm and preset MU values of the beams in the initial treatment planning were used.
Step 5: In the final step, we compared the reconstructed dose–volume histogram (rDVH) parameters from the kV CBCT with the DVH parameters from the initial planning CT. Potential dosimetric changes to the CTV_abd are the quantities of interest for comparing plans in which patients were and were not given food and fluid instructions. We focused on the following DVH parameters: volume receiving ≥95%, ≥99% and ≥107% of the prescribed dose (V95%, V99%and V107%). In addition, we analysed the dose to 5% of the volume (D5% or near-maximum dose) and the mean, minimum and maximum dose (Dmean, Dmin and Dmax) for CTV_abd. In this study, the altered dose distribution was considered a significant change if [18]:•V95% of CTV_abd decreased by more than 5% compared to the initial planning CT•Dmean of CTV_abd decreased by more than 5% compared to the initial planning CT•The percentage of D5% increased by more than 5% compared to the initial planning CT
Figure 1. Workflow ‘how to recalculate dose on kV CBCT’.
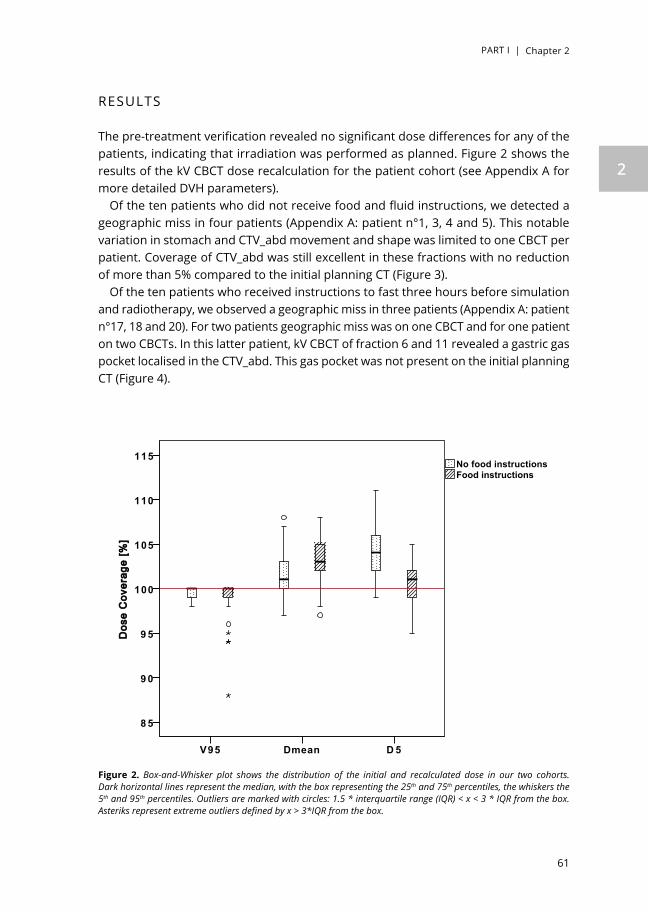
PART I | Chapter 2
61
2
RESULTS
The pre-treatment verification revealed no significant dose differences for any of the patients, indicating that irradiation was performed as planned. Figure 2 shows the results of the kV CBCT dose recalculation for the patient cohort (see Appendix A for more detailed DVH parameters).
Of the ten patients who did not receive food and fluid instructions, we detected a geographic miss in four patients (Appendix A: patient n°1, 3, 4 and 5). This notable variation in stomach and CTV_abd movement and shape was limited to one CBCT per patient. Coverage of CTV_abd was still excellent in these fractions with no reduction of more than 5% compared to the initial planning CT (Figure 3).
Of the ten patients who received instructions to fast three hours before simulation and radiotherapy, we observed a geographic miss in three patients (Appendix A: patient n°17, 18 and 20). For two patients geographic miss was on one CBCT and for one patient on two CBCTs. In this latter patient, kV CBCT of fraction 6 and 11 revealed a gastric gas pocket localised in the CTV_abd. This gas pocket was not present on the initial planning CT (Figure 4).
D 5DmeanV95
DDooss
ee CC
oovveerr
aaggee
[[%%]]
115
110
105
100
9 5
9 0
8 5
Food instructionsNo food instructions
Figure 2. Box-and-Whisker plot shows the distribution of the initial and recalculated dose in our two cohorts. Dark horizontal lines represent the median, with the box representing the 25th and 75th percentiles, the whiskers the 5th and 95th percentiles. Outliers are marked with circles: 1.5 * interquartile range (IQR) < x < 3 * IQR from the box. Asteriks represent extreme outliers defined by x > 3*IQR from the box.

PART I | Chapter 2
62
This is the only patient in whom we observed more than 5% reduction in dose coverage but this was not in the region of the CTV_abd part that was outside the PTV_abd. Looking in more detail, we realised that the underdosage was situated in an in-air- PTV_abd region caused by the gas pocket. This observation did not lead to adaptive treatment planning in this patient.
Comparing the CBCT plan to the treatment plan there was no significant difference between the two groups for V95%, Dmean and D5%. In one fraction (Appendix A: patient n°5) we observed an increase of D5% with 6% but this was not considered alarming. For both treatment groups, there was no decline of Dmean of more than 5% and no increase of D5% with more than 5%. In general, we observed a trend towards a higher Dmax and V107% in all CBCTs (Appendix A: patients n°3 and 15) or a limited number of CBCTs (Appendix A: patient n°2 and 20) compared to the planning CT. When we looked at the D5% instead of the V107% the dose–volume differences were
Figure 3. Visual inspection of CTV_abd outside PTV_abd with good coverage (red arrow). (A): dose distribution after recalculation on kV CBCT CT; (B): magnified view of 95% isodose line still covering the part of CTV_abd located outside the PTV_abd.Light green= GTV; orange = CTV_abd; red = PTV_abd; dark blue = stomach; yellow= 95% isodose line; cyanic blue = 50% isodose line.

PART I | Chapter 2
63
2
considerably smaller. After matching the PTV_abd on the slow kV-CBCT to the initial planning mid-expiration CT, we observed in these patients that the beam was less attenuated by absorption as it passed through more air. Details about the image characteristics are given in Appendix C. Using highly conformal irradiation techniques, a steep dose fall-off in treatment planning for oesophageal cancer was created; so the smallest shift of the dose distribution (e.g. because of an aberrant breathing pattern) may result in a large shift of dose–volume metrics. Although this was not the scope of our study, these additional findings show the dependency on respiratory motion in CBCT dose recalculation. This could be solved by using the first day of CBCT data sets rather than planning CT to provide reliable dosimetric parameters comparison. As a result of evaluating the dose–volume histogram data listed in Figure 2, there seemed to be no need for adaptive radiotherapy planning based on both quantitative dose analysis and visual interpretation of the kV CBCT.
Figure 4. (A): initial plannings mid-expiration CT; (B): redelineation on kV CBCT with the presence of a gas pocket in the stomach; (C): dose recalculation on the kV CBCT shows that the 95% isodose line shifted inside the in-air-PTV region (red arrow).Light green = GTV; orange = CTV_abd; red = PTV; dark blue = stomach; yellow = 95% isodose line; magenta = 107% isodose line and cyanic blue = 50% isodose line.

PART I | Chapter 2
64
DISCUSSION
Nowadays, IGRT is widely used for correctly positioning patients, but in this study we focused on the kV CBCT imaged gastric anatomic changes of patients with GEJ tumours. We investigated CBCT for dose calculation to predict and assess the dose delivered to the patient and use it for adaptive radiotherapy. We monitored a total 100 kV CBCTs from 20 patients who either were or were not instructed to restricted intake of food or carbonated drinks three hours before simulation and treatment. Only one patient did not achieve the pre-determined rDVH criteria with reduced dose coverage. However, this reduced dose coverage was in air and was not clinically relevant to the treatment protocol. Although this was only a weekly dose recalculation instead of a daily analysis, we expect no large shift of the integral and cumulative dose distribution relative to the CTV_abd since we found no systematic errors. Even with a strict gastric filling scenario, physiological organ motion and shape variation seems unpredictable and unavoidable. Our study affirms that giving no instructions is the correct approach for patients with GEJ tumours who already often have difficulties maintaining their dietary habits during CRT. Still when thinking of reducing PTV margin to less than 1 cm, paying attention to image-guided based patient setup error and instructing radiation therapists to observe potential geometric misses are strategies that can be utilised to reduce compromised coverage of the CTV. Future research should extend this study with more participants to further confirm these results.
A study by Bouchard et al. [19] also focused on GEJ tumours and found that the filling status of the stomach had no impact on the actual dose to the GTV. However when there is an increase in gastric volume, they warn against neglecting the inadequate doses to the PTV, which could result in small geographic misses. Bouchard et al. [19] did not analyse the potential dosimetric errors induced by gas pockets or different filling state of the stomach during radiotherapy treatment.
The advantage of our study is that it brings the focus back to the main objective of radiotherapy: namely ensuring that the prescribed dose is delivered to the correct location. Organs like the stomach may inflate and deflate over time and we focused on the part of the target volume which is most prone to variability: the part of the CTV extending into the stomach. Since a dose deficit to a 1% volume of the target that is larger than 20% of the prescription dose still may lead to serious loss of tumour control probability, it is important to pay attention to small-volume cold regions in the target [20]. In our study the biological impact of small CTV_abd expansion outside the PTV_abd was considered to be limited. Modest cold spots as observed in our study will likely not reduce tumour control probability unduly [21,22]. Our study information may also prove useful if any questions arise about patient guidelines for food and fluid during treatment for GEJ cancer.
The major drawback of our study is the offline approach, including the fact that the radiotherapy fraction had already been delivered before a possible insufficient dose coverage was detected. We did not investigate the influence of dose–volume parameter

PART I | Chapter 2
65
2
differences in organs at risk. We do not expect a violation of dose constraints to the gastric fundus regarding the potential influence of postoperative anatomic leakage [23]. We recognise that patients’ dietary compliance was only tracked on a weekly basis. Another limitation is the limited reconstruction length of the kV CBCT (i.e. 17 cm) where the PTV length systematically exceeded these features. Further developments in merging sectional CBCTs into an accurate, larger single image would overcome the limitation of the small FOV of CBCT [24]. The mid-expiration phase of treatment planning is only a snapshot in time, while kV CBCT acts as a slow CT in which breathing and peristaltic motion create rather blurry images. The current study has shown that the relative motion and position of the tumour at the time of treatment may not match that of the planning 4DCT scan. Patients can present with different respiratory patterns during radiotherapy treatment [25]. Respiratory-correlated cone beam could improve imaging quality and correct recalculation. Visual qualitative inspection of CBCT scans and redelineation of target volumes is time-consuming and prone to inter-observer variation in human interpretation. The image quality was clinically sufficient to delineate the stomach, but the uncertainty for the manual delineation of other structures and OARs is high due to the poor image quality and artifacts caused by gas-pockets and therefore merely enough for the purpose of adaptive radiotherapy [26]. The kV CBCT image quality continues to improve: recent results indicate a 1–2% soft-tissue contrast resolution [27,28]. Dose recalculation on kV CBCT should be done with clear awareness of its limitations and a reliable calibration between the pixel values (reconstructed grey-scale values) within the reconstructed image and the electron density of the material being imaged is mandatory, especially in the presence of air gaps and metal artifacts [29]. These inconsistencies and artifacts are inherent to the use of kV CBCT, which might be solved by technological advances.
Ideally, we would perform on-line adaptive radiotherapy in order to monitor and modify dose before treatment delivery ‘on-line’. Until now, the many steps involved before one can display the estimated delivered dose distribution on a near real-time image like kV CBCT, have made it difficult to implement this in daily clinical practice. There are application tools to automate some of these steps (e.g. auto-propagation of contours) and facilitate the workflow process, but these are not yet sufficiently well integrated into current commercial platforms to use on a daily scale.
In addition to a better matching of the patient’s position, IGRT with kV CBCT images offers a more powerful use to reconstruct the estimated delivered dose. To our knowledge, this is the first study to investigate variations in gastric dimension and their effect on the (near) real-time given dose. Our study summarises the work needed to implement dose-guided radiotherapy with kV CBCT for patients with GEJ tumours and comments on the remaining challenges. We conclude that when an adequate PTV margin of 1 cm is applied, dietary instructions do not contribute to optimal target coverage. CBCT before treatment does provide information on interfractional and interindividual variations in stomach volume for GEJ tumours but there is currently no need for adaptive treatment planning.

PART I | Chapter 2
66
Conflict of interestNone.
AcknowledgmentsAuthors acknowledge financial support from the QuIC-ConCePT project, which is partly funded by EFPI A companies and the Innovative Medicine Initiative Joint Undertaking (IMI JU) under Grant Agreement No. 115151. This research is also supported by the Dutch technology Foundation STW (Grant No. 10696 DuCAT), which is the applied science division of NWO, and the Technology Programme of the Ministry of Economic Affairs. Authors also acknowledge financial support from EU 7th framework program (ARTFORCE, REQUITE).

PART I | Chapter 2
67
2
REFERENCES
[1]. van Hagen P., Hulshof M.C., van Lanschot J.J., et al: Preoperative chemoradiotherapy for esophageal or junctional cancer. N Engl J Med 2012; 366: pp. 2074-2084
[2]. Gao X.S., Qiao X., Wu F., et al: Pathological analysis of clinical target volume margin for radiotherapy in patients with esophageal and gastroesophageal junction carcinoma. Int J Radiat Oncol Biol Phys 2007; 67: pp. 389-396
[3]. Muijs C., Smit J., Karrenbeld A., et al: Residual tumor after neoadjuvant chemoradiation outside the radiation therapy target volume: a new prognostic factor for survival in esophageal cancer. Int J Radiat Oncol Biol Phys 2014; 88: pp. 845-852
[4]. Bortfeld T., Jiang S.B., and Rietzel E.: Effects of motion on the total dose distribution. Semin Radiat Oncol 2004; 14: pp. 41-51
[5]. Chui C.S., Yorke E., and Hong L.: The effects of intra-fraction organ motion on the delivery of intensity-modulated field with a multileaf collimator. Med Phys 2003; 30: pp. 1736-1746
[6]. George R., Keall P.J., Kini V.R., et al: Quantifying the effect of intrafraction motion during breast IMRT planning and dose delivery. Med Phys 2003; 30: pp. 552-562
[7]. van der Geld Y.G., Senan S., van Sornsen de Koste J.R., et al: A four-dimensional CT-based evaluation of techniques for gastric irradiation. Int J Radiat Oncol Biol Phys 2007; 69: pp. 903-909
[8]. Yaremko B.P., Guerrero T.M., McAleer M.F., et al: Determination of respiratory motion for distal esophagus cancer using four-dimensional computed tomography. Int J Radiat Oncol Biol Phys 2008; 70: pp. 145-153
[9]. Watanabe M., Isobe K., Takisima H., et al: Intrafractional gastric motion and interfractional stomach deformity during radiation therapy. Radiother Oncol 2008; 87: pp. 425-431
[10]. Chen J., Morin O., Aubin M., et al: Dose-guided radiation therapy with megavoltage cone-beam CT. Br J Radiol 2006; 79: pp. S87-98
[11]. Persoon L.C., Egelmeer A.G., Ollers M.C., et al: First clinical results of adaptive radiotherapy based on 3D portal dosimetry for lung cancer patients with atelectasis treated with volumetric-modulated arc therapy (VMAT). Acta Oncol 2013; 52: pp. 1484-1489
[12]. Van De Voorde L., Larue R.T., Pijls M., et al: A qualitative synthesis of the evidence behind elective lymph node irradiation in oesophageal cancer. Radiother Oncol 2014; 113: pp. 166-174
[13]. Chavaudra J., and Bridier A.: Cancer Radiother 2001; 5: pp. 472-478
[14]. Gregoire V., and Mackie T.R.: State of the art on dose prescription, reporting and recording in intensity-modulated radiation therapy (ICRU report No. 83). Cancer Radiother 2011; 15: pp. 555-559
[15]. van Elmpt W., McDermott L., Nijsten S., et al: A literature review of electronic portal imaging for radiotherapy dosimetry. Radiother Oncol 2008; 88: pp. 289-309
[16]. Petit S.F., van Elmpt W.J., Lambin P., and Dekker A.L.: Dose recalculation in megavoltage cone-beam CT for treatment evaluation: removal of cupping and truncation artefacts in scans of the thorax and abdomen. Radiother Oncol 2010; 94: pp. 359-366
[17]. Elstrom U.V., Olsen S.R., Muren L.P., et al: The impact of CBCT reconstruction and calibration for radiotherapy planning in the head and neck region – a phantom study. Acta Oncol 2014; 53: pp. 1114-1124
[18]. Moller D.S., Khalil A.A., Knap M.M., and Hoffmann L.: Adaptive radiotherapy of lung cancer patients with pleural effusion or atelectasis. Radiother Oncol 2014; 110: pp. 517-522

PART I | Chapter 2
68
[19]. Bouchard M., McAleer M.F., and Starkschall G.: Impact of gastric filling on radiation dose delivered to gastroesophageal junction tumors. Int J Radiat Oncol Biol Phys 2010; 77: pp. 292-300.
[20]. Tome W.A., and Fowler J.F.: On cold spots in tumor sub volumes. Med Phys 2002; 29: pp. 1590-1598
[21]. Goitein M., and Niemierko A.: Intensity modulated therapy and inhomogeneous dose to the tumor: a note of caution. Int J Radiat Oncol Biol Phys 1996; 36: pp. 519-522
[22]. Niemierko A., and Goitein M.: Implementation of a model for estimating tumor control probability for an inhomogeneously irradiated tumor. Radiother Oncol 1993; 29: pp. 140-147
[23]. VandeWalle C., Ceelen W.P., Boterberg T., et al: Anastomotic complications after Ivor Lewis esophagectomy in patients treated with neoadjuvant chemoradiation are related to radiation dose to the gastric fundus. Int J Radiat Oncol Biol Phys 2012; 82: pp. e513-9
[24]. Kim M.K., Kang S.H., Lee E.H., et al: Accuracy and validity of stitching sectional cone beam computed tomographic images. J Craniofac Surg 2012; 23: pp. 1071-1076
[25]. Purdie T.G., Moseley D.J., Bissonnette J.P., et al: Respiration correlated cone-beam computed tomography and 4DCT for evaluating target motion in Stereotactic Lung Radiation Therapy. Acta Oncol 2006; 45: pp. 915-922
[26]. Njeh C.F., Dong L., and Orton C.G.: Point/counterpoint. IGRT has limited clinical value due to lack of accurate tumor delineation. Med Phys 2013; 40: pp. 040601
[27]. Jaffray D.A., and Siewerdsen J.H.: Cone-beam computed tomography with a flat-panel imager: initial performance characterization. Med Phys 2000; 27: pp. 1311-1323
[28]. Seppi E.J., Munro P., Johnsen S.W., et al: Megavoltage cone-beam computed tomography using a high-efficiency image receptor. Int J Radiat Oncol Biol Phys 2003; 55: pp. 793-803
[29]. Rong Y., Smilowitz J., Tewatia D., et al: Dose calculation on kV cone beam CT images: an investigation of the Hu-density conversion stability and dose accuracy using the site-specific calibration. Med Dosim 2010; 35: pp. 195-207

PART I | Chapter 2
69
2
SUPPLEMENTARY DATANo instruc+on
s
Volume [cm
3 ]
Co
verage [%
]
CTV
CTV ou
tside
PTV
V95
V99
V107
D5
Dmax
Dmin
Dmean
1 TPS
89
-‐
99
89
0 10
2 10
5 95
10
0
CBCT
, mean (ran
ge)
10
3 (100
-‐105
) -‐
99 (9
8-‐10
0)
93 (8
5-‐99
) 1 (0-‐1)
105 (103
-‐106
) 10
7 (106
-‐109
) 92
(91-‐97
) 10
2 (101
-‐103
)
CBCT
, frac,on
(volum
e)
-‐ 1 (12)
-‐ -‐
-‐ -‐
-‐ -‐
-‐
2 TPS
74
-‐
99
52
0 10
2 10
6 94
99
CBCT
, mean (ran
ge)
74
(67-‐78
) -‐
100 (100
-‐100
) 90
(69-‐10
0)
8 (0-‐40)
105 (103
-‐107
) 10
8 (105
-‐112
) 97
(95-‐10
1) 10
2 (100
-‐106
)
CBCT
, frac,on
(volum
e)
-‐ -‐
-‐ -‐
-‐ -‐
-‐ -‐
-‐
3 TPS
94
-‐
100
100
0 10
6 10
8 10
0 10
4
CBCT
, mean (ran
ge)
97
(90-‐10
8)
-‐ 99
(98-‐10
0)
100 (99-‐10
0)
35 (1
0-‐85
) 10
9 (107
-‐111
) 11
2 (109
-‐116
) 93
(78-‐10
4) 10
6 (105
-‐108
)
CBCT
, frac,on
(volum
e)
-‐ 11
(3)
-‐ -‐
-‐ -‐
-‐ -‐
-‐
4 TPS
90
-‐
100
45
0 10
1 10
6 94
99
CBCT
, mean (ran
ge)
10
0 (79-‐12
5)
-‐ 10
0 (100
-‐100
) 94
(91-‐97
) 0 (0-‐0)
103 (101
-‐104
) 10
6 (104
-‐107
) 96
(94-‐97
) 10
1 (100
-‐102
)
CBCT
, frac,on
(volum
e)
-‐ 21
(1)
-‐ -‐
-‐ -‐
-‐ -‐
-‐
5 TPS
19
1 -‐
100
92
0 10
2 10
6 96
10
1
CBCT
, mean (ran
ge)
21
1 (187
-‐260
) -‐
100 (99-‐10
0)
97 (9
6-‐99
) 1 (0-‐2)
106 (104
-‐108
) 10
9 (106
-‐111
) 96
(94-‐98
) 10
3 (101
-‐105
)
CBCT
, frac,on
(volum
e)
-‐ 1 (1)
-‐ -‐
-‐ -‐
-‐ -‐
-‐
6 TPS
93
-‐
99
35
0 10
0 10
3 94
98
CBCT
, mean (ran
ge)
10
5 (95-‐11
5)
-‐ 10
0 (100
-‐100
) 81
(71-‐91
) 0 (0-‐0)
103 (102
-‐104
) 10
6 (106
-‐107
) 95
(95-‐96
) 10
0 (99-‐10
1)
CBCT
, frac,on
(volum
e)
-‐ -‐
-‐ -‐
-‐ -‐
-‐ -‐
-‐
7 TPS
56
-‐
99
89
0 10
2 10
5 94
10
0
CBCT
, mean (ran
ge)
55
(54-‐55
) -‐
100 (100
-‐100
) 96
(92-‐99
) 1 (0-‐1)
105 (104
-‐106
) 10
7 (106
-‐109
) 96
(96-‐97
) 10
2 (101
-‐103
CBCT
, frac,on
(volum
e)
-‐ -‐
-‐ -‐
-‐ -‐
-‐ -‐
-‐
8 TPS
67
-‐
99
6 0
99
101
93
97
CBCT
, mean (ran
ge)
73
(66-‐77
) -‐
98 (9
8-‐99
) 8 (0-‐38)
0 (0-‐0)
99 (9
9-‐10
0) 10
2 (101
-‐104
) 93
(92-‐94
) 97
(97-‐98
)
CBCT
, frac,on
(volum
e)
-‐ -‐
-‐ -‐
-‐ -‐
-‐ -‐
-‐
9 TPS
21
-‐
100
98
0 10
3 10
6 96
10
1
CBCT
, mean (ran
ge)
22
(20-‐24
) -‐
100 (100
-‐100
) 99
(99-‐10
0)
2 (0-‐4)
106 (105
-‐106
) 10
9 (108
-‐110
) 98
(97-‐99
) 10
3 (103
-‐104
)
CBCT
, frac,on
(volum
e)
-‐ -‐
-‐ -‐
-‐ -‐
-‐ -‐
-‐
10 T
PS
36
-‐
100
56
0 10
1 10
5 96
99
CBCT
, mean (ran
ge)
42
(36-‐46
) -‐
100 (100
-‐100
) 93
(78-‐99
) 1 (0-‐3)
105 (104
-‐106
) 10
8 (107
-‐110
) 97
(96-‐98
) 10
2 (101
-‐103
)
CBCT
, frac,on
(volum
e)
-‐ -‐
-‐ -‐
-‐ -‐
-‐ -‐
-‐
Food
instruc+on
s Vo
lume [cm
3 ]
Co
verage [%
]
CTV
CTV ou
tside
PTV
V95
V99
V107
D5
Dmax
Dmin
Dmean
11 T
PS
26
-‐
100
94
0 10
1 10
4 97
10
0
CBCT
, mean (ran
ge)
34
(30-‐41
) -‐
100 (100
-‐100
) 96
(94-‐99
) 0 (0-‐0)
103 (102
-‐104
) 10
6 (106
-‐107
) 97
(97-‐98
) 10
1 (100
-‐102
)
CBCT
, frac,on
(volum
e)
-‐ -‐
-‐ -‐
-‐ -‐
-‐ -‐
-‐
12 T
PS
46
-‐
100
87
0 10
2 10
6 96
10
0
CBCT
, mean (ran
ge)
51
(45-‐58
) -‐
100 (100
-‐100
) 95
(88-‐98
) 0 (0-‐0)
104 (103
-‐104
) 10
7 (106
-‐108
) 95
(95-‐96
) 10
2 (101
-‐102
)
CBCT
, frac,on
(volum
e)
-‐ -‐
-‐ -‐
-‐ -‐
-‐ -‐
-‐
13 T
PS
72
-‐
99
74
0 10
1 10
8 92
10
0
CBCT
, mean (ran
ge)
71
(70-‐72
) -‐
99 (9
9-‐10
0)
91 (8
5-‐97
) 1 (0-‐1)
104 (104
-‐105
) 11
1 (109
-‐112
) 94
(92-‐95
) 10
1 (101
-‐102
)
CBCT
, frac,on
(volum
e)
-‐ -‐
-‐ -‐
-‐ -‐
-‐ -‐
-‐
14 T
PS
37
-‐
100
3 0
98
102
95
97
CBCT
, mean (ran
ge)
36
(36-‐37
) -‐
100 (100
-‐100
) 84
(63-‐99
) 0 (0-‐0)
102 (101
-‐105
) 10
6 (103
-‐109
) 97
(96-‐98
) 10
0 (99-‐10
2)
CBCT
, frac,on
(volum
e)
-‐ -‐
-‐ -‐
-‐ -‐
-‐ -‐
-‐
15 T
PS
51
-‐
100
73
0 10
4 10
8 95
10
1
CBCT
, mean (ran
ge)
50
(45-‐55
) -‐
100 (100
-‐100
) 99
(99-‐99
) 12
(5-‐20)
107 (107
-‐108
) 11
1 (110
-‐112
) 97
(97-‐98
) 10
4 (104
-‐105
)
CBCT
, frac,on
(volum
e)
-‐ -‐
-‐ -‐
-‐ -‐
-‐ -‐
-‐
16 T
PS
33
-‐
99
15
0 99
10
4 92
98
CBCT
, mean (ran
ge)
32
(32-‐32
) -‐
96 (9
4-‐99
) 8 (0-‐28)
0 (0-‐0)
98 (9
7-‐99
) 10
2 (100
-‐104
) 92
(90-‐93
) 96
(95-‐98
)
CBCT
, frac,on
(volum
e)
-‐ -‐
-‐ -‐
-‐ -‐
-‐ -‐
-‐
17 T
PS
62
-‐
99
45
0 10
0 10
4 94
98
CBCT
, mean (ran
ge)
62
(61-‐66
) -‐
100 (99-‐10
0)
79 (6
5-‐95
) 0 (0-‐0)
103 (102
-‐106
) 10
7 (106
-‐109
) 94
(90-‐96
) 10
0 (99-‐10
3)
CBCT
, frac,on
(volum
e)
-‐ 11
(1)
-‐ -‐
-‐ -‐
-‐ -‐
-‐
18 T
PS
34
-‐
100
30
0 10
0 10
3 96
98
CBCT
, mean (ran
ge)
39
(33-‐48
) -‐
100 (98-‐10
0)
92 (9
0-‐97
) 1 (0-‐1)
104 (102
-‐105
) 10
7 (104
-‐109
) 93
(78-‐97
) 10
1 (100
-‐102
)
CBCT
, frac,on
(volum
e)
-‐ 21
(2)
-‐ -‐
-‐ -‐
-‐ -‐
-‐
19 T
PS
52
-‐
99
33
0 10
2 10
8 94
98
CBCT
, mean (ran
ge)
51
(50-‐51
) -‐
99 (9
9-‐10
0)
67 (5
2-‐98
) 1 (0-‐3)
104 (103
-‐106
) 10
8 (107
-‐109
) 95
(94-‐96
) 10
0 (99-‐10
2)
CBCT
, frac,on
(volum
e)
-‐ -‐
-‐ -‐
-‐ -‐
-‐ -‐
-‐
20 T
PS
11
7 -‐
100
98
0 10
2 10
5 96
10
0
CBCT
, mean (ran
ge)
13
5 (115
-‐160
) -‐
96 (8
8-‐10
0)
93 (8
2-‐98
) 8 (0-‐20)
106 (103
-‐107
) 11
1 (107
-‐112
) 88
(81-‐96
) 10
3 (101
-‐104
)
CBCT
, frac,on
(volum
e)
-‐ 6 (1), 11
(1)
-‐ -‐
-‐ -‐
-‐ -‐
-‐
App
endi
x A
. Res
ults
of t
he in
itial
pla
nnin
g do
se a
nd d
ose
reca
lcul
atio
n on
kV
CBCT
.Ab
brev
iatio
ns: T
PS: t
reat
men
t pla
nnin
g sy
stem
; CBC
T: c
one-
beam
com
pute
d to
mog
raph
y.

PART I | Chapter 2
70
Appendix B. Accurate 3D kV CBCT stitched image registration.
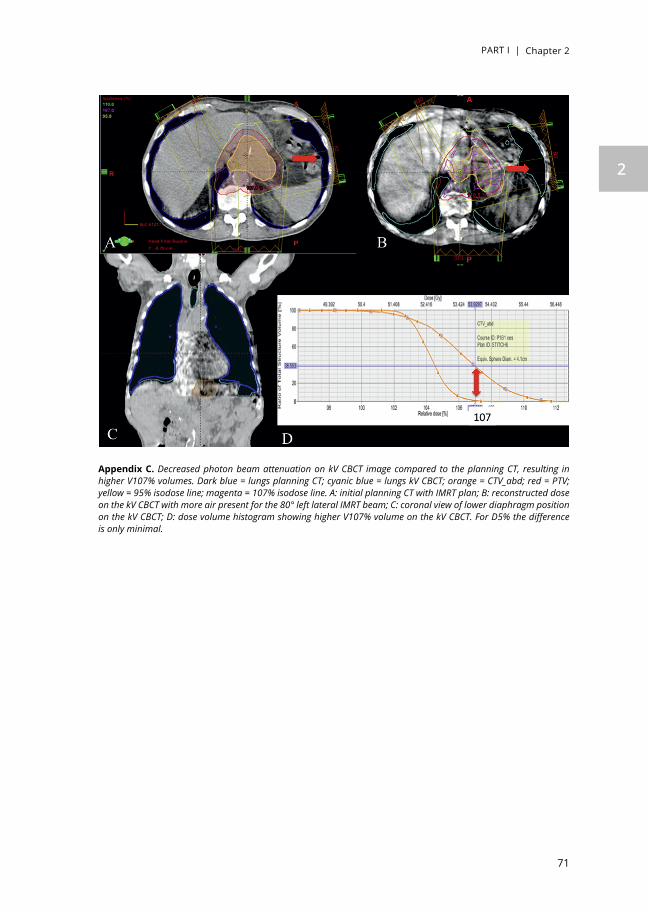
PART I | Chapter 2
71
2
Appendix C. Decreased photon beam attenuation on kV CBCT image compared to the planning CT, resulting in higher V107% volumes. Dark blue = lungs planning CT; cyanic blue = lungs kV CBCT; orange = CTV_abd; red = PTV; yellow = 95% isodose line; magenta = 107% isodose line. A: initial planning CT with IMRT plan; B: reconstructed dose on the kV CBCT with more air present for the 80° left lateral IMRT beam; C: coronal view of lower diaphragm position on the kV CBCT; D: dose volume histogram showing higher V107% volume on the kV CBCT. For D5% the difference is only minimal.


A. hoeben, J. Polak, L. Van De Voorde, F. Hoebers, H.I. Grabsch, J. de Vos-Geelen
Cervical esophageal cancer:
a gap in cancer knowledge
Annals of Oncology 2016; 27: 1664-1674
Chapter 3
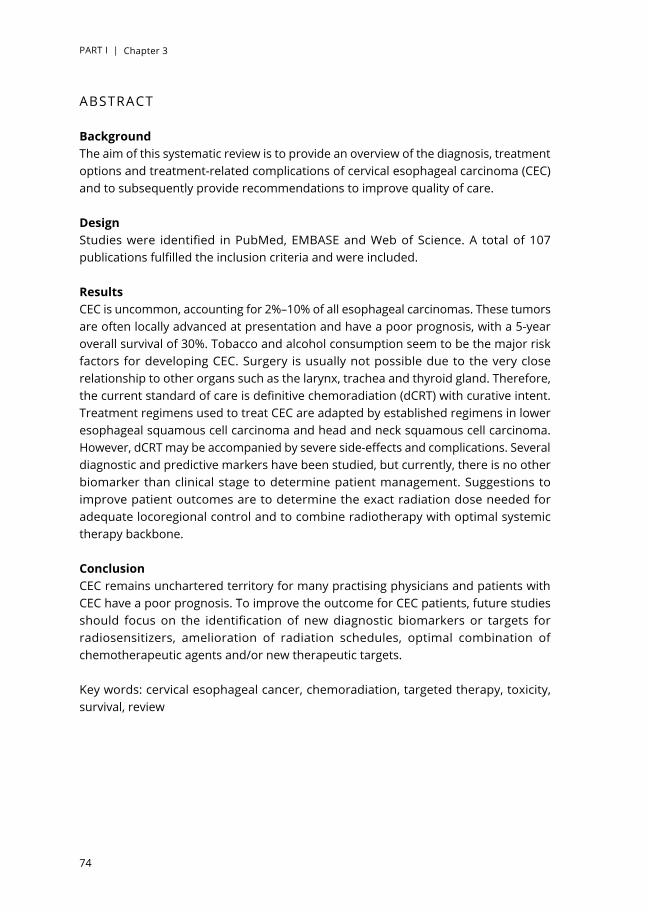
PART I | Chapter 3
74
ABSTRACT
BackgroundThe aim of this systematic review is to provide an overview of the diagnosis, treatment options and treatment-related complications of cervical esophageal carcinoma (CEC) and to subsequently provide recommendations to improve quality of care.
DesignStudies were identified in PubMed, EMBASE and Web of Science. A total of 107 publications fulfilled the inclusion criteria and were included.
ResultsCEC is uncommon, accounting for 2%–10% of all esophageal carcinomas. These tumors are often locally advanced at presentation and have a poor prognosis, with a 5-year overall survival of 30%. Tobacco and alcohol consumption seem to be the major risk factors for developing CEC. Surgery is usually not possible due to the very close relationship to other organs such as the larynx, trachea and thyroid gland. Therefore, the current standard of care is definitive chemoradiation (dCRT) with curative intent. Treatment regimens used to treat CEC are adapted by established regimens in lower esophageal squamous cell carcinoma and head and neck squamous cell carcinoma. However, dCRT may be accompanied by severe side-effects and complications. Several diagnostic and predictive markers have been studied, but currently, there is no other biomarker than clinical stage to determine patient management. Suggestions to improve patient outcomes are to determine the exact radiation dose needed for adequate locoregional control and to combine radiotherapy with optimal systemic therapy backbone.
ConclusionCEC remains unchartered territory for many practising physicians and patients with CEC have a poor prognosis. To improve the outcome for CEC patients, future studies should focus on the identification of new diagnostic biomarkers or targets for radiosensitizers, amelioration of radiation schedules, optimal combination of chemotherapeutic agents and/or new therapeutic targets.
Key words: cervical esophageal cancer, chemoradiation, targeted therapy, toxicity, survival, review

PART I | Chapter 3
75
3
INTRODUCTION
The cervical esophagus is the short part of the esophagus between the lower border of the cricoid cartilage and the thoracic inlet (suprasternal notch), ~18 cm from the incisor teeth [1]. Carcinoma of the cervical esophagus (CEC), usually squamous cell carcinoma (SCC), is uncommon, with 5 new cases per 1 million person years in the United States [2] and accounts for 2%–10% of all esophageal carcinomas [3]. The highest rates of SCC are found in Eastern Asia and Southern Africa, and the lowest rates in Western Africa and Central America [4]. The management of CEC differs from that of cancers of the lower two-thirds of the esophagus because CECs are often locally advanced at the time of diagnosis infiltrating nearby anatomical structures including, for example, the cricoid, thyroid cartilage or thyroid gland. Moreover, patients with CEC often present with lymph node metastases [1]. Most CECs are not treatable by surgery, as this would involve mutilating resections including pharyngo-laryngo-esophagectomy (PLE). Therefore, definitive chemoradiation (dCRT) is the standard treatment modality recommended by the National Comprehensive Cancer Network (NCCN) and European Society for Medical Oncology (ESMO) guidelines [5, 6]. dCRT usually consists of 50.4 Gy in 1.8 Gy per fraction per day. Higher doses up to 60–66 Gy may be appropriate if no surgery is planned. Concurrent chemotherapy generally consists of cisplatin and 5-fluorouracil (5-FU), oxaliplatin and 5-FU or carboplatin and paclitaxel [5]. As CECs behave very aggressively, as they grow in an area of abundant lymphatic drainage and fail to produce early symptoms, and easily and frequently extend toward the hypopharynx, these tumors are sometimes treated with schedules for locally advanced head and neck squamous cell carcinoma (LAHNSCC), which consists of 70 Gy in 35 fractions and cisplatin 100 mg/m2 on day 1, 22 and 43 of radiotherapy (RT) (NCCN guidelines for head and neck cancers [7]). dCRT is related to life-threatening adverse events in 5%–10% of patients [8, 9]; thus, further research is needed to define the optimal treatment schedule with adequate survival and acceptable toxicity. In this literature review, we will provide an overview of the current knowledge and controversies surrounding CEC with respect to histopathology, genetic factors, etiology, diagnosis, treatment, toxicity and local disease control rate and survival and we will provide recommendations for future studies regarding potential curative treatment options, based on the current literature.
METHODS
Literature search strategyIn May 2015, the PubMed, Web of Science and EMBASE databases were searched for relevant evidence. The literature search strategy is detailed in supplementary Section 1, available at Annals of Oncology online. The reference lists from included articles were also searched for additional relevant studies.

PART I | Chapter 3
76
Study inclusion and exclusion criteriaLanguage was restricted to English. Articles published during the last three decades were selected. Studies were included if they comprised a minimum of five patients diagnosed with cancer in the cervical esophagus and treated with curative intent. Studies were excluded if patients had distant metastasis and were treated with palliative intent. Only studies published as abstracts were excluded.
Literature search resultsThe initial search in the three databases yielded 639 articles. Based on reading the titles and abstracts, 488 articles were excluded. Using Endnote (Version X6, Thomson Reuters) and manual screening, 63 duplicate articles were excluded. Eighty-eight original articles and reviews were further screened. Thirty articles were excluded based on our predefined exclusion criteria leaving 58 full publications for inclusion in this review. During the manual search of the reference lists of the included articles, a further 49 relevant publications were identified, resulting in 107 articles that formed the basis of this review (for details, see flowchart in supplementary Figure S1, available at Annals of Oncology online).
HISTOPATHOLOGY AND GENETIC FACTORS
SCC accounts for 95% of cervical esophageal malignancies [10]. Very little is known about SCC precursor lesions and genetic factors predisposing for CEC in particular. The malignant transformation to SCC involves basal cell hyperplasia, low- and high-grade dysplasia and invasive carcinoma. Squamous dysplasia is a well-described histological precursor lesion of esophageal SCC [11–14]. Dysplasia is thought to be caused by molecular alterations [15]. Early detection of molecular alterations, endoscopic and histological features of squamous dysplasia is necessary to identify SCC at an early stage [16–19]. Modern endoscopy techniques, like micro-endoscopy, lugol staining and the use of biomarkers, have the potential to increase early detection [17–19].
Genetic alterations in CEC are currently poorly understood and to the best of our knowledge, there are no studies investigating only genetic alterations in carcinomas located in the cervical esophagus. Several genes have been shown to be down- or upregulated in (pre)malignant lesions of esophageal SCC [11, 20–29]. The most common genetic alterations consist of allelic losses at chromosomes 3p, 5q, 9p, 9q, 3q, 17p, 17q, 18q and mutations of p53, RB1(retinoblastoma protein), ALDH2 (aldehyde dehydrogenase-2 gene), MTHFR (methylene tetrahydrofolate reductase gene), EGR1 (early growth response gene-1), CCND1 (cyclin D1) and cMYC [30–34]. A recent work by the Cancer Genome Atlas Initiative provides comprehensive molecular profiling data of squamous cancers of the esophagus that may also facilitate future research for diagnostic and therapeutic molecular targets in CEC [35]. There is an urgent clinical need for further research to investigate the potential usefulness of genetic and protein alterations for early diagnosis of CEC.

PART I | Chapter 3
77
3
ETIOLOGY AND RISK FACTORS
Tobacco and alcohol consumption are well-known risk factors for CEC [10, 15, 34, 36]. Mutations in ADH (alcohol-dehydrogenase) 1B and ALDH-2, both enzymes involved in alcohol metabolism, have been related to the occurrence of neoplasia in the upper aerodigestive tract [10].
The variable geographic incidence of CEC with high-risk regions in Iran, Central Asia, Mongolia, Northern China and Eastern Cape South Africa suggests a potential influence of nutritional and environmental factors. The role of family history has not been clarified yet [34, 37]. Occupational factors have been difficult to evaluate independently because esophageal carcinomas often occur in unqualified workers in industry and agriculture, who are often also frequent tobacco and/or alcohol consumers. High exposure to polycyclic aromatic hydrocarbons (PAHs) has also been associated with a high risk of esophageal cancer [38].
Studies investigating the potential association between human papilloma virus (HPV) infection and CEC incidence have conflicting results. Geographical locations with a high incidence of esophageal SCC tend to also have a higher incidence of HPV infection in patients with esophageal SCC (more than 10% of esophageal SCC cases are related to HPV infection) [39–41]. The main strains involved in esophageal cancer appear to be HPV 16 and 18 [40].
DIAGNOSIS AND STAGING
Endoscopy and biopsy are the first choice of examination if a CEC is suspected. Recommendations regarding the minimum number of biopsies vary between countries, ranging from 1 up to 8 [42]. Endoscopic ultrasonography (EUS) is considered to be the best technique to assess the depth of tumor infiltration and lymph node status and can be combined with fine needle aspiration cytology [3, 43, 44]. 18-Fluorodeoxyglucose-positron-emission-tomography-computed-tomography (18F-FDG-PET CT) is highly recommended to detect potential tumor invasion into adjacent structures and lymph node or distant metastases [44]. Bronchoscopy, with endobronchial ultrasound and biopsy, can be used to assess infiltration in adjacent structures, e.g. trachea [45].
Most CECs are locally advanced at the time of diagnosis, with ~55% being TNM stage III or IV tumors and 27% stage II tumors [1, 46–49]. An overview of the current TNM staging can be found in supplementary table 2, available at Annals of Oncology online.
TREATMENT
Historically, surgery has been the standard treatment for CEC. Mostly, a PLE was carried out, a procedure that includes the resection of the larynx and has a huge impact on
PART I | Chapter 3
78
quality of life [50]. Nonetheless, during the last decades, the outcome for patients who underwent surgery for CEC has improved due to the newly developed surgical strategies, such as minimally invasive surgery and neoadjuvant (chemo)radiotherapy [51]. Furthermore, reconstruction methods like free jejunal graft, gastric pull-up or deltopectoral or pectoralis major myocutaneus flap have been introduced [50, 52–62]. Despite these efforts, surgical treatment still has a great risk of major complications and a high morbidity and mortality rate [57, 63–68].
To improve survival and quality of life, non-invasive treatment options like RT and dCRT have been explored. The Radiation Therapy Oncology Group (RTOG) compared dCRT versus RT alone for the treatment of patients with thoracic esophageal cancer and found that dCRT significantly increased 5-year overall survival (OS) compared with RT alone, 26% versus 0% [8]. Although this study included only patients with thoracic esophageal cancer, the study results form the basis of the current non-surgical treatment of patients with esophageal cancer, including CEC. An update of the original RTOG 85-01 trial by al-Sarraf et al. [69] reports higher survival rates of patients treated with dCRT compared with RT alone in the treatment of locally advanced esophageal cancer. Another study carried out in patients with cervical and upper thoracic esophageal cancer showed less favorable results than the RTOG study, reporting 5-year OS of 18.6% in patients treated with dCRT [70]. Other studies reported a 5-year OS of ~30% for CEC patients treated with dCRT [46, 71] which is comparable with OS after surgery alone (24%–47%) [56, 58, 63, 66, 72–74]. In comparison with other SCCs in the head and neck region, 5-year OS of patients with CEC is relatively low [10], while it is comparable with 5-year OS in patients with SCC located in other parts of the esophagus, which is ~26% [8]. dCRT may cause high rates of toxicity in CEC patients. Common toxic effects include dysphagia, dehydration, mucositis, esophagitis, dermatitis and fatigue. An additional side-effect of chemotherapy is bone marrow suppression [8, 9, 47–49, 71, 75, 76]. Moreover, late toxic effects like strictures and fistulas may occur [48, 71, 77].
In the following, we will describe the currently available organ-sparing treatment options for locally advanced CEC, which combine RT with chemotherapy.
Systemic therapy used within concurrent treatment regimens for CECSeveral chemotherapeutic regimens are used, adapted by established regimens in lower esophageal SCC and head and neck squamous cell carcinoma (HNSCC). High-dose cisplatin-based chemotherapy, consisting of 100 mg/m2 on day 1, 22 and 43 of RT, is currently considered one of the treatment options for patients with CEC based on increased cure rates that were observed with high-dose cisplatin in patients with head and neck cancer [7, 46]. However, no difference was seen in OS, disease-free survival (DFS) or locoregional recurrence-free survival (LRFS) comparing CEC patients treated with high-dose cisplatin with a concurrent RT dose of 70 Gy versus low-dose cisplatin combined with 5-FU or mitomycin C, concurrently administered with an RT schedule of 54 Gy (Table 1) [46].

PART I | Chapter 3
79
3
Tabl
e 1.
Incl
uded
stu
dies
usi
ng d
efini
tive
chem
orad
iatio
n (d
CRT)
or c
hem
othe
rapy
in p
atie
nts
with
eso
phag
eal c
ance
r.
Aut
hor(
s)/
Refe
renc
enu
mbe
r
Stud
y
desi
gnPa
tien
tsTr
eatm
ent
Resp
onse
rat
es (%
)Su
rviv
al (%
)
Tepp
er e
t al
(200
8) [5
1]RC
T ph
ase
356
(SCC
, AC)
(1) C
DD
P/5-
FU/5
0.4
Gy
+
SX (N
= 3
0)
(2) S
X (N
= 2
6)
(1)
CR 3
3.3
PR 2
6.7
SD 6
.7
PD 6
.7
(2) n
o da
ta
5-YR
OS:
(1
) 39
(95%
CI 2
1-57
)
(2) 1
6 (9
5% C
I 5-3
3)
Coop
er e
t al
(199
9) [8
]RC
T ph
ase
312
3 (S
CC, A
C)(1
) CD
DP/
5-FU
/50
Gy
(N =
61)
:
(2) 6
4 G
y
(1)
PD 2
6
(2)
PD 3
7
5-YR
OS:
(1
) 26
(95%
CI 1
5-37
)
(2) 0
Al-S
arra
f et a
l (1
997)
[69]
RCT
phas
e 3
(upd
ate
of R
TOG
85
-01
tria
l)
123
(SCC
)(1
) CD
DP/
5-FU
/50
Gy
(N =
61)
(2) 6
4 G
y (N
= 6
2)
5-YR
OS:
(1) 2
7
(2) 0
Wan
g et
al
(200
6) [7
0]RS
35 (S
CC, A
C)(1
) 5-F
U/5
0.4
Gy
(N =
35)
CR >
50
Gy:
79.
2, <
50
Gy:
27
.3PR
8.6
SD 5
.7PD
5.7
5-YR
OS:
18.
6 5-
YR D
FS: 2
2.4
Uno
et a
l (2
007)
[49]
RS21
(SCC
)(1
) CD
DP/
5-FU
/64
Gy
(N =
14)
:
(2) C
DD
P/5-
FU/4
0 G
y +
SX (N
= 5
):
(3) 6
4 G
y (N
= 2
)
Initi
al L
CR: 5
7.9
(incl
udin
g 5
SX p
atie
nts)
(1) +
(2) +
(3)
2-YR
OS:
41
5-YR
OS:
27
Yam
ada
et a
l (2
006)
[47]
RS27
(SCC
)(1
) CD
DP/
5-FU
/66
Gy
(N =
23)
:
(2) 6
6 G
y (N
= 4
)
CR 4
8.1
PR 4
0.7
SD 1
1.1
PD 0
(1) +
(2)
5-YR
OS:
37.
9

PART I | Chapter 3
80
Aut
hor(
s)/
Refe
renc
enu
mbe
r
Stud
y
desi
gnPa
tien
tsTr
eatm
ent
Resp
onse
rat
es (%
)Su
rviv
al (%
)
Gki
ka e
t al
(201
4) [7
1]RS
55 (S
CC, A
C,
undi
ffer
entia
ted
carc
inom
a)
(1) 5
6-70
Gy/
CD
DP/
5-FU
(R
TOG
85-
01)1
NAT
: LV/
5-FU
/CD
DP
(N =
25)
(2) 5
6-70
Gy/
CD
DP/
VP-1
6 (F
LEP)
2 N
AT: 5
-FU
/LV/
CDD
P/VP
-16
(N
= 2
2)
(3) 5
6-70
Gy/
CDD
P-ba
sed/
irin
otec
an o
r ta
xane
s (e
xact
dos
e is
not
men
tione
d)
(N =
8)
CR 6
4RD
26
PD 1
4.5
PR 1
0.9
3-YR
OS:
(1) 1
8
(2) 3
7
(3) 3
1
Stus
chke
et a
l (1
999)
[9]
RS17
(SCC
)
(1) 6
0-66
Gy
N
AT: 5
-FU
/LV/
VP-1
6 (F
LEP)
4 CR
T: C
DD
P/VP
-16
(FLE
P)4
(N =
11)
(2
) 60-
66 G
yN
AT: L
V/5-
FU/C
DD
P
CRT:
CD
DP/
VP-1
6 (F
LEP)
4 (N
= 6
)
2-, 3
-YR
LRR
67 +
14
(1) +
(2)
2- a
nd 3
-YR
OS:
24
Burm
eist
er e
t al
(200
0) [4
8]PC
S34
(SCC
, AC)
(1
) CD
DP
80/5
-FU
/61.
2 G
y
(N =
24)
(2) C
DD
P 20
/5-F
U/6
1.2
Gy
(N
= 8
) (3
) 5-F
U/ 6
1.2
Gy
(N =
2)
CR 9
1.1
PR 5
.9SD
0PD
2.9
(1) +
(2) +
(3)
5-YR
OS
55
(95%
CI 3
8-74
)3
Hua
ng e
t al
(200
8) [4
6]RS
50 (C
EC)
(1) 5
-FU
/mito
myc
in C
or
CD
DP/
54 G
y (N
= 1
3)
+ SX
(N =
6)
(2) C
DD
P/70
Gy
(N =
22)
:
(3) R
T al
one
(N =
9)
(dos
e un
know
n)
(1)
CR (1
-YR)
71
CR (2
-YR)
48
(2)
CR (1
-YR)
64
CR
(2-Y
R) 4
6
(1)
1-YR
OS:
86
(95%
CI 6
2-95
) 2-
YR O
S: 5
2 (9
5% C
I 30-
71)
(2)
1-YR
OS:
69
(95%
CI 4
9-82
)2-
YR O
S: 4
3 (9
5% C
I 24-
60)

PART I | Chapter 3
81
3
Aut
hor(
s)/
Refe
renc
enu
mbe
r
Stud
y
desi
gnPa
tien
tsTr
eatm
ent
Resp
onse
rat
es (%
)Su
rviv
al (%
)
Conr
oy e
t al
(201
4) [8
1]RC
T ph
ase
2/3
267
(SCC
, AC,
ASC
C)
(1) o
xalip
latin
/LV/
5-FU
(FO
LFO
X)/5
0 G
y (N
=
134)
(2) C
DD
P/5-
FU/5
0 G
y (N
= 1
33)
(1)
CR 4
4PR
22
SD 1
1PD
9(2
) CR
43
PR 2
2SD
8PD
9
3-YR
OS:
(1
) 19.
9 (9
5% C
I 10.
8-31
.0)
(2) 2
6.9
(95%
CI 1
6.9-
37.8
)
Cros
by e
t al
(201
3) [8
5]RC
T ph
ase
2/3
258
(SCC
, AC)
(1
) CD
DP/
cape
cita
bine
/50
Gy
(2
cyc
les
CDD
P/ca
peci
tabi
ne N
AT) (
N =
12
9)
(2) C
DD
P/ca
peci
tabi
ne/5
0 G
y +
cetu
xim
ab (2
cyc
les
CDD
P/ca
peci
tabi
ne
NAT
) (N
= 1
29)
TFF
at 2
4 w
eeks
: (1
) 66.
4 (9
0% C
I 58.
6 –
73.6
)
(2) 7
6.9
(90%
CI 6
9.7-
83.0
)
mO
S4 : (1
) 25.
4 m
onth
s
(95%
CI 2
0.5-
37.9
)
(2) 2
2.1
mon
ths
(9
5% C
I 15.
1-24
.5)
Ma
et a
l (2
011)
[76
]RC
T10
2 (S
CC)
(1) p
aclit
axel
/CD
DP/
59.4
Gy
+ IF
I (N
= 5
1)
(2) p
aclit
axel
/CD
DP/
59.4
Gy
+ EN
I (N
= 5
1)
(1)
CR (1
-YR)
90.
0 CR
(2-Y
R) 8
0.1
CR (3
-YR)
80.
1
(2)
CR (1
-YR)
92.
8 CR
(2-Y
R) 9
2.8
CR (3
-YR)
85.
7
(1)
1-YR
OS:
100
2-
YR O
S: 8
7.5
3-YR
OS:
32.
0
(2)
1-YR
OS:
100
2-
YR O
S: 8
4.0
3-YR
OS:
41.
3
Tu e
t al
(201
3) [7
5]RS
36 (S
CC)
(1) p
aclit
axel
/CD
DP/
60 G
y (IM
RT)
(N =
36)
CR 1
6.7
PR 3
3.3
SD 4
1.7
1-YR
OS:
83.
3 2-
YR O
S: 4
2.8

PART I | Chapter 3
82
Aut
hor(
s)/
Refe
renc
enu
mbe
r
Stud
y
desi
gnPa
tien
tsTr
eatm
ent
Resp
onse
rat
es (%
)Su
rviv
al (%
)
Blei
berg
et a
l (1
997)
[80]
RCT
phas
e 2
88 (S
CC)
(1) C
Tx: C
DD
P/5-
FU (N
= 4
4)
prio
r SX
(N =
5)
prio
r ra
diot
hera
py (N
= 4
)
(2) C
Tx: C
DD
P (N
= 4
4)
prio
r SX
(N =
8)
prio
r ra
diot
hera
py (N
= 6
)
(1)
CR 3
PR
32
SD 2
9 PD
18
earl
y de
ath
15
not a
sses
sabl
e 3
(2)
CR 3
PR
16
SD 3
8 PD
43
earl
y de
ath
0 no
t ass
essa
ble
0
(1)
1-YR
OS:
34
(95%
CI 2
0-48
) 2-
YR O
S: 1
8 (9
5% C
I 7-2
9)
(2)
1-YR
OS:
27
(95%
CI 1
4-40
)2-
YR O
S: 9
(95%
CI 1
-17)
Rupp
ert e
t al
(201
0) [8
2]RS
57 (S
CC, A
C)
(1) C
DD
P/ir
inot
ecan
/50.
4-61
.2 G
y (2
cy
cles
CD
DP/
irin
otec
an N
AT)
(N =
38)
(2) c
arbo
plat
in/p
aclit
axel
/50.
4-61
.2 G
y
(N =
19)
(1)
CR 2
1.1
(2)
CR 3
1.6
(1)5
2-YR
OS:
40.
6(9
5% C
I 26.
9 –
61.3
)
(2)
2-YR
OS:
63.
2
(95%
CI 4
4.8-
89.0
)
Ludm
ir e
t al
(201
4) [4
0]RS
37 (C
EC)
CRT
(N =
37)
RT: 5
4 G
y (1
4.4-
71)
CTx:
CD
DP/
5-FU
(N =
16)
, CD
DP
(N =
4),
CDD
P/VP
-16
(N =
6),
CDD
P/pa
clita
xel
(N =
6),
othe
r
(N =
7)
CR 5
.65-
YR O
S: 3
4.1
Min
sky
et a
l (2
002)
[78
]RC
T ph
ase
323
6 (S
CC, A
C)
(1) C
DD
P/5-
FU/6
4.8
Gy
(N =
109
)
(2) C
DD
P/5-
FU/5
0.4
Gy
(N =
109
)
2-YR
OS:
(1) 3
1
(2) 4
0

PART I | Chapter 3
83
3
Aut
hor(
s)/
Refe
renc
enu
mbe
r
Stud
y
desi
gnPa
tien
tsTr
eatm
ent
Resp
onse
rat
es (%
)Su
rviv
al (%
)
Zhan
g et
al
(201
5) [9
2]RS
102
(CEC
)CR
T (N
= 1
02)
RT: 6
0 G
y (5
0-70
)
CTx:
N
AT: C
DD
P-ba
sed
(N =
18)
CRT:
1.
do
ceta
xel/C
DD
P(N
= 1
3)2.
CD
DP/
doce
taxe
l (N
= 2
6)3.
CD
DP/
5-FU
(N =
63)
3-YR
OS:
39.
3
1 RTO
G 8
5-01
: CRT
: CD
DP
75 m
g/m
2 (fir
st d
ay o
f wee
k 1,
5, 8
and
11)
/5-F
U 1
g/m
2 (fir
st 4
day
s of
wee
k 1,
5, 8
and
11)
[7]
2 FLE
P: N
AT: L
V 30
0 m
g/m
2 , VP
-16
100
mg/
m2 ,
5-FU
500
mg/
m2 ,
CDD
P 30
mg/
m2 o
n da
ys 1
-3. A
2nd
and
3rd
cou
rse
wer
e st
arte
d at
day
22
of th
e la
st c
ours
e. C
RT s
tart
ed
betw
een
days
22
and
28 o
f las
t NAT
cou
rse.
CRT
: CD
DP
50 m
g/m
2 day
s 2
and
8, V
P-16
100
mg/
m2 o
n da
ys 4
, 5 a
nd 6
(60h
-infu
sion
) [8]
3 No
sign
ifica
nt d
iffer
ence
bet
wee
n th
e tw
o re
gim
ens
in te
rms
of o
vera
ll an
d di
seas
e-fr
ee s
urvi
val.
4 H
R: 1
.53
(95%
CI 1
.03-
2.27
) (P
= 0.
035)
5 HR:
2.4
2 (P
= 0
.022
)
RCT:
rand
omiz
ed c
ontr
olle
d tr
ial,
SCC:
squ
amou
s ce
ll ca
rcin
oma,
AC:
ade
noca
rcin
oma,
CD
DP:
cis
plat
in, 5
-FU
: 5-fl
uoro
urac
il, S
X: s
urge
ry, C
R: c
ompl
ete
resp
onse
, PR:
par
tial
resp
onse
, SD
: sta
ble
dise
ase,
PD
: pro
gres
sive
dis
ease
, -YR
OS:
-yea
r ov
eral
l sur
viva
l, CI
: con
fiden
ce in
terv
al,T
FF: t
reat
men
t fai
lure
free
, RS:
ret
rosp
ectiv
e st
udy,
-YR
DFS
: -y
ear
dise
ase
free
sur
viva
l, LC
R: lo
cal c
ontr
ol r
ate,
CRT
: che
mor
adia
tion,
NAT
: neo
adju
vant
, LV:
leuc
ovor
in, V
P-16
: eto
posi
de, L
RR: l
ocor
egio
nal r
ecur
renc
e ra
te, P
CS:
pros
pect
ive
coho
rt s
tudy
, CEC
: cer
vica
l eso
phag
eal c
ance
r, AS
CC: a
deno
squa
mou
s ca
rcin
oma,
MO
S: m
edia
n ov
eral
l sur
viva
l, H
R: h
azar
d ra
tio, I
FI: i
nvol
ved
field
irra
diat
ion,
EN
I: el
ectiv
e no
dal i
rrad
iatio
n, IM
RT: i
nten
sity
mod
ulat
ed r
adia
tion
ther
apy,
CTx
: che
mot
hera
py, L
RC: l
ocor
egio
nal c
ontr
ol

PART I | Chapter 3
84
SCC of the lower esophagus is often treated with a combination of cisplatin and 5-FU [82], a key factor in the treatment of gastroesophageal cancer [84]. In CEC, the combination of cisplatin and 5-FU has shown acceptable cure and survival rates [9, 46–48, 71] (Table 1), but combination therapy can lead to higher toxicity rates when compared with cisplatin alone. Bleiberg et al. [80] randomized patients with advanced esophageal SCC to either receive cisplatin (100 mg/m2) and continuous 5-FU (1000 mg/m2/day) from day 1 to 5 or cisplatin alone (100 mg/m2) and found higher 2-year OS rates (18% and 9%, respectively), but also higher toxicity rates in the cisplatin/5-FU group (16% treatment-related deaths in the cisplatin/5-FU group versus 0% in the cisplatin alone group).
Other chemotherapeutic regimens have been studied with comparable results [78, 81]. Conroy et al. [78] studied the role of FOLFOX regimen: 5-FU (bolus 400 mg/m2, followed by infusional 5-FU 1600 mg/m2 over 46 h) plus leucovorin (200 mg/m2) and oxaliplatin (85 mg/m2) in patients with adeno-, squamous cell or adenosquamous carcinoma. They compared the FOLFOX regimen with standard cisplatin/5-FU and found more treatment-related deaths in the cisplatin/5-FU group (4.5% in the cisplatin/5-FU group versus 0.7% in the FOLFOX group). Three-year OS was 19.9% [95% confidence interval (CI) 10.8–31.0] in the FOLFOX group and 26.9% (95% CI 16.9–37.8) in the cisplatin/5-FU group. Ruppert et al. [81] identified carboplatin-/paclitaxel-based chemotherapy, a regimen already used in SCC of the lower esophagus, as a useful alternative to the cisplatin-based regimen. Van Hagen et al. [85] studied the role of neoadjuvant carboplatin AUC 2 and paclitaxel 50 mg/m2 for 5 weeks and concurrent RT (41.4 Gy in 23 fractions), followed by surgery in esophageal and esophagogastric junction SCC, adenocarcinoma and large-cell undifferentiated carcinoma and found a pathological complete response (pCR) in 49% of patients with SCC. There was only one treatment-related death among the patients (n = 171) that were treated with neoadjuvant chemoradiation, which indicates the great tolerance of this regimen. Three-year OS in this group was 58%, compared with 44% in the group that received surgery alone. Moreover, Blom et al. [86] found in patients treated with chemoradiation before surgery, that the combination of carboplatin/paclitaxel/41.4 Gy had a lower percentage of treatment-related deaths (1.1% versus 4.1%) and a comparable 3-year OS rate (57% versus 61%) compared with the cisplatin/5-FU/50.4 Gy regimen. Hence, low-dose cisplatin, FOLFOX and carboplatin/paclitaxel (especially in combination with a low RT dose of 41.4 Gy) are useful alternatives to a high-dose cisplatin-based chemotherapy.
The role of epidermal growth factor receptor (EGFR), targeting therapy using cetuximab, an established radiosensitizer in HNSCC [7], seems to be not that prominent in CEC. On the basis of the results of the SCOPE1 trial, a multicenter phase II/III trial, randomizing 258 patients between standard dCRT and dCRT combined with cetuximab, the use of cetuximab cannot be recommended due to treatment-limiting toxicity [79]. Likewise, the randomized phase III RTOG 0436 trial that compared OS between patients treated with dCRT with or without cetuximab [87], and the COG trial, in which

PART I | Chapter 3
85
3
esophageal cancer patients who had progressed under chemotherapy were randomly assigned to either gefitinib or placebo [88], did not find an improvement in OS when an anti-EGFR target was added. This is in contrast to the study by Lorenzen et al. [89], which was published before the SCOPE1 trial, but included only 62 patients. They reported a 75% disease control rate in the group randomized to standard chemotherapy combined with cetuximab (CET-CF), compared with 57% in the group randomized to standard chemotherapy alone (CF). This study also found a difference in survival rates, with a median OS of 9.5 and 5.5 months for CET-CF and CF, respectively, and therefore concluded that the addition of cetuximab to standard chemotherapy might be a useful therapeutic approach in patients with advanced (metastatic) esophageal SCC. Recently, the subsequent phase III REAL3 trial had to be closed early due to a lack of efficacy [90]. These findings seem to indicate that the use of cetuximab is not recommended in patients with CEC.
RT used within concurrent treatment regimens for CECThe standard of care regarding dCRT for patients with esophageal cancer is 50.4 Gy with concurrent chemotherapy. In the case of CEC, there exists some tendency to increase the radiation dose of 60–70 Gy to the primary tumor and ~40–45 Gy to elective lymph node regions, analogous to the treatment of LAHNSCC [91]. The randomized phase III INT-0123/RTOG 94-05 trial investigated the effect of dose escalation from 50.4 to 64.8 Gy of RT combined with chemotherapy in esophageal cancer from all anatomical locations [82]. There was no increase in survival or local/regional control for the high-dose arm. In CEC, there has been a tendency to use higher doses of radiation than the standard dose of 50.4 Gy, up to 66–70 Gy [9, 47, 48, 55, 83, 92]. In retrospective studies, there are some indications that higher dose of radiation might be associated with improved outcome in esophageal cancer; Zhang et al. [93] investigated local disease control and survival rates in patients with stage II–III esophageal cancer treated either with high-dose RT (>51 Gy) or with low-dose RT (≤51 Gy) and found a positive correlation between radiation dose and locoregional control rate and survival. Comparable results regarding the association between a higher radiation dose and survival were published by Sun [94]. On the other hand, Huang et al. [46] concluded that when using conventionally fractionated RT (70 Gy) rather than hypofractionated RT (54 Gy), the addition of prophylactic nodal RT and a change to high-dose cisplatin chemotherapy did not result in improved outcome in CEC patients. Currently, the ARTDECO study, in which differences in local tumor control, survival and grade 3 and 4 toxicity are measured between patients with inoperable esophageal cancer treated with a total RT dose of 61.6 Gy in combination with carboplatin/paclitaxel and in patients with similar tumor characteristics treated with a total RT dose of 50.4 Gy with the same concurrent chemotherapy regimen, is ongoing [95].
Administering an adequate RT dose to the tumor is often challenging because of the close proximity of the cervical esophagus to vital structures such as the spinal cord and lungs. Modern RT techniques, such as intensity-modulated radiation therapy (IMRT)

PART I | Chapter 3
86
and simultaneous integrated boost (SIB), in which the intensity of the radiation can be changed during treatment, enable a higher dose to the tumor and a reduced dose to adjacent structures. Studies suggest that these techniques may be useful in the treatment of CEC [75, 91, 96, 97]. Volume-modulated arc RT, a rotational radiation treatment technique, allows to deliver a more conformal dose to the tumor and improved sparing of nearby organs at risk, providing an alternative CEC treatment option [98, 99].
No consensus has been reached so far regarding elective lymph node irradiation (ENI). According to some authors, the omission of ENI did not have a significant effect on the failure rate of non-irradiated lymph nodes and OS, but would delay cervical nodal progression [76, 100, 101], while others do recommend elective irradiation of neck and upper mediastinal lymph node stations [102–104]. Patients who have not been treated with ENI might need salvage treatment more frequently than those treated with ENI. However, the latter group of patients might experience more frequently and more severe treatment-related toxicity, because of the larger radiation field [76, 105]. There are no guidelines recommending the treatment of paratracheal lymph nodes, despite the fact that the lymphatic drainage of the cervical esophagus is primarily to the paratracheal nodes and 43% of CEC patients have paratracheal lymph node metastases [106, 107].
LOCAL DISEASE CONTROL RATE AND SURVIVAL
The local disease control rate depends mainly on the depth of tumor invasion, lymph node status and type of treatment [8, 46, 47, 49, 76, 81]. Locoregional recurrence rates in CEC patients treated with dCRT, range from 13.7% to 42% within 0–8.7 years [46, 76, 101] compared with 51%–74.1% within 0–4 years in patients treated with RT alone [47, 100] and 15.6%–48.6% within 0–15 years in surgically treated patients [53, 56, 63, 66].
Local failure is an important prognostic factor for survival. Uno et al. [49] found that after dCRT, none of the patients with initial local failure as determined by endoscopic examination, survived more than 20 months compared with 2- and 5-year survival rates of 60% and 40%, respectively, in patients with initial local control. Local recurrences can be treated by salvage surgery, which potentially has a high morbidity rate, but is the only chance for relatively long-term survival [108]. Otherwise, palliative treatment options have to be considered.
Survival rates of patients with CEC remain poor, due to a delayed diagnosis, poor performance status of many patients, particularly anatomic characteristics of the viscera associated with high malignancy potential, frequent occurrence of locoregional and distant metastases and 12%–30% increased risk of synchronous or metachronous lesions [9, 46, 109]. Yamada et al. [47] found that performance status and tumor length (≤6 or >6 cm) were factors that were significantly related to survival.

PART I | Chapter 3
87
3
DISCUSSION AND RECOMMENDATIONS
CEC is a very rare disease and often locally advanced at the time of diagnosis resulting in limited locoregional disease control and poor survival. Dysplasia is a known precursor lesion of SCC [11–14] and can be diagnosed by endoscopic biopsy improving the detection of patients at high risk of malignant transformation. Detection of genetic changes could also be an effective manner of diagnosing early tumors, but unfortunately the molecular changes in CEC and its precursor lesions remain to be clarified.
Owing to the presence of locally advanced disease at the time of diagnosis and the cancer being close to vital structures such as the larynx, upper airway and spinal cord, non-surgical management seems to be the current preferred therapeutic option. Our review suggests that the best results with respect to locoregional disease control and survival can be achieved with dCRT, however, at the costs of higher incidence of toxicity compared with RT alone. Despite the introduction of dCRT, survival rates remain relatively low and patients require optimal clinical support to retain food intake and exercise to maintain good quality of life and to achieve best patient outcome [110].
Several different chemoradiation schedules and techniques have been investigated in the past, but no consensus has been reached regarding the optimal treatment for CEC patients. High-dose RT (60–70 Gy) and concurrent cisplatin, similar to the established treatment regimen in locally advanced head and neck SCC (HNSCC), could be an option; however, there is no level I evidence to support this approach. Although thoracic esophageal SCCs, defined by being localized caudal of the suprasternal notch, develop only few centimeters distal from cervical SCC, the commonly used dCRT schedule for thoracic esophageal SCCs consists of a lower radiation dose (50.4 Gy) combined with cisplatin/5-fluorouracil (5-FU), oxaliplatin/5-FU or carboplatin/paclitaxel regimen [6]. A possible rationale for the use of a lower radiation dose is the very close proximity of vital structures in the mediastinum and the lungs. In the CROSS study on preoperative chemoradiation, Van Hagen et al. [85] found a pCR of 49% after neoadjuvant chemoradiation (41.4 Gy and concurrent carboplatin/paclitaxel) in esophageal SCC of which 2% were located in the proximal third of the esophagus. The study by Blom et al. [86] suggests this regimen is as effective as dCRT consisting of an RT dose of 50.4 Gy and cisplatin/5-FU, and has a more favorable toxicity profile [86]. Therefore, we could hypothesize that the currently used high radiation dose in CEC is potentially unnecessary as it does not seem to result in higher complete response (CR) rates and outcome in SCC of the lower esophagus [82]. While the use of a high RT dose of 61.6 Gy concurrently with chemotherapy in patients with inoperable/irresectable esophageal cancer is currently studied in the ARTDECO study [95], it could also be of potential interest to study the effect of lower dose RT in CEC alone, which may be accompanied by lower toxicity rates.
However, high toxicity rates in CEC patients [8, 9] might not only be a result of a high radiation dose, but could also be an effect of a relatively large radiation field [105], especially when combined with concurrent chemotherapy. A reduction in toxicity rates

PART I | Chapter 3
88
may be expected by applying modern state-of-the-art radiation techniques like IMRT, lowering the dose to normal structures. However, the current literature is inconclusive; some studies propose that only an irradiation volume covering the gross volume is appropriate and accompanied with lower toxicity rates [76, 100], while others recommend consideration of ENI, especially in the case of nodal stage N1 and higher [5, 101]. Given the reported incidence of metastases in surrounding lymph nodes (~50% of all CECs), especially in the neck (levels II, III and the supraclavicular lymph nodes) and upper mediastinum [103, 106], we recommend that ENI of cervical, supraclavicular and paratracheal lymph nodes should be considered in CEC invading the hypopharynx. In more distally located CEC, which are located close to the suprasternal notch, ENI of mediastinal and paratracheal lymph nodes should be considered [104]. We anticipate that radiation techniques will improve in the near future enabling the discovery and use of newer techniques (e.g. dose painting, in which a non-uniform radiation dose distribution is applied to the target volume based on functional or molecular imaging), where only the radiation dose needed for adequate locoregional disease control is applied, hopefully minimizing the rate of adverse events.
With respect to systemic therapy, a cisplatin-based schedule is currently often used, since this has shown to be effective in the treatment of HNSCC. Current guidelines are inconclusive regarding the most adequate chemotherapy treatment regimen and cisplatin/5-FU, oxaliplatin/5-FU or carboplatin/paclitaxel are equally recommended [5]. Since the combination of carboplatin and paclitaxel is proven to be effective with acceptable adverse event rates in the (neoadjuvant) treatment of lower esophageal SCC [81, 85], future studies might want to compare the combination of carboplatin/paclitaxel with current cisplatin-based schedules. When molecular profiles of CEC including driver oncogenes and potential therapeutic targets will become apparent, the use of targeted agents, e.g. as radiosensitizers, might become worthwhile to investigate in future clinical trials. Furthermore, future research should focus on identifying a dCRT design with adequate survival and acceptable toxicity rates. It is of clinical interest to establish whether CECs are best treated with head and neck cancer protocols or regimens established in lower esophageal SCC. As patients with CECs treated according to the head and neck cancer protocol have a worse prognosis compared with patients with HNSCC [72, 74, 107], it could be interesting to study the potential underlying molecular differences between these two types of SCCs.

PART I | Chapter 3
89
3
ConclusionCEC remains unchartered territory for many practising physicians. Treatment of cancers at this site is often difficult because of the cervical location and most tumors are locally advanced with invasion of surrounding vital structures. To improve survival outcome and reduce morbidity and mortality rates, future studies should focus on earlier detection of these cancers and improving treatment design by investigating innovative radiation schedules and identifying the optimal backbone of systemic therapy.
FundingNone declared.
DisclosureThe authors have declared no conflicts of interest.
RecommendationsFuture studies that focus on early detection of CEC precancerous conditions, molecular changes and on identification of biomarkers for detection of early disease or as targets for radiosensitizers would be desirable for the future. However, since CEC is rare in Western countries, it is improbable that screening will impact on this disease outside high-risk areasTaking the survival data and toxicity profiles of the different dCRT regimens in consideration, the optimal treatment regimen for CEC patients is not yet definedFuture studies should focus on whether CEC is best treated according to a head and neck cancer or esophageal cancer protocolWe recommend that ENI of cervical, supraclavicular and paratracheal lymph nodes should be consideredFinally, one should be aware that patients will need optimal clinical support to retain food intake and exercise to optimize patient outcome and quality of life

PART I | Chapter 3
90
SUPPLEMENTARY DATA SECTION 1
Literature search strategy
Pubmed1. Cervical esophageal cancer [Title/Abstract]2. Cervical esophageal carcinoma [Title/Abstract]3. Cancer of the cervical esophagus [Title/Abstract]4. Cervical oesophageal cancer [Title/Abstract]5. Cervical oesophageal carcinoma [Title/Abstract]6. Cancer of the cervical oesophagus [Title/Abstract]7. Proximal esophageal cancer [Title/Abstract]8. Proximal esophageal carcinoma [Title/Abstract]9. Cancer of the proximal esophagus [Title/Abstract]10. Proximal oesophageal cancer [Title/Abstract]11. Proximal oesophageal carcinoma [Title/Abstract]12. Cancer of the proximal oesophagus [Title/Abstract]13. Upper esophageal cancer [Title/Abstract]14. Upper esophageal carcinoma [Title/Abstract]15. Cancer of the upper esophagus [Title/Abstract]16. Upper oesophageal cancer [Title/Abstract]17. Upper oesophageal carcinoma [Title/Abstract]18. Cancer of the upper oesophagus [Title/Abstract]19. High esophageal carcinoma [Title/Abstract]20. High esophageal cancer [Title/Abstract]21. High oesophageal carcinoma [Title/Abstract]22. High oesophageal cancer [Title/Abstract]23. 1 or 2 or 3 or 4 or 5 or 6 or 7 or 8 or 9 or 10 or 11 or 12 or 13 or 14 or 15 or 16 or
17 or 18 or 19 or 20 or 21 or 2224. Incidence25. Incidence [Mesh Terms]26. Epidemiology27. Epidemiology [Mesh Terms]28. 24 or 2529. 26 or 2730. Etiology 31. Etiology [Subheading] [Mesh Terms]32. 30 or 3133. Risk factors34. Risk factors [Mesh Terms]35. 33 or 3436. Diagnostics
PART I | Chapter 3
91
3
37. Treatment38. Therapy39. Therapy [Subheading]40. 37 or 38 or 3941. Chemoradiation42. Chemoradiotherapy43. 41 or 4244. Targeted therapy45. Molecular targeted therapy [Mesh Terms]46. 44 or 4547. Survival rate 48. Survival rate [Mesh Terms]49. 47 or 4850. Toxicity 51. Toxicity [Subheading] [Mesh Terms]52. 50 or 5153. 23 AND (28 OR 29 OR 32 OR 35 OR 36 OR 40 OR 43 OR 46 OR 49 OR 52)
Histology1. Esophageal cancer [Title/Abstract]2. Oesophageal cancer [Title/Abstract]3. Esophageal carcinoma [Title/Abstract]4. Oesophageal carcinoma [Title/Abstract]5. Cancer of the esophagus [Title/Abstract]6. Cancer of the oesophagus [Title/Abstract]7. 1 or 2 or 3 or 4 or 5 or 68. Histopathology9. Squamous dysplasia10. Precancerous condition11. Precancerous lesion12. 7 AND 8 AND 9 AND 10 AND 11
Web of Science(Cervical esophageal cancer OR cervical esophageal carcinoma OR cancer cervical esophagus OR cervical oesophageal cancer OR cervical oesophageal carcinoma OR cancer cervical oesophagus OR proximal esophageal cancer OR proximal esophageal carcinoma OR cancer proximal esophagus OR proximal oesophageal cancer OR proximal oesophageal carcinoma OR cancer proximal oesophagus OR upper esophageal cancer OR upper esophageal carcinoma OR cancer of upper esophagus OR upper oesophageal cancer OR upper oesophageal carcinoma OR cancer of upper oesophagus AND (incidence OR epidemiology OR etiology OR risk factors OR diagnostics OR treatment OR therapy OR chemoradiation OR chemoradiotherapy OR targeted therapy OR molecular targeted therapy OR survival rate OR toxicity)) [Title]

PART I | Chapter 3
92
Histology1. Esophageal cancer [Title]2. Oesophageal cancer [Title]3. Esophageal carcinoma [Title]4. Oesophageal carcinoma [Title]5. Cancer of the esophagus [Title]6. Cancer of the oesophagus [Title]7. 1 or 2 or 3 or 4 or 5 or 68. Histopathology9. Squamous dysplasia10. 7 AND 8 AND 9
Embase((Cervical esophageal cancer OR cervical esophageal carcinoma OR cancer of the cervical esophagus OR cervical oesophageal cancer OR cervical oesophageal carcinoma OR cancer of cervical oesophagus OR proximal esophageal cancer OR proximal esophageal carcinoma OR cancer of proximal esophagus OR proximal oesophageal cancer OR proximal oesophageal carcinoma OR cancer of proximal oesophagus OR upper oesophageal cancer OR upper oesophageal carcinoma OR cancer of the upper oesophagus) AND (incidence OR epidemiology OR etiology OR risk factors OR diagnostics OR treatment OR therapy OR chemoradiation OR chemoradiotherapy OR targeted therapy OR molecular targeted therapy OR survival rate OR toxicity)) [Abstract]
Histology1. Esophageal cancer2. Esophageal carcinoma3. Cancer of the esophagus4. Oesophageal cancer5. Oesophageal carcinoma6. Cancer of the oesophagus7. 1 or 2 or 3 or 4 or 5 or 68. Histopathology9. Squamous dysplasia10. 7 AND 8 AND 9

PART I | Chapter 3
93
3
Supplementary Figure S1.

PART I | Chapter 3
94
SUPPLEMENTARY DATA SECTION 2
1. Sobin, L.H., M.K. Gospodarowicz, and C. Wittekind, The TNM Classification of Malignant Tumours, 7th Edition. 2009: Wiley-Blackwell. 336.
TNM staging (7th edition) of esophageal squamous cell cancer (SCC) [1]
Primary tumor (T)1
Tx Primary tumor cannot be assessed
T0 No evidence of primary tumor
Tis2 High-grade dysplasia
T1 Tumor invades lamina propria, muscularis mucosae or submucosa
T1a Tumor invades lamina propria or muscularis mucosae
T1b Tumor invades submucosa
T2 Tumor invades muscularis propria
T3 Tumor invades adventitia
T4 Tumor invades adjacent structures
T4a Resectable tumor invading pleura, pericardium or diaphragm
T4b Unresectable tumor invading adjacent structures, such as aorta, vertebral body, trachea, etc.
Regional lymph nodes (N)3
Nx Regional lymph node(s) cannot be assessed
N0 No regional lymph node metastasis
N1 Metastasis in 1-2 regional lymph nodes
N2 Metastasis in 3-6 regional lymph nodes
N3 Metastasis in seven or more regional lymph nodes
Distant metastasis (M)
M0 No distant metastasis
M1 Distant metastasis
Histologic grade (G)
Gx Grade cannot be assessed – stage grouping as G1
G1 Well differentiated
G2 Moderately differentiated
G3 Poorly differentiated
G4 Undifferentiated – stage grouping as G3 squamous
Anatomic stage/prognostic groups
Squamous cell carcinoma4
Stage T N M Grade Tumor location5
0 Tis (HGD) N0 M0 1, x Any
IA T1 N0 M0 1, x Any
IB T1T2-3
N0 N0
M0 M0
2-3 1, x
Any Lower, x
IIA T2-3 T2-3
N0 N0
M0 M0
1, x 2-3
Upper, middle Lower, x

PART I | Chapter 3
95
3Anatomic stage/prognostic groups
Squamous cell carcinoma4
IIB T2-3 T1-2
N0 N1
M0 M0
2-3 Any
Upper, middle Any
IIIA T1-2 T3 T4
N2 N1 N0
M0 M0 M0
Any Any Any
Any Any Any
IIIB T3 N2 M0 Any Any
IIIC T4a T4b Any
N1-2 Any N3
M0 M0 M0
Any Any Any
Any Any Any
IV Any Any M1 Any Any
1 At least maximal dimension of the tumor must be recorded and multiple tumors require the T(m) suffix.2 HGD: high-grade dysplasia includes all noninvasive neoplastic epithelia that was formerly called carcinoma in
situ, a diagnosis that is no longer used for columnar mucosae anywhere in the gastrointestinal tract.3 Number must be recorded for total number of regional nodes sampled and total number of reported nodes
with metastasis.4 Or mixed histology including a squamous component or NOS.5 Location of the primary cancer site is defined by the position of the upper (proximal) edge of the tumor in the
esophagus.
PART I | Chapter 3
96
REFERENCES
1. Grass GD, Cooper SL, Armeson K et al. Cervical esophageal cancer: a population-based study. Head Neck 2015; 37: 808–814.
2. Davies L, Welch HG. Epidemiology of head and neck cancer in the United States. Otolaryngol Head Neck Surg 2006; 135(3): 451–457.
3. Lee DJ, Harris A, Gillette A et al. Carcinoma of the cervical esophagus:diagnosis, management, and results. South Med J 1984; 77(11): 1365–1367.
4. Torre LA, Bray F, Siegel RL et al. Global cancer statistics, 2012. CA Cancer J Clin 2015; 65(2): 87–108.
5. National Comprehensive Cancer Network. Clinical practice guidelines in oncology (NCCN Guidelines). Esophageal and Esophagogastric Junction Cancers 2015.NCCN.org.
6. European Society for Medical Oncology: clinical practice guidelines, in oesophageal cancer: ESMO Clinical Practice Guidelines for diagnosis, treatment and follow-up. Ann Oncol 2013; 24(Suppl 6): vi51–56.
7. National Comprehensive Cancer Network. Clinical practice guidelines in oncology (NCCN Guidelines). Head and Neck Cancers 2015: NCCN.org.
8. Cooper JS, Guo MD, Herskovic A et al. Chemoradiotherapy of locally advanced esophageal cancer: long-term follow-up of a prospective randomized trial (RTOG 85-01). Radiation Therapy Oncology Group. JAMA 1999; 281(17): 1623–1627.
9. Stuschke M, Stahl M, Wilke H et al. Induction chemotherapy followed by concurrent chemotherapy and high-dose radiotherapy for locally advanced squamous cell carcinoma of the cervical oesophagus. Oncology 1999; 57(2):99–105.
10. Popescu CR, Bertesteanu SV, Mirea D et al. The epidemiology of hypopharynx and cervical esophagus cancer. J Med Life 2010; 3(4): 396–401.
11. Taylor PR, Abnet CC, Dawsey SM. Squamous dysplasia—the precursor lesion for esophageal squamous cell carcinoma. Cancer Epidemiol Biomarkers Prev 2013;22(4): 540–552.
12. Lewin KJ. Malignant and premalignant lesions of the esophagus. Keio J Med 1992; 41(3): 177–183.
13. Sugimachi K, Sumiyoshi K, Nozoe T et al. Carcinogenesis and histogenesis of esophageal carcinoma. Cancer 1995; 75(6 Suppl): 1440–1445.
14. Qiu SL, Yang GR. Precursor lesions of esophageal cancer in high-risk populations in Henan Province, China. Cancer 1988; 62(3): 551–557.
15. Popescu B, Popescu CR, Grigore R et al. Morphology and morphopathology of hypopharyngo-esophageal cancer. Rom J Morphol Embryol 2012; 53(2):243–248.
16. Dawsey SM, Wang GQ, Weinstein WM et al. Squamous dysplasia and early esophageal cancer in the Linxian region of China: distinctive endoscopic lesions. Gastroenterology 1993; 105(5): 1333–1340.
17. Shin D, Protano MA, Polydorides AD et al. Quantitative analysis of high-resolution microendoscopic images for diagnosis of esophageal squamous cell carcinoma.Clin Gastroenterol Hepatol 2015; 13(2): 272–279.e2.
18. Kaneko K, Katagiri A, Konishi K et al. Study of p53 gene alteration as a biomarker to evaluate the malignant risk of Lugol-unstained lesion with non-dysplasia in theoesophagus. Br J Cancer 2007; 96(3): 492–498.

PART I | Chapter 3
97
3
19. Carvalho R, Areia M, Brito D et al. Diagnostic accuracy of lugol chromoendoscopy in the oesophagus in patients with head and neck cancer. Rev Esp Enferm Dig 2013; 105(2): 79–83.
20. Xue LY, Hu N, Song YM et al. Tissue microarray analysis reveals a tight correlation between protein expression pattern and progression of esophageal squamous cell carcinoma. BMC Cancer 2006; 6: 296.
21. Wang LD, Hong JY, Qiu SL et al. Accumulation of p53 protein in human esophageal precancerous lesions: a possible early biomarker for carcinogenesis. Cancer Res 1993; 53(8): 1783–1787.
22. Zhou Q, Dong Wang L, Du F et al. Changes of TGFbeta1 and TGFbetaRII expression in esophageal precancerous and cancerous lesions: a study of a high risk population in Henan, northern China. Dis Esophagus 2002; 15(1): 74–79.
23. Yang L, Wang LS, Chen XL et al. Hedgehog signaling activation in the development of squamous cell carcinoma and adenocarcinoma of esophagus. Int J Biochem Mol Biol 2012; 3(1): 46–57.
24. Bai P, Xiao X, Zou J et al. Expression of p14(ARF), p15(INK4b), p16(INK4a) and skp2 increases during esophageal squamous cell cancer progression. Exp Ther Med 2012; 3(6): 1026–1032.
25. Chen H, Wang LD, Guo M et al. Alterations of p53 and PCNA in cancer and adjacent tissues from concurrent carcinomas of the esophagus and gastric cardia in the same patient in Linzhou, a high incidence area for esophageal cancer in northern China. World J Gastroenterol 2003; 9(1): 16–21.
26. Kimos MC, Wang S, Borkowski A et al. Esophagin and proliferating cell nuclear antigen (PCNA) are biomarkers of human esophageal neoplastic progression. Int J Cancer 2004; 111(3): 415–417.
27. Roye GD, Myers RB, Brown D et al. CD44 expression in dysplastic epithelium and squamous-cell carcinoma of the esophagus. Int J Cancer 1996; 69(4): 254–258.
28. Xia M, Zhao MQ, Wu K et al. Investigations on the clinical significance of FOXP3 protein expression in cervical oesophageal cancer and the number of FOXP3+ tumour-infiltrating lymphocytes. J Int Med Res 2013; 41(4): 1002–1008.
29. Yang YF, Li H, Xu XQ et al. An expression of squamous cell carcinoma antigen 2 in peripheral blood within the different stages of esophageal carcinogenesis. Dis Esophagus 2008; 21(5): 395–401.
30. Wu MY, Liang YR, Wu XY, Zhuang CX. Relationship between Egr-1 gene expression and apoptosis in esophageal carcinoma and precancerous lesions. World J Gastroenterol 2002; 8(6): 971–975.
31. Li QD, Li H, Wang MS et al. Multi-susceptibility genes associated with the risk of the development stages of esophageal squamous cell cancer in Feicheng County. BMC Gastroenterol 2011; 11: 74.
32. Yasuda M, Kuwano H, Watanabe M et al. p53 expression in squamous dysplasia associated with carcinoma of the oesophagus: evidence for field carcinogenesis. Br J Cancer 2000; 83(8): 1033–1038.
33. Montesano R, Hollstein M, Hainaut P. Genetic alterations in esophageal cancer and their relevance to etiology and pathogenesis: a review. Int J Cancer 1996; 69(3): 225–235.
34. Morita M, Saeki H, Mori M et al. Risk factors for esophageal cancer and the multiple occurrence of carcinoma in the upper aerodigestive tract. Surgery 2002; 131(1 Suppl): S1–S6.
35. Zhan C, Yan L, Wang L et al. Landscape of expression profiles in esophageal carcinoma by The Cancer Genome Atlas data. Dis Esophagus 2015; doi: 10.1111/dote.12416.
36. Pandeya N, Williams G, Green AC et al. Alcohol consumption and the risks of adenocarcinoma and squamous cell carcinoma of the esophagus. Gastroenterology 2009; 136(4): 1215–1224, e1–2.
37. Morita M, Kuwano H, Nakashima T et al. Family aggregation of carcinoma of the hypopharynx and cervical esophagus: special reference to multiplicity of cancer in upper aerodigestive tract. Int J Cancer 1998; 76(4): 468–471.

PART I | Chapter 3
98
38. van Gijssel HE, Schild LJ, Watt DL et al. Polycyclic aromatic hydrocarbon-DNA adducts determined by semiquantitative immunohistochemistry in human esophageal biopsies taken in 1985. Mutat Res 2004; 547(1–2): 55–62.
39. Guo F, Liu Y, Wang X et al. Human papillomavirus infection and esophageal squamous cell carcinoma: a case–control study. Cancer Epidemiol Biomarkers Prev 2012; 21(5): 780–785.
40. Ludmir EB, Palta M, Zhang X et al. Incidence and prognostic impact of high-risk HPV tumor infection in cervical esophageal carcinoma. J Gastrointest Oncol 2014; 5(6): 401–407.
41. Syrjanen KJ. HPV infections and oesophageal cancer. J Clin Pathol 2002; 55 (10): 721–728.
42. Nederlandse Vereniging van Maag-Darm-Leverartsen: richtlijn oesofaguscarcinoom. 2010; http://www.oncoline.nl/oesofaguscarcinoom (4 May 2016, date last accessed).
43. Laterza E, de Manzoni G, Guglielmi A et al. Endoscopic ultrasonography in the staging of esophageal carcinoma after preoperative radiotherapy and chemotherapy. Ann Thorac Surg 1999; 67(5): 1466–1469.
44. Hermans R. Imaging of hypopharyngeal and cervical oesophageal cancer. Cancer Imaging 2004; 4(1): 7–9.
45. Riedel M, Hauck RW, Stein HJ et al. Preoperative bronchoscopic assessment of airway invasion by esophageal cancer: a prospective study. Chest 1998; 113(3): 687–695.
46. Huang SH, Lockwood G, Brierley J et al. Effect of concurrent high-dose cisplatin chemotherapy and conformal radiotherapy on cervical esophageal cancer survival. Int J Radiat Oncol Biol Phys 2008: 71(3): 735–740.
47. Yamada K, Murakami M, Okamoto Y et al. Treatment results of radiotherapy for carcinoma of the cervical esophagus. Acta Oncol 2006; 45(8): 1120–1125.
48. Burmeister BH, Dickie G, Smithers BM et al. Thirty-four patients with carcinoma of the cervical esophagus treated with chemoradiation therapy. Arch Otolaryngol Head Neck Surg 2000: 126(2): 205–208.
49. Uno T, Isobe K, Kawakami H et al. Concurrent chemoradiation for patients with squamous cell carcinoma of the cervical esophagus. Dis Esophagus 2007; 20(1): 12–18.
50. Archibald S, Young JE, Thoma A. Pharyngo-cervical esophageal reconstruction. Clin Plast Surg 2005; 32(3): 339–346.
51. Tepper J, Krasna MJ, Niedzwiecki D et al. Phase III trial of trimodality therapy with cisplatin, fluorouracil, radiotherapy, and surgery compared with surgery alone for esophageal cancer: CALGB 9781. J Clin Oncol 2008; 26(7): 1086–1092.
52. Bottger T, Bumb P, Dutkowski P et al. Carcinoma of the hypopharynx and the cervical oesophagus: a surgical challenge. Eur J Surg 1999; 165(10): 940–946.
53. Kadota H, Sakuraba M, Kimata Y et al. Larynx-preserving esophagectomy and jejunal transfer for cervical esophageal carcinoma. Laryngoscope 2009; 119(7):1274–1280.
54. Cao Z, Ye Q, Qian X et al. End-to-end anastomosis after segmental esophagectomy for early stage cervical esophageal carcinoma. Ann Thorac Surg 2013; 95(5): 1815–1817.
55. Tong DK, Law S, Kwong DL et al. Current management of cervical esophageal cancer. World J Surg 2011; 35(3): 600–607.
56. Miyata H, Yamasaki M, Takahashi T et al. Larynx-preserving limited resection and free jejunal graft for carcinoma of the cervical esophagus. World J Surg 2013;37(3): 551–557.

PART I | Chapter 3
99
3
57. Shuangba H, Jingwu S, Yinfeng W et al. Complication following gastric pull-up reconstruction for advanced hypopharyngeal or cervical esophageal carcinoma: a 20-year review in a Chinese institute. Am J Otolaryngol 2011; 32(4): 275–278.
58. Sun F, Li X, Lei D et al. Surgical management of cervical esophageal carcinoma with larynx preservation and reconstruction. Int J Clin Exp Med 2014; 7(9): 2771–2778.
59. Zhao D, Gao X, Guan L et al. Free jejunal graft for reconstruction of defects in the hypopharynx and cervical esophagus following the cancer resections. J Gastrointest Surg 2009; 13(7): 1368–1372.
60. Cahow CE, Sasaki CT. Gastric pull-up reconstruction for pharyngo-laryngoesophagectomy. Arch Surg 1994; 129(4): 425–429; discussion 429–430.
61. Puttawibul P, Pornpatanarak C, Sangthong B et al. Results of gastric pull-up reconstruction for laryngolaryngo-oesophagectomy in advanced head and neck cancer and cervical oesophageal squamous cell carcinoma. Asian J Surg 2004;27(3): 180–185.
62. Wu JX, Yu L, Li JY et al. Gasless laparoscopically assisted transhiatal esophagectomy for upper esophageal carcinoma. Ann Surg Oncol 2015; 22(3): 1015–1019.
63. Ott K, Lordick F, Molls M et al. Limited resection and free jejunal graft interposition for squamous cell carcinoma of the cervical oesophagus. Br J Surg 2009; 96(3): 258–266.
64. Adelstein DJ, Rice TW, Tefft M et al. Aggressive concurrent chemoradiotherapy and surgical resection for proximal esophageal squamous cell carcinoma. Cancer 1994; 74(6): 1680–1685.
65. Chou SH, Li HP, Lee JY et al. Radical resection or chemoradiotherapy for cervical esophageal cancer? World J Surg 2010; 34(8): 1832–1839.
66. Daiko H, Hayashi R, Saikawa M et al. Surgical management of carcinoma of the cervical esophagus. J Surg Oncol 2007; 96(2): 166–172.
67. Ferahkose Z, Bedirli A, Kerem M et al. Comparison of free jejunal graft with gastric pull-up reconstruction after resection of hypopharyngeal and cervical esophageal carcinoma. Dis Esophagus 2008; 21(4): 340–345.
68. Kelley DJ, Wolf R, Shaha AR et al. Impact of clinicopathologic parameters on patient survival in carcinoma of the cervical esophagus. Am J Surg 1995; 170 (5): 427–431.
69. al-Sarraf M, Martz K, Herskovic A et al. Progress report of combined chemoradiotherapy versus radiotherapy alone in patients with esophageal cancer: an intergroup study. J Clin Oncol 1997; 15(1): 277–284.
70. Wang S, Liao Z, Chen Y et al. Esophageal cancer located at the neck and upper thorax treated with concurrent chemoradiation: a single-institution experience. J Thorac Oncol 2006; 1(3): 252–259.
71. Gkika E, Gauler T, Eberhardt W et al. Long-term results of definitive radiochemotherapy in locally advanced cancers of the cervical esophagus. Dis Esophagus 2014; 27(7): 678–684.
72. Triboulet JP, Mariette C, Chevalier D, Amrouni H. Surgical management of carcinoma of the hypopharynx and cervical esophagus: analysis of 209 cases. Arch Surg 2001; 136(10): 1164–1170.
73. Jiang M, He X, Wu D et al. Reconstruction techniques for hypopharyngeal and cervical esophageal carcinoma. J Thorac Dis 2015; 7(3): 449–454.
74. Wang HW, Chu PY, Kuo KT et al. A reappraisal of surgical management for squamous cell carcinoma in the pharyngoesophageal junction. J Surg Oncol 2006; 93(6): 468–476.
75. Tu L, Sun L, Xu Y et al. Paclitaxel and cisplatin combined with intensitymodulated radiotherapy for upper esophageal carcinoma. Radiat Oncol 2013; 8:75.

PART I | Chapter 3
100
76. Ma JB, Song YP, Yu JM et al. Feasibility of involved-field conformal radiotherapy for cervical and upper-thoracic esophageal cancer. Onkologie 2011; 34(11): 599–604.
77. Wang SL, Liao Z, Liu H et al. Intensity-modulated radiation therapy with concurrent chemotherapy for locally advanced cervical and upper thoracic esophageal cancer. World J Gastroenterol 2006; 12(34): 5501–5508.
78. Conroy T, Galais MP, Raoul JL et al. Definitive chemoradiotherapy with FOLFOX versus fluorouracil and cisplatin in patients with oesophageal cancer (PRODIGE5/ACCORD17): final results of a randomised, phase 2/3 trial. Lancet Oncol 2014; 15(3): 305–314.
79. Crosby T, Hurt CN, Falk S et al. Chemoradiotherapy with or without cetuximab in patients with oesophageal cancer (SCOPE1): a multicentre, phase 2/3 randomised trial. Lancet Oncol 2013; 14(7): 627–637.
80. Bleiberg H, Conroy T, Paillot B et al. Randomised phase II study of cisplatin and 5-fluorouracil (5-FU) versus cisplatin alone in advanced squamous cell oesophageal cancer. Eur J Cancer 1997; 33(8): 1216–1220.
81. Ruppert BN, Watkins JM, Shirai K et al. Cisplatin/irinotecan versus carboplatin/paclitaxel as definitive chemoradiotherapy for locoregionally advanced esophageal cancer. Am J Clin Oncol 2010; 33(4): 346–352.
82. Minsky BD, Pajak TF, Ginsberg RJ et al. INT 0123 (Radiation Therapy Oncology Group 94–05) phase III trial of combined-modality therapy for esophageal cancer: high-dose versus standard-dose radiation therapy. J Clin Oncol 2002;20(5): 1167–1174.
83. Zhang P, Xi M, Zhao L et al. Clinical efficacy and failure pattern in patients with cervical esophageal cancer treated with definitive chemoradiotherapy. Radiother Oncol 2015; 116(2): 257–261.
84. Cunningham D, Allum WH, Stenning SP et al. Perioperative chemotherapy versus surgery alone for resectable gastroesophageal cancer. N Engl J Med 2006; 355 (1): 11–20.
85. van Hagen P, Hulshof MC, van Lanschot JJ et al. Preoperative chemoradiotherapy for esophageal or junctional cancer. N Engl J Med 2012; 366(22): 2074–2084.
86. Blom RL, Sosef MN, Nap M et al. Comparison of two neoadjuvant chemoradiotherapy regimens in patients with potentially curable esophageal carcinoma. Dis Esophagus 2014; 27(4): 380–387.
87. Ilson DH, Moughan J, Suntharalingam M et al. RTOG 0436: a phase III trial evaluating the addition of cetuximab to paclitaxel, cisplatin, and radiation for patients with esophageal cancer treated without surgery. J Clin Oncol 2014; 32: 5s (Suppl): abstr 4007.
88. Dutton SJ, Ferry DR, Blazeby JM et al. Gefitinib for oesophageal cancer progressing after chemotherapy (COG): a phase 3, multicentre,double-blind, placebo-controlled randomised trial. Lancet Oncol 2014; 15(8):894–904.
89. Lorenzen S, Schuster T, Porschen R et al. Cetuximab plus cisplatin-5-fluorouracil versus cisplatin-5-fluorouracil alone in first-line metastatic squamous cell carcinoma of the esophagus: a randomized phase II study of the Arbeitsgemeinschaft Internistische Onkologie. Ann Oncol 2009; 20(10): 1667–1673.
90. Waddell T, Chau I, Cunningham D et al. Epirubicin, oxaliplatin, and capecitabine with or without panitumumab for patients with previously untreated advanced oesophagogastric cancer (REAL3): a randomised, open-label phase 3 trial. Lancet Oncol 2013; 14(6): 481–489.
91. Fu WH, Wang LH, Zhou ZM et al. Comparison of conformal and intensitymodulated techniques for simultaneous integrated boost radiotherapy of upper esophageal carcinoma. World J Gastroenterol 2004; 10(8): 1098–1102.
92. Cao CN, Luo JW, Gao L et al. Intensity-modulated radiotherapy for cervical esophageal squamous cell carcinoma: clinical outcomes and patterns of failure. Eur Arch Otorhinolaryngol 2016; 273(3): 741–747.
PART I | Chapter 3
101
3
93. Zhang Z, Liao Z, Jin J et al. Dose–response relationship in locoregional control for patients with stage II-III esophageal cancer treated with concurrent chemotherapy and radiotherapy. Int J Radiat Oncol Biol Phys 2005; 61(3): 656–664.
94. Sun DR. Ten-year follow-up of esophageal cancer treated by radical radiation therapy: analysis of 869 patients. Int J Radiat Oncol Biol Phys 1989; 16(2): 329–334.
95. Hulshof MCCM. A randomised trial of dose escalation in definitive chemoradiotherapy for patients with oesophageal cancer. http://www.trialregister.nl/trialreg/admin/rctview.asp?TC=3532 (4 May 2016, date last accessed).
96. Fenkell L, Kaminsky I, Breen S et al. Dosimetric comparison of IMRT vs. 3D conformal radiotherapy in the treatment of cancer of the cervical esophagus. Radiother Oncol 2008; 89(3): 287–291.
97. Zhu WG, Zhou K, Yu CH et al. Efficacy analysis of simplified intensity-modulated radiotherapy with high or conventional dose and concurrent chemotherapy for patients with neck and upper thoracic esophageal carcinoma. Asian Pac J Cancer Prev 2012; 13(3): 803–807.
98. Yin Y, Chen J, Xing L et al. Applications of IMAT in cervical esophageal cancer radiotherapy: a comparison with fixed-field IMRT in dosimetry and implementation. J Appl Clin Med Phys 2011; 12(2): 3343.
99. Ma P, Wang X, Xu Y et al. Applying the technique of volume-modulated arc radiotherapy to upper esophageal carcinoma. J Appl Clin Med Phys 2014; 15(3):4732.
100. Zhao KL, Ma JB, Liu G et al. Three-dimensional conformal radiation therapy for esophageal squamous cell carcinoma: is elective nodal irradiation necessary? Int J Radiat Oncol Biol Phys 2010; 76(2): 446–451.
101. Liu M, Zhao K, Chen Y, Jiang GL. Evaluation of the value of ENI in radiotherapy for cervical and upper thoracic esophageal cancer: a retrospective analysis. Radiat Oncol 2014; 9: 232.
102. Li M, Liu Y, Fan B, Yu J. Determining the lymph node clinical target volume of upper esophageal carcinoma with computed tomography. Arch Biol Sci 2013; 65 (3): 821–827.
103. Li M, Liu Y, Xu L et al. Computed tomography-based distribution of involved lymph nodes in patients with upper esophageal cancer. Curr Oncol 2015; 22(3): e178–e182.
104. Van De Voorde L, Larue RT, Pijls M et al. A qualitative synthesis of the evidence behind elective lymph node irradiation in oesophageal cancer. Radiother Oncol 2014; 113(2): 166–174.
105. Fukada J, Shigematsu N, Ohashi T et al. Pericardial and pleural effusions after definitive radiotherapy for esophageal cancer. J Radiat Res 2012; 53(3): 447–453.
106. Timon CV, Toner M, Conlon BJ. Paratracheal lymph node involvement in advanced cancer of the larynx, hypopharynx, and cervical esophagus. Laryngoscope 2003; 113(9): 1595–1599.
107. Jones AS, Roland NJ, Hamilton J et al. Malignant tumours of the cervical oesophagus. Clin Otolaryngol Allied Sci 1996; 21(1): 49–53.
108. Schieman C, Wigle DA, Deschamps C et al. Salvage resections for recurrent or persistent cancer of the proximal esophagus after chemoradiotherapy. Ann Thorac Surg 2013; 95(2): 459–463.
109. Mariette C, Triboulet JP. Which treatment for squamous cell carcinoma of the pharyngoesophageal junction? J Surg Oncol 2006; 94(3): 175–177.
110. Fearon K, Strasser F, Anker SD et al. Definition and classification of cancer cachexia: an international consensus. Lancet Oncol 2011; 12(5): 489–495.


New life for old drugs or data?
PART II


Ruben T.H.M. Larue*, Lien Van De Voorde*, Janna E. van Timmeren, Ralph T.H. Leijenaar, Maaike Berbée, Meindert N. Sosef, Wendy M.J. Schreurs,
Wouter van Elmpt, Philippe Lambin
*Equal contributors
4D-CT imaging to assess radiomics feature stability:
An investigation for thoracic cancers
Radiotherapy and Oncology 2017 Oct; 125(1): 147-153
Chapter 4

PART II | Chapter 4
106
ABSTRACT
Background and purposeQuantitative tissue characteristics derived from medical images, also called radiomics, contain valuable prognostic information in several tumour-sites. The large number of features available increases the risk of overfitting. Typically test–retest CT-scans are used to reduce dimensionality and select robust features. However, these scans are not always available. We propose to use different phases of respiratory-correlated 4D CT-scans (4DCT) as alternative.
Materials and methodsIn test–retest CT-scans of 26 non-small cell lung cancer (NSCLC) patients and 4DCT-scans (8 breathing phases) of 20 NSCLC and 20 oesophageal cancer patients, 1045 radiomics features of the primary tumours were calculated. A concordance correlation coefficient (CCC) >0.85 was used to identify robust features. Correlation with prognostic value was tested using univariate cox regression in 120 oesophageal cancer patients.
ResultsFeatures based on unfiltered images demonstrated greater robustness than wavelet-filtered features. In total 63/74 (85%) unfiltered features and 268/299 (90%) wavelet features stable in the 4D-lung dataset were also stable in the test–retest dataset. In oesophageal cancer 397/1045 (38%) features were robust, of which 108 features were significantly associated with overall-survival.
Conclusion4DCT-scans can be used as alternative to eliminate unstable radiomics features as first step in a feature selection procedure. Feature robustness is tumour-site specific and independent of prognostic value.
Keywords: Radiomics, Oesophageal cancer, Lung cancer,Test-retest, 4D-CT, Feature stability

PART II | Chapter 4
107
4
In oncology an ever-increasing number of treatment options are available, coinciding with evidence that tumours and patients might be more heterogeneous than previously assumed [1]. To move forward from the current population-based approach to precision cancer therapy [2–4], physicians should be able to consider many factors including biology (mutations, translations, etc.), pathology, proteomics [5], and imaging biomarkers [6], to select the best possible treatment. Clinical Decision Support Systems (CDSS) can put all these factors in perspective based on prediction models of treatment outcome, and are developed to aid physicians with decision making [7,8]. An example is the PRODECIS platform, comparing photon and proton treatments in head-and-neck cancer, based on dose metric, toxicity and cost-effectiveness levels [9].
Medical imaging already plays an important role in the diagnosis, treatment planning and response assessment of oncology patients. Apart from a few routinely used quantitative metrics (e.g. RECIST [10]), most clinical decisions still rely on visual interpretation. In recent years there is increasing interest in the use of quantitative imaging features, also called radiomics [11], for the prediction of outcome. A landmark study was conducted by Aerts et al. [12], in which a combination of four radiomics features was shown to be prognostic in both lung and head-and-neck cancer. Their data suggest that radiomics has the potential to identify a general prognostic phenotype existing in multiple cancer types. This was further demonstrated in oesophageal cancer, where tumour heterogeneity features retrieved from computed tomography (CT) [13–15] and positron emission tomography (PET) [16,17] scans have been shown to be associated with treatment outcome. This makes radiomics a powerful and promising approach for implementation in CDSS [8].
Radiomics features are susceptible to several factors including respiratory motion [18–20], scanner settings [21], and segmentation method [22]. Also, the number of features calculated is typically much larger than the number of patients studied, which increases the risk of overfitting the data when developing prognostic and/or predictive models [23]. Therefore, it is important to appropriately reduce the number of features and select only the most robust and repeatable features prior to model building [23]. Reduction of dimensionality is typically achieved by analysing multiple delineations and/or through test–retest data [24–26]. These test–retest scans are not acquired in daily clinical practice and therefore are not available for all tumour sites. For lung cancer, however, the publically available RIDER dataset [27], in which 32 NCLSC patients received a same-day repeated CT-scan in a prospective setting, can be used.
Test-retest data are not available for oesophageal cancer, but prior to radiotherapy treatment respiratory-correlated 4D CT-scans (4DCT) are acquired routinely for radiotherapy dose planning purposes. Although the source of variability is different in 4DCT compared to the test–retest setting, the biological tumour variability within a short time-span is limited and hence quantitative features derived from either dataset should also not change. We therefore hypothesized that the majority of the features not susceptible to acquisition and set-up variations in test–retest scans would also be insusceptible to breathing motion in 4DCT-scans, implying that 4DCT-scans can act as
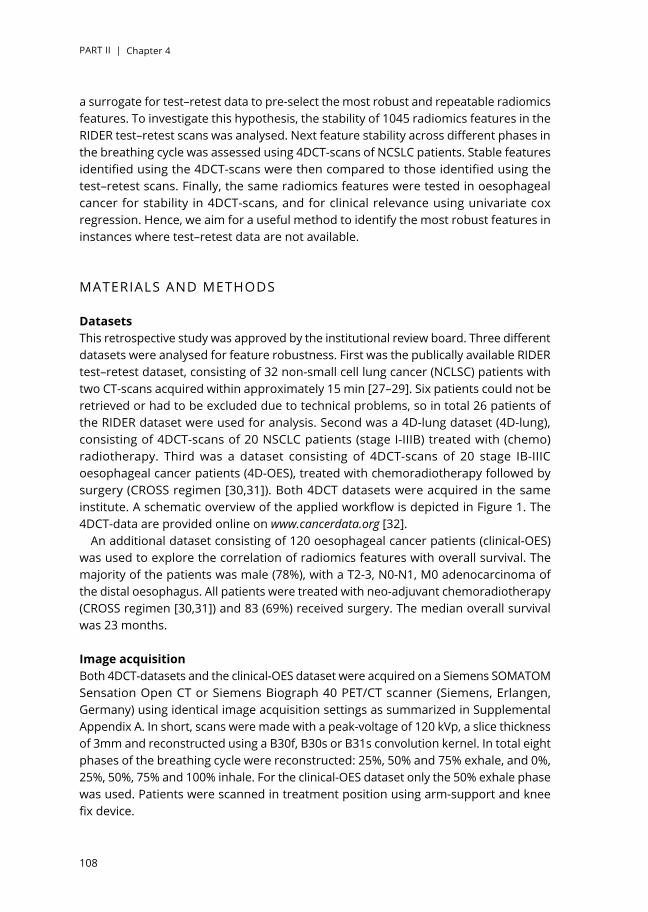
PART II | Chapter 4
108
a surrogate for test–retest data to pre-select the most robust and repeatable radiomics features. To investigate this hypothesis, the stability of 1045 radiomics features in the RIDER test–retest scans was analysed. Next feature stability across different phases in the breathing cycle was assessed using 4DCT-scans of NCSLC patients. Stable features identified using the 4DCT-scans were then compared to those identified using the test–retest scans. Finally, the same radiomics features were tested in oesophageal cancer for stability in 4DCT-scans, and for clinical relevance using univariate cox regression. Hence, we aim for a useful method to identify the most robust features in instances where test–retest data are not available.
MATERIALS AND METHODS
DatasetsThis retrospective study was approved by the institutional review board. Three different datasets were analysed for feature robustness. First was the publically available RIDER test–retest dataset, consisting of 32 non-small cell lung cancer (NCLSC) patients with two CT-scans acquired within approximately 15 min [27–29]. Six patients could not be retrieved or had to be excluded due to technical problems, so in total 26 patients of the RIDER dataset were used for analysis. Second was a 4D-lung dataset (4D-lung), consisting of 4DCT-scans of 20 NSCLC patients (stage I-IIIB) treated with (chemo)radiotherapy. Third was a dataset consisting of 4DCT-scans of 20 stage IB-IIIC oesophageal cancer patients (4D-OES), treated with chemoradiotherapy followed by surgery (CROSS regimen [30,31]). Both 4DCT datasets were acquired in the same institute. A schematic overview of the applied workflow is depicted in Figure 1. The 4DCT-data are provided online on www.cancerdata.org [32].
An additional dataset consisting of 120 oesophageal cancer patients (clinical-OES) was used to explore the correlation of radiomics features with overall survival. The majority of the patients was male (78%), with a T2-3, N0-N1, M0 adenocarcinoma of the distal oesophagus. All patients were treated with neo-adjuvant chemoradiotherapy (CROSS regimen [30,31]) and 83 (69%) received surgery. The median overall survival was 23 months.
Image acquisitionBoth 4DCT-datasets and the clinical-OES dataset were acquired on a Siemens SOMATOM Sensation Open CT or Siemens Biograph 40 PET/CT scanner (Siemens, Erlangen, Germany) using identical image acquisition settings as summarized in Supplemental Appendix A. In short, scans were made with a peak-voltage of 120 kVp, a slice thickness of 3mm and reconstructed using a B30f, B30s or B31s convolution kernel. In total eight phases of the breathing cycle were reconstructed: 25%, 50% and 75% exhale, and 0%, 25%, 50%, 75% and 100% inhale. For the clinical-OES dataset only the 50% exhale phase was used. Patients were scanned in treatment position using arm-support and knee fix device.

PART II | Chapter 4
109
4
Image acquisition settings of the RIDER test–retest dataset were described previously [28]. These scans were acquired in breath hold with a peak-voltage of 120 kVp and a slice thickness of 1.25mm. To minimize variability between datasets, the test–retest scans were downsampled to the same dimensions as the 4DCT-scans (0.98 × 0.98 × 3 mm) using cubic interpolation.
Volume of interest segmentationBased on all available diagnostic information, gross tumour volumes (GTV) of the primary tumours in the 4D-lung, 4D-OES and clinical-OES datasets were delineated by an experienced radiation oncologist on the mid-expiration phase (50% exhale) of the 4D CT-scan (Varian Eclipse), used for radiotherapy planning purposes. A second radiation oncologist independently evaluated these delineations. The delineations were then rigidly registered to the CT images of the seven other breathing phases and manually adjusted and verified by a radiation oncologist. These delineations were used as volume of interest for further image analyses. The RIDER test–retest dataset was manually delineated using the lesion notes available online [27].
Quantitative image analysisA radiomics analysis using in-house developed software [11] was used to calculate in total 1045 features. These were divided in 19 first-order grey-level statistics features describing the tumour intensity, 19 geometric features describing the tumour shape and size, and 95 textural features describing the spatial distribution of voxel intensities. The textural features were derived from the grey-level co-occurrence (GLCM, 26 features) [33], grey-level distance-zone (GLDZM, 16 features) [34], grey-level run-length (GLRLM, 16 features) [35], grey-level size-zone (GLSZM, 16 features) [36], neighbouring grey-level dependence (NGLDM, 16 features) [37], and neighbourhood grey-tone difference (NGTDM, 5 features) [38] matrices. The textural and statistics features were also calculated after applying a three-dimensional wavelet transformation to the images, resulting in 8 decompositions and 912 additional features in total. The mathematical definitions of these features were described previously [12,39,40]
StatisticsThe pairwise concordance correlation coefficient (CCC) [41] was used to determine the agreement in feature values between the two scans in the test–retest dataset, or between all possible phase combinations in the 4DCT datasets (28 unique combinations). The CCC ranges from -1 (perfect negative agreement) to 1 (perfect positive agreement). In line with previous work [24,42], features with a minimum CCC value above 0.85 were considered to have a high repeatability and robustness.A proof-of-concept for testing clinical relevance of the features was tested in the clinical-OES dataset, using univariate cox regression. This statistical analysis was performed in R-3.3.2 (R: A Language and Environment for Statistical Computing, 2016, Vienna, Austria). To correct for multiple testing, False Discovery Rate (FDR)-adjusted p-values

PART II | Chapter 4
110
(q-values) [43] were calculated using the ‘qvalue’ package [44]. Difference between feature selection and no feature selection was tested.
RESULTS
Test-retest vs. 4D-lungIn general, the features retrieved from the unfiltered CT-images (k = 133) had a higher minimum CCC, i.e. repeatability, than the features retrieved from wavelet-filtered images (k = 912), independent of the dataset analysed or threshold used. This is visualized in Figure 2.
Using the pre-set threshold of 0.85, 74/133 (56%) unfiltered features were considered robust in the 4D-lung dataset, 80 (60%) in the test–retest dataset, and 63 (47%) in both datasets. This applied to 299/912 (33%) wavelet-filtered features in the 4D-lung, 449 (49%) in the test–retest, and 268 (29%) in both datasets, respectively. Hence, the remaining 70 (53%) unfiltered and 644 (71%) wavelet features were to some extent susceptible to breathing motion and/or acquisition settings and therefore considered unstable. Most of these unstable features could also be identified using only one of the methods to assess features’ stability: 4DCT identified 59/70 (84%) unfiltered and 613/644 (95%) wavelet features, and test–retest 53/70 (76%) unfiltered and 463/644 (72%) wavelet features, respectively. The contingency tables in Supplemental Appendix B give a clear overview of the distribution of stable and unstable features in both datasets.
The majority of the features that were stable in both the test–retest lung and 4D-lung datasets, were also stable in the 4D-OES dataset: 56 (42%) filtered and 193 (21%) wavelet features (Figure 3). However, this overlap differed per feature category as visualized in Supplementary Appendix C. The biggest overlap was observed for the shape features (68%), the smallest for the unfiltered NGTDM textural features (0%). Among the textural features, the GLDZM-based features had the highest stability in combination with the biggest overlap between the thee datasets. A list of the features that were stable in at least one of the datasets is available in Supplemental Appendix D.
Multiple CT-scans
Radiomics
CCC analysisInput datasets
Lung RIDER
Lung 4D-CT
Oesophagus 4D-CT
Figure 1. Schematic overview of the workflow in this study. Radiomics analysis was performed on the primary tumour in three independent datasets containing test–retest or 4DCT data. The consistency of 1045 radiomics features was then assessed using the concordance correlation coefficient (CCC) as a measure.
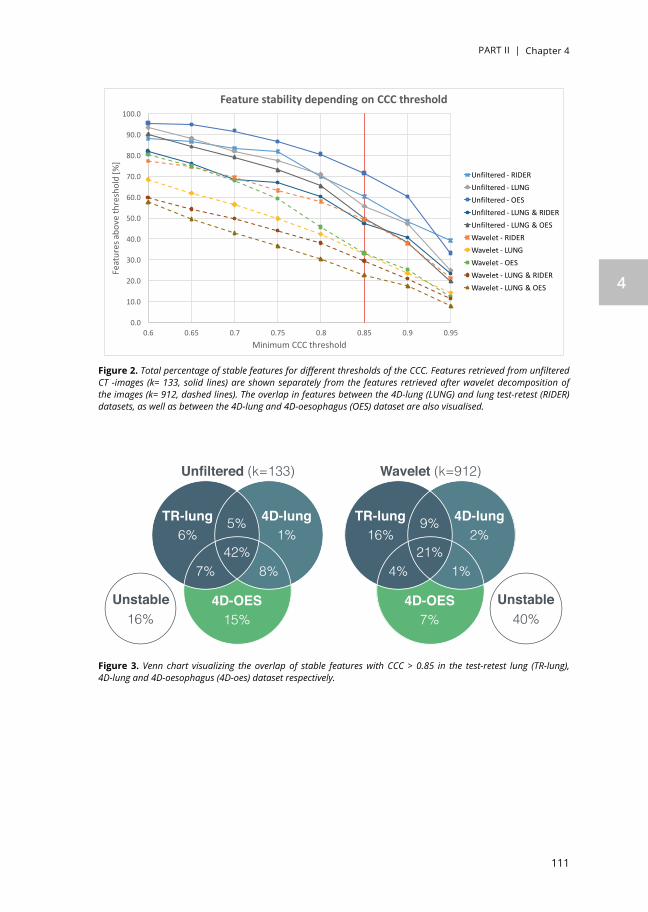
PART II | Chapter 4
111
4
Figure 2. Total percentage of stable features for different thresholds of the CCC. Features retrieved from unfiltered CT -images (k= 133, solid lines) are shown separately from the features retrieved after wavelet decomposition of the images (k= 912, dashed lines). The overlap in features between the 4D-lung (LUNG) and lung test-retest (RIDER) datasets, as well as between the 4D-lung and 4D-oesophagus (OES) dataset are also visualised.
Figure 3. Venn chart visualizing the overlap of stable features with CCC > 0.85 in the test-retest lung (TR-lung), 4D-lung and 4D-oesophagus (4D-oes) dataset respectively.
0.0
10.0
20.0
30.0
40.0
50.0
60.0
70.0
80.0
90.0
100.0
0.6 0.65 0.7 0.75 0.8 0.85 0.9 0.95
Feat
ures
abov
eth
resh
old
[%]
MinimumCCCthreshold
FeaturestabilitydependingonCCCthreshold
Unfiltered- RIDERUnfiltered- LUNGUnfiltered- OESUnfiltered- LUNG&RIDERUnfiltered- LUNG&OESWavelet- RIDERWavelet- LUNGWavelet- OESWavelet- LUNG&RIDERWavelet- LUNG&OES
Unfiltered (k=133)
TR-lung 4D-lung
15%
6% 1%
7% 8%
4D-OES
42%
5%
16%Unstable
TR-lung 4D-lung16% 2%
4% 1%21%
9%
40%Unstable
Wavelet (k=912)
7%4D-OES

PART II | Chapter 4
112
Feature selection and clinical assessment in oesophageal cancerIn oesophageal cancer 95/133 (71%) unfiltered features had a minimum observed CCC value above 0.85. These were divided in 20/26 (77%) GLCM, 11/16 (69%) GLDZM, 11/16 (69%) GLRLM, 10/16 (63%) GLSZM, 10/16 (63%) NGLDM and 3/5 (60%) NGTDM textural features. For the first-order-statistics and shape features this applied to 11/19 (58%) and 19 /19 (100%) features, respectively. This is shown in Figure 4.
Application of any of the eight wavelet filters resulted in a lower number of stable features when compared to the non-filtered images. Shape features are only dependent on the delineations and therefore not tested after wavelet filtering. Some unstable features in the non-filtered features turned out to be stable after wavelet filtering and vice versa. This resulted in 302 of the 912 wavelet features (33%) having a minimum
1Shape Major Axis LengthMax Diameter 3D
Max Diameter 2D2Max Diameter 2D3
VolumeMax Diameter 2D1
SurfaceLeast Axis LengthMinor Axis Length
Surface Volume RatioSpere Disprop
AsphericityElongationSphericity
Centroid DistanceCompactness 1Compactness 3
FlatnessCompactness 2
1Statistics EnergyTot. Energy
MaxRange
STDSkewness
VarianceEntropy
UniformityMean Dev.
KurtosisIQRMin
RMSMean Dev.
RMDP90
MedianP10
GLCM Homogeneity 2Diff. Variance
ContrastHomogeneity 1
Inverse VarianceIMC1
DissimilarityDiff. Average
Cluster ShadeDiff. Entropy
MPEnergyEntropy
VarianceCluster Prominence
IMC2Sum Entropy
Sum VarianceCluster Tendency
IDNCorrelation
IDMNAutocorrelation
Sum AverageAverage
MCGLDZM DZV
LDEIN
DZEDZN
ZPSDE
IVHILDEDZNN
INNHIELIE
LISDEHISDELILDE
GLRLM GLNRLNRLVLRERP
SRERLNN
GLVRE
GLNNLRHGEHGRE
SRHGELGRE
SRLGELRLGE
GLSZM SZVLAE
INSZN
IVZEZP
HILAEINN
LILAEHIE
HISAELIE
LISAESZNN
SAENGLDM GLN
SMLDEDNDV
DNNSDE
HGLDEGLV
GLNNDE
HGEHGSDE
LGELGSDELGLDE
NGTDM CoarsenessComplexity
StrengthContrast
Busyness
0.5 0.85 1
CCC1Shape Major Axis Length
Max Diameter 3DMax Diameter 2D2Max Diameter 2D3
VolumeMax Diameter 2D1
SurfaceLeast Axis LengthMinor Axis Length
Surface Volume RatioSpere Disprop
AsphericityElongationSphericity
Centroid DistanceCompactness 1Compactness 3
FlatnessCompactness 2
1Statistics EnergyTot. Energy
MaxRange
STDSkewness
VarianceEntropy
UniformityMean Dev.
KurtosisIQRMin
RMSMean Dev.
RMDP90
MedianP10
GLCM Homogeneity 2Diff. Variance
ContrastHomogeneity 1
Inverse VarianceIMC1
DissimilarityDiff. Average
Cluster ShadeDiff. Entropy
MPEnergyEntropy
VarianceCluster Prominence
IMC2Sum Entropy
Sum VarianceCluster Tendency
IDNCorrelation
IDMNAutocorrelation
Sum AverageAverage
MCGLDZM DZV
LDEIN
DZEDZN
ZPSDE
IVHILDEDZNN
INNHIELIE
LISDEHISDELILDE
GLRLM GLNRLNRLVLRERP
SRERLNN
GLVRE
GLNNLRHGEHGRE
SRHGELGRE
SRLGELRLGE
GLSZM SZVLAE
INSZN
IVZEZP
HILAEINN
LILAEHIE
HISAELIE
LISAESZNN
SAENGLDM GLN
SMLDEDNDV
DNNSDE
HGLDEGLV
GLNNDE
HGEHGSDE
LGELGSDELGLDE
NGTDM CoarsenessComplexity
StrengthContrast
Busyness
0.5 0.85 1
CCCMajor Axis LengthMax Diameter 3D
Max Diameter 2D2Max Diameter 2D3
VolumeMax Diameter 2D1
Compactness 1Surface
Least Axis LengthMinor Axis Length
Surface Volume RatioSpere Disprop
AsphericityElongationSphericity
Centroid DistanceCompactness 3
FlatnessCompactness 2
EnergyTot. Energy
MaxRange
STDSkewness
VarianceEntropy
UniformityMean Dev.
KurtosisIQRMin
RMSMean Dev.
RMDP90
MedianP10
Homogeneity 2Diff. Variance
ContrastHomogeneity 1
Inverse VarianceIMC1
DissimilarityDiff. Average
Cluster ShadeDiff. Entropy
MPEnergyEntropy
VarianceCluster Prominence
IMC2Sum Entropy
Sum VarianceCluster Tendency
IDNCorrelation
IDMNAutocorrelation
Sum AverageAverage
MCDZVLDE
INDZEDZN
ZPSDE
IVHILDEDZNN
INNHIELIE
LISDEHISDELILDE
GLNRLNRLVLRERP
SRERLNN
GLVRE
GLNNLRHGEHGRE
SRHGELGRE
SRLGELRLGE
SZVLAE
INSZN
IVZEZP
HILAEINN
LILAEHIE
HISAELIE
LISAESZNN
SAEGLN
SMLDEDNDV
DNNSDE
HGLDEGLV
GLNNDE
HGEHGSDE
LGELGSDELGLDE
CoarsenessComplexity
StrengthContrast
Busyness
0.5 0.85 1
CCC1Shape Major Axis Length
Max Diameter 3DMax Diameter 2D2Max Diameter 2D3
VolumeMax Diameter 2D1
SurfaceLeast Axis LengthMinor Axis Length
Surface Volume RatioSpere Disprop
AsphericityElongationSphericity
Centroid DistanceCompactness 1Compactness 3
FlatnessCompactness 2
1Statistics EnergyTot. Energy
MaxRange
STDSkewness
VarianceEntropy
UniformityMean Dev.
KurtosisIQRMin
RMSMean Dev.
RMDP90
MedianP10
GLCM Homogeneity 2Diff. Variance
ContrastHomogeneity 1
Inverse VarianceIMC1
DissimilarityDiff. Average
Cluster ShadeDiff. Entropy
MPEnergyEntropy
VarianceCluster Prominence
IMC2Sum Entropy
Sum VarianceCluster Tendency
IDNCorrelation
IDMNAutocorrelation
Sum AverageAverage
MCGLDZM DZV
LDEIN
DZEDZN
ZPSDE
IVHILDEDZNN
INNHIELIE
LISDEHISDELILDE
GLRLM GLNRLNRLVLRERP
SRERLNN
GLVRE
GLNNLRHGEHGRE
SRHGELGRE
SRLGELRLGE
GLSZM SZVLAE
INSZN
IVZEZP
HILAEINN
LILAEHIE
HISAELIE
LISAESZNN
SAENGLDM GLN
SMLDEDNDV
DNNSDE
HGLDEGLV
GLNNDE
HGEHGSDE
LGELGSDELGLDE
NGTDM CoarsenessComplexity
StrengthContrast
Busyness
0.5 0.85 1
CCCNon-filtered
Wavelet LHH Wavelet LLL1Shape Major Axis Length
Max Diameter 3DMax Diameter 2D2Max Diameter 2D3
VolumeMax Diameter 2D1
SurfaceLeast Axis LengthMinor Axis Length
Surface Volume RatioSpere Disprop
AsphericityElongationSphericity
Centroid DistanceCompactness 1Compactness 3
FlatnessCompactness 2
1Statistics EnergyTot. Energy
MaxRange
STDSkewness
VarianceEntropy
UniformityMean Dev.
KurtosisIQRMin
RMSMean Dev.
RMDP90
MedianP10
GLCM Homogeneity 2Diff. Variance
ContrastHomogeneity 1
Inverse VarianceIMC1
DissimilarityDiff. Average
Cluster ShadeDiff. Entropy
MPEnergyEntropy
VarianceCluster Prominence
IMC2Sum Entropy
Sum VarianceCluster Tendency
IDNCorrelation
IDMNAutocorrelation
Sum AverageAverage
MCGLDZM DZV
LDEIN
DZEDZN
ZPSDE
IVHILDEDZNN
INNHIELIE
LISDEHISDELILDE
GLRLM GLNRLNRLVLRERP
SRERLNN
GLVRE
GLNNLRHGEHGRE
SRHGELGRE
SRLGELRLGE
GLSZM SZVLAE
INSZN
IVZEZP
HILAEINN
LILAEHIE
HISAELIE
LISAESZNN
SAENGLDM GLN
SMLDEDNDV
DNNSDE
HGLDEGLV
GLNNDE
HGEHGSDE
LGELGSDELGLDE
NGTDM CoarsenessComplexity
StrengthContrast
Busyness
0.5 0.85 1
CCC1Shape Major Axis Length
Max Diameter 3DMax Diameter 2D2Max Diameter 2D3
VolumeMax Diameter 2D1
SurfaceLeast Axis LengthMinor Axis Length
Surface Volume RatioSpere Disprop
AsphericityElongationSphericity
Centroid DistanceCompactness 1Compactness 3
FlatnessCompactness 2
1Statistics EnergyTot. Energy
MaxRange
STDSkewness
VarianceEntropy
UniformityMean Dev.
KurtosisIQRMin
RMSMean Dev.
RMDP90
MedianP10
GLCM Homogeneity 2Diff. Variance
ContrastHomogeneity 1
Inverse VarianceIMC1
DissimilarityDiff. Average
Cluster ShadeDiff. Entropy
MPEnergyEntropy
VarianceCluster Prominence
IMC2Sum Entropy
Sum VarianceCluster Tendency
IDNCorrelation
IDMNAutocorrelation
Sum AverageAverage
MCGLDZM DZV
LDEIN
DZEDZN
ZPSDE
IVHILDEDZNN
INNHIELIE
LISDEHISDELILDE
GLRLM GLNRLNRLVLRERP
SRERLNN
GLVRE
GLNNLRHGEHGRE
SRHGELGRE
SRLGELRLGE
GLSZM SZVLAE
INSZN
IVZEZP
HILAEINN
LILAEHIE
HISAELIE
LISAESZNN
SAENGLDM GLN
SMLDEDNDV
DNNSDE
HGLDEGLV
GLNNDE
HGEHGSDE
LGELGSDELGLDE
NGTDM CoarsenessComplexity
StrengthContrast
Busyness
0.5 0.85 1
CCC
GLCM
GLDZM
GLRLM
GLSZM
NGLDM
NGTDM
Statistics
Shape
10
20
30
40
50
60
70
80
90
100
110
120
130
20
30
40
50
60
70
80
90
100
110
120
130
20
30
40
50
60
70
80
90
100
110
120
130
20
30
40
50
60
70
80
90
100
110
120
130
Figure 4. In the left panel a graphical representation of the pairwise CCCs for all phases of the 4D-OES data without wavelet filtering. The horizontal lines extend from the minimum to the maximum observed values per feature in the 4DCT-scan, and dots representing the median are red when the minimum CCC > 0.85. The two remaining panels show the extreme results after wavelet filtering: LHH with 29 stable features and LLL with 63 stable features, respectively. Abbreviations for the textural feature groups: greylevel co-occurrence (GLCM), grey-level distance-zone (GLDZM), grey-level run-length (GLRLM), grey-level size-zone (GLSZM), neighbouring grey-level dependence (NGLDM,and neighbourhood grey-tone difference (NGTDM). Individual feature names can be found in Supplemental Appendix E.

PART II | Chapter 4
113
4
CCC of 0.85. Results for the individual wavelet filters are given in Supplemental Appendix F. Combining the unfiltered and wavelet features, in total 397/1045 (38%) radiomics features were shown to be robust in oesophageal cancer. The total number of features per category is summarized in Table 1 for all three datasets.
Univariate cox regression was then performed on the clinical-OES dataset. Without correction for multiple testing, 262 of the 1045 (25%) features were univariately significantly (p ≤ 0.05) associated with overall survival. Of these 262 features, 113 (43%) were also identified as stable. There was no significant correlation between feature stability and prognostic value measured by the concordance-index (c-index). To correct for multiple testing the q-value was considered. A q-value of 0.05 implies that 5% of all significant features (with p ≤ 0.05) will be tested as false positive. Without selection for
Table 1. Total number of features per category with a minimum CCC > 0.85 before and after wavelet filtering in all three datasets. Shape features are not calculated after wavelet filtering.
Dataset Category Un-filtered
Wavelet filtered Total
HHH HHL HLH HLL LHH LHL LLH LLL
RIDER Shape (19) 15 - - - - - - - - 15
GLCM (26) 11 4 11 5 10 8 10 6 12 77
GLDZM (16) 11 8 8 11 7 10 7 9 11 82
GLRLM (16) 8 7 8 8 8 6 8 10 12 75
GLSZM (16) 10 8 8 5 7 8 7 6 9 68
NGLDM (16) 11 7 9 9 11 7 9 10 12 85
NGTDM (5) 2 3 2 3 2 2 1 3 3 21
Statistics (19) 12 11 13 11 12 10 15 12 10 106
4D-lung Shape (19) 13 - - - - - - - - 13
GLCM (26) 15 3 4 2 7 3 9 3 11 57
GLDZM (16) 8 8 7 7 8 8 9 7 9 71
GLRLM (16) 9 2 3 2 6 2 7 5 9 45
GLSZM (16) 5 2 4 2 7 2 4 2 7 35
NGLDM (16) 10 3 5 3 9 3 7 6 10 56
NGTDM (5) 2 2 4 2 3 3 3 2 2 23
Statistics (19) 12 2 11 8 4 2 13 9 12 73
4D-OES Shape (19) 19 - - - - - - - - 19
GLCM (26) 20 4 4 5 9 3 7 6 15 73
GLDZM (16) 11 9 9 9 8 8 7 8 10 79
GLRLM (16) 11 2 2 2 6 2 2 2 10 39
GLSZM (16) 10 2 2 2 4 2 1 2 8 33
NGLDM (16) 10 3 3 2 6 2 3 3 9 41
NGTDM (5) 3 1 2 3 2 2 2 1 3 19
Statistics (19) 11 10 9 14 10 10 12 10 8 94

PART II | Chapter 4
114
feature stability, only 2 (unstable) features of the total feature space (k = 1045) also had a q ≤ 0.05. When only focussing on the 397 stable features, in total 108 features had a q-value below 0.05 and thus more features were associated with overall survival if a selection of stable features was used.
DISCUSSION
Radiomics feature selection based on test–retest scans is a commonly used method to reduce the total number of features and consequently the risk of overfitting. For oesophageal cancer such test–retest (CT) scans are not available, so we investigated if 4DCT-scans can be used as alternative to eliminate unstable features. Subsequently we investigated the correlation between feature stability and clinical prognostic value in oesophageal cancer patients.
The total number of stable features in the 4D-lung and test–retest dataset was 373 and 529, respectively. It was shown that 63 (47%) nonfiltered and 268 (29%) wavelet-filtered features had a CCC >0.85 in both the 4DCT-lung and test–retest dataset, including the four features selected previously to be prognostic in lung and head-and-neck cancer [12]. During the test–retest scans patients were repositioned and repeated their breath hold which simulates differences in daily set-up (inter-fractional motion). During the 4D-lung acquisition patients remain positioned and the intra-fractional motion caused by breathing is captured. These 4D-scans are acquired with a minimal time difference, so there is less uncertainty from repositioning and anatomical changes, but more motion blurring and uncertainty induced by the breathing cycle. Since these methods capture different sources of variability in the CT-scans, ideally a combination of both should be used to identify and remove the unstable features prior to model building. However, using only 4DCT already identified 95% of the unfiltered and 85% of the wavelet features that were unstable, while test–retest identified 76% of the unfiltered and 72% of the wavelet features, respectively. So without reconciling the fundamental differences between 4DCT and test–retest, either of the methods is useful for radiomics feature selection.
As mentioned earlier, many factors such as respiratory motion [18–20], scanner settings [21], and segmentation method [22] can influence radiomics feature stability. In that sense differences in overlap between 4DCT and test–retest might have more causes than only the conceptual difference between the methods. For instance, the scans in this study were delineated manually. Due to the inter-observer variability [45], feature instability might also be comprised by the delineation method rather than differences in CT-scans alone [22,46]. However, in clinical practice features having a large dependence on the delineation method (i.e. large inter-observer variability) should be eliminated as well. Furthermore, the CT-scans in the test–retest dataset were acquired in breath hold with a slice thickness of 1.25mm, whereas the scan in the 4D-lung dataset were respiratory-gated and had a slice thickness of 3mm. Differences

PART II | Chapter 4
115
4
in noise-levels due to 4D vs. 3D reconstructions, as well as different acquisition settings (Supplemental Appendix A) might have affected feature values. This difference is inherent to the retrospective design of this study. However, to minimize the variability induced by different voxel dimensions [47], the test–retest scans were downsampled to a slice thickness of 3.0 mm and 0.98 × 0.98 mm pixel spacing using cubic interpolation. Without downsampling 505 features instead of 529 had an CCC > 0.85, and as a consequence the overlap with the other datasets was slightly different.
In oesophageal cancer 397 of the 1045 CT radiomics features were identified as robust, based on their stability over eight phases of the breathing cycle in 4DCT-scans. The stable features consisted of 19 shape, 11 statistics, 65 textural, and 302 wavelet features. In total 66/95 (69%) unfiltered and 206/302 (68%) of the wavelet-filtered features that were stable in oesophageal cancer, were also stable in the 4D-lung dataset. Because the image acquisition settings and hardware were the same in the 4D-lung and 4D-OES scans, the overlap of 69% (272/397) suggests that stable features might be tumour site specific. This underlines the need for solid feature selection methods, even if the commonly used test–retest scans are not available for a specific tumour site.
Of all stable radiomics features listed in Supplemental Appendix D, 331 were stable in both the test–retest and 4D-lung dataset. These robust features can be safely used in further radiomics studies for lung cancers. In addition, the 249 features that were also stable in the 4D-oesophagus dataset might be useful across tumour sites. However, their stability was not assessed in oesophageal cancer using a test–retest dataset, so susceptibility to inter-fractional motion cannot be excluded. Without detailed feature stability assessment using 4DCT and/or test–retest datasets, generalizability to tumour sites other than lung or oesophagus cannot be verified.
Univariate analysis in the clinical-OES dataset revealed two important findings. First, there was no clear correlation between feature stability and prognostic value, i.e. also unstable features could have a (significantly) high c-index. Second, using a FDR of 5% to correct for multiple testing, more features remained significantly correlated with overall survival after feature selection (108/397) than without selection (2/1045). Also with a random sample of 397 unstable features, only 2–3 features were significantly correlated with outcome. This suggests that feature selection can be a useful tool to purify the feature space prior to statistical analysis, and consequently prevent from taking unstable features into consideration.
The univariate analysis performed in this study only demonstrates the potential prognostic value of individual features. To further develop prognostic models, multivariate analysis complemented with clinical variables is warranted. However, the development of prognostic models of outcome requires external validation in large, independent datasets, preferably acquired and analysed in a standardized manner [40,48]. Hence, this did not fit in the scope of the current study.
The delineations were manually adjusted for each phase of the 4DCT-scans, using the delineations on the 50% exhale scan (used for radiotherapy) as a guideline. These

PART II | Chapter 4
116
adjustments were a combination of rigid movement and manual adaptation. In both the lung and oesophageal datasets slight movement of the tumours was visible. However, the contrast between tumour and normal tissue is generally better visible in lungs than in the oesophagus. Therefore, minimal changes in shape and position induced by the breathing cycle were adjusted more accurately in the lung tumours, whereas the oesophageal tumour delineations relied more on rigid movement. This is also noticeable in the stability of the shape features; 100% of the features had an CCC > 0.85 for the 4DCT-OES dataset, compared to 79% and 68% of the shape features in the lung datasets. To assess the repeatability of shape features, a multiple observer delineation study would be more suitable.
A CCC threshold of 0.85 is used previously in comparable studies [24,42] to identify robust radiomics features, but this value is arbitrary. As shown in Figure 2 another threshold would result in another set of robust features. However, as discussed above a high reproducibility does not necessarily mean that a feature also has good prognostic value or clinical relevance.
CONCLUSION
In this study we found a high but not perfect agreement between radiomics feature stability based in 4DCT and test–retest data in lung cancer. Ideally feature selection should be performed based on both 4D and test–retest datasets, but most of the unstable features can already be eliminated using only a test–retest or 4DCT dataset. For oesophageal cancer a subset of 397 stable CT radiomics features was identified by analysing 4DCT-scans of 20 patients. These partially overlapped with the features in NSCLC, but 125 (31%) features were tumour-site specific. There was no significant correlation between feature stability and prognostic value in an explorative univariate cox regression. Feature selection is useful to purify the feature space prior to statistical analysis.
Disclosures of potential conflicts of interestRalph Leijenaar is a salaried employee of ptTheragnostic B.V., a company developing biomarkers and software to individualize radiotherapy treatment. Ralph Leijenaar and Philippe Lambin are co-inventors of several Radiomics patents.
AcknowledgementsAuthors acknowledge financial support from ERC advanced grant (ERC-ADG-2015, n° 694812 - Hypoximmuno) and the QuIC-ConCePT project, which is partly funded by EFPI A companies and the Innovative Medicine Initiative Joint Undertaking (IMI JU) under Grant Agreement No. 115151. This research is also supported by the Dutch technology Foundation STW (grant n° P14-19 Radiomics STRaTegy), which is the applied science division of NWO, and the Technology Programme of the Ministry of Economic Affairs.

PART II | Chapter 4
117
4
Authors also acknowledge financial support from the SME Phase 2 (EU proposal 673780 – RAIL), EUROSTARS (DART), the European Program H2020-2015-17 (BD2Decide - PHC30-689715 and ImmunoSABR - n° 733008), Kankeronderzoekfonds Limburg from the Health Foundation Limburg, the Zuyderland-MAASTRO grant and the Dutch Cancer Society.

PART II | Chapter 4
118
REFERENCES
[1]. Wu D., Wang D.C., Cheng Y., Qian M., Zhang M., Shen Q., et al: Roles of tumor heterogeneity in the development of drug resistance: a call for precision therapy. Semin Cancer Biol 2017; 42: pp. 13-19
[2]. Lambin P., Roelofs E., Reymen B., Velazquez E.R., Buijsen J., Zegers C.M.L., et al: “Rapid Learning health care in oncology” – an approach towards decision support systems enabling customised radiotherapy. Radiother Oncol 2013; 109: pp. 159-164
[3]. Lambin P., Zindler J., Vanneste B., Van De Voorde L., Jacobs M., Eekers D., et al: Modern clinical research : How rapid learning health care and cohort multiple randomised clinical trials complement traditional evidence based medicine. Acta Oncol 2015; 54: pp. 1289-1300
[4]. Lambin P., Petit S.F., Aerts H.J.W.L., Van Elmpt WJC, Oberije C.J.G., Starmans M.H.W., et al: The ESTRO Breur Lecture 2009. From population to voxel-based radiotherapy: Exploiting intra-tumour and intra-organ heterogeneity for advanced treatment of non-small cell lung cancer. Radiother Oncol 2009; 2010: pp. 145-152
[5]. Huang Z., Ma L., Huang C., Li Q., and Nice E.C.: Proteomic profiling of human plasma for cancer biomarker discovery. Proteomics 2016; 17: pp. 160040
[6]. O’Connor J.P.B., Aboagye E.O., Adams J.E., Aerts H.J.W.L., Barrington Sally F., Beer A.J., et al: Imaging biomarker roadmap for cancer studies. Nat Rev Clin Oncol 2017; 14: pp. 169-186
[7]. Lambin P., van Stiphout R.G.P.M., Starmans M.H.W., Rios-Velazquez E., Nalbantov G., Aerts H.J.W.L., et al: Predicting outcomes in radiation oncology – multifactorial decision support systems. Nat Rev Clin Oncol 2013; 10: pp. 27-40
[8]. Lambin P., Zindler J., Vanneste B.G.L., Van De Voorde L., Eekers D., Compter I., et al: Decision support systems for personalized and participative radiation oncology. Adv Drug Deliv Rev 2017; 109: pp. 131-153
[9]. Cheng Q., Roelofs E., Ramaekers B.L.T., Eekers D., van Soest J., Lustberg T., et al: Development and evaluation of an online three-level proton vs photon decision support prototype for head and neck cancer – comparison of dose, toxicity and cost-effectiveness. Radiother Oncol 2016; 118: pp. 281-285
[10]. Eisenhauer E.A., Therasse P., Bogaerts J., Schwartz L.H., Sargent D., Ford R., et al: New response evaluation criteria in solid tumours: revised RECIST guideline (version 1.1). Eur J Cancer 2009; 45: pp. 228-247
[11]. Lambin P., Rios-Velazquez E., Leijenaar R., Carvalho S., van Stiphout R.G.P.M., Granton P., et al: Radiomics: extracting more information from medical images using advanced feature analysis. Eur J Cancer 2012; 48: pp. 441-446
[12]. Aerts H.J.W.L., Velazquez E.R., Leijenaar R.T.H., Parmar C., Grossmann P., Cavalho S., et al: Decoding tumour phenotype by noninvasive imaging using a quantitative radiomics approach. Nat Commun 2014; 5: pp. 4006
[13]. Ganeshan B., Skogen K., Pressney I., Coutroubis D., and Miles K.: Tumour heterogeneity in oesophageal cancer assessed by CT texture analysis: preliminary evidence of an association with tumour metabolism, stage, and survival. Clin Radiol 2012; 67: pp. 157-164.
[14]. Yip C., Landau D., Kozarski R., Ganeshan B., Thomas R., Michaelidou A., et al: Primary esophageal cancer: heterogeneity as potential prognostic biomarker in patients treated with definitive chemotherapy and radiation therapy. Radiology 2014; 270: pp. 141-148.
[15]. Yip C., Davnall F., Kozarski R., Landau D.B., Cook G.J.R., Ross P., et al: Assessment of changes in tumor heterogeneity following neoadjuvant chemotherapy in primary esophageal cancer. Dis Esophagus 2015; 28: pp. 172-179

PART II | Chapter 4
119
4
[16]. Tixier F., Le Rest C.C., Hatt M., Albarghach N., Pradier O., Metges J.-P., et al: Intratumor heterogeneity characterized by textural features on baseline 18F-FDG PET images predicts response to concomitant radiochemotherapy in esophageal cancer. J Nucl Med 2011; 52: pp. 369-378
[17]. Tixier F., Hatt M., Cheze Le Rest C., Le Pogam A., Corcos L., and Visvikis D.: Reproducibility of tumor uptake heterogeneity characterization through textural feature analysis in 18F-FDG PET. J Nucl Med 2012; 53: pp. 693-700
[18]. Oliver J.A., Budzevich M., Zhang G.G., Dilling T.J., Latifi K., and Moros E.G.: Variability of image features computed from conventional and respiratory-gated PET/CT images of lung cancer. Transl Oncol 2015; 8: pp. 524-534
[19]. Grootjans W., Tixier F., van der Vos C.S., Vriens D., Le Rest C.C., Bussink J., et al: The impact of optimal respiratory gating and image noise on evaluation of intra-tumor heterogeneity in 18F-FDG positron emission tomography imaging of lung cancer. J Nucl Med 2016; 57: pp. 1692-1698
[20]. Yip S., McCall K., Aristophanous M., Chen A.B., Aerts H.J., and Berbeco R.: Comparison of texture features derived from static and respiratory-gated pet images in non-small cell lung cancer. PLoS One 2014; 9: pp. e115510
[21]. Mackin D., Fave X., Zhang L., Fried D., Yang J., Taylor B., et al: Measuring computed tomography scanner variability of radiomics features. Invest Radiol 2015; 50: pp. 757-765
[22]. van Velden F.H.P., Kramer G.M., Frings V., Nissen I.A., Mulder E.R., de Langen A.J., et al: Repeatability of radiomic features in non-small-cell lung cancer [18F]FDG-PET/CT studies: impact of reconstruction and delineation. Mol Imaging Biol 2016; 18: pp. 788-795
[23]. Collins G.S., Reitsma J.B., Altman D.G., and Moons K.G.M.: Transparent reporting of a multivariable prediction model for individual prognosis or diagnosis (TRIPOD): the TRIPOD statement. Ann Intern Med 2015; 162: pp. 55-63
[24]. Zhao B., Tan Y., Tsai W.-Y., Qi J., Xie C., Lu L., et al: Reproducibility of radiomics for deciphering tumor phenotype with imaging. Sci Rep 2016; 6: pp. 23428
[25]. Leijenaar R.T.H., Carvalho S., Velazquez E.R., van Elmpt W.J.C., Parmar C., Hoekstra O.S., et al: Stability of FDG-PET Radiomics features: an integrated analysis of test-retest and inter-observer variability. Acta Oncol (Madr) 2013; 52: pp. 1391-1397
[26]. Balagurunathan Y., Kumar V., Gu Y., Kim J., Wang H., Liu Y., et al: Test-retest reproducibility analysis of lung CT image features. J Digit Imaging 2014; 27: pp. 805-823
[27]. Zhao B, Schwartz LH, Kris MG. Data from RIDER_Lung CT. The Cancer Imaging Archive 2015.
[28]. Zhao B., James L.P., Moskowitz C.S., Guo P., Ginsberg M.S., Lefkowitz R.A., et al: Evaluating variability in tumor measurements from same-day repeat CT scans of patients with non-small cell lung cancer. Radiology 2009; 252: pp. 263-272
[29]. Clark K., Vendt B., Smith K., Freymann J., Kirby J., Koppel P., et al: The cancer imaging archive (TCIA): maintaining and operating a public information repository. J Digit Imaging 2013; 26: pp. 1045-1057
[30]. Shapiro J., van Lanschot J.J.B., Hulshof M.C.C.M., van Hagen P., van Berge Henegouwen M.I., Wijnhoven B.P.L., et al: Neoadjuvant chemoradiotherapy plus surgery versus surgery alone for oesophageal or junctional cancer (CROSS): long-term results of a randomised controlled trial. Lancet Oncol 2015; 16: pp. 1090-1098
[31]. van Hagen P., Hulshof M.C.C.M., van Lanschot J.J.B., Steyerberg E.W., van Berge Henegouwen M.I., Wijnhoven B.P.L., et al: Preoperative chemoradiotherapy for esophageal or junctional cancer. N Engl J Med 2012; 366: pp. 2074-2084
[32]. Larue R.T.H.M., Van De Voorde L., van Timmeren J.E., Leijenaar R.T.H., Berbée M., Sosef M.N., et al: Data

PART II | Chapter 4
120
from: 4DCT imaging to assess radiomics feature stability: an investigation for thoracic cancers. Cancer Data 2017; undefined:
[33]. Haralick R., Shanmugan K., Meyer F., and Dinstein I.: Textural features for image classification. IEEE Trans Syst Man Cybern 1973; SMC-3: pp. 610-621
[34]. Thibault G., Angulo J., and Meyer F.: Advanced statistical matrices for texture characterization: Application to cell classification. IEEE Trans Biomed Eng 2014; 61: pp. 630-637
[35]. Galloway M.M.: Texture analysis using gray level run lengths. Comput Graph Image Process 1975; 4: pp. 172-179
[36]. Thibault G., Fertil B., Navarro C., Pereira S., Cau P., Levy N., et al: Texture indexes and gray level size zone matrix application to cell nuclei classification. Pattern Recognit Inf Process 2009; undefined: pp. 140-145
[37]. Sun C., and Wee W.G.: Neighboring grey level dependence matrix for texture classification. Comput Graph Image Process 1983; 23: pp. 341-352
[38]. Amadasun M., and King R.: Textural features corresponding to textural properties. IEEE Trans Syst Man Cybern 1989; 19: pp. 1264-1274
[39]. Leijenaar R.T.H., Carvalho S., Hoebers F.J.P., Aerts H.J.W.L., Van Elmpt WJC, Huang S.H., et al: External validation of a prognostic CT-based radiomic signature in oropharyngeal squamous cell carcinoma. Acta Oncol (Madr) 2015; 54: pp. 1423-1429
[40]. Lambin P, Leijenaar RTH, Deist TM, Peerlings J, Soest J van, Jong E de, et al. Radiomics: the bridge between medical imaging and personalized medicine. Nat Rev Clin Oncol n.d.;In press.
[41]. Lin L.I.: A concordance correlation coefficient to evaluate reproducibility. Biometrics 1989; 45: pp. 255-268
[42]. van Timmeren J.E., Leijenaar R.T.H., van Elmpt W., Wang J., Zhang Z., Dekker A., et al: Test-retest data for radiomics feature stability analysis: generalizable or study specific? Tomography 2016; 2: pp. 361-365
[43]. Storey J.D.: A direct approach to false discovery rates. J 2002; 64: pp. 479-498
[44]. Storey JD, Bass AJ, Dabney A, Robinson D. qvalue: Q-value estimation for false discovery rate control. R Packag Version 2_6_0 2015. http://github.com/jdstorey/qvalue.
[45]. Eminowicz G., and McCormack M.: Variability of clinical target volume delineation for definitive radiotherapy in cervix cancer. Radiother Oncol 2015; 117: pp. 542-547
[46]. Parmar C., Rios Velazquez E., Leijenaar R., Jermoumi M., Carvalho S., Mak R.H., et al: Robust radiomics feature quantification using semiautomatic volumetric segmentation. PLoS One 2014; 9: pp. e102107
[47]. Shafiq-ul-Hassan M., Zhang G.G., Latifi K., Ullah G., Hunt D.C., Balagurunathan Y., et al: Intrinsic dependencies of CT radiomic features on voxel size and number of gray levels. Med Phys 2017; 44: pp. 1050-1062
[48]. Larue R.T.H.M., Defraene G., De Ruysscher D., Lambin P., and van Elmpt W.: Quantitative radiomics studies for tissue characterization: a review of technology and methodological procedures. Br J Radiol 2017; 90: pp. 20160665

121

PART II | Chapter 4
122
SUPPLEMENTAL APPENDIX A
Scan parameters for all datasets
TR-lung (n = 26)
4DCT-lung (n = 20)
4DCT-OES(n =20)
Clinical-OES(n = 120)
Manufacturer GE Healthcare Siemens Siemens Siemens
Acquisition type Helical Helical Helical Helical
Tube voltage 120 kVp 120 kVp 120 kVp 120 kVp
Tube current 165-549 mA 55-240 mA 48-156 mA 42-300 mA
Convolution kernel Lung B30f, B30s B30f B30f, B30s, B31s
Reconstruction diameter 260-445 mm 500 mm 500 mm 500 mm
Slice thickness 1.25 mm 3 mm 3 mm 3 mm
Pixel spacing 0.51-0.91 mm 0.98 mm 0.98 mm 0.98 mm
Pixels 512 x 512 512 x 512 512 x 512 512 x 512
SUPPLEMENTAL APPENDIX B
Test-retest vs. 4D-lung contingency tables
Unfiltered features
4D-lung
Stable Unstable Total
Test - retest
Stable 63 17 80
Unstable 11 42 53
Total 74 59 133
Wavelet features
4D-lung
Stable Unstable Total
Test - retest
Stable 268 181 449
Unstable 31 432 463
Total 299 613 912

PART II | Chapter 4
123
4
SUPPLEMENTAL APPENDIX C
Venn charts per feature categoryVenn charts per feature category, visualizing the overlap of stable features with CCC>0.85 in the test-retest lung (TR-lung), 4D-lung and 4D-OES dataset, respectively.
Unfiltered (k=133)
TR-lung 4D-lung
15%
6% 1%
7% 8%
4D-OES
42%
5%
16%Unstable
TR-lung 4D-lung16% 2%
4% 1%21%
9%
40%Unstable
Wavelet (k=912)
7%4D-OES
Combined
Unfiltered (k=26)
TR-lung 4D-lung
15%
0% 4%
8% 19%
4D-OES
35%
0%
19%Unstable
TR-lung 4D-lung13% 2%
2% 2%11%
5%
55%Unstable
Wavelet (k=208)
10%4D-OES
GLCM
Unfiltered (k=16)
TR-lung 4D-lung
13%
13% 0%
6% 0%
4D-OES
50%
0%
18%Unstable
TR-lung 4D-lung8% 3%
2% 1%43%
2%
34%Unstable
Wavelet (k=128)
7%4D-OES
GLDZM

PART II | Chapter 4
124
Unfiltered (k=16)
TR-lung 4D-lung
13%
0% 0%
0% 6%
4D-OES
50%
0%
31%Unstable
TR-lung 4D-lung25% 1%
0% 0%16%
11%
42%Unstable
Wavelet (k=128)
5%4D-OES
GLRLM
Unfiltered (k=16)
TR-lung 4D-lung
13%
13% 0%
19% 0%
4D-OES
31%
0%
24%Unstable
TR-lung 4D-lung23% 1%
0% 0%15%
8%
50%Unstable
Wavelet (k=128)
3%4D-OES
GLSZM
Unfiltered (k=16)
TR-lung 4D-lung
6%
6% 0%
0% 0%
4D-OES
56%
6%
26%Unstable
TR-lung 4D-lung23% 1%
0% 0%22%
13%
39%Unstable
Wavelet (k=128)
2%4D-OES
NGLDMUnfiltered (k=16)
TR-lung 4D-lung
6%
6% 0%
0% 0%
4D-OES
56%
6%
26%Unstable
TR-lung 4D-lung23% 1%
0% 0%22%
13%
39%Unstable
Wavelet (k=128)
2%4D-OES
NGLDM

PART II | Chapter 4
125
4
Unfiltered (k=5)
TR-lung 4D-lung
40%
20% 0%
0% 20%
4D-OES
0%
20%
0%Unstable
TR-lung 4D-lung20% 13%
0% 13%13%
15%
11%Unstable
Wavelet (k=40)
15%4D-OES
NGTDM
Unfiltered (k=19)
TR-lung 4D-lung
16%
11% 0%
5% 16%
4D-OES
21%
26%
5%Unstable
TR-lung 4D-lung8% 1%
16% 1%28%
10%
27%Unstable
Wavelet (k=152)
9%4D-OES
Statistics
Unfiltered (k=19)
TR-lung 4D-lung
21%
0% 0%
11% 0%
4D-OES
68%
0%
0%Unstable
RIDER 4D-lungN/A N/A
N/A N/AN/A
N/A
N/AUnstable
Wavelet (k=0)
N/A4D-OES
Shape

PART II | Chapter 4
126
SUPPLEMENTAL APPENDIX D
Features with CCC > 0.85 per datasetCorresponding definitions are described previously.1[1]
Feature name TR-lung 4D-lung Lung(4D&TR)
4D-OES OES & lung(4D&TR)
1. GLCM_clusProm NO YES NO YES NO
2. GLCM_clusShade NO YES NO YES NO
3. GLCM_clusTend NO NO NO YES NO
4. GLCM_contrast YES NO NO YES NO
5. GLCM_diffAvrg YES YES YES YES YES
6. GLCM_diffEntro NO YES NO YES NO
7. GLCM_diffVar YES NO NO YES NO
8. GLCM_dissimilar YES YES YES YES YES
9. GLCM_energy NO YES NO YES NO
10. GLCM_entrop2 YES YES YES YES YES
11. GLCM_homogeneity1 YES YES YES YES YES
12. GLCM_homogeneity2 YES YES YES YES YES
13. GLCM_infoCorr1 YES YES YES YES YES
14. GLCM_infoCorr2 YES YES YES YES YES
15. GLCM_invDiffmomnor NO YES NO NO NO
16. GLCM_invDiffnorm YES YES YES YES YES
17. GLCM_inverseVar YES YES YES YES YES
18. GLCM_maxProb NO NO NO YES NO
19. GLCM_sumEntro NO YES NO YES NO
20. GLCM_sumSquares NO NO NO YES NO
21. GLCM_sumVar NO NO NO YES NO
22. GLDZM_DZE YES YES YES YES YES
23. GLDZM_DZN YES YES YES YES YES
24. GLDZM_DZNN YES YES YES YES YES
25. GLDZM_DZV YES YES YES YES YES
26. GLDZM_HILDE YES NO NO YES NO
27. GLDZM_IN YES YES YES YES YES
28. GLDZM_INN NO NO NO YES NO
29. GLDZM_IV NO NO NO YES NO
30. GLDZM_LDE YES YES YES YES YES
31. GLDZM_LIE YES NO NO NO NO
[1] Lambin P, Leijenaar RTH, Deist TM, Peerlings J, Soest J van, Jong E de, et al. Radiomics: the bridge between medical imaging and personalized medicine. Nat Rev Clin Oncol n.d.;Submitted.

PART II | Chapter 4
127
4
32. GLDZM_LISDE YES NO NO NO NO
33. GLDZM_SDE YES YES YES YES YES
34. GLDZM_ZP YES YES YES YES YES
35. GLRLM_GLN YES YES YES YES YES
36. GLRLM_GLNN YES YES YES YES YES
37. GLRLM_GLV NO NO NO YES NO
38. GLRLM_LRE YES YES YES YES YES
39. GLRLM_LRHGE NO NO NO YES NO
40. GLRLM_RE NO YES NO YES NO
41. GLRLM_RLN YES YES YES YES YES
42. GLRLM_RLNN YES YES YES YES YES
43. GLRLM_RLV YES YES YES YES YES
44. GLRLM_RP YES YES YES YES YES
45. GLRLM_SRE YES YES YES YES YES
46. GLSZM_HILAE YES NO NO YES NO
47. GLSZM_IN YES YES YES YES YES
48. GLSZM_INN NO NO NO YES NO
49. GLSZM_IV NO NO NO YES NO
50. GLSZM_LAE YES YES YES YES YES
51. GLSZM_LIE YES NO NO NO NO
52. GLSZM_LILAE YES NO NO YES NO
53. GLSZM_LISAE YES NO NO NO NO
54. GLSZM_SZN YES YES YES YES YES
55. GLSZM_SZV YES YES YES YES YES
56. GLSZM_ZE YES NO NO YES NO
57. GLSZM_ZP YES YES YES YES YES
58. NGLDM_DE YES YES YES NO NO
59. NGLDM_DN YES YES YES YES YES
60. NGLDM_DNN YES YES YES YES YES
61. NGLDM_DV YES YES YES YES YES
62. NGLDM_GLN YES YES YES YES YES
63. NGLDM_GLNN YES YES YES YES YES
64. NGLDM_GLV NO NO NO YES NO
65. NGLDM_HGLDE YES YES YES YES YES
66. NGLDM_LDE YES YES YES YES YES
67. NGLDM_LGSDE YES NO NO NO NO
68. NGLDM_SDE YES YES YES YES YES
69. NGLDM_SM YES YES YES YES YES
70. NGTDM_busyness YES NO NO NO NO
71. NGTDM_coarseness NO YES NO YES NO

PART II | Chapter 4
128
72. NGTDM_complexity NO NO NO YES NO
73. NGTDM_contrast YES YES YES NO NO
74. NGTDM_strength NO NO NO YES NO
75. Shape_asphericity YES YES YES YES YES
76. Shape_centroidDistance NO NO NO YES NO
77. Shape_compactness YES YES YES YES YES
78. Shape_compactness2 NO NO NO YES NO
79. Shape_compactness3 NO NO NO YES NO
80. Shape_elongation NO NO NO YES NO
81. Shape_flatness YES NO NO YES NO
82. Shape_leastaxislength YES YES YES YES YES
83. Shape_majoraxislength YES YES YES YES YES
84. Shape_maxDiameter2D1 YES YES YES YES YES
85. Shape_maxDiameter2D2 YES YES YES YES YES
86. Shape_maxDiameter2D3 YES YES YES YES YES
87. Shape_maxDiameter3D YES YES YES YES YES
88. Shape_minoraxislength YES YES YES YES YES
89. Shape_spherDisprop YES YES YES YES YES
90. Shape_sphericity YES NO NO YES NO
91. Shape_surface YES YES YES YES YES
92. Shape_surfVolRatio YES YES YES YES YES
93. Shape_volume YES YES YES YES YES
94. Stats_energy YES YES YES YES YES
95. Stats_entropy YES YES YES YES YES
96. Stats_iqr YES NO NO NO NO
97. Stats_kurtosis NO YES NO YES NO
98. Stats_max NO YES NO YES NO
99. Stats_md YES NO NO YES NO
100. Stats_mean YES YES YES NO NO
101. Stats_median YES YES YES NO NO
102. Stats_p10 YES YES YES NO NO
103. Stats_p90 YES YES YES NO NO
104. Stats_range NO NO NO YES NO
105. Stats_rmd YES NO NO NO NO
106. Stats_rms YES YES YES NO NO
107. Stats_skewness NO YES NO YES NO
108. Stats_std NO NO NO YES NO
109. Stats_totalenergy YES YES YES YES YES
110. Stats_uniformity YES YES YES YES YES
111. Stats_var NO NO NO YES NO

PART II | Chapter 4
129
4
Feature name (wavelet filtered) TR-lung 4D-lung Lung(4D&TR)
4D-OES OES & lung(4D&TR)
112. HHH_GLCM_average NO NO NO YES NO
113. HHH_GLCM_infoCorr1 YES YES YES YES YES
114. HHH_GLCM_infoCorr2 YES YES YES YES YES
115. HHH_GLCM_invDiffmomnor YES NO NO NO NO
116. HHH_GLCM_invDiffnorm YES NO NO NO NO
117. HHH_GLCM_maxCorr NO YES NO NO NO
118. HHH_GLCM_sumAvg NO NO NO YES NO
119. HHH_GLDZM_DZE YES YES YES YES YES
120. HHH_GLDZM_DZN YES YES YES YES YES
121. HHH_GLDZM_DZNN YES YES YES YES YES
122. HHH_GLDZM_DZV YES YES YES YES YES
123. HHH_GLDZM_HILDE NO NO NO YES NO
124. HHH_GLDZM_IN YES YES YES YES YES
125. HHH_GLDZM_LDE YES YES YES YES YES
126. HHH_GLDZM_SDE YES YES YES YES YES
127. HHH_GLDZM_ZP YES YES YES YES YES
128. HHH_GLRLM_GLN YES YES YES YES YES
129. HHH_GLRLM_LRE YES NO NO NO NO
130. HHH_GLRLM_RLN YES YES YES YES YES
131. HHH_GLRLM_RLNN YES NO NO NO NO
132. HHH_GLRLM_RLV YES NO NO NO NO
133. HHH_GLRLM_RP YES NO NO NO NO
134. HHH_GLRLM_SRE YES NO NO NO NO
135. HHH_GLSZM_HILAE YES NO NO NO NO
136. HHH_GLSZM_IN YES YES YES YES YES
137. HHH_GLSZM_LAE YES NO NO NO NO
138. HHH_GLSZM_LILAE YES NO NO NO NO
139. HHH_GLSZM_SZN YES YES YES YES YES
140. HHH_GLSZM_SZV YES NO NO NO NO
141. HHH_GLSZM_ZE YES NO NO NO NO
142. HHH_GLSZM_ZP YES NO NO NO NO
143. HHH_NGLDM_DE YES NO NO NO NO
144. HHH_NGLDM_DN YES YES YES YES YES
145. HHH_NGLDM_DV YES NO NO NO NO
146. HHH_NGLDM_GLN YES YES YES YES YES
147. HHH_NGLDM_LDE YES NO NO NO NO
148. HHH_NGLDM_SDE YES NO NO NO NO
149. HHH_NGLDM_SM YES YES YES YES YES
150. HHH_NGTDM_coarseness YES YES YES YES YES

PART II | Chapter 4
130
151. HHH_NGTDM_contrast YES NO NO NO NO
152. HHH_NGTDM_strength YES YES YES NO NO
153. HHH_Stats_energy YES YES YES YES YES
154. HHH_Stats_iqr YES NO NO YES NO
155. HHH_Stats_kurtosis YES NO NO NO NO
156. HHH_Stats_md YES NO NO YES NO
157. HHH_Stats_p10 YES NO NO YES NO
158. HHH_Stats_p90 YES NO NO YES NO
159. HHH_Stats_rmd YES NO NO YES NO
160. HHH_Stats_rms YES NO NO YES NO
161. HHH_Stats_std YES NO NO YES NO
162. HHH_Stats_totalenergy YES YES YES YES YES
163. HHH_Stats_var YES NO NO YES NO
164. HHL_GLCM_average NO NO NO YES NO
165. HHL_GLCM_diffAvrg YES NO NO NO NO
166. HHL_GLCM_dissimilar YES NO NO NO NO
167. HHL_GLCM_entrop2 YES NO NO NO NO
168. HHL_GLCM_homogeneity1 YES NO NO NO NO
169. HHL_GLCM_homogeneity2 YES NO NO NO NO
170. HHL_GLCM_infoCorr1 YES YES YES YES YES
171. HHL_GLCM_infoCorr2 YES YES YES YES YES
172. HHL_GLCM_invDiffmomnor YES YES YES NO NO
173. HHL_GLCM_invDiffnorm YES YES YES NO NO
174. HHL_GLCM_inverseVar YES NO NO NO NO
175. HHL_GLCM_maxCorr YES NO NO NO NO
176. HHL_GLCM_sumAvg NO NO NO YES NO
177. HHL_GLDZM_DZE YES NO NO YES NO
178. HHL_GLDZM_DZN YES YES YES YES YES
179. HHL_GLDZM_DZNN YES YES YES YES YES
180. HHL_GLDZM_DZV YES YES YES YES YES
181. HHL_GLDZM_HILDE NO NO NO YES NO
182. HHL_GLDZM_IN YES YES YES YES YES
183. HHL_GLDZM_LDE YES YES YES YES YES
184. HHL_GLDZM_SDE YES YES YES YES YES
185. HHL_GLDZM_ZP YES YES YES YES YES
186. HHL_GLRLM_GLN YES YES YES YES YES
187. HHL_GLRLM_GLNN YES NO NO NO NO
188. HHL_GLRLM_LRE YES NO NO NO NO
189. HHL_GLRLM_RLN YES YES YES YES YES
190. HHL_GLRLM_RLNN YES YES YES NO NO

PART II | Chapter 4
131
4
191. HHL_GLRLM_RLV YES NO NO NO NO
192. HHL_GLRLM_RP YES NO NO NO NO
193. HHL_GLRLM_SRE YES NO NO NO NO
194. HHL_GLSZM_HILAE YES YES YES NO NO
195. HHL_GLSZM_IN YES YES YES YES YES
196. HHL_GLSZM_LAE YES NO NO NO NO
197. HHL_GLSZM_LILAE YES NO NO NO NO
198. HHL_GLSZM_SZN YES YES YES YES YES
199. HHL_GLSZM_SZV YES NO NO NO NO
200. HHL_GLSZM_ZE YES NO NO NO NO
201. HHL_GLSZM_ZP YES YES YES NO NO
202. HHL_NGLDM_DE YES NO NO NO NO
203. HHL_NGLDM_DN YES YES YES YES YES
204. HHL_NGLDM_DNN YES YES YES NO NO
205. HHL_NGLDM_DV YES NO NO NO NO
206. HHL_NGLDM_GLN YES YES YES YES YES
207. HHL_NGLDM_GLNN YES NO NO NO NO
208. HHL_NGLDM_LDE YES NO NO NO NO
209. HHL_NGLDM_SDE YES YES YES NO NO
210. HHL_NGLDM_SM YES YES YES YES YES
211. HHL_NGTDM_busyness YES YES YES NO NO
212. HHL_NGTDM_coarseness YES YES YES YES YES
213. HHL_NGTDM_complexity NO NO NO YES NO
214. HHL_NGTDM_contrast NO YES NO NO NO
215. HHL_NGTDM_strength NO YES NO NO NO
216. HHL_Stats_energy YES YES YES YES YES
217. HHL_Stats_entropy YES NO NO NO NO
218. HHL_Stats_iqr YES YES YES YES YES
219. HHL_Stats_kurtosis YES YES YES NO NO
220. HHL_Stats_md YES YES YES YES YES
221. HHL_Stats_p10 YES YES YES YES YES
222. HHL_Stats_p90 YES YES YES YES YES
223. HHL_Stats_rmd YES YES YES YES YES
224. HHL_Stats_rms YES YES YES YES YES
225. HHL_Stats_std YES YES YES YES YES
226. HHL_Stats_totalenergy YES YES YES YES YES
227. HHL_Stats_uniformity YES NO NO NO NO
228. HHL_Stats_var YES YES YES NO NO
229. HLH_GLCM_average NO NO NO YES NO
230. HLH_GLCM_infoCorr1 YES YES YES YES YES

PART II | Chapter 4
132
231. HLH_GLCM_infoCorr2 YES YES YES YES YES
232. HLH_GLCM_invDiffmomnor YES NO NO NO NO
233. HLH_GLCM_invDiffnorm YES NO NO YES NO
234. HLH_GLCM_maxCorr YES NO NO NO NO
235. HLH_GLCM_sumAvg NO NO NO YES NO
236. HLH_GLDZM_DZE YES NO NO YES NO
237. HLH_GLDZM_DZN YES YES YES YES YES
238. HLH_GLDZM_DZNN YES YES YES YES YES
239. HLH_GLDZM_DZV YES YES YES YES YES
240. HLH_GLDZM_HILDE NO NO NO YES NO
241. HLH_GLDZM_IN YES YES YES YES YES
242. HLH_GLDZM_LDE YES YES YES YES YES
243. HLH_GLDZM_LIE YES NO NO NO NO
244. HLH_GLDZM_LILDE YES NO NO NO NO
245. HLH_GLDZM_LISDE YES NO NO NO NO
246. HLH_GLDZM_SDE YES YES YES YES YES
247. HLH_GLDZM_ZP YES YES YES YES YES
248. HLH_GLRLM_GLN YES YES YES NO NO
249. HLH_GLRLM_LGRE YES NO NO NO NO
250. HLH_GLRLM_LRHGE NO NO NO YES NO
251. HLH_GLRLM_LRLGE YES NO NO NO NO
252. HLH_GLRLM_RLN YES YES YES YES YES
253. HLH_GLRLM_RLNN YES NO NO NO NO
254. HLH_GLRLM_RP YES NO NO NO NO
255. HLH_GLRLM_SRE YES NO NO NO NO
256. HLH_GLRLM_SRLGE YES NO NO NO NO
257. HLH_GLSZM_IN YES YES YES YES YES
258. HLH_GLSZM_LIE YES NO NO NO NO
259. HLH_GLSZM_LISAE YES NO NO NO NO
260. HLH_GLSZM_SZN YES YES YES YES YES
261. HLH_GLSZM_ZP YES NO NO NO NO
262. HLH_NGLDM_DE YES NO NO NO NO
263. HLH_NGLDM_DN YES YES YES YES YES
264. HLH_NGLDM_DNN YES NO NO NO NO
265. HLH_NGLDM_GLN YES YES YES NO NO
266. HLH_NGLDM_HGLDE YES NO NO NO NO
267. HLH_NGLDM_LGE YES NO NO NO NO
268. HLH_NGLDM_LGSDE YES NO NO NO NO
269. HLH_NGLDM_SDE YES NO NO NO NO
270. HLH_NGLDM_SM YES YES YES YES YES

PART II | Chapter 4
133
4
271. HLH_NGTDM_busyness YES NO NO NO NO
272. HLH_NGTDM_coarseness YES YES YES YES YES
273. HLH_NGTDM_complexity NO NO NO YES NO
274. HLH_NGTDM_contrast YES NO NO NO NO
275. HLH_NGTDM_strength NO YES NO YES NO
276. HLH_Stats_energy YES YES YES YES YES
277. HLH_Stats_iqr YES NO NO YES NO
278. HLH_Stats_kurtosis YES NO NO YES NO
279. HLH_Stats_max NO NO NO YES NO
280. HLH_Stats_md YES YES YES YES YES
281. HLH_Stats_min NO NO NO YES NO
282. HLH_Stats_p10 YES NO NO YES NO
283. HLH_Stats_p90 YES YES YES YES YES
284. HLH_Stats_range NO NO NO YES NO
285. HLH_Stats_rmd YES YES YES YES YES
286. HLH_Stats_rms YES YES YES YES YES
287. HLH_Stats_std YES YES YES YES YES
288. HLH_Stats_totalenergy YES YES YES YES YES
289. HLH_Stats_var YES YES YES YES YES
290. HLL_GLCM_autocorr NO NO NO YES NO
291. HLL_GLCM_average NO NO NO YES NO
292. HLL_GLCM_clusShade NO NO NO YES NO
293. HLL_GLCM_diffAvrg YES NO NO NO NO
294. HLL_GLCM_diffVar NO NO NO YES NO
295. HLL_GLCM_dissimilar YES NO NO NO NO
296. HLL_GLCM_homogeneity1 YES YES YES NO NO
297. HLL_GLCM_homogeneity2 YES YES YES NO NO
298. HLL_GLCM_infoCorr1 YES YES YES YES YES
299. HLL_GLCM_infoCorr2 YES YES YES YES YES
300. HLL_GLCM_invDiffmomnor YES NO NO YES NO
301. HLL_GLCM_invDiffnorm YES YES YES YES YES
302. HLL_GLCM_inverseVar YES YES YES NO NO
303. HLL_GLCM_maxCorr YES YES YES NO NO
304. HLL_GLCM_sumAvg NO NO NO YES NO
305. HLL_GLDZM_DZE NO NO NO YES NO
306. HLL_GLDZM_DZN YES YES YES NO NO
307. HLL_GLDZM_DZNN YES YES YES NO NO
308. HLL_GLDZM_DZV YES YES YES YES YES
309. HLL_GLDZM_HIE NO NO NO YES NO
310. HLL_GLDZM_HILDE NO YES NO NO NO

PART II | Chapter 4
134
311. HLL_GLDZM_HISDE NO NO NO YES NO
312. HLL_GLDZM_IN YES YES YES YES YES
313. HLL_GLDZM_IV NO NO NO YES NO
314. HLL_GLDZM_LDE YES YES YES YES YES
315. HLL_GLDZM_SDE YES YES YES NO NO
316. HLL_GLDZM_ZP YES YES YES YES YES
317. HLL_GLRLM_GLN YES YES YES YES YES
318. HLL_GLRLM_GLNN YES NO NO NO NO
319. HLL_GLRLM_GLV NO NO NO YES NO
320. HLL_GLRLM_HGRE NO NO NO YES NO
321. HLL_GLRLM_LRE YES YES YES NO NO
322. HLL_GLRLM_LRHGE NO NO NO YES NO
323. HLL_GLRLM_RLN YES YES YES YES YES
324. HLL_GLRLM_RLNN YES YES YES NO NO
325. HLL_GLRLM_RLV YES NO NO NO NO
326. HLL_GLRLM_RP YES YES YES NO NO
327. HLL_GLRLM_SRE YES YES YES NO NO
328. HLL_GLRLM_SRHGE NO NO NO YES NO
329. HLL_GLSZM_HIE NO NO NO YES NO
330. HLL_GLSZM_HILAE YES YES YES NO NO
331. HLL_GLSZM_HISAE NO NO NO YES NO
332. HLL_GLSZM_IN YES YES YES YES YES
333. HLL_GLSZM_IV NO NO NO YES NO
334. HLL_GLSZM_LAE YES YES YES NO NO
335. HLL_GLSZM_SZN YES YES YES NO NO
336. HLL_GLSZM_SZV YES YES YES NO NO
337. HLL_GLSZM_ZE YES YES YES NO NO
338. HLL_GLSZM_ZP YES YES YES NO NO
339. HLL_NGLDM_DE YES YES YES NO NO
340. HLL_NGLDM_DN YES YES YES YES YES
341. HLL_NGLDM_DNN YES YES YES NO NO
342. HLL_NGLDM_DV YES NO NO NO NO
343. HLL_NGLDM_GLN YES YES YES YES YES
344. HLL_NGLDM_GLNN YES YES YES NO NO
345. HLL_NGLDM_HGE NO NO NO YES NO
346. HLL_NGLDM_HGLDE YES YES YES YES YES
347. HLL_NGLDM_HGSDE NO NO NO YES NO
348. HLL_NGLDM_LDE YES YES YES NO NO
349. HLL_NGLDM_LGSDE YES NO NO NO NO
350. HLL_NGLDM_SDE YES YES YES NO NO

PART II | Chapter 4
135
4
351. HLL_NGLDM_SM YES YES YES YES YES
352. HLL_NGTDM_busyness YES YES YES NO NO
353. HLL_NGTDM_coarseness NO YES NO YES NO
354. HLL_NGTDM_contrast YES NO NO NO NO
355. HLL_NGTDM_strength NO YES NO YES NO
356. HLL_Stats_energy YES YES YES YES YES
357. HLL_Stats_iqr YES NO NO YES NO
358. HLL_Stats_kurtosis YES YES YES NO NO
359. HLL_Stats_md YES NO NO YES NO
360. HLL_Stats_min NO NO NO YES NO
361. HLL_Stats_p10 YES NO NO NO NO
362. HLL_Stats_p90 YES NO NO NO NO
363. HLL_Stats_range NO NO NO YES NO
364. HLL_Stats_rmd YES NO NO YES NO
365. HLL_Stats_rms YES NO NO YES NO
366. HLL_Stats_std YES NO NO YES NO
367. HLL_Stats_totalenergy YES YES YES YES YES
368. HLL_Stats_uniformity YES YES YES NO NO
369. HLL_Stats_var YES NO NO YES NO
370. LHH_GLCM_correl1 NO YES NO YES NO
371. LHH_GLCM_homogeneity1 YES NO NO NO NO
372. LHH_GLCM_homogeneity2 YES NO NO NO NO
373. LHH_GLCM_infoCorr1 YES YES YES YES YES
374. LHH_GLCM_infoCorr2 YES YES YES YES YES
375. LHH_GLCM_invDiffmomnor YES NO NO NO NO
376. LHH_GLCM_invDiffnorm YES NO NO NO NO
377. LHH_GLCM_inverseVar YES NO NO NO NO
378. LHH_GLCM_maxCorr YES NO NO NO NO
379. LHH_GLDZM_DZE YES NO NO YES NO
380. LHH_GLDZM_DZN YES YES YES YES YES
381. LHH_GLDZM_DZNN YES YES YES YES YES
382. LHH_GLDZM_DZV YES YES YES YES YES
383. LHH_GLDZM_HILDE NO YES NO NO NO
384. LHH_GLDZM_IN YES YES YES YES YES
385. LHH_GLDZM_LDE YES YES YES YES YES
386. LHH_GLDZM_LIE YES NO NO NO NO
387. LHH_GLDZM_LISDE YES NO NO NO NO
388. LHH_GLDZM_SDE YES YES YES YES YES
389. LHH_GLDZM_ZP YES YES YES YES YES
390. LHH_GLRLM_GLN YES YES YES YES YES

PART II | Chapter 4
136
391. LHH_GLRLM_LGRE YES NO NO NO NO
392. LHH_GLRLM_LRLGE YES NO NO NO NO
393. LHH_GLRLM_RLN YES YES YES YES YES
394. LHH_GLRLM_RLNN YES NO NO NO NO
395. LHH_GLRLM_SRLGE YES NO NO NO NO
396. LHH_GLSZM_HILAE YES NO NO NO NO
397. LHH_GLSZM_IN YES YES YES YES YES
398. LHH_GLSZM_LAE YES NO NO NO NO
399. LHH_GLSZM_LIE YES NO NO NO NO
400. LHH_GLSZM_SZN YES YES YES YES YES
401. LHH_GLSZM_SZV YES NO NO NO NO
402. LHH_GLSZM_ZE YES NO NO NO NO
403. LHH_GLSZM_ZP YES NO NO NO NO
404. LHH_NGLDM_DE YES NO NO NO NO
405. LHH_NGLDM_DN YES YES YES YES YES
406. LHH_NGLDM_DNN YES NO NO NO NO
407. LHH_NGLDM_GLN YES YES YES NO NO
408. LHH_NGLDM_LGE YES NO NO NO NO
409. LHH_NGLDM_SDE YES NO NO NO NO
410. LHH_NGLDM_SM YES YES YES YES YES
411. LHH_NGTDM_busyness YES YES YES NO NO
412. LHH_NGTDM_coarseness NO YES NO YES NO
413. LHH_NGTDM_complexity NO NO NO YES NO
414. LHH_NGTDM_contrast YES NO NO NO NO
415. LHH_NGTDM_strength NO YES NO NO NO
416. LHH_Stats_energy YES YES YES YES YES
417. LHH_Stats_iqr YES NO NO YES NO
418. LHH_Stats_md YES NO NO YES NO
419. LHH_Stats_mean YES NO NO NO NO
420. LHH_Stats_p10 YES NO NO YES NO
421. LHH_Stats_p90 YES NO NO YES NO
422. LHH_Stats_rmd YES NO NO YES NO
423. LHH_Stats_rms YES NO NO YES NO
424. LHH_Stats_std YES NO NO YES NO
425. LHH_Stats_totalenergy YES YES YES YES YES
426. LHH_Stats_var NO NO NO YES NO
427. LHL_GLCM_average NO NO NO YES NO
428. LHL_GLCM_correl1 NO YES NO YES NO
429. LHL_GLCM_diffAvrg NO YES NO NO NO
430. LHL_GLCM_dissimilar NO YES NO NO NO

PART II | Chapter 4
137
4
431. LHL_GLCM_entrop2 YES NO NO NO NO
432. LHL_GLCM_homogeneity1 YES YES YES NO NO
433. LHL_GLCM_homogeneity2 YES NO NO NO NO
434. LHL_GLCM_infoCorr1 YES YES YES YES YES
435. LHL_GLCM_infoCorr2 YES YES YES YES YES
436. LHL_GLCM_invDiffmomnor YES YES YES YES YES
437. LHL_GLCM_invDiffnorm YES YES YES YES YES
438. LHL_GLCM_inverseVar YES YES YES NO NO
439. LHL_GLCM_maxCorr YES NO NO NO NO
440. LHL_GLCM_maxProb YES NO NO NO NO
441. LHL_GLCM_sumAvg NO NO NO YES NO
442. LHL_GLDZM_DZE NO YES NO NO NO
443. LHL_GLDZM_DZN YES YES YES YES YES
444. LHL_GLDZM_DZNN YES YES YES YES YES
445. LHL_GLDZM_DZV YES YES YES YES YES
446. LHL_GLDZM_HILDE NO YES NO NO NO
447. LHL_GLDZM_IN YES YES YES YES YES
448. LHL_GLDZM_LDE YES YES YES YES YES
449. LHL_GLDZM_SDE YES YES YES YES YES
450. LHL_GLDZM_ZP YES YES YES YES YES
451. LHL_GLRLM_GLN YES YES YES YES YES
452. LHL_GLRLM_GLNN YES YES YES NO NO
453. LHL_GLRLM_LRE YES NO NO NO NO
454. LHL_GLRLM_LRHGE NO YES NO NO NO
455. LHL_GLRLM_RLN YES YES YES YES YES
456. LHL_GLRLM_RLNN YES YES YES NO NO
457. LHL_GLRLM_RLV YES NO NO NO NO
458. LHL_GLRLM_RP YES YES YES NO NO
459. LHL_GLRLM_SRE YES YES YES NO NO
460. LHL_GLSZM_HILAE NO YES NO NO NO
461. LHL_GLSZM_IN YES YES YES YES YES
462. LHL_GLSZM_LAE YES NO NO NO NO
463. LHL_GLSZM_LILAE YES NO NO NO NO
464. LHL_GLSZM_SZN YES YES YES NO NO
465. LHL_GLSZM_SZV YES NO NO NO NO
466. LHL_GLSZM_ZE YES NO NO NO NO
467. LHL_GLSZM_ZP YES YES YES NO NO
468. LHL_NGLDM_DE YES YES YES NO NO
469. LHL_NGLDM_DN YES YES YES YES YES
470. LHL_NGLDM_DNN YES YES YES NO NO

PART II | Chapter 4
138
471. LHL_NGLDM_DV YES NO NO NO NO
472. LHL_NGLDM_GLN YES YES YES YES YES
473. LHL_NGLDM_GLNN YES NO NO NO NO
474. LHL_NGLDM_HGLDE NO YES NO NO NO
475. LHL_NGLDM_LDE YES NO NO NO NO
476. LHL_NGLDM_SDE YES YES YES NO NO
477. LHL_NGLDM_SM YES YES YES YES YES
478. LHL_NGTDM_busyness YES YES YES NO NO
479. LHL_NGTDM_coarseness NO YES NO YES NO
480. LHL_NGTDM_complexity NO NO NO YES NO
481. LHL_NGTDM_strength NO YES NO NO NO
482. LHL_Stats_energy YES YES YES YES YES
483. LHL_Stats_entropy YES NO NO NO NO
484. LHL_Stats_iqr YES YES YES YES YES
485. LHL_Stats_kurtosis NO YES NO NO NO
486. LHL_Stats_max NO NO NO YES NO
487. LHL_Stats_md YES YES YES YES YES
488. LHL_Stats_mean YES YES YES NO NO
489. LHL_Stats_median YES YES YES NO NO
490. LHL_Stats_min NO NO NO YES NO
491. LHL_Stats_p10 YES YES YES YES YES
492. LHL_Stats_p90 YES YES YES YES YES
493. LHL_Stats_range NO NO NO YES NO
494. LHL_Stats_rmd YES YES YES YES YES
495. LHL_Stats_rms YES YES YES YES YES
496. LHL_Stats_skewness YES NO NO NO NO
497. LHL_Stats_std YES YES YES YES YES
498. LHL_Stats_totalenergy YES YES YES YES YES
499. LHL_Stats_uniformity YES NO NO NO NO
500. LHL_Stats_var YES YES YES NO NO
501. LLH_GLCM_average NO NO NO YES NO
502. LLH_GLCM_correl1 YES YES YES YES YES
503. LLH_GLCM_infoCorr1 YES YES YES YES YES
504. LLH_GLCM_infoCorr2 YES YES YES YES YES
505. LLH_GLCM_invDiffmomnor YES NO NO NO NO
506. LLH_GLCM_invDiffnorm YES NO NO YES NO
507. LLH_GLCM_maxCorr YES NO NO NO NO
508. LLH_GLCM_sumAvg NO NO NO YES NO
509. LLH_GLDZM_DZE NO NO NO YES NO
510. LLH_GLDZM_DZN YES YES YES YES YES

PART II | Chapter 4
139
4
511. LLH_GLDZM_DZNN YES YES YES YES YES
512. LLH_GLDZM_DZV YES YES YES YES YES
513. LLH_GLDZM_IN YES YES YES YES YES
514. LLH_GLDZM_LDE YES YES YES YES YES
515. LLH_GLDZM_LIE YES NO NO NO NO
516. LLH_GLDZM_LISDE YES NO NO NO NO
517. LLH_GLDZM_SDE YES YES YES YES YES
518. LLH_GLDZM_ZP YES YES YES YES YES
519. LLH_GLRLM_GLN YES YES YES YES YES
520. LLH_GLRLM_LGRE YES NO NO NO NO
521. LLH_GLRLM_LRE YES NO NO NO NO
522. LLH_GLRLM_LRLGE YES NO NO NO NO
523. LLH_GLRLM_RLN YES YES YES YES YES
524. LLH_GLRLM_RLNN YES YES YES NO NO
525. LLH_GLRLM_RLV YES NO NO NO NO
526. LLH_GLRLM_RP YES YES YES NO NO
527. LLH_GLRLM_SRE YES YES YES NO NO
528. LLH_GLRLM_SRLGE YES NO NO NO NO
529. LLH_GLSZM_IN YES YES YES YES YES
530. LLH_GLSZM_LIE YES NO NO NO NO
531. LLH_GLSZM_LISAE YES NO NO NO NO
532. LLH_GLSZM_SZN YES YES YES YES YES
533. LLH_GLSZM_ZE YES NO NO NO NO
534. LLH_GLSZM_ZP YES NO NO NO NO
535. LLH_NGLDM_DE YES YES YES NO NO
536. LLH_NGLDM_DN YES YES YES YES YES
537. LLH_NGLDM_DNN YES YES YES NO NO
538. LLH_NGLDM_DV YES YES YES NO NO
539. LLH_NGLDM_GLN YES YES YES YES YES
540. LLH_NGLDM_LDE YES NO NO NO NO
541. LLH_NGLDM_LGE YES NO NO NO NO
542. LLH_NGLDM_LGSDE YES NO NO NO NO
543. LLH_NGLDM_SDE YES NO NO NO NO
544. LLH_NGLDM_SM YES YES YES YES YES
545. LLH_NGTDM_busyness YES NO NO NO NO
546. LLH_NGTDM_coarseness YES YES YES YES YES
547. LLH_NGTDM_contrast YES NO NO NO NO
548. LLH_NGTDM_strength NO YES NO NO NO
549. LLH_Stats_energy YES YES YES YES YES
550. LLH_Stats_iqr YES YES YES YES YES

PART II | Chapter 4
140
551. LLH_Stats_kurtosis YES NO NO NO NO
552. LLH_Stats_md YES YES YES YES YES
553. LLH_Stats_mean YES NO NO NO NO
554. LLH_Stats_p10 YES YES YES YES YES
555. LLH_Stats_p90 YES NO NO YES NO
556. LLH_Stats_rmd YES YES YES YES YES
557. LLH_Stats_rms YES YES YES YES YES
558. LLH_Stats_skewness NO NO NO YES NO
559. LLH_Stats_std YES YES YES YES YES
560. LLH_Stats_totalenergy YES YES YES YES YES
561. LLH_Stats_var YES YES YES NO NO
562. LLL_GLCM_average YES NO NO NO NO
563. LLL_GLCM_clusShade NO YES NO YES NO
564. LLL_GLCM_clusTend NO NO NO YES NO
565. LLL_GLCM_contrast NO NO NO YES NO
566. LLL_GLCM_diffAvrg YES NO NO YES NO
567. LLL_GLCM_diffEntro NO YES NO YES NO
568. LLL_GLCM_diffVar NO NO NO YES NO
569. LLL_GLCM_dissimilar YES NO NO YES NO
570. LLL_GLCM_energy NO YES NO YES NO
571. LLL_GLCM_entrop2 YES YES YES YES YES
572. LLL_GLCM_homogeneity1 YES YES YES YES YES
573. LLL_GLCM_homogeneity2 YES YES YES YES YES
574. LLL_GLCM_infoCorr1 YES YES YES YES YES
575. LLL_GLCM_infoCorr2 YES YES YES NO NO
576. LLL_GLCM_invDiffnorm YES YES YES YES YES
577. LLL_GLCM_inverseVar YES YES YES NO NO
578. LLL_GLCM_maxProb YES NO NO NO NO
579. LLL_GLCM_sumAvg YES NO NO NO NO
580. LLL_GLCM_sumEntro NO YES NO NO NO
581. LLL_GLCM_sumSquares NO NO NO YES NO
582. LLL_GLCM_sumVar NO NO NO YES NO
583. LLL_GLDZM_DZE NO YES NO YES NO
584. LLL_GLDZM_DZN YES YES YES YES YES
585. LLL_GLDZM_DZNN YES YES YES YES YES
586. LLL_GLDZM_DZV YES YES YES YES YES
587. LLL_GLDZM_HILDE YES YES YES YES YES
588. LLL_GLDZM_IN YES YES YES YES YES
589. LLL_GLDZM_IV NO NO NO YES NO
590. LLL_GLDZM_LDE YES YES YES YES YES

PART II | Chapter 4
141
4
591. LLL_GLDZM_LIE YES NO NO NO NO
592. LLL_GLDZM_LILDE YES NO NO NO NO
593. LLL_GLDZM_LISDE YES NO NO NO NO
594. LLL_GLDZM_SDE YES YES YES YES YES
595. LLL_GLDZM_ZP YES YES YES YES YES
596. LLL_GLRLM_GLN YES YES YES YES YES
597. LLL_GLRLM_GLNN YES YES YES NO NO
598. LLL_GLRLM_GLV NO NO NO YES NO
599. LLL_GLRLM_LGRE YES NO NO NO NO
600. LLL_GLRLM_LRE YES YES YES YES YES
601. LLL_GLRLM_LRHGE YES YES YES YES YES
602. LLL_GLRLM_LRLGE YES NO NO NO NO
603. LLL_GLRLM_RE NO NO NO YES NO
604. LLL_GLRLM_RLN YES YES YES YES YES
605. LLL_GLRLM_RLNN YES YES YES YES YES
606. LLL_GLRLM_RLV YES YES YES YES YES
607. LLL_GLRLM_RP YES YES YES YES YES
608. LLL_GLRLM_SRE YES YES YES YES YES
609. LLL_GLRLM_SRLGE YES NO NO NO NO
610. LLL_GLSZM_HILAE YES YES YES YES YES
611. LLL_GLSZM_IN YES YES YES YES YES
612. LLL_GLSZM_IV NO NO NO YES NO
613. LLL_GLSZM_LAE YES YES YES YES YES
614. LLL_GLSZM_LIE YES NO NO NO NO
615. LLL_GLSZM_LISAE YES NO NO NO NO
616. LLL_GLSZM_SZN YES YES YES YES YES
617. LLL_GLSZM_SZV YES YES YES YES YES
618. LLL_GLSZM_ZE YES YES YES YES YES
619. LLL_GLSZM_ZP YES YES YES YES YES
620. LLL_NGLDM_DE YES YES YES NO NO
621. LLL_NGLDM_DN YES YES YES YES YES
622. LLL_NGLDM_DNN YES YES YES YES YES
623. LLL_NGLDM_DV YES YES YES YES YES
624. LLL_NGLDM_GLN YES YES YES YES YES
625. LLL_NGLDM_GLNN YES YES YES NO NO
626. LLL_NGLDM_GLV NO NO NO YES NO
627. LLL_NGLDM_HGLDE YES YES YES YES YES
628. LLL_NGLDM_LDE YES YES YES YES YES
629. LLL_NGLDM_LGE YES NO NO NO NO
630. LLL_NGLDM_LGSDE YES NO NO NO NO

PART II | Chapter 4
142
631. LLL_NGLDM_SDE YES YES YES YES YES
632. LLL_NGLDM_SM YES YES YES YES YES
633. LLL_NGTDM_busyness YES NO NO NO NO
634. LLL_NGTDM_coarseness YES YES YES YES YES
635. LLL_NGTDM_complexity NO NO NO YES NO
636. LLL_NGTDM_contrast YES YES YES NO NO
637. LLL_NGTDM_strength NO NO NO YES NO
638. LLL_Stats_energy YES YES YES YES YES
639. LLL_Stats_entropy YES YES YES NO NO
640. LLL_Stats_iqr YES NO NO NO NO
641. LLL_Stats_kurtosis NO YES NO NO NO
642. LLL_Stats_max NO YES NO YES NO
643. LLL_Stats_md NO NO NO YES NO
644. LLL_Stats_mean YES YES YES NO NO
645. LLL_Stats_median YES YES YES NO NO
646. LLL_Stats_p10 YES YES YES NO NO
647. LLL_Stats_p90 YES YES YES NO NO
648. LLL_Stats_range NO NO NO YES NO
649. LLL_Stats_rms YES YES YES NO NO
650. LLL_Stats_skewness NO YES NO YES NO
651. LLL_Stats_std NO NO NO YES NO
652. LLL_Stats_totalenergy YES YES YES YES YES
653. LLL_Stats_uniformity YES YES YES NO NO
654. LLL_Stats_var NO NO NO YES NO
Total no. features 529 373 331 397 249

PART II | Chapter 4
143
4
SUPPLEMENTAL APPENDIX E
Individual feature namesCorresponding definitions are described previously.2[1]
Geometric features
1. Major Axis Length
2. Maximum Diameter 3D
3. Maximum Diameter 2D2
4. Maximum Diameter 2D3
5. Volume
6. Maximum Diameter 2D1
7. Compactness 1
8. Surface
9. Least Axis Length
10. Minor Axis Length
11. Surface to Volume Ratio
12. Asphericity
13. Spherical Disproportion
14. Elongation
15. Sphericity
16. Centroid Distance
17. Compactness 3
18. Flatness
19. Compactness 2
First-order (histogram) statistics
20. Energy
21. Total Energy
22. Maximum
23. Range
24. Standard Deviation
25. Skewness
26. Variance
27. Entropy
28. Uniformity
29. Mean Absolute Deviation
30. Kurtosis[1] Lambin P, Leijenaar RTH, Deist TM, Peerlings J, Soest J van, Jong E de, et al. Radiomics: the bridge between medical imaging and personalized medicine. Nat Rev Clin Oncol n.d.;Submitted.

PART II | Chapter 4
144
31. Interquartile Range
32. Minimum
33. Root Mean Square
34. Mean
35. Robust Mean Absolute Deviation
36. 90th percentile
37. Median
38. 10th percentile
Grey-Level Co-Occurrence Matrix based features
39. Homogeneity 2
40. Difference Variance
41. Contrast
42. Homogeneity 1
43. Inverse Variance
44. Informational Measure of Correlation 1
45. dissimilar
46. Difference Average
47. Cluster Shade
48. Difference Entropy
49. Maximum Probability
50. Energy
51. Entropy
52. Sum of Squares (Variance)
53. Cluster Prominence
54. Informational Measure of Correlation 2
55. Sum Entropy
56. Cluster Tendency
57. Sum Variance
58. Inverse Difference Normalized
59. Correlation
60. Inverse Difference Moment Normalized
61. Autocorrelation
62. Sum Average
63. Average
64. Maximal Correlation Coefficient
Grey-Level Distance-Zone Matrix based features
65. Distance-Zone Variance
66. Large Distance Emphasis
67. Intensity Non-Uniformity

PART II | Chapter 4
145
4
68. Distance-Zone Entropy
69. Distance-Zone Non-Uniformity
70. Zone Percentage
71. Small-Distance Emphasis
72. Intensity Variability
73. High Intensity Large Distance Emphasis
74. Distance-Zone Non-Uniformity Normalized
75. Intensity Non-Uniformity Normalized
76. High Intensity Emphasis
77. Low Intensity Emphasis
78. Low Intensity Small Distance Emphasis
79. High Intensity Small Distance Emphasis
80. Low Intensity Large Distance Emphasis
Grey-Level Run-Length Matrix based features
81. Grey-Level Non-Uniformity
82. Run Length Non-Uniformity
83. Run Length Variance
84. Long Run Emphasis
85. Run Percentage
86. Short Run Emphasis
87. Run Length Non-Uniformity Normalized
88. Grey-Level Variance
89. Run Entropy
90. Grey-Level Non-Uniformity Normalized
91. Long Run High Grey-Level Emphasis
92. High Grey-Level Run Emphasis
93. Short Run High Grey-Level Emphasis
94. Low Grey-Level Run Emphasis
95. Short Run Low Grey-Level Emphasis
96. Long Run Low Grey-Level Emphasis
Grey-Level Size-Zone Matrix based features
97. Size-Zone Variance
98. Large Area Emphasis
99. Intensity Non-Uniformity
100. Size-Zone Non-Uniformity
101. Intensity Variance
102. Zone Entropy
103. Zone Percentage
104. High Intensity Large Area Emphasis

PART II | Chapter 4
146
105. Intensity Non-Uniformity Normalized
106. Low Intensity Large Area Emphasis
107. High Intensity Emphasis
108. High Intensity Small Area Emphasis
109. Low Intensity Emphasis
110. Low Intensity Small Area Emphasis
111. Size-Zone Non-Uniformity Normalized
112. Small Area Emphasis
Neighbouring Grey-Level Dependence Matrix based features
113. Grey-Level Non-Uniformity
114. Second Moment
115. Large Dependence Emphasis
116. Dependence Non-Uniformity
117. Dependence Variance
118. Dependence Non-Uniformity Normalized
119. Small Dependence Emphasis
120. High Grey-Level Large Dependence Emphasis
121. Grey-Level Variance
122. Grey-Level Non-Uniformity Normalized
123. Dependence Entropy
124. High Grey-Level Emphasis
125. High Grey-Level Small Dependence Emphasis
126. Low Grey-Level Emphasis
127. Low Grey-Level Small Dependence Emphasis
128. Low Grey-Level Large Dependence Emphasis
Neighbourhood Grey Tone Difference Matrix based features
129. Coarseness
130. Complexity
131. Strength
132. Contrast
133. Busyness

PART II | Chapter 4
147
4
SUPPLEMENTAL APPENDIX F
Pairwise CCCs after wavelet filteringGraphical representation of the pairwise CCCs for all wavelet filtered features. The horizontal lines extend from the minimum to the maximum observed values per feature in the 4DCT-scan, and dots representing the median are red when the minimum CCC > 0.85. Abbreviations for the textural feature groups: grey-level co-occurrence (GLCM), grey-level distance-zone (GLDZM), grey-level run-length (GLRLM), grey-level size-zone (GLSZM), neighbouring grey-level dependence (NGLDM), and neighbourhood grey-tone difference (NGTDM). Individual feature names can be found in appendix A.

PART II | Chapter 4
148
Supp
l.Material:Larue,R.eta
l.4D
CTim
agingtoassessradiomicsfeaturestability:aninvestigationfortho
raciccancers.
Radiotherapyand
Oncology2017.
27
Supp
lemen
talA
ppen
dixF.Pairw
iseCCC
safte
rwaveletfilte
ring.
Graphic
alrepresentat
ionofthepair
wiseCCC
sforallw
avele
tfilteredfe
atures.Th
ehorizo
ntallin
esex
tendfro
mth
eminim
umto
them
axim
umobserved
value
sperfeatu
rein
the4
DCT-scan,and
dotsrepresentin
gthemedian
arer
edwhent
heminim
umCC
C>0.85
.Abb
reviationsfo
rthete
xturalfe
aturegrou
ps:
grey-levelco-occurrence
(GLCM),
grey-le
veldistance-zon
e(GLD
ZM),
grey-levelrun-length(GL
RLM),
grey-le
velsize-zone(GL
SZM),
neighb
ourin
ggrey-level
depend
ence(N
GLDM
),andneighb
ourhoo
dgrey-ton
ediffe
rence(NGT
DM).Individu
alfeaturenamescanbefoun
dinapp
endixA.
1Sha
peM
ajor
Axi
s Le
ngth
Max
Dia
met
er 3
DM
ax D
iam
eter
2D
2M
ax D
iam
eter
2D
3Vo
lum
eM
ax D
iam
eter
2D
1Su
rface
Leas
t Axi
s Le
ngth
Min
or A
xis
Leng
thSu
rface
Vol
ume
Rat
ioSp
ere
Dis
prop
Asph
eric
ityEl
onga
tion
Sphe
ricity
Cen
troid
Dis
tanc
eC
ompa
ctne
ss 1
Com
pact
ness
3Fl
atne
ssC
ompa
ctne
ss 2
1Sta
tistic
sEn
ergy
Tot.
Ener
gyM
axR
ange
STD
Skew
ness
Varia
nce
Entro
pyU
nifo
rmity
Mea
n D
ev.
Kurto
sis
IQR
Min
RM
SM
ean
Dev
.R
MD
P90
Med
ian
P10
GLC
MH
omog
enei
ty 2
Diff
. Var
ianc
eC
ontra
stH
omog
enei
ty 1
Inve
rse
Varia
nce
IMC
1D
issi
mila
rity
Diff
. Ave
rage
Clu
ster
Sha
deD
iff. E
ntro
py MP
Ener
gyEn
tropy
Varia
nce
Clu
ster
Pro
min
ence
IMC
2Su
m E
ntro
pySu
m V
aria
nce
Clu
ster
Ten
denc
yID
NC
orre
latio
nID
MN
Auto
corre
latio
nSu
m A
vera
geAv
erag
eM
CG
LDZM
DZV
LDE IN
DZE
DZN ZP
SDE IV
HIL
DE
DZN
NIN
NH
IE LIE
LISD
EH
ISD
ELI
LDE
GLR
LMG
LNR
LN RLV
LRE
RP
SRE
RLN
NG
LV RE
GLN
NLR
HG
EH
GR
ESR
HG
ELG
RE
SRLG
ELR
LGE
GLS
ZMSZ
VLA
E INSZ
N IV ZE ZPH
ILAE IN
NLI
LAE
HIE
HIS
AE LIE
LISA
ESZ
NN
SAE
NG
LDM
GLN SM LD
ED
ND
VD
NN
SDE
HG
LDE
GLV
GLN
ND
EH
GE
HG
SDE
LGE
LGSD
ELG
LDE
NG
TDM
Coa
rsen
ess
Com
plex
itySt
reng
thC
ontra
stBu
syne
ss
0.5
0.85
1
CCC
Maj
or A
xis
Leng
thM
ax D
iam
eter
3D
Max
Dia
met
er 2
D2
Max
Dia
met
er 2
D3
Volu
me
Max
Dia
met
er 2
D1
Surfa
ceLe
ast A
xis
Leng
thM
inor
Axi
s Le
ngth
Surfa
ce V
olum
e R
atio
Sper
e D
ispr
opAs
pher
icity
Elon
gatio
nSp
heric
ityC
entro
id D
ista
nce
Com
pact
ness
1C
ompa
ctne
ss 3
Flat
ness
Com
pact
ness
2En
ergy
Tot.
Ener
gyM
axR
ange
STD
Skew
ness
Varia
nce
Entro
pyU
nifo
rmity
Mea
n D
ev.
Kurto
sis
IQR
Min
RM
SM
ean
Dev
.R
MD
P90
Med
ian
P10
Hom
ogen
eity
2D
iff. V
aria
nce
Con
trast
Hom
ogen
eity
1In
vers
e Va
rianc
eIM
C1
Dis
sim
ilarit
yD
iff. A
vera
geC
lust
er S
hade
Diff
. Ent
ropy M
PEn
ergy
Entro
pyVa
rianc
eC
lust
er P
rom
inen
ceIM
C2
Sum
Ent
ropy
Sum
Var
ianc
eC
lust
er T
ende
ncy
IDN
Cor
rela
tion
IDM
NAu
toco
rrela
tion
Sum
Ave
rage
Aver
age
MC
DZV
LDE IN
DZE
DZN ZP
SDE IV
HIL
DE
DZN
NIN
NH
IE LIE
LISD
EH
ISD
ELI
LDE
GLN
RLN RLV
LRE
RP
SRE
RLN
NG
LV RE
GLN
NLR
HG
EH
GR
ESR
HG
ELG
RE
SRLG
ELR
LGE
SZV
LAE IN
SZN IV ZE ZP
HIL
AE INN
LILA
EH
IEH
ISAE LI
ELI
SAE
SZN
NSA
EG
LN SM LDE
DN
DV
DN
NSD
EH
GLD
EG
LVG
LNN
DE
HG
EH
GSD
ELG
ELG
SDE
LGLD
EC
oars
enes
sC
ompl
exity
Stre
ngth
Con
trast
Busy
ness
0.5
0.85
1
CCC
Wav
elet
HH
HW
avel
et H
HL
Wav
elet
HLH
Wav
elet
HLL
1Sha
peM
ajor
Axi
s Le
ngth
Max
Dia
met
er 3
DM
ax D
iam
eter
2D
2M
ax D
iam
eter
2D
3Vo
lum
eM
ax D
iam
eter
2D
1Su
rface
Leas
t Axi
s Le
ngth
Min
or A
xis
Leng
thSu
rface
Vol
ume
Rat
ioSp
ere
Dis
prop
Asph
eric
ityEl
onga
tion
Sphe
ricity
Cen
troid
Dis
tanc
eC
ompa
ctne
ss 1
Com
pact
ness
3Fl
atne
ssC
ompa
ctne
ss 2
1Sta
tistic
sEn
ergy
Tot.
Ener
gyM
axR
ange
STD
Skew
ness
Varia
nce
Entro
pyU
nifo
rmity
Mea
n D
ev.
Kurto
sis
IQR
Min
RM
SM
ean
Dev
.R
MD
P90
Med
ian
P10
GLC
MH
omog
enei
ty 2
Diff
. Var
ianc
eC
ontra
stH
omog
enei
ty 1
Inve
rse
Varia
nce
IMC
1D
issi
mila
rity
Diff
. Ave
rage
Clu
ster
Sha
deD
iff. E
ntro
py MP
Ener
gyEn
tropy
Varia
nce
Clu
ster
Pro
min
ence
IMC
2Su
m E
ntro
pySu
m V
aria
nce
Clu
ster
Ten
denc
yID
NC
orre
latio
nID
MN
Auto
corre
latio
nSu
m A
vera
geAv
erag
eM
CG
LDZM
DZV
LDE IN
DZE
DZN ZP
SDE IV
HIL
DE
DZN
NIN
NH
IE LIE
LISD
EH
ISD
ELI
LDE
GLR
LMG
LNR
LN RLV
LRE
RP
SRE
RLN
NG
LV RE
GLN
NLR
HG
EH
GR
ESR
HG
ELG
RE
SRLG
ELR
LGE
GLS
ZMSZ
VLA
E INSZ
N IV ZE ZPH
ILAE IN
NLI
LAE
HIE
HIS
AE LIE
LISA
ESZ
NN
SAE
NG
LDM
GLN SM LD
ED
ND
VD
NN
SDE
HG
LDE
GLV
GLN
ND
EH
GE
HG
SDE
LGE
LGSD
ELG
LDE
NG
TDM
Coa
rsen
ess
Com
plex
itySt
reng
thC
ontra
stBu
syne
ss
0.5
0.85
1
CCC
Maj
or A
xis
Leng
thM
ax D
iam
eter
3D
Max
Dia
met
er 2
D2
Max
Dia
met
er 2
D3
Volu
me
Max
Dia
met
er 2
D1
Surfa
ceLe
ast A
xis
Leng
thM
inor
Axi
s Le
ngth
Surfa
ce V
olum
e R
atio
Sper
e D
ispr
opAs
pher
icity
Elon
gatio
nSp
heric
ityC
entro
id D
ista
nce
Com
pact
ness
1C
ompa
ctne
ss 3
Flat
ness
Com
pact
ness
2En
ergy
Tot.
Ener
gyM
axR
ange
STD
Skew
ness
Varia
nce
Entro
pyU
nifo
rmity
Mea
n D
ev.
Kurto
sis
IQR
Min
RM
SM
ean
Dev
.R
MD
P90
Med
ian
P10
Hom
ogen
eity
2D
iff. V
aria
nce
Con
trast
Hom
ogen
eity
1In
vers
e Va
rianc
eIM
C1
Dis
sim
ilarit
yD
iff. A
vera
geC
lust
er S
hade
Diff
. Ent
ropy M
PEn
ergy
Entro
pyVa
rianc
eC
lust
er P
rom
inen
ceIM
C2
Sum
Ent
ropy
Sum
Var
ianc
eC
lust
er T
ende
ncy
IDN
Cor
rela
tion
IDM
NAu
toco
rrela
tion
Sum
Ave
rage
Aver
age
MC
DZV
LDE IN
DZE
DZN ZP
SDE IV
HIL
DE
DZN
NIN
NH
IE LIE
LISD
EH
ISD
ELI
LDE
GLN
RLN RLV
LRE
RP
SRE
RLN
NG
LV RE
GLN
NLR
HG
EH
GR
ESR
HG
ELG
RE
SRLG
ELR
LGE
SZV
LAE IN
SZN IV ZE ZP
HIL
AE INN
LILA
EH
IEH
ISAE LI
ELI
SAE
SZN
NSA
EG
LN SM LDE
DN
DV
DN
NSD
EH
GLD
EG
LVG
LNN
DE
HG
EH
GSD
ELG
ELG
SDE
LGLD
EC
oars
enes
sC
ompl
exity
Stre
ngth
Con
trast
Busy
ness
0.5
0.85
1
CCC
GLCM
GLDZM
GLRLM
GLSZM
NGLDM
NGTDM
Statistics
20 30 40 50 60 70 80 90 100
110
120
130
20 30 40 50 60 70 80 90 100
110
120
130
20 30 40 50 60 70 80 90 100
110
120
130
20 30 40 50 60 70 80 90 100
110
120
130

PART II | Chapter 4
149
4
Supp
l.Material:Larue,R.eta
l.4D
CTim
agingtoassessradiomicsfeaturestability:aninvestigationfortho
raciccancers.
Radiotherapyand
Oncology2017.
28
1Sha
peM
ajor
Axi
s Le
ngth
Max
Dia
met
er 3
DM
ax D
iam
eter
2D
2M
ax D
iam
eter
2D
3Vo
lum
eM
ax D
iam
eter
2D
1Su
rface
Leas
t Axi
s Le
ngth
Min
or A
xis
Leng
thSu
rface
Vol
ume
Rat
ioSp
ere
Dis
prop
Asph
eric
ityEl
onga
tion
Sphe
ricity
Cen
troid
Dis
tanc
eC
ompa
ctne
ss 1
Com
pact
ness
3Fl
atne
ssC
ompa
ctne
ss 2
1Sta
tistic
sEn
ergy
Tot.
Ener
gyM
axR
ange
STD
Skew
ness
Varia
nce
Entro
pyU
nifo
rmity
Mea
n D
ev.
Kurto
sis
IQR
Min
RM
SM
ean
Dev
.R
MD
P90
Med
ian
P10
GLC
MH
omog
enei
ty 2
Diff
. Var
ianc
eC
ontra
stH
omog
enei
ty 1
Inve
rse
Varia
nce
IMC
1D
issi
mila
rity
Diff
. Ave
rage
Clu
ster
Sha
deD
iff. E
ntro
py MP
Ener
gyEn
tropy
Varia
nce
Clu
ster
Pro
min
ence
IMC
2Su
m E
ntro
pySu
m V
aria
nce
Clu
ster
Ten
denc
yID
NC
orre
latio
nID
MN
Auto
corre
latio
nSu
m A
vera
geAv
erag
eM
CG
LDZM
DZV
LDE IN
DZE
DZN ZP
SDE IV
HIL
DE
DZN
NIN
NH
IE LIE
LISD
EH
ISD
ELI
LDE
GLR
LMG
LNR
LN RLV
LRE
RP
SRE
RLN
NG
LV RE
GLN
NLR
HG
EH
GR
ESR
HG
ELG
RE
SRLG
ELR
LGE
GLS
ZMSZ
VLA
E INSZ
N IV ZE ZPH
ILAE IN
NLI
LAE
HIE
HIS
AE LIE
LISA
ESZ
NN
SAE
NG
LDM
GLN SM LD
ED
ND
VD
NN
SDE
HG
LDE
GLV
GLN
ND
EH
GE
HG
SDE
LGE
LGSD
ELG
LDE
NG
TDM
Coa
rsen
ess
Com
plex
itySt
reng
thC
ontra
stBu
syne
ss
0.5
0.85
1
CCC
Maj
or A
xis
Leng
thM
ax D
iam
eter
3D
Max
Dia
met
er 2
D2
Max
Dia
met
er 2
D3
Volu
me
Max
Dia
met
er 2
D1
Surfa
ceLe
ast A
xis
Leng
thM
inor
Axi
s Le
ngth
Surfa
ce V
olum
e R
atio
Sper
e D
ispr
opAs
pher
icity
Elon
gatio
nSp
heric
ityC
entro
id D
ista
nce
Com
pact
ness
1C
ompa
ctne
ss 3
Flat
ness
Com
pact
ness
2En
ergy
Tot.
Ener
gyM
axR
ange
STD
Skew
ness
Varia
nce
Entro
pyU
nifo
rmity
Mea
n D
ev.
Kurto
sis
IQR
Min
RM
SM
ean
Dev
.R
MD
P90
Med
ian
P10
Hom
ogen
eity
2D
iff. V
aria
nce
Con
trast
Hom
ogen
eity
1In
vers
e Va
rianc
eIM
C1
Dis
sim
ilarit
yD
iff. A
vera
geC
lust
er S
hade
Diff
. Ent
ropy M
PEn
ergy
Entro
pyVa
rianc
eC
lust
er P
rom
inen
ceIM
C2
Sum
Ent
ropy
Sum
Var
ianc
eC
lust
er T
ende
ncy
IDN
Cor
rela
tion
IDM
NAu
toco
rrela
tion
Sum
Ave
rage
Aver
age
MC
DZV
LDE IN
DZE
DZN ZP
SDE IV
HIL
DE
DZN
NIN
NH
IE LIE
LISD
EH
ISD
ELI
LDE
GLN
RLN RLV
LRE
RP
SRE
RLN
NG
LV RE
GLN
NLR
HG
EH
GR
ESR
HG
ELG
RE
SRLG
ELR
LGE
SZV
LAE IN
SZN IV ZE ZP
HIL
AE INN
LILA
EH
IEH
ISAE LI
ELI
SAE
SZN
NSA
EG
LN SM LDE
DN
DV
DN
NSD
EH
GLD
EG
LVG
LNN
DE
HG
EH
GSD
ELG
ELG
SDE
LGLD
EC
oars
enes
sC
ompl
exity
Stre
ngth
Con
trast
Busy
ness
0.5
0.85
1
CCC
Wav
elet
LLL
Wav
elet
LLH
Wav
elet
LH
LW
avel
et L
HH
1Sha
peM
ajor
Axi
s Le
ngth
Max
Dia
met
er 3
DM
ax D
iam
eter
2D
2M
ax D
iam
eter
2D
3Vo
lum
eM
ax D
iam
eter
2D
1Su
rface
Leas
t Axi
s Le
ngth
Min
or A
xis
Leng
thSu
rface
Vol
ume
Rat
ioSp
ere
Dis
prop
Asph
eric
ityEl
onga
tion
Sphe
ricity
Cen
troid
Dis
tanc
eC
ompa
ctne
ss 1
Com
pact
ness
3Fl
atne
ssC
ompa
ctne
ss 2
1Sta
tistic
sEn
ergy
Tot.
Ener
gyM
axR
ange
STD
Skew
ness
Varia
nce
Entro
pyU
nifo
rmity
Mea
n D
ev.
Kurto
sis
IQR
Min
RM
SM
ean
Dev
.R
MD
P90
Med
ian
P10
GLC
MH
omog
enei
ty 2
Diff
. Var
ianc
eC
ontra
stH
omog
enei
ty 1
Inve
rse
Varia
nce
IMC
1D
issi
mila
rity
Diff
. Ave
rage
Clu
ster
Sha
deD
iff. E
ntro
py MP
Ener
gyEn
tropy
Varia
nce
Clu
ster
Pro
min
ence
IMC
2Su
m E
ntro
pySu
m V
aria
nce
Clu
ster
Ten
denc
yID
NC
orre
latio
nID
MN
Auto
corre
latio
nSu
m A
vera
geAv
erag
eM
CG
LDZM
DZV
LDE IN
DZE
DZN ZP
SDE IV
HIL
DE
DZN
NIN
NH
IE LIE
LISD
EH
ISD
ELI
LDE
GLR
LMG
LNR
LN RLV
LRE
RP
SRE
RLN
NG
LV RE
GLN
NLR
HG
EH
GR
ESR
HG
ELG
RE
SRLG
ELR
LGE
GLS
ZMSZ
VLA
E INSZ
N IV ZE ZPH
ILAE IN
NLI
LAE
HIE
HIS
AE LIE
LISA
ESZ
NN
SAE
NG
LDM
GLN SM LD
ED
ND
VD
NN
SDE
HG
LDE
GLV
GLN
ND
EH
GE
HG
SDE
LGE
LGSD
ELG
LDE
NG
TDM
Coa
rsen
ess
Com
plex
itySt
reng
thC
ontra
stBu
syne
ss
0.5
0.85
1
CCC
Maj
or A
xis
Leng
thM
ax D
iam
eter
3D
Max
Dia
met
er 2
D2
Max
Dia
met
er 2
D3
Volu
me
Max
Dia
met
er 2
D1
Surfa
ceLe
ast A
xis
Leng
thM
inor
Axi
s Le
ngth
Surfa
ce V
olum
e R
atio
Sper
e D
ispr
opAs
pher
icity
Elon
gatio
nSp
heric
ityC
entro
id D
ista
nce
Com
pact
ness
1C
ompa
ctne
ss 3
Flat
ness
Com
pact
ness
2En
ergy
Tot.
Ener
gyM
axR
ange
STD
Skew
ness
Varia
nce
Entro
pyU
nifo
rmity
Mea
n D
ev.
Kurto
sis
IQR
Min
RM
SM
ean
Dev
.R
MD
P90
Med
ian
P10
Hom
ogen
eity
2D
iff. V
aria
nce
Con
trast
Hom
ogen
eity
1In
vers
e Va
rianc
eIM
C1
Dis
sim
ilarit
yD
iff. A
vera
geC
lust
er S
hade
Diff
. Ent
ropy M
PEn
ergy
Entro
pyVa
rianc
eC
lust
er P
rom
inen
ceIM
C2
Sum
Ent
ropy
Sum
Var
ianc
eC
lust
er T
ende
ncy
IDN
Cor
rela
tion
IDM
NAu
toco
rrela
tion
Sum
Ave
rage
Aver
age
MC
DZV
LDE IN
DZE
DZN ZP
SDE IV
HIL
DE
DZN
NIN
NH
IE LIE
LISD
EH
ISD
ELI
LDE
GLN
RLN RLV
LRE
RP
SRE
RLN
NG
LV RE
GLN
NLR
HG
EH
GR
ESR
HG
ELG
RE
SRLG
ELR
LGE
SZV
LAE IN
SZN IV ZE ZP
HIL
AE INN
LILA
EH
IEH
ISAE LI
ELI
SAE
SZN
NSA
EG
LN SM LDE
DN
DV
DN
NSD
EH
GLD
EG
LVG
LNN
DE
HG
EH
GSD
ELG
ELG
SDE
LGLD
EC
oars
enes
sC
ompl
exity
Stre
ngth
Con
trast
Busy
ness
0.5
0.85
1
CCC
GLCM
GLDZM
GLRLM
GLSZM
NGLDM
NGTDM
Statistics
20 30 40 50 60 70 80 90 100
110
120
130
20 30 40 50 60 70 80 90 100
110
120
130
20 30 40 50 60 70 80 90 100
110
120
130
20 30 40 50 60 70 80 90 100
110
120
130


L. Van De Voorde, L. Janssen, R. Larue, R. Houben, J. Buijsen, M. Sosef, B. Vanneste, M.-C. Schraepen, M. Berbée, P. Lambin
Chapter 5
Can metformin improve ‘the tomorrow’ of patients
treated for oesophageal cancer?
European Journal of Surgical Oncology 2015; 41 : 1333-1339
PART II | Chapter 5
152
ABSTRACT
IntroductionRecent studies suggest that the use of metformin is associated with reduced cancer incidence and improved prognosis in patients with oesophageal cancer. We explored the relationship between the use of metformin and outcome (pathologic response rate, distant metastasis-free and overall survival) in our mono-institutional cohort of patients treated for oesophageal cancer.
Material and methodsBetween 2008 and 2014, a total of 196 patients with oesophageal cancer (ages ranged from 37 to 82 years) eligible for curative treatment entered the study. Patients were categorized as non-diabetic (n = 172), diabetic not taking metformin (n = 5) or diabetic taking metformin (n = 19). The majority of patients were treated with trimodality therapy (n = 189). Pathologic response was graded according to Mandard’s tumour regression score at the time of surgery. Distant metastasis-free and overall survival were calculated using the Kaplan–Meier method with log rank comparisons performed to determine significance.
ResultsThe overall pathologic complete response rate for the study population was 26%. It was 25% for patients not using metformin and 39% for diabetics taking metformin (p = 0.260). The two-year overall survival rate for the whole group was 59%. Use of metformin was associated with a significantly better distant metastasis-free survival rate (p = 0.040) or overall survival rate (p = 0.012). Multivariate analysis using Cox regression found that metformin treatment significantly prolonged survival (p = 0.043).
ConclusionIn our population-based study, the use of metformin was associated with an improved overall and distant metastasis-free survival rate in patients with oesophageal cancer. These data are complementary to one other clinical study and warrant further prospective study.
Keywords: Oesophageal cancer, Diabetes, Metformin, Survival

PART II | Chapter 5
153
5
INTRODUCTION
Oesophageal carcinoma is the eighth most common cancer worldwide and is known for its aggressive nature and poor survival rate.1 Adenocarcinoma of the oesophagogastric junction (AEG) is increasingly common in the Western world and its prevalence now equals or surpasses that of squamous cell carcinoma (SCC).2 Research has suggested that a high body mass index (BMI) is a major risk factor for the development of AEG.3 The exact underlying pathomechanism is unclear, but over recent years chronic inflammation accompanying obesity has come to be seen as a crucial contributing factor.4 The visceral adipose tissue is a sink of a high amount of systemically active cytokines and adipo-cytokines which act as pro-inflammatory mediators, initiating the metaplasia-dysplasia-adenocarcinoma sequence.5 In addition to high BMI, type 2 diabetes has also become alarmingly common worldwide, sharing the same dual relationship with cancer incidence or mortality.6
Metformin (1,1-dimethylbiguanide hydrochloride) belongs to the biguanide class of oral antidiabetic drugs originally derived from galegine (isoamylene guanide), a guanidine derivative found in the French lilac Galega officinalis. This drug is typically used in the treatment of people with type 2 diabetes who also have obesity. Long-term use of this drug has been associated with reduced risks for some cancer types and improved cancer prognosis.7–9
At the molecular level, the exact mechanism for its anticancer effect is rather complicated and not fully clear. Encouraging results from preclinical data have indicated that metformin may prevent the development of oesophageal cancer.10 Moreover, emerging clinical data suggests that cancer patients who take metformin have a better treatment response than those who do not.11,12 Only one retrospective study has addressed the question of whether metformin, in conjunction with a standard neoadjuvant approach, could also improve complete remission and outcome in oesophageal cancer.12 Therefore, the objective of this single-institution retrospective study was to investigate the effect of metformin on the outcomes in our oesophageal cancer patient cohort.
MATERIAL AND METHODS
Patient selectionTwo independent researchers reviewed clinical data about our patients who were treated with curative intent for oesophageal cancer between 2008 and 2014. A total of 196 patients met these criteria, of which 189 (96%) received neoadjuvant chemoradiotherapy (CRT). Only 7 (3%) had clinical stage cT1N0M0 disease and underwent primary surgical treatment.
All patients received initial staging with oesophagogastroscopy and biopsies, endoscopic ultrasound and positron emission tomography computed tomography

PART II | Chapter 5
154
(PET-CT). Staging was done in accordance with the American Joint Committee on Cancer TNM classification, 7th Edition. The standard neoadjuvant approach was to apply radiotherapy to the tumour and draining lymph nodes. Chemoradiotherapy consisted of 50.4 Gy combined with two cycles of cisplatin and 5-FU or 41.4 Gy combined with five cycles of carboplatin and paclitaxel.13 All patients were treated with external beam radiation, using three-dimensional conformal radiation technique or Volumetric Modulated Arc Therapy (RapidArc). Re-evaluation with PET-CT was planned 6–8 weeks after CRT, followed by en-bloc-oesophagectomy with regional node dissection. Pathologic complete response (pCR) was defined as a tumour regression grade I based on the Mandard classification. In addition, the absence of tumour cells in sampled lymph nodes was necessary to fulfill the definition.
Patients were categorized as non-diabetic (n = 172), diabetic not taking metformin (n = 5) or diabetic taking metformin (n = 19). Classification of diabetes was based on pre-existing diagnosis prior to CRT. From the computer records, we identified all the patients’ medical prescriptions. We also did an additional manual search of the patients’ pharmacy records or charts to verify our data about the use of any antidiabetic medications (metformin, sulfonylurea, alfa-glucosidase inhibitors, thiazolidinediones, meglitinides, dipeptidyl peptidase-4 inhibitors and insulin). We determined the cumulative daily use of metformin from prescription records found in electronic medical records or from self-reported records from the outpatient clinic. Pre-treatment height and weight were used to generate a pre-treatment BMI. Data were censored for analysis on 28 February 2015.
StatisticsAll statistical analyses were conducted using SPSS (v.22). Univariate comparisons of patient characteristics between patients with or without metformin use were performed using a Pearson’s Chi-square test for comparison of categorical data like sex or T stage and a Student’s T-test for continuous data like age and BMI.Pathologic complete response (pCR), overall survival (OS) and distant metastasis-free survival (DMFS) were the primary endpoints of this study. With respect to pCR, univariate analyses (either Pearson Chi-square or Student’s T-test) were performed with the following variables: metformin use, age, BMI, tumour and nodal classification and histopathological subtype. Any variable with a significance of p ≤ 0.1 was included in the multivariate analysis. Multivariate analysis was performed with logistic regression. All p-values for multivariate analysis are two-sided, with a p < 0.05 considered significant.
For DMFS and OS, time-to-event was calculated from the first day of radiation treatment or, when no neoadjuvant treatment was initiated, from the date of surgery until an event occurred or was censored. Event for DMFS was defined as recurrence of disease at distant sites or non-regional lymph nodes. These metastases were identified on computed tomography (with or without positron emission tomography) or chest X-ray. Pathologic confirmation of distant metastasis was not always available when evident. Event for OS was defined as death due to any cause. OS and DMFS were

PART II | Chapter 5
155
5
calculated using the Kaplan–Meier statistic, and log rank comparisons were performed to determine significance in univariate analyses for categorical predictors. Univariate analyses for continuous variables were performed using Cox proportional hazards regression. Any variable with a significance of p ≤ 0.1 was included in the multivariate analysis. Multivariate analysis for DMFS and OS was performed with Cox proportional hazards regression. All p-values for multivariate analyses are two-sided, with a p < 0.05 considered significant.
RESULTS
Patient and tumour characteristicsOf the 196 patients who were eligible for analysis, 10% (n = 19) had used metformin before and during their treatment. Detailed characteristics of cases and controls are summarized in Table 1. Thirteen patients had a daily intake of more than 850 mg of metformin, compared to six patients with an intake less than or equal to 850 mg.The mean age of the whole patient population was 63 years (range 37–82 years). The majority of patients were diagnosed with adenocarcinoma (78%), clinical stage T3 (68%) and N0–N1 stage (80%). Only BMI, measured as a continuous variable, was significantly different for both treatment groups (p = 0.004).
Pathologic complete responseOf the 189 patients who received neoadjuvant CRT, 50 (26%) were found to have a pCR at the time of surgical resection (Table 2). A pCR was reached for 18 out of 38 patients with SCC (47%) while for adenocarcinoma this percentage was considerably lower (21% or 31 out of 148 patients).For the metformin group, this percentage was 39% and for the non-metformin group it was 25%. The univariate analysis of our study cohort revealed that metformin treatment did not result in a significantly increased pCR rate (p = 0.260). Tumour characteristics that did significantly influence pCR rate were N stage (p = 0.026) or N category (N0/1 vs N2/3, p = 0.010) and SCC (p = 0.004). Controlling for these three factors, the pCR effect was only significant in favour of SCC (p = 0.001; HR 0.393; 95% CI 0.133–0.620) but not for metformin (p = 0.139; HR 0.546; 95% CI 0.769–6.538).
Distant metastasis-free survivalWe report a 30-month median follow-up for DMFS (95% CI 24–35 months). One-, two- and five-year DMFS for the whole group were 84.5%, 72.1% and 71%, respectively (Table 2). Median DMFS was not reached for the whole group and both subgroups. One- and two-year DMFS for the non-metformin patients were 82.1% and 69.6%, respectively, compared to 100% and 93.3% for the metformin group (p = 0.040; Figure 1). On a multivariate analysis, metformin use was no longer significantly associated with improved DMFS (p = 0.082, HR 1.014; 95% CI 0.024–1.253).

PART II | Chapter 5
156
Survival outcomesMedian follow-up for OS in our patient cohort was 51 months (95% CI 44–57 months). Median OS for the whole study population was 34 months (95% CI 18.6–49.3 months (Table 2). One-, two- and five-year OS rates for the whole patient cohort were 78.7%, 59.1% and 44.8%, respectively. They were 77%, 56.5% and 41%, respectively, for the non-metformin group and 94.7%, 82.9% and 74.6%, respectively, for the metformin group. In the non-metformin group, median OS was 32 months (95% CI 18–46 months). In the metformin group, median OS had not been reached at the time of analysis.
From the univariate analysis, we found that the following characteristics influence OS: metformin use (p = 0.012; Figure 2), cN stage (p = 0.044), Mandard tumour regression grade (p = 0.001) and BMI as a continuous variable (p = 0.012). Patients whose BMI was 30 or higher had a better OS rate (p = 0.041). We performed multivariate Cox regression analysis to evaluate the influence of these variables and found metformin was the only prognostic factor for OS (p = 0.043; HR 0.352; 95 CI 0.128–0.969).
Table 1. Baseline characteristics between groups
Variable No metformin
Metformin P-value
N % N %
Number 177 90.3 19 9.7
Sex Female Male
35142
19.880.2
316
15.884.2
0.772
Age Mean (min-max) 63 (37-82) 64 (51-76)
0.314
Type carcinoma Adenocarcinoma Squamous cell Other
137364
77.420.32.3
1630
84.215.80
0.847
cT stage T1 T2 T3 T4
6421236
3.423.769.53.4
17110
5.336.857.90
0.470
cN stage N0 N1 N2 N3
57812415
32.245.813.58.5
10810
52.642.15.30
0.131
Neoadjuvant CRT Yes No
1716
96.83.4
181
94.75.3
0.676
BMI Mean (min-max) ≤30 >30
25 (15-40)15225
85.914.1
28 (20-36)136
68.431.6
0.004
0.089

PART II | Chapter 5
157
5
DISCUSSION
The renewed interest in the Warburg effect and cancer energetics emphasizes the dependence of many cancers on glycolysis for energy.14 Metformin, a first-line diabetes drug, inhibits gluconeogenesis and increases glucose uptake and peripheral glycolysis. Several epidemiological studies explored the role of metformin as a chemopreventive agent to decrease the risk of various types of cancer.8 Metformin may not only reduce cancer incidence, but may also alter the behaviour of present cancer cells. In our opinion, the possibility that metformin use hampers neoplastic proliferation and thereby improves outcome for oesophageal cancer patients deserved further consideration.
To our knowledge, this study is the first to assess the survival benefit of metformin intake in oesophageal cancer patients. Both univariate and multivariate analysis confirmed that survival was significantly better for patients using metformin. Exposure to this biguanide was also associated with an improved DMFS, but did not affect the results of the multivariate analysis. Although pCR was not statistically significantly better among metformin users, there was a trend towards higher pCR rates in favour of metformin intake. The only factor influencing pCR rate was squamous cell cancer, which was in line with the observation of Van Hagen et al.13 A remarkable finding in this study was the observation that a higher BMI correlates with an improved OS rate on univariate analysis. In the literature, the influence of a high BMI on long-term survival has been investigated with contradictory results. Some authors have described an improved overall and disease-free survival rate in obese patients, while others have
Table 2. Impact of metformin on outcome
All patients(n=196)
No metformin(n=177)
Metformin(n=19)
Univariate analysisp-value
pCR n events (%)* 50 (26)* 43 (25)* 7 (39)* 0.260*
DMFS n events median, months12-month DMFS,%24-month DMFS, % 60-months DMFS, %
45NR84.572.171
44NR82.169.668.2
1NR10093.393.3
0.040
OSn deathsmedian, months12-month OS,%24 month OS, % 60-month OS, %
933478.7 59.144.8
89327756.541
4NR94.782.974.6
0.012
Abbreviations: pCR= pathologic complete response, DMFS=distant metastasis-free survival, OS= overall survival, n= number, NR= not reached*pCR was calculated for patients treated with neoadjuvant chemoradiotherapy (n=189) without (n= 171) or with (n=18) metformin.

PART II | Chapter 5
158
reported no marked differences compared to patients with a normal BMI.15–17 Since we do not exactly know which molecular pathways dominate the promotion of obesity-related oesophageal cancer, a variety of questions still remain unanswered.
In the literature, there is only one other retrospective observational study investigating the effect of metformin in oesophageal cancer: Skinner et al.12 looked at patients with oesophageal adenocarcinoma treated with neoadjuvant CRT. They found that metformin use was associated with an increased pCR rate compared to non-users of metformin. This may be explained by the fact that metformin together with 5-fluorouracil can cause a synergistic reduction in tumour growth by targeting cancer stem cells and the components of the mammalian target of rapamycin (mTOR) pathway (Figure 3).18 The mTOR protein is a key protein that regulates processes of cell growth and angiogenesis, and promotes cell division and protein synthesis.19 Other studies have also suggested immunological or anti-inflammatory actions.20 As these mechanisms may affect both local and distant response to anti-cancer treatments, these mechanisms could clarify the improved pCR rate found by Skinner et al.12 as well as the improved overall survival rate found in our study.
Consistent with our results, recent population studies reinforced the use of metformin to reduce cancer-related mortality in different types of cancer: head and neck cancer,21,22 lung cancer,23–25 breast cancer,26,27 gastrointestinal cancer,28–31 gynaecological cancer32,33 and prostate cancer.34,35 Other retrospective studies report less encouraging results
Figure 1. Kaplan–Meier distant metastasis-free survival curves comparing patients treated with metformin versus without metformin.

PART II | Chapter 5
159
5
and only tentative conclusions of the true effect of metformin can be drawn.36–38
The strength of our study is that we were able to study a large number of patients with oesophageal cancer in a well-established primary care database of high quality and completeness. Comparing other clinical studies of metformin use in cancer patients, their percentage of metformin intake is in the same range as our reported institutional rate (10%). When combined with the results from Skinner et al.12 our clinical data suggest the need for a prospective trial to evaluate the effect of metformin on outcome.
Our study had several limitations. One is its retrospective nature and the fact that we had no insight into the strict drug-compliance and the severity of patients’ type 2 diabetes. We did not examine a dose-effect and treatment duration relationship for metformin as our sample size was too small.39 Other potential chemopreventive medications which are associated with a reduced risk of oesophageal cancer e.g. nonsteroidal anti-inflammatory drugs or statins were not co-investigated.40 Locoregional controle rate was not assessed because the lack of objective and accurate information of the anastomotic site e.g. endoscopy and biopsy.
As the genetic make-up of oesophageal cancer patients is expected to be different in different geographic treatment populations, our results may not be applicable to other populations.18 It is for example known that the anti-tumour effects or enhanced radiosensitivity of metformin may be limited to tumours with tumour protein 53 (p53)
Figure 2. Survival analysis Kaplan-Meier plots comparing patients treated with metformin versus without metformin.

PART II | Chapter 5
160
gene mutations. Although the loss of p53 confers a selective growth advantage to cancer cells, it impairs their ability to respond to metabolic changes induced by metformin and to survive when there is glucose limitation.41,42
Figure 3 summarizes the anticancer effects of metformin in oesophageal tumour cells. One mechanism may be indirect where metformin alters the endocrine-metabolic milieu of the host in a way that may influence oesophageal cancer. The drug gets into the liver and prevents gluconeogenesis. Consequently, levels of mitogens like insulin and insulin growth factors are decreased with less activation of the phosphatidylinositol 3-kinase (PI3K) pathway to support cancer growth.19
A second presumed effect is that the organic cation transporters can allow metformin to accumulate directly in cancer cells, which then stops the cells from proliferating. This could be arranged by inhibiting several targets in the mitochondria (e.g. complex I of oxidative phosphorylation). In vitro studies point to its activation of a molecular regulator of cell metabolism called 5′ adenosine monophosphate-activated protein kinase (AMPK) with consequent downstream inhibition of mTOR signalling in both oesophageal squamous cells and oesophageal adenocarcinoma cell lines in vitro.18 Other AMPK-related downstream effects are suppression of the fatty acid and cholesterol synthesis which is necessary for tumour survival.19 There are also alternative pathways by which metformin downregulates mTOR independent of AMPK or reduces
Figure 3. Potential dual anti-cancer effect of metformin: Indirect by reduced hepatic gluconeogenesis with lower, circulating insulin levels. Direct by activation of AMPK through inhibition of complex I of the mitochondrial respiratory chain. Other cell cycle mediators may also be intracellular targets of metformin independent of AMPK activation.

PART II | Chapter 5
161
5
cellular oxygen consumption by inhibiting the mitochondrial respiratory chain.43 This metformin-induced tumour re-oxygenation could improve radiation-induced tumour growth delay.44
Less studied direct anticancer effects of metformin include the reduction of cyclines D1 and E, increased ubiquitin-specific-processing protease 7 (USP7), cell cycle arrest, increased autophagy and effects on CD8+ tumour-infiltrating lymphocytes and cancer stem cells.4,20
Given the low cost, general availability and low side effects of this drug, investigating the role of metformin on a broad scale is justified. Numerous preclinical findings have encouraged more than 100 registered clinical trials on the effect of metformin in cancer patients, including prevention, adjuvant treatment and palliative treatment (cfr. on the NIH ClinicalTrials.gov web site).45 Until now, no prospective study about its use in the secondary prevention in oesophageal cancer has been registered. The right clinical trial in oesophageal cancer would include a high number of patients from different geographic regions, an exact knowledge of insulin levels, the insulin receptor, organic cation transporters status, pharmacokinetic study and a signature of mitochrondrial and glycolytic metabolic functions on biopsy. The increasing use of (18)F-2-fluoro-2-deoxy-d-glucose positron emission tomography (FDG-PET) in cancer evaluation will consequently raise a number of questions about the possible modulation of metformin on FDG distribution. The effect of metformin on FDG-PET image intensity is difficult to predict, as drugs with anti-proliferative activity generally decrease FDG uptake, but agents capable of activating AMPK in tumors would be expected to increase FDG uptake.46 Collecting prospective data in this setting will help to verify whether FDG-PET can be a valid tool to assess the anticancer effect of this new therapeutic approach.47 All this information could help us understand the complex working mechanism of metformin on oesophageal cancer cells and select those patients who could potentially benefit from its use.
In summary, although the association between metformin use and oesophageal cancer outcome remains uncertain and the exact underlying molecular mechanism is yet to be revealed, our study provides arguments in favour of further research on metformin and its impact on prognosis. The good safety profile of this drug creates a window of opportunity for selecting metformin for drug repurposing especially in a growing elderly population.
Disclosure statementThe authors have nothing to disclose.
Conflict of interestNone declared.

PART II | Chapter 5
162
REFERENCES
1. Ferlay J., Shin H.R., Bray F., et al: Estimates of worldwide burden of cancer in 2008: Globocan 2008. Int J Cancer 2010; 127: pp. 2893-2917 2. Dikken J.L., Lemmens V.E., Wouters M.W., et al: Increased incidence and survival for oesophageal cancer but not for gastric cardia cancer in the netherlands. Eur J Cancer 2012; 48: pp. 1624-1632
3. Ryan A.M., Duong M., Healy L., et al: Obesity, metabolic syndrome and esophageal adenocarcinoma: epidemiology, etiology and new targets. Cancer Epidemiol 2011; 35: pp. 309-319
4. Miyashita T., Tajima H., Shah F.A., et al: Impact of inflammation-metaplasia-adenocarcinoma sequence and inflammatory microenvironment in esophageal carcinogenesis using surgical rat models. Ann Surg Oncol 2014; 21: pp. 2012-2019
5. Tilg H., and Moschen A.R.: Mechanisms behind the link between obesity and gastrointestinal cancers. Best Pract Res Clin Gastroenterol 2014; 28: pp. 599-610
6. Giovannucci E., Harlan D.M., Archer M.C., et al: Diabetes and cancer: a consensus report. Diabetes Care 2010; 33: pp. 1674-1685
7. Ben Sahra I., Le Marchand-Brustel Y., Tanti J.F., and Bost F.: Metformin in cancer therapy: a new perspective for an old antidiabetic drug? Mol Cancer Ther 2010; 9: pp. 1092-1099
8. Decensi A., Puntoni M., Goodwin P., et al: Metformin and cancer risk in diabetic patients: a systematic review and meta-analysis. Cancer Prev Res (Phila) 2010; 3: pp. 1451-1461
9. Noto H., Goto A., Tsujimoto T., and Noda M.: Cancer risk in diabetic patients treated with metformin: a systematic review and meta-analysis. PLoS One 2012; 7: pp. e33411
10. Becker C., Meier C.R., Jick S.S., and Bodmer M.: Case-control analysis on metformin and cancer of the esophagus. Cancer Causes Control 2013; 24: pp. 1763-1770
11. Skinner H.D., Crane C.H., Garrett C.R., et al: Metformin use and improved response to therapy in rectal cancer. Cancer Med 2013; 2: pp. 99-107
12. Skinner H.D., McCurdy M.R., Echeverria A.E., et al: Metformin use and improved response to therapy in esophageal adenocarcinoma. Acta Oncol 2013; 52: pp. 1002-1009
13. van Hagen P., Hulshof M.C., van Lanschot J.J., et al: Preoperative chemoradiotherapy for esophageal or junctional cancer. N Engl J Med 2012; 366: pp. 2074-2084
14. Garber K.: Energy boost: the warburg effect returns in a new theory of cancer. J Natl Cancer Inst 2004; 96: pp. 1805-1806
15. Blom R.L., Lagarde S.M., Klinkenbijl J.H., et al: A high body mass index in esophageal cancer patients does not influence postoperative outcome or long-term survival. Ann Surg Oncol 2012; 19: pp. 766-771
16. Grotenhuis B.A., Wijnhoven B.P., Hotte G.J., et al: Prognostic value of body mass index on short-term and long-term outcome after resection of esophageal cancer. World J Surg 2010; 34: pp. 2621-2627
17. Healy L.A., Ryan A.M., Gopinath B., et al: Impact of obesity on outcomes in the management of localized adenocarcinoma of the esophagus and esophagogastric junction. J Thorac Cardiovasc Surg 2007; 134: pp. 1284-1291
18. Honjo S., Ajani J.A., Scott A.W., et al: Metformin sensitizes chemotherapy by targeting cancer stem cells and the mtor pathway in esophageal cancer. Int J Oncol 2014; 45: pp. 567-574
19. Aljada A., and Mousa S.A.: Metformin and neoplasia: implications and indications. Pharmacol Ther 2012; 133: pp. 108-115

PART II | Chapter 5
163
5
20. Eikawa S., Nishida M., Mizukami S., et al: Immune-mediated antitumor effect by type 2 diabetes drug, metformin. Proc Natl Acad Sci U. S. A 2015; 112: pp. 1809-1814
21. Rego D.F., Pavan L.M., Elias S.T., et al: Effects of metformin on head and neck cancer: a systematic review. Oral Oncol 2015; 51: pp. 416-422
22. Sandulache V.C., Hamblin J.S., Skinner H.D., et al: Association between metformin use and improved survival in patients with laryngeal squamous cell carcinoma. Head Neck 2014; 36: pp. 1039-1043
23. Lin J.J., Gallagher E.J., Sigel K., et al: Survival of patients with stage iv lung cancer with diabetes treated with metformin. Am J Respir Crit Care Med 2015; 191: pp. 448-454
24. Mazzone P.J., Rai H., Beukemann M., et al: The effect of metformin and thiazolidinedione use on lung cancer in diabetics. BMC Cancer 2012; 12: pp. 410
25. Tan B.X., Yao W.X., Ge J., et al: Prognostic influence of metformin as first-line chemotherapy for advanced nonsmall cell lung cancer in patients with type 2 diabetes. Cancer 2011; 117: pp. 5103-5111
26. Peeters P.J., Bazelier M.T., Vestergaard P., et al: Use of metformin and survival of diabetic women with breast cancer. Curr Drug Saf 2013; 8: pp. 357-363
27. Vissers P.A., Cardwell C.R., van de Poll-Franse L.V., et al: The association between glucose-lowering drug use and mortality among breast cancer patients with type 2 diabetes. Breast Cancer Res Treat 2015; 150: pp. 427-437
28. Choi Y., Kim T.Y., Oh D.Y., et al: The impact of diabetes mellitus and metformin treatment on survival of patients with advanced pancreatic cancer undergoing chemotherapy. Cancer Res Treat 2015; undefined:
29. Garrett C.R., Hassabo H.M., Bhadkamkar N.A., et al: Survival advantage observed with the use of metformin in patients with type ii diabetes and colorectal cancer. Br J Cancer 2012; 106: pp. 1374-1378
30. Lee C.K., Jung M., Jung I., et al: Cumulative metformin use and its impact on survival in gastric cancer patients after gastrectomy. Ann Surg 2015, Jan 8; undefined:
31. Lee J.H., Kim T.I., Jeon S.M., Hong S.P., Cheon J.H., and Kim W.H.: The effects of metformin on the survival of colorectal cancer patients with diabetes mellitus. Int J Cancer 2012; 131: pp. 752-759
32. Kumar S., Meuter A., Thapa P., et al: Metformin intake is associated with better survival in ovarian cancer: a case-control study. Cancer 2013; 119: pp. 555-562
33. Nevadunsky N.S., Van Arsdale A., Strickler H.D., et al: Metformin use and endometrial cancer survival. Gynecol Oncol 2014; 132: pp. 236-240
34. Margel D., Urbach D., Lipscombe L.L., et al: Association between metformin use and risk of prostate cancer and its grade. J Natl Cancer Inst 2013; 105: pp. 1123-1131
35. Raval A.D., Thakker D., Vyas A., et al: Impact of metformin on clinical outcomes among men with prostate cancer: a systematic review and meta-analysis. Prostate Cancer Prostatic Dis 2015; 18: pp. 110-121
36. Bayraktar S., Hernadez-Aya L.F., Lei X., et al: Effect of metformin on survival outcomes in diabetic patients with triple receptor-negative breast cancer. Cancer 2012; 118: pp. 1202-1211
37. Kwon M., Roh J.L., Song J., et al: Effect of metformin on progression of head and neck cancers, occurrence of second primary cancers, and cause-specific survival. Oncologist 2015; 20: pp. 546-553
38. Patel T., Hruby G., Badani K., et al: Clinical outcomes after radical prostatectomy in diabetic patients treated with metformin. Urology 2010; 76: pp. 1240-1244

PART II | Chapter 5
164
39. But A., Wang H., Mannisto S., Pukkala E., and Haukka J.: Assessing the effect of treatment duration on the association between anti-diabetic medication and cancer risk. PLoS One 2014; 9: pp. e113162
40. Thrift A.P.: Esophageal adenocarcinoma: the influence of medications used to treat comorbidities on cancer prognosis. Clin Gastroenterol Hepatol 2015, Mar 31; undefined:
41. Buzzai M., Jones R.G., Amaravadi R.K., et al: Systemic treatment with the antidiabetic drug metformin selectively impairs p53-deficient tumor cell growth. Cancer Res 2007; 67: pp. 6745-6752
42. Skinner H.D., Sandulache V.C., Ow T.J., et al: Tp53 disruptive mutations lead to head and neck cancer treatment failure through inhibition of radiation-induced senescence. Clin Cancer Res 2012; 18: pp. 290-300
43. Ben Sahra I., Regazzetti C., Robert G., et al: Metformin, independent of ampk, induces mtor inhibition and cell-cycle arrest through redd1. Cancer Res 2011; 71: pp. 4366-4372 44. Zannella V.E., Dal Pra A., Muaddi H., et al: Reprogramming metabolism with metformin improves tumor oxygenation and radiotherapy response. Clin Cancer Res 2013; 19: pp. 6741-6750
45. National Institutes of Health NIH Clinical Research Trials. Available from: URL: http://www.nih.gov/health/clinicaltrials/index.htm.
46. Mashhedi H., Blouin M.J., Zakikhani M., et al: Metformin abolishes increased tumor (18)f-2-fluoro-2-deoxy-d-glucose uptake associated with a high energy diet. Cell Cycle 2011; 10: pp. 2770-2778
47. Capitanio S., Marini C., Sambuceti G., and Morbelli S.: Metformin and cancer: technical and clinical implications for fdg-pet imaging. World J Radiol 2015; 7: pp. 57-60

165


Exploiting hypoxia in oesophageal cancer
PART III


Jurgen Peerlings*, Lien Van De Voorde*, Cristina Mitea, Ruben Larue, Ala Yaromina, Sebastian Sandeleanu, Linda Spiegelberg, Ludwig Dubois,
Philippe Lambin, Felix M. Mottaghy
*Equal contributors
Hypoxia and hypoxia response-associated molecular
markers in esophageal cancer: A systematic review
Methods 2017 Nov 1; 130: 51-62
Chapter 6

PART III | Chapter 6
170
ABSTRACT
PurposeIn this systematic review, the existing evidence of available hypoxia-associated molecular response biomarkers in esophageal cancer (EC) patients is summarized and set into the context of the role of hypoxia in the prediction of esophageal cancer, treatment response and treatment outcome.
MethodsA systematic literature search was performed in Web of Science, MEDLINE, and PubMed databases using the keywords: hypoxia, esophagus, cancer, treatment outcome and treatment response. Eligible publications were independently evaluated by two reviewers. In total, 22 out of 419 records were included for systematic review. The described search strategy was applied weekly, with the last update being performed on April 3rd, 2017.
ResultsIn esophageal cancer, several (non-)invasive biomarkers for hypoxia could be identified. Independent prognostic factors for treatment response include HIF-1α, CA IX, GLUT-1 overexpression and elevated uptake of the PET-tracer 18F-fluoroerythronitroimidazole (18F-FETNIM). Hypoxia-associated molecular responses represents a clinically relevant phenomenon in esophageal cancer and detection of elevated levels of hypoxia-associated biomarkers and tends to be associated with poor treatment outcome (i.e., overall survival, disease-free survival, complete response and local control).
ConclusionEvaluation of tumor micro-environmental conditions, such as intratumoral hypoxia, is important to predict treatment outcome and efficacy. Promising non-invasive imaging-techniques have been suggested to assess tumor hypoxia and hypoxia-associated molecular responses. However, extensive validation in EC is lacking. Hypoxia-associated markers that are independent prognostic factors could potentially provide targets for novel treatment strategies to improve treatment outcome. For personalized hypoxia-guided treatment, safe and reliable makers for tumor hypoxia are needed to select suitable patients.
Keywords: Hypoxia, Esophagus, Oncology, Treatment outcome,Survival

PART III | Chapter 6
171
6
1. INTRODUCTION
Hypoxia is one of the hallmarks of cancer and has been associated with a more aggressive tumor phenotype, a higher likelihood of metastatic progression and resistance to (chemo)radiotherapy [1]. Hypoxia occurs when tissue oxygen demand (e.g., increased metabolism) exceeds oxygen supply (e.g., acute and/or chronic vascular changes, anemia, malfunctioning hemoglobin). In normal tissue, acute hypoxia (i.e., perfusion-limited) is resolved by physiological homeostasis while in cancerous tissue, additional chronic hypoxia (i.e., diffusion-limited) is more likely to manifest. The rapid and uncontrollable tumor growth requires large amounts of nutrients and therefore triggers neo-angiogenesis. However, the resulting tumor neo-vasculature is highly chaotic and inefficient. Oxygenation of tumor regions surrounding perfused blood vessels therefore depends on a diffusion-gradient, relative to the intravascular oxygen partial pressure (pO2). Generally, the diffusion-gradient is limited to 100–180 µm, thus inducing chronic hypoxia in remote regions [1].
Clinically, hypoxia is thought to be a key factor contributing to treatment resistance and poor patient prognosis [2]. Although neoadjuvant therapy (i.e., CROSS regimen with weekly carboplatin (2 mg/ml/min AUC) and paclitaxel (50 mg/m2) for 5 weeks,
CONTENTS
1. Introduction2. Material and methods 2.1. Systematic search strategy 2.2. Study selection 2.3. Data extraction3. Results 3.1. Literature search 3.2. Data extraction 3.2.1. Hypoxia-inducible factor (HIF) 3.2.2. Carbonic Anhydrase (CA IX) 3.2.3. Other hypoxia-associated markers 3.2.4. Non-invasive imaging techniques4. Discussion5. Conclusion Disclosure of interest Funding Appendix A A1. Systematic search protocol Research question Search strategy Inclusion criteria Exclusion criteria Data extraction References

PART III | Chapter 6
172
concurrent radiotherapy (41.4 Gy in 23 fractions, 5 days per week), followed by surgery) has been proven to be valuable in esophageal cancer (EC), prognosis remains dismal with approximately 20% complete responders (5 yr overall survival = 20–30% [3,4]), making EC the sixth most lethal cancer type in 2012, worldwide [5]. In 2016, over 15.000 patients died from EC in the USA alone [5]. Most EC contain hypoxic areas with a higher percentage in the adenocarcinomas, potentially explaining the poor treatment outcome for these patients [6]. About half of the patients treated with definitive chemoradiation will suffer from a locoregional recurrence. For effective radiation treatment, the presence of molecular oxygen is essential. Under normoxic conditions, ionizing radiation leads to the formation of free radicals and reactive oxygen species (ROS), which can damage DNA. Free radicals produced in the critical target can be fixed in the presence of oxygen, leading to irreversible DNA damage. In hypoxic conditions however, free radicals are reduced and hypoxic regions becomes 2–3 times more radio-resistant, which may explain low rates of complete response (CR) and local control (LC) [1,7]. Accordingly, patients with hypoxic EC might need a different, personalized treatment approach to reach therapeutic success.
Since tumor hypoxia cannot be predicted based on clinical size, stage, or grade, there is a need for molecular biomarkers that can assess hypoxic status in EC. Such biomarkers could be used to detect hypoxic tumor status at an early stage, evaluate treatment response, predict prognosis in EC patients and select patients for suitable, personalized treatment options.
In this systematic review, we provide an overview of hypoxia response-associated biomarkers in EC patients and aim to evaluate the prognostic value of elevated expression rate of hypoxia-associated biomarkers with regard to treatment outcome and efficacy [i.e., overall survival (OS), disease-free survival (DFS), CR, and LC]. Markers that are independent prognostic factors could potentially provide targets for novel treatment strategies. In addition, several known methods to improve treatment outcome will be discussed in relationship to these hypoxia-associated biomarkers.
2. MATERIAL AND METHODS
2.1. Systematic search strategyThe research question for this systematic review was defined as: “What are the known hypoxia-associated molecular markers in patients with EC and how does elevated expression associate with treatment outcome and response?”.
To consider the research question, a comprehensive PRISMA-based literature search was performed to identify relevant studies published in PubMed (National Center for Biotechnology Information, NCBI), MEDLINE (U.S. National Library of Medicine, using NCBI), or Web of Science (Thomson Reuters). The electronic databases were explored using a PICOS-based search string containing a free-text or Medical Subject Headings (MeSH) construction of 5 key search terms: ‘hypoxia’ AND ‘esophagus’ AND ‘cancer’

PART III | Chapter 6
173
6
AND (‘treatment outcome’ OR ‘treatment efficacy’). For each search term, all known synonyms and associated keywords were included in the search string using Boolean OR-operators. A detailed description of the entire search strings can be found in Appendix A1 [8]. The complete search strategy was applied weekly, with the last update being performed on April 3rd, 2017.
2.2. Study selectionArticles were eligible for inclusion when corresponding to the predetermined eligibility criteria: (1) the patient population consisted of human adults diagnosed with esophageal cancer or clinically acquired EC tissue samples; (2) the index tests were all tests able to assess tumor hypoxia; (3) treatment outcome had to be evaluated and correlated with hypoxia. Only full-text articles written in English were retrieved from the electronic databases. If full-text content was not available to us, the corresponding author was contacted to retrieve the printed publication. Next, duplicate findings were manually discarded to ensure that no data overlap occurred. Further selection was performed by applying several exclusion criteria: (1) reviews, letters, abstracts, case studies, etc.; (2) studies using only esophageal cell lines or animal-based tumor models; (3) studies aiming to investigate the molecular mechanisms of hypoxia; (4) studies that did not correlate expression rate of hypoxia-associated markers with treatment outcome or efficacy (i.e., CR, LC, OS, or DFS). Additional eligible articles were retrieved by manually cross checking reference lists of relevant articles and reviews (citation tracking). Furthermore, databases were searched to retrieve studies exploring additional methods for non-invasive hypoxia-assessment in cancer patients by performing a secondary search including the MeSH-terms ‘Hypoxia’ AND (‘MRI’ OR ‘SPECT’ OR ‘PET’ OR ‘CT’). This search was not specific for esophageal cancer and will be reviewed in the second part of this manuscript.
2.3. Data extractionTwo investigators (J.P. and L.VDV.) performed each step of this protocol independently (i.e., systematic search, defining eligibility, and data extraction). In cases of disagreement and consensus could not be reached, a third party (L.D.) was consulted to adjudicate. From the included articles, data was extracted concerning study characteristics (i.e., author, publication year), patient characteristics (i.e., number of subjects, country of origin, specimen type, tumor cell type), measurement characteristics (i.e., method of quantifying hypoxia, marker type, definition of hypoxia, percentage of hypoxic elements), and treatment strategy and response outcome characteristics (i.e., OS, DFS, CR, and LC). CR is defined as the total disappearance of a tumor, and LC as the arrest of cancer growth at the site of origin (i.e., stable tumor volume). Survival is assessed by OS, defined as the time interval from end of primary therapy until last known survival data or death, and DSF that is defined as the time interval after primary treatment and the first signs of recurrence, metastasis, or cancer-related disease. Furthermore, statistical outcome was extracted with p-values defining the prognostic/predictive

PART III | Chapter 6
174
power. P-values <0.05 indicated statistically significant differences in treatment outcome between high and low percentages of hypoxia-associated markers based on the reported threshold of hypoxia.
3. RESULTS
3.1. Literature searchAs presented in Figure 1, a total of 419 records were initially identified in Web of Science (n = 182), PubMed (n = 215) using free-text search strings and in MEDLINE (n = 22) using MeSH-terms. After imposing language-restrictions and removing duplicate findings (n = 121), 244 full-text records remained. Further screening of records’ title resulted in 85 potentially eligible studies by excluding articles that clearly stated terms did not fit the inclusion criteria (e.g., different tumor-types, reviews, meta-analyses, etc.). Next, abstracts of the remaining 85 articles were screened and based on the exclusion criteria, we excluded reviews (n = 4), papers that studied the molecular pathways of hypoxia (n = 7), and papers that did not evaluate esophageal cancer (n = 16), or treatment outcome (n = 13), or studied the effects of hypoxia (n = 14). Finally, the full-text content of 31 articles was assessed for eligibility and 11 studies were excluded for following reasons: studies had different study objective than our PICOS-based research question to assess esophageal tumor hypoxia (n = 6), the use of preclinical animal-based tumor models or esophageal cell lines (n = 4), and studies that did not allow the extraction of survival data or clinical effectiveness data (n = 1). Through citation tracking, additional papers (n = 2) were included that fitted the eligibility criteria. In total, 22 studies were included to be systematically reviewed [9–30].
3.2. Data extractionSeveral studies confirm the presence of endogenous hypoxia-associated markers in esophageal cancer patients. The clinical impact of hypoxia in treatment outcome (i.e., OS, DFS, CR, and LC) is summarized in Tables 1 and 2, respectively. In both tables, clinical impact was defined by Kaplan-Meier analyses (log-rank test) and Cox proportional hazard model (uni- and multi-variate analyses).In general, we found mainly endogenous tissue markers (HIF-1α, carbonic anhydrase IX and GLUT-1) with prognostic value and ability to predict treatment response in EC. We found only one study with non-invasive imaging including 18F-FETNIM PET which correlated hypoxia to chemoradiotherapy response in EC.

PART III | Chapter 6
175
6
Figure 1. Flowchart of information through different phases of systematic review. ‘Reasons for exclusion on full-text level were: not fitting PICOS-based research question (n=6), use of preclinical tumor models (n=4), or unsuitable to extract survival data (n=1).

PART III | Chapter 6
176
Table 1. Extracted data concerning overall survival (OS) and disease-free survival (DFS) in esophageal squamous cell carcinoma (SCC) and adenocarcinoma (AC). IHC= immunohistochemistry. (*)P-values < 0.05 indicate significant differences.
Hyp
oxia
cri
teri
a (t
hres
hold
exp
ress
ion
rate
/defi
niti
on o
f hy
poxi
a
Ref
Aut
hor
Publ
icat
ion
year
Coun
try
Spec
imen
Inde
x te
st
Mar
ker
Tum
or t
ype
# Sa
mpl
es
Hyp
oxic
sam
ple
(%)
9 Birner et al.
2011 Austria Surgical IHC CAIX > median staining intensity * staining rate
All 330 44.5%
AC 182 46.7%
SCC 148 41.9%
10 Chen et al. 2009 China Surgical IHC Beclin-2 <10% cytoplasm/cytomembrane staining
SCC 54 33.3%
HIF-1 α >mean cytotoplasmic expression
SCC 54 46.3%
Beclin-2 and HIF-1α
Low Beclin-2 and High HIF-1α
SCC 54 24.1%
11 Chiba et al. 2010 Japan Biopsy IHC GLUT-1 >30% membrane expression
SCC 25 28.1%
12 Driessen et al.
2006 The Netherlands/ Belgium
Surgical IHC CAIX >median membranous staining intensity
AC 39 49.0%
VEGF >median cytoplasmic staining intensity
AC 39 69.2%
13 Jomrich et al.
2014 Austria Surgical IHC CAIX ≥10% stromal staining
Total 361 11.6%
AC 206 11.2%
SCC 155 12.3%
14 Katsuta et al.
2005 Japan Surgical IHC HIF-1 α >10% nuclear or distinct cytoplasmic staining
SCC 48 70.8%
VEGF >30% cytoplasmic staining
SCC 48 60.4%
15 Kimura et al.
2004 Japan Surgical IHC HIF-1 α > mean nuclear/cytoplasmic expression
SCC 47 36.1%
VEGF >10% cytoplasmic staining
SCC 47 53.2%
16 Koukourakis et al.
2001 Greece Biopsy IHC HIF-1 α nuclear staining SCC 37 51.0%
HIF-2 α nuclear staining SCC 37 13.5%

PART III | Chapter 6
177
6
OS DFS
hypo
xic
vs.
non-
hypo
xic
sam
ple
P-va
lue*
Ka
plan
-Mei
er
mod
el
Cox
prop
orti
onal
haz
ard
mod
el
hypo
xic
vs.
non-
hypo
xic
sam
ple
P va
lue*
Ka
plan
-Mei
er
mod
el
Cox
prop
orti
onal
haz
ard
mod
el
Inde
pend
ent
Prog
nost
ic fa
ctor
Univariate P-value*
Multivariate P-value*
Univariate P-value*
Multivariate P-value*
30% vs. 54% 0.001 <0.001 0.009 24% vs.52% 0.001 <0.001 0.001 Yes
37% vs. 59%
0.001 0.007 0.027 33% vs. 55% 0.001 0.007 0.019 Yes
19% vs. 48%
0.001 0.001 0.043 12% vs. 45% 0.001 <0.001 0.01 Yes
- 0.004 - - - - - - -
- 0.052 - - - - - - -
- 0.001 - - - - - - -
- - - - 28.5% vs. 30.1% 0.0405 0.0405 0.016 yes
27% vs. 47% 0.008 - 0.017 - - - 0.041 yes
- - >0.05 >0.05 - - >0.05 >0.06 no
28% vs. 44% 0.013 - 0.196 25% vs. 37% 0.007 - 0.081 no
42% vs. 47% 0.142 - 0.256 40% vs. 41% 0.121 - 0.055 no
10% vs. 39% 0.045 - 0.933 8% vs. 33% 0.029 - 0.807 no
70.6% vs. 92.9%
0.3408 - - 20.6% vs. 0% 0.09 - - -
65.5% vs. 89.5%
0.4659 - - 26.1% vs. 5.6% 0.22 - - -
- 0.044 - - - - - - -
- 0.0012 - - - - - - -
- 0.08 - - - 0.14 - - -
- 0.03 - - - 0.1 - - -

PART III | Chapter 6
178
Hyp
oxia
cri
teri
a (t
hres
hold
exp
ress
ion
rate
/defi
niti
on o
f hy
poxi
a
Ref
Aut
hor
Publ
icat
ion
year
Coun
try
Spec
imen
Inde
x te
st
Mar
ker
Tum
or t
ype
# Sa
mpl
es
Hyp
oxic
sam
ple
(%)
17 Kurokawa et al.
2003 Japan Surgical IHC HIF-1 α >10% nuclear or distinct cytoplasmic staining
SCC 130 30.8%
18 Ling et al. 2006 Germany Biopsy +Surgical
IHC HIF-1 α protein
nuclear staining Total 53 33.3%
RNA assay
HIF-1 α mRNA
Ratio tumor-to-normal epithelium >1
Total 53 53.8%
AC 22 15.4%
SCC 31 38.5%
19 Matsuyama et al.
2004 Japan Surgical IHC HIF-1 α > mean nuclear/cytoplasmic expression
SCC 215 95.0%
20 Munipalle et al.
2011 United Kingdom
Biopsy IHC HIF-1 α ≥10% nuclear staining
SCC 36 52.8%
21 Ogane et al.
2010 Japan Surgical IHC HIF-1 α nuclear staining SCC 96 67,7%
22 Ogawa et al.
2011 Japan Biopsy IHC HIF-1 α >10% staining SCC 25 18.2%
23 Schreurs et al.
2014 The Netherlands
Patient PET scan 18F-FDG SUVmax(FDG) > 3.67
Mix 47 -
24 Sohda et al.
2004 Japan Biopsy IHC HIF-1 α >10% cell staining Mix 65 58.5%
25 Takala et al.
2011 Finland Surgical IHC HIF-1 α >5% nuclear staining
Mix 80 71.3%
VEGF >25% cytoplasmatic staining
Mix 84 71.4%
26 Tanaka et al.
2008 Japan Surgical IHC CAIX >median staining rate and intensity
SCC 127 59.8%
27 Tzao et al.
2008 Taiwan Surgical IHC HIF-1 α >10% positive staining
SCC 85 61.2%
VEGF >10% positive staining
SCC 85 65.9%
28 Winther et al.
2013 Denmark Biopsy Gene Clustering
15 hypoxia-assoc. genes
weighted hypoxia gene expression signature
Mix 56 31.0%
30 Zhang et al.
2014 China Surgical IHC HIF-1 α > median staining intensity * staining rate
SCC 136 52.2%
Locoregional SCC 67 41,8%
Table 1. Continued

PART III | Chapter 6
179
6
OS DFShy
poxi
c vs
. no
n-hy
poxi
c sa
mpl
e
P-va
lue*
Ka
plan
-Mei
er
mod
el
Cox
prop
orti
onal
haz
ard
mod
el
hypo
xic
vs.
non-
hypo
xic
sam
ple
P va
lue*
Ka
plan
-Mei
er
mod
el
Cox
prop
orti
onal
haz
ard
mod
el
Inde
pend
ent
Prog
nost
ic fa
ctor
Univariate P-value*
Multivariate P-value*
Univariate P-value*
Multivariate P-value*
40% vs. 58% 0.0007 0.0011 0.1669 - - - - no
- - 0.53 - - - - - no
- - 0.78 - - - - - no
- - 0.59 - - - - - no
- - 0.23 - - - - - no
43% vs. 52% 0.109 0.112 - 47% vs. 55% 0.024 0.027 0.142 no
26% vs. 18% 0.908 - <0.001 - - - - yes
- 0.034 0.0322 0.227 - 0.019 - - yes
- >0.05 - - 18.2% vs. 39.8% 0.0009 0.0009 0.001 yes
23.3% vs.56.6%
0.301 - - 17% vs. 62% 0.022 - - -
- 0.472 - - - - - - -
- 0.223 - - - - - - -
- 0.84 - - - - - - -
33.3% vs. 66.5%
0.0003 0.0006 0.7859 - - - - no
- 0.002 - 0.044 - - - - yes
- 0.001 - 0.035 - - - - yes
12.5% vs. 48.6%
0.07 >0.05 0.11 12.5% vs. 48.6% 0.13 0.02 0.22 no
25.3% vs. 36.9%
0.031 - 0.22 22.5% vs. 35.4% 0.042 - 0.35 no
32.1% vs. 51.3%
0.044 - 0.039 32.1% vs. 51.3% 0.049 - 0.051 yes

PART III | Chapter 6
180
3.2.1. Hypoxia-inducible factor (HIF)Hypoxia-inducible factor (HIF) is the master protein in regulating the response of cells to changing oxygen levels and recognizes the hypoxia response element (HRE) on the untranslated region of over 150 genes involved in cell survival, tumor metabolism, proliferation, and angiogenesis [31,32]. HIF-1 exists as a heterodimer protein composed of constitutively expressed HIF-1β complexed with one of three subunits (HIF-1α, HIF-2α or HIF-3α). Synthesis of HIF-1α is regulated via O2-independent mechanisms whereas degradation is primarily 02-dependent. Thus, HIF-1α upregulation could be a promising endogenous marker of hypoxia in EC. Interestingly, strong immunoreactivity for HIF-1α was presented more often in esophageal squamous cell carcinomas (ESCC) tumor tissue than in adenocarcinoma (AC) (p = 0.009) [25]. HIF-1α could be differently upregulated in ESCC than in AC. Together with molecular mutations and epigenetic alterations, the difference in outcome and treatment response of the two histologic subtypes could be explained [4]. Given the scarce data of HIF-1α in AC, no clear conclusion can be drawn regarding clinical outcome.
In a meta-analysis by Ping et al. [3], the prognostic significance of HIF-1α in ESCC has been investigated [3]. They reported that in univariate analyses HIF-1α overexpression was significantly associated with poor OS (p < 0.001, 10 studies), and DFS (P = 0.013, 2
Table 2 Extracted data concerning complete response (CR) and local control (LC) in esophageal squamous cell carcinoma (SCC) and adenocarcinoma (AC). CCRT= concurrent chemoradiotherapy, PDT = photodynamic therapy. (*) P-values < 0.05 indicate significant differences.
Ref
Aut
hor
Publ
icat
ion
year
Coun
try
Spec
imen
Inde
x te
st
Mar
ker
hypo
xia
crit
eria
(t
hres
hold
ex
pres
sion
rat
e)
Tum
or t
ype
# Sa
mpl
e
Hyp
oxic
sam
ple
(%)
11 Chiba et al. 2010 Japan Biopsy IHC GLUT-1 >30% membrane expression
SCC 25 28.0%
16 Koukourakis et al.
2001 Greece Biopsy IHC HIF-1 α Epithelial expression
SCC 37 51.0%
HIF-2 α Epithelial expression
SCC 37 13.5%
22 Ogawa et al. 2011 Japan Biopsy IHC HIF1 α >10% staining SCC 25 42.7%
24 Sohda et al.
2004 Japan Biopsy IHC HIF-1 α >10% cell staining
Mix 65 58%
28 Winther et al.
2013 Denmark Biopsy Gene Clustering
15 hypoxia-assoc. genes
weighted hypoxia gene expression signature
SCC 56 31%
29 Yue et al. 2012 China Patient PET scan 18F-FETNIM Ratio SUVmax to spleen SUVmean >1,3
SCC 28 82%
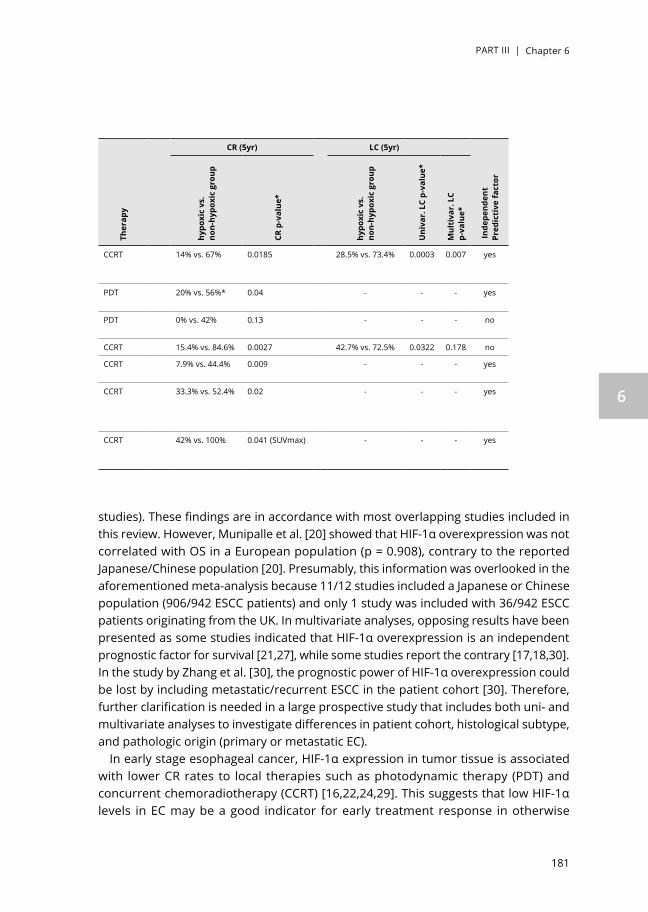
PART III | Chapter 6
181
6
studies). These findings are in accordance with most overlapping studies included in this review. However, Munipalle et al. [20] showed that HIF-1α overexpression was not correlated with OS in a European population (p = 0.908), contrary to the reported Japanese/Chinese population [20]. Presumably, this information was overlooked in the aforementioned meta-analysis because 11/12 studies included a Japanese or Chinese population (906/942 ESCC patients) and only 1 study was included with 36/942 ESCC patients originating from the UK. In multivariate analyses, opposing results have been presented as some studies indicated that HIF-1α overexpression is an independent prognostic factor for survival [21,27], while some studies report the contrary [17,18,30]. In the study by Zhang et al. [30], the prognostic power of HIF-1α overexpression could be lost by including metastatic/recurrent ESCC in the patient cohort [30]. Therefore, further clarification is needed in a large prospective study that includes both uni- and multivariate analyses to investigate differences in patient cohort, histological subtype, and pathologic origin (primary or metastatic EC).
In early stage esophageal cancer, HIF-1α expression in tumor tissue is associated with lower CR rates to local therapies such as photodynamic therapy (PDT) and concurrent chemoradiotherapy (CCRT) [16,22,24,29]. This suggests that low HIF-1α levels in EC may be a good indicator for early treatment response in otherwise
CR (5yr) LC (5yr)
Ther
apy
hypo
xic
vs.
non-
hypo
xic
grou
p
CR p
-val
ue*
hypo
xic
vs.
non-
hypo
xic
grou
p
Uni
var.
LC
p-va
lue*
Mul
tiva
r. L
C p-
valu
e*
Inde
pend
ent
Pred
icti
ve fa
ctor
CCRT 14% vs. 67% 0.0185 28.5% vs. 73.4% 0.0003 0.007 yes
PDT 20% vs. 56%* 0.04 - - - yes
PDT 0% vs. 42% 0.13 - - - no
CCRT 15.4% vs. 84.6% 0.0027 42.7% vs. 72.5% 0.0322 0.178 no
CCRT 7.9% vs. 44.4% 0.009 - - - yes
CCRT 33.3% vs. 52.4% 0.02 - - - yes
CCRT 42% vs. 100% 0.041 (SUVmax) - - - yes

PART III | Chapter 6
182
treatment-resistant hypoxic tumors. The significant correlation between HIF-1α and CR has been confirmed by Ping et al. (p = 0.001, 4 studies) [3].
3.2.2. Carbonic anhydrase (CA IX)Carbonic Anhydrase IX (CA IX) belongs to the family of zinc metalloenzymes with presence in normal stomach, intestinal and gall bladder tissue. It is involved in maintaining the cells pH-homeostasis by the reversible hydration of carbon dioxide into bicarbonate and hydrogen [33]. CA IX is over-expressed in hypoxic solid tumors through the HIF-1α activation cascade. Compared to HIF-1 α, CA IX is a stable and sustained marker of hypoxia with a half-life of 38 h [9,34]. In general, elevated membraneous CA IX was mainly found at the tumor center or at the border of tumors with expression rates being approximately 45–60% [9,12,26]. In 2008, Tanaka et al. reported that although hypoxia-induced CA IX expression correlated with more aggressive clinicopathological parameters and poor outcome, tumor related CA IX expression in ESCC was not an independent prognostic factor in multivariate survival analysis [26]. In contrast, Driessen et al. [12] showed that CA IX is a significant determinant in AC, and an independent prognostic factor for OS (p = 0.017) and DFS (p = 0.041) [12]. This was confirmed in a more recent study by Birner et al. [9] in an evenly-distributed patient cohort of ESCC and AC [9]. In a meta-analysis by van Kuijk et al. [33], EC-specific subgroup-analyses reported significant association between CA IX expression and both OS and DFS, respectively (p < 0.001) [33]. High CA IX expression was thus regarded as an adverse prognostic marker in EC. Furthermore, the expression of CA IX in tumor-surrounding stroma has also been significantly linked to shorter OS (p = 0.013) and DFS (p = 0.007) in a large cohort-study (n = 155 ESCC, n = 206 AC) [13]. It has been postulated that the difference in clinical behavior between ESCC and AC, could be related to a significant correlation between CA IX and HER-2 and/or a VEGF expression [9,12]. Nevertheless, these findings indicate the importance of this hypoxia-associated marker in disease progression and treatment resistance.
3.2.3. Other hypoxia-associated markersThe expression of glucose-transporter-1 (GLUT-1) is upregulated in hypoxic condition by HIF-1. In immunohistochemistry (IHC) analyses, GLUT-1 expression appeared to be a surrogate marker for hypoxia but also seemed to be prognostic factor for DFS and predictive for initial response to CCRT and LC [11].Vascular endothelial growth factor (VEGF) is a transcriptional target for HIF and stimulates angiogenesis in EC [25]. Contradicting findings have been reported concerning the prognostic value of VEGF. In AC patients or in a mixed cohort, studies reported no association between VEGF expression and prognosis [12,25]. In ESCC, however, VEGF expression was regarded as an independent prognostic factor of OS [15,27].

PART III | Chapter 6
183
6
3.2.4. Non-invasive imaging techniquesNon-invasive molecular imaging using positron-emission tomography (PET) has been shown to specifically detect hypoxic cell clusters in individual tumors using several 2-nitroimidazole derivatives [35–41]. Viable hypoxic cells are marked by 2-nitroimidazole derivatives through irreversible electron-reduction mechanisms involving nitroreductaseenzymes such as cytochrome P450 reductase. Four clinically used, FDA approved hypoxia PET-tracers are presented in Table 3 [6,29,35,36,42–46].
It has been shown that 18F-fluoromisonidazole (18F-FMISO) allows visualization of hypoxic areas in a variety of tumors although data on EC remain scarce. In a study by Brink et al. [6], 33/38 patients with EC presented noticeable hypoxic volumes [6]. Standard uptake values (SUV) of 18F-FMISO were shown to be significantly higher in AC (n = 20, SUVmean = 1.93 ± 0.43) than in ESCC (n = 18, SUVmean = 1.56 ± 0.25) (P < 0.01) [6]. However, the ability to visualize hypoxia differs in various cancer-types. For example, a significant correlation between 18F-FMISO uptake and tumor markers from IHC (e.g., microvessel density, HIF-1alfa, VEGF, and GLUT-1) have been reported in head-and-neck cancer, whereas no correlation has been published in non-small-cell-lung cancer (NSCLC) [35,37].
In untreated ESCC, Yue et al. evaluated the spatiotemporal variability of hypoxia and assessed the ability to predict clinical response after CCRT using the PET-marker 18F-fluoroerythronitroimidazole (18F-FETNIM) [29]. In this study, 18F-FETNIM presented pharmacokinetic advantages over 18F-FMISO and SUVmax (18F-FETNIM) was found to
Table 3. Overview of 2-nitroimidazole PET-tracers able to visualize tumor hypoxia in esophageal cancer. (*) missing data was substituted with know features in lung cancer. (**)Tumor to background ratio was defined as the ratio of SUVmax (tumor) over SUVmax (spleen).
[18F]-FMISO [18F]-FETNIM [18F]-FAZA* [18F]-HX4
Hypoxia PET-tracers
Year of publication [44] 1987 1995 2002 2010
Stability Metabolites in blood and urine
Fewermetabolite-formation than
FMISO
Very few metabolite-formation (10-15%)
[46]
Few metabolite-formation (18%)[47]
Clearance Very slow Hepatobiliary
Slow Renal Fast Renal Very fast Renal
Optimal scantime No plateau 2h p.i. [29] 2h p.i. [37] 3-4h p.i. [45]
TBRmax (mean ± SD) Not defined 2.41 ± 0.6* [37] 0.98 ± 0.19 [46] 1.87 ± 0.46 [45]
Hypoxic threshold TBR>1.2 [6] TBR**>1.3 [29] TBR>1.4 [83] TBR>1.0-1.4 [45]
Hydrophilicity (logP)[43] 0.4 -0.77 -0.4 -0.69
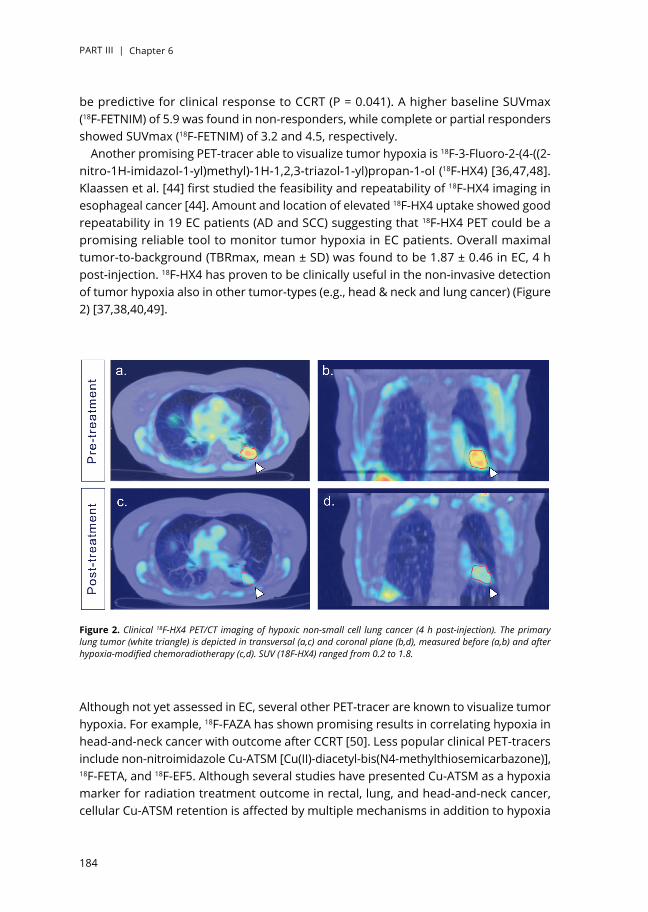
PART III | Chapter 6
184
be predictive for clinical response to CCRT (P = 0.041). A higher baseline SUVmax (18F-FETNIM) of 5.9 was found in non-responders, while complete or partial responders showed SUVmax (18F-FETNIM) of 3.2 and 4.5, respectively.
Another promising PET-tracer able to visualize tumor hypoxia is 18F-3-Fluoro-2-(4-((2-nitro-1H-imidazol-1-yl)methyl)-1H-1,2,3-triazol-1-yl)propan-1-ol (18F-HX4) [36,47,48]. Klaassen et al. [44] first studied the feasibility and repeatability of 18F-HX4 imaging in esophageal cancer [44]. Amount and location of elevated 18F-HX4 uptake showed good repeatability in 19 EC patients (AD and SCC) suggesting that 18F-HX4 PET could be a promising reliable tool to monitor tumor hypoxia in EC patients. Overall maximal tumor-to-background (TBRmax, mean ± SD) was found to be 1.87 ± 0.46 in EC, 4 h post-injection. 18F-HX4 has proven to be clinically useful in the non-invasive detection of tumor hypoxia also in other tumor-types (e.g., head & neck and lung cancer) (Figure 2) [37,38,40,49].
Although not yet assessed in EC, several other PET-tracer are known to visualize tumor hypoxia. For example, 18F-FAZA has shown promising results in correlating hypoxia in head-and-neck cancer with outcome after CCRT [50]. Less popular clinical PET-tracers include non-nitroimidazole Cu-ATSM [Cu(II)-diacetyl-bis(N4-methylthiosemicarbazone)], 18F-FETA, and 18F-EF5. Although several studies have presented Cu-ATSM as a hypoxia marker for radiation treatment outcome in rectal, lung, and head-and-neck cancer, cellular Cu-ATSM retention is affected by multiple mechanisms in addition to hypoxia
Figure 2. Clinical 18F-HX4 PET/CT imaging of hypoxic non-small cell lung cancer (4 h post-injection). The primary lung tumor (white triangle) is depicted in transversal (a,c) and coronal plane (b,d), measured before (a,b) and after hypoxia-modified chemoradiotherapy (c,d). SUV (18F-HX4) ranged from 0.2 to 1.8.

PART III | Chapter 6
185
6
[51,52]. Thus Cu-ATSM would not be a pure marker for hypoxia. Recently, 89Zr-labeled cG250 monoclonal antibodies have been show to quantify and map CA IX expression in preclinical models and head-and-neck cancer using PET [53]. Directly labeling CA IX for hypoxia-related PET-tracers has also been investigated [54–56].Ideal PET-tracers for hypoxia should be able to reach hypoxic cells in perfusion-limited microenvironments, have an oxygen-specific retention mechanism, and have a rapid and complete clearance of unbound radioactive tracer (i.e., hydrophilic) [42]. These properties ensure safe and optimal PET-imaging of tumor hypoxia. Unfortunately, none of the presented PET-tracers completely meet all these requirements (Table 3).
Another non-invasive technique that can detect hypoxia is magnetic resonance imaging(MRI) using exo- or endogenous contrast agents, and MR spectroscopy techniques such as electron paramagnetic resonance and hyperpolarized metabolic MRI [57]. Although MRI has not yet been used to investigate tumor hypoxia in EC, it shows promising results in other tumor types. In cervical cancer, for example, several studies have shown a correlation between tumor hypoxia and dynamic contrast enhanced (DCE-)MRI, using gadolinium bolus-injection, and demonstrated the ability to identify patients with hypoxia-related treatment resistance [58]. However, DCE-MRI estimates tumor perfusion and could therefore not assess the full extent of chronic tumor hypoxia. Similarly, blood-oxygen level dependent (BOLD)-MRI has been reported to be sensitive to tissue oxygenation by indirectly correlating deoxyhemoglobin-induced changes in MR signal to pO2. In clinical trials, BOLD-MRI has been reported to map chronic hypoxic regions in prostate cancer by correlation with pimonidazole staining and evaluate hypoxia in breast cancer through correlation with CA IX expression (r = 0.616, P < 0.001) [59,60]. Although these MRI-techniques could be used as surrogate markers for tumor hypoxia, measurements are usually indirect and sensitive to image-related artifacts [61].
4. DISCUSSION
In this study, we performed a systematic literature search, reviewed the various hypoxia-associated markers used in EC patients, and assessed the clinical impact of hypoxia in treatment outcome (i.e., CR, LC, OS and DFS). Most included studies investigated invasively acquired hypoxia-associated markers (i.e., HIF and CA IX) in IHC analyses. Although all studies confirmed the presence of tumor hypoxia in esophageal cancer, the prognostic value was not consistent across all studies. Discrepancies might arise from methodology differences for hypoxia detection and quantification. In addition, diverging findings could arise from differences in tumor cell type (AC vs. SCC) or from population differences (Western vs. Far Eastern) in the study cohort. Nevertheless, HIF-1α overexpression could be regarded as a molecular biomarker for hypoxia-response and could be associated with treatment outcome and clinical response to CCRT and PDT in Asiatic patients with EC. In AC, CA IX levels in both tumor

PART III | Chapter 6
186
stroma and cell membrane are indicative for hypoxic status and prognostic for OS and DFS. However, we found contradicting results from multivariate survival analyses in studies with HIF-1α as well as with CA IX. These findings support the need to further elucidate the complex molecular mechanism of tumor hypoxia and construct more reliable prediction models. Because invasively acquired biomarkers report unreliable results and are lacking the ability to capture the full intricacies of tumor hypoxia and its heterogeneity, there is a need for robust and quantitative biomarkers to detect hypoxia or hypoxia-associated responses in EC and determine complete tumor oxygenation. Furthermore, clinical assessment of hypoxic status needs to be performed repeatedly (i.e., before and during (chemo)radiation treatment), since hypoxia is a dynamic process and reoxygenation could occur after irradiation [62,63]. Non-invasive imaging using radioactive PET-tracers shows great promise in repeatable and quantitative detection of hypoxic sub-regions in the entire tumor, although further validation of the clinical and prognostic value in EC is required.
Combining PET-imaging with MRI in a multimodal hybrid system (i.e., PET/MRI) might be the solution to identify potential new biomarkers and validate hypoxia-associated biomarkers in EC patients. Recently, Simoncic et al. [64] demonstrated a high correlation between 18F-FMISO uptake parameters and DCE-MRI kinetic parameters in head-and-neck cancer patients (n = 6) [64]. However, the vascular data of dynamic PET and DCE-MRI was not exactly the same and the further development of simultaneous PET/MRI is encouraged to visualize hypoxic status. In addition to DCE- and BOLD-MRI, new techniques to assess tissue oxygenation are under development. Mapping oxygen by imaging lipids relaxation enhancement (MOBILE) detects variations in oxygenation based on MR relaxation rates of tissue lipids, instead of blood-oxygen related signal differences as seen in BOLD-MRI [65]. It has preclinically been confirmed that this novel technique is able to monitor changes in tumor oxygenation (r = 0.51, p = 0.022) and changes in lipid relaxation rates show moderate correlation with absolute pO2 values (r = 0.37, p = 0.027) [66]. Another promising novel MR-technique is oxygen-enhanced (OE-)MRI, where tumor oxygenation is detected as oxygen-induced increase in MR signal that is generally larger than signal changes detected using BOLD-MRI or MOBILE. By letting subjects breath 100% oxygen, O2-saturation in arterial blood plasma (Hb-bound and dissolved) will increase, resulting in an increase in tumor pO2 and tissue oxygenation [67]. In a preliminary study, 10 patients with advanced abdominal/pelvic cancer underwent serial measurement of tumor relaxation rate while breathing medical air (21% oxygen) followed by 100% oxygen (OE-MRI). The resulting difference in MR signal was significant (P < 0.005), proving the ability of OE-MRI to indirectly detect changes in tumor oxygen levels [67,68]. When combining multiple MRI-techniques with simultaneous PET-based imaging (i.e., PET/MRI), complementary information in tumor perfusion, tissue oxygenation, metabolic activity, and oxygen consumption could be acquired. Similar to PET/CT, this multiparametric method could be used to validate novel hypoxia-associated biomarkers and may help elucidate the complex nature of chronic hypoxia [69]. Moreover, PET/MRI relies on highly sensitive PET-probes and

PART III | Chapter 6
187
6
highly specific anatomical and/or functional MR information. However, protocol standardization (i.e., execution and analyses) is needed to allow for reproducible results and validation method of hypoxia-detection in multiple clinics and tumor types.
Non-invasive imaging could be useful to monitor hypoxic status and estimate early clinical response during (chemo)radiation treatment. In non-responsive patients, treatment strategies could adapted to more hypoxia-guided therapies [70]. In radiotherapy, PET-based dose painting has been proposed to specifically deliver an escalated radiation dose or boost to hypoxic sub-volumes [71]. Such hypoxia-targeted radiotherapy could deliver an optimal dose distribution to radio-resistant regions. Currently, the survival probability of EC patients remains disappointing. Potentially, treatment outcome and patient survival could be improved by targeting hypoxia (i.e., increasing oxygen delivery, normalize tumor vasculature, or reduce oxygen consumption) or by implicating hypoxia-specific treatment strategies. However, pretreatment hypoxic status must first be assessed since large patient- and tumor-variability in oxygenation can exist. By selecting hypoxic patients before the start of treatment, a window-of-opportunity arises wherein attempts to reduce tumor hypoxia could be made. By first applying hypoxia-specific treatment strategies to overcome tumor hypoxia or eradicate hypoxic cells, conventional (chemo-)radiotherapy may become more effective and better treatment outcome can be achieved [47,70]. For example, preselected patients with hypoxic laryngeal cancer (i.e., high CA IX-fraction) had better LC and DFS when treated with accelerated radiotherapy with carbogen breathing and nicotinamide (ARCON) compared to accelerated radiotherapy (LC 97% vs. 71%, p < 0.01 and DFS 92% vs. 69%, p = 0.06) [72]. In contrast, a reversed scheme of radiation dose-painting has recently been proposed [73]. Here, hypoxic tumor regions were preclinically assessed using 18F-HX4-PET/CT imaging and used for radiation treatment dose planning. Non-hypoxic regions (i.e., low 18F-HX-4 uptake) received an escalated radiation dose, while hypoxic regions were targeted with hypoxia-activated prodrugs (HAP). Interestingly, this strategy was as effective as conventional radiotherapy plans but was able to reduce the mean overall tumor dose and hereby lowering normal tissue toxicity. Radiation dose was therefore used more efficiently.
It seems that hypoxia represents a ‘Janus face’ in tumor biology. On the one hand, it is associated with restrained proliferation and oxygen-deprived cell death, but on the other hand, it promotes adaptive processes leading to tumor aggressiveness, progression, and acquired resistance to treatment [74]. The high treatment failure rate seen in EC might therefore be due to a hypoxic microenvironment.
Molecular imaging could help individualizing hypoxia-specific treatment strategies in EC. Several approaches are available that focus on targeting HIF-1α and VEGF. YC-1 (3-(5′-hydroxymethyl-2′-furyl)-1-benzylindazole) suppresses esophageal tumor cell growth and inhibit cellular migration activities [75]. Similarly, radiosensitivity could be enhanced by downregulating VEGF and HIF-1α protein levels. Drugs such as Ginsenoside Rg3, Fenofibrate, and Berberine have been associated with anti-tumor and anti-angiogenesis activities by promoting radiosensitivity of human hypoxic EC cell lines

PART III | Chapter 6
188
[76–78]. By targeting CA IX expression, therapeutic benefit could be improved when combining conventional treatment with cytotoxic agents such as CA IX-directed ligands or antibodies [79].
Another hypoxia-specific treatment strategy is the use of hypoxia-activated prodrugs (HAP) that become activated by enzymatic reduction under hypoxic conditions to release cytotoxic effectors (“warheads”). For example, evofosfamide (TH-302) is a HAP that upon activation in severely hypoxic regions induces DNA damage but also diffuses to the surrounding, better oxygenated, cells and creating cytotoxic bystander effects. TH-302 has demonstrated enhanced anti-tumor effects in combination with (chemo)radiotherapy, although levels of toxicity were also elevated [47,80]. In addition, significant clinical benefit has yet to be reported for treatment strategies involving currently-available HAP (i.e., monotherapy or combined with chemoradiotherapy) [81]. We acknowledge the potential therapeutic effect of additional anti-hypoxia treatment, but also the importance to limit unnecessary toxicity by selecting patients who will benefit from these modifications. Extensive clinical testing of TH-302 in combination with CCRT is therefore advised in pre-selected hypoxic patients using for example HX4-PET imaging [70,80].
Although this systematic review adheres to the PRISMA statement, it holds a few limitations [8]. Several clinicopathological factors such as age, clinical stage, lymph node invasion, and location (i.e., proximal or distal EC) were not investigated, but could explain the different expression rate of hypoxia-associated biomarkers in esophageal cancer. Furthermore, interactions between these factors and treatment differences (e.g., radiation dose, fractions, and chemo regimens) were not described. Beside hypoxia, reactive oxygen species, genetic alterations and inflammation may also be involved in the stimulation of hypoxia-associated molecular responses. Finally, we did not assess the effect of methodological differences across included studies (e.g., IHC staining procedures, antibody supplier, slice thickness, and threshold for hypoxic status). We assumed that reliable, standardized protocols were applied correctly for optimal detection of hypoxia-associated markers. Although presumed to be inconsequential, the possibility of impure comparison emphasizes the need for protocol standardization.
5. CONCLUSION
Evaluation of tumor micro-environmental conditions, such as intratumoral hypoxia, is important to predict treatment outcome and efficacy. Until now, the predictive value of hypoxia-associated biomarkers in esophageal cancer is controversially discussed. Although there is increasing clinical evidence that hypoxia-associated responses can be detected, the perfect biomarker for tumor hypoxia in EC has not yet been established. However, PET-based hypoxia imaging shows great potential in evaluating hypoxic tumor status non-invasively. Knowledge of the presence and dynamics of

PART III | Chapter 6
189
6
hypoxia in different esophageal cancer patients (ESCC vs. AC) is important to exploit and validate novel therapeutic strategies directed against tumor hypoxia. The window-of-opportunity trial concept paves the way for optimal hypoxia diagnosis and individualized hypoxia-guided treatment to improve radiotherapy response in EC patients. For personalized cancer medicine, simple, safe, and efficient methods are needed to determine tumor oxygenation in EC and help select patients with hypoxic tumors. Presumably, the combination of multiple, minimally invasive molecular markers is needed to fully evaluate the hypoxic status in cancer patients.
Disclosure of interestThe authors report no conflict of interest.
FundingL.D. was funded by Worldwide Cancer Research (Worldwide Cancer Research), formerly known as AICR [Grant #15-0345].

PART III | Chapter 6
190
APPENDIX A
A1. Systematic search protocolResearch questionHow does hypoxia affect treatment efficacy and outcome in patients with esophageal cancer?Search strategyWeb of Science: 182 hitsTOPIC: (hypoxia) ORTOPIC: (hypox*) AND TOPIC: TS = (cancer) OR TS = (tumor) OR TS = (tumor) OR TS = (carcinoma) OR TS = (neoplasm) OR TS = (oncology) OR TS = (lymph node) AND TOPIC: (esophag *) OR (oesophag *) OR (esophageal cancer) OR (oesophageal cancer) OR (esophageal carcinoma) OR (oesophageal carcinoma) OR(esophageal tumor) OR (oesophageal tumor) AND TOPIC: TS = (radioresistance) OR TS = (prognosis) OR TS = (treatment outcome) OR TS = (tumor aggressiveness) OR TS = (tumor spread) OR TS = (malignant progression) OR TS = (metastasis) OR TS = (clinical outcome) OR TS = (response prediction) OR TS = (pathological free survival) OR TS = (non-responders) OR TS = (pathological response) OR TS = (treatment resistance) OR TS = (therapy resistance) OR TS = (treatment efficacy).MEDLINE (MeSH): 22 hitsSearch (((((((hypoxia[MeSH Terms]) AND ((((cancer[MeSH Terms]) OR oncology[MeSH Terms]) OR tumor[MeSH Terms]) OR tumor[MeSH Terms])) AND ((((((radiation therapy[MeSH Terms]) OR treatment outcome[MeSH Terms]) OR prognosis[MeSH Terms]) OR adjuvant chemotherapy[MeSH Terms]) OR immunotherapy[MeSH Terms]) OR treatment resistant[MeSH Terms])) AND (((((esophageal cancer[MeSH Terms]) OR oesophag *[MeSH Terms]) OR esophag *[MeSH Terms]) OR lymph node[MeSH Terms]) or mediastin * [MeSH Terms])))).PubMed (Free text): 215 hits((((((((hypoxia) OR hypox *) OR hypoxia-induced factor)) AND (((((((((((esophageal cancer) OR esophag *) OR oesophageal cancer) OR mediastinum) OR lymphadenopathy) OR oesophageal carcinoma) OR esophageal tumor) OR oesophageal tumor) OR esophageal carcinoma) OR lymph node) AND (((((((((((((((radioresistance) OR prognosis) OR treatment outcome) OR tumor aggressiveness) OR tumor spread) OR malignant progression) OR metastasis) OR clinical outcome) OR response prediction) OR pathological free survival) OR non-responders) OR pathological response) OR treatment resistance) OR therapy resistance) OR treatment efficacy)).Inclusion criteriaP = PARTICIPANTS OR PATIENTS. Species: human.Age: adults (minimal age >18 yr.).Sex: no restriction.Condition: esophageal cancer.Specimen: patients or biopsy-acquired tissue samples or surgical tissue samples.

PART III | Chapter 6
191
6
Tumor type: Squamous cell carcinoma (SCC) and adenocarcinoma (AC).Stage: no restriction.I = INDEX TESTAll clinical tests able to measure hypoxia-related markers.C = COMPARATIVE TESTnot relevant.O = OUTCOMEOverall survival (OS), Disease-free survival (DSF).S = STUDY DESIGNStudy design: original diagnostic experiments.Study type: full-text content available, no studies aiming to elucidate molecular mechanisms of hypoxia.Language: English.Publication year: no restriction.Exclusion criteriaBased on title & abstractBased on full text1.Irrelevant study, not meeting PICOS-characteristics.2.preclinical studies using animal-based tumor models or esophageal cell lines.3.Reviews, letters to the editor, comments, supplements, conference abstracts, reports, essays, symposiums, guidelines.4.Overlapping data-sets.5.Survival analyses were not presented in publication.6.Presented survival analyses did not allow correlation between expression rate of hypoxia-associated markers and treatment outcome analyses.Data extractionElements that were extracted comprised of:Patient characteristics: number of subjects included in the study, country of origin, mean age of the patient population, tumor cell type, specimen type.Index test characteristics: method of quantifying hypoxia, marker type, definition of hypoxia, percentage of hypoxic elements, selected treatment strategy.Outcome parameters: statistical analysis (uni- or multivariate), overall survival, disease free survival, complete response, local control, p-values indicating statistical difference in treatment outcome between high and low percentages of hypoxia-associated markers.Study characteristics: First author, publication year.Finally, each article was given a unique identification number.
PART III | Chapter 6
192
REFERENCES
[1] M.R. Horsman, L.S. Mortensen, J.B. Petersen, M. Busk, J. Overgaard, Imaging hypoxia to improve radiotherapy outcome, Nat. Rev. Clin. Oncol. 9 (2012) 674– 687.
[2] J. Overgaard, Hypoxic modification of radiotherapy in squamous cell carcinoma of the head and neck–a systematic review and meta-analysis, Radiother. Oncol. 100 (2011) 22–32.
[3] W. Ping, W. Sun, Y. Zu, W. Chen, X. Fu, Clinicopathological and prognostic significance of hypoxia-inducible factor-1alpha in esophageal squamous cell carcinoma: a meta-analysis, Tumour Biol. 35 (2014) 4401–4409.
[4] P. van Hagen, M. Hulshof, J. van Lanschot, E.W. Steyerberg, M.I.V. Henegouwen,B.P.L. Wijnhoven, D.J. Richel, G.A.P. Nieuwenhuijzen, C. Group, Preoperative chemoradiotherapy for esophageal or junctional cancer, N. Engl. J. Med. 366 (2012) 2074–2084.
[5] R.L. Siegel, K.D. Miller, A. Jemal, Cancer statistics, CA Cancer J. Clin. 66 (2016) 7–30.
[6] I. Brink, P. Baier, E. Juttner, T. Paulus, M. Narayanan, U. Podbielski, W. Weber,M. Hentschel, Assessment of hypoxia in esophageal carcinomas using 18FMISO PET, Journal of nuclear medicine: official publication, Soci. Nucl. Med. 49(2008).
[7] L.H. Gray, A.D. Conger, M. Ebert, S. Hornsey, O.C. Scott, The concentration of oxygen dissolved in tissues at the time of irradiation as a factor in radiotherapy, Br. J. Radiol. 26 (1953) 638–648.
[8] D. Moher, A. Liberati, J. Tetzlaff, D.G. Altman, Preferred reporting items for systematic reviews and meta-analyses: the PRISMA statement, J. Clin. Epidemiol. 62 (2009) 1006–1012.
[9] P. Birner, B. Jesch, J. Friedrich, M. Riegler, J. Zacherl, M. Hejna, F. Wrba, A.Schultheis, S.F. Schoppmann, Carbonic anhydrase IX overexpression is associated with diminished prognosis in esophageal cancer and correlates with her-2 expression, Ann. Surg. Oncol. 18 (2011) 3330–3337.
[10] Y.S. Chen, Y. Lu, C.L. Lu, L. Zhang, Beclin-1 expression is a predictor of clinical outcome in patients with esophageal squamous cell carcinoma and correlated to hypoxia-inducible factor (HIF)-1 alpha expression, Pathol. Oncol. Res. 15 (2009) 487–493.
[11] I. Chiba, K. Ogawa, T. Morioka, H. Shimoji, N. Sunagawa, S. Iraha, T. Nishimaki,N. Yoshimi, S. Murayama, Clinical significance of GLUT-1 expression in patients with esophageal cancer treated with concurrent chemoradiotherapy, Oncol. Lett. 2 (2011) 21–28.
[12] A. Driessen, W. Landuyt, S. Pastorekova, J. Moons, L. Goethals, K. Haustermans,P. Nafteux, F. Penninckx, K. Geboes, T. Lerut, N. Ectors, Expression of carbonic anhydrase IX (CA IX), a hypoxia-related protein, rather than vascularendothelial growth factor (VEGF), a pro-angiogenic factor, correlates with an extremely poor prognosis in esophageal and gastric adenocarcinomas, Ann.Surg. 243 (2006) 334–340.
[13] G. Jomrich, B. Jesch, P. Birner, K. Schwameis, M. Paireder, R. Asari, S.F.Schoppmann, Stromal expression of carbonic anhydrase IX in esophageal cancer, Clin. Transl. Oncol. 16 (2014) 966–972.
[14] M. Katsuta, M. Miyashita, H. Makino, T. Nomura, S. Shinji, K. Yamashita, T.Tajiri, M. Kudo, T. Ishiwata, Z. Naito, Correlation of hypoxia inducible factor-1alpha with lymphatic metastasis via vascular endothelial growth factor-C in human esophageal cancer, Exp. Mol. Pathol. 78 (2005) 123–130.
[15] S. Kimura, Y. Kitadai, S. Tanaka, T. Kuwai, J. Hihara, K. Yoshida, T. Toge, K. Chayama, Expression of hypoxia-inducible factor (HIF)-1 alpha is associated with vascular endothelial growth factor expression and tumour anglogenesis in human oesophageal squamous cell carcinoma, Eur. J. Cancer 40 (2004) 1904–1912.
[16] M.I. Koukourakis, A. Giatromanolaki, J. Skarlatos, L. Corti, S. Blandamura, M. Piazza, K.C. Gatter, A.L. Harris, Hypoxia inducible factor (HIF-1a and HIF-2a) expression in early esophageal cancer and response to photodynamic therapy and radiotherapy, Cancer Res. 61 (2001) 1830–1832.

PART III | Chapter 6
193
6
[17] T. Kurokawa, M. Miyamoto, K. Kato, Y. Cho, Y. Kawarada, Y. Hida, T. Shinohara, T. Itoh, S. Okushiba, S. Kondo, H. Katoh, Overexpression of hypoxia-induciblefactor 1 alpha(HIF-1 alpha) in oesophageal squamous cell carcinoma correlates with lymph node metastasis and pathologic stage, Br. J. Cancer 89 (2003) 1042–1047.
[18] F.C. Ling, N. Leimbach, S.E. Baldus, S. Buechel, S. Neiss, J. Brabender, U. Drebber, H.P. Dienes, R.P. Mueller, A.H. Hoelscher, P.M. Schneider, HIF-1alpha mRNA is not associated with histopathological regression following neoadjuvant chemoradiation in esophageal cancer, Anticancer Res. 26 (2006) 4505–4509.
[19] T. Matsuyama, K. Nakanishi, T. Hayashi, Y. Yoshizumi, S. Aiko, Y. Sugiura, T. Tanimoto, M. Uenoyama, Y. Ozeki, T. Maehara, Expression of hypoxia inducible factor-1 alpha in esophageal squamous cell carcinoma, Cancer Sci.96 (2005) 176–182.
[20] P.C. Munipalle, Y.K.S. Viswanath, P.A. Davis, D. Scoones, Prognostic value of hypoxia inducible factor 1 alpha in esophageal squamous cell carcinoma, Dis. Esophagus 24 (2011) 177–181.
[21] N. Ogane, M. Yasuda, M. Shimizu, M. Miyazawa, S. Kamoshida, A. Ueda, K. Takata, Y. Sakuma, Y. Miyagi, Y. Kameda, Clinicopathological implications of expressions of hypoxia-related molecules in esophageal superficial squamous cell carcinoma, Ann. Diagn. Pathol. 14 (2010) 23–29.
[22] K. Ogawa, I. Chiba, T. Morioka, H. Shimoji, W. Tamaki, R. Takamatsu, T. Nishimaki, N. Yoshimi, S. Murayama, Clinical significance of HIF-l alpha expression in patients with esophageal cancer treated with concurrent chemoradiotherapy, Anticancer Res. 31 (2011) 2351–2359.
[23] L.M.A. Schreurs, J.K. Smit, K. Pavlov, B.B. Pultrum, J. Pruim, H. Groen, H. Hollema, J.T.M. Plukker, Prognostic impact of clinicopathological features and expression of biomarkers related to F-18-FDG uptake in esophageal cancer, Ann. Surg. Oncol. 21 (2014) 3751–3757.
[24] M. Sohda, H. Ishikawa, N. Masuda, H. Kato, T. Miyazaki, M. Nakajima, M. Fukuchi, R. Manda, Y. Fukai, H. Sakurai, H. Kuwano, Pretreatment evaluation of combined HIF-1alpha, p53 and p21 expression is a useful and sensitive indicator of response to radiation and chemotherapy in esophageal cancer, Int. J. Cancer 110 (2004) 838–844.
[25] H. Takala, J. Saarnio, H. Wiik, P. Ohtonen, Y. Soini, HIF-1 alpha and VEGF are associated with disease progression in esophageal carcinoma, J. Surg. Res. 167 (2011) 41–48.
[26] N. Tanaka, H. Kato, T. Inose, H. Kimura, A. Faried, M. Sohda, M. Nakajima, Y. Fukai, T. Miyazaki, N. Masuda, M. Fukuchi, H. Kuwano, Expression of carbonic anhydrase 9, a potential intrinsic marker of hypoxia, is associated with poor prognosis in oesophageal squamous cell carcinoma, Br. J. Cancer 99 (2008) 1468–1475.
[27] C. Tzao, S.C. Lee, H.J. Tung, H.S. Hsu, W.H. Hsu, G.H. Sun, C.P. Yu, J.S. Jin, Y.L. Cheng, Expression of hypoxia-inducible factor (HIF)-1 alpha and vascular endothelial growth factor (VEGF)-D as outcome predictors in resected esophageal squamous cell carcinoma, Dis. Markers 25 (2008) 141–148.
[28] M. Winther, J. Alsner, T. Tramm, M. Nordsmark, Hypoxia-regulated gene expression and prognosis in loco-regional gastroesophageal cancer, Acta Oncol. (Stockholm, Sweden) 52 (2013) 1327–1335.
[29] J. Yue, Y. Yang, A.R. Cabrera, X. Sun, S. Zhao, P. Xie, J. Zheng, L. Ma, Z. Fu, J. Yu, Measuring tumor hypoxia with (1)(8)F-FETNIM PET in esophageal squamous cell carcinoma: a pilot clinical study, Dis. Esophagus 25 (2012) 5461.
[30] L. Zhang, S.B. Ye, Z.L. Li, G. Ma, S.P. Chen, J. He, W.L. Liu, D. Xie, Y.X. Zeng, J. Li, Increased HIF-1alpha expression in tumor cells and lymphocytes of tumor microenvironments predicts unfavorable survival in esophageal squamous cell carcinoma patients, Int. J. Clin. Exp. Pathol. 7 (2014) 3887–3897.
[31] G.L. Semenza, HIF-1 and tumor progression: pathophysiology and therapeutics, Trends Mol. Med. 8 (2002) S62–S67.

PART III | Chapter 6
194
[32] B. Krishnamachary, M.F. Penet, S. Nimmagadda, Y. Mironchik, V. Raman, M. Solaiyappan, G.L. Semenza, M.G. Pomper, Z.M. Bhujwalla, Hypoxia regulates CD44 and its variant isoforms through HIF-1alpha in triple negative breast cancer, PLoS One 7 (2012) e44078.
[33] S.J. van Kuijk, A. Yaromina, R. Houben, R. Niemans, P. Lambin, L.J. Dubois, Prognostic significance of carbonic anhydrase IX expression in cancer patients: a meta-analysis, Front. Oncol. 6 (2016) 69.
[34] U.R. Jewell, I. Kvietikova, A. Scheid, C. Bauer, R.H. Wenger, M. Gassmann, Induction of HIF-1alpha in response to hypoxia is instantaneous, FASEB J. 15 (2001) 1312–1314.
[35] S.G. Peeters, C.M. Zegers, A. Yaromina, W. Van Elmpt, L. Dubois, P. Lambin,Current preclinical and clinical applications of hypoxia PET imaging using 2-nitroimidazoles, Q. J. Nucl. Med. Mol. Imaging 59 (2015) 39–57.
[36] S.G. Peeters, C.M. Zegers, N.G. Lieuwes, W. van Elmpt, J. Eriksson, G.A. van Dongen, L. Dubois, P. Lambin, A comparative study of the hypoxia PET tracers [(1)(8)F]HX4, [(1)(8)F]FAZA, and [(1)(8)F]FMISO in a preclinical tumor model, Int. J. Radiat. Oncol. Biol. Phys. 91 (2015) 351–359.
[37] C.M. Zegers, F.J. Hoebers, W. van Elmpt, J.A. Bons, M.C. Ollers, E.G. Troost, D. Eekers, L. Balmaekers, M. Arts-Pechtold, F.M. Mottaghy, P. Lambin, Evaluation of tumour hypoxia during radiotherapy using [18F]HX4 PET imaging and blood biomarkers in patients with head and neck cancer, Eur. J. Nucl. Med. Mol. Imaging 43 (2016) 2139–2146.
[38] C.M. Zegers, W. van Elmpt, F.J. Hoebers, E.G. Troost, M.C. Ollers, F.M. Mottaghy, P. Lambin, Imaging of tumour hypoxia and metabolism in patients with head and neck squamous cell carcinoma, Acta Oncol. (Stockholm, Sweden) 54 (2015) 1378–1384.
[39] C.M. Zegers, W. van Elmpt, B. Reymen, A.J. Even, E.G. Troost, M.C. Ollers, F.J. Hoebers, R.M. Houben, J. Eriksson, A.D. Windhorst, F.M. Mottaghy, D. De Ruysscher, P. Lambin, In vivo quantification of hypoxic and metabolic status of NSCLC tumors using [18F]HX4 and [18F]FDG-PET/CT imaging, Clin. Cancer Res. 20 (2014) 6389–6397.
[40] C.M. Zegers, W. van Elmpt, K. Szardenings, H. Kolb, A. Waxman, R.M. Subramaniam, D.H. Moon, J.C. Brunetti, S.M. Srinivas, P. Lambin, D. Chien, Repeatability of hypoxia PET imaging using [(1)(8)F]HX4 in lung and head and neck cancer patients: a prospective multicenter trial, Eur. J. Nucl. Med. Mol. Imaging 42 (2015) 1840–1849.
[41] C.M. Zegers, W. van Elmpt, R. Wierts, B. Reymen, H. Sharifi, M.C. Ollers, F. Hoebers, E.G. Troost, R. Wanders, A. van Baardwijk, B. Brans, J. Eriksson, B. Windhorst, F.M. Mottaghy, D. De Ruysscher, P. Lambin, Hypoxia imaging with [(1)(8)F]HX4 PET in NSCLC patients: defining optimal imaging parameters, Radiother. Oncol. 109 (2013) 58–64.
[42] I.N. Fleming, R. Manavaki, P.J. Blower, C. West, K.J. Williams, A.L. Harris, J. Domarkas, S. Lord, C. Baldry, F.J. Gilbert, Imaging tumour hypoxia with positron emission tomography, Br. J. Cancer 112 (2015) 238–250.
[43] E.M. Hammond, M.C. Asselin, D. Forster, J.P. O’Connor, J.M. Senra, K.J. Williams, The meaning, measurement and modification of hypoxia in the laboratory and the clinic, Clin. Oncol. (Royal College of Radiologists (Great Britain)) 26 (2014) 277–288.
[44] R. Klaassen, R.J. Bennink, G. van Tienhoven, M.F. Bijlsma, M.G.H. Besselink, M.I. V. Henegouwen, J.W. Wilmink, A.J. Nederveen, A.D. Windhorst, M. Hulshof, H. W.M. van Laarhoven, Feasibility and repeatability of PET with the hypoxia tracer F-18 HX4 in oesophageal and pancreatic cancer, Radiother. Oncol. 116 (2015) 94–99.
[45] E.E. Verwer, F.H. van Velden, I. Bahce, M. Yaqub, R.C. Schuit, A.D. Windhorst, P.Raijmakers, A.A. Lammertsma, E.F. Smit, R. Boellaard, Pharmacokinetic analysis of [18F]FAZA in non-small cell lung cancer patients, Eur. J. Nucl. Med. Mol. Imaging 40 (2013) 1523–1531.
[46] E.E. Verwer, C.M. Zegers, W. van Elmpt, R. Wierts, A.D. Windhorst, F.M. Mottaghy, P. Lambin, R. Boellaard, Pharmacokinetic modeling of a novel hypoxia PET tracer [18F]HX4 in patients with non-small cell lung cancer, EJNMMI Phys. 3 (2016) 30.

PART III | Chapter 6
195
6
[47] R. Larue, L. Van de Voorde, M. Berbee, W.J.C. van Elmpt, L.J. Dubois, K.M. Panth, S. Peeters, A. Claessens, W.M.J. Schreurs, M. Nap, F. Warmerdam, F.L.G.Erdkamp, M.N. Sosef, P. Lambin, A phase 1 ’window-of-opportunity’ trial testing evofosfamide (TH-302), a tumour-selective hypoxia-activated cytotoxic prodrug, with preoperative chemoradiotherapy in oesophagealadenocarcinoma patients, BMC Cancer 16 (2016) 8.
[48] L.J. Dubois, N.G. Lieuwes, M.H. Janssen, W.J. Peeters, A.D. Windhorst, J.C. Walsh,H.C. Kolb, M.C. Ollers, J. Bussink, G.A. van Dongen, A. van der Kogel, P. Lambin,Preclinical evaluation and validation of [18F]HX4, a promising hypoxia marker for PET imaging, Proc. Natl. Acad. Sci. U.S.A. 108 (2011) 14620–14625.
[49] J. van Loon, M.H. Janssen, M. Ollers, H.J. Aerts, L. Dubois, M. Hochstenbag, A.M. Dingemans, R. Lalisang, B. Brans, B. Windhorst, G.A. van Dongen, H. Kolb, J.Zhang, D. De Ruysscher, P. Lambin, PET imaging of hypoxia using [18F]HX4: a phase I trial, Eur. J. Nucl. Med. Mol. Imaging 37 (2010) 1663–1668.
[50] E.E. Graves, R.J. Hicks, D. Binns, M. Bressel, Q.T. Le, L. Peters, R.J. Young, D. Rischin, Quantitative and qualitative analysis of [(18)F]FDG and [(18)F]FAZA positron emission tomography of head and neck cancers and associations with HPV status and treatment outcome, Eur. J. Nucl. Med. Mol. Imaging 43 (2016) 617–625.
[51] H. Yuan, T. Schroeder, J.E. Bowsher, L.W. Hedlund, T. Wong, M.W. Dewhirst, Intertumoral differences in hypoxia selectivity of the PET imaging agent 64Cu (II)-diacetyl-bis(N4-methylthiosemicarbazone), J. Nucl. Med. 47 (2006) 989–998.
[52] K.S. Chao, W.R. Bosch, S. Mutic, J.S. Lewis, F. Dehdashti, M.A. Mintun, J.F. Dempsey, C.A. Perez, J.A. Purdy, M.J. Welch, A novel approach to overcome hypoxic tumor resistance: Cu-ATSM-guided intensity-modulated radiation therapy, Int. J. Radiat. Oncol. Biol. Phys. 49 (2001) 1171–1182.
[53] B.A. Hoeben, J.H. Kaanders, G.M. Franssen, E.G. Troost, P.F. Rijken, E.Oosterwijk, G.A. van Dongen, W.J. Oyen, O.C. Boerman, J. Bussink, PET of hypoxia with 89Zr-labeled cG250-F(ab’)2 in head and neck tumors.
[54] V. Akurathi, L. Dubois, S. Celen, N.G. Lieuwes, S.K. Chitneni, B.J. Cleynhens, A.Innocenti, C.T. Supuran, A.M. Verbruggen, P. Lambin, G.M. Bormans,Development and biological evaluation of (9)(9)mTc-sulfonamide derivatives for in vivo visualization of CA IX as surrogate tumor hypoxia markers, Eur. J.Med. Chem. 71 (2014) 374–384.
[55] L. Dubois, N.G. Lieuwes, A. Maresca, A. Thiry, C.T. Supuran, A. Scozzafava, B.G.Wouters, P. Lambin, Imaging of CA IX with fluorescent labelled sulfonamides distinguishes hypoxic and (re)-oxygenated cells in a xenograft tumour model,Radiother. Oncol. 92 (2009) 423–428.
[56] D. Sneddon, R. Niemans, M. Bauwens, A. Yaromina, S.J. van Kuijk, N.G. Lieuwes, R. Biemans, I. Pooters, P.A. Pellegrini, N.A. Lengkeek, I. Greguric, K.F. Tonissen, C.T. Supuran, P. Lambin, L. Dubois, S.A. Poulsen, Synthesis and in vivo biological evaluation of (68)Ga-labeled carbonic anhydrase IX targeting small molecules for positron emission tomography, J. Med. Chem. 59 (2016) 6431–6443.
[57] M. Matsuo, S. Matsumoto, J.B. Mitchell, M.C. Krishna, K. Camphausen, Magnetic resonance imaging of the tumor microenvironment in radiotherapy: perfusion, hypoxia, and metabolism, Semin. Radiat. Oncol. 24 (2014) 210–217.
[58] C. Halle, E. Andersen, M. Lando, E.K. Aarnes, G. Hasvold, M. Holden, R.G. Syljuasen, K. Sundfor, G.B. Kristensen, R. Holm, E. Malinen, H. Lyng, Hypoxia-induced gene expression in chemoradioresistant cervical cancer revealed by dynamic contrast-enhanced MRI, Cancer Res. 72 (2012) 5285–5295.
[59] P.J. Hoskin, D.M. Carnell, N.J. Taylor, R.E. Smith, J.J. Stirling, F.M. Daley, M.I. Saunders, S.M. Bentzen, D.J. Collins, J.A. d’Arcy, A.P. Padhani, Hypoxia in prostate cancer: correlation of BOLD-MRI with pimonidazole immunohistochemistry-initial observations, Int. J. Radiat. Oncol. Biol. Phys. 68 (2007) 1065–1071.
[60] Y. Wang, M. Liu, M.L. Jin, Blood oxygenation level-dependent magnetic resonance imaging of breast cancer: correlation with carbonic anhydrase IX and vascular endothelial growth factor, Chin. Med. J. (Engl) 130 (2017) 71–76.
PART III | Chapter 6
196
[61] A.R. Padhani, K.A. Krohn, J.S. Lewis, M. Alber, Imaging oxygenation of human tumours, Eur. Radiol. 17 (2007) 861–872.
[62] A. Yaromina, H. Thames, X. Zhou, S. Hering, W. Eicheler, A. Dorfler, T. Leichtner, D. Zips, M. Baumann, Radiobiological hypoxia, histological parameters of tumour microenvironment and local tumour control after fractionated irradiation, Radiother. Oncol. 96 (2010) 116–122.
[63] D. Zips, S. Boke, T. Kroeber, A. Meinzer, K. Bruchner, H.D. Thames, M. Baumann, A. Yaromina, Prognostic value of radiobiological hypoxia during fractionated irradiation for local tumor control, Strahlenther. Onkol. 187 (2011) 306–310.
[64] U. Simoncic, S. Leibfarth, S. Welz, N. Schwenzer, H. Schmidt, G. Reischl, C. Pfannenberg, C. Fougere, K. Nikolaou, D. Zips, D. Thorwarth, Comparison of DCE-MRI kinetic parameters and FMISO-PET uptake parameters in head and neck cancer patients, Med. Phys. (2017).
[65] B.F. Jordan, J. Magat, F. Colliez, E. Ozel, A.C. Fruytier, V. Marchand, L. Mignion, C. Bouzin, P.D. Cani, C. Vandeputte, O. Feron, N. Delzenne, U. Himmelreich, V. Denolin, T. Duprez, B. Gallez, Mapping of oxygen by imaging lipids relaxation enhancement: a potential sensitive endogenous MRI contrast to map variations in tissue oxygenation, Magn. Reson. Med. 70 (2013) 732–744.
[66] F. Colliez, M.A. Neveu, J. Magat, T.T. Cao Pham, B. Gallez, B.F. Jordan, Qualification of a noninvasive magnetic resonance imaging biomarker to assess tumor oxygenation, Clin. Cancer Res. 20 (2014) 5403–5411.
[67] J.P. O’Connor, J.H. Naish, G.J. Parker, J.C. Waterton, Y. Watson, G.C. Jayson, G.A. Buonaccorsi, S. Cheung, D.L. Buckley, D.M. McGrath, C.M. West, S.E. Davidson, C. Roberts, S.J. Mills, C.L. Mitchell, L. Hope, N.C. Ton, A. Jackson, Preliminary study of oxygen-enhanced longitudinal relaxation in MRI: a potential novel biomarker of oxygenation changes in solid tumors, Int. J. Radiat. Oncol. Biol. Phys. 75 (2009) 1209–1215.
[68] J.P. O’Connor, J.K. Boult, Y. Jamin, M. Babur, K.G. Finegan, K.J. Williams, R.A. Little, A. Jackson, G.J. Parker, A.R. Reynolds, J.C. Waterton, S.P. Robinson, Oxygen-enhanced MRI accurately identifies, quantifies, and maps tumor hypoxia in preclinical cancer models, Cancer Res. 76 (2016) 787–795.
[69] W. van Elmpt, C.M. Zegers, B. Reymen, A.J. Even, A.M. Dingemans, M. Oellers, J. E. Wildberger, F.M. Mottaghy, M. Das, E.G. Troost, P. Lambin, Multiparametric imaging of patient and tumour heterogeneity in non-small-cell lung cancer: quantification of tumour hypoxia, metabolism and perfusion, Eur. J. Nucl. Med. Mol. Imaging 43 (2016) 240–248.
[70] L.J. Dubois, R. Niemans, S.J. van Kuijk, K.M. Panth, N.K. Parvathaneni, S.G. Peeters, C.M. Zegers, N.H. Rekers, M.W. van Gisbergen, R. Biemans, N.G. Lieuwes, L. Spiegelberg, A. Yaromina, J.Y. Winum, M. Vooijs, P. Lambin, New ways to image and target tumour hypoxia and its molecular responses, Radiother. Oncol. 116 (2015) 352–357.
[71] A.J. Even, J. van der Stoep, C.M. Zegers, B. Reymen, E.G. Troost, P. Lambin, W. van Elmpt, PET-based dose painting in non-small cell lung cancer: Comparing uniform dose escalation with boosting hypoxic and metabolically active subvolumes,Radiother. Oncol. 116 (2015) 281–286.
[72] Saskia E. Rademakers, Ilse J. Hoogsteen, Paul F. Rijken, Egbert Oosterwijk, Chris H. Terhaard, Patricia A. Doornaert, Johannes A. Langendijk, Piet van den Ende, Robert Takes, Remco De Bree, Albert J. van der Kogel, Johan Bussink, J.H. Kaanders, Pattern of CAIX expression is prognostic for outcome and predicts response to ARCON in patients with laryngeal cancer treated in a phase III randomized trial, Radiat. Oncol. J. 108 (2013) 517–522.
[73] A. Yaromina, M. Granzier, R. Biemans, N.G. Lieuwes, W. Van Elmpt, G. Shakirin, L. Dubois, P. Lambin, A novel concept for tumour targeting inverse dose-painting or targeting the ‘‘Low Drug Uptake Volume”, Radiother. Oncol. (2017).
[74] J.L. Tatum, G.J. Kelloff, R.J. Gillies, J.M. Arbeit, J.M. Brown, K.S. Chao, J.D. Chapman, W.C. Eckelman, A.W. Fyles, A.J. Giaccia, R.P. Hill, C.J. Koch, M.C. Krishna, K.A. Krohn, J.S. Lewis, R.P. Mason, G. Melillo, A.R. Padhani, G. Powis, J. G. Rajendran, R. Reba, S.P. Robinson, G.L. Semenza, H.M. Swartz, P. Vaupel, D. Yang,

PART III | Chapter 6
197
6
B. Croft, J. Hoffman, G. Liu, H. Stone, D. Sullivan, Hypoxia: importance in tumor biology, noninvasive measurement by imaging, and value of its measurement in the management of cancer therapy, Int. J. Radiat. Biol. 82 (2006) 699–757.
[75] Y. Feng, H. Zhu, T. Ling, B. Hao, G. Zhang, R. Shi, Effects of YC-1 targeting hypoxia-inducible factor 1 alpha in oesophageal squamous carcinoma cell line cells, Cell Biol. Int. 35 (2011) 491–497.
[76] X.L. Ge, F.X. Zhen, B.X. Yang, X. Yang, J. Cai, C. Zhang, S. Zhang, Y.D. Cao, J.X. Ma, H.Y. Cheng, X.C. Sun, Ginsenoside Rg3 enhances radiosensitization of hypoxic oesophageal cancer cell lines through vascular endothelial growth factor and hypoxia inducible factor 1 alpha, J. Int. Med. Res. 42 (2014) 628–640.
[77] Y.Y. Ge, J. Liu, X. Yang, H.C. Zhu, B.X. Yang, K.L. Zhao, Z.J. Wu, G.J. Cheng, F. Wang, F. Ni, Q. Ge, Y.G. Yang, G.M. Tai, X.C. Sun, J. Cai, Fenofibrate enhances radiosensitivity of esophageal squamous cell carcinoma by suppressing hypoxia-inducible factor-1 alpha expression, Tumor Biol. 35 (2014) 10765–10771.
[78] X. Yang, B.X. Yang, J. Cai, C. Zhang, Q. Zhang, L.P. Xu, Q. Qin, H.C. Zhu, J.X. Ma, G.Z. Tao, H.Y. Cheng, X.C. Sun, Berberine enhances radiosensitivity of esophageal squamous cancer by targeting HIF-1 alpha in vitro and in vivo, Cancer Biol.Ther. 14 (2013) 1068–1073.
[79] P.C. McDonald, S. Dedhar, Carbonic anhydrase IX (CAIX) as a mediator of hypoxia-induced stress response in cancer cells, Subcell. Biochem. 75 (2014)255–269.
[80] S.G. Peeters, C.M. Zegers, R. Biemans, N.G. Lieuwes, R.G. van Stiphout, A. Yaromina, J.D. Sun, C.P. Hart, A.D. Windhorst, W. van Elmpt, L.J. Dubois, P.Lambin, TH-302 in combination with radiotherapy enhances the therapeutic outcome and is associated with pretreatment [18F]HX4 hypoxia PET imaging, Clin. Cancer Res. 21 (2015) 2984–2992.
[81] N. Baran, M. Konopleva, Molecular pathways: hypoxia-activated prodrugs in cancer therapy, Clin. Cancer Res. (2017).
[82] D. Di Perri, J.A. Lee, A. Bol, F.X. Hanin, G. Janssens, D. Labar, A. Robert, E. Sterpin, X. Geets, Evolution of [18F]fluorodeoxyglucose and [18F]fluoroazomycin arabinoside PET uptake distributions in lung tumours during radiation therapy, Acta Oncol. (Stockholm, Sweden) 56 (2017) 516–524.


Ruben T.H.M. Larue*, Lien Van De Voorde*, Maaike Berbée, Wouter J.C. van Elmpt, Ludwig J. Dubois, Kranthi M. Panth, Sarah G.J.A. Peeters, Ann Claessens,
Wendy M.J. Schreurs, Marius Nap, Fabiënne A.R.M. Warmerdam, Frans L.G. Erdkamp, Meindert N. Sosef and Philippe Lambin
*Equal contributors
A phase 1 ‘window-of-opportunity’ trial testing
evofosfamide (TH-302), a tumour-selective
hypoxia-activated cytotoxic prodrug,
with preoperative chemoradiotherapy in
oesophageal adenocarcinoma patients
BMC Cancer (2016) 16: 644
Chapter 7

PART III | Chapter 7
200
ABSTRACT
BackgroundNeo-adjuvant chemoradiotherapy followed by surgery is the standard treatment with curative intent for oesophageal cancer patients, with 5-year overall survival rates up to 50 %. However, patients’ quality of life is severely compromised by oesophagectomy, and eventually many patients die due to metastatic disease.Most solid tumours, including oesophageal cancer, contain hypoxic regions that are more resistant to chemoradiotherapy. The hypoxia-activated prodrug evofosfamide works as a DNA-alkylating agent under these hypoxic conditions, which directly kills hypoxic cancer cells and potentially minimizes resistance to conventional therapy. This drug has shown promising results in several clinical studies when combined with chemotherapy. Therefore, in this phase I study we investigate the safety of evofosfamide added to the chemoradiotherapy treatment of oesophageal cancer.
Methods/DesignA phase I, non-randomized, single-centre, open-label, 3 + 3 trial with repeated hypoxia PET imaging, will test the safety of evofosfamide in combination with neo-adjuvant chemoradiotherapy in potentially resectable oesophageal adenocarcinoma patients. Investigated dose levels range from 120 mg/m2 to 340 mg/m2. Evofosfamide will be administered one week before the start of chemoradiotherapy (CROSS-regimen) and repeated weekly up to a total of six doses. PET/CT acquisitions with hypoxia tracer 18F-HX4 will be made before and after the first administration of evofosfamide, allowing early assessment of changes in hypoxia, accompanied with blood sampling to measure hypoxia blood biomarkers. Oesophagectomy will be performed according to standard clinical practice.Higher grade and uncommon non-haematological, haematological, and post-operative toxicities are the primary endpoints according to the CTCAEv4.0 and Clavien-Dindo classifications. Secondary endpoints are reduction in hypoxic fraction based on 18F-HX4 imaging, pathological complete response, histopathological negative circumferential resection margin (R0) rate, local and distant recurrence rate, and progression free and overall survival.
DiscussionThis is the first clinical trial testing evofosfamide in combination with chemoradiotherapy. The primary objective is to determine the dose limiting toxicity of this combined treatment and herewith to define the maximum tolerated dose and recommended phase 2 dose for future clinical studies. The addition of non-invasive repeated hypoxia imaging (‘window-of-opportunity’) enables us to identify the biologically effective dose. We believe this approach could also be used for other hypoxia targeted drugs.
Keywords: Oesophageal cancer, Neoadjuvant chemoradiotherapy, Evofosfamide, Oesophagectomy, Dose limiting toxicity, Hypoxia imaging, Window-of-opportunity trial

PART III | Chapter 7
201
7
BACKGROUND
The incidence of oesophageal cancer in developed Western countries has risen in recent decades [1]. Adenocarcinoma is now more prevalent than squamous cell carcinoma, with most tumours located in the distal oesophagus. A Western lifestyle is a risk factor and the disease is associated with obesity and symptomatic gastro-oesophageal reflux [2]. The standard treatment with curative intent for T2 or higher stage tumours consists of neoadjuvant chemoradiotherapy (nCRT) followed by surgery, [3] as confirmed by the Dutch ChemoRadiotherapy for Oesophageal cancer followed by Surgery Study (CROSS) [4]. In this study, significantly better 5-year overall survival (OS) rates were observed for patients treated with nCRT followed by surgery (47 %; 95 % CI 39–54) when compared to surgery alone (33 %; 95 % CI 26–40), with greater benefits for squamous cell carcinoma (61 % vs. 30 %) than for adenocarcinoma (43 % vs. 33 %) [5]. However, little progress has been made in long-term survival (median OS ~49 months) and the patients’ quality of life is still severely compromised by the impact of oesophagectomy. Therefore, there is an urgent need for new innovative treatment strategies.
The role of the tumour microenvironment in cancer progression, and especially the difference between this microenvironment and surrounding normal tissue, is a subject of increasing investigational interest with a specific focus on hypoxia. Hypoxic tumour cells promote a more aggressive phenotype, are associated with increased metastatic potential, and are known to be more resistant to standard chemoradiotherapy [6, 7, 8, 9, 10, 11, 12, 13, 14]. Recently, even micro-metastases have been shown to exhibit hypoxia [15]. Up to 5–10 % of the oesophageal cancer patients suffer from progressive disease with metastases shortly after completion of neoadjuvant chemoradiotherapy [16] and the majority of patients eventually die because of metastatic disease. Therefore, hypoxia is an attractive target for newly developed drugs to increase the therapeutic effect of conventional oesophageal cancer treatment modalities.
Evofosfamide (TH-302) is a hypoxia-activated prodrug only activated under low levels of oxygen (hypoxia) [17, 18, 19, 20, 21, 22, 23]. Evofosfamide exploits the activation of a nitroimidazole prodrug by a process that involves the reduction of one electron, mediated by ubiquitous cellular reductases as the NADPH cytochrome P450 reductase to generate a radical anion prodrug. In the presence of oxygen (normoxia) the radical anion prodrug reacts rapidly with oxygen to produce superoxide and re-generate the original prodrug. Under the low-oxygen conditions of the hypoxic zones in tumours, however, the radical anion form of the prodrug has a longer half-life and can either fragment directly, or undergo further reductions, releasing the active drug bromo-isophosphoramide mustard that acts as a DNA cross-linker.
Recently, our group reported the radio-sensitizing effect of evofosfamide in a preclinical setting using syngeneic rat R1 rhabdomyosarcoma and human H460 NSCLC (non-small cell lung cancer) xenograft tumour models. Evofosfamide treatment significantly reduced the hypoxic fraction, by more than 80 % compared to the control

PART III | Chapter 7
202
tumours in both tumour models. This was visualized at either micro-regional level or on PET images with the hypoxia tracer 18F-HX4 (Figure 1). Treatment with evofosfamide alone caused a significant delay in tumour growth while, when combined with radiotherapy (8 Gy), the growth delay was further enhanced. In addition, hypoxic fractions determined by pre-treatment 18F-HX4 scans were predictive for the response associated with evofosfamide treatment. Therefore, a pre-treatment 18F-HX4 scan may be beneficial for selection of patients for evofosfamide treatment and a post treatment 18F-HX4 scan enables to monitor treatment efficacy [20].
Evofosfamide has already been clinically investigated both as monotherapy and in combination with chemotherapy or other targeted cancer drugs in over 1,500 patients, and is currently under investigation in more than fifteen clinical trials registered at clinicaltrials.gov. Investigated tumours include soft tissue sarcoma, pancreatic cancer, non-small cell lung cancer, melanoma, and haematological malignancies. In general, the drug is well tolerated with main toxicities being higher-grade skin and mucosal toxicities, in particular in doses above 240 mg/m2 [24, 25]. In patients with advanced pancreatic cancer or soft-tissue sarcoma the combination of chemotherapy with evofosfamide achieved favourable outcomes, [26, 27] leading to two phase III clinical trials (NCT01746979 and NCT01440088). Despite the promising pre-clinical results demonstrating the potential added value of evofosfamide in combination with radiotherapy [20], to date no clinical studies have been performed to confirm this.The primary objective of this 3 + 3 dose escalation phase I ‘window-of-opportunity’ trial is to investigate the safety of evofosfamide in combination with the standard CROSS regimen in patients with distal oesophageal and oesophago-gastric junction adenocarcinoma, to determine the dose-limiting toxicities (DLTs) of the combined regimen and consequently to find the maximum tolerated dose (MTD) and recommended phase II dose (RP2D). As 18F-HX4 has shown to be a hypoxia PET-tracer [28, 29, 30, 31, 32, 33, 34, 35] with good repeatability in oesophageal cancer [36], two 18F-HX4 PET-scans
Figure 1. Evosfofamide decreases the hypoxic fraction in a Rhabdomyosarcoma rat model. PET scans with hypoxia tracer 18F-HX4 were made before (day 0) and after (day 4) administering evofosfamide for four consecutive days at a dose of 25mg/kg.

PART III | Chapter 7
203
7
will be performed to characterize tumour hypoxia at baseline and visualize the potential change in hypoxia after the first administration of evofosfamide [9, 37].
METHODS/DESIGN
Study designThis is a phase I, non-randomized, single-centre, open-label, 3 + 3, ‘window-of-opportunity’ trial combining preoperative evofosfamide with the CROSS regimen (NCT02598687).
In this traditional 3 + 3 dose-escalation design [38, 39], a cohort of three patients will enter a given dose level, and if no dose limiting toxicity (DLT) is observed 30 days after surgery, the trial will proceed to the next dose level. If a DLT occurs in 1 of 3 patients at a given dose level, 3 additional patients will be added to the same dose level cohort. If the occurrence of DLT remains limited to 1 out of 6 patients, the trial will proceed to the next dose level. If a DLT occurs in 2 or more patients at a certain dose level, dose escalation will be stopped. The previous dose level is then considered the maximum tolerated dose (MTD) and, therefore, the recommended dose for a phase II study. This is also summarized in Figure 2. In this study three dose levels will be tested, which means that a maximum of nine to eighteen patients will be included.
Figure 2. Flowcharts summarizing the 3+3 dose escalating study design. In the first cohort of patients evofosfamide will be administered at a dose of 120 mg/m2. Depending on the observed toxicity, we will escalate to dose level 2, or de-escalate to dose level -1. In further dose levels we can only escalate to the next dose (up to 340mg/m2) or stop due to dose limiting toxicity.

PART III | Chapter 7
204
In- and exclusion criteriaPrior to treatment, patients are discussed at the centralized multidisciplinary tumour board consisting of, inter alia, a surgeon, medical oncologist, nuclear medicine physician and radiation oncologist. Potentially curable patients with histologically proven stage IB-IIIC T2-4 distal oesophageal or oesophago-gastric junction adenocarcinoma are eligible to participate in this study. The minimum age is 18 years and the patients need to be fit for chemoradiotherapy with a normal baseline electrocardiogram (ECG) and a performance status of 0–2 according to the World Health Organisation (WHO) classification.The most important exclusion criteria are: a history of thoracic radiotherapy, recent severe cardiac or pulmonary disease, pregnancy, and/or viral infection.
Study treatmentAll patients will receive nCRT according to the CROSS regimen (Carboplatin AUC = 2 mg/ml/min, Paclitaxel 50 mg/m2, concurrent radiotherapy 41.4 Gy/23 fractions) [4]. One starting dose of evofosfamide will be administered one week prior to the start of the nCRT, after which five additional administrations will be given weekly on the same day as Carboplatin and Paclitaxel, but 2–4 h prior to the chemotherapeutics (Figure 3). The drugs will be administered via a peripherally inserted central catheter (PICC) and an ECG will be made before and after administration of the first two fractions of evofosfamide. Investigated dose levels range from 120 mg/m2 to 340 mg/m2 evofosfamide, with the possibility to de-escalate to a dose level of 60 mg/m2 (Figure 2). Due to the activation of evofosfamide under all hypoxic conditions, the patients will receive extra skin-care, e.g. by using cold packs during administration, to reduce hypoxia and prevent the possible occurrence of any severe skin-toxicities.
Surgical resection will be attempted six to ten weeks after completion of the nCRT, depending on the patient’s characteristics and the lack of evidence for metastatic disease on a re-evaluation FDG-PET/CT-scan made before the planned surgery. Depending on tumour location and general comorbidity, either a minimally invasive transhiatal approach, including a one-field and low mediastinal lymph node dissection, or a transthoracic approach with a two-field lymph node dissection will be performed. The pathological tumour response of the resected specimen will be evaluated using the standardized pathology protocol, reporting, amongst others, the tumour regression grade according to the Mandard scoring [40], and the status of the resected lymph nodes and resection margins.
ImagingStandard non-invasive diagnostic modalities include a (whole-body) FDG-PET/CT scan and/or endoscopic ultrasound (EUS) with biopsy. Patients that are included in this study will receive two additional PET/CT-scans with the hypoxia tracer 18F-HX4: the first scan at baseline and the second scan three days after the first administration of evofosfamide (Figure 3). 18F-HX4 will be administered via a bolus intravenous injection 444 MBq (12

PART III | Chapter 7
205
7
mCi), and the PET/CT-scan will be acquired 4 h post injection. The detailed acquisition protocol was previously described by Zegers et al. [33]. Based on the available diagnostic information, only a single bed position centred around the primary tumour site will be imaged and a slice-thickness of 3 mm will be used for the CT-reconstruction [28, 29, 33, 34]. On both days a blood sample (5–7 ml) will be drawn before administration of 18F- HX4 to analyse the concentration of hypoxia related blood biomarkers carbonic anhydrase IX (CAIX) and osteopontin (OPN) [41].
Study parameters and endpointsThe main study endpoint is to determine the DLT and define the MTD and RP2D. DLT is defined as:• Uncommon grade 3 or higher non-haematological toxicity according to the Common
Terminology Criteria for Adverse Events (CTCAE) version 4.0. Grade III esophagitis in 50 % of the patients is accepted.
• Grade 4 or higher haematological toxicity according to CTCAE version 4.0.• Grade 4 or higher postoperative toxicity within 30 days post-surgery according to
the Clavien-Dindo classification [42]. For anastomotic leakage and cardiorespiratory complication we accept a rate of 50 % and 40 % respectively.
• Any grade 2 or higher non-haematological toxicity that does not resolve to grade 0 or 1 toxicity by the start of the next cycle, which is considered a DLT according to the judgement of the investigator or sponsor.
• Inability to begin the next cycle of treatment within two weeks of the last dose due to unresolved toxicity.
Secondary endpoints include investigating the change in hypoxia based on 18F-HX4 imaging and blood biomarkers to explore what would be the biologically effective dose, and anti-tumour activity measured by the rate of pathological complete response (pCR), histopathological negative circumferential resection margin (CRM) rate, local and distance recurrence rate, and progression free and overall survival.
Figure 3. Study treatment schedule. Prior to the start of the standard CROSS treatment, patients will receive additional 18F-HX4 scans before and after the first dose of evofosfamide.

PART III | Chapter 7
206
Post-treatmentEnd of treatment is defined as the date of the last radiotherapy fraction in case of treatment completion according to protocol. When a patient drops-out before the end of treatment for any reasons other than DLT, he or she will be replaced by an additional patient.If there is a complete remission on re-evaluation FDG-PET/CT-scan after chemoradiotherapy, a patient can discuss the possibility for a wait-and-see strategy off protocol [43]. The decision to proceed to the next dose level of evofosfamide will be made when the minimum post-surgery or post-chemoradiotherapy (if no further surgery) follow-up of each patient in a particular dose level is 30 days. Patients are examined weekly during the treatment. Follow-up starts directly after the end of treatment and adverse events will be assessed at 1 and 4 weeks after nCRT, right before surgery and one month after surgery. Thereafter, follow-up visits will be planned every three months in the first year after nCRT, twice in the second year, and then yearly until a minimum follow-up time of five years.
DISCUSSION
Known and potential risks and benefitsThe primary dose limiting toxicities of evofosfamide from clinical studies have indicated more haematological toxicity than in monotherapeutic chemotherapy. Skin and mucosal toxicities are common above doses of 240 mg/m2 [24, 25]. The mucosal toxicities increase with dose but are still treatable with conservative approaches. The percentage of grade 3 esophagitis is expected to be higher in our proposed study design than with the standard CROSS treatment, but can be managed adequately (feeding tube, parenteral nutrition).
Evofosfamide has not been tested in combination with carboplatin, paclitaxel and radiotherapy before, so no pharmacological interactions between these drugs are known. A potential risk is that all three drugs can cause mild haematological toxicity (reversible leukopenia, neutropenia and/or lymphopenia) in some patients, but it is not known if this effect will be amplified by combining the drugs. Therefore we start with low dose levels of evofosfamide in comparison to the maximum tolerated doses in previous clinical studies. As an extra safety measure, patients in the first cohort will only be included when the previously included patient has finished chemoradiotherapy.
We are aware that with our trial design, combining evofosfamide with trimodality treatment, it will be difficult to determine the exact cause of potential adverse events. An alternative design would be to only include oesophageal cancer patients that receive either chemotherapy (carboplatin and/or paclitaxel) or radiotherapy. However, this strategy currently is only applied in very rare palliative cases. Moreover, the dose levels of chemotherapy and radiotherapy in a palliative setting are different than in a curative setting. Potentially curable patients will always receive trimodality therapy and withholding one of the treatment modalities to test the safety in combination with

PART III | Chapter 7
207
7
evofosfamide in potentially curable patients would, obviously, be very unethical, especially since the effectiveness of evofosfamide in oesophageal cancer is not proven yet. Hence, we believe that it is essential to test evofosfamide in the setting as proposed in this trial.The benefit of this ‘window-of-opportunity’ trial is that the clinical activity of evofosfamide in patients with oesophageal cancer can be studied without being compromised by previous or interfering treatments [37]. Another benefit is that the combination therapy might overcome resistance to conventional treatment with chemoradiotherapy and creates a supra-additive effect with increased tumour response. Patients with a complete pathological response after neo-adjuvant treatment eventually could opt for a wait-and-see strategy to omit or postpone surgery.
Explorative image analysisHypoxia PET-tracer 18F-HX4 has been extensively used at our institute in both pre-clinical and clinical studies. It is shown that the tracer is not associated with any toxicity [31], has a stable uptake pattern [33], provides complementary information to metabolic FDG imaging [34], and has a good spatial stability in lung, head and neck [29], and oesophageal cancer [36]. The design of this trial enables us to study the hypoxic response based on imaging biomarker 18F-HX4 and blood biomarkers CAIX and OPN. This early response assessment will give us insight into the anti-tumour activity of evofosfamide, and can be used to define the optimal dose for future clinical research.
Calais et al. showed previously that high FDG-uptake regions at baseline identify tumour sub-volumes that are at a greater risk of recurrence [44]. Therefore explorative image analysis will be performed to visualize the spatial correlation between the baseline FDG-uptake and 18F-HX4 uptake first, and later investigate if the high uptake regions correlate with the patterns of residual disease. Also the correlation between 18F-HX4-imaging and hypoxia blood biomarkers CAIX and OPN will be evaluated.
Predictive models of outcome (e.g. pathological response, survival) will be developed based on a so-called Radiomics analysis. Radiomics is the extraction of a large number of quantitative intensity, shape and textural features from both CT and PET images [45]. It was shown that Radiomics features have prognostic value in both lung and head and neck cancer [46, 47, 48]. The additional value of Radiomics features in response prediction of oesophageal cancer patients is currently under investigation [49, 50, 51].
Another phase II clinical study currently investigates the effect of tumour hypoxia on the response to standard chemoradiation, by visualizing hypoxia with 18F-HX4-imaging before treatment and two weeks after the start of treatment (NCT02584400). Since the HX4-scanning settings are identical, the imaging data of both studies provide complementary information about the behaviour and influence of tumour hypoxia in oesophageal cancer treatment. All of this together may be of additional value to better stratify patients in the future [52], by identifying patients who would benefit from hypoxia-selective treatment, such as evofosfamide, already in an early stage.

PART III | Chapter 7
208
ABBREVIATIONS
18F-HX4: [18F]-fluortanidazoleAUC: Target area under the concentration-time curve in mg/ml/minCAIX: Carbonic anhydrase IXCRM: Circumferential resection marginCROSS: ChemoRadiotherapy for Oesophageal cancer followed by Surgery StudyCT: Computed tomographyCTCAE: Common toxicity criteria for adverse eventsDLT: Dose-limiting toxicityECG: ElectrocardiogramEUS: Endoscopic ultrasoundFDG: [18F]-fluordeoxyglucoseMTD: Maximum tolerated dosenCRT: Neo-adjuvant chemoradiotherapyOPN: OsteopontinOS: Overall survivalpCR: Pathological complete remissionPET: Positron emission tomographyPICC: Peripherally inserted central catheterRP2D: Recommended phase 2 doseTH-302: Former abbreviation for evofosfamideWHO: World Health Organisation
DECLARATIONS
AcknowledgementsAuthors acknowledge financial support from ERC advanced grant (ERC-ADG-2015, n° 694812 - Hypoximmuno) and the QuIC-ConCePT project, which is partly funded by EFPI A companies and the Innovative Medicine Initiative Joint Undertaking (IMI JU) under Grant Agreement No. 115151. This research is also supported by the Dutch technology Foundation STW (grant n° 10696 DuCAT & n° P14-19 Radiomics STRaTegy), which is the applied science division of NWO, and the Technology Programme of the Ministry of Economic Affairs. Authors also acknowledge financial support from EU 7th framework program (EURECA, ARTFORCE - n° 257144, REQUITE - n° 601826), SME Phase 2 (EU proposal 673780 – RAIL), the European Program H2020-PHC-2015 (BD2Decide - PHC30-689715), Kankeronderzoekfonds Limburg from the Health Foundation Limburg, Alpe d’HuZes-KWF (DESIGN) and the Dutch Cancer Society.
FundingThis trial is funded by the 2013 Atrium-Maastro grant, which is a collaboration between

PART III | Chapter 7
209
7
the former Atrium Medical Centre (since 2015 called Zuyderland Medical Centre) in Heerlen, and Maastro Clinic in Maastricht, The Netherlands.
Authors’ contributionsPL, LV, FW, FE, MS, WS, MN, MB, LD, WE and RL are the investigators of this trial and have as such contributed to drafting the original study protocol, without which this manuscript could not have been written. LV, AC, MB and RL were responsible for writing, optimizing and submitting the study protocol. PL, MS, WE, WS were the PIs for the Atrium-Maastro grant application and designed the study. LV and RL wrote this manuscript. SP, KP and LD were responsible for the pre-clinical data. All authors read and approved the final manuscript.
Authors' informationNot applicable.
Competing interestsThreshold Pharmaceuticals supplies evofosfamide and 18F-HX4. Threshold had no influence on the study protocol and was only contacted after the study protocol had been set. The authors declare that they have no competing interests.
Consent for publicationNot applicable.
Ethics approval and consent to participateThe study will be conducted according to the ICH Harmonised Tripartite Guideline for Good Clinical Practice and has been approved by the medical ethics committee of the Zuyderland Medical Centre (15 T85). All patients are given oral and written information about the study. They are given sufficient time to consider participation before the informed consent will be signed.
PART III | Chapter 7
210
REFERENCES
1. Castro C, Bosetti C, Malvezzi M, Bertuccio P, Levi F, Negri E, et al. Patterns and trends in esophageal cancer mortality and incidence in Europe (1980–2011) and predictions to 2015. Ann Oncol. 2014;25:283–290. doi: 10.1093/annonc/mdt486.
2. Melhado RE, Alderson D, Tucker O. The Changing Face of Esophageal Cancer. Cancers (Basel) 2010;2:1379–1404. doi: 10.3390/cancers2031379.
3. Tepper J, Krasna MJ, Niedzwiecki D, Hollis D, Reed CE, Goldberg R, et al. Phase III Trial of Trimodality Therapy With Cisplatin, Fluorouracil, Radiotherapy, and Surgery Compared With Surgery Alone for Esophageal Cancer : CALGB 9781. J Clin Oncol. 2008;26:1086–1092. doi: 10.1200/JCO.2007.12.9593.
4. van Hagen P, Hulshof MCCM, van Lanschot JJB, Steyerberg EW, van Berge Henegouwen MI, Wijnhoven BPL, et al. Preoperative chemoradiotherapy for esophageal or junctional cancer. N Engl J Med. 2012;366:2074–2084. doi: 10.1056/NEJMoa1112088.
5. Shapiro J, van Lanschot JJB, Hulshof MCCM, van Hagen P, van Berge Henegouwen MI, Wijnhoven BPL, et al. Neoadjuvant chemoradiotherapy plus surgery versus surgery alone for oesophageal or junctional cancer (CROSS): long-term results of a randomised controlled trial. Lancet Oncol. 2015;16:1090–1098. doi: 10.1016/S1470-2045(15)00040-6.
6. Bennewith KL, Dedhar S. Targeting hypoxic tumour cells to overcome metastasis. BMC Cancer. 2011;11:504. doi: 10.1186/1471-2407-11-504.
7. Pettersen EO, Ebbesen P, Gieling RG, Williams KJ, Dubois L, Lambin P, et al. Targeting tumour hypoxia to prevent cancer metastasis. From biology, biosensing and technology to drug development : the METOXIA consortium. J Enzyme Inhib Med Chem. 2015;30:689–721. doi: 10.3109/14756366.2014.966704
8. Ebbesen P, Pettersen EO, Gorr TA, Jobst G, Williams K, Kieninger J, et al. Taking advantage of tumor cell adaptations to hypoxia for developing new tumor markers and treatment strategies. J Enzyme Inhib Med Chem. 2009;24:1–39. doi: 10.1080/14756360902784425.
9. Dubois LJ, Niemans R, Van Kuijk SJA, Panth KM, Parvathaneni N, Peeters SGJA, et al. New ways to image and target tumour hypoxia and its molecular responses. Radiother Oncol. 2015;116:352–357. doi: 10.1016/j.radonc.2015.08.022.
10. Smits KM, Melotte V, Niessen HEC, Dubois L, Oberije C, Troost EGC, et al. Epigenetics in radiotherapy: Where are we heading ? Radiother Oncol. 2014;111:168–177. doi: 10.1016/j.radonc.2014.05.001.
11. Mengesha A, Dubois L, Chiu RK, Paesmans K, Wouters BG, Lambin P, Theys J. Potential and limitations of bacterial-mediated cancer therapy. Front Biosci. 2007;12:3880–3891. doi: 10.2741/2357.
12. Wouters BG, Van Den Beucken T, Magagnin MG, Lambin P, Koumenis C. Targeting hypoxia tolerance in cancer. Drug Resist Updat. 2004;7:25–40. doi: 10.1016/j.drup.2003.12.004.
13. Wouters BG, Koritzinsky M, Chiu RK, Theys J, Buijsen J, Lambin P. Modulation of Cell Death in the Tumor. Semin Oncol. 2003;13:31–41. doi: 10.1053/srao.2003.50004.
14. Wouters BG, Weppler SA, Koritzinsky M, Landuyt W, Nuyts S, Theys J, et al. Hypoxia as a target for combined modality treatments. Eur J Cancer. 2002;38:240–257. doi: 10.1016/S0959-8049(01)00361-6
15. Li X-F, O’Donoghue JA. Hypoxia in Microscopic Tumors. Cancer Lett. 2009;264:172–180. doi: 10.1016/j.canlet.2008.02.037.
16. Stiekema J, Vermeulen D, Vegt E, Voncken FEM, Aleman BMP, Sanders J, et al. Detecting Interval Metastases and Response Assessment Using F-FDG PET / CT After Neoadjuvant Chemoradiotherapy for Esophageal Cancer. Clin Nucl Med. 2014;39:862–867. doi: 10.1097/RLU.0000000000000517
PART III | Chapter 7
211
7
17. Sun JD, Liu Q, Wang J, Ahluwalia D, Ferraro D, Wang Y, et al. Selective tumor hypoxia targeting by hypoxia-activated prodrug TH-302 inhibits tumor growth in preclinical models of cancer. Clin Cancer Res. 2012;18:758–770. doi: 10.1158/1078-0432.CCR-11-1980.
18. Hu J, Handisides DR, Van VE, De RH, Menu E, Vande BI, et al. Targeting the multiple myeloma hypoxic niche with TH-302, a hypoxia-activated prodrug. Blood. 2010;116:1524–1528. doi: 10.1182/blood-2010-02-269126
19. Liapis V, Labrinidis A, Zinonos I, Hay S, Ponomarev V, Panagopoulos V, et al. Hypoxia-activated pro-drug TH-302 exhibits potent tumor suppressive activity and cooperates with chemotherapy against osteosarcoma. Cancer Lett. 2015;357:160–169. doi: 10.1016/j.canlet.2014.11.020.
20. Peeters SGJA, Zegers CML, Biemans R, Lieuwes NG, van Stiphout RGPM, Yaromina A, et al. TH-302 in combination with radiotherapy enhances the therapeutic outcome and is associated with pretreatment [18 F]HX4 hypoxia PET imaging. Clin Cancer Res. 2015;21:2984–2993. doi: 10.1158/1078-0432.CCR-15-0018.
21. Saggar JK, Tannock IF. Activity of the hypoxia-activated pro-drug TH-302 in hypoxic and perivascular regions of solid tumors and its potential to enhance therapeutic effects of chemotherapy. Int J Cancer. 2014;134:2726–2734. doi: 10.1002/ijc.28595.
22. Liu Q, Sun JD, Wang J, Ahluwalia D, Baker AF, Cranmer LD, et al. TH-302, a hypoxia-activated prodrug with broad in vivo preclinical combination therapy efficacy: optimization of dosing regimens and schedules. Cancer Chemother Pharmacol. 2012;69:1487–1498. doi: 10.1007/s00280-012-1852-8.
23. Portwood S, Lal D, Hsu Y-C, Vargas R, Johnson MK, Wetzler M, et al. Activity of the hypoxia-activated prodrug, TH-302, in preclinical human acute myeloid leukemia models. Clin Cancer Res. 2013;19:6506–6519. doi: 10.1158/1078-0432.CCR-13-0674.
24. Ganjoo KN, Cranmer LD, Butrynski JE, Rushing D, Adkins D, Okuno SH, et al. A Phase I Study of the Safety and Pharmacokinetics of the Hypoxia-Activated Prodrug TH-302 in Combination with Doxorubicin in Patients with Advanced Soft Tissue Sarcoma. Oncology. 2011;80:50–56. doi: 10.1159/000327739.
25. Weiss GJ, Infante JR, Chiorean EG, Borad MJ, Bendell JC, Molina JR, et al. Cancer Therapy : Clinical Phase 1 Study of the Safety, Tolerability, and Pharmacokinetics of TH-302, a Hypoxia-Activated Prodrug, in Patients with Advanced Solid Malignancies. Clin Cancer Res. 2011;17:2997–3005. doi: 10.1158/1078-0432.CCR-10-3425.
26. Chawla SP, Cranmer LD, Van Tine B a, Reed DR, Okuno SH, Butrynski JE, et al. Phase II Study of the Safety and Antitumor Activity of the Hypoxia-Activated Prodrug TH-302 in Combination With Doxorubicin in Patients With Advanced Soft Tissue Sarcoma. J Clin Oncol. 2014;32:3299–3306. doi: 10.1200/JCO.2013.54.3660.
27. Borad MJ, Reddy SG, Bahary N, Uronis HE, Sigal D, Cohn AL, et al. Randomized Phase II Trial of Gemcitabine Plus TH-302 Versus Gemcitabine in Patients With Advanced Pancreatic Cancer. J Clin Oncol. 2015;33:1475–1481. doi: 10.1200/JCO.2014.55.7504.
28. Zegers CML, Van Elmpt W, Hoebers FJP, Troost EGC, Öllers MC, Mottaghy FM, Lambin P. Imaging of tumour hypoxia and metabolism in patients with head and neck squamous cell carcinoma. Acta Oncol (Madr) 2015;54:1378–1384. doi: 10.3109/0284186X.2015.1062913.
29. Zegers CML, Van Elmpt W, Szardenings K, Kolb H, Waxman A, Subramaniam RM, et al. Repeatability of hypoxia PET imaging using [18 F]HX4 in lung and head and neck cancer patients: a prospective multicenter trial. Eur J Nucl Med Mol Imaging. 2015;42:1840–1849. doi: 10.1007/s00259-015-3100-z.
30. Wack LJ, Mönnich D, van Elmpt W, Zegers CML, Troost EGC, Zips D, Thorwarth D. HX4 for PET imaging of hypoxia – a simulation study. Acta Oncol (Madr) 2015;54:1370–1377. doi: 10.3109/ 0284186X.2015.1067721.
31. van Loon J, Janssen MHM, Ollers M, Aerts HJWL, Dubois L, Hochstenbag M, et al. PET imaging of hypoxia using [18 F]HX4: a phase I trial. Eur J Nucl Med Mol Imaging. 2010;37:1663–1668. doi: 10.1007/s00259-010-1437-x.

PART III | Chapter 7
212
32. Peeters SGJA, Zegers CML, Lieuwes NG, van Elmpt W, Eriksson J, van Dongen GAMS, et al. A Comparative Study of the Hypoxia PET Tracers [18 F]HX4, [18 F]FAZA, and [18 F]FMISO in a Preclinical Tumor Model. Int J Radiat Oncol. 2015;91:351–359. doi: 10.1016/j.ijrobp.2014.09.045.
33. Zegers CML, van Elmpt W, Wierts R, Reymen B, Sharifi H, Öllers MC, et al. Hypoxia imaging with [18F]HX4 PET in NSCLC patients: defining optimal imaging parameters. Radiother Oncol. 2013;109:58–64. doi: 10.1016/j.radonc.2013.08.031.
34. Zegers CML, van Elmpt W, Reymen B, Even AJG, Troost EGC, Ollers MC, et al. In Vivo Quantification of Hypoxic and Metabolic Status of NSCLC Tumors Using [18 F]HX4 and [18 F]FDG-PET/CT Imaging. Clin Cancer Res. 2014;20:6389–6397. doi: 10.1158/1078-0432.CCR-14-1524.
35. Dubois LJ, Lieuwes NG, Janssen MHM, Peeters WJM, Windhorst AD. Preclinical evaluation and valication of [18 F]HX4, a promising hypoxia marker for PET imaging. Proc Natl Acad Sci. 2011;108:14620–14625. doi: 10.1073/pnas.1102526108.
36. Klaassen R, Bennink RJ, van Tienhoven G, Bijlsma MF, Besselink MGH, van Berge Henegouwen MI, et al. Feasibility and repeatability of PET with the hypoxia tracer [18 F]HX4 in oesophageal and pancreatic cancer. Radiother Oncol. 2015;116:94–99. doi: 10.1016/j.radonc.2015.05.009.
37. Glimelius B, Lahn M. Window-of-opportunity trials to evaluate clinical activity of new molecular entities in oncology. Ann Oncol. 2011;22:1717–1725. doi: 10.1093/annonc/mdq622.
38. Storer BE. Design and analysis of phase I clinical trials. Biometrics. 1989;45:3.
39. Le Tourneau C, Lee JJ, Siu LL. Dose escalation methods in phase i cancer clinical trials. J Natl Cancer Inst. 2009;101:708–720. doi: 10.1093/jnci/djp079.
40. Mandard A-M, Dalibard F, Mandard J-C, Marnay J, Henry-Amar M, Pefiot J, et al. Pathologic Assessment of Tumor Regression after Preoperative Chemoradiotherapy of Esophageal Carcinoma Clinicopa thologic Correlations. Cancer. 1994;73:2680–2686. doi: 10.1002/1097-0142(19940601)73:11<2680::AID-CNCR2820731105>3.0.CO;2-C.
41. Rademakers SE, Span PN, Kaanders JHAM, Sweep FCGJ, Van Der Kogel AJ, Bussink J. Molecular aspects of tumour hypoxia. Mol Oncol. 2008;2:41–53. doi: 10.1016/j.molonc.2008.03.006.
42. Clavien P, Barkun J, de Oliveira ML, Vauthey JN, Dindo D, Schulick RD, et al. The Clavien-Dindo Classification of Surgical Complications Five-Year Experience The Clavien-Dindo Classification of Surgical Complications. Ann Surg. 2009;250:187–196. doi: 10.1097/SLA.0b013e3181b13ca2.
43. Noordman BJ, Shapiro J, Spaander MC, Krishnadath KK, van Laarhoven HW, van Berge Henegouwen MI, et al. Accuracy of Detecting Residual Disease After Cross Neoadjuvant Chemoradiotherapy for Esophageal Cancer (preSANO Trial): Rationale and Protocol. JMIR Res Protoc. 2015;4:e79. doi: 10.2196/resprot.4320.
44. Calais J, Dubray B, Nkhali L, Thureau S, Lemarignier C, Modzelewski R, et al. High FDG uptake areas on pre-radiotherapy PET/CT identify preferential sites of local relapse after chemoradiotherapy for locally advanced oesophageal cancer. Eur J Nucl Med Mol Imaging. 2015;42:858–867. doi: 10.1007/s00259-015-3004-y.
45. Lambin P, Rios-Velazquez E, Leijenaar R, Carvalho S, van Stiphout RGPM, Granton P, et al. Radiomics: extracting more information from medical images using advanced feature analysis. Eur J Cancer. 2012;48:441–446. doi: 10.1016/j.ejca.2011.11.036.
46. Leijenaar RTH, Carvalho S, Hoebers FJP, Aerts HJWL, van Elmpt WJC, Huang SH, et al. External validation of a prognostic CT-based radiomic signature in oropharyngeal squamous cell carcinoma. Acta Oncol (Madr) 2015;54:1423–1429. doi: 10.3109/0284186X.2015.1061214.
47. Aerts HJWL, Velazquez ER, Leijenaar RTH, Parmar C, Grossmann P, Cavalho S, et al. Decoding tumour phenotype by noninvasive imaging using a quantitative radiomics approach. Nat Commun. 2014;5:4006.

PART III | Chapter 7
213
7
48. Carvalho S, Leijenaar RTH, Velazquez ER, Oberije C, Parmar C, van Elmpt W, et al. Prognostic value of metabolic metrics extracted from baseline positron emission tomography images in non-small cell lung cancer. Acta Oncol (Madr) 2013;52:1398–1404. doi: 10.3109/0284186X.2013.812795.
49. Hatt M, Majdoub M, Vallieres M, Tixier F, Cheze Le Rest C, Groheux D, et al. FDG PET uptake characterization through texture analysis: investigating the complementary nature of heterogeneity and functional tumor volume in a multi-cancer site patient cohort. J Nucl Med. 2015;56:38–44. doi: 10.2967/jnumed.114.144055.
50. Hatt M, Visvikis D, Albarghach NM, Tixier F, Pradier O, Cheze-le RC. Prognostic value of 18 F-FDG PET image-based parameters in oesophageal cancer and impact of tumour delineation methodology. Eur J Nucl Med Mol Imaging. 2011;38:1191–1202. doi: 10.1007/s00259-011-1755-7.
51. Yip SSF, Coroller TP, Sanford NN, Huynh E, Mamon H, Aerts HJWL, Berbeco RI. Use of registration-based contour propagation in texture analysis for esophageal cancer pathologic response prediction. Phys Med Biol. 2016;61:906–922. doi: 10.1088/0031-9155/61/2/906.
52. Lambin P, Zindler J, Vanneste B, Van De Voorde L, Jacobs M, Eekers D, et al. Modern clinical research : How rapid learning health care and cohort multiple randomised clinical trials complement traditional evidence based medicine. Acta Oncol (Madr) 2015;54:1289–1300. doi: 10.3109/0284186X.2015.1062136.


DISCUSSION


General discussion and future perspectives
Chapter 8

DISCUSSION | Chapter 8
218
For the majority of patients with locally advanced oesophageal cancer the treatment of choice is a combination of chemo-/radiotherapy and surgery1. Unfortunately, there has not been a major breakthrough in improving overall survival and quality of life of these patients in the last decade. In this discussion, the research performed in this thesis is put in a wider perspective for the various parts important for optimal treatment of oesophageal cancer: staging and delineation issues, optimizing radiation treatment, understanding tumour biology and the use of possible biological modifiers.
8.1 OPTIMIZATION OF RADIOTHERAPY IN THE TREATMENT OF OESOPHAGEAL CANCER
ELECTIVE LYMPH NODE IRRADIATION
One of the most important contributions of preoperative radiotherapy in the treatment of oesophageal cancer is the improvement in locoregional control. We know that the number of metastatic lymph nodes (even when staged as ypT0) is a well established independent prognostic factor for predicting prognosis of oesophageal cancer patients 2,3. Persistent regional lymph node metastases (ypN1) portend poor survival and thus sterilization of these metastatic regional nodes may be of crucial importance4. In the CROSS trial node-positive disease remained in 31% after chemoradiation but in 75% with surgery alone1.
EUS, CT, DW MRI and fluorodeoxyglucose positron emission tomography (FDG-PET) afford regional lymph node imaging with advantages and limitations specific to each technique. MRI and EUS showed a higher sensitivity than CT for N staging but none of the three techniques had satisfactory results in terms of specificity and accuracy5. This may be partly attributed to the fact that pathological nodes are not necessarily enlarged just like swollen lymph nodes might be also only a sign of inflammation. The majority of pathological involved lymph nodes even measured less than 6 mm, making direct identification extremely challenging even on modern medical imaging6. In patients receiving neoadjuvant therapy, lymph nodes can atrophy and again be difficult to recognize macroscopically. Studies found a high variability in lymph node involvement depending on tumour histology, anatomic site and other factors. Understanding the patterns of node metastases and the risk factors underlying them is critical for answering the question whether or not elective node irradiation is useful.
Since a decade, radiotherapy is a crucial part of the treatment in oesophageal cancer patients but still nobody provided level I evidence to include or exclude elective nodal irradiation in the target volume. One could advocate that excluding elective nodal irradiation leads to smaller irradiation fields and hence potential less toxicity7. A reason to include ENI is to eliminate potential nodal micrometastases not diagnosed with the

DISCUSSION | Chapter 8
219
8
routine examination8,9. In addition, survival for patients with residual nodes appears to be extremely poor. Although we do not exactly know the whole process of metastatic disease, we assume that the spread and the nestling of tumour cells an early step is during initiation and progression of oesophageal cancer.
With our review in chapter 1 we wanted to investigate the lymph node distribution for including selective elective node irradiation in the treatment of oesophageal cancer patients. As inappropriate delivery could potentially cause loco-regional relapse or excess toxicity we precise the delineation process according to tumour location in our literature study. We reviewed 49 publications with surgical data on lymph node distribution depending on different tumour subgroups namely early, cervical, thoracic and gastro-oesophageal junction cancer. We reported consistent data on the location and frequency of lymph node spread according to different subtypes. Unfortunately, there are only limited date on the exact lymph node recurrence pattern. The findings of our study are based on pathology assessments instead of CT interpretation.
This thesis is first to provide a schematic illustration to guide the radiation oncologist in delineation of elective lymph node irradiation. For early oesophageal cancer, the risk of skip metastases appears very low and we recommend to include only nearby lymph node regions. In contrary, cervical oesophageal cancers are known for high locoregional recurrence and we suggest to include cervical to tracheal bifurcation lymph node regions. For patients with upper and lower TOC, inclusion of 101-106 (especially 106RecR) and region 110, station 1, 2, 3 and 7 respectively should be provided. For middle thoracic cancer, no strict recommendation can be made as lymph node distribution seems to be bidirectional. The radiation field for junctional oesophageal cancer should be extended to include paracardial, left gastric and lesser curve region compatible with region 1,2,3 and 7.
Until our publication, there has been published only one report with defined guidelines for lymph node delineation but these were restricted to gastro-oesophageal junctional adenocarcinomas. With our work we provide the radiation oncologist with five evidence-based recommendations, ready applicable on a daily basis.
A limitation of this paper is that most data involved large series of Asian patients with squamous cell cancer and our data might not be fully applicable for adenocarcinoma patients. Although Oppedijk et al.10 found only 3.3% of patients with isolated locoregional recurrence in the CROSS trial, it is not ruled out that the persistence of micrometastases in elective lymph node regions may be the cause of distant tumour recurrence. As yet, all assembled data are retrospective and therefore, further prospectively multicenter studies are still needed.
We therefore recommend a randomized controlled trial to compare ENI and no ENI with the need of a large sample size to compare mortality between both patient groups. As a radiation oncologist one should be caution to eliminate elective lymph node irradiation until the results of this research is presented 11.

DISCUSSION | Chapter 8
220
We recommend to create a model for risk estimation to provide radiation oncologists with quantifiable information and facilitate decision making about whether and which regional nodes should be included in the radiation field.
THE INFLUENCE OF GASTRIC FILLING INSTRUCTIONS
Tumour size, shape and position may change during radiotherapy but there are no conclusive data on the nature of these target variations during treatment course. This is particularly true for gastro-oesophageal junction (GEJ) tumours, since this is in area with large amounts of uncertainty due to respiratory motion and gastric filling.
The current way of radiotherapy has the treatment planned on a snapshot dataset of the patient’s anatomy taken at the time of simulation. This snapshot may vary from initial simulation as the stomach content varies depending on food and fluid intake. The variation in gas volume during treatment course may result in clinically undesired underdose or overdose.
So, variations in gastric filling may lead to significant interfraction differences in the location of perigastric nodes, and dose to normal stomach. As the right gastric and gastroepiploic vessels are important for making the gastric conduit in oesophagectomy, only a margin of 2-3 cm along the clinically uninvolved gastric mucosa is recommended. Muijs et al. found that microscopic disease extending beyond CTV margin has an inferior outcome and this further stresses the need for accurate targeted radiotherapy12.
Online adaptive radiation therapy (ART) could potentially address changes in the patient’s anatomy and/or physiology during the treatment course. So far,this clinical implementation is hampered by several technical limitations and chapter 2 reassures us that when taking 1cm PTV margin we can safely await further improvement in the development of online ART. The aim of our study was to investigate the dosimetric consequences of anatomic changes due to fluid and food instructions before radiotherapy in oesophageal cancer patients. We assumed that the radiotherapy plan might become suboptimal and influenced by the impact of food and fluid instructions in irradiating distal oesophgeal cancer patients with consequently the need for adaptive radiotherapy. Only patients where the cardia was part of the target volume were included.
The results of reconstructed DVH parameters (V95, V99, D5, Dmean, Dmin/max, V107) of 100 kVCBCTs in patients with (n=10) and without (n=10) food and fluid instructions at least three hours before treatment simulation and radiotherapy were investigated. There was no significant difference in the two groups in tumour coverage for the planning target volume. Furthermore, irrespectively of intake instructions, there is no significant geographic miss (5% reduction of V95% or Dmean) in irradiatiating oesophageal cancer patients. If a margin of 1cm is used to form the PTV, quantitave imaging analysis and visual inspection did no argument for the need of adaptive radiotherapy. We did find a trend in higher maximum dose and V107 in the kVCBCT which might be explained by

DISCUSSION | Chapter 8
221
8
the presence of air pockets and consequent less absorption of the treatment beam. There are only a few studies on the dosimetric effect induced by gas and filling changes in radiotherapy of lower gastrointestinal cancers13. Our study focused more on the effect of gastric filling but in the study of Jin et al.13 some patients also had unpredictable gas volumes over the treatment course.
The findings in chapter 2 are in line with the findings of the study of Bouchard et al.14 He also found that stomach filling has a negligible impact on the dose delivery in patients with GEJ cancer using 3DCRT or IMRT. These differences in the amount of intraabdominal gas between fractions of individual patients can be substantial but clinical impact is negligible15.
Conclusions from our study should be drawn the context of the small number of patients. First of all, because of the limited soft-tissue contrast in the CBCT, it was difficult to delineate the CTV on the CBCT. The patient number was low and there are no preset values to define insufficient coverage of the target volume. In the study of Nyeng et al.16 the treatment was adapted if the volume receiving 95% of prescriped dose (V95%) coverage of CTV decreased >1% or planning target volume decreased by >3% which was more strict than in our study. Furthermore, we also did not investigate the potential influence on normal tissue dose.
Dose recalculation on kV CBCTwas sufficient to investigate the most important variation in dose-volume parameters compared to CT image. Our kV CBCT images were hampered by a limited field of view and a lack of soft-tissue contrast. Without our corrective method, CBCT has only a poor correlation to electron density and these images cannot replace traditional CT images for dose calculation accuracy17.
Dietary instructions do not contribute to optimal target coverage when using an adequate PTV margin of 1cm. To avoid overlooking potential important anatomical changes during oesophageal radiotherapy, frequent online or offline evaluation according to a decision support system could be implemented-especially when thinking of reducing PTV margin to less than 1 cm.
CERVICAL OESOPHAGEAL CANCER
Cervical oesophageal cancer is a rare disease, often locally advanced at diagnosis and unchartered territory for many oncologists. Some hypothesize that the biological behavior of CEC is more like head and neck cancer with predominant local invasiveness and less prone to distant metastases. So far, the optimal management of CEC has not been established.
Historically, treatment of cervical oesophageal cancer was dominated by surgery resulting in mutilating resection with consequently negative impact on quality of life. More than in with thoracic squamous cell oesophageal cancer, results of dCRT in

DISCUSSION | Chapter 8
222
treatment of CEC show comparable survival rates as to the surgical approach18. Because of the rarity of its occurrence there are only limited studies available. In our review in chapter 3, we collect the current knowledge and ongoing controversies surrounding CEC from the last three decades. We included 107 publications and provide recommendations to improve quality of care in CEC.
First of all, if we want to increase early detection of CEC and its precursor lesions namely squamous dysplasia, we need to search and verify more reliable biomarkers. For CEC, both treatment schedules for lower oesophageal carcinoma and head and neck squamous cell carcinoma are used.
As for chemotherapy, high-dose cisplatin, cisplatin/5FU, oxaliplatin/5-FU or carboplatin/paclitaxel are equally recommended. As for radiotherapy, the optimal radiation dose in combination with the optimal systemic backbone is another gap in our knowledge. Maximizing locoregional control with still acceptable treatment-related toxicity in cervical oesophageal cancer is of paramount importance. At present, there are conflicting results concerning the benefit of increasing the radiation dose to the the same dose level as in treating head and neck cancer. Radiation dose according the hypopharyngeal cancer protocol consist usually of 70 Gray in 35 fractions which is about 20 Gray higher than the 50.4 Gray in patients treated with dCRT for oesophageal cancer. Despite modern radiotherapy techniques, this higher dose can be complicated by potential radiation induced complications eg trachea perforation, bleeding, fistula and lung fibrosis. Until now, there are no hard data of level I evidence to support one regimen above the other.
The best results in CEC with respect to locoregionally disease control and survival can be achieved with dCRT and future studies should focus on which treatment regimen is the most optimal regarding radiation dose and systemic backbone.As there is an abundant lymph-capillary network in the cervical oesophagus and as already mentioned in chapter 1 we advise to include ENI (cervical, supraclavicular and paratracheal lymph nodes) when CEC invades the hypopharynx.
8.2 NEW LIFE FOR OLD DRUGS AND DATA
RADIOMICS
Upcoming data suggest that medical images contain more information than can be seen by the eye of the physician. Nowadays medical imaging post-processing tools allow to fulfill a more prominent role in identification and quantifaction of images. In addition at radiotherapy and radiology departments, we have a large archive of imaging data at our disposal, so using these data continuously from routine clinical practice for decision making or hypothesis testing in new oesophageal cancer patients could be
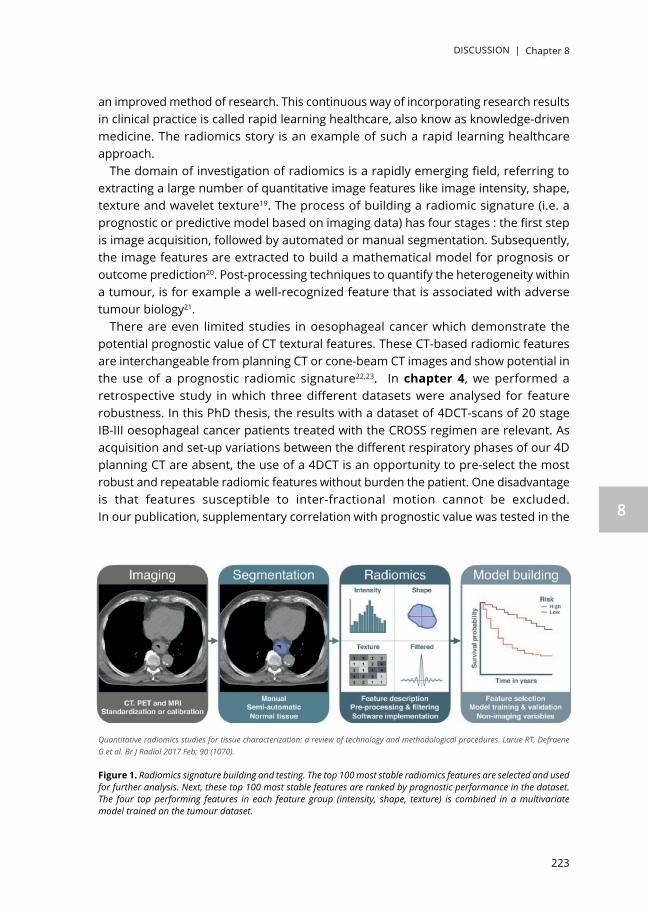
DISCUSSION | Chapter 8
223
8
an improved method of research. This continuous way of incorporating research results in clinical practice is called rapid learning healthcare, also know as knowledge-driven medicine. The radiomics story is an example of such a rapid learning healthcare approach.
The domain of investigation of radiomics is a rapidly emerging field, referring to extracting a large number of quantitative image features like image intensity, shape, texture and wavelet texture19. The process of building a radiomic signature (i.e. a prognostic or predictive model based on imaging data) has four stages : the first step is image acquisition, followed by automated or manual segmentation. Subsequently, the image features are extracted to build a mathematical model for prognosis or outcome prediction20. Post-processing techniques to quantify the heterogeneity within a tumour, is for example a well-recognized feature that is associated with adverse tumour biology21.
There are even limited studies in oesophageal cancer which demonstrate the potential prognostic value of CT textural features. These CT-based radiomic features are interchangeable from planning CT or cone-beam CT images and show potential in the use of a prognostic radiomic signature22,23. In chapter 4, we performed a retrospective study in which three different datasets were analysed for feature robustness. In this PhD thesis, the results with a dataset of 4DCT-scans of 20 stage IB-III oesophageal cancer patients treated with the CROSS regimen are relevant. As acquisition and set-up variations between the different respiratory phases of our 4D planning CT are absent, the use of a 4DCT is an opportunity to pre-select the most robust and repeatable radiomic features without burden the patient. One disadvantage is that features susceptible to inter-fractional motion cannot be excluded. In our publication, supplementary correlation with prognostic value was tested in the
Quantitative radiomics studies for tissue characterization: a review of technology and methodological procedures. Larue RT, Defraene G et al. Br J Radiol 2017 Feb; 90 (1070).
Figure 1. Radiomics signature building and testing. The top 100 most stable radiomics features are selected and used for further analysis. Next, these top 100 most stable features are ranked by prognostic performance in the dataset. The four top performing features in each feature group (intensity, shape, texture) is combined in a multivariate model trained on the tumour dataset.

DISCUSSION | Chapter 8
224
MAASTRO dataset of 120 oesophageal cancer patients. We considered features with a CCC index (concordance correlation coefficient) above 0.85 as a stable feature. Combining the unfiltered and wavelet features, in total 397/1045 (38%) radiomics features were shown to be robust in oesophageal cancer. Of these 397 stable features, 108 features were significantly associated with overall survival.
As already mentioned, there have been very few studies investigating the potential of texture analysis in primary oesophageal cancer. Our study design was retrospective and limited to only 20 oesophageal cancer patients witholding a proof of principle more than a actual prognostic value. Although our delineation of the GTV on the eight phases of 4D CT-scan was verified by the radiation oncologist, we acknowledge that it might be affected by interobserver dependency.
In literature, there is upcoming interest to further assess CT image texture parameters in which mostly CT tumour heterogeneity provides useful information in oesophageal cancer21-24. The study of Ganeshan et al.21 was the first to demonstrate that heterogeneity measured on CT images was associated with adverse biological features. A possible mechanism for these associations is the development of hypoxic voids in the presence of a heterogeneous vascular supply. A recent study from our group , Larue et al.25 suggested that the validated radiomics model should be combined with a the model using standard clinical variables to improve the prognostic value for treatment adaptation. Basically, these radiomic features show great promise for implementation in clinical decision support systems. The combination of both technical and clinical developments in the area of oesophageal cancer will stimulate further treatment optimization and personalization while avoiding dangerous and costly complications.
The preliminary results of this work are not yet accurate enough to base clinical decisions on, but they show that this radiomics approach most definitely has the potential to become an important factor in clinical routine.
To further build a prognostic model using our imaging data , we will need external validation in large, independent datasets acquired in a standardized manner. When using a large number of features, significant statistical problems arise from analysis of these features, with as a result overfitting leading to relationships being seen were there are none. The result is that the bulk of hundred or even thousand features are assessed without any clinical significance. Another downside of the radiomics approach might be that the method is critically dependent on image acquisition settings which may vary across different institutions and operators.Then again, radiomics is an inexpensive and non-invasive way of providing a clinical useful biomarker.
The Computer Assisted Theragnostics (CAT) concept is an attractive way of analyzing the data. By creating a shared database with medical imaging and characteristics in cancer patients, tumours and treatments- we can greatly improve the ability to learn and predict the outcome of individual treatments within the coming years. Consequently, the data used in our publication is publically available online on www.cancerdata.org.

DISCUSSION | Chapter 8
225
8
In future trials, extracted features should be consistent in regard to inter-scanner variability and inter-reconstruction algorithm variability26. Up till now, uncertainty about exact measurement characteristics of quantitative image biomarkers is a barrier to the planning of large-scale multicenter trials. We advocate for detailed recommendations regarding every step of the radiomics workflow to increase the quality of these studies and validate their importance in clinical endpoints. In this way, we can launch prospective multicenter trials to implement texture analysis tools for clinical purpose and personalized medicine.
We therefore recommend to perform the future radiomics analysis with enforced usage of standardization protocols and stable features to avoid incorrect feature interpretation and overly optimistic claims of robustness. The use of 4D CT-scans in oesophageal cancer can be used as a surrogate for test-retest data and as a first step to eliminate unstable radiomic features in a feature selection procedure.
METFORMIN
In 1926, Warburg et al.27 found that cancer cells take up glucose and obtain energy from anaerobic glycolysis and lactate production (Warburg effect). Poor glycemic control has been shown to be associated with worse prognosis in cancer, also in oesophageal cancer28.
Metformin, due to its low cost and less adverse reactions has become a first-line medication for treatment of type 2 diabetes mellitus. Recently, this drug has attracted more concern due to its anti-cancer effects with also limited results in oesophageal cancer which might stimulate future studies29.
In vivo and in vitro studies have showed that metformin (1,1-dimethylbiguanide) as an antidiabetic drug can have a direct (insulin-independent) and indirect (insulin-dependent) antitumour effect. The direct effect is mediated by disrupting complex I of the mitochondrial respiratory chain which leads to reduced cellular energy stores of ATP. Consequently, the 5’ adenosine monophosphate-activated protein kinase (AMPK) is activated leading to downstream stimulation of catabolic processes that generate ATP such as glycolysis, suppression of gluconeogenesis, protein and fatty acid synthesis, which, in turn, reduces tumour cell progression.
The indirect effect of metformin is responsible for inhibition of the transcription of key gluconeogenesis genes in the liver and stimulates glucose uptake and thus reducing fasting blood glucose and insulin.
In addition, metformin might also display growth inhibitory and radiosensitizing effects in several cancer cell and mouse tumour models by other unknown anticancer effects30,31. The mechanism by which metformin alters radiation response is multifaceted and includes direct radiosensitization as well as reduction in tumour hypoxia. An interesting study from Wang et al.32 showed greater anti-cancer effects when combining

DISCUSSION | Chapter 8
226
metformin with cisplatin via inhibiting the proliferation and promoting the apoptosis ability of ESCC cells. Until now, the role of metformin in oesophageal cancer cells has seldom been studied.
Our study in chapter 5 reported on the relationship between the use of metformin and outcome (pCR, DMFS and OS) in 196 patients with oesophageal cancer of which 19 patients were taking metformin. In this population-based study, we found from the multivariate analysis that metformin use was the only prognostic factor for OS (p=0.043). We published the first study in which the survival benefit of metformin in oesophageal cancer patients was assessed. Only two other studies reported on the use of metformin in oesophageal cancer patients with conflicting results. Skinner et al.33 found an increased pCR rate compared to non-users of metformin in oesophageal adenocarcinoma. The study of Spiering et al.34 (n=43) failed to found a higher pathological response rate or improved overall survival or disease-free survival compared with non-metformin use in patients receiving neoadjuvant chemo(radio)therapy for resectable oesophageal cancer.
The reason for these contradictory results may be due to different tumours profiles. Unfortunately, all these studies including our trial are retrospective in nature without the availability of biomarkers to predict metformin benefit and response to therapy. Our study had a relatively small sample size and had no information on potential life style confounders, BMI or socioeconomic factors. Nevertheless, our findings are important to contribute to the overall evidence of metformin and oesophageal cancer. Larger studies are required to further elucidate the role of metformin in outcome for oesophageal cancer patients. Metformin has a favourable safety profile, even in those patients without type II diabetes and consequently this implies low risk when conducting metformin studies at a population level35. The enhancement of metformin-induced tumour response in oesophageal cancer patients may be of most benefit in patients exhibiting key biomarkers like hyperinsulinemia, tumours expressing the insulin receptor or loss of the tumour suppressor p53. Loss of p53 impairs the ability of cancer cells to respond to metabolic changes induced by metformin and to survive under conditions of nutrient deprivation36.
There is evidence that there is an interindivual variability of metformin pharmacokinetic parameters37. One of the missing links in this different metformin response could be dependent on drug transporters and drug-drug interactions. More effort should be put into validating the potential genetic, non-genetic, environmental and epigenetic factors accounting for this significant fraction of variability.
A recent study demonstrated that metformin even inhibited oxygen consumption of cancer cells in vitro and in vivo and reduced tumour hypoxia38. Noninvasive hypoxia imaging could be a helpful tool to provide us information on metformin-induced changes in tumour oxygenation31. There is early evidence that hypoxia radiomics signature derived from CT and FDG-PET have the potential to inform interventional trials e.g. with metformin on hypoxic tumour state39.

DISCUSSION | Chapter 8
227
8
Both univariate and multivariate analysis confirmed that survival was significantly better for patients using metformin. Our analysis support the launch of prospective studies with metformin using imaging (hypoxia PET or hypoxia radiomics signature) to stratify patients on pretreatment hypoxia to assess whether patients with hypoxic tumours benefit selectively for metformin treatment in combination with radiation therapy.
8.3 EXPLOITING HYPOXIA IN OESOPHAGEAL CANCER
PRESENCE OF HYPOXIA IN OESOPHAGEAL CANCER
In general terms, hypoxia is an important negative prognostic factor for overall survival in cancer patients treated with chemotherapy and radiotherapy. In hypoxic conditions, the amount of free radicals induced by radiation therapy is reduced and hypoxic regions become more chemo-and radiotherapy resistant. Accordingly, patients with hypoxic oesophageal cancer might need a different, personalized treatment approach to reach therapeutic success. Heterogeneity of tumour blood supply results in the formation of hypoxic voids, which is associated with adverse tumour biology. Assessment of tumour heterogeneity by non-invasive imaging like radiomics of imaging with nitroimidazole derivatives could provide a biomarker for prediction of bad treatment response.
In search for potential hypoxia targeted treatment strategies we performed a PICOS-based systemic review in the evidence of hypoxia-associated molecular biomarkers in oesophageal cancer. Furthermore, we investigated the role of these biomarkers in treatment response and outcome.
After thorough selection we included 22 publications in our systematic review in chapter 6. Several studies confirmed the presence of hypoxia-associated biomarkers e.g. HIF-1alfa, CA IX, GLUT-1 overexpression and elevated uptake of the PET-tracer 18F-fluoroerythronitroimidazole (18F-FETNIM). Unfortunately, we found diverging results concerning the presence of hypoxia-associated markers (namely HIF-1alfa and CA IX) and its link with prognosis. In a meta-analyses by Ping et al.40 HIF-1alfa overexpression was significantly associated with poor overall survival.
Potential reasons for discrepancies in results of our publication might arise from population, tumour stage, histology or methodoly differences (e.g. kinetic differences). This wide variety of clinicopathological factors were not investigated. It is noteworthy that most studies involved an Asian tumour population, therefore extensive validation of the presence of hypoxia associated biomarkers in oesophageal cancer in the European population is lacking. Genetic alterations and inflammation have also the potential to influence the hypoxia-associated molecular responses and these were not investigated in our systematic review.

DISCUSSION | Chapter 8
228
There is definitely a role for a more robust hypoxia biomarker to explore the dynamics of tumour hypoxia and its effect on treatment. In this way,non-invasive PET-based hypoxia imaging shows a promising potential in mapping oesophageal cancer hypoxia41. As shown in the study of Brink et al.42 adenocarcinoma of the oesophagus contained a higher percentage hypoxic areas detected by FMISO PET.
Including non-invasive hypoxia imaging in window-of-opportunity trials could individualize treatment (e.g. with the use of hypoxia-activated prodrugs or HAPs). An ideal 2-nitroimidazole PET-tracer should have an oxygen-specific retention mechanism, and have a rapid and complete clearance of unbound radioactive tracer (i.e 18F-FAZA, 18F-HX4). However, tumour hypoxia can be even present in microscopic tumour deposits which would not be visualized in hypoxia imaging (PET-and/or MR-based).
Invasively acquired biomarkers report unreliable results and are lacking the ability to capture the full intricacies of tumor hypoxia and its heterogeneity in oesophageal cancer.We therefore might need a combination of robust and quantitative molecular biomarkers and non-invasive imaging to assess the real hypoxic state in oesophageal cancer. This could result in adequate patient selection for further hypoxia-specific treatment trials with HAPs which release cytoxic warheads under hypoxic conditions.
EVOFOSFAMIDE (TH-302)
Many conventional chemotherapeutic agents exhibit only a cytotoxic effect on the normoxic part of the tumour but are not active on the tumour hypoxic subregion.
We hypothesize that targeting the hypoxic niche of oesophageal cancer could pave the way to personalized therapy and improve the outcome in current treatment approach. In chapter 7, we designed a phase I non-randomized, single-center, open-label, 3+3 trial with repeated hypoxia PET imaging to test the safety of a HAP in oesophageal adenocarcinoma patients who are treated with the CROSS regimen.
Our trial aims to exploit TH-302 (Evofosfamide), a hypoxia-activated prodrug, selectively targeting hypoxic regions of solid tumours. By designing molecules to be activated under conditions of severe tumour hypoxia, there is a pipeline of “hypoxia-activated prodrugs”, or “HAPs”, that selectively target tumour cells. HAPs hold promise to be more effective in killing tumour tissue and less toxic to healthy tissue than conventional anti-cancer drugs.
To identify the hypoxic tumour profile, hypoxia PET tracers should be used, but unfortunately currently lack high tumour-to-background (TBR) ratios making image interpretation difficult.
TH-302 exploits the activation of a nitroimidazole prodrug by a process that involves a one electron reduction mediated by ubiquitous cellular reductases such as the NADPH cytochrome P450 reductase to generate a radical anion prodrug. In the

DISCUSSION | Chapter 8
229
8
presence of oxygen (normoxia) the radical anion prodrug reacts rapidly with oxygen to produce superoxide and regenerate the original prodrug. Under low oxygen conditions of the hypoxic zones in tumours, however, the radical anion form of the prodrug has a longer half-life and can either fragment directly, or undergo further reductions, releasing the active drug, a DNA cross-linker. Evofosfamide delivers a cytotoxic warhead, namely DNA-alkylating bromo-isophosporamide mustard (Br-IPM) within hypoxic regions of the tumour while maintaining relatively low systemic toxicity. There has been a wide experience with this agent in the clinical setting and our overall hypothesis is that this drug can decrease the hypoxic fraction and thereby increase the efficacy of tumour irradiation and activity of conventional anti-neoplastic agents. Preliminary results in an experimental rhabdomyosarcoma rat tumour model demonstrated that irradiation alone recuded the tumour growth, however, combining TH-302 with irradiation resulted in a pronounced further growth delay (Figure 2.)43. In-house in vivo research showed that the combination of evofosfamide and radiotherapy in two oesophageal cancer xenograft models results in an enhanced tumour growth delay without influencing the acute or late radiation-induced toxicity44.
Evofosfamide is available for intravenous infusion and will be administered one week before start of chemoradiotherapy and continued on a weekly basis prior to carboplatinum/paclitaxel for a total of 6 doses.To avoid added toxicity, the investigated dose levels will range from 120mg/m2 to 340mg/m2, a dose much lower than investigated in previous patient trials. In addition, this trial was designed as a window-opportunity-trial to evaluate the activity of TH-302 before the start of the CROSS regimen1. MAASTRO published the first in human trial to evaluate spatiotemporal stability and optimal acquisition parameters for [18F]Hx445. Consequently, we will use the validated Hx4 hypoxia PET tracer as a surrogate of intratumoural TH-302 distribution, which has similar mechanism of metabolic activation via its 2-nitroimidazole moiety.
Baseline hypoxia HX4 PET imaging will help us to localize better the hypoxia voxels in the tumour. The hypoxic response is to be tested by [18]F-HX4 imaging with preferred pharmacokinetic and clearance properties compared to other available nitroimidazoles. Imaging will be accompanied by blood sampling to measure hypoxia blood biomarkers. The primary endpoint of our study was to check the safety of this trimodality therapy with Evofosfamide. Finally, we want to define the maximum tolerated dose and recommended phase 2 dose for future clinical studies. There are no preclinical data on the combination of all three drugs which each can cause mild hematological toxicity and potential skin toxicity. In a worst case scenario this drug and radiotherapy combination results in severe unsuspected adverse events. As a safety measure we will only include the next patient in the dose level if no dose limiting toxicity is observed 30 days after surgery.

DISCUSSION | Chapter 8
230
Figure 2. The combination of TH-302 and radiotherapy (8 Gy) reduces tumour growth in a rhabdomyosarcoma (n = 8) and H460 (n ≥ 8) tumour model. A, growth curves; B, time to reach four times start volume (T4×SV). Animals were treated with either control (NaCl) or TH-302 administered to the rhabdomyosarcoma model for 4 consecutive days with a dose of 25 mg/kg and for the H460 model for 5 consecutive days using a dose of 50 mg/kg. Radiotherapy was performed on either the third or fourth day of TH-302 treatment. The HF of the control animals and the animals treated with TH-302 was analyzed in C for rhabdomyosarcoma (n = 6) both before and immediately after treatment using [18F]HX4 hypoxia PET imaging (top, representative [18F]HX4 PET images with the delineation of the total tumour volume in black and the HF in red (bottom, quantification of HF per group) and in D for H460 (n = 6) immediately after treatment using pimonidazole IHC staining [top, representative stainings, with hypoxia (pimonidazole) in green, perfusion (Hoechst) in blue, and vessels (CD31) in red]. The white scale bar indicates 500 μm. Bottom: quantification. Data, mean ± SEM. *, P < 0.05; **, P < 0.005; ***, P < 0.001; ****, P < 0.0001

DISCUSSION | Chapter 8
231
8
The addition of non-invasive repeated hypoxia imaging in a ‘window-of opportunity’ trial can identify the role of hypoxia activated prodrugs (e.g. evofosfamide) to increase the therapeutic effect of conventional multimodality treatment of oesophageal cancer.
EVOFOSFAMIDE TRIAL: CURRENT STATUS
Unfortunately, in december 2015 an announcement was made by Threshold Pharmaceuticals, Inc, the developer of the drug: Evofosfamide failed two phase III clinical trials46,47, one studying its possible efficacy in pancreatic cancer and one in advanced soft tissue sarcoma. The results were announced at an oral session during the 2016 ASCO Gastrointestinal Cancer Symposium, held in San Francisco in late January. The results from these two phase III trials examining evofosfamide in advanced pancreas cancer and soft tissue sarcoma patients, show the treatment offers little-to-no advantage47. In conclusion, Threshold was not pursing further development of the drug in oesophageal cancer. However, recent preclinical research shows that combining evofosfamide and anti-CTLA4/anti-PD-1 treatment can induce infiltration by T-cells in hypoxic therapy resistant zones48. Whether the net phenotypic result of hypoxia-induced changes is neoplastic growth impairment or promotion may be determined by the genomic state, the degree of hypoxia and microenvironmental epigenetic factors. Future trials should shed a light on the role of this contributing factors and their effect on systemic therapy efficacy.
Convert Pharmaceuticals recently developed a promising new HAP namely CP-506, which is designed as an active cytotoxic drug under severe hypoxic conditions. CP-506 was tested in vitro but also in tumour xenograft models (triple negative breast cancer, lung and pancreatic cancers) and showed a significant inhibition of tumour growth. In addition, CP-506 has a strong bystander effect i.e. the ability of the active metabolite to locally diffuse beyond the hypoxic core and induce tumour cell death. The combination of this HAP and predictive molecular and imaging biomarkers for patient selection holds great promise for the treatment of cancer49.
8.4 FUTURE PERSPECTIVES
RESPONSE PREDICTION
In oesophageal cancer, neoadjuvant chemoradiation is sometimes so effective that in about 30% of patients no malignant cells are found in the resection specimen, having a so called pathologic complete response. Pathologic complete response after nCRT may be an important clinical prognostic marker of a superior outcome. The chance of

DISCUSSION | Chapter 8
232
a complete response differs according to the histological subtype in favour of squamous cell histology. High-quality evidence from a Cochrane Systematic Review found that the addition of oesophagectomy had little or no difference on overall survival in locally advanced oesophageal squamous cell carcinoma50. Until now, it is undetermined whether these results can be applied to the treatment of adenocarcinomas and to people with poor response to chemoradiation.
In this way, routinely operating intrinsically heterogeneous patients populations might be incorrect and we should focus on careful patient selection for organ preservation or a wait-and-see policy. This organ preserving strategy with active surveillance after nCRT is already successful in patients with bladder, rectal and head-and neck cancer. It is expected that when implementing an active surveillance strategy we can avoid surgery in 30-40% of patients with locally advanced oesophageal cancer either by cure due to CRT or by tackling the early manifest progression of distant metastes during this active surveillance.
The first studies (SANO,ESOSTRATE study ) which compare active surveillance with immediate surgery in patients with oesophageal carcinoma are at the starting line but questions about oncological safety are unanswered51,52. The main problem is that we currently lack clear and truly valid selection criteria. Although pathologic complete response is predictable preoperatively to some extent, the accuracy remains low since the geographic distribution of resistant cancer in the resected specimen is unpredictable53. Limitation also exist in differentiating between viable residual tumour and post treatment inflammatory changes as well as in detecting microscopic disease54. We need prediction models that better meet the patients’needs and inform them on the benefits, morbidity and potential harms of the various treatment options55. In that way, individualizing cancer treatment is an important goal. Future studies should focus on tumour heterogeneity and consider the use of biomarkers to predict the response of anticancer treatment. Linking the imaging phenotype to the tumour genotype could be highly informative in creating a library of tumour response and treatment linkages.
Radiation oncology is a perfect fit for artificial intelligence, given the discipline’s heavy use for computers for tasks such as radiation therapy planning56. One of those powerful prediction tools is the rise of Rapid Learning Health Care (RLHC) also known as computer-assisted theragnostics. The basic idea is the (re-) use of historical data from routine clinical practice for decisions concerning new patients or to test new hypothesis. This modern clinical research necessitates adopting a data sharing philosophy across various institutions. Radiotherapy departments should share their data to meet this challenge and an example of this is the euroCAT project (http://www.eurocat.info ). Using potential quantitative image biomarkers in therapy guidance should be done using a consistent , automated and validated fashion. Future prospective multicenter clinical trials with further proof of significance of these textural features are awaited. While the implementation of radiomics in the tumour treating field is of much interest,

DISCUSSION | Chapter 8
233
8
we still do not fully understand the complex relationship of radiomics, clinical factors and tumour biology. Possible new imaging modalities and other post-processing techniques can help evolve radiomics to become of high clinical importance in the future57.
TREATMENT
Oesophageal cancer is a challenging disease since extensive treatment might be associated with a considerable decline in quality of life and yet still a poor prognosis. New research should spark new ideas and collaborations which will make a real difference to oesophageal cancer patients. Historically many studies focused on oesophageal SCC but nowadays the incidence of oesophageal adenocarcinoma has surpassed that of the squamous cell type in many Western countries. In line with decades of research, a new study by the Cancer Genome Atlas Research Network suggests that oesophageal squamous cell carcinoma and oesophageal adenocarcinoma may be totally separate diseases with a biological background which only partly overlap58.
There is still a notable ambiguity regarding the impact of dose escalation in the treatment of especially non-operable oesophageal carcinoma59-61.The Dutch prospective ARTDECO study is comparing standard chemoradiation with a higher dose up to 61.6 Gy in irresectable, in operable, M0 oesophageal cancer patients. The main aim of this study is to see if it is possible to improve outcome with dose escalation in oesophageal cancers. Other studies that clinicians eagerly await are the NeoAEGIS, ESOPEC, PROTECT and TOPGEAR study which investigate whether the addition of chemoradiotherapy to chemotherapy is superior to chemotherapy alone in the neoadjuvant setting.
Delivering an adequate dose to the oesophagus can be difficult because the close proximitiy of organs like heart, lungs and spinal cord. Proton therapy could be a unique way of irradiating the mid- and distal oesophagus while minimizing the damage to critical tissues because of its lack of exit dose and consequently limit posttreatment complications. However, to define the exact role of proton therapy in oesophageal cancer, we await more prospective clinical data, long-term results and cost-effectiveness studies. One concern is that protons are very sensitive to changes in density, and so if there is a slight change in the patient’s body positioning day to day, or a large change in the tumour mass during treatment, there would be a notable risk of marginally missing the target volume. The gastro-oesophageal junction (with the diaphragm in close proximity) is such an area, and as with IMRT, patients must be planned in a manner that locates anatomic areas as a function of the breathing phase62,63.
Successful opportunities for using radiotherapy in novel combinations with emerging molecules (e.g. targeted biologic therapy, hypoxia-activated prodrugs and immunotherapy) should be explored. To improve therapeutic response, these new molecular agents should be tested in a window of time before starting standard treatment allowing the evaluation of this drug in tumours unperturbed by previous therapies.

DISCUSSION | Chapter 8
234
A possibility to explore is the synergistic effect of radiation with immunological interventions. Oesophageal carcinomas show high mutational burden and have biological characteristics suitable for immunotherapy such as an overexpression of immune checkpoint proteins e.g. programmed death-ligand 1 (PD-L1)64. The use of immune checkpoint inhibitors constitutes a new therapeutic field for the therapy of gastrointestinal malignancies following the recent FDA approvals of PD-1 inhibitors for oesophago-gastric adenocarcinoma. These agents have shown efficacy in early studies in advanced oesofagogastric cancer65,66. Two studies in oesophageal cancers showed an overall response rate in the range of 20-30%67,68.
In a study of about 450 Asian patients nivolumab helped patients live longer than patients who received placebo. Certainly, nivolumab is a leading contender, but pembrolizumab, which is a very similar drug, is also currently being looked at in multiple phase III studies, some of which are complete and potentially for which we will have results over the next 1 or 2 years69. First trials for adjuvant or neoadjuvant use of immunotherapy started to recruit and I believe that the combination of these drugs with radiotherapy can potentially sensitize the tumour for its maximum activity. Knowledge of the exact mechanism of these new drug actions and combinations needs to be generated to guide this targeted therapy70. In addition, the surge of combining these immune checkpoint inhibitors with chemo-and or radiotherapy will necessitate further investigation of radiation dose and schedule to optimize clinical utility in combining these different treatments.
Scheer et al.71 took a comprehensive review of 22 studies and found that patients with a pCR are two to three times more likely to survive than are those with residual tumour at oesophagectomy. These data provide the rationale to examine treatment intensification of preoperative treatment since there might be a subpopulation of cancer cells that reside in the radioresistant hypoxic niche with a negative impact on the response of cancer treatment and subsequently survival. Developing new methods to overcome that resistance is crucial and one of these methods could be the development of antihypoxia treatment 72. Furthermore, research should focus on the development of robust and quantitative biomarkers to detect this hypoxic state or analyse the mechanisms of non-responsiveness to improve future trials. In this way, we will able to establish the role of hypoxia in oesophageal cancer and consequently establish the exact need for these hypoxia-associated prodrugs. Metformin is an example of a drug which influences hypoxic state by reducing oxygen consumption and therefore a promising strategy to overcome hypoxia. There is even early evidence that the efficacy of PD-1 blockade is potentiated by metformin-induced reduction of tumour hypoxia38. Several lines of evidence suggest that oxygen deprivation is generally to be considered as immunosuppressive as oxidative phosphorylation is required for many aspects of T-Cell function. Microenvironmental deficiencies may prevent T-cells from generating enough energy to carry out effector function. In this way, we believe that targeting hypoxia can assist in the design of new innovative immuno-oncology trials to improve therapeutic efficacy.

DISCUSSION | Chapter 8
235
8
Taking all this together, future trials should focus on precisely define the best treatment with the lowest toxicity and understand these risks and benefits for discussion with the patients.

DISCUSSION | Chapter 8
236
REFERENCES
1. van Hagen, P. et al. Preoperative Chemoradiotherapy for Esophageal or Junctional Cancer. N. Engl. J. Med. 366, 2074–2084 (2012)
2. Wang, Q., Yu, S. et al. Residual lymph node status is an independent prognostic factor in esophageal squamous cell Carcinoma with pathologic T0 after preoperative radiotherapy. Radiation oncology vol 10 pp142 (2015).
3. Gaca, J., Petersen, R. et al. Pathologic Nodal Status Predicts Disease-Free Survival After Neoadjuvant Chemoradiation for Gastroesophageal Junction Carcinoma. Annals of Surgical Oncology vol: 13 (3) pp: 340-346 (2006).
4. Groth S., Bryan B. Prognostic value of neoadjuvant treatment response in locally advanced esophageal adenocarcinoma. J Thorac Cardiovasc Surg 2019: 1-12.
5. Rice, T., Ishwaran, H. et al. Cancer of the Esophagus and Esophagogastric Junction: An Eight Edition Staging Primer. Journal of Thoracic Oncology (2017).
6. Foley K.G. , Christian A. et al. Accuracy of contemporary oesophageal cancer lymph node stag ing with radiological-pathological correlation. Clinical Radiology 2017: 72: 693.
7. Wang X, Miao C. et al. Can involved-field irradiation replace elective nodal irradiation in chemoradiotherapy for esophageal cancer? A systematic reviw and meta-analysis. Onco Targets Ther 2017; 10:2087-9.
8. Li Q, Zhu et al. Elective nodal irradiation provides a superior therapeutic modality for lymph node positivity esophageal squamous cell carcinoma patients receiving definitive radiotherapy versus involved-field irradiation. Medicine 2019; 98.
9. Yanagi M, Sasaki K et al. Effect of neoadjuvant Chemoradiotherapy on lymph node micrometastases in thoracic esophageal cancer. AntiCancer Res. 2018; 38: 893-900.
10. Oppedijk V., van der Gaast A., van Lanschot J.J., et al: Patterns of recurrence after surgery alone versus preoperative chemoradiotherapy and surgery in the CROSS trials. J Clin Oncol; 32: pp. 385-391 (2014).
11. Wu, A.J. et al. Expert consensus contouring guidelines for intensity modulated radiation therapy in esophageal and gastroesophageal junction cancer. International Journal of Radiation Oncology Biology Physics 92, 911-920 (2015).
12. Muijs C., Smit J., Karrenbeld A., et al: Residual tumor after neoadjuvant chemoradiation outside the radiation therapy target volume: a new prognostic factor for survival in esophageal cancer. Int J Radiat Oncol Biol Phys 2014; 88: pp. 845-852
13. Jin, P., Crama, KF. et al. Density override in treatment planning to mitigate the dosimetric effect induced by gastrointestinal gas in esophageal cancer radiation therapy. Acta Oncol.Oct 5: 1-9 (2018).
14. Bouchard M., McAleer M.F., and Starkschall G.: Impact of gastric filling on radiation dose delivered to gastroesophageal junction tumors. Int J Radiat Oncol Biol Phys; 77: pp. 292-300 (2010).
15. Kamphuis, M., Van Wieringen, N. et al. PO-1096 Inter-fraction variation of gas volume in the abdominal region during radiotherapy for distal esophageal cancer. Radiother. Oncolog.; 115: S592-593 (2015).
16. Nyeng, TB. , Nordsmark, M. et al. Dosimetric evaluation of anatomical changes during treatment to identify criteria for adaptive radiotherapy in oesophageal cancer patienst. Acta Oncol.; 54(9): 1467-73 (2015).
17. Lim-Reinders, S., Keller, BM. Et al. Online Adaptive Radiation Therapy. Int J Radiat Oncol Biol Phys Nov 15; 99(4): 994-1003 (2017).

DISCUSSION | Chapter 8
237
8
18. Zenda S., Kojima T. et al. Multicenter phase 2 study of Cisplatin and 5-fluorouracil with concurrent radiation as an organ preservation approach in patients with squamous cell carcinoma of the cervical esophagus. Int J Radiat Oncol Biol Phys 96 (5°: 976-984 (2016).
19. Aerts H.J.W.L., Velazquez E.R., Leijenaar R.T.H., Parmar C., Grossmann P., Cavalho S., et al: Decoding tumour phenotype by noninvasive imaging using a quantitative radiomics approach. Nat Commun; 5: pp. 4006 (2014).
20. Avanzo, M., Stancanello, J. et al. Beyond imaging: The promise of radiomics. Phys Med Jun; 38: 122-139 (2017).
21. Ganeshan B., Skogen K., Pressney I., Coutroubis D., and Miles K.: Tumour heterogeneity in oesophageal cancer assessed by CT texture analysis: preliminary evidence of an association with tumour metabolism, stage, and survival. Clin Radiol 2012; 67: pp. 157-164.
22. Niedzielski, J. S. et al. A Novel Methodology using CT Imaging Biomarkers to Quantify Radiation Sensitivity in the Esophagus with Application to Clinical Trials. Sci. Rep. 7, 6034 (2017).
23. Yip C., Landau D., Kozarski R., Ganeshan B., Thomas R., Michaelidou A., et al: Primary esophageal cancer: heterogeneity as potential prognostic biomarker in patients treated with definitive chemotherapy and radiation therapy. Radiology 2014; 270: pp. 141-148.
24. Yan Zhumin, Zhang J. Correlation of CT texture changes with treatment response during radiotherapy for esophageal cancer: an exploratory study. PlosOne 14(9): e0223140.
25. Larue, RTHM., Klaassen, R., Jochems, A. et al. Pre-treatment CT radiomics to predict 3-year overall survival following chemoradiotherapy of esophageal cancer. Acta Oncol. Aug1:1-7 (2018).
26. Van Rossum, Peter, Cai Xu, David et al. The emerging field of radiomics in esophageal cancer: current evidence and future potential. Translational Cancer Research, Vol 5, No 4 Aug (2016).
27. Warburg, O., Wind, F. et al. The metabolism of tumors in the body. J Gen Physiol. Mar 7; 8(6): 519-30 (1927).
28. Okamura, A., Watanabe, M. et al. Glycemic Status and Prognosis of Patients with Squamous Cell Carcinoma of the Esophagus. World J Surg Oct; 41(10): 2591-2597 (2017).
29. Liang F, Wang Y et al. Metformin inhibited growth, invasion and metastasis of esophageal squamous cell carcinoma in vitro and in vivo. Cell Physiol Biochem 2018; 51: 1276-1286.
30. Koritzinsky, M. Metformin: A novel biological modifier of tumor response to radiation therapy. International Journal of Radiation Oncology Biology Physics 93, 454–464 (2015).
31. Zannella, V. E. et al. Reprogramming metabolism with metformin improves tumor oxygenation and radiotherapy response. Clin. Cancer Res. 19, 6741–6750 (2013).
32. Wang, F., Ding, X., Wang, T. Metformin inhibited esophageal squamous cell carcinoma proliferation in vitro and in vivo and enhanced the anti-cancer effect of cisplatin. PloS One Apr 1; 12(4) (2017).
33. Skinner H.D., Crane C.H., Garrett C.R., et al: Metformin use and improved response to therapy in rectal cancer. Cancer Med; 2: pp. 99-107 (2013).
34. Spierings, LE., Lagarde, SM. Et al. Metformin Use During Treatment of Potentially Curable Esophageal Cancer Patients is not Associated with Better Ourcomes. Ann Surg Oncol. Dec; 22 Supl 3: 766-71 (2015).
35. Lacroix, O., Couttenier, A. et al. Impact of metformin on gastric adenocarcinoma survival: A Belgian population based study. Cancer Epidemiol. Apr; 53: 149-155 (2018).
36. Buzzai, M., Jones, RG. et al. Systemic treatment with the antidiabetic drug metformin selectively impairs p53-deficient tumorcell growth. Cancer Res Jul 15;67 (14): 6745-52 (2007).

DISCUSSION | Chapter 8
238
37. Riedmaier, E., Fisel, P. et al. Metformin and cancer: from the old medicine cabinet to pharmacological pitfalls and prospects. Trends Pharmacol Sci. Feb; 34(2): 126-32 (2013).
38. Scharping, NE., Menk, AV. et al. Efficacy of PD-1 Blockade is Potentiated by Metformin-Induced Reduction of Tumor Hypoxia. Cancer Immunol Res. Jan; 5(1): 9-16 (2017).
39. Sanduleanu,S., Jochems, A. et al. PO-0733 Non-invasive imaging for tumor hypoxia: a novel validated CT and FDG-PET-based Radiomic signature. Radiotherapy and Oncology 133: S376-S377. April (2019).
40. Ping, W., Sun, W. et al. Clinicopathological and prognostic significance of hypoxia-inducible factor-1alfa in esophageal squamous cell carcinoma: a meta-analysis. Tumour Biol. May;35(5): 4401-9 (2014).
41. Tao R. , Ager B. et al. Hypoxia imaging in upper gastrointestinal tumors and application to radiation therapy. J Gastrointest Oncol 2018; 9 : 1044-1053.
42. Brink, I., Baier, P. et al. Assessment of hypoxia in esophageal carcinomas using 18FMISO PET, Journal of nuclear medicine: official publication, Soci. Nucl. Med. 49(2008).
43. Peeters,S.G., Zegers C.M., Biemans, R. et al. TH-302 in combination with radiotherapy enhances the therapeutic outcome and is associated with pretreatment [18F]HX4 hypoxia PET imaging, Clin. Cancer Res. 21: 2984–2992 (2015).
44. Spiegelberg L., van Hoof Stefan J. et al. Evofosfamide sensitizes esophageal carcinomas to radiation without increasing normal toxicity. Radiother Oncol aug 17 (2019).
45. Van Loon, J., Janssen, MH. et al. PET imaging of hypoxia using (18F)HX4: a phase I trial. Eur J Nucl Med Mol Imaging. Aug; 37(9): 1663-8 (2010).
46. Tap, WD., Papai, Z. et al. Doxorubicin plus evofosfamide versus doxorubicin alone in locally advanced, unresectable or metastatic soft-tissue sarcoma (TH CR-406/SARC021): an international multicenter, open-label, randomized phase 3 trial. Lancet Oncol. Aug; 18(8): 1089-1103 (2017).
47. Van Cutsem, E, Lenz H, Furuse J, et al. Evofosfamide (TH-302) in combination with gemcitabine in previously untreated patients with metastatic or locally advanced unresectable pancreatic ductal adenocarcinoma: Primary analysis of the randomized, double-blind phase III MAESTRO study. J Clin Oncol. 34, 2016 (suppl 4S; abstr 193).
48. Immunotherapy Study of Evofosfamide in Combination With Ipilimumab. https://clinicaltrials.gov/ct2/show/NCT03098160.
49. Niemans R., A. Yaromina, et al. Abstract 4959: CP-506, a next generation hypoxia-activated prodrug, as promising novel anti-cancer therapeutic. Cancer Research 78 (13 supplement): 4959-4959,July 2018.
50. Vellapayan, BA., Soon, Y. et al. Chemoradiotherapy versus chemoradiotherapy plus surgery for esophageal cancer. Cochrane Database of Systemic Reviews; issue 8 (2017).
51. Noordman, BJ, Shapiro J., et al. Accuracy of Detecting Residual Disease after Cross neoadjuvant chemoradiotherapy for esophageal cancer (preSANO trial): rationale and protocol. JMIR Res Protoc. Jun 29; 4(2)(2015).
52. Comparison of Systematic Surgery Versus surveillance and rescue surgery in operable oesophageal cancer with a complete clinical response to radiochemotherapy (Esostrate). https://clinicaltrials.gov/ct2/show/NCT02551458.
53. Cheedella, NK, Suzuki, A. et al. Association between clinical complete response and pathological complete response after preoperative chemoradiation in patients with gastroesophageal cancer: analysis in large cohort. Ann Oncol. May; 24(5): 1262-6 (2013).
54. Dewan A., Sharma, SK. Et al. Impact on radiological and pathological response with neoadjuvant chemoradiation and its effect ons survival in squamous cell carcinoma of thoracic esophagus. J Gastrointest Cancer Mar;48(1): 42-49 (2017).

DISCUSSION | Chapter 8
239
8
55. Van Den Boorn, H., Engelhardt, EG et al. Prediction models for patients with esophageal or gastric cancer: A systematic review and meta-analysis. PLOS One; February 8 (2018).
56. Thompson R, Valdes G. Artificial intelligence in radiation oncology: a specialty-wide disruptive transformation? Rad Onc 120: 421-426 (2019).
57. Gillies R. et al. Radiomics: images are more than pictures, they are data. Radiology 278(2016).
58. Integrated genomic characterization of oesophageal carcinoma. The Cancer Genome Atlas Research Network. Nature, vol 541, p169-175 (2017).
59. Kunos, C.A., Coleman C.N. Current and Future Initiatives for Radiation Oncology at the National Cancer Institue in the Era of Precision Medicine. Int J Radiat Oncol Biol Phys. Sep 1; 102: 18-25 (2018).
60. Xu, Y., Zhu, W. et al. A multicenter, randomized prospective study evaluating the optimal radiation dose of definitive concurrent chemoradiation for inoperable esophageal squamous cell carcinoma. J Clin Oncol 36; 15_supll, 4013-4013 (2018).
61. Chen CY., Li CC. et al. Does higher radiation dose lead to better outcome for non-operated localized esophageal squamous cell carcinoma patients who received concurrent chemoradiotherapy? A population based propensity-score matched analysis. Radiother Oncol 120 (1): 136-9 (2016).
62. Ke Te-Min, Fong Y. et al. Evaluating the optimal radiation dose for definitive chemoradiotherapy for esophageal squamous cell carcinoma : a single instition experience. Medicine Nov 97 (46): e 13214 (2018).
63. Chuong, MD., Hallemeier, CL. et al. Improving outcomes for esophageal cancer using proton beam therapy. Int J Radiat Oncol Biol Phys; 1: 95 (1): 488-97 (2016).
64. Xi M., Lin S. Recent advances in intensity modulated radiotherapy and proton therapy for esophageal cancer. Expert review of anticancer therapy 17, 7: 635-646 (2017).
65. Myint, Z. W. & Goel, G. Role of modern immunotherapy in gastrointestinal malignancies: a review of current clinical progress. J. Hematol. Oncol. 10, 86 (2017).
66. Stein, A., Moehler, M. et al. Immuno-oncology in GI tumours: Clinical evidence and emerging trials of PD-1/PD-L1 antagonists. Crit Rev Oncol Hematol. Oct; 130: 12-26 (2018).
67. Fuchs, CS., Doi, T. et al. Safety and Efficacy of Pembroluzimab Monotherapy in Patients with previously treated advanced gastric and gastoesophageal junction cancer: Phase 2 Clinical KEYNOTE-059 trial. JAMA Oncol. May 10; 4 (2018).
68. Kudo, T., Hamamoto, Y. et al. Nivolumab treatment for oesophageal squamous-cell carcinoma: an open-label, multicenter, phase 2 trial. Lancet Oncol May; 18(5): 631-639 (2017).
69. Doi, T., Piha-Paul, SA. Et al. Safety and Antitumor activity of the anti-programmed death-1 antibody pembroluzimab in patients with advanced esophageal carcinoma. J Clin Oncol Jan 1;36: 61-67 (2018).
70. Mimura, K., Yamada, L. et al. Immunotherapy for esophageal squamous cell carcinoma: a review. Fukushima J Med Sci Aug 29;64: 46-53 (2018).
71. Scheer, RV., Fakiris, AJ et al. Quantifying the benefit of a pathologic complete response after neoadjuvant chemoradiotherapy in the treatment of esophageal cancer. Int J Radiat Oncol Biol Phys Jul 15;80(4): 996-1001 (2010).
72. Graham, K., Unger, E. et al. Overcoming tumor hypoxia as a barrier to radiotherapy, chemotherapy and immunotherapy in cancer treatment. Int J Nanomedicine; 13: 6049-6058 (2018).


Summary / Samenvatting
Chapter 9

DISCUSSION | Chapter 9
242
SUMMARY
The incidence of oesophageal cancer has risen dramatically in recent decades, coinciding with a shift in histologic type and primary tumour location. Adenocarcinoma of the oesophagus is now more prevalent than squamous cell carcinoma in Western Europe, with most tumours located in the distal oesophagus.
Unfortunately, oesophageal cancer patients are know to face a bitter future since it is a treatable disease, but it is rarely curable. Combined neoadjuvant chemoradiation followed by surgical resection after a waiting period of 6 to 8 weeks is currently the standard treatment for most oesophageal tumours. The overall 5-year survival rate in patients amenable to definitive treatment ranges from 5% to 60%.
This thesis points out the best available evidence concerning the use of radiation therapy in oesophageal cancer and future directions for treatment. In order to develop optimal treatment schedules we need to develop new anti-cancer therapies but not at the expense of an increased toxicity.
PART ITHE BEST PREPARATION FOR TOMORROW IS DOING YOUR BEST TODAY
Oesophageal cancer is known for its rich lymph node drainage and, according to different sites, will easy metastasize to different regions. Radiotherapy is one of the primary curative treatment modalities for oesophageal cancer with an unmistakable effect on locoregional control. However, it appeared that the radiation regimen that were used in each randomized trials were heterogeneous with respect to dose, fractionation, length of treatment field, dosimetric planning, and quality control. Guidelines for oesophageal cancer contouring are mainly derived from former two-dimensional fields based on bony landmarks. They do not provide sufficient anatomical details to ensure consistent contouring when using newer techniques like intensity-modulated radiotherapy. Until now, the clinical target volume of lymph node drainage area has always been controversial, one is to irradiate positive lymph nodes only, the other is to irradiate the easier involved lymph node area according to different sites. In chapter 1, the available literature regarding this subject is reviewed in order to define and understand of the biological behavior and spread of oesophageal cancer. Our findings provide critical information for clinical decision-making regarding the extent of lymph node irradiation in the treatment of oesophageal cancer.
Another actual challenging topic in the treatment of oesophageal cancer involves the treatment of cervical oesophageal cancer. This is an uncommon and very aggressive cancer with a high incidence of submucosal lymphatic spread. Historically, total pharyngolaryngo-oesophagectomy and gastric pull-up reconstruction are often the procedures of choice. In chapter 2, we provide an overview of the diagnosis, current
DISCUSSION | Chapter 9
243
9
treatment options and treatment-related complications of cervical oesophageal carcinoma (CEC) and subsequently provide recommendations to improve quality of care. In accordance to chapter 1, we recommend that cervical, supraclavicular and paratracheal lymph nodes should be included in the radiation target volume. As the optimal treatment regimen for CEC is not yet defined, future studies should focus on whether this agressive disease is to be treated according to a head and neck or oesophageal cancer protocol. Oesophageal cancer radiotherapy encompasses considerable geometrical uncertainties due to setup errors, position variation of the oesophageal target volume, and organ motion. In patients with distal oesophageal tumours, gastric filling might introduce potential interfractional position variation and we investigated this in a dosimetric study discussed in chapter 3. We redelineated and recalculated dose distributions of 20 patients who either did or did not received food or drink instructions before simulation and treatment. Although our study was restricted to a limited patient group we found no need for adaptive radiotherapy for GEJ tumours. Variation in food and fluid instructions for the treatment of GEJ tumours does not result in the need for replanning when using a PTV margin of 1cm. In addition, we showed that dose computation on kV CBCT imaging for a potential adaptive radiotherapy approach is feasible.
PART I INEW LIFE FOR OLD DRUGS OR DATA?
For radiation planning purpose, oesophageal cancer patients undergo a CT scan at the department and so we have a huge amount of diagnostic images at our disposal. These images might contain more quantitative information than the eye could see.
The emerging field of radiomics is a promising field aimed at identifying these image biomarkers and could be useful in producing risk models for clinical practice. In chapter 4 we used different phases of respiratory-correlated 4D CT-scans of 20 oesophageal cancer patients to find stable radiomic features. Eventually, 397/1045 (38%) features were robust of which 108 features were significantly associated with overall survival.
Radiomics analysis involves several fixed steps—image acquisition, segmentation, feature extraction, and feature selection—which each have specific drawbacks that would need to be resolved in each future study.
Drug repurposing, the application of an existing old therapeutic to a new disease indication, holds the promise of rapid clinical impact at a lower cost than de novo drug development. There are emerging data that one of these repurposing drug candidates is metformin (1.1-dimethylbiguanide hydrochloride), an oral antidiabetic drug. In chapter 5 we explored the relationship between metformin use and outcome in oesophageal cancer patients. In this retrospective study on 196 patients, metformin

DISCUSSION | Chapter 9
244
use was associated with a significant prolonged overall survival (p=0.043). This study is the first to find a survival benefit of metformin intake in oesophageal cancer patients on multivariate analysis. Our findings suggest that metformin may have clinical use in the treatment of our oesophageal cancer population and supports the need for further prospective study of the use of metformin in oesophageal cancer treatment. The exact mechanism of metformin is explained by a variety of pathways in which metformin could even improve tumour re-oxygenation.
PART I I IEXPLOITING HYPOXIA IN OESOPHAGEAL CANCER
Tailored cancer therapies, in which specific information about of oesophageal cancer is taken into account during treatment decisions, are an important step forward in current population-based therapy22.
As tumours and patients seem to be less homogeneous than assumed, there is increasing interest in the tumour microenvironment with a specific focus on hypoxia. Hypoxic tumour cells promote a more aggressive phenotype and are associated with increased metastatic potential and chemoradiotherapy resistance.
In chapter 6 we assemble the abundant literature concerning hypoxia-associated molecular response biomarkers in oesophageal cancer, treatment response and outcome. We found that elevated levels of endogenous tissue hypoxia-associated biomarkers (HIF-1alfa, CA IX and GLUT-1) tend to be associated with poor treatment outcome (complete response, local control , disease-free survival and overall survival). However, some studies showed conflicting results which might be due to differences in hypoxia detection methods and quantification, tumour cell type and population. Non-invasive imaging with hypoxia tracers could be a more useful way to monitor hypoxic status and treatment response in patients with oesophageal cancer.
Tumour hypoxia can serve as the basis for selective, microenvironmentally targeted cancer therapy. TH-302 is in clinical development at Threshold Pharmaceuticals Inc. and activated only at very low levels of oxygen (hypoxia). It is a nitroimidazole prodrug of the cytotoxin, bromo-isophosphoramide mustard (Bromo-IPM), an alkylating agent. TH-302 or Evofosfamide has already been studied preclinically, in animal models and in phase I to III studies. The Maastricht group confirmed that in tumour-bearing animals the activity of TH-302 is dependent on tumour oxygenation and clearly sensitizes tumours to irradiation. Consequently, the purpose of chapter 7 or our phase I single-center study is to determine whether combining TH-302 with the CROSS regimen in distal and junctional oesophageal cancer patients is safe and effective. Evofosfamide is available for intravenous infusion and will be administered on a weekly basis. This is the first trial in which carboplatin, paclitaxel, radiotherapy and evofosfamide will be combined. PET-CT acquisitions with hypoxia tracer 18F-Hx4 will be made before and after first administration (window-of-opportunity) to identify early changes in hypoxia

DISCUSSION | Chapter 9
245
9
induced by evofosfamide. The known activity of evofosfamide in oesophageal cancer may also help eradicate
undiagnosed micro-metastatic disease. As a result, the supra-additive effect of this combination may improve complete response after neoadjuvant treatment or overall survival in this selected group of patients. Careful patient identification to select patients who are most appropriate for the treatments so that we minimize exposing patients who are not likely to benefit from these treatments is definitely a priority.

DISCUSSION | Chapter 9
246
NEDERLANDSE SAMENVATTING
De incidentie van slokdarmkanker is de laatste jaren toegenomen en parallel hiermee zien we een verschuiving van het histologisch subtype alsook de lokalisatie van de tumour. In West-Europa zijn adenocarcinomen van de slokdarm nu meer prevalent dan het plaveiselcelcarcinoom. De meerderheid van de adenocarcinomen zijn gelokaliseerd in het distale gedeelte van de slokdarm.
Ondanks behandeling blijft de uitkomst van patiënten met slokdarmkanker bijzonder slecht, aangezien deze ziekte zelden definitief te genezen valt. De standaardbehandeling bestaat uit neoadjuvant chemo-en radiotherapie gevolgd door chirurgische resectie na een 6-tot 8-tal weken. De 5-jaarsoverleving van patiënten die op deze manier curatief benaderd worden varieert van 5% tot 60%.
Er is dringend nood aan nieuwe therapeutische strategieën voor patiënten met slokdarmkanker maar dit mag vanzelfsprekend niet ten koste gaan van toegenomen toxiciteit.
In deze thesis wordt de beschikbare evidentie rond belangrijke radiotherapie vragen en een potentiële nieuwe therapeutische strategie toegelicht.
DEEL IOPTIMALISATIE VAN RADIOTHERAPIE IN DE BEHANDELING VAN SLOKDARMKANKER
Slokdarmkanker wordt gekenmerkt door zijn rijke lymfedrainage en metasteert dan ook vaak naar verscheidene regio’s ifv de localisatie van de primaire tumour.
Radiotherapie maakt deel uit van de curatieve benadering van slokdarmkanker en heeft een onmiskenbaar effect op locoregionale controle. In de literatuur zijn de data rond bestralingsschema, dosis en fractionatie, grootte bestralingsveld en dosimetrische planning zeer divers. Richtlijnen voor delineatie van slokdarmtumoren zijn afkomstig van vroegere 2-dimensionele bestralingstechnieken en aldus gebaseerd op botstructuren. Met de komst van de intensiteitsgemoduleerde radiotherapie techniek zijn deze richtlijnen ontoereikend aangezien ze te weinig anatomische informatie bevatten. De delineatie van het klinisch doelvolume bij de bestraling van slokdarmtumoren is sinds lange tijd ook controversieel en dan met name op het gebied van het al dan niet includeren van electieve lymfeklierregio’s.
In hoofdstuk 1 wordt de beschikbare literatuur rond dit onderwerp besproken in een systematisch review artikel. Op die manier krijgt de lezer inzage in het biologisch gedrag en in het bijzonder de spreiding van slokdarmkanker naar de omliggende klierstreken. Onze data leveren kritische klinische informatie voor de radiotherapeut en vormen een leidraad bij de beslissing om lymfeklierregio’s electief mee te nemen in het bestralingsveld.

DISCUSSION | Chapter 9
247
9
Een andere controversiële topic in de behandeling van slokdarmkanker is de behandeling van cervicale slokdarmtumoren. Dit is een zeldzame en tevens bijzonder aggressieve ziekte gekenmerkt door een hoge kans op submucosale lymfatische spreiding. Vroeger was de aanpak steevast een totale pharyngolaryngectomie en gastric pull-up reconstructie. In hoofdstuk 2 geven we een overzicht van de diagnose, huidige behandelopties en de hierbij gerelateerde toxiciteit bij de behandeling van cervicale slokdarmtumoren. Bijkomend geven we een aantal aanbevelingen om de kwaliteit van zorg in deze subgroep te verbeteren. Toekomstige studies moeten duidelijkheid scheppen of we hoog geleden slokdarmtumoren beter behandelen volgens het slokdarm of hoofd-hals schema.
Radiotherapie bij slokdarmtumoren impliceert een aantal geometrische onzekerheden omwille van instel onnauwkeurigheid, positie variatie van het doelvolume en orgaan beweging. In patiënten met een distaal slokdarmcarcinoom kan een variatie in maagvulling mogelijk aanleiding geven tot interfractionele positie variatie. In hoofstuk 3 onderzoeken we deze invloed in een dosimetrische studie waarbij we de cone beam CT bij 20 patiënten opnieuw hebben ingetekend. Vervolgens werd de dosisverdeling opnieuw berekend in de 10 patiënten met en de 10 patiënten zonder voedingsinstructies voor radiotherapie simulatie en behandeling. Ondanks het feit dat onze studie beperkt was tot een kleine groep patiënten concluderen we dat er aktueel geen nood is voor adaptieve radiotherapie voor junctietumoren. Als er een PTV marge van 1cm gebruikt wordt is er geen nood tot herplanning ongeacht het geven van voedingsinstructies voorafgaand aan bestraling gastroesophageale junctietumoren. Deze studie is ook één van de eerste om aan te tonen dat dosis herberekening op kV CBCT tot de mogelijkheden behoort indien wenst te beslissen tot al dan niet adaptieve bestraling.
DEEL I INIEUWE THERAPEUTISCHE STRATEGIEËN MET GEKENDE DATA OF MEDICATIE ?
In de voorbereiding van het maken van een bestralingsplan kijgen slokdarmkanker patiënten een CT scan op de afdeling. We beschikken dus over een grote hoeveel CT data op de radiotherapie afdeling. Deze beelden kunnen mogelijks meer informatie bevatten dan zichtbaar met het blote oog.
Het domein van radiomics is een veelbelovende piste om via beeldvorming biomarkers te identifiëren die nuttig zijn in het ontwikkelen van risico modellen in de klinische praktijk. In hoofdstuk 4 gebruiken we verscheidene fasen van ademhalingsgecorreleerde 4D –CT scans van 20 patiënten met slokdarmkanker om in eerste instantie stabiele radiomics parameters te vinden. Uiteindelijk bleken 397 van de 1045 parameters (38%) stabiel waarvan 108 features significant geassocieerd zijn met overleving. Radiomics impliceert het volgen van verscheidene stappen met name beeld acquisitie, segmentatie, feature extractie en selectie. Elke stap is geassocieerd

DISCUSSION | Chapter 9
248
met mogelijke pitfalls dewelke in toekomstige studies verder onderzocht dienen te worden.
Drug repurposing of het gebruik van een bestaand product voor een nieuwe indicatie, heeft als mogelijk voordeel dat de kost gering is in vergelijking met het ontwikkelen van nieuwe farmaca. Indien het product succesvol is gebleken, kan dit eveneens snel in de praktijk geïmplementeerd worden.
Eén van deze “drug repurposing” kandidaten is metformine (1.1 dimethylbiguanide hydrochloride), een oraal antidiabeticum. In hoofdstuk 5 onderzoeken we het effect van metformine op de behandeling van patiënten (n=196) met slokdarmkanker. Dit is de eerste retrospectieve studie die een overlevingsvoordeel bevestigt door het gebruik van metformine bij slokdarmkanker (p=0.043). Deze resultaten ondersteunen de nood voor het opzetten van een prospectieve studie en tonen aan dat metformine mogelijk een rol kan spelen in de klinische aanpak van slokdarmkanker. Het werkingsmechanisme van metformine wordt verklaard door zijn werking op diverse metabole processen waarbij metformine zelfs tumor re-oxygenatie kan bevorderen.
DEEL I I I HYPOXIE IN SLOKDARMKANKER
Een grondige kennis over slokdarmkanker is van cruciaal belang om gepersonaliseerde behandeling te kunnen aanbieden. Zowel de patiënt als de tumor zelf zijn minder homogeen dan initieel gedacht en er is een toenemende interesse in de tumor biologie voornamelijk rond hypoxie. Hypoxische kankercellen zijn aggressiever en geassocieerd met verhoogde kans op metastasering en therapieresistentie.
In hoofstuk 6 verzamelden we de beschikbare literatuur over hypoxie-geassocieerde biomerkers in slokdarmkanker en hun link met respons op behandeling en overleving. Een verhoogd weefselgehalte van biomarkers zoals HIF1-alfa, CA IX en GLUT-1 zijn geassocieerd met een slechtere uitkomst (therapie respons, lokale controle, ziekte-vrij en algemene overleving). Sommige studies leverden weliswaar conflicterende resultaten op wat mogelijk een gevolg is van diversiteit in detectie methodes, histologie en tumor populatie. Niet-invasieve beeldvorming met hypoxie tracers zijn een veelbelovende manier om hypoxie en de therapierespons te monitoren in patiënten met slokdarmkanker. Tumor hypoxie kan dus als doelwit fungeren voor selectieve therapie gericht op tumorbiologie.
TH-302 of evofosfamide werd ontwikkeld door Threshold Pharmaceuticals Inc. en wordt enkel geactiveerd bij zeer lage zuurstoflevels. Het is een nitroimidazole prodrug van bromo-isofosforamide mosterd, dewelke fungeert als een alkylerend cytostaticum. TH-302 is reeds bestudeerd in heel veel dierenmodellen, preklinische alsook fase I,II en III studies. Onze groep van Maastricht bevestigde in een muizenmodel dat de activiteit van evofosfamide zuurstofafhankelijk is en de tumor gevoeliger maakt voor bestraling. In hoofdstuk 7 beschrijven we het opzet van onze fase I studie waarin TH-

DISCUSSION | Chapter 9
249
9
302 gecombineerd wordt met het CROSS schema in patiënten met distale of junctie slokdarmtumoren. Het doel van de studie is nagaan of deze combinatie behandeling veilig en effectief is. Evofosfamide wordt intraveneus toegediend op wekelijkse basis. Deze fase I studie is de eerste studie waar carboplatinum, paclitaxel, radiotherapie en TH-302 gecombineerd zullen worden. Voor en na de eerste toediening TH-302 wordt bijkomend een PET-CT verricht met de hypoxie tracer 18F-Hx4 om veranderingen in hypoxie ten gevolge van de behandeling te identifiëren . Zelfs micrometastasen kunnen hypoxisch zijn aldus kan TH-302 ook hier een rol in spelen om de ziekte te eradiceren. Het supra-additief effect van de combinatie TH-302 en het CROSS schema kan de kans op een complete respons na neoadjuvante therapie verhogen of de overleving verbeteren. Correcte identificatie en selectie van patiënten die baat hebben bij deze nieuwe aanpak is hierbij van uiterst belang. Op die manier vermijden we mogelijke toegevoegde toxiciteit bij patiënten bij wie het gebruik van hypoxie-gemedieerde therapie geen nut heeft.

Valorization addendum
Curriculum vitae & PhD Portfolio
Personal acknowledgements
Chapter 10

DISCUSSION | Chapter 10
252
VALORIZATION ADDENDUM
The scientific results of this thesis will be described in perspective of the valorization process regarding its value for society, its economic relevance and novelty of this work.
Clinical and social relevanceOur thesis primarily focused on oesophageal cancer, which currently is the eight most common cancer type worldwide and the sixth most common cause of death from cancer. In 2017, more than 2500 patients were diagnosed with oesophageal cancer in the Netherlands. The rise in risk factors suchs as obesity and gastro-oesophageal reflux disease will lead to an increased incidence of this cancer.
Due to the aggressive character of the tumour and the lack of effective individualized treatment, the 5-year survival rates and quality of life of patients with oesophageal cancer is poor.
Still, large individual differences in survival and treatment response are observed which emphasize the need for more personalized therapy. Radiation therapy will play a central role in this personalized medicine era together with the development of new drug agents and repurposing others according to radiobiological rationale. The main theme of this thesis is the development of a clinical guidance for radiation treatment in oesophageal cancer and investigate the role radiomics and hypoxia in the prognosis to define a more tailored therapeutic approach of this disease.
PART I may serve as a ”template” to guide oesophageal cancer treatment and target delineation in daily practice for the radiation oncologist. Previous studies have shown that microscopic extension outside the clinical target volume is an unfavourable prognostic factor for disease-and overall survival. With the results of chapter 1, we can reduce unnecessary irradiation of lymph node regions with minimal risk of tumour involvement and still assure adequate covering of microscopic target areas. With chapter 2 and 3, we further attempt to minimize inconsistency of the irradiation field and to achieve precise radiotherapy.
The “drug repurposing “ and “radiomics” approach in PART II may contribute to the ongoing movement towards more individualized treatment strategies for oesophageal cancer patients. The strategy of radiomics is not yet ready to be implemented on a larger scale in standard clinical practice. However, it can fit in within existing practice with low cost and without an additional burden to patients, as it involves post-processing techniques on standard CT which are performed as part of routine clinical practice.
Our data presented in chapter 5 with metformin support the data found in lung cancer and could also be of interest for other cancer patients. In addition, metformin is an inexpensive drug and might and could be a safe efficacious approach to overcome tumour hypoxia in radiation treatment.

DISCUSSION | Chapter 10
253
10
The studies presented in PART III are an attempt at improving neoadjuvant treatment response. In this respect, there might be a subpopulation where complete response directs to a watch-and-wait strategy without debilitating surgery. In chapter 6, we describe the role of hypoxia in oesophageal cancer which can be used for selection of patients with hypoxic properties, known for its negative impact on the prognosis of the patients. Although our paper of hypoxia-associated markers in oesophageal cancer involves mostly preclinical data, we were the first to assemble crucial information of the role of hypoxia parameters in these patients.
From an economically perspective stratifying patients into being hypoxic or not could be cost-effective when using anti-hypoxia treatment. In chapter 7, we propose a phase I window-of-opportunity trial with the combination of TH-302, an hypoxia-activated prodrug and chemoradiotherapy. It is with this study that we hope to improve the response to treatment in selected oesophageal cancer patients. The study was prepared with Threshold Pharmaceuticals , a biotechnology company that develops tumour-targeted therapies. One of its products is [18F]-Hx4, an in-licensed positron-emission tomography agent for hypoxia. The use of this imaging biomarkers allows us assessment of any early anti-tumour activity of evofosfamide or TH-302.
Using new theragnostic and therapeutic opportunities (hypoxia-radiomics imaging, combination with a bioreductive drug) will result in a major benefit for patients with oesophageal cancer. With the emerge of individualized medicine and the increasing amount and complexity of available medical data, a growing need exists for the development of clinical multifactorial decision-support systems based on prediction models of treatment outcome.
MAASTRO Clinic has extensive expertise in developing prediction models for survival with published series in major American and European radiotherapy journals (www.predictcancer.org). MAASTRO Clinic established a data warehouse to collect, relate and interpret clinical, imaging, treatment and molecular data from patients (see also www.cancerdata.org ) which been recorded in an electronic patient database since 2005. This warehouse includes patients records, registry data, molecular profiles, clinicopathologic data, treatment data and raw DICOM images. In future, we hope to develop a truly useful predictive model in oesophageal cancer which can be integrated in the clinic shaded on in a global manner. Eurocat (www.eurocat.info) is a project managed by Maastro Clinic with the ambition to do so.
Target audience PART I of this thesis is an effort moving towards a uniform radiation approach in patients with oesophageal cancer. More particularly, radiation oncologists can individualize regional lymph node irradiation according to tumour location and thereby avoid unnecessary lung and heart radiation dose. Consequently, surgeons are confronted with less postoperative complications like radiation pneumonitis and anastomotic leakage.

DISCUSSION | Chapter 10
254
In the current healtch care environment there is also a growing interest for patient-aided treatment decision. We present the use of radiomics and presence of hypoxia which can be of use in the implementation in treatment decision tools (www.oncoradiomics.com) . Finally, the effect of hypoxia presence in oesophageal cancer and anti-hypoxia treatment could be of interest to all healthcare companies with interest to develop hypoxia targeted agents. For example, the development of Evofosfamide has shifted focus from the combination with chemotherapy to immunotherapy. (https://clinicaltrials.gov/ct2/show/NCT03098160?cond=evofosfamide&draw=2&rank=1).
Novelty of the conceptAdequate radiotherapy delineation and delivery is of upper most importancy when overthinking deferral of consequent surgery. Even with ‘old’ data this PhD thesis is the first to overview the role of elective lymph node irradiation in oesophageal cancer and to implement delineation guidelines according to tumour location.
Extraction of multiple features from CT images as in radiomics is a recent innovative way of using data for defining the tumour phenotype. This innovative form of quantitative image analysis has future potential for clinical practice in patients with oesophageal cancer by providing an additional layer of information to the standard imaging assessment.
Evidence of the negative prognostic role of hypoxia presence is not new but is accumulating and still rather limited in oesophageal cancer. This thesis provides an overview of the current data of hypoxia presence in oesophageal cancer and paves the road for anti-hypoxia treatment in patients with oesophageal cancer. Threshold is a clinical stage biopharmaceutical company focused on the discovery and development of cancer therapeutics based on a novel and powerful approach of targeting this tumour hypoxia. In our phase I trial with TH-302 we are the first to describe a window-of-opportunity trial with a hypoxia-activated prodrug in this disease. In particular, the combination of TH-302 and radiotherapy is a novel concept.
The aim is to exploit these prodrugs to sensitize tumours to the conventional chemo-radiotherapy and improve the therapeutic outcome in oesophageal cancer patients.
Road to the marketThere is no doubt that oesophageal cancer deserves more research and there is a need to seek for biomarkers of response and prognosis to adapt treatment. The studies presented in part I to III are examples of initiatives to improve personalized oesophageal cancer treatment.
First effort to uniform radiotherapy treatment volume and preparation have been made with our research. The conclusions presented within this first part of the thesis can be recommended guidelines for routine clinical practice on a worldwide basis.
In addition, revealing radiomics and hypoxia data in oesophageal cancer is just the start of a new paradigm in treating this malignant disease. Medical imaging has been

DISCUSSION | Chapter 10
255
10
the cornerstone for the management of patients for decades, particularly in oncology. Improved standardization of image feature extraction in combination with artificial intelligence will guide personalized treatment in the nearby future. Both, hypoxia-associated biomarkers and radiomic features have potential to be implemented for clinical decision support systems to select the best tailored treatment. In PART III of this thesis, we present new initiatives to implement hypoxia PET imaging which lead to new opportunities regarding clinical trials. In March 2013, Threshold announced the acquisition of [18F]Hx4 from Siemens Healthcare. [18F]Hx4 is an investigational radiolabeled Positron Emission Tomography (PET) tracer for hypoxia. [18F]Hx4 could be potentially be used as a companion diagnostic to hypoxia-targeted therapeutics based on Threshold’s drug discovery platform. The initial intent is to develop [18F]Hx4 to determine a patient’s tumour hypoxia profile, which may identify patients who will best respond to Threshold’s hypoxia-targeted therapeutics.
Consequently, implementation of new hypoxia radiosensitizers to improve treatment might find their way to the market (www.convertpharma.com) . This next step could be realised by finishing the trial in oesophageal cancer with hypoxia-activated prodrugs in a window-of-opportunity trial.
We acknowledge that a variety on disease-related information e.g. patient and family history, pathology and many other data will be needed to be part of a well-founded treatment decision. We are not there yet, but we are hopeful that analysing vast amount of medical Big Data data from a worldwide population of oesophageal cancer patients will allow us to improve the effectiveness of certain treatments and exclude those which don’t.
This tailored treatment will definitely benefit society as the approach will become more effective and more cost-efficient.

DISCUSSION | Chapter 10
256
CURRICULUM VITAE
Lien Van De Voorde was born on the 28th of May, 1982, in Bruges, Belgium where she grew up. She graduated summa cum laude from the Leuven University of Medicine in 2007. She first started the specialisation Nuclear Medicine but developed a growing interest in Oncology during her internship in Internal Medicine. As she did not want to give up the technical part of her discipline, she applied for Radiation Oncology at the Ghent University. In 2012 she finished her education as a radiation oncologist under the guidance of Professor Wilfried De Neve.
From september 2012 untill april 2016 she worked at MAASTRO Clinic, Maastricht as a resident in Radiation Oncology. MAASTRO clinic is known for its outstanding track record in clinical and basic research. She was offered to be part of a research project and got the the opportunity to perform the PhD project described in this thesis under the supervision of Prof. P. Lambin. Her research project focusses on the optimization of oesophageal cancer treatment.
From june 2016, she works as a radiation oncology at the AZ Sint-Lucas hospital in Ghent where she is responsible for the treatment of patients with urological and central nervous system tumours.

DISCUSSION | Chapter 10
257
10
PHD PORTFOLIO
A. Hébrant, M. Lammens, C. Van den Broecke, N D’haene, J. Van den Oord, A. Vanderstichele, A. Dendooven, P. Neven, K. Punie, G. Floris, J. Van der Meulen, H.A. Poirel, C. Dooms, S. Rottey, T. Boterberg, L. Brochez, M-C Burlacu, G. Costante, D. Creytens, P. De Paepe, R. De Pauw, B. Decallone, F. Dedeurwaerdere, H. Denys, L. Ferdinande, R. Forsyth, M. Garmyn, T. Gevaert, J. De Greve, E. Govaerts, E. Hauben, J. Kerger, O. Kholmanskikh Van Criekingen, V. Kruse, Y. Lalami, L. Lapeire, P. Lefesvre, J-P. Machiels, B. Maes, G. Martens, M. Remmelink, I. Salmon, R. Sciot, S. Tejpar, K. Van de Vijver, L. Van De Voorde et al. Algorithms for molecular testing in solid tumours. BJMO Nov 2019, Vol 13; issue 7.
Peerlings J*, Van De Voorde L*, Mitea C, Larue R, Yaromina A, Sandeleanu S, Spiegelberg L, Dubois L, Lambin P, Mottaghy FM. Hypoxia and hypoxia response-associated molecular markers in esophageal cancer: A systematic review. Methods. 2017 Nov 1; 130: 51-62. *Equal contribution
Larue RTHM*, Van De Voorde L*, van Timmeren JE, Leijenaar RTH, Berbée M, Sosef MN, Schreurs WMJ, van Elmpt W, Lambin P. 4DCT imaging to assess radiomics feature stability: An investigation for thoracic cancers. Radiother Oncol. 2017 Oct;125(1):147-153.*Equal contribution
Lambin P, Zindler J, Vanneste BG, Van De Voorde L, Eekers D, Compter I, Panth KM, Peerlings J, Larue RT, Deist TM, Jochems A, Lustberg T, van Soest J, de Jong EE, Even AJ, Reymen B, Rekers N, van Gisbergen M, Roelofs E, Carvalho S, Leijenaar RT, Zegers CM, Jacobs M, van Timmeren J, Brouwers P, Lal JA, Dubois L, Yaromina A, Van Limbergen EJ, Berbee M, van Elmpt W, Oberije C, Ramaekers B, Dekker A, Boersma LJ, Hoebers F, Smits KM, Berlanga AJ, Walsh S. Decision support systems for personalized and participative radiation oncology. Adv Drug Deliv Rev. 2017; 109:131-153.
Vanneste BG, Hoffmann AL, van Lin EN, Van De Voorde L, Pinkawa M, Lambin P. Who will benefit most from hydrogel rectum spacer implantation in prostate cancer radiotherapy? A model-based approach for patient selection. Radiother Oncol. 2016 Oct;121(1):118-123.
Larue RT*, Van De Voorde L*, Berbée M, van Elmpt WJ, Dubois LJ, Panth KM, Peeters SG, Claessens A, Schreurs WM, Nap M, Warmerdam FA, Erdkamp FL, Sosef MN, Lambin P. A phase 1 ‘window-of-opportunity’ trial testing evofosfamide (TH-302), a tumour-selective hypoxia-activated cytotoxic prodrug, with preoperative chemoradiotherapy in oesophageal adenocarcinoma patients. BMC Cancer. 2016 Aug 17;16:644.*Equal contribution

DISCUSSION | Chapter 10
258
Hoeben A, Polak J, Van De Voorde L, Hoebers F, Grabsch HI, de Vos-Geelen J. Cervical esophageal cancer: a gap in cancer knowledge. Ann Oncol. 2016 Sep;27(9):1664-74.
Lambin P, Zindler J, Vanneste B, van de Voorde L, Jacobs M, Eekers D, Peerlings J, Reymen B, Larue RT, Deist TM, de Jong EE, Even AJ, Berlanga AJ, Roelofs E, Cheng Q, Carvalho S, Leijenaar RT, Zegers CM, van Limbergen E, Berbee M, van Elmpt W, Oberije C, Houben R, Dekker A, Boersma L, Verhaegen F, Bosmans G, Hoebers F, Smits K, Walsh S. Modern clinical research: How rapid learning health care and cohort multiple randomised clinical trials complement traditional evidence based medicine. Acta Oncol. 2015;54(9):1289-300.
R.T.H.M. Larue, L. Van De Voorde, M.C. Schraepen, F.Warmerdam, W.M.J. Schreurs, M.N. Sosef, P. Lambin, W.Van Elmpt. Changes in FDG-PET uptake before and after chemoradiotherapy predict pathological response in esophageal cancer. 3rd ESTRO forum April 2015 Volume 115, Supplement 1, page S301.
Van De Voorde L, Larue R, Persoon L, Öllers M, Nijsten S, Bosmans G, Berbée M, Swinnen A, van Elmpt W, Vanneste B, Verhaegen F, Lambin P. The influence of gastric filling instructions on dose delivery in patients with oesophageal cancer: A prospective study.Radiother Oncol. 2015 Dec;117(3):442-7.
Vanneste BG, Van De Voorde L, de Ridder RJ, Van Limbergen EJ, Lambin P, van Lin EN. Chronic radiation proctitis: tricks to prevent and treat. Int J Colorectal Dis. 2015 Oct;30(10):1293-303.
Van De Voorde L, Janssen L, Larue R, Houben R, Buijsen J, Sosef M, Vanneste B, Schraepen MC, Berbée M, Lambin P. Can metformin improve ‘the tomorrow’ of patients treated for oesophageal cancer? Eur J Surg Oncol. 2015 Oct;41(10):1333-9.
Vanneste BG, Pijls-Johannesma M, Van De Voorde L, van Lin EN, van de Beek K, van Loon J, Ramaekers BL, Lambin P. Spacers in radiotherapy treatment of prostate cancer: is reduction of toxicity cost-effective? Radiother Oncol. 2015 Feb;114(2):276-81.
Van De Voorde L, Vanneste B, Houben R, Damen P, van den Bogaard J, Lammering G, Dejong K, de Vos-Geelen J, Buijsen J, Öllers M, Berbée M, Lambin P. Image-guided stereotactic ablative radiotherapy for the liver: a safe and effective treatment. Eur J Surg Oncol. 2015 Feb;41(2):249-56. Van De Voorde L, Larue RT, Pijls M, Buijsen J, Troost EG, Berbée M, Sosef M, van Elmpt W, Schraepen MC, Vanneste B, Oellers M, Lambin P. A qualitative synthesis of the evidence behind elective lymph node irradiation in oesophageal cancer.Radiother Oncol. 2014 Nov;113(2):166-74.

DISCUSSION | Chapter 10
259
10
Van De Voorde L, Vanneste B, Borger J, Troost EG, Werner P. Rapid decline of follicular lymphoma-associated chylothorax after low dose radiotherapy to retroperitoneal lymphoma localization. Case Rep Hematol. 2014;2014:684689.
Berkovic P, van de Voorde L, De Meerleer G, Delrue L, Speleers B, Van Belle S, Vandecasteele K. Whole abdominopelvic radiotherapy in the palliative treatment of pseudomyxoma peritonei. Strahlenther Onkol. 2014 Feb;190(2):223-8. Van Gestel D, Verellen D, Van De Voorde L, de Ost B, De Kerf G, Vanderveken O, Van Laer C, Van den Weyngaert D, Vermorken JB, Gregoire V. The potential of helical tomotherapy in the treatment of head and neck cancer. Oncologist. 2013 Jun;18(6):697-706. Van De Voorde L, Speeckaert R, Van Gestel D, Bracke M, De Neve W, Delanghe J, Speeckaert M;DNA methylation-based biomarkers in serum of patients with breast cancer. Mutat Res. 2012 Oct-Dec;751(2):304-25.
Van De Voorde L, Delrue L, van Eijkeren M, De Meerleer G. Radiotherapy and surgery-an indispensable duo in the treatment of retroperitoneal sarcoma. Cancer. 2011 Oct 1;117(19):4355-64.
Speeckaert MM, Speeckaert R, Van De Voorde L, Delanghe JR. Immunochemically unreactive albumin in urine: fiction or reality? Crit Rev Clin Lab Sci. 2011 Mar-Apr;48(2):87-96.
GRANTS
ESTRO Fellowship grant to attend the ECCO –AACR-EORTC-ESMO Workshop: “Methods in Clinical Cancer Research”; Flims, Switzerland 2013.

DISCUSSION | Chapter 10
260
PERSONAL ACKNOWLEDGEMENTS/DANKWOORD
Met het schrijven van dit dankwoord leg ik de laatste hand aan mijn scriptie.This is it! Dit proefschrift is niet alleen tot stand gekomen dankzij mijn inspanningen, maar ook door de inzet en steun van vele andere enthousiaste en bereidwillige mensen. Via deze weg wil ik dan ook iedereen hartelijk bedanken voor de hulp die ik hierbij mocht ontvangen. Zonder jullie was dit mij nooit gelukt, dankjewel!
Allereerst wil ik alle patiënten die hebben deelgenomen aan de verschillende onderzoeken bedanken. Zonder jullie bereidheid tot deelname was dit onderzoek uberhaupt niet mogelijk geweest.
Verder wil ik mijn promotor Professor Philippe Lambin bedanken. Beste Philippe, bedankt voor de kansen die ik via u kreeg om research te doen in MAASTRO Clinic. Het is voor mij een hele eer uw promovenda te mogen zijn en op essentiële onderdelen stuurde u mij telkens in de juiste richting.
Mijn co-promotoren Maaike Berbée en Wouter van Elmpt wil ik graag bedanken voor de fijne samenwerking, de telkens snelle respons op mijn prangende vragen en de hulp bij het succesvol afronden van mijn PhD thesis.
De leden van de leescommissie en opponenten, Prof. dr. Dirk De Ruysscher, dr. Berthe Aleman, Prof. dr. Manon Van Engeland en dr. Lieven Depypere wil ik bedanken voor het kritisch doorlezen en beoordelen van het proefschrift.
Alle co-auteurs die hebben bijgedragen aan de artikelen in dit proefschrift wil ik hartelijk bedanken voor hun onmisbare hulp en samenwerking.
Ik heb het geluk gehad om mijn eerste jaren als radiotherapeut te mogen werken in een topcentrum voor radiotherapie met de meest gemotiveerde collega’s. Ik ben dan ook alle collega’s, zowel artsen, fysici, laboranten, doktersassistenten en secretaresses dankbaar voor de kansen die ik in MAASTRO kreeg. Alle enthousiaste stafleden van MAASTRO Clinic en met name cluster 1, of inmiddels team 2 genaamd-ik vond het bijzonder fijn om mijn loopbaan te starten met jullie aan mijn zijde. In april 2016 verliet ik jullie definitief omdat ik inzag dat “tijd” nu eenmaal kostbaar is, helemaal al met de geboorte van ons zoontje Laurens. Met spijt in het hart verliet ik dan ook Maastricht maar ik vergeet jullie nooit en koester vele mooie herinneringen.
Dankzij de hulp en begeleiding van een deskundig team kon ik steeds de data klaarhelder analyseren en interpreteren. In het bijzonder dank aan Lucas Persoon, Ruud Houben en Frank Verhaegen.
DISCUSSION | Chapter 10
261
10
Bart Reymen, Ans Swinnen, Daniëlle de Haas, Geert Bosmans, Daniëlle Eekers, Michel Öllers, Esther Troost & Aswin Hoffmann dankjewel voor jullie vriendschap en gezellige momenten samen in Maastricht. De gezellige etentjes, koffie-momenten en boeiende gesprekken gaven mij telkens weer nieuwe energie.
Graag dank ik mijn familie, vriendinnen en vrienden, die gedurende die vele jaren enthousiast bleven vragen naar de vorderingen van mijn onderzoek. Ik durf niemand bij naam te noemen, bang dat ik iemand vergeet!
Ruben Larue en Jurgen Peerlings, mijn co-onderzoekers, dankjewel voor de overlegmomenten en intense samenwerking. Jullie proefschrift is al een tijdje achter de rug maar ik denk nog vaak terug aan ons teamwerk.
Judith Van Loon en Ben Vanneste, ik ben ontzettend blij dat jullie als paranimfen aan mijn zijde willen staan. Onze vriendschap bleef ook duren nadat ik MAASTRO clinic verliet en daar ben ik echt dankbaar om.
Françoise en Jan, ook jullie wil ik bedanken. Bedankt voor alle steun en bezorgdheid naar mij toe. Ik heb me van dag één welkom gevoeld bij jullie en ik apprecieer hoe we langs beide kanten goed voor elkaar zorgen. Jan, jij stimuleerde mij ook telkens weer om mijn promotie af te werken. Terwijl ik zag hoe jouw kennis over de Nigeriaanse sculpturale diversiteit werd neergepend in inmiddels drie prachtige boeken, kreeg ook mijn proefschrift meer en meer vorm.
Laurensje, ik hoop dat je in al die tijd niets tekort bent gekomen omdat mama nu ook een echte doctor wou worden. Gelukkig konden wij altijd rekening op jouw “super papa”, die steeds voor ons klaar staat.
Diederik, met je bijna 2 meter sta je letterlijk en figuurlijk steeds achter mij. Ik ben je dankbaar voor je begrip als ik weer eens ‘s avonds of tijdens het weekend aan het werk moest. Jij bent de beste partner en papa die ik me kon voorstellen en ik wil je diep uit mijn hart bedanken om in alle aspecten voor ons te zorgen. Ik kijk uit naar alle momenten die komen om samen met jullie te genieten.
Papa, soms sluit ik mijn ogen en denk ik aan waar we samen waren en ik zie dat mijn hart deze herinnering voor altijd bewaart.
Liefste mama, jij verdient in dit hele project, de grootste dank. Woorden schieten mij te kort om jou te bedanken om mij steeds alle kansen te geven in het leven. Je staat elke dag klaar met je eeuwig optimisme en relativeringsvermogen. Recht uit mijn hart wil ik jou bedanken om mij steun te geven in de vele momenten waar het even niet zo vanzelfsprekend liep. Jij staat altijd voor mij klaar en jouw onvoorwaardelijke liefde is onbeschrijflijk. Dankjewel!