THE BAROMETER OF THE ROMANIAN ECONOMY - FEBRUARY 2007 VERSION
18
The Barometer of the Romanian Economy − Romanian Journal of Economic Forecasting – 1/2007 97 THE BAROMETER OF THE ROMANIAN ECONOMY * - FEBRUARY 2007 VERSION - Ionel FLORESCU, Nona CHILIAN, Cornelia SCUTARU, Crenguţa PANĂ, Carmen UZLĂU, Marioara IORDAN, Petre CARAIANI, Liana PECICAN ** Introduction "The Barometer of the Romanian Economy" intends to be a mirror of the evolution of the Romanian economy and, at the same time, to be its global indicator of the state and trend. "The Barometer of the Romanian Economy" was first published some years ago in Microeconomia aplicată, on the initiative and under the co-ordination of Professor Cezar Mereuţă. Quarterly, during 1997-1999, eight issues were published until December 1999, when the publication ceased to exist. In 2000, "The Barometer of the Romanian Economy" reappeared as a semester topic in the Romanian Journal of Economic Forecasting, Nos.1-2. 1. Industrial Production (Source: Monthly Statistical Bulletin No. 12/2006, NIS) Ionel FLORESCU In 2006, the actual increase in Industrial Output amounted to 7.2%, by 0.1 percentage points higher than the previous increase. A slightly higher growth rate was recorded only in Manufacturing: by 0.2 percentage points higher than the previous one in (resulting in 7.8% actual increase), while in the other sectors the growth rates became negative: by -0.6 percentage points in Electric and thermal energy, gas and water (resulting in 4.5 % actual increase), and by -0.4 percentage points in Mining and * Parts of the articles published on the site Barometer of the Romanian Economy, Internet Securities Inc., ISI Emerging Markets, http://www.securities.com. ** Institute of Economic Forecasting, Bucharest 8
Transcript of THE BAROMETER OF THE ROMANIAN ECONOMY - FEBRUARY 2007 VERSION

The Barometer of the Romanian Economy
− Romanian Journal of Economic Forecasting – 1/2007
97
THE BAROMETER OF THE ROMANIAN ECONOMY*
- FEBRUARY 2007 VERSION -
Ionel FLORESCU, Nona CHILIAN, Cornelia SCUTARU, Crenguţa PANĂ, Carmen UZLĂU, Marioara IORDAN, Petre CARAIANI, Liana PECICAN**
Introduction "The Barometer of the Romanian Economy" intends to be a mirror of the evolution of the Romanian economy and, at the same time, to be its global indicator of the state and trend. "The Barometer of the Romanian Economy" was first published some years ago in Microeconomia aplicată, on the initiative and under the co-ordination of Professor Cezar Mereuţă. Quarterly, during 1997-1999, eight issues were published until December 1999, when the publication ceased to exist. In 2000, "The Barometer of the Romanian Economy" reappeared as a semester topic in the Romanian Journal of Economic Forecasting, Nos.1-2.
1. Industrial Production (Source: Monthly Statistical Bulletin No. 12/2006, NIS)
Ionel FLORESCU In 2006, the actual increase in Industrial Output amounted to 7.2%, by 0.1 percentage points higher than the previous increase. A slightly higher growth rate was recorded only in Manufacturing: by 0.2 percentage points higher than the previous one in (resulting in 7.8% actual increase), while in the other sectors the growth rates became negative: by -0.6 percentage points in Electric and thermal energy, gas and water (resulting in 4.5 % actual increase), and by -0.4 percentage points in Mining and
* Parts of the articles published on the site Barometer of the Romanian Economy, Internet
Securities Inc., ISI Emerging Markets, http://www.securities.com. ** Institute of Economic Forecasting, Bucharest
8

Institute of Economic Forecasting
Romanian Journal of Economic Forecasting – 1/2007 −
98
quarrying (resulting in 2.3 % actual increase) as one may see from the graph presenting the monthly dynamics of the output indices. Except for Electric and thermal energy, gas and water, all the trends went upwards.
Monthly evolution of the production indices
The current dynamics was due to the change in industrial sectors as follows: % increase E.f.p.a* Trend Industry – Total 7.2 0.1 Upward Manufacturing 7.8 0.2 Upward Electric and thermal energy, gas and water 4.5 -0.6 Downward Mining and quarrying 2.3 -0.4 Upward * The percentage difference as against the previous interval (in percentage points). As compared to the corresponding period in the previous year, the Manufacturing Sector recorded the highest increases in the following industries: % increase E.f.p.a* Trend Furniture and other industrial activities –n.e.s. 21.4 -1.8 Upward Road transport means 21.2 1.1 Upward Other transport means 16.5 2.9 Upward Food and beverages 16.1 0.8 Upward * The percentage difference as against the previous interval (in percentage points). The most significant decreases were registered by the following industries: % increase E.f.p.a* Trend Textiles and textile fabrics -13.1 1.7 Upward Tobacco industry -9.4 -0.6 Downward Ready-made clothes -8.9 -0.6 Downward Equipment, radio, TV sets and communications -5.7 11.3 Upward * The percentage difference as against the previous interval (in percentage points).

The Barometer of the Romanian Economy
− Romanian Journal of Economic Forecasting – 1/2007
99
As compared to the previous interval, a single new entrant appeared in the group of the fastest increasing industries (Other transport means). In the highly increasing industries, the actual increases were similar or lower than in the previously analyzed interval, except for Other transport means, where the growth rate was higher (by 2.9 percentage points, resulting in 16.5% actual increase). As regards the highest decreasing industries, also a single new entrant appeared (Ready-made clothes), while the decrease in output slowed down significantly in Equipment, radio, TV sets and communications (which increased by 11.3 percentage points, resulting in an actual increase of -5.7), and in Textiles and textile fabrics (increase by 1.7 percentage points). In the other two industries, the decline in output continued to accelerate (decrease by 0.6 percentage points in both industries). In the Mining and quarrying sector, the production evolved as follows: % increase E.f.p.a* Trend Increase in: Other extraction activities 23.0 2.8 Upward Coal mining and preparation 7.3 0.9 Upward Decrease in: Iron ore mining and preparation -22.5 0.9 Downward Petroleum and natural gas extraction - excluding prospecting -2.1 -1.9 Downward * The percentage difference as against the previous interval (in percentage points).
During the analyzed interval, Other extraction activities and Coal mining and preparation recorded positive growths (by 2.8%, and 0.9%, respectively), while the decrease continued in Petroleum and natural gas extraction (by 1.9%, resulting in a negative actual increase of -2.1%). Iron ore mining recorded a significant decrease (-22.5%), but the growth rate turned positive (0.9%).
The production of Electric and thermal power, gas and water recorded an overall decrease due to the evolutions of its two industries: % increase E.f.p.a* Trend Increase in: Production, transport and distribution of electric and thermal power, of gas and hot water 6.8 -0.9 Downward Decrease in: Water resources administration, water collection, purification and distribution -4.4 0.4
Stagnant 53.5%
* The percentage difference as against the previous interval (in percentage points).
As compared to the previously analyzed interval, the output in Production, transport and distribution decreased by 0.9 percentage points (resulting in an actual increase by

Institute of Economic Forecasting
Romanian Journal of Economic Forecasting – 1/2007 −
100
6.8%), while in Water resources the decrease in output continued to slow down (+0.4%, resulting in an actual decrease of -4.4%). The changes in trends were:
• The downward trend during the previous period turned upward in the industry: − Publishing houses, polygraphy and recording on supports
• The upward trend during the previous period turned stagnant in the industries: − Leather and footwear − Water resources administration, water collection, purification and
distribution • The upward trend during the previous period turned downward in the industry:
− Metallurgy. 2. Foreign Trade
(Source: Monthly Statistical Bulletin No. 12/2006, NIS) Nona CHILIAN
Foreign Trade Dynamics -%-
December 2006/ November 2006
December 2006/ December 2005
Jan-Dec. 2006/Jan-Dec. 2005
Exports FOB 79.4 107.6 116.2 - of which: private sector
76.7 108.3 115.9
Imports CIF 99.7 130.7 125.1 - of which: private sector
98.9 133.0 124.5
Note: Data on January-November 2006 are rectified and on December 2006 are provisional and can be subsequently rectified. Source: National Authority of Customs (NAC). In December 2006, the trade flows reversed the ascending trend: the overall exports decreased significantly as against the previous month and also as compared to the imports, while as compared to December 2005 and the cumulated interval both the overall exports and the imports increased (but the exports far less than the imports). The private sector’s trade flows evolutions were similar; however, as compared to December 2005, the increase in exports was similar to that of the overall exports, while as compared to the previous month and the cumulated interval the exports increased less than the overall exports. The situation signals significant structural changes on the way and difficulties in the activity of the exporting companies, the slower growth in the private sector’s exports raise concerns for the future. The likely appreciation of the exchange rate at the end of the year influences to a significant extent the trade flow dynamics.

The Barometer of the Romanian Economy
− Romanian Journal of Economic Forecasting – 1/2007
101
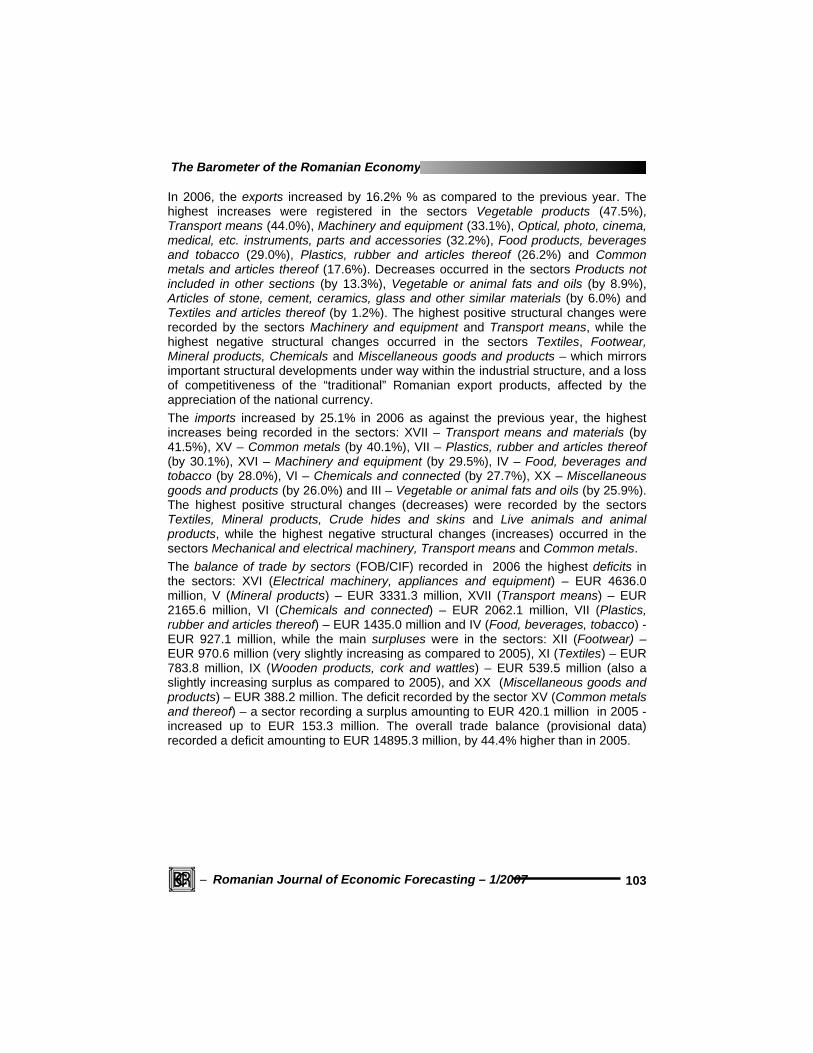
Foreign trade flows by sector
Foreign trade balances by sector

Institute of Economic Forecasting
Romanian Journal of Economic Forecasting – 1/2007 −
102
Following the usual end-of-the-year pattern, the overall and private sector trade balance deficits were different in December 2006 as compared to the previous month: all the deficits increased significantly. As compared to December 2005, the overall dynamics and the private sector deficit dynamics were also similar: the overall FOB/FOB deficit was 70.8% higher than the corresponding deficit recorded in December 2005 and the overall FOB/CIF deficit was 63.4% higher, while the private sector FOB/FOB deficit was 67.1% higher than the corresponding deficit in December 2005, and the private sector FOB/CIF deficit was 61.5% higher. Following the general patterns of trade flows, the coverage ratio of imports by exports (FOB/FOB) decreased in December 2006 to 52.2%, by 13.3 percentage points as against the previous month, and by 11.2 percentage points as against December 2005. As regards the main trade partners of Romania in 2006, the European Union was the leading partner, and the increase in the overall exports to this area was similar to the overall increase in exports. Italy and Germany were the most important trade partners, followed by France and a group of ‘medium’ (in terms of export and import values), but important trade partners: Hungary, the UK, Austria, Spain, the Netherlands, Greece, Poland, Belgium and the Czech Republic. Only in the case of Italy (the most important “traditional” partner) the increase in the exports was lower than the increase in exports to some of the medium and smaller partners (such as Slovakia – nearly double, Estonia, Lithuania, Poland, the Czech Republic, Hungary, Finland, Malta, Sweden and Denmark). It is worth noticing the significant increases in the exports towards most of the countries that acceded to the EU in May 2004. An overall trade deficit was recorded and small trade surpluses were recorded with some of the trade partners: the United Kingdom, Greece, Cyprus, Malta and Latvia. The situation regarding the Balkans improved: the exports to the countries in the region increased, except for Croatia, but the imports from these countries also increased (except for Albania and Croatia), which might raise some concerns in the future (especially in the case of Turkey, the main trade partner in the region). The export values remained modest, except for the exports to Turkey, Bulgaria and Serbia-Montenegro. Except for Turkey (for the first time in many years), all the trade balances with the countries in this area registered surpluses. The situation regarding the trade with the Community of Independent States continued to improve in 2006; the Romanian exports towards this area increased strongly, although the export values stayed modest. The most important market continued to be the Russian Federation (followed closely by Ukraine); both the imports and the exports from/to this very large market increased significantly as against 2005, but the growth rate of the Romanian exports to this market slowed down. A surplus in the trade relationships with the Republic of Moldova was recorded, and very strong signs of recovery were recorded in the trade with Ukraine (the exports being nearly one and a half times higher in value) and even Belarus (nearly double export value, but from a very low base). As regards the countries belonging to the European Free Trade Association, the Romanian exports to this market increased significantly in 2006 as compared to 2005, and a trade surplus was recorded in the trade balance with Norway.
The Barometer of the Romanian Economy
− Romanian Journal of Economic Forecasting – 1/2007
103
In 2006, the exports increased by 16.2% % as compared to the previous year. The highest increases were registered in the sectors Vegetable products (47.5%), Transport means (44.0%), Machinery and equipment (33.1%), Optical, photo, cinema, medical, etc. instruments, parts and accessories (32.2%), Food products, beverages and tobacco (29.0%), Plastics, rubber and articles thereof (26.2%) and Common metals and articles thereof (17.6%). Decreases occurred in the sectors Products not included in other sections (by 13.3%), Vegetable or animal fats and oils (by 8.9%), Articles of stone, cement, ceramics, glass and other similar materials (by 6.0%) and Textiles and articles thereof (by 1.2%). The highest positive structural changes were recorded by the sectors Machinery and equipment and Transport means, while the highest negative structural changes occurred in the sectors Textiles, Footwear, Mineral products, Chemicals and Miscellaneous goods and products – which mirrors important structural developments under way within the industrial structure, and a loss of competitiveness of the “traditional” Romanian export products, affected by the appreciation of the national currency. The imports increased by 25.1% in 2006 as against the previous year, the highest increases being recorded in the sectors: XVII – Transport means and materials (by 41.5%), XV – Common metals (by 40.1%), VII – Plastics, rubber and articles thereof (by 30.1%), XVI – Machinery and equipment (by 29.5%), IV – Food, beverages and tobacco (by 28.0%), VI – Chemicals and connected (by 27.7%), XX – Miscellaneous goods and products (by 26.0%) and III – Vegetable or animal fats and oils (by 25.9%). The highest positive structural changes (decreases) were recorded by the sectors Textiles, Mineral products, Crude hides and skins and Live animals and animal products, while the highest negative structural changes (increases) occurred in the sectors Mechanical and electrical machinery, Transport means and Common metals. The balance of trade by sectors (FOB/CIF) recorded in 2006 the highest deficits in the sectors: XVI (Electrical machinery, appliances and equipment) – EUR 4636.0 million, V (Mineral products) – EUR 3331.3 million, XVII (Transport means) – EUR 2165.6 million, VI (Chemicals and connected) – EUR 2062.1 million, VII (Plastics, rubber and articles thereof) – EUR 1435.0 million and IV (Food, beverages, tobacco) - EUR 927.1 million, while the main surpluses were in the sectors: XII (Footwear) – EUR 970.6 million (very slightly increasing as compared to 2005), XI (Textiles) – EUR 783.8 million, IX (Wooden products, cork and wattles) – EUR 539.5 million (also a slightly increasing surplus as compared to 2005), and XX (Miscellaneous goods and products) – EUR 388.2 million. The deficit recorded by the sector XV (Common metals and thereof) – a sector recording a surplus amounting to EUR 420.1 million in 2005 - increased up to EUR 153.3 million. The overall trade balance (provisional data) recorded a deficit amounting to EUR 14895.3 million, by 44.4% higher than in 2005.

Institute of Economic Forecasting
Romanian Journal of Economic Forecasting – 1/2007 −
104
3. Exchange Rate (Source: Monthly Statistical Bulletin Nos. 1-12/2005 and 12/2006, NIS)
Cornelia SCUTARU Evolution of the Nominal Exchange Rate
December 2006 - as against the EUR –
RON/EUR* % as against the previous
month
% as against December of the previous
year Nominal exchange rate – monthly average
3.4141 97.7 93.3
Nominal exchange rate – at end of period
3.3817 98.5 92.0
* Since July 1st, 2005, all the nominal values have been reported in RON. 1 RON = 10,000 ROL.
Evolution of the Nominal Exchange Rate December 2006
- as against the USD –
RON/USD* % as against the previous
month
% as against December of the previous
year Nominal exchange rate – monthly average
2.5834 95.2 83.8
Nominal exchange rate – at end of period
2.5676 98.6 82.6
* Since July 1st, 2005, all the nominal values have been reported in RON. 1 RON = 10,000 ROL. The evolution of the exchange rate as against the EUR as compared to the previous month revealed an appreciation (by 2.3 percentage points) of the national currency (monthly average). As against the USD, in December 2006 an appreciation (by 4.8 percentage points) of the national currency as against the previous month was recorded (monthly average), reflecting the USD/EUR exchange rate dynamics. As compared to the currency basket proposed by the NBR (75% EUR, 25% USD), an appreciation by 2.925% of the national currency occurred in December, while inflation was 0.74%. As against the last month of the previous year, the currency basket appreciated by 9.2%, while inflation reached 4.87%.

The Barometer of the Romanian Economy
− Romanian Journal of Economic Forecasting – 1/2007
105
Evolution of the Exchange Rate (Monthly Average)
As compared to the other saving instruments (state securities with descending trend), the foreign currencies were for a long time the alternative sources of saving mostly appreciated by population. However, the latest developments are likely to impose the re-evaluation of such options, bringing major changes in the forex markets, at the Stock Exchange and on the real estate market. 2003 revealed an appreciation as against the USD (by 2.7 percentage points) and depreciation as against the EUR (by 18.5 percentage points), while inflation reached 14.1% (December-to-December). As against the euro, the depreciating trend of the national currency was significant in 2002 and 2003. A change in the trend occurred in February-March 2004: while the inflation as against December of the previous year reached 2.2%, in March the ROL appreciated as against the euro by 1.3 percentage points as compared to December 2003. The depreciation of ROL as against the euro occurred in April; nevertheless, in May-September 2004 the process stagnated. Major changes occurred over the interval October-December, when a strong appreciation of the national currency occurred as against both the US dollar and the euro (stronger as against the former). As a conclusion, 2004 was a year of major developments in the exchange rate. The same trend of appreciation of the RON as against the euro continued also in 2005 until September, but in October-December the trend changed. However, an increase in the US dollar/euro exchange rate was revealed over the period June-December, reflected by the slight depreciation of the RON as against the euro. 2006 started with an appreciation of the RON both as against the EUR and as against the USD, higher as against the latter, reflecting the international market dynamics. The appreciation continued also over the period February-May. However, since June the national currency started to depreciate against EUR and USD, more against USD,

Institute of Economic Forecasting
Romanian Journal of Economic Forecasting – 1/2007 −
106
due to the international evolutions. The trend maintained almost unchanged also in July, while the interval August-October was characterized by a relatively constant dynamics of the exchange rate. In November and December, an appreciation of the RON occurred, especially as against the USD, due to the latter’s downward dynamics.
4. Inflation
(Source: Price Statistical Bulletin Nos.1-12/2005, 12/2006, NIS) Cornelia SCUTARU
Consumer Price Indices December 2006
% as against the previous month
% as against December of the
previous year
% as against October 1990
Total 100.74 104.87 285808.1 Food goods 101.15 101.07 220932.9 Non-food goods 100.87 108.33 302653.8 Services 99.53 105.12 498133.7 During the analysed period (December 2005-December 2006), the consumer price indices as against October 1990 had an upward evolution, highly dampened by the low inflation rate; a certain decrease was recorded by the services in February and March 2006, by the food goods in the period June–October 2006, and by non-food goods in August 2006. November and December brought a new increase in the food goods prices. As compared to the previous years, 2004 revealed a moderate inflation dynamics. However, the repeated energy price increases strongly impacted by propagated effects upon inflation during the winter 2003-2004. It was one of the most sensitive areas as regards the impact upon inflation. In 2005, the increase in inflation was moderate; the highest increase being recorded in the non-food goods in April and in services in February and April. The May-December interval was characterized by low inflation levels in all the three domains (food goods, non-food goods and services). 2006 started with quite a high inflation (1.03%), especially for the non-food goods (1.88%). In February, March and April the inflation decreased significantly, and diminutions in the consumption prices were recorded by the services only in February and March. The price increases in non-food goods determined an inflation surge in May. The inflation decreased over the interval June-October, mainly due to the reduction in food goods prices and in August also to the reduction in the non-food goods prices. November and December witnessed an increase in the food goods prices; at the same time the services prices decreased in December 2006.

The Barometer of the Romanian Economy
− Romanian Journal of Economic Forecasting – 1/2007
107
Evolution of the Consummer Price Index (As Against the Previous Month)
The correlation with industrial production prices for the domestic market is maintained. As regards the inflation dynamics as against that of the exchange rate, the appreciation of the leu in the past months has completely changed the power ratio and the role of the exchange rate in the inflationary process at work within the Romanian economy. In December 2006, an appreciation by 2.925% of the RON1 as against the currency basket occurred (structure: 75% EUR and 25% USD) as compared to the previous month, while inflation reached 0.74%. As compared to December 2005, the currency basket appreciated by 9.2%, while inflation reached 4.87%.
5. Wage Earnings of the Population
(Source: Monthly Statistical Bulletin No. 12/2006, NIS) Crenguţa PANĂ
Evolution of the Nominal Net Average Salary Earnings December 2006
RON/ month
% as against the previous
month Total 1099 121.0 Agriculture, hunting and annex services 724 112.4 Forestry, logging and related service activities 953 119.1 1 Since July 1st, 2005, the nominal values have been reported in RON. 1 RON = 10,000 ROL.

Institute of Economic Forecasting
Romanian Journal of Economic Forecasting – 1/2007 −
108
RON/ month
% as against the previous
month Industry 947 109.5 Constructions 833 109.2 Wholesale and retail trade; repair of motor vehicles, motorcycles and repair of personal and household goods
772 107.7
Hotels and restaurants 649 115.5 Land transport; transport via pipelines 1072 122.2 Water transport 1299 112.5 Air transport 2255 122.6 Annexed and auxiliary transport activities; travel agencies activities
1830 159.0
Mail and telecommunications 1614 119.1 Financial intermediations (except activities of social insurance public system)
3336 142.4
Insurance and pension funding (except activities of social insurance public system)
1942 124.7
Research-development and informatics 1634 107.9 Public administration and defence; social insurance of public sector
2532 151.9
Education 1449 143.0 Health and social assistance 1047 122.3 Refusal of waste and used waters; reclamation, sanitation and similar activities
763 125.9
Other activities 1042 126.9
Ranking of economic activities by descending order of the average net monthly earnings,December 2006

The Barometer of the Romanian Economy
− Romanian Journal of Economic Forecasting – 1/2007
109
In December 2006 the breakdown by activities, in ascending order, revealed the following: in twelve activities the average net nominal wage earnings exceeded RON 1000/month: Financial intermediations, Public administration and defence; social insurance of public, Air transport, Insurance and pension funding, Annexed and auxiliary transport activities; travel agencies activities, Research-development and informatics, Mail and telecommunications, Education, Water transport, Land transport; transport via pipelines, Health and social assistance and Other activities. In Annexed and auxiliary transport activities; travel agencies activities an increase in the average net nominal wage earnings was recorded: from 1151 RON/month to 1830 RON/month (that means an increase by about 59.0 percentage points as compared to the previous month). The average net nominal wages in Hotels and restaurants; Agriculture, hunting and annex service; Refusal of waste and used waters; reclamation, sanitation and similar activities; Wholesale and retail trade; Constructions; Industry; Forestry, logging and related service activities; Other activities; Health and social assistance and Land transport; transport via pipelines were still lower than the average per economy (RON 1099/month). The average net nominal wage increased in December 2006 in the whole economy as compared to the previous month (by 21.0%). Unsurprisingly, increases in the average net nominal wage were recorded in this month in all the sectors: Annexed and auxiliary transport activities; Travel agencies activities (by 59.0%); Public administration and defence; Social insurance of public sector (by 51.9%); Education (by 43.0%); Financial intermediations (except activities of social insurance public system) (by 42.4%); Other activities (by 26.9%); Refusal of waste and used waters; Reclamation, sanitation and similar activities (by 25.9%); Insurance and pension funding (except activities of social insurance public system) (by 24.7%); Air transport (by 22.6%); Health and social assistance (by 22.3%); Land transport; Transport via pipelines (by 22.2%); Forestry, logging and related service activities (by 19.1%); Mail and telecommunications (by 19.1%); Hotels and restaurants (by 15.5%); Water transport (by 12.5%); Agriculture, hunting and annex services (by 12.4%); Industry (by 9.5%); Constructions (by 9.2%); Research-development and informatics (by 7.9%) and Wholesale and retail trade (by 7.7%). The trend of the real net wage earnings (as against October 1990) during December 2005– December 2006 revealed an increase, while the trend of the net wage earnings expressed in EUR showed a slight increase as against the previous month. One may observe a tendency of these two trends to get closer to each other than in the previous month. Also, it should be noticed that in this month the real net wage earnings (as against October 1990) recorded a significant increase as against the previous month of the same year and, also, as against the same month of the previous year (an increase by 20.1 percentage points in the first case, and by 23.6 percentage points in the last case, respectively). A similar evolution was recorded by the net wage earnings expressed in EUR: an increase by 38.9 percentage points as against the same month of the previous year and an increase by 23.9 percentage points as against November 2006. As against October 1990, the ratio of the net average salary earnings to the consumer price index increased in December 2006 by 16.6%.

Institute of Economic Forecasting
Romanian Journal of Economic Forecasting – 1/2007 −
110
Average monthly earnings, December 2005 - December 2006
Over the interval December 2005–December 2006, the difference between the average gross nominal wage earnings and the average net wage earnings increased gradually (with some decreases in some months) over the entire interval, with a significant increase in the current month.
6. Unemployment (Source: Monthly Statistical Bulletin No. 12/2006, NIS)
Carmen UZLĂU Unemployment
End of December 2006 Total number of unemployed (thou. persons) 460,495 Unemployment rate*) 5.2 *) The ratio of the total number of unemployed to active civilian population on 1st January, 2006. In December 2006 the unemployment rate ranged between 11.2% (Vaslui) and 2% (Ilfov). Counties with an unemployment rate below 9.0 % were: Arad, Alba, Sălaj, Argeş, Buzău, Giurgiu, Iaşi, Brăila, Sibiu, Mureş, Tulcea, Bacău, Dolj, Bistriţa-Năsăud, etc. In December 2006, the territorial distribution of unemployment showed concentrations of the counties within the intervals: 5.1-5.9% (7 counties), 2.0-4.7% (15 counties), 6-6.9% (10 counties) and 7.0-11.2% (10 counties). The 5.2% unemployment rate recorded in December 2006 was lower than the one recorded in December 2005, of 5.9%, respectively.

The Barometer of the Romanian Economy
− Romanian Journal of Economic Forecasting – 1/2007
111
7. Retail Trade and Market Services Rendered to Households (Source: Monthly Statistical Bulletin No. 12/2006, NIS)
Marioara IORDAN
Turnover without VAT of the Volume Indices of Retail Trade and Market Services Rendered to Households
Turnover indices (%), in December 1 2006 as
against: Indicators December
2005 November2
2006
1.I.-31.XII.2006
as against 1.I. –
31.XII.2005 ( % )
Turnover without VAT of the volume indices of retail trade (excepting motor vehicles and motorcycles trade) - Total
119.9
149.3
124.0
Turnover without VAT of the volume indices of wholesale and retail trade maintenance and repair of motor vehicles and motorcycles; retail trade of motor vehicles fuels - Total
123.9
120.0
118.0
Turnover without VAT of Volume Indices of Market Services to the Population - Total
129.9
103.8
113.6
Note: Since 2005, the turnover volume indices have been calculated based on turnover without VAT. In order to ensure the indicator comparability, the data on 2004 were rectified. The turnover volume indices are computed under methodological conditions and comparable prices having as a reference period the average of 2004=100. 1)Provisional data. 2)Rectified data.
• Turnover without VAT of the volume indices of retail trade (except motor vehicles and motorcycles trade)
The turnover volume of the retail trade increased by 49.3% in December 2006 as against the previous month, due to the increase in the sales of food goods by 47.9 % and by 52.1% in the sales of non-food goods. Under comparable circumstances, in December 2006 the turnover of the companies with their main activity in retail trade increased by 19.9% as compared to the same period of 2005, due to the increase by 22.8% in the sales of the food goods and by 17.9% in the non-food goods sales.
• Turnover without VAT of the volume indices of wholesale and retail trade, maintenance and repair of motor vehicles and motorcycles; retail trade of motor vehicles fuels
The overall turnover increased by 20.0% in December 2006 as compared to November 2006, as a result of the increase by 28.7% in the retail trade of motor vehicles, motorcycles, related parts and accessories maintenance and repair of motor vehicles and the decrease by 7.9% in the retail trade of fuels for motor vehicles,

Institute of Economic Forecasting
Romanian Journal of Economic Forecasting – 1/2007 −
112
motorcycles. As compared to the same month of the previous year, the turnover without VAT of volume indices of wholesale and retail trade, maintenance and repair of motor vehicles and motorcycles (including retail trade of fuels for motor vehicles) increased by 23.9%, due to the increase by 14.2% in the retail trade of motor vehicles, motorcycles, afferent parts and accessories maintenance and repair of motor vehicles and by 31.5% in the trade of motor vehicles, motorcycles, spare parts and accessories.
• Turnover without VAT of the volume indices of market services to the population
The turnover volume market services to the population in December 2006 decreased by 3.8% as compared to November 2006, due to the decreases in nearly all the activities (Activities of travel agencies and tour-operators, activities of tourist assistance by 16.7%, by 71.7% in the Hairdresser and other beauty activities, by 40.5% in the Laundry, clearing and dyeing textiles and furs, by 5.1% in the Gambling and other recreation activities), except for the increase by 7.3 % in the Hotels and restaurants. As against December 2005, under comparable circumstances, the market services rendered to the population increased in December 2006 by 29.9%. The activities that recorded the most important increases were Gambling and other recreation activities (increased by 17.1%) and Hotels and restaurants, which increased by 35.5%. The activities decreased in Hairdresser and other beauty activities by 20.2% and in the Laundry, clearing and dyeing of textiles and furs by 14.4%. The linear trends over the interval December 2005–December 2006 of the turnover volume evolution in retail trade for the population and in retail trade maintenance and repair of motor vehicles and motorcycles; retail trade of motor vehicles fuels went upwards, while the trend in market services for the population went downwards.
8. Monetary Evolutions (Source: Monthly Statistical Bulletin No. 12/2006, NBR)
Petre CARAIANI
Evolution of Credits to Non-government December 2006*
Bill. RON***, end of period
% as against the previous month
% as against the same month of
the previous year Credit to non-government 93283.3 101.5 153.7 In RON 49486.0 101.3 177.3 In convertible currencies** 43797.3 101.2 133.6 * Provisional data. ** At the exchange rate at the end of the month. *** Since July 1st, 2005, the nominal values have been reported in RON. 1 RON = 10,000 ROL.
The Barometer of the Romanian Economy
− Romanian Journal of Economic Forecasting – 1/2007
113
In December 2006 the credit in RON increased by 1.3 percentage points as against the previous month, at a lower pace than it increased in the previous month. During the last 12 months an increase in non-governmental credits took place (53.7 percentage points as against the same month of the previous year). Similarly to the previous interval, the credits in convertible currencies had an increase (by 33.6 percentage points as against the same month of the previous year) lower than that of the credits in RON (an increase by 77.3 percentage points as against the same month of the previous year).
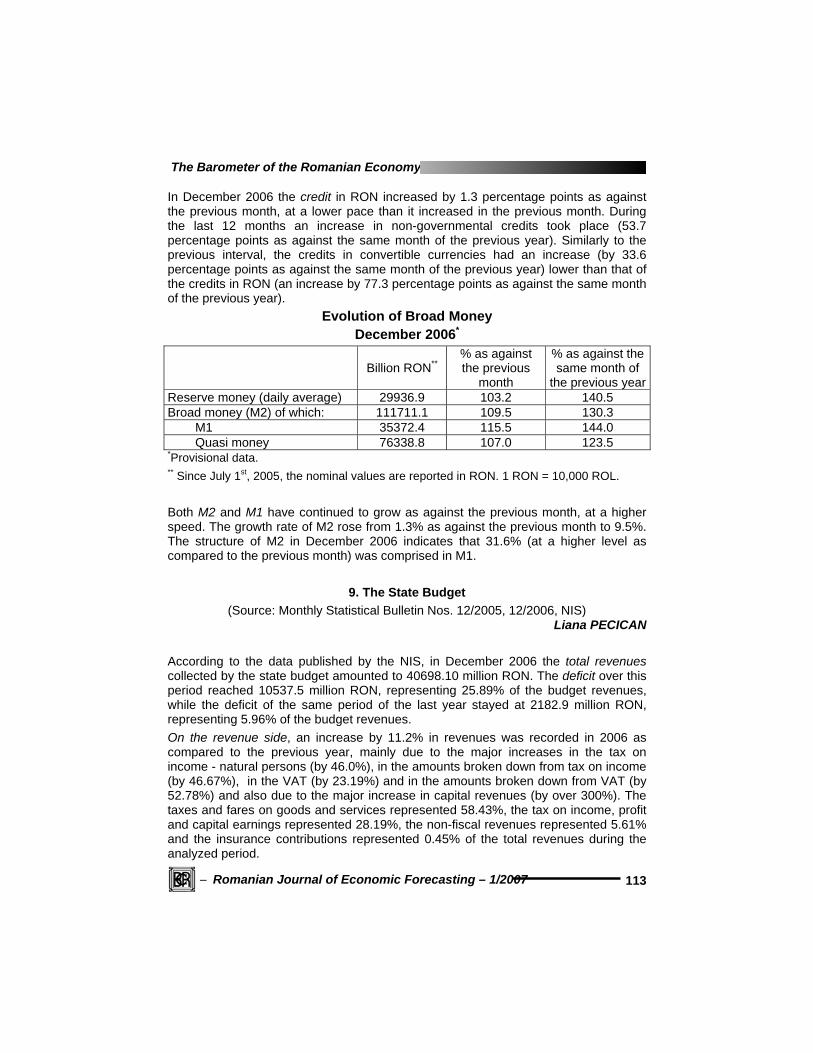
Evolution of Broad Money December 2006*
Billion RON** % as against the previous
month
% as against the same month of
the previous year Reserve money (daily average) 29936.9 103.2 140.5 Broad money (M2) of which: 111711.1 109.5 130.3 M1 35372.4 115.5 144.0 Quasi money 76338.8 107.0 123.5 *Provisional data. ** Since July 1st, 2005, the nominal values are reported in RON. 1 RON = 10,000 ROL.
Both M2 and M1 have continued to grow as against the previous month, at a higher speed. The growth rate of M2 rose from 1.3% as against the previous month to 9.5%. The structure of M2 in December 2006 indicates that 31.6% (at a higher level as compared to the previous month) was comprised in M1.
9. The State Budget (Source: Monthly Statistical Bulletin Nos. 12/2005, 12/2006, NIS)
Liana PECICAN According to the data published by the NIS, in December 2006 the total revenues collected by the state budget amounted to 40698.10 million RON. The deficit over this period reached 10537.5 million RON, representing 25.89% of the budget revenues, while the deficit of the same period of the last year stayed at 2182.9 million RON, representing 5.96% of the budget revenues. On the revenue side, an increase by 11.2% in revenues was recorded in 2006 as compared to the previous year, mainly due to the major increases in the tax on income - natural persons (by 46.0%), in the amounts broken down from tax on income (by 46.67%), in the VAT (by 23.19%) and in the amounts broken down from VAT (by 52.78%) and also due to the major increase in capital revenues (by over 300%). The taxes and fares on goods and services represented 58.43%, the tax on income, profit and capital earnings represented 28.19%, the non-fiscal revenues represented 5.61% and the insurance contributions represented 0.45% of the total revenues during the analyzed period.
Institute of Economic Forecasting
Romanian Journal of Economic Forecasting – 1/2007 −
114
On the expenditure side, the payments made in 2006 amounted to 51235.60 million RON, an increase by 32.11% as compared to the previous year. The most important payments were the expenditures on defense, public order and social security (25.13% of the total expenditures), social assistance and social benefits (21.0% of the total expenditures) .The situation was similar to that of 2005. As compared to the same period of the last year, the general public services expenditures increased by 100.78%, the expenditures on public services and development and dwellings increased by 92.16%, the social assistance expenditures increased by 43.96%, the expenditures on fundamental research increased by 50.54% and the expenditures on transport and communication by 63.0%. The expenditures on mining and quarrying, on manufacturing, on constructions (by over 70%) and on health (by almost 1%) decreased.