The Bacterial Nanorecorder: Engineering E. coli to Function as a Chemical Recording Device
10
The Bacterial Nanorecorder: Engineering E. coli to Function as a Chemical Recording Device Prasanna Bhomkar 1 *, Wayne Materi 1 , David S. Wishart 1,2,3 1 National Institute for Nanotechnology, Edmonton, Alberta, Canada, 2 Department of Computing Science, University of Alberta, Edmonton, Alberta, Canada, 3 Department of Biological Sciences, University of Alberta, Edmonton, Alberta, Canada Abstract Synthetic biology is an emerging branch of molecular biology that uses synthetic genetic constructs to create man-made cells or organisms that are capable of performing novel and/or useful applications. Using a synthetic chemically sensitive genetic toggle switch to activate appropriate fluorescent protein indicators (GFP, RFP) and a cell division inhibitor (minC), we have created a novel E. coli strain that can be used as a highly specific, yet simple and inexpensive chemical recording device. This biological ‘‘nanorecorder’’ can be used to determine both the type and the time at which a brief chemical exposure event has occurred. In particular, we show that the short–term exposure (15–30 min) of cells harboring this synthetic genetic circuit to small molecule signals (anhydrotetracycline or IPTG) triggered long-term and uniform cell elongation, with cell length being directly proportional to the time elapsed following a brief chemical exposure. This work demonstrates that facile modification of an existing genetic toggle switch can be exploited to generate a robust, biologically-based ‘‘nanorecorder’’ that could potentially be adapted to detect, respond and record a wide range of chemical stimuli that may vary over time and space. Citation: Bhomkar P, Materi W, Wishart DS (2011) The Bacterial Nanorecorder: Engineering E. coli to Function as a Chemical Recording Device. PLoS ONE 6(11): e27559. doi:10.1371/journal.pone.0027559 Editor: Mark Isalan, Center for Genomic Regulation, Spain Received June 28, 2011; Accepted October 19, 2011; Published November 23, 2011 Copyright: ß 2011 Bhomkar et al. This is an open-access article distributed under the terms of the Creative Commons Attribution License, which permits unrestricted use, distribution, and reproduction in any medium, provided the original author and source are credited. Funding: National Research Council of Canada, The Canadian Institutes of Health Research (CIHR) and the Natural Sciences and Engineering Research Council (NSERC). The funders had no role in study design, data collection and analysis, decision to publish, or preparation of the manuscript. Competing Interests: The authors have declared that no competing interests exist. * E-mail: [email protected] Introduction Synthetic biology or ‘‘synbio’’ is an emerging field of biotechnology that combines molecular biology with genetic engineering and protein engineering. Like synthetic chemistry, synthetic biology involves the design and synthesis of novel entities with unusual and/or useful functionalities. In synthetic biology, the raw materials are DNA and proteins, while in synthetic chemistry the raw materials are small molecule chemicals and chemical catalysts. Over the past decade, synthetic biologists have designed and developed a number of ‘‘synthetic prokaryotes’’ exhibiting completely novel or entirely un-natural functions such as a bacterial oscillator [1], a toggle switch [2], a bacterial photocopier [3], a bacterial drug delivery system [4], a biofilm- destroying agent [5], an edge detection tool [6] and a bacterial clock [7]. More recently the same synbio concepts have been successfully applied to eukaryotic systems [8–11]. However, constructing synthetic cells or organisms that respond in a robust and precise manner still represents a significant challenge for today’s synthetic biologists. In particular, gaps in our understand- ing of the operational principles of natural biological systems, coupled with the lack of tools to fully characterize synbio-inspired devices has led to many more proof-of-principle demonstrations than useful applications [12]. The bistable toggle switch is an example of a genetic ‘‘memory element’’ that is among the most robust and useful synthetic biology devices developed to date. This device is a synthetic genetic circuit that generates a sustained cellular response to a transient stimulus [2]. In its initial inception, the toggle switch consisted of two constitutive promoters driving the expression of mutually inhibitory repressor proteins. Other genetic memory element circuits include the fimE-driven inversion recombination switch [13], the conditional memory circuit, wherein a bistable toggle switch is modified by the addition of two regulatory proteins [14] and the riboregulator-/recombinase-based genetic counter [15]. Because of its reliance on relatively few regulatory elements, the toggle switch design is relatively tolerant of stochastic fluctuations and has been exploited in a number of synbio applications. These include an E.coli strain that responds by biofilm formation upon transient exposure to a DNA-damaging agent [16] and a cadmium biosensing Pseudomonas putida strain [17]. Although the toggle switch represents an effective way to detect and store the ‘‘memory’’ of an event, it is currently not possible to ‘‘time stamp’’ such a memory using the current toggle switch configuration. In other words, it is not yet feasible to determine the time when the toggle switch was initially exposed to a stimulus or signal molecule without a continuous recording of the reporter gene expression. Time stamping would obviously be a useful feature for biologically based chemosensors, particularly if one is interested in passive environmental monitoring, tracking the occurrences of pulsed chemical releases or performing longer term longitudinal chemosensing. This time stamp problem arises because most synbio systems employing toggle switches have relied on the expression of primary output responses that do not increase predictably or in a retroactively measurable fashion following exposure to the signal molecule. Indeed most biosensor or chemosensor output responses are typically limited to fluorescent PLoS ONE | www.plosone.org 1 November 2011 | Volume 6 | Issue 11 | e27559
Transcript of The Bacterial Nanorecorder: Engineering E. coli to Function as a Chemical Recording Device

The Bacterial Nanorecorder: Engineering E. coli toFunction as a Chemical Recording DevicePrasanna Bhomkar1*, Wayne Materi1, David S. Wishart1,2,3
1 National Institute for Nanotechnology, Edmonton, Alberta, Canada, 2 Department of Computing Science, University of Alberta, Edmonton, Alberta, Canada,
3 Department of Biological Sciences, University of Alberta, Edmonton, Alberta, Canada
Abstract
Synthetic biology is an emerging branch of molecular biology that uses synthetic genetic constructs to create man-madecells or organisms that are capable of performing novel and/or useful applications. Using a synthetic chemically sensitivegenetic toggle switch to activate appropriate fluorescent protein indicators (GFP, RFP) and a cell division inhibitor (minC),we have created a novel E. coli strain that can be used as a highly specific, yet simple and inexpensive chemical recordingdevice. This biological ‘‘nanorecorder’’ can be used to determine both the type and the time at which a brief chemicalexposure event has occurred. In particular, we show that the short–term exposure (15–30 min) of cells harboring thissynthetic genetic circuit to small molecule signals (anhydrotetracycline or IPTG) triggered long-term and uniform cellelongation, with cell length being directly proportional to the time elapsed following a brief chemical exposure. This workdemonstrates that facile modification of an existing genetic toggle switch can be exploited to generate a robust,biologically-based ‘‘nanorecorder’’ that could potentially be adapted to detect, respond and record a wide range ofchemical stimuli that may vary over time and space.
Citation: Bhomkar P, Materi W, Wishart DS (2011) The Bacterial Nanorecorder: Engineering E. coli to Function as a Chemical Recording Device. PLoS ONE 6(11):e27559. doi:10.1371/journal.pone.0027559
Editor: Mark Isalan, Center for Genomic Regulation, Spain
Received June 28, 2011; Accepted October 19, 2011; Published November 23, 2011
Copyright: � 2011 Bhomkar et al. This is an open-access article distributed under the terms of the Creative Commons Attribution License, which permitsunrestricted use, distribution, and reproduction in any medium, provided the original author and source are credited.
Funding: National Research Council of Canada, The Canadian Institutes of Health Research (CIHR) and the Natural Sciences and Engineering Research Council(NSERC). The funders had no role in study design, data collection and analysis, decision to publish, or preparation of the manuscript.
Competing Interests: The authors have declared that no competing interests exist.
* E-mail: [email protected]
Introduction
Synthetic biology or ‘‘synbio’’ is an emerging field of
biotechnology that combines molecular biology with genetic
engineering and protein engineering. Like synthetic chemistry,
synthetic biology involves the design and synthesis of novel entities
with unusual and/or useful functionalities. In synthetic biology,
the raw materials are DNA and proteins, while in synthetic
chemistry the raw materials are small molecule chemicals and
chemical catalysts. Over the past decade, synthetic biologists have
designed and developed a number of ‘‘synthetic prokaryotes’’
exhibiting completely novel or entirely un-natural functions such
as a bacterial oscillator [1], a toggle switch [2], a bacterial
photocopier [3], a bacterial drug delivery system [4], a biofilm-
destroying agent [5], an edge detection tool [6] and a bacterial
clock [7]. More recently the same synbio concepts have been
successfully applied to eukaryotic systems [8–11]. However,
constructing synthetic cells or organisms that respond in a robust
and precise manner still represents a significant challenge for
today’s synthetic biologists. In particular, gaps in our understand-
ing of the operational principles of natural biological systems,
coupled with the lack of tools to fully characterize synbio-inspired
devices has led to many more proof-of-principle demonstrations
than useful applications [12].
The bistable toggle switch is an example of a genetic ‘‘memory
element’’ that is among the most robust and useful synthetic
biology devices developed to date. This device is a synthetic
genetic circuit that generates a sustained cellular response to a
transient stimulus [2]. In its initial inception, the toggle switch
consisted of two constitutive promoters driving the expression of
mutually inhibitory repressor proteins. Other genetic memory
element circuits include the fimE-driven inversion recombination
switch [13], the conditional memory circuit, wherein a bistable
toggle switch is modified by the addition of two regulatory proteins
[14] and the riboregulator-/recombinase-based genetic counter
[15]. Because of its reliance on relatively few regulatory elements,
the toggle switch design is relatively tolerant of stochastic
fluctuations and has been exploited in a number of synbio
applications. These include an E.coli strain that responds by
biofilm formation upon transient exposure to a DNA-damaging
agent [16] and a cadmium biosensing Pseudomonas putida strain
[17].
Although the toggle switch represents an effective way to detect
and store the ‘‘memory’’ of an event, it is currently not possible to
‘‘time stamp’’ such a memory using the current toggle switch
configuration. In other words, it is not yet feasible to determine the
time when the toggle switch was initially exposed to a stimulus or
signal molecule without a continuous recording of the reporter
gene expression. Time stamping would obviously be a useful
feature for biologically based chemosensors, particularly if one is
interested in passive environmental monitoring, tracking the
occurrences of pulsed chemical releases or performing longer
term longitudinal chemosensing. This time stamp problem arises
because most synbio systems employing toggle switches have relied
on the expression of primary output responses that do not increase
predictably or in a retroactively measurable fashion following
exposure to the signal molecule. Indeed most biosensor or
chemosensor output responses are typically limited to fluorescent
PLoS ONE | www.plosone.org 1 November 2011 | Volume 6 | Issue 11 | e27559
reporter proteins (namely GFP) or phenotypic alterations (viz.
biofilm formation) which cannot be readily used as a quantitative
measure of the time elapsed following an initial (or a brief) signal
exposure. Also, the visualization of a fluorescent reporter protein
necessitates the use of a well-equipped microscope facility and
hence cannot be used for routine or field-based detection.
To address this time-stamping and detection limitation with
today’s bacterial biosensors we decided to utilize a number of pre-
existing synbio circuits to create a time-stamping, chemo-sensing
bacterium or more simply, a bacterial ‘‘nanorecorder’’. This
bacterial time-recording device has been designed so that it could
1) respond to a brief event or stimulus; 2) maintain a memory of
that event/stimulus; and 3) time stamp that event or stimulus. In
other words we wanted to create a synthetic bacterium that could
register a long-term phenotypic response following short-term
exposure to a chemical and utilize the elicited phenotypic response
to estimate the time elapsed after chemical exposure. One suitable
phenotypic response capable of being able to time-stamp events in
bacteria could be to arrest the cell division process, and instead
activate cell elongation. Utilizing this response has three benefits:
1) the detection of activated cells becomes much easier (light
microsopy vs. fluorescence microscopy); 2) the length of the cell is
proportional to the time following exposure and 3) the system is
self-limiting (cells stop generating viable progeny after exposure to
the chemical stimulus). Therefore to create this bacterial time-
recording device we coupled the expression of the cell division
inhibitor gene, minC [18–20], with a standard genetic toggle switch
to engineer a phenotypic response (i.e. filamentation) that can be
used to calculate the time of initial signal exposure. Specifically, in
this report we describe the modification of two well-studied
bistable toggle plasmids (namely, pTAK117 and pIKE107) [2] to
support the co-expression of physiologically relevant levels of
MinC protein. Transforming these plasmids into suitable host cells
led to the production of E. coli strains that fluoresce with different
colors (depending on the type of chemical exposure) and elongate
up to 306 their normal length (allowing quantitative determina-
tion of time elapsed following initial signal exposure) upon short-
term exposure to different signal molecules (namely IPTG or
anhydrotetracycline). The length of the cells corresponds to the
time (in cell division ‘‘units’’) since exposure or activation, allowing
quantitative determination of time elapsed following initial signal
exposure. By analogy to the manner in which the length of paper
produced from a chart recorder corresponds to the length of time
since the start of recording, this system resembles a recorder
device. The term ‘‘nanorecorder’’ was coined because this system
uses specially engineered nanoscale devices, including proteins,
plasmids and bacteria (width = 500 nm), to create a functioning
recorder.
This work demonstrates how the careful modification of an
existing genetic toggle switch can be exploited to generate a
biologically-based ‘‘nanorecorder’’ that could potentially be
adapted to detect, respond, recall and record a wide range of
chemical stimuli that may vary over time and space.
Materials and Methods
Bacterial strains, growth conditions and chemicalsE. coli strain XL-1-Blue (obtained from Stratagene, USA) was
used for the construction of all plasmids described in this work.
The E. coli strains PB103 [21], PB103:pDR175 and PB103:lDR144 were obtained as gifts from Dr. Piet A. J. de Boer (Case
Western Reserve University, Cleveland, OH). Plasmid pDR175
[20] is a pGB2 [22] derivative wherein expression of the MinC
protein is induced by a 42uC heat-shock, while the integrated
prophage l DR144 (imm21 bla+ lacIq+ Plac::sfiA) encodes an IPTG-
inducible SfiA protein. The host strain PB103 was used to test the
effect of expression of two different cell division inhibitors, namely
MinC and SfiA, on cell elongation. Cells were grown in Luria-
Bertani (LB) medium at 37uC and plasmids were selected using
50 mg/L ampicillin and 25 mg/L spectinomycin. Ampicillin,
spectinomycin and IPTG were procured from Gold Biotechnol-
ogy, MO, Anhydrotetracycline was manufactured using our in-
house chemical synthesis facility, while LB medium was prepared
using DifcoTM LB broth Miller (BD Biosciences, Canada).
Restriction enzymes were obtained from New England Biolabs,
Canada and primer sequences were commercially synthesized
from Integrated DNA Technologies, Canada. For expression
studies, the cells were cultured at 31uC. All molecular cloning
manipulations were performed according to standard protocols
described in the Molecular Cloning Manual [23].
Plasmid constructionToggle switch plasmids, pTAK117 and pIKE107 [2], were
obtained as gifts from Dr. Jim Collins (Centre for Biodynamics,
Boston, MA) and used as the basis for constructing derivative
plasmids. The pTAK117 derivative, pTAK117-minC, was
designed to express green fluorescent protein (GFP) and MinC
upon exposure to IPTG, while the pIKE107 derivative, pIKE107-
RFP-minC, was designed to express red fluorescent protein (RFP)
and MinC upon exposure to anhydrotetracycline (i.e. aTc). The
minC coding sequence was amplified by PCR using E. coli genomic
DNA (strain MG1655, ATCC number 700926D-5) as a template
with the primers minC-FW1 and minC-RW1 and ligated into
PCR 2.1-TOPO (Invitrogen, Canada) to obtain PCR 2.1-minC.
The 59 primer sequence also included ribosome-binding sites
(RBSs) of different strengths to confer translational control on
MinC expression levels. The IPTG-inducible promoter, pTrc2,
was amplified using pTAK117 as a template with primers (pTrc2-
KpnI-FW, pTrc2-BamHI-RW) and cloned into pGEMT. The
pTrc2 promoter fragment (KpnI-BamHI) was ligated into KpnI-
BamHI digested PCR 2.1-minC to obtain pTrc-minC. This
plasmid was co-transformed with the toggle switch plasmid,
pTAK117, into the PB103 host cells by heat shock transformation
and co-transformants were selected on ampicillin and kanamycin.
In independent experiments, the minC coding sequence was
amplified using primers having NheI overhangs at both ends
(minC-FW2, minC-RW2) and cloned downstream of the GFP
gene into NheI-digested pTAK117. The ligation mixture was
transformed into XL-1 blue host cells and plasmid DNA was
isolated from all the putative recombinant clones (regardless of the
minC orientation), followed by independently transforming the
isolated plasmids into PB103 host cells. Recombinants having minC
gene cloned in the sense orientation (with respect to the pTrc2
promoter) were identified using a phenotypic screen (as described
in the Results and Discussion section), confirmed by plasmid DNA
sequencing and were designated as pTAK117-minC (Figure 1A).
A ‘‘toggle-less’’ version of the IPTG-nanorecorder (pTAK117-
minC*) was made by digesting pTAK117-minC with SphI-KpnI (to
get rid of the pTrc2-cI fragment) followed by ligating a
commercially synthesized SphI-KpnI fragment (comprising the
pTrc2 promoter). Due to this manipulation, PB103 cells
transformed pTAK117-minC* would be unable to synthesize the
cI repressor and hence require continuous IPTG exposure to
induce GFP and MinC expression.
In order to construct pIKE107-RFP-minC, GFP was excised
from pIKE107 by a KpnI-NheI digest followed by blunting and self-
ligation of the vector backbone. The RFP gene was then amplified
from the Biobrick plasmid BBa_J23018 using primers having NheI
The Bacterial Nanorecorder
PLoS ONE | www.plosone.org 2 November 2011 | Volume 6 | Issue 11 | e27559
overhangs at both ends (RFP-FW, RFP-RW), subcloned into
PCR2.1-TOPO (to obtain PCR2.1-TOPO-RFP) before its
ligation as an AscI fragment in AscI-digested pIKE107 to obtain
pIKE107-RFP. The RFP-FW primer sequence included the RBSc
(used earlier to control MinC expression in pTAK117). The minC
fragment (obtained as an NheI digest from pTAK117-minC) was
blunt-ended using T4 DNA polymerase and ligated (downstream
of RFP) in NheI-digested and blunt-ended pIKE107-RFP.
Recombinant clones wherein minC was ligated in the sense
orientation (with respect to the anhydrotetracycline-inducible
PLtetO-1 promoter) were identified using the phenotypic screen,
validated using DNA sequencing and were designated as
pIKE107-RFP-minC (Figure 1B). Sequences for the primers used
in these experiments are listed in Figure 1C. Restriction maps of
pTAK117-minC, pIKE107-RFP-minC and the nucleotide se-
quence of the commercially synthesized SphI-KpnI fragment are
provided in Supporting information as Figures S1 and S2
respectively.
Characterization of the bacterial nanorecordersThe IPTG-inducible version of the bacterial nanorecorder
strain (PB103:pTAK117-minC) was characterized in order to
determine the limits of its sensitivity and its potential suitability as a
time-stamping or recording device. To monitor the behavior of the
cell population under continuous IPTG induction, the cells were
grown in the presence of 2 mM IPTG at 31uC and aliquots were
observed via microscopy at 30 min-intervals to record their
fluorescence signal intensity and cell length. In order to determine
the minimum IPTG concentration and the shortest time of cellular
exposure necessary to register a long-term response, the cells were
incubated with 2 mM, 5 mM, 10 mM and 20 mM IPTG for
15 min, 30 min and 60 min. After exposure the cells were briefly
pelleted, washed twice in LB medium before suspending them in
LB (50 mg/L ampicillin, without IPTG) and retransferred to
culture tubes for further growth. The cells were observed at 30-
min intervals to record their fluorescence signal intensity and cell
length. Aliquots from the same culture grown with 2 mM IPTG
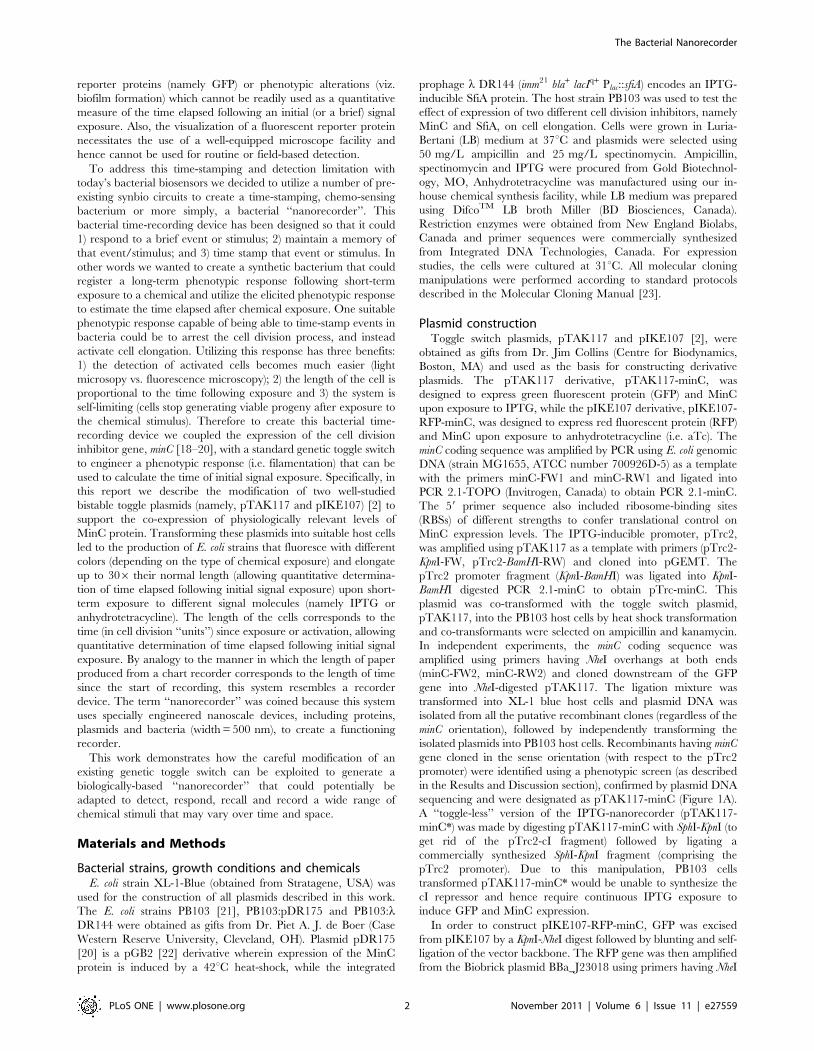
Figure 1. Representation of modified toggle switch plasmids and primer sequences. A. pTAK117-minC functions as an IPTG-sensitivenanorecorder. The repressor, cI, inhibits transcription from the PLs1con promoter while the lacI repressor inhibits transcription from the pTrc2promoter. Transient addition of IPTG derepresses pTrc2 and initiates long-term expression of GFP and MinC reporter genes. B. pIKE107-RFP-minC isthe anhydrotetracycline-responsive nanorecorder. The lacI repressor prevents transcription from the pTrc2 promoter while the TetR repressor inhibitstranscption initiation from the PLtetO-1 promoter. Transient exposure to anhydrotetracycline relieves PLtetO-1 from TetR-mediated repression,stimulating sustained expression of RFP and minC reporter genes. C. Primers used for construction of toggle switch plasmids. RBS representsribosome binding sequences, RBSa: aaagaggagaaa, RBSb: tcacacaggaaag, RBSc: tcacacaggaaacc. The sequences in italics represent the restriction sitesused for cloning.doi:10.1371/journal.pone.0027559.g001
The Bacterial Nanorecorder
PLoS ONE | www.plosone.org 3 November 2011 | Volume 6 | Issue 11 | e27559

and in IPTG-less media were included as positive and negative
controls. The anhydrotetracycline-inducible version of the bacte-
rial nanorecorder strain (PB103:pIKE107-RFP-minC) was char-
acterized similarly upon exposure to 0.05 nM, 0.1 nM, 0.25 nM,
0.5 nM, 1 nM, 2 nM, 5 nM and 10 nM anhydrotetracycline and
the responses obtained were compared to those obtained with the
IPTG-inducible version of the nanorecorder.
Microscopy, data collection and analysisTwenty microlitres of actively growing cultures were transferred
to a glass slide and visualized by phase contrast microscopy at 206magnification (Olympus IX81 inverted microscope). Images were
collected using Image Pro Plus software (Media Cybernetics). To
measure cell length, the image was calibrated to the magnification
used and cells selected using the software’s ‘‘Select ranges’’
function. The selected cells were distributed into various bin sizes
(class 1: 0.5 mm–4 mm, class 2: 4.1 mm–8 mm, class 3: 8.1 mm–
16 mm, class 4: 16.1 mm–32 mm, class 5: 32.1 mm–64 mm, class 6:
64.1 mm–132 mm) using the ‘‘Count’’ and ‘‘Measure’’ functions of
the software. Cells in class 1 correspond to those having gone
through one doubling without cytokinesis; cells in class 2
correspond to those having gone through two doublings without
cytokinesis; cells in class 3 correspond to those that have doubled
at least three times without cytokinesis, cells in class 4 correspond
to those that have doubled at least four times without cytokinesis
and cells in class 5 correspond to those that have doubled five
times or more without cytokinesis. Note that a range of cell lengths
are used for each doubling category because the variable
orientation of the cells in the microscope viewing plane causes
optical foreshortening of the true cell length. The data obtained
was transferred to MS Excel and used to calculate the number of
cells measured in each class (Figure 2 A–F) and the corresponding
standard deviation of the cell length distribution for each class. All
measurements were obtained from three independent cultures
maintained under identical conditions. Each experiment was
repeated at least three times. For each treatment, at least 500 cells
were counted. The average cell length was also plotted versus time
elapsed for better data visualization (Figure 2G). GFP and RFP
expression in cells was visualized under UV fluorescence using
FITC and TRITC filters, respectively.
Results and Discussion
Synthetic biology relies on the construction of man-made or
synthetic genetic devices to produce cells with predictable yet
fundamentally un-natural properties. This is most often done by
harnessing and modifying endogenous pathways to generate
artificial genetic networks. For example, the genetic bistable
toggle switch [2] has been exploited as a means to program cells
using a modular design strategy, thereby paving the way for the
development of ‘‘plug-and-play’’ genetic circuit devices. A number
of synthetic gene networks designed to function as memory
elements have already been described [13–16]. However, these
systems cannot be used to estimate the time elapsed following
exposure (either brief or continuous) to a signal molecule. Because
of this limitation we decided to generate a bacterial time-stamp
device (a biological nanorecorder) that, upon transient (or
continuous) exposure to a signal molecule, would generate an
easily quantifiable phenotypic response that would allow us to
estimate the time elapsed following signal exposure.
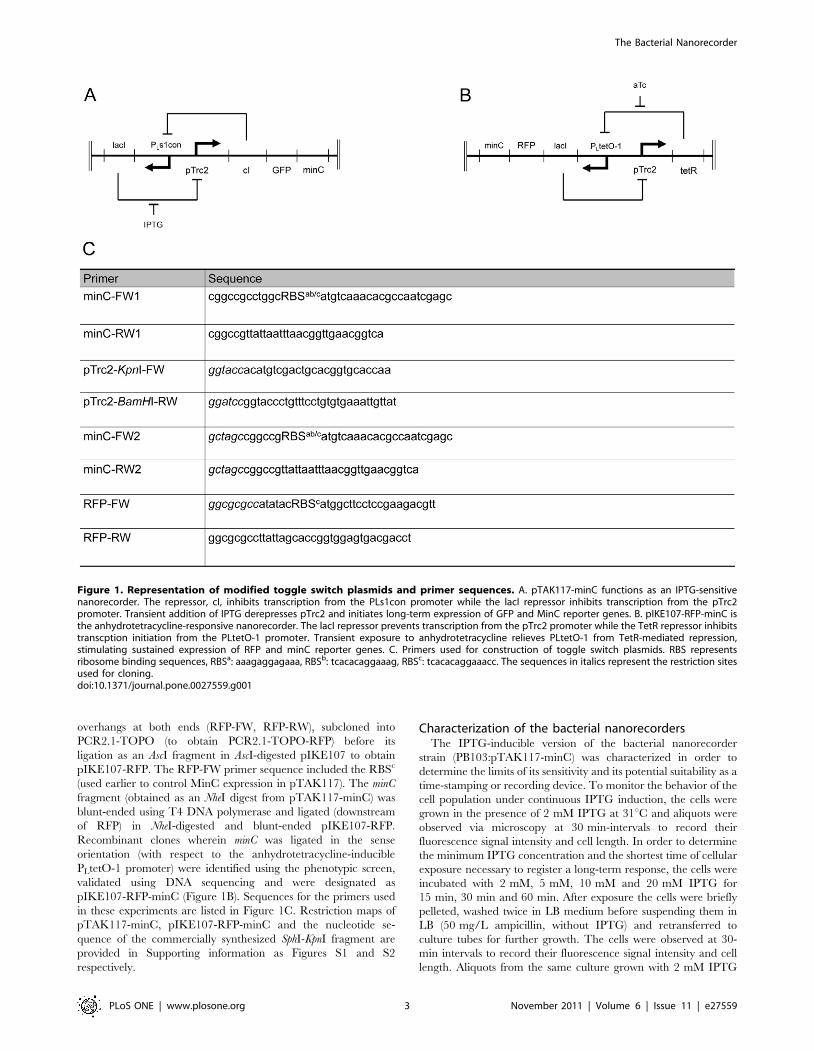
Figure 3 conceptualizes the expected behavior of the proposed
time stamp devices. It describes what we expect to happen if we
prepared a bacterial system that contained i) only a chemically
activated toggle switch coupled to a fluorescent signal, ii) no toggle
switch but had chemically activated cell elongation coupled to a
fluorescent signal, and iii) both a chemically activated toggle switch
and a cell division inhibitor coupled to a fluorescent signal. As part
of the proposed time stamp devices, we first explored the feasibility
of an alternative approach for time recording, wherein transient
exposure to a signal molecule rapidly induces expression of a
fluorescent reporter and the time elapsed following signal exposure
can be estimated by monitoring the periodic reduction in
fluorescence intensity (Figure 3B). We found that this approach
could be used to time-stamp a 30 min pulse for 3 h and a 45 min
pulse for 4 h (see Supporting information, Figure S3 for details).
However, we experienced that measuring fluorescence intensity
and quantifying fluorescent decay was relatively tedious and time
consuming (as one needs to carefully normalize fluorescence
intensities) and is very sensitive to minor changes in the focal plane
and could be easily affected external parameters (such as the life of
the mercury lamp used for visualizing fluorescence). Additionally,
fluorescence intensities were also dependent on media used for cell
culture (intensities were higher by up to 20% in M9 medium as
compared to LB medium). Although there could be promoter-
reporter-strain-media combinations where the fluorescence-inten-
sity based method could yield better results, we explored a toggle-
switch based approach to time-stamping. Accordingly, we were
interested to investigate cell length as an alternative reporter
system because cell length can be easily visualized using a simple
light microscope, can be potentially quantified without the use of
sophisticated software and is independent of media type. As shown
in Figure 3C, exposing bacteria containing only the toggle switch-
fluorescent reporter combination to a short pulse of the signaling
molecule would result in many fluorescent progeny but no
elongated cells. While the presence of fluorescent cells would
indicate an exposure event, without knowing the initial number of
cells that were exposed or the number of cells that were activated,
it would not be possible to calculate when the exposure event
occurred. As shown in Figure 3D, exposing bacteria containing a
combination of a fluorescent reporter and cell division inhibitor
but no toggle switch, to a short pulse of the signaling molecule
would temporarily inhibit division in the progenitor cells but after
a short time the cells would lose their memory of the exposure
event and essentially nothing useful could be detected. Finally, as
shown in Figure 3E, exposing bacteria containing both the toggle
switch and the cell division inhibitor to the signaling molecule
would result in an easily detected phenotypic response where the
length of the elongating bacterial cell could be used to calculate the
time elapsed following exposure. Based on these scenarios, we
constructed a bacterial system that contained a chemically
activated toggle switch and a cell division inhibitor coupled to a
fluorescent signal. Balancing physiological levels of this reporter
gene (minC) in bacterial cells proved to be critical to the
development of this kind of bacterial nanorecorder (For further
details, refer to Supporting information, Text S1-Optimization of
the MinC reporter system. For example, Figure S4 demonstrates
that MinC expression resulted in better inhibition of cell division
than SfiA expression).
Characterization of the IPTG-sensitive bacterial ‘‘time-stamp’’ device
The following experiments were initiated to explore the
potential suitability of PB103 cells harboring the modified IPTG
toggle switch (pTAK117-minC) as a ‘‘time-stamp’’ device and
determine the limits of its sensitivity.
Time course of cell elongation upon continuous IPTG
exposure. PB103:pTAK117 cells cultured under continuous
exposure to 2 mM IPTG at 31uC in LB medium were 2 mm long
The Bacterial Nanorecorder
PLoS ONE | www.plosone.org 4 November 2011 | Volume 6 | Issue 11 | e27559

and divided every 35 min in their exponential phase. On the other
hand, PB103 cells (transformed with the modified toggle switch,
pTAK117-minC) cultured under identical conditions displayed
uniform cell elongation in a time-dependent manner (Figure 2).
After 30 min of incubation, the PB103:pTAK117-minC cell
population showed no visible signs of cell elongation in either
the induced or non-induced treatments (Figure 2). However, after
60 min of incubation (Figure 2B), the induced cell population
comprised of 61% cells in class 2 (4.1 mm–8 mm) and 8% cells in
class 3 (8.1 mm–16 mm). The induced cell population continued to
elongate in a time-dependent manner and reached maximal cell
lengths after 150 min (Figure 2E), wherein all the cells were found
to be in class 5 (32.1 mm–64 mm). Further cell elongation was not
observed beyond this incubation period. Meanwhile, after
180 min of incubation more than 90% of the uninduced
PB103:pTAK117-minC cell population consisted of cells in class
1 (0.5 mm–4 mm), thereby displaying negligible background
elongation in the absence of IPTG.
The maximal length of the filaments obtained upon continuous
exposure of the PB103:pTAK117-minC to 2 mM IPTG was
58 mm (nearly 306 the length of their uninduced counterparts).
Arends and Weiss [24] noted that long-term inhibition of cell
division in E.coli apparently did not affect the growth rate, DNA
replication or chromosome segregation and the only obvious
effects were morphological wherein these cells grew into long,
aseptate filaments that ultimately lysed, eventually resulting in
lethality.
Overall, we found that cell elongation of PB103 cells
(pTAK117-minC), following exposure to the signal molecule
(IPTG), occurred in a time-dependent manner and that it was
Figure 2. Time course of cell elongation upon continuous exposure to 2 mM IPTG. PB103:pTAK117-minC cells observed at A) 30 min, B)60 min, C) 90 min, D) 120 min, E) 150 min and F) 180 min post-IPTG exposure. Class sizes are as follows: class 1: 0.5 mm–4 mm, class 2: 4.1 mm–8 mm,class 3: 8.1 mm–16 mm, class 4: 16.1 mm–32 mm, class 5: 32.1 mm–64 mm, class 6: 64.1 mm–132 mm. G. Average cell length versus elapsed time uponconstant exposure to 2 mM IPTG. PB103:pTAK117-minC cells observed at different time intervals (30 min, 60 min, 90 min, 120 min, 150 min and180 min) following continuous IPTG exposure to 2 mM IPTG following which the averaged cell length was plotted with respect to time elapsed post-IPTG exposure.doi:10.1371/journal.pone.0027559.g002
The Bacterial Nanorecorder
PLoS ONE | www.plosone.org 5 November 2011 | Volume 6 | Issue 11 | e27559
accompanied by the appearance of different-sized cells at discrete
time intervals up to 2.5 h. These data suggest that cell length can
be used to detect and calculate the time elapsed following exposure
to a signal molecule. To illustrate, a cell population consisting of
ca. 60% cells in class 3 (8.1 mm–16 mm) and 40% cells in class 4
(16.1 mm–32 mm) would suggest that these cells were exposed to
the signal molecule 90 min (3–4 doublings) prior to measurement,
while a cell population consisting of ca. 40% cells in class 4
(16.1 mm–32 mm) and 60% cells in class 5 (32.1 mm–64 mm) would
be indicative of an exposure event that occurred 120 min (4–5
doublings) in the past. It should be noted that because cell
doubling times are dependent on growth medium and culture
temperature, we would advocate that the nanorecorder’s time
should ideally be measured in units of cell doublings rather than in
standard units of hours or minutes. Plotting the average cell length
(without binning the cells into different class sizes) versus elapsed
time also demonstrated that there was a consistent increase in the
average measured cell length for up to 150 min of continuous
IPTG exposure (Figure 2G).
Utility and sensitivity of cell elongation and toggle-
switching as a time-stamp device. Upon confirming that
continuous signal molecule (IPTG) exposure of PB103 containing
the modified toggle switch plasmid (pTAK117-minC) led to the
phenotype of interest, (i.e. chemo-selective time-dependent cell
elongation), we decided to determine the utility and sensitivity
limits of this IPTG nanorecorder. In particular, we wanted to
answer four questions: 1) What is the minimum length of time and
minimum IPTG concentration needed to activate the
nanorecorder? Within the context of the MinC reporter system
2) Is the toggle switch necessary for proper time stamping? 3) Is
continuous exposure of a chemical stimulus required to activate
cells without the toggle switch? and 4) Is cell elongation absolutely
necessary to record time stamping or can it be inferred by other
means? To answer these questions we prepared two separate E. coli
strains. The first strain consisted of PB103 cells transformed with a
‘‘toggle-less’’ version of pTAK117-minC (i.e. PB103:pTAK117-
minC*) that is incapable of synthesizing the cI repressor and hence
express MinC only upon continuous IPTG exposure. The second
strain consisted of PB103 cells transformed with the original toggle
switch plasmid (pTAK117). These PB103:pTAK117 cells do not
express MinC and therefore continue to divide normally following
exposure to IPTG.
Gardner et al. [2] reported that the toggle switch plasmid,
pTAK117, begins switching from the ‘‘low’’ state (pTrc2
repressed, no cI repressor, no GFP) to the ‘‘high’’ state (i.e.
derepression of pTrc2 leading to cI and GFP expression) after 3–
4 h of IPTG induction. To address the first question, PB103 cells
transformed with pTAK117-minC were exposed to 2 mM, 5 mM,
10 mM and 20 mM IPTG for 15 min, 30 min and 60 min. After
exposure, the 12 sets of cells were pelleted and washed twice with
Figure 3. Schematic illustration of the proposed bacterial time-stamp devices. Panel B outlines the expected behavior of cells whereintransient exposure to a signal molecule rapidly induces expression of a fluorescent reporter protein followed by periodic reduction in fluorescentintensity upon removal of the signal molecule. Brief signal exposure of bacteria containing only the toggle switch driving expression of a fluorescentreporter protein (C) would result in fluorescence in the dividing progeny, while identical signal exposure in bacteria containing a plasmid capable ofconstitutive expression of a cell-division inhibitor and a fluorescent reporter protein (D) would eventually result in non-elongating and non-fluorescent progeny. Only bacteria containing a toggle switch driving expression of a fluorescent reporter protein and a cell-division inhibitor protein(E) are expected to display fluorescence and sustained cellular elongation in progenitor cells, the length of which could be used to calculate timeelapsed following signal exposure. Control bacteria devoid of toggle switch are represented as (A).doi:10.1371/journal.pone.0027559.g003
The Bacterial Nanorecorder
PLoS ONE | www.plosone.org 6 November 2011 | Volume 6 | Issue 11 | e27559

plain LB medium before their final resuspension and incubation in
IPTG-less LB amp50 medium. The exposed cultures were
monitored for 180 min post-IPTG exposure and the population
was sorted into different classes based on observed cell lengths.
Irrespective of the duration of exposure, PB103:pTAK117-minC
cells exposed to 2 mM or 5 mM IPTG did not elongate or express
GFP after transfer to IPTG-less growth medium. Filamentation
was observed in cultures exposed to 10 mM (and 20 mM) IPTG
for 30 min (Figure 4G). In other words, the IPTG nanorecorder
required at least a 30 min exposure to a minimum concentration
of 10 mM IPTG to register the presence of the chemical signal
and begin recording. After 180 min, 62% of the induced
nanorecorder cell population belonged to class 1 (0.5 mm–4 mm),
6% was in class 2 (4.1 mm–8 mm) and 32% of the population
belonged to class 3 (8.1 mm–16 mm). Instead of calculating the
averaged length of all the transiently cells induced cells, we could
estimate the time elapsed post-signal exposure by measuring
length of the most elongated cells. Also, GFP expression was
observed in all filamenting cells exposed to a 30 min, 10 mM
IPTG pulse, but the GFP intensity was 3–4 fold lower than seen in
PB103:pTAK117-minC cells that were grown under the contin-
uous presence of 2 mM IPTG (Figure 4H). Further increases in
the frequency (i.e. total number of filamentous cells) or the extent
of cell filamentation (i.e. the increase in filament lengths of the
responding cell population) were not observed upon increasing the
duration of cell exposure to 60 min (at 10 mM IPTG) or upon
increasing the IPTG concentration (e.g. to 20 mM). Therefore,
our results indicate that the switching process is dependent on the
concentration of the signal molecule and that the bacterial
nanorecorder can begin switching from the ‘‘low’’ to ‘‘high’’ state
at 30 min post-exposure to 10 mM IPTG.
By contrast, the PB103:pTAK117-minC* cells (the ‘‘toggle-less’’
version) could filament and express GFP only upon continuous
exposure to 2 mM IPTG. Therefore these toggle-less cells had no
‘‘memory’’ of a short-term exposure event, although they could
effectively record the duration of continuous signal exposure. In
parallel experiments performed with PB103:pTAK117, we found
that 56% of the population expressed GFP when exposed to
10 mM IPTG for 30 min. As expected, none of these cells showed
any elongation. It is worth noting that with these PB103:pTAK117
cells, the level of fluorescence decayed after 24 h post-transfer to
IPTG-less growth medium. Therefore these continuously dividing
cells had only a partial or fading ‘‘memory’’ of an exposure event.
Consequently they could not be used to effectively record the
duration or the time since IPTG exposure. The results of these
control experiments show that the use of a toggle switch in
combination with cell elongation and an optional chemo-specific
fluorescent signal is an effective route to generating an easy-to-
visualize and hence useable nanorecorder. It is also worth
mentioning that PB103:pTAK117 cells could express GFP for
up to 48 h post-IPTG exposure, but this was only possible if the
cells were subcultured at 3-h intervals into fresh growth media.
Our results with the pTAK117 plasmid (Supporting informa-
tion, Figure S5) were interesting, especially in light of what is
currently understood about toggle switch behavior. As noted
earlier, Gardner et al. [2] reported that the toggle switch plasmid
began switching from the ‘‘low’’ (no GFP expression) to the ‘‘high’’
(i.e. GFP expressing) state after three hours of exposure to 2 mM
IPTG. We observed that PB103:pTAK117 cells exposed for as
little as 30 min expressed GFP (Figure S5-D), although a higher
concentration of IPTG (10 mM) was required. This suggests that
exposing cells to higher IPTG concentrations results in faster
quenching of the unbound intracellular LacI repressor molecules
as well as quickly derepressing the pTrc2-bound LacI repressor,
thereby reducing the exposure time necessary to toggle the genetic
switch from a ‘‘low’’ to a ‘‘high’’ state.
Although phenotypic diversity of a clonal bacterial culture is
stochastic [25], such cells also display subpopulations with
heritable phenotypic differences [26]. The toggle switch is a cyclic
digenic (two-gene) system comprised of two promoter-repressor
cassettes, arranged so that each promoter is inhibited by the
repressor expressed by the opposing promoter. This framework is
considered robust enough to tolerate inherent stochastic fluctua-
tions in gene expression. Consequently it will switch to either of
Figure 4. ‘‘Memory effect’’ upon short-term IPTG exposure.Visible light and UV-light images of PB103: p TAK117-minC exposed to10 mM IPTG for 15 min (E, F),30 min (G, H) and 60 min (I, J) beforewashing and resuspending the cells in IPTG-less LB amp50 medium.Controls include cells not exposed to IPTG (A, B) and cells grown undercontinuous exposure to 2 mM IPTG (C, D). Images were taken after 2 h30 min of exposure to 10 mM IPTG. Scale bar is 50 mm.doi:10.1371/journal.pone.0027559.g004
The Bacterial Nanorecorder
PLoS ONE | www.plosone.org 7 November 2011 | Volume 6 | Issue 11 | e27559

the two alternate stable states only by the addition of specific
external inducers (such as IPTG and temperature in the case of the
toggle plasmid pTAK117). Our demonstration that the ‘‘memory
response’’, characteristic of the toggle switch, is obtained only
when cells are kept at low density (through continuous
subculturing every 3 h) corroborates the findings of Stupak et al.
[27] that the functional state of a bistable toggle switch in the
absence of inducers is also dependent on bacterial cell metabolism.
In their study, Stupak et al. [27] demonstrated that increasing the
time interval between cell subculture lowered the cellular growth
rate, decreased the level of metabolism and resulted in the switch
of these cyclic systems from bistable to monostable functioning
regime. While decreased levels of cellular metabolism are known
to result in stochastic changes in the ratios of cellular proteins,
Stupak et al. [27] also proposed that a low cellular growth rate
could also affect the levels and/or stability of the repressor proteins
that regulate the toggle switch. Although other mechanisms, which
may alter the levels of the repressor proteins or other components
of the toggle switch, cannot be ruled out, our study suggests that
stochastic fluctuations in gene expression may be accentuated by
subtle changes in growth conditions and result in long-term
changes in epigenotypes. In the reverse case scenario, Tan et al.
[28] reported that changes in bacterial host physiology were
responsible for a counter-intuitive situation, wherein bistable gene
expression was displayed by a simple positive feedback circuit.
These studies along with our results suggest that unexpected
interactions between a genetic circuit and its host can result in
unintended perturbations in the dynamics of gene expression.
Therefore, properly accounting for these factors is important for
engineering any kind of robust behavior in synthetic biological
systems.
Anhydrotetracycline-sensitive version of the bacterial‘‘nanocrecorder’’
Similar in configuration to pTAK117, the anhydrotetracycline-
sensitive toggle plasmid, pIKE107, switches from the ‘‘high’’ state
(reporter gene expression) to the ‘‘low’’ state (no expression of
reporter genes) upon short-term exposure to anhydrotetracycline.
Using this toggle switch we decided to make a anhydrotetracy-
cline-responsive version of the ‘‘time-stamp’’ device that would
express the reporter genes upon anhydrotetracycline exposure.
While MinC expression remained our choice for phenotype-based
detection of an exposure event, we chose to express the red
fluorescent protein (RFP) to differentiate its read-out response
from the GFP-based output obtained from the IPTG-nanorecor-
der. This modification enabled colour-coded chemo-selective
detection.
Optimizing expression of RFP reporter gene. Although
RFP expression was detected both in E. coli transformed with a
template Biobrick plasmid (i.e. BBa_J23018) and in E. coli
transformed with PCR2.1-TOPO-RFP (data not shown), our
initial attempts to express the RFP coding sequence in pIKE107
were unsuccessful. Pfleger et al. [29] demonstrated that the
problems related to RFP expression in E. coli were due to the
formation of strong base-pairing between a GC-rich region
present near the 59 end of the RFP gene and the RBS used for
translational initiation. Using saturation mutagenesis, Pfleger et al.
[29] modified the nucleotides of these 59 RFP codons (without
altering the amino acid sequences) and effectively restored RFP
expression by minimizing base-pairing between the 59 end of the
RFP gene and the RBS. Similarly, we hypothesized that our
inability to obtain expression of the RFP-encoding open reading
frame upon transfer from a Biobrick plasmid (BBa_J23018) to a
toggle plasmid (pIKE107) stemmed from the potential base-
pairing between the 59 RFP sequence and the RBS used for
translational initiation. Based on this premise, the RFP gene
amplified using the native Biobrick RBS (identified by sequencing
BBa_J23018) was able to express RFP when cloned into pIKE107.
A comparison of the RBS’s used for RFP expression using a
secondary structure prediction program did not suggest any
differences in their base pairing abilities with the 59 end of the RFP
gene. It is therefore possible that the Biobrick RBS was stronger
and was responsible for RFP expression in pIKE107.
Comparative behavior of the IPTG- and aTc-sensitive
time stamp devices. Although PB103:pIKE107-RFP-minC
cells displayed uniform elongation upon continuous exposure to
1 nM anhydrotetracycline, the response time (i.e. the time taken
for RFP and MinC expression) was much longer than that
observed upon continuous exposure of PB103:pTAK117-minC
cells to 2 mM IPTG. For instance, the anhydrotetracycline-
induced population reached maximal cell lengths after 4 h, while
their IPTG-induced counterparts required only 2.5 h to attain this
stage (Figure 5). Our observation that both the fluorescence and
the MinC-induced cell elongation is delayed in PB103:pIKE107-
RFP-minC compared to PB103:pTAK117-minC may be due to
the higher transcription efficiency of the pTrc-2 promoter relative
to pLtetO-1 and the higher repression efficiency of cI compared to
the TetR [2]. Our studies also revealed that just a 15 min
exposure of PB103:pIKE107-RFP-minC cells to 0.5 nM
anhydrotetracycline was sufficient to trigger cell elongation.
After 210 min of culture in LB medium (50 mg/L ampicillin, no
anhydrotetracycline), 55% of the aTc nanorecorder cell
population was in class 1 (0.5 mm–4 mm), 9% in class 2 (4.1 mm–
8 mm) and 36% of the population in class 3 (8.1 mm–16 mm).
These results demonstrate the pulsed exposure also works with a
anhydrotetracycline-inducible system. Independent experiments
wherein a mixed culture of PB103:pTAK117-minC and
PB103:pIKE107-RFP-minC cells were exposed sequentially to
Figure 5. Comparative behavior of the IPTG- and aTc-sensitivetime stamp devices. Visible light images of PB103:pTAK117-minC andPB103:pIKE107-RFP-minC upon continuous exposure to 2 mM IPTG and1 nM anhydrotetracycline, respectively. Overnight cultures (initiatedfrom glycerol stocks and grown at 37uC in LB amp50) were sub-culturedto fresh LB amp50 for 90 min and used at a 100-fold dilution toinoculate fresh LB amp50 supplemented with IPTG and anhydrote-tracycline. Cells were observed after 90 min (A, D); 2 h 30 min (B, E) and4 h (C, F). Scale bar is 50 mm.doi:10.1371/journal.pone.0027559.g005
The Bacterial Nanorecorder
PLoS ONE | www.plosone.org 8 November 2011 | Volume 6 | Issue 11 | e27559

IPTG and anhydrotetracycline demonstrated the utility of these
nanorecorders to simultaneously respond and generate a time-
dependent response to two different chemical stimuli (Figure 6).
SummaryWe have shown that the facile modification of an existing
genetic toggle switch can be exploited to generate a robust,
biologically-based ‘‘nanorecorder’’ that could potentially be
adapted to detect, recall and record a wide range of chemical
stimuli. By embedding the expression of MinC, a cell division
inhibitory protein, within a standard toggle switch framework, we
demonstrated that a transient exposure to a selected signal
molecule (namely IPTG or anhydrotetracycline) was sufficient to
trigger a long-term cell elongation response in more than one-third
of the exposed cells. As shown here, this induced response can be
used to predict the time elapsed since signal exposure, thereby
providing a time stamp to the exposure event. Also, slow growing
bacterial cells harboring this gene circuit would be capable of
recording longer time intervals post-signal exposure. While these
biological nanorecorders exhibit many of the desired features that
were designed into them, they are relatively imperfect devices, at
least in terms of their sensitivity (in the case of IPTG, requiring
millimolar instead of micromolar or nanomolar concentrations of
the signal molecules), their fidelity (a 33% response rate instead of
100%) and required exposure times (minutes instead of seconds).
Despite this, we believe these results provide the first instance of a
synbio-inspired approach to use organisms as event-recording
devices. We are currently looking at expanding the scope of this
work to construct real-world nanorecorders for sensing pollutants
and toxins (such as heavy metals, phenols) and clinically useful
metabolites (nitrates, urea).
Supporting Information
Figure S1 Schematic restriction maps of A) pTAK117-minC and B) pIKE107-RFP-minC.
(TIF)
Figure S2 DNA sequence of the synthesized SphI-KpnIfragment. RBS denotes the Ribosome Binding Site, while 210
and 235 represent the consensus 235 and 210 sequences of the
pTrc2 promoter.
(TIF)
Figure S3 A. Fluorescence decay of GFP following short-term IPTG exposure. BL21(DE3) cells transformed with
pET15b-GFP were grown at 37uC in LB medium supplemented
with 50 mg/L ampicillin to mid-log phase (OD600 nm,0.5) and
were subcultured at a 1: 30 dilution into LB medium supple-
mented with 50 mg/L ampicillin and 1 mM IPTG. Following
subculture, 1 ml aliquots were withdrawn at set time intervals
(15 min, 30 min, 45 min and 60 min), briefly spun to remove
IPTG and the pelleted cells were resuspended and cultured as
before in 1 ml IPTG-less LBamp50 medium. The cells were
observed under a fluorescence microscope at hourly intervals for a
total of 10 h post-transfer to IPTG-less LBamp50 medium. Images
were adjusted for adjusted for background intensities before
recording cellular fluorescence intensities. Image processing was
done using the software MetaMorph Basic (Molecular Devices Inc.
version 7.7) while average fluorescence intensities and standard
deviation were calculated using MS Excel. B. Schematicrestriction map of pET15b-GFP. The coding sequence of
GFP was amplified from pGFP [4] using primers having NdeI and
BamHI overhangs and cloned into NdeI-BamHI digested pET15b
(Novagen Inc. USA).
(TIF)
Figure S4 Relative efficacy of cell division inhibition.Visible light images of PB103 cells expressing MinC under A)
uninduced and B) induced conditions and SfiA under C)
uninduced and D) induced conditions. MinC expression was
initiated by transferring freshly grown culture (OD600 nm,0.3) of
PB103:pDR175 (grown at 31uC in LB medium supplemented with
25 mg/L spectinomycin) to 42uC. SfiA expression was elicited by
addition of 2 mM IPTG to a freshly grown culture
(OD600 nm,0.3) of PB103:l DR144 (grown at 37uC in LB
medium supplemented with 50 mg/L ampicillin). Cells were
observed following 2 h 30 min of induction. Scale bar is 20 mm.
(TIF)
Figure S5 Response of PB103:pTAK117 cells to short-term IPTG exposure. A freshly grown culture of
PB103:pTAK117 was used to inoculate LBamp50 supplemented
with 2 mM IPTG and 10 mM IPTG followed by culturing the
cells for 30 min at 31 deg C at 225 rpm. After 30 min, cells were
washed off IPTG, cultured in LB amp50 only and visualized after
3 hours. A, B are visible and UV-light images, respectively, of cells
exposed to 2 mM IPTG for 30 minutes while C,D are visible and
UV-light images respectively, of cells exposed to 10 mM IPTG for
30 minutes. E and F represent visible and UV-light images
respectively, of the control treatment wherein cells were grown in
continuous presence of LBamp50 supplemented with 2 mM
IPTG. Scale bar is 20 mm.
(TIF)
Figure 6. Response of mixed culture IPTG- and aTc-sensitive nanorecorders. Visible light (A) and false coloured fluorescence microscopyimage of a mixed culture of PB103:pTAK117-minC (labeled green) and PB103:pIKE107-RFP-minC (labeled red). The culture was exposed to a 15 min,0.25 nM anhydrotetracycline (aTc) pulse and after 2 h, the culture was exposed to a 30 min, 10 mM IPTG pulse. The culture was effectively grown for90 min post-IPTG exposure and 4 h post-aTc exposure and imaged using TRITC and FITC filters. Scale bar is 50 mm.doi:10.1371/journal.pone.0027559.g006
The Bacterial Nanorecorder
PLoS ONE | www.plosone.org 9 November 2011 | Volume 6 | Issue 11 | e27559
Text S1 Optimization of the MinC reporter system.
(DOC)Author Contributions
Conceived and designed the experiments: PB WM DW. Performed the
experiments: PB. Analyzed the data: PB WM. Wrote the paper: PB DW.
References
1. Elowitz MB, Leibler S (2000) A synthetic oscillatory network of transcriptional
regulators. Nature 403(6767): 335–338.
2. Gardner TS, Cantor CR, Collins JJ (2000) Construction of a genetic toggleswitch in Escherichia coli. Nature 403(6767): 339–342.
3. Levskaya A, Chevalier AA, Tabor JJ, Simpson ZB, Lavery LA, et al. (2005)Synthetic biology: engineering Escherichia coli to see light. Nature 438(7067):
441–442.4. Anderson JC, Clarke EJ, Arkin AP, Voigt CA (2006) Environmentally controlled
invasion of cancer cells by engineered bacteria. J Mol Biol 355(4): 619–627.
5. Lu TK, Collins JJ (2007) Dispersing biofilms with engineered enzymaticbacteriophage. Proc Natl Acad Sci U S A 104(27): 11197–11202.
6. Tabor JJ, Salis HM, Simpson ZB, Chevalier AA, Levskaya A, et al. (2009) Asynthetic genetic edge detection program. Cell 137(7): 1272–1281.
7. Danino T, Mondragon-Palomino O, Tsimring L, Hasty J (2010) A synchronized
quorum of genetic clocks. Nature 463(7279): 326–330.8. Kramer BP, Fussenegger M (2005) Hysteresis in a synthetic mammalian gene
network. Proc Natl Acad Sci U S A 102(27): 9517–9522.9. Rinaudo K, Bleris L, Maddamsetti R, Subramanian S, Weiss R, et al. (2007) A
universal RNAi-based logic evaluator that operates in mammalian cells. NatBiotechnol 25(7): 795–801.
10. Weber W, Luzi S, Karlsson M, Sanchez-Bustamante CD, Frey U, et al. (2009) A
synthetic mammalian electro-genetic transcription circuit. Nucleic Acids Res37(4): e33.
11. Chen YY, Jensen MC, Smolke CD (2010) Genetic control of mammalian T-cellproliferation with synthetic RNA regulatory systems. Proc Natl Acad Sci U S A
107(19): 8531–8536.
12. Andrianantoandro E, Basu S, Karig DK, Weiss R (2006) Synthetic biology: newengineering rules for an emerging discipline. Mol Syst Biol 2: 2006 0028.
13. Ham TS, Lee SK, Keasling JD, Arkin AP (2006) A tightly regulated inducibleexpression system utilizing the fim inversion recombination switch. Biotechnol
Bioeng 94(1): 1–4.14. Fritz G, Buchler NE, Hwa T, Gerland U (2007) Designing sequential
transcription logic: a simple genetic circuit for conditional memory. Syst Synth
Biol 1(2): 89–98.15. Friedland AE, Lu TK, Wang X, Shi D, Church G, et al. (2009) Synthetic gene
networks that count. Science 324(5931): 1199–1202.
16. Kobayashi H, Kaern M, Araki M, Chung K, Gardner TS, et al. (2004)
Programmable cells: interfacing natural and engineered gene networks. Proc
Natl Acad Sci U S A 101(22): 8414–8419.
17. Wu CH, Le D, Mulchandani A, Chen W (2009) Optimization of a whole-cell
cadmium sensor with a toggle gene circuit. Biotechnol Prog 25(3): 898–903.
18. Bi E, Lutkenhaus J (1993) Cell division inhibitors SulA and MinCD prevent
formation of the FtsZ ring. J Bacteriol 175(4): 1118–1125.
19. de Boer PA, Crossley RE, Rothfield LI (1989) A division inhibitor and a
topological specificity factor coded for by the minicell locus determine proper
placement of the division septum in E. coli. Cell 56(4): 641–649.
20. Raskin DM, de Boer PA (1999) MinDE-dependent pole-to-pole oscillation of
division inhibitor MinC in Escherichia coli. J Bacteriol 181(20): 6419–6424.
21. de Boer PA, Crossley RE, Rothfield LI (1988) Isolation and properties of minB,
a complex genetic locus involved in correct placement of the division site in
Escherichia coli. J Bacteriol 170(5): 2106–2112.
22. de Boer PA, Crossley RE, Rothfield LI (1990) Central role for the Escherichia
coli minC gene product in two different cell division-inhibition systems. Proc
Natl Acad Sci U S A 87(3): 1129–1133.
23. Sambrook J, Russell DW (2001) Molecular Cloning: A Laboratory Manual.
Cold Spring Harbor, New York: Cold Spring Harbor Laboratories Press.
24. Arends SJ, Weiss DS (2004) Inhibiting cell division in Escherichia coli has little if
any effect on gene expression. J Bacteriol 186(3): 880–884.
25. Kaern M, Elston TC, Blake WJ, Collins JJ (2005) Stochasticity in gene
expression: from theories to phenotypes. Nat Rev Genet 6(6): 451–464.
26. Veening JW, Smits WK, Kuipers OP (2008) Bistability, epigenetics, and bet-
hedging in bacteria. Annu Rev Microbiol 62: 193–210.
27. Stupak EE, Stupak IV (2010) Phenotypic switching of Escherichia coli cells
containing cyclic digenic systems with negative feedback upon changes in
cultivation conditions. Genetika 46(5): 610–615.
28. Tan C, Marguet P, You L (2009) Emergent bistability by a growth-modulating
positive feedback circuit. Nat Chem Biol 5(11): 842–848.
29. Pfleger BF, Fawzi NJ, Keasling JD (2005) Optimization of DsRed production in
Escherichia coli: effect of ribosome binding site sequestration on translation
efficiency. Biotechnol Bioeng 92(5): 553–558.
The Bacterial Nanorecorder
PLoS ONE | www.plosone.org 10 November 2011 | Volume 6 | Issue 11 | e27559