The availability and consistency of dengue surveillance data provided online by the world health...
10
RESEARCH ARTICLE The Availability and Consistency of Dengue Surveillance Data Provided Online by the World Health Organization Irene Ruberto 1 , Ernesto Marques 2 , Donald S. Burke 1 , Willem G. Van Panhuis 1 * 1 Department of Epidemiology, University of Pittsburgh Graduate School of Public Health, Pittsburgh, Pennsylvania, United States of America, 2 Center for Vaccine Research, University of Pittsburgh, Pittsburgh, Pennsylvania, United States of America * [email protected] Abstract Background The use of high quality disease surveillance data has become increasingly important for public health action against new threats. In response, countries have developed a wide range of dis- ease surveillance systems enabled by technological advancements. The heterogeneity and complexity of country data systems have caused a growing need for international organiza- tions such as the World Health Organization (WHO) to coordinate the standardization, integra- tion, and dissemination of country disease data at the global level for research and policy. The availability and consistency of currently available disease surveillance data at the global level are unclear. We investigated this for dengue surveillance data provided online by the WHO. Methods and Findings We extracted all dengue surveillance data provided online by WHO Headquarters and Regional Offices (RO’s). We assessed the availability and consistency of these data by comparing indicators within and between sources. We also assessed the consistency of dengue data provided online by two example countries (Brazil and Indonesia). Data were available from WHO for 100 countries since 1955 representing a total of 23 million dengue cases and 82 thousand deaths ever reported to WHO. The availability of data on Dengue- Net and some RO’s declined dramatically after 2005. Consistency was lacking between sources (84% across all indicators representing a discrepancy of almost half a million cases). Within sources, data at high spatial resolution were often incomplete. Conclusions The decline of publicly available, integrated dengue surveillance data at the global level will limit opportunities for research, policy, and advocacy. A new financial and operational framework will be necessary for innovation and for the continued availability of integrated country disease data at the global level. PLOS Neglected Tropical Diseases | DOI:10.1371/journal.pntd.0003511 April 14, 2015 1 / 10 OPEN ACCESS Citation: Ruberto I, Marques E, Burke DS, Van Panhuis WG (2015) The Availability and Consistency of Dengue Surveillance Data Provided Online by the World Health Organization. PLoS Negl Trop Dis 9(4): e0003511. doi:10.1371/journal.pntd.0003511 Editor: Michael A Johansson, Centers for Disease Control and Prevention, UNITED STATES Received: July 16, 2014 Accepted: December 31, 2014 Published: April 14, 2015 Copyright: © 2015 Ruberto et al. This is an open access article distributed under the terms of the Creative Commons Attribution License, which permits unrestricted use, distribution, and reproduction in any medium, provided the original author and source are credited. Data Availability Statement: Data are available from existing online repositories that are listed in the manuscript. All data are made available through the Project Tycho online data system at the University of Pittsburgh (www.tycho.pitt.edu) Funding: The contributions of IR, WGVP, and DSB to this study were supported by the Bill and Melinda Gates Foundation (Grant 49276, Evaluation of Candidate Vaccine Technologies Using Computational Models) and the US National Institute of General Medical Sciences (Grant 5U54GM088491, Computational Models of Infectious Disease Threats). The funders had no role in study design, data
-
Upload
independent -
Category
Documents
-
view
0 -
download
0
Transcript of The availability and consistency of dengue surveillance data provided online by the world health...
RESEARCH ARTICLE
The Availability and Consistency of DengueSurveillance Data Provided Online by theWorld Health OrganizationIrene Ruberto1, Ernesto Marques2, Donald S. Burke1, Willem G. Van Panhuis1*
1 Department of Epidemiology, University of Pittsburgh Graduate School of Public Health, Pittsburgh,Pennsylvania, United States of America, 2 Center for Vaccine Research, University of Pittsburgh, Pittsburgh,Pennsylvania, United States of America
Abstract
BackgroundThe use of high quality disease surveillance data has become increasingly important for publichealth action against new threats. In response, countries have developed a wide range of dis-ease surveillance systems enabled by technological advancements. The heterogeneity andcomplexity of country data systems have caused a growing need for international organiza-tions such as theWorld Health Organization (WHO) to coordinate the standardization, integra-tion, and dissemination of country disease data at the global level for research and policy. Theavailability and consistency of currently available disease surveillance data at the global levelare unclear. We investigated this for dengue surveillance data provided online by theWHO.
Methods and FindingsWe extracted all dengue surveillance data provided online by WHO Headquarters andRegional Offices (RO’s). We assessed the availability and consistency of these data bycomparing indicators within and between sources. We also assessed the consistency ofdengue data provided online by two example countries (Brazil and Indonesia). Data wereavailable fromWHO for 100 countries since 1955 representing a total of 23 million denguecases and 82 thousand deaths ever reported to WHO. The availability of data on Dengue-Net and some RO’s declined dramatically after 2005. Consistency was lacking betweensources (84% across all indicators representing a discrepancy of almost half a millioncases). Within sources, data at high spatial resolution were often incomplete.
ConclusionsThe decline of publicly available, integrated dengue surveillance data at the global level willlimit opportunities for research, policy, and advocacy. A new financial and operationalframework will be necessary for innovation and for the continued availability of integratedcountry disease data at the global level.
PLOS Neglected Tropical Diseases | DOI:10.1371/journal.pntd.0003511 April 14, 2015 1 / 10
OPEN ACCESS
Citation: Ruberto I, Marques E, Burke DS, VanPanhuis WG (2015) The Availability and Consistencyof Dengue Surveillance Data Provided Online by theWorld Health Organization. PLoS Negl Trop Dis 9(4):e0003511. doi:10.1371/journal.pntd.0003511
Editor: Michael A Johansson, Centers for DiseaseControl and Prevention, UNITED STATES
Received: July 16, 2014
Accepted: December 31, 2014
Published: April 14, 2015
Copyright: © 2015 Ruberto et al. This is an openaccess article distributed under the terms of theCreative Commons Attribution License, which permitsunrestricted use, distribution, and reproduction in anymedium, provided the original author and source arecredited.
Data Availability Statement: Data are available fromexisting online repositories that are listed in themanuscript. All data are made available through theProject Tycho online data system at the University ofPittsburgh (www.tycho.pitt.edu)
Funding: The contributions of IR, WGVP, and DSBto this study were supported by the Bill and MelindaGates Foundation (Grant 49276, Evaluation ofCandidate Vaccine Technologies UsingComputational Models) and the US National Instituteof General Medical Sciences (Grant 5U54GM088491,Computational Models of Infectious Disease Threats).The funders had no role in study design, data
Ernesto Marques
Author SummaryThe use of high quality data and information has become essential for public health agen-cies to monitor and protect population health. Technological advancement has enabledthe development of sophisticated disease surveillance systems by many countries. Increas-ingly, countries are making surveillance data publicly available to their constituencies. Akey role of international agencies such as the World Health Organization is the integrationand curation of country data at the global level. Because it can be confusing to navigate thecurrent online disease data landscape, we assessed the availability and consistency of on-line available surveillance data for dengue provided by the World Health Organizationand two example countries (Brazil and Indonesia). We found that data availability de-clined substantially after 2005 and that consistency between sources was limited to 84%,representing a discrepancy of half a million cases. These limitations reduce opportunitiesfor the efficient use of country data to counter public health threats. A new financial andoperational model is needed to advance the use of disease data at the global level. Industryand academic partners need to step up to support this mandate.
IntroductionThreats to public health around the world have become increasingly complex and the impor-tance of high quality disease surveillance for preparedness and disease control will continue togrow [1]. Scientific progress and global cooperation against emerging threats will depend onthe availability and sharing of disease surveillance data between countries. Global health andfunding agencies emphasized this in an appeal for greater availability and use of data for globalhealth [2,3]. Formally, the 2005 International Health Regulations require the use and sharingof data in response to new threats [4,5]. The central role of the World Health Organization(WHO) in global disease surveillance and data dissemination has been stated in World HealthAssembly resolutions for specific diseases [6].
The WHO has developed various data systems to integrate and disseminate country surveil-lance data such as the Global Health Observatory [7], the Global TB Database [8], DengueNet[9], RabNet [10] and FluNet [11]. In addition to these global databases, WHO Regional Offices(RO’s) also provide disease surveillance data through their websites to inform member coun-tries on disease patterns and trends in their region. Increasingly, country Ministries of Healthpost their own disease surveillance data online for their constituency, mostly in the form of epi-demiological bulletins but sometimes using sophisticated online data repositories such as thosedeveloped by Brazil and Indonesia [12,13]. The public availability of disease surveillance datafrom various heterogeneous sources provides new opportunities for research, training, and pol-icy making but can also lead to confusion on data discrepancies between sources. Limited in-formation on methodology used at various steps along the data trail from within countries tothe global level has further complicated this data landscape. Although it is generally knownthat surveillance data reported by different agencies may not be identical due to reportingmethods and definitions, few studies have quantified the availability and consistency of public-ly available disease surveillance data across sources. This information can guide policy makers,scientists, students, and others to use available data more effectively. We used the example ofdengue to assess the availability and consistency of surveillance data provided online by WHO.We also provided examples of online data provided by the Ministry of Health of Brazil andIndonesia.
Online Dengue Data
PLOS Neglected Tropical Diseases | DOI:10.1371/journal.pntd.0003511 April 14, 2015 2 / 10
collection and analysis, decision to publish, orpreparation of the manuscript.
Competing Interests: The authors have declaredthat no competing interests exist
MethodsWe extracted all online dengue surveillance data fromWHO (WHO DengueNet [9] and fromthe websites of the Pan American Health Organization (PAHO) [14], the WHO SoutheastAsia Regional Office (SEARO) [15] and the WHOWestern Pacific Regional Office (WPRO)[16,17]), and by the Ministries of Health (MOH) of Brazil and Indonesia [12,13]. Brazil and In-donesia were selected as examples because they provided open access to detailed dengue sur-veillance data online in computer readable format. All available data up to April 12th 2013 wereextracted at the highest possible spatiotemporal resolution. To obtain standardized data acrossthese sources, we extracted data for all ages and for both genders combined. We did not extractserotype specific data because these were minimally available. We standardized indicators re-ported by different sources across spatial and temporal scales and also harmonized countrynames using the United Nations ISO country name standard (ISO 3166) [18]. We assessed theavailability of dengue data from each source and also measured data consistency between andwithin sources. We defined consistency between sources as the percent agreement of data re-ported for overlapping countries and time periods. We defined consistency within a source bythe percent agreement of indicators that were recomputed by us from data within the sourceand the corresponding indicators provided by the same source.
All data used in this study are made publicly available through the University of PittsburghProject Tycho online data system (www.tycho.pitt.edu).
ResultsData availabilityWe extracted a total of 71,460 counts for 100 countries from DengueNet and WHO RO web-sites (Fig 1). These data represented a total of ~23 million dengue cases and ~82,000 deathsthat have been reported to WHO between 1955 and 2012. Of these, ~13 million cases (56%)and ~20,000 deaths (24%) were reported between 2000 and 2012. A total of ~4.6 million caseswere reported by WPRO (20%), ~3.2 million (14%) by SEARO, and ~15 million (66%) byPAHO countries (Table 1). The majority of dengue deaths were reported by SEARO (49%) andWPRO (44%).
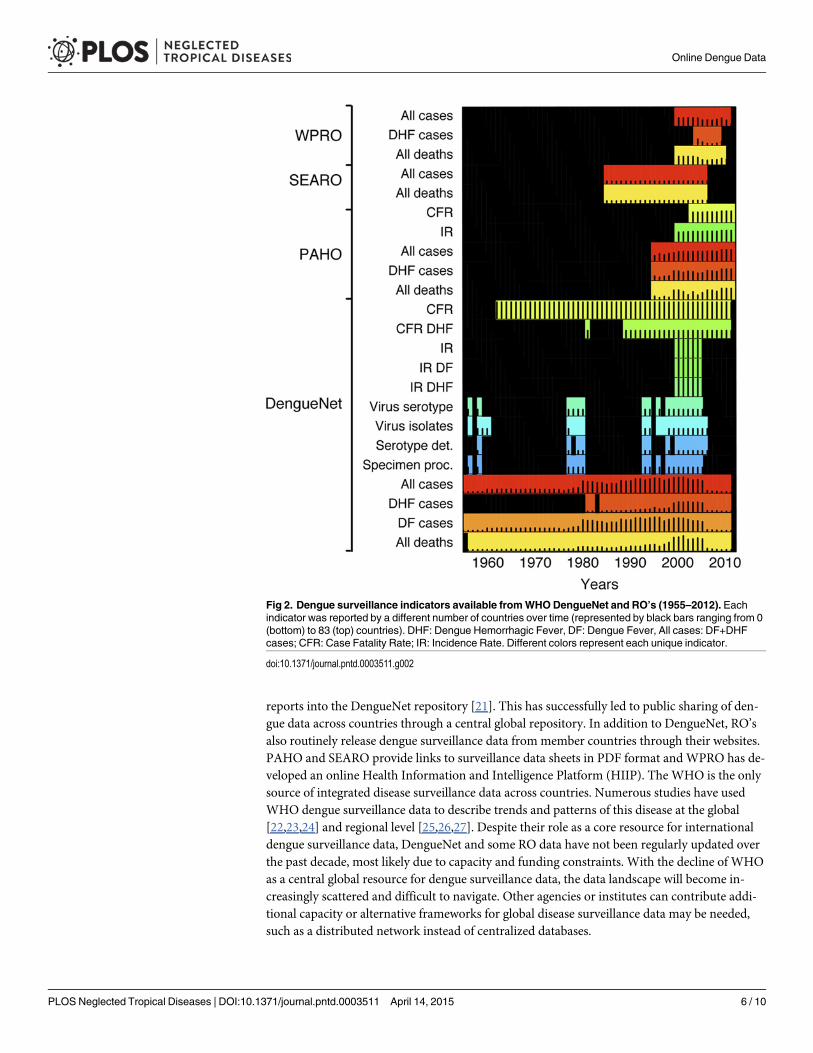
Each source provided counts for a range of different indicators (Fig 2). Data for “all” denguecases (dengue fever and dengue hemorrhagic fever combined) and “all” dengue deaths wereavailable from DengueNet and all RO’s. Data for DHF cases were predominantly from PAHO,few counts were fromWPRO and none from SEARO. Across time, DengueNet providedcounts for the longest time period (1955–2011) compared to SEARO (1985–2006), WPRO(2000–2011), and PAHO (1995–2012) (Fig 3 and S1 Fig). Across sources, data for “all” caseswere provided for the longest time periods, followed by mortality data. Data for DHF countswere available for the shortest time periods (Fig 3 and S1B Fig). In general, many counts weremissing across years and countries.
Consistency across data sourcesWe compared data from DengueNet and RO’s to assess consistency across sources (Table 2and S2 Fig). The overall percent agreement was 83.8% across all indicators. Data from SEAROwere the most consistent with a percent agreement of 92.2% and data fromWPRO were theleast consistent at 72.3%. Data for DHF cases were more consistent compared to the other indi-cators at 92.4% compared to 76.1% for “all” cases and 89.4% for “all” deaths. DengueNet valuesfor all indicators were generally lower compared to values from RO’s. In total, DengueNet
Online Dengue Data
PLOS Neglected Tropical Diseases | DOI:10.1371/journal.pntd.0003511 April 14, 2015 3 / 10

reported 426,808 fewer “all cases”, 17,854 fewer DHF cases, and 245 fewer deaths compared toRO’s (Table 2).
Internal consistency of DengueNet dataWe recomputed the number of “all” cases for DengueNet from separately reported denguefever (DF) and DHF cases. We also recomputed the case fatality rate (CFR) for DengueNetfrom reported cases and deaths. Our recomputed data for “all” cases corresponded with 98.9%of original values and for CFR with 99.5% (Table 3). We also recomputed the annual numberof dengue cases at country level from monthly cases at the provincial level (in DengueNet, datawere either reported at the country level by year or at the provincial level by month). Our re-computed annual country level data for “all” cases was> 3 million cases lower compared to re-ported data at that level. The recomputed values for “all” deaths were about 2000 deaths lowercompared to reported mortality at country level by year. This discrepancy was likely due tomissing data at the lower administrative levels. We found that provincial level data were notavailable for all calendar months in years before 1997 and after 2004 (S3 Fig). In addition, pro-vincial level data for countries were only available for a median of 3.5% of provinces before1996 and for 85.7% of provinces after 1996 (using The Second Administrative Level Boundariesdata set project (SALB) [19] for the expected number of provinces per country).
Fig 1. Number of counts per country available from onlineWHO sources: 1955–2012. A count was defined as a reported value for an indicator, e.g. thereported number of cases for one month and location would be one count. The number of counts available per country (indicated in different colors) wasdetermined by the spatiotemporal resolution of data, the number of indicators reported, and the length of the time period reported.
doi:10.1371/journal.pntd.0003511.g001
Online Dengue Data
PLOS Neglected Tropical Diseases | DOI:10.1371/journal.pntd.0003511 April 14, 2015 4 / 10

Data provided online by countriesWe also assessed dengue surveillance data provided online by the Ministries of Health of Braziland Indonesia (Fig 4). Both these countries are dengue endemic and have developed online da-tabases that provide publicly available dengue surveillance data. The annual number of “all”cases reported by the Brazil and Indonesia MOH corresponded to WHO data for most yearsexcept 2008 (Brazil) and 2000/2004 (Indonesia). NoWHO data were available for Indonesiaafter 2005. We found discrepancies within the data provided by the MOH of Indonesia foryears after 2007. Our recomputed number of cases per year at the country level from reportedprovincial data (1st administrative level) was higher than country level values recomputed fromdistrict data (2nd administrative level). This suggested that data from lower administrative lev-els were incomplete.
DiscussionWe integrated publicly available online dengue surveillance data from various WHO and coun-try sources to describe the availability and consistency of globally available dengue surveillancedata. We found that consistency of overlapping data between DengueNet and WHO RegionalOffices was lacking and that data at subnational levels were often incomplete. This incomplete-ness was difficult to recognize since the absence of data for provinces or districts was not indi-cated explicitly. DengueNet systematically reported lower values compared to the RO’s. Thismay be due to a difference in timing of data reports made by countries and a lack of updatingDengueNet as countries updated their figures.
DengueNet was created by the WHO Headquarters in 2002 as part of the Global HealthAtlas [9,20]. Focal points were appointed and trained in every country to upload standardized
Table 1. The cumulative number (in thousands) of “all” dengue cases, DHF cases and “all” deathsper WHORegion.
Entire period * (1955–2012) Last decade† (2000–2012)
All cases
WPRO 4,640 (20%) 1,983 (15%)
SEARO 3,216 (14%) 1,060 (8%)
PAHO 15,001 (66%) 9,974 (77%)
EMRO 0.45 (<0.1%) 0 (0%)
Total 22,858 (100%) 13,019 (100%)
DHF cases
WPRO 159 (31%) 159 (38%)
SEARO 1 (0.2%) 0 (0%)
PAHO 357 (69%) 266 (63%)
EMRO 0 (<0.1%) 0 (0%)
Total 518 (100%) 426 (100%)
All deaths
WPRO 36 (44%) 7 (37%)
SEARO 40 (49%) 8 (39%)
PAHO 6 (7%) 5 (24%)
EMRO 0 (0.5%) 0 (0%)
Total 83 (100%) 20 (100%)
* 1955–2012 for all cases, 1981–2012 for DHF cases, 1956–2012 for all deaths.† Last decade: 2000–2012.
doi:10.1371/journal.pntd.0003511.t001
Online Dengue Data
PLOS Neglected Tropical Diseases | DOI:10.1371/journal.pntd.0003511 April 14, 2015 5 / 10
reports into the DengueNet repository [21]. This has successfully led to public sharing of den-gue data across countries through a central global repository. In addition to DengueNet, RO’salso routinely release dengue surveillance data from member countries through their websites.PAHO and SEARO provide links to surveillance data sheets in PDF format andWPRO has de-veloped an online Health Information and Intelligence Platform (HIIP). The WHO is the onlysource of integrated disease surveillance data across countries. Numerous studies have usedWHO dengue surveillance data to describe trends and patterns of this disease at the global[22,23,24] and regional level [25,26,27]. Despite their role as a core resource for internationaldengue surveillance data, DengueNet and some RO data have not been regularly updated overthe past decade, most likely due to capacity and funding constraints. With the decline of WHOas a central global resource for dengue surveillance data, the data landscape will become in-creasingly scattered and difficult to navigate. Other agencies or institutes can contribute addi-tional capacity or alternative frameworks for global disease surveillance data may be needed,such as a distributed network instead of centralized databases.
Fig 2. Dengue surveillance indicators available fromWHODengueNet and RO’s (1955–2012). Eachindicator was reported by a different number of countries over time (represented by black bars ranging from 0(bottom) to 83 (top) countries). DHF: Dengue Hemorrhagic Fever, DF: Dengue Fever, All cases: DF+DHFcases; CFR: Case Fatality Rate; IR: Incidence Rate. Different colors represent each unique indicator.
doi:10.1371/journal.pntd.0003511.g002
Online Dengue Data
PLOS Neglected Tropical Diseases | DOI:10.1371/journal.pntd.0003511 April 14, 2015 6 / 10

Fig 3. Data availability fromWHODengueNet and Regional Offices per country: 1955–2012.Data availability is shown by coloring vs. black for “all”cases (dengue fever and dengue hemorrhagic fever, DHF), for “all” deaths, and for DHF cases. Data availability per country from DengueNet is indicated ingreen, fromWPRO in blue, from SEARO in yellow, and from PAHO in red. Data points that are available from both DengueNet and a regional office areshown in pink (for more detail see S5A–S5C Fig).
doi:10.1371/journal.pntd.0003511.g003
Table 2. Consistency between DengueNet andWHORegional Office data.
Indicator Source Percent agreement* Pairs† Difference‡
All cases PAHO 77.2 219 -398,311
SEARO 92.5 40 -12,210
WPRO 64.0 75 -16,287
Total 76.1 334 -426,808
All deaths PAHO 90.2 164 -67
SEARO 92.0 50 36
WPRO 84.0 50 -142
Total 89.4 264 -245
DHF cases PAHO 92.9 126 -7,854
WPRO 80.0 5 -10,000
Total 92.4 131 -17,854
All indicators PAHO 85.3 509 -406,232
SEARO 92.2 90 -12,246
WPRO 72.3 130 -26,429
Total 83.8 729 - 444,907
* Percent of pairs with identical values between DengueNet and Regional Office.† Number of matched pairs excluding missing values.‡ Sum of differences between pairs (DengueNet minus RO).
doi:10.1371/journal.pntd.0003511.t002
Online Dengue Data
PLOS Neglected Tropical Diseases | DOI:10.1371/journal.pntd.0003511 April 14, 2015 7 / 10

Increasingly, individual countries disseminate their own disease surveillance data online invarious formats ranging from epidemiological bulletins to sophisticated databases. This hasgreatly advanced the availability of disease data at the global level. In 2010 the 63rd WorldHealth Assembly stated that “the WHO urges member states to improve the collection of reli-able health information and data and to maximize, where appropriate, their free and unrestrict-ed availability in the public domain” [28]. Country data systems however use a large diversityof surveillance methodology and definitions that often lack detailed documentation. The po-tential biases and lack of comparability of data across countries are limiting the efficient use ofthese data. The reporting process of dengue surveillance data from countries to WHO alsolacks detailed documentation and may vary across countries. Future research should formally
Table 3. Consistency of data within DengueNet, measured by comparing recomputed with reported indicators.
Indicator Percent agreement * Pairs† Difference‡
All cases 98.9 446 -27,226
CFR (%) 99.5 789 -0.25
Annual cases at country level 13.3 75 -3,079,617
Annual DF cases at country level 10.9 46 -2,920,397
Annual DHF cases at country level 44.4 36 -3,888
Annual deaths at country level 45.5 55 -2,073
* Percent of pairs with identical values† Number of matched pairs excluding missing values.‡ Recomputed data minus reported data.
doi:10.1371/journal.pntd.0003511.t003
Fig 4. The total number of dengue cases reported for Brazil (A) and Indonesia (B) by different sources.The annual number of “all” cases reported for the entire country from DengueNet, the RO, and the Ministry ofHealth (MOH). Country level data reported by the MOHwas derived from provincial (admin1) and district(admin2) level data provided online.
doi:10.1371/journal.pntd.0003511.g004
Online Dengue Data
PLOS Neglected Tropical Diseases | DOI:10.1371/journal.pntd.0003511 April 14, 2015 8 / 10

compare country data systems and country vs. WHO data to gain more insight in potential bi-ases of the various sources. A standardized and curated global data system can maximize op-portunities for the efficient use of country disease data for science and policy.
Data standardization and curation are essential for a global data system. For example wefound that ~16% of country names in DengueNet were different from country names used bythe RO’s (S1 Table). Across all WHO sources, ~19% of country names were different from theUN ISO standard for country names [19]. In the absence of up-to-date global platforms for dis-ease surveillance data, alternative data systems have emerged such as Google Dengue and FluTrends and the HealthMap project that automatically integrate data from search queries or on-line news items respectively [29,30,31]. Innovative technological solutions and capacity usedby these projects should be applied to integrate country disease surveillance data as well to es-tablish a state-of-the-art 21st century global data system. This system can be coordinated byWHO but can be implemented by external institutes that have already created large scale publichealth data systems such as the Institute of Health Metrics and Evaluation, the Malaria AtlasProject, or Project Tycho.
A new and sustainable framework will be required to ensure that integrated and curated dis-ease surveillance data from countries around the world will continue to be available to stakehold-ers at all levels. Innovative technology should be used for data integration that minimizes theburden on countries but maximizes data availability and use. Academic and private sector part-ners should step up to support international agencies with this increasingly complex mandate.
Supporting InformationS1 Table. Country names used by DengueNet, RO’s and corresponding UN ISO names.(PDF)
S1 Fig. Data availability fromWHODengueNet and Regional Offices per country: 1955–2012. (A) Data for “all” cases (dengue fever and dengue hemorrhagic fever, DHF), (B) data for“all” deaths, and (C) data for DHF cases. Data availability from DengueNet is indicated ingreen, fromWPRO in blue, from SEARO in yellow, and from PAHO in red. Data points thatare available from both DengueNet and a regional office are shown in pink.(PDF)
S2 Fig. Consistency of data from DengueNet and WHO Regional Offices. Data were avail-able from both sources for years between 2000 and 2005 for (A) “all” cases, (B) “all deaths”,and (C) DHF cases.(PDF)
S3 Fig. Completeness of DengueNet data on “all” cases at provincial/monthly resolutionacross countries by year. Per year, the distribution across countries is shown of the number ofcalendar months (A) and the percent of all provinces (B) with data available for “all” cases.(PDF)
Author ContributionsConceived and designed the experiments: DSBWGVP. Performed the experiments: IR. Ana-lyzed the data: IR WGVP. Contributed reagents/materials/analysis tools: EMWGVP. Wrotethe paper: IR EM DSBWGVP.
Online Dengue Data
PLOS Neglected Tropical Diseases | DOI:10.1371/journal.pntd.0003511 April 14, 2015 9 / 10
References1. Heymann DL, Rodier GR. Hot spots in a wired world: WHO surveillance of emerging and re-emerging
infectious diseases. Lancet Infect Dis. 2001; 1: 345–353. PMID: 11871807
2. Walport M, Brest P. Sharing research data to improve public health. Lancet. 2011; 377: 537–539. doi:10.1016/S0140-6736(10)62234-9 PMID: 21216456
3. Bill & Melinda Gates Foundation. Global Health Data Acces Principles. 2011. http://www.gatesfoundation.org/global-health/Documents/data-access-principles.pdf.
4. McNabb SJ. Comprehensive effective and efficient global public health surveillance. BMC PublicHealth. 2010; 10 Suppl 1: S3. doi: 10.1186/1471-2458-10-S1-S3 PMID: 21143825
5. World Health Organization. International Health Regulations. 2005. Geneva: World HealthOrganization.
6. World Health Assembly. Global eradication of poliomyelitis by the year 2000. WHA41.28 1988. Gene-va: World Health Assembly.
7. WHO. Global Health Observatory. http://www.who.int/gho/en/.
8. WHO. Global TB Database. http://www.who.int/tb/country/data/download/en/index.html.
9. WHO. DengueNet. http://apps.who.int/globalatlas/default.asp.
10. WHO. RabNet. http://apps.who.int/globalatlas/.
11. WHO. FluNet. http://www.who.int/influenza/gisrs_laboratory/flunet/en/.
12. Ministry of Health of Brazil. http://portalsaude.saude.gov.br.
13. Ministry of Health of Indonesia. http://pppl.depkes.go.id.
14. WHO-PAHO. Dengue Regional Information Number of Cases. http://www.paho.org/hq/index.php?option = com_content&view = article&id=264&Itemid=363.
15. WHOSEARO. http://www.searo.who.int/EN/Section10/Section332_1101.htm
16. WHO-WPRO. Health Information and Intelligence Platform (HIIP). http://hiip.wpro.who.int/hiip/.
17. WHO-WPRO. Annual Dengue Data in the Western Pacific Region. http://www.wpro.who.int/emerging_diseases/annual.dengue.data.wpr/en/index.html.
18. ISO International Standards. http://www.iso.org/iso/home/standards.htm.
19. UNGeographic InformationWorking Group (UNGIWG). The Second Administrative Level Boundaries.http://www.unsalb.org.
20. WHOWeekly Epidemiological Record. DengueNet-WHO's Internet-based System for the Global Sur-veillance of Dengue Fever and Dengue Haemorrhagic Fever. 2002; 77: 300–304. http://www.who.int/docstore/wer/pdf/2002/wer7736.pdf. PMID: 12238319
21. WHO. DengueNet implementation in the Americas. Report of WHO/PAHO/CDCMeeting. San Juan,Puerto Rico, 9–11 July 2002. 2003. http://apps.who.int/iris/bitstream/10665/67924/1/WHO_CDS_CSR_GAR_2003.8.pdf.
22. Kroeger A, Nathan MB. Dengue: setting the global research agenda. Lancet. 2006; 368: 2193–2195.PMID: 17189016
23. WHO-TDR. Dengue Scientific Working Group. 2006. http://www.who.int/tdr/publications/tdr-research-publications/swg-report-dengue/en/index.html.
24. Farrar J, Focks D, Gubler D, Barrera R, Guzman MG, et al. Towards a global dengue research agenda.Trop Med Int Health. 2007; 12: 695–699. PMID: 17550466
25. Ooi E-E GD. Dengue in Southeast Asia: epidemiological characteristics and strategic challenges in dis-ease prevention. Ca Saude Publica, Rio de Janeiro. 2008; 25 Sup: S115–S124.
26. Tapia-Conyer R, Mendez-Galvan JF, Gallardo-Rincon H. The growing burden of dengue in Latin Amer-ica. J Clin Virol. 2009; 46 Suppl 2: S3–6. doi: 10.1016/S1386-6532(09)70286-0 PMID: 19800563
27. Gubler DJ. Dengue, Urbanization and Globalization: The Unholy Trinity of the 21(st) Century. Trop MedHealth. 2011; 39: 3–11. doi: 10.2149/tmh.2011-S05 PMID: 22500131
28. WHO. Sixty-Third World Health Assembly. 2010. http://apps.who.int/gb/ebwha/pdf_files/WHA63-REC1/WHA63_REC1-en.pdf.
29. GOOGLE. Google Dengue Trends. http://www.google.org/denguetrends/intl/en_us/.
30. Boston Children's Hospital. HealthMap. Global Health, Local Knowledge. http://www.healthmap.org/en/.
31. GOOGLE. Google Flu Trends. http://www.google.org/flutrends/intl/en_us/.
Online Dengue Data
PLOS Neglected Tropical Diseases | DOI:10.1371/journal.pntd.0003511 April 14, 2015 10 / 10