
The Association between ENSO and Winter Atmospheric Circulation and Temperature in the North...
13
3408 VOLUME 14 JOURNAL OF CLIMATE q 2001 American Meteorological Society The Association between ENSO and Winter Atmospheric Circulation and Temperature in the North Atlantic Region D. POZO-VA ´ ZQUEZ Departmento de Fı ´sica, Universidad de Jae ´n, Jaen, Spain M. J. ESTEBAN-PARRA Departmento de Fı ´sica Aplicada, Universidad de Granada, Granada, Spain F. S. RODRIGO Departmento de Fı ´sica Aplicada, Universidad de Almerı ´a, Almeria, Spain Y. CASTRO-Dı ´EZ Departmento de Fı ´sica Aplicada, Universidad de Granada, Granada, Spain (Manuscript received 12 April 2000, in final form 17 January 2001) ABSTRACT The association among ENSO, the Northern Hemisphere sea level pressure (SLP), and temperatures in Europe has been analyzed during the period 1873–1995. In the first part, the SST of the Nin ˜o-3 region has been used to select extreme cold and warm ENSO events and periods that can be regarded as normal. The study was carried out for winter with the constraints that the ENSO events were well developed during the winter of study, and that they are extreme events. Composites of winter SLP and temperatures have been made for the selected cold and warm events as well as for normal cases and compared with each other. In the North Atlantic area, no statistically significant SLP anomaly patterns were found associated with warm events, while during cold events a statistically significant anomaly pattern resembling the positive phase of the North Atlantic oscillation (NAO) was found. The temperature analysis shows statistically significant negative anomalies during cold events over the Iberian Peninsula and positive anomalies over the British Isles and southern Scandinavia, consistent with the SLP anomalies. The SLP and temperatures have also been analyzed for spring. The patterns resemble those found for winter but the anomalies have lower amplitudes. For the completion of the composite analysis, the consistency among events of the relationship between ENSO and SLP as well as between ENSO and temperatures was examined. The results show that the significant patterns found in the composite analysis in the North Atlantic area are not the result of a few major events, but rather because both the SLP and temperature anomalies in this area during cold ENSO events are stable and qualitatively similar to those found during the positive phase of the NAO. The possible physical basis for this association between NAO and ENSO is discussed. 1. Introduction The El Nin ˜o–Southern Oscillation (ENSO) phenom- enon is recognized as a major source for global climate variability. Numerous studies, especially during the last years, have dealt both with the underlying physics of the phenomenon and with the worldwide implications for climate (van Loon and Madden 1981; Kiladis and Diaz 1989; Ropelewski and Halpert 1989; Halpert and Ropelewski 1992; Trenberth et al. 1998). The associa- tion between ENSO and climate anomalies in the trop- Corresponding author address: David Pozo-Va ´zquez, Departmen- to de Fı ´sica Aplicada, Facultad de Ciencias, Universidad de Granada, Avd. Fuentenueva s/n, 18071 Granada, Spain. E-mail: [email protected] ical Pacific region is well documented. On the other hand, the impact of ENSO on the climate of the extra- tropical regions, as well as the mechanism responsible for anomalies in the tropical Pacific SST having world- wide impacts, are not so well documented. Particularly, the impact of ENSO on the climate of the North Atlantic region is still largely unknown. Few works have dealt with this problem; some of them show circulation changes in the North Atlantic associated with the ENSO (van Loon and Madden 1981; Fraedrich 1990, 1994; Fraedrich et al. 1992). The impact of ENSO on circulation in the North Atlantic region has been ex- amined by some authors through the study of the as- sociation between the North Atlantic oscillation (NAO) and the ENSO (Rogers 1984; Huang et al. 1998). Ev-
-
Upload
independent -
Category
Documents
-
view
1 -
download
0
Transcript of The Association between ENSO and Winter Atmospheric Circulation and Temperature in the North...

3408 VOLUME 14J O U R N A L O F C L I M A T E
q 2001 American Meteorological Society
The Association between ENSO and Winter Atmospheric Circulation and Temperaturein the North Atlantic Region
D. POZO-VAZQUEZ
Departmento de Fısica, Universidad de Jaen, Jaen, Spain
M. J. ESTEBAN-PARRA
Departmento de Fısica Aplicada, Universidad de Granada, Granada, Spain
F. S. RODRIGO
Departmento de Fısica Aplicada, Universidad de Almerıa, Almeria, Spain
Y. CASTRO-DıEZ
Departmento de Fısica Aplicada, Universidad de Granada, Granada, Spain
(Manuscript received 12 April 2000, in final form 17 January 2001)
ABSTRACT
The association among ENSO, the Northern Hemisphere sea level pressure (SLP), and temperatures in Europehas been analyzed during the period 1873–1995. In the first part, the SST of the Nino-3 region has been usedto select extreme cold and warm ENSO events and periods that can be regarded as normal. The study wascarried out for winter with the constraints that the ENSO events were well developed during the winter of study,and that they are extreme events. Composites of winter SLP and temperatures have been made for the selectedcold and warm events as well as for normal cases and compared with each other. In the North Atlantic area,no statistically significant SLP anomaly patterns were found associated with warm events, while during coldevents a statistically significant anomaly pattern resembling the positive phase of the North Atlantic oscillation(NAO) was found. The temperature analysis shows statistically significant negative anomalies during cold eventsover the Iberian Peninsula and positive anomalies over the British Isles and southern Scandinavia, consistentwith the SLP anomalies. The SLP and temperatures have also been analyzed for spring. The patterns resemblethose found for winter but the anomalies have lower amplitudes. For the completion of the composite analysis,the consistency among events of the relationship between ENSO and SLP as well as between ENSO andtemperatures was examined. The results show that the significant patterns found in the composite analysis inthe North Atlantic area are not the result of a few major events, but rather because both the SLP and temperatureanomalies in this area during cold ENSO events are stable and qualitatively similar to those found during thepositive phase of the NAO. The possible physical basis for this association between NAO and ENSO is discussed.
1. Introduction
The El Nino–Southern Oscillation (ENSO) phenom-enon is recognized as a major source for global climatevariability. Numerous studies, especially during the lastyears, have dealt both with the underlying physics ofthe phenomenon and with the worldwide implicationsfor climate (van Loon and Madden 1981; Kiladis andDiaz 1989; Ropelewski and Halpert 1989; Halpert andRopelewski 1992; Trenberth et al. 1998). The associa-tion between ENSO and climate anomalies in the trop-
Corresponding author address: David Pozo-Vazquez, Departmen-to de Fısica Aplicada, Facultad de Ciencias, Universidad de Granada,Avd. Fuentenueva s/n, 18071 Granada, Spain.E-mail: [email protected]
ical Pacific region is well documented. On the otherhand, the impact of ENSO on the climate of the extra-tropical regions, as well as the mechanism responsiblefor anomalies in the tropical Pacific SST having world-wide impacts, are not so well documented.
Particularly, the impact of ENSO on the climate ofthe North Atlantic region is still largely unknown. Fewworks have dealt with this problem; some of them showcirculation changes in the North Atlantic associated withthe ENSO (van Loon and Madden 1981; Fraedrich 1990,1994; Fraedrich et al. 1992). The impact of ENSO oncirculation in the North Atlantic region has been ex-amined by some authors through the study of the as-sociation between the North Atlantic oscillation (NAO)and the ENSO (Rogers 1984; Huang et al. 1998). Ev-

15 AUGUST 2001 3409P O Z O – V A Z Q U E Z E T A L .
idence of the impact of ENSO on temperatures and pre-cipitation in Europe has also been reported (Kiladis andDiaz 1989; Halpert and Ropelewski 1992; Fraedrich andMuller, 1992; Wilby 1993; Rodo et al. 1997).
Two recent studies, by Dong et al. (2000) and Grotz-ner et al. (2000), provide observational data and modelresults indicating an influence of the last two ENSOevents, El Nino 1997/98 and La Nina 1998, on the cli-mate of the North Atlantic region.
These studies on the implications of ENSO for theclimate of the North Atlantic shows varied results and,in some cases, even contradictory results. As com-mented by Trenberth (1997a), the research challengesin the understanding of ENSO teleconnections in higherlatitudes are many, and much work is needed. Partic-ularly, according to Trenberth (1997a) ‘‘continued ef-forts should be made to improve the existent observa-tional database and analyse the dataset of known qual-ity.’’ The aim of the present study is to increase currentknowledge concerning the association between Euro-pean climate and ENSO during the period 1873–1995.Our strategy is based on the study of the climate anom-alies associated with a set of cold and warm ENSOevents selected following an optimal procedure in termsof an eventual influence of ENSO in the European area.We analyze these climate anomalies, the consistencyamong events, and also their statistical significance.
The possible relationship between European climateand ENSO can have important implications for seasonalforecast of European climate and GCM validation. Par-ticularly, considerable effort has been made in the lastdecade to predict the ENSO state using a multitude ofmethodologies (physical models, statistical models, andmixtures of the two) with considerable success in pre-dicting ENSO indices with lead times 6–12 months (seeLatif et al. 1998 for a thorough review of the state ofthe art of ENSO predictability).
The present study is structured as follows. In section2, we discuss the criteria for the selection of the warmand cold ENSO events. We also describe in this sectionthe data used in the paper. In section 3, we make com-posites of winter and spring Northern Hemisphere sealevel pressure (SLP) and European temperatures for theselected ENSO events. We also investigate the consis-tency among events of the relationship among ENSO,SLP, and temperatures. In section 4, we conclude witha summary and discussion.
2. Methodology and data
The search for ENSO signals in the North Atlanticarea presents several difficulties. First, there are differ-ent types of El Nino and La Nina events, with differentcharacteristics that can lead to different responses of theextratropical atmospheric circulation. Second, climato-logical planetary atmospheric waves, natural noise, andthe complexity of the numerous feedbacks (and maybenonlinear relationships) can hide the signal of ENSO in
the extratropics (Trenberth 1997a). Many authors haveargued that only when tropical SST anomalies are largecan the ENSO signal be found in the extratropics (Tren-berth et al. 1998; Huang et al. 1998). On the other hand,tropical forcing is stronger during the northern winter,coinciding with the mature stage of El Nino events(Trenberth et al. 1998). Besides this, the greateststrength of the circulation in the North Atlantic area isfound during winter (Moses et al. 1987). Thus, it appearsthat the possible influence of ENSO in the North At-lantic regions is more likely to be found during extremeevents of ENSO and during the winter.
There is a lag of around 3 months between the be-ginning of an ENSO event and, eventually, the extra-tropical response in higher latitudes in the North Pacificarea (Trenberth and Hurrell 1994). This response oftenresembles the Pacific–North American (PNA) pattern.The perturbation can be propagated downstream, as awave train, to other longitudes in the form of Rossbywaves, eventually affecting locations far away from thePacific, particularly the North Atlantic region. Conse-quently, the eventual propagation of such events to otherlongitudes takes place with a similar lag. As we areinterested in the ENSO signal in the North Atlantic areaduring the northern winter, and bearing in mind the PNAhypothesis, we have to select those ENSO events that1) are considered extreme and 2) can influence the NorthAtlantic area during winter.
There is no general agreement on the definition ofthe ENSO or on which indicator (pressure indices orSST indices) should be used (Trenberth 1997b). In thiswork, we have used the Nino-3 SST region (58S–58N,908–1508W) to monitor the ENSO. SST data for theperiod 1871–1995, from the Met Office Global Sea-Iceand SST data (GISST2.3; Rayner et al. 1996), have beenused. These data are compiled on a monthly basis, anda monthly standardized index was computed using thereference period 1951–80. The selection of this refer-ence period avoids the use of the 1980s, with the strongwarm ENSO events during this decade that can bias thereference period. Finally, seasonal values are calculatedby averaging the corresponding monthly values: De-cember–February (DJF) for winter and September–No-vember (SON) for autumn.
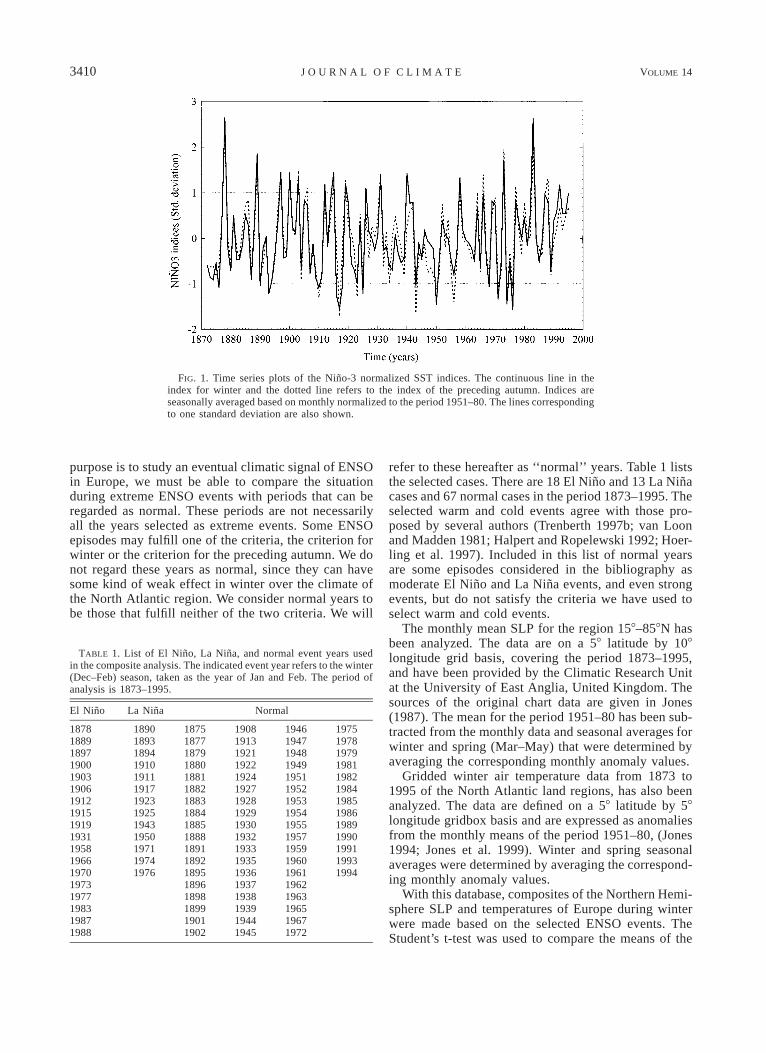
Extreme ENSO events have been selected based onthe analysis of these seasonal SST normalized series.For El Nino events, we selected those years in whichcurrent winter and the preceding autumn have an indexvalue roughly equal to or greater than one standard de-viation. For La Nina events, we used similar criteria forthose years in which the preceding autumn and the cur-rent winter have an index value roughly equal to or lessthan minus one standard deviation. The criteria for pre-ceding autumn ensures that during the winter, the ENSOevents will be well developed, having had time even-tually to affect the North Atlantic area. Figure 1 showsthe time series of the Nino-3 normalized SST indicesfor both winter and the preceding autumn. Since our
3410 VOLUME 14J O U R N A L O F C L I M A T E
FIG. 1. Time series plots of the Nino-3 normalized SST indices. The continuous line in theindex for winter and the dotted line refers to the index of the preceding autumn. Indices areseasonally averaged based on monthly normalized to the period 1951–80. The lines correspondingto one standard deviation are also shown.
TABLE 1. List of El Nino, La Nina, and normal event years usedin the composite analysis. The indicated event year refers to the winter(Dec–Feb) season, taken as the year of Jan and Feb. The period ofanalysis is 1873–1995.
El Nino La Nina Normal
187818891897190019031906191219151919193119581966197019731977198319871988
1890189318941910191119171923192519431950197119741976
187518771879188018811882188318841885188818911892189518961898189919011902
190819131921192219241927192819291930193219331935193619371938193919441945
194619471948194919511952195319541955195719591960196119621963196519671972
1975197819791981198219841985198619891990199119931994
purpose is to study an eventual climatic signal of ENSOin Europe, we must be able to compare the situationduring extreme ENSO events with periods that can beregarded as normal. These periods are not necessarilyall the years selected as extreme events. Some ENSOepisodes may fulfill one of the criteria, the criterion forwinter or the criterion for the preceding autumn. We donot regard these years as normal, since they can havesome kind of weak effect in winter over the climate ofthe North Atlantic region. We consider normal years tobe those that fulfill neither of the two criteria. We will
refer to these hereafter as ‘‘normal’’ years. Table 1 liststhe selected cases. There are 18 El Nino and 13 La Ninacases and 67 normal cases in the period 1873–1995. Theselected warm and cold events agree with those pro-posed by several authors (Trenberth 1997b; van Loonand Madden 1981; Halpert and Ropelewski 1992; Hoer-ling et al. 1997). Included in this list of normal yearsare some episodes considered in the bibliography asmoderate El Nino and La Nina events, and even strongevents, but do not satisfy the criteria we have used toselect warm and cold events.
The monthly mean SLP for the region 158–858N hasbeen analyzed. The data are on a 58 latitude by 108longitude grid basis, covering the period 1873–1995,and have been provided by the Climatic Research Unitat the University of East Anglia, United Kingdom. Thesources of the original chart data are given in Jones(1987). The mean for the period 1951–80 has been sub-tracted from the monthly data and seasonal averages forwinter and spring (Mar–May) that were determined byaveraging the corresponding monthly anomaly values.
Gridded winter air temperature data from 1873 to1995 of the North Atlantic land regions, has also beenanalyzed. The data are defined on a 58 latitude by 58longitude gridbox basis and are expressed as anomaliesfrom the monthly means of the period 1951–80, (Jones1994; Jones et al. 1999). Winter and spring seasonalaverages were determined by averaging the correspond-ing monthly anomaly values.
With this database, composites of the Northern Hemi-sphere SLP and temperatures of Europe during winterwere made based on the selected ENSO events. TheStudent’s t-test was used to compare the means of the

15 AUGUST 2001 3411P O Z O – V A Z Q U E Z E T A L .
composites in each grid. A signal was considered sig-nificant when it was significant at the 99% level for atwo-tailed test of the null hypothesis of no differenceof means. The test was applied both to compare thecomposites of SLP and temperature of the selected ElNino and La Nina events against normal years and tocompare El Nino against La Nina events. The test takesinto account eventual different lengths of the series com-pared. When a particular value was missing from a grid,the data were not included in the composite.
Finally, for completion of the composite analysis, wehave examined the consistency among events in the re-lationship between ENSO and SLP as well as betweenENSO and temperatures. The magnitude of anomaliescan vary greatly between events, and this could lead tocomposites dominated by a few major events. It is thusnecessary to ascertain the extent to which the signal ata given place is consistent among events. We have ad-dressed this problem following Kiladis and Diaz (1989),whose method consists of calculating the percentage ofconsistent signals, which is defined as the percentage ofevents having anomalies with the same sign as that ofthe composite anomaly.
We have also studied the SLP and temperatures duringthe spring following the winter of ENSO events. MostENSO events begin between March and September andend between February and March (Trenberth 1997b),with the peak of the anomalies during the northern win-ter. Given the lag of around 3 months between the settingof an ENSO event and an eventual propagation to theextratropics, it seems reasonable to expect certain ENSOsignals during the spring following a winter with anextreme ENSO event. We do not require the ENSO eventto still be taking place during the spring, so this studygives certain forecasting information concerning thespring following an ENSO event during winter.
The values of the NAO index were also analyzedbased upon the ENSO state. A seasonal index repre-sentative of the NAO was used to monitor the NAOduring the period 1873–1995. The index was formulatedusing pressure data from the Azores and Iceland (Joneset al. 1987, 1997). Normalization relative to the period1951–80 was used. The way in which the index wasformulated, the rationale in using this particular index,and their main characteristics are thoroughly discussedin Pozo-Vazquez et al. (2000a).
3. Analysis and discussion
a. Observed patterns during winter
1) SEA LEVEL PRESSURE
Composites of SLP anomalies during winter weremade based on the selected cases (Table 1). Figure 2ashows the composite of SLP anomalies for the selectedEl Nino events, Fig. 2b for normal cases, and Fig. 2dfor La Nina cases. A negative anomaly pattern is cen-tered south of the Aleutian Islands during El Nino cases
(Fig. 2a). This center reaches negative anomalies of 23mb. During La Nina (Fig. 2d), positive anomalies arefound southwest of the Aleutian Islands. Both patternsare statistically significant when they are compared withthe normal situation (Figs. 2c and 2e). These patternsare consistent with a deepening of the Aleutian lowpressure center during El Nino events and a weakeningduring La Nina. The amplitude of the anomalies is ofthe same order in both La Nina and El Nino events. Thesame behavior was found by Hoerling et al. (1997). Overthe southeastern part of the United States, weak (butstatistically significant) anomalies can be found whencomparing El Nino and normal years (Fig. 2c). No sta-tistically significant signature was found over the NorthAtlantic region.
During La Nina (Fig. 2d) a relatively strong anomalypressure pattern is also found over the North Atlanticarea. There is an anomalous high pressure band overthe central Atlantic (over Azores) and an anomalous lowpressure over the area south of Iceland. The comparisonof this pattern with those of normal years, shows thatboth areas are statistically significant (Fig. 2e). Partic-ularly, the significance area extends from the Azores tothe Florida peninsula. This SLP anomaly pattern closelyresembles the positive phase of the NAO, with an in-tensification of the Azores high and a deepening of theIcelandic low.
We considered the association between the NAO andthe ENSO phenomena through the analyses of the NAOindex during the ENSO events. Table 2 shows a com-posite of the values of the NAO index from the autumnof the onset of the ENSO events to the following spring.The composite was calculated over El Nino, La Nina,and normal years. For La Nina years, the mean valueof the NAO index in winter was 0.98, while for El Nino0.47, and for normal 0.22. The difference between thecomposite value for La Nina and normal years is sta-tistically significant at the 98.5% confidence level usinga t test (p value 0.015). During the spring, the value ofthe NAO index for La Nina is still slightly greater thanfor normal springs, 0.32 versus 20.05, and still statis-tically significant at the 90% confidence level (p value0.081). Thus, it can be concluded that for extreme LaNina events, higher than average climatological valuesof the NAO index can be expected during winter andthe following spring, with the subsequent consequencesfor the North Atlantic area climate.
Figure 2f shows the difference between El Nino andLa Nina. Statistically significant areas are, fundamen-tally, those found in Fig. 2e, but over a greater area.Slightly higher pressures can also be expected over cen-tral Europe during La Nina than during El Nino. Thisresult was also found by Fraedrich (1990).
2) TEMPERATURE
As in the case of SLP, composites of temperatureanomalies in Europe during winter were made based on

3412 VOLUME 14J O U R N A L O F C L I M A T E
FIG. 2. Composites of winter (DJF) observed SLP anomalies. See Table 1 for the years included inthe composites. (a) During El Nino, (b) during normal winters, and (c) difference, (a) minus (b). (d)Anomalies during La Nina and (e) difference, (d) minus (b). (f ) Difference between El Nino and LaNina, (a) minus (d). Contour interval is 1 mb. Continuous line indicates positive or zero anomalies anddotted line indicates negative anomalies. Shading indicates local statistical significance of the differenceat 99% confidence level, based on a t test.

15 AUGUST 2001 3413P O Z O – V A Z Q U E Z E T A L .
TABLE 2. Composite NAO index associated with El Nino, La Nina,and normal years. The index value is shown for the autumn of theENSO onset year and for the following winter and spring.
Autumn Winter Spring
El NinoLa NinaNormal
20.4420.1120.06
0.470.980.22
0.000.32
20.05
the selected ENSO events. Figure 3a shows the com-posite during El Nino events, Fig. 3b for normal years,and Fig. 3c shows the differences, Fig. 3a minus Fig.3b, between the two patterns. During El Nino years,maximum positive anomalies in winter, of the value0.258C, are found over central Europe and the south-ernmost part of the Iberian Peninsula. In winter of nor-mal years, negative anomalies of the value 20.258C arefound over the Iberian Peninsula and up to 20.58C overthe southern of the Italian peninsula (Fig. 3b). Statis-tically nonsignificant differences were found betweenEl Nino and normal winter (Fig. 3c).
Figure 3d shows the composite of temperature anom-alies for winter during La Nina events and Fig. 3e showsthe differences of Fig. 3d minus Fig. 3b. During LaNina winters, positive temperature anomalies of valuesbetween 0.58 and 18C are found over northern Germany,Poland, southern Scandinavia, and the British Isles. Onthe other hand, negative anomalies are found over south-west France, the southern part of the Italian peninsula,and the Iberian Peninsula. The Iberian peninsula showsminimum negative anomalies, reaching 218C. Verysimilar results were reported by Fraedrich and Muller(1992). Differences between La Nina and normal win-ters are statistically significant over the center and southof the Iberian Peninsula, registering values of up to20.58C (Fig. 3e). Over northern Britain and southernScandinavia, differences are also statistically significantbut positive, with values between 0.58 and 18C.
We also analyzed the differences between El Ninoand La Nina winters. Figure 3f shows the differencesbetween Fig. 3a and Fig. 3d. Differences are statisticallysignificant and positive (around 0.758C) over the centraland southwestern part of the Iberian Peninsula, and sta-tistically significant and negative over northern Britain(reaching values of 20.58C) as well as southern Scan-dinavia (reaching values of 218C).
The temperature anomalies found in Fig. 3 agree withthe changes in the circulation reflected in Fig. 2. Par-ticularly, during La Nina winters, a statistically signif-icant pattern of SLP anomalies, resembling the positivephase of the NAO, appears over the North Atlantic re-gion. The temperature anomalies found for La Ninaevents are consistent with the results that can be ex-pected for this state of the NAO (Hurrell 1995; Hurrelland van Loon 1997; Osborn et al. 1999; Pozo-Vazquezet al. 2001).
b. Observed patterns during spring
We have studied the SLP and temperatures during thespring following the winter of ENSO events. Since wedo not taken into account the state of ENSO in spring,this study gives certain forecasting information con-cerning the climate during the spring following an ex-treme winter ENSO event.
1) SEA LEVEL PRESSURE
The composite of SLP anomalies for El Nino (Fig.4a), normal cases (Fig. 4b), and the differences togetherwith a t test of significance (Fig. 4c) are shown. Figure4a shows that the deepening of the low pressure centerover the Aleutian Islands, characteristic of El Nino dur-ing winter, is still visible during the following spring,although weaker. The very center of the anomaly patternis statistically significant when compared with normalyears (Fig. 4c). Areas of statistical significance appearover the southeastern United States. No statistically sig-nificant signature is detected over the North Atlanticregion. During La Nina years (Fig. 4d) the anomalypattern south of the Aleutian Islands disappears, andstatistically nonsignificant differences are found be-tween the pressure in this area during La Nina and nor-mal cases (Fig. 4e). On the other hand, over the NorthAtlantic region an anomaly pattern is detected. As forwinter, the pattern resembles the positive phase of theNAO, but anomalies are lower than in that case anddisplaced northward (as might be expected by the mi-gration of the semipermanent pressure center duringspring and summer). Only the center of the high pressureanomalies, north of the Azores Islands, is statisticallysignificant when compared with normal years. The com-posite of the NAO index for spring during La Nina casesis 0.32 and 20.05 during normal cases, the differencebeing statistically significant [see section 3a(1)]. In Fig-ure 4f, showing the difference between El Nino and LaNina years, a notable band of statistical significanceappears over the central Atlantic and over the west coastof California.
2) TEMPERATURE
The composites of temperature anomalies during ElNino (Fig. 5a), during normal years (Fig. 5b), and thedifferences (Fig. 5c) were also computed. Statisticallynonsignificant areas are found when comparing patternsin Figs. 5a and 5b, as can be expected from the pressureanomaly pattern. In Fig. 5d, showing the anomalies dur-ing La Nina cases, the pattern resembles those foundfor winter, but the anomalies have lower values for mostof the area analyzed. Anomalies of up to 218C are foundover the Iberian Peninsula. The comparison of valuesin Figs. 5b and 5d shows that only the western IberianPeninsula and northern Algeria have values with statis-tically significant differences during La Nina and normal

3414 VOLUME 14J O U R N A L O F C L I M A T E
FIG. 3. As in Fig. 2 but for the observed temperatures in Europe. Contour interval is 0.258C. Continuous lineindicates positive or zero anomalies and dotted line indicates negative anomalies. Shading indicates local sta-tistical significance of the difference at 99% confidence level, based on a t test.
years (Fig. 5e). These temperature anomalies are diffi-cult to explain based only on the changes in the cir-culation reflected in Fig. 4. When comparing El Ninoand La Nina cases (Fig. 5f), only the very western edgeof the Iberian Peninsula shows different behavior (sta-tistically significant).
c. Stability of the patterns
1) CONSISTENCY OF THE SLP PATTERNS
We studied the consistency among events in the re-lationship between ENSO and SLP by calculating thepercentage of consistent signals. Figures 6a and 6b

15 AUGUST 2001 3415P O Z O – V A Z Q U E Z E T A L .
FIG. 4. As in Fig. 2 but for the spring following the winter of the ENSO event.

3416 VOLUME 14J O U R N A L O F C L I M A T E
FIG. 5. As in Fig. 3 but for the spring following the winter of the ENSO event.
show, respectively, the results for El Nino and La Ninaduring winter, while Figs. 6c and 6d show the resultsfor El Nino and La Nina during spring.
During winter, the ENSO signal over the AleutianIslands appears to be more stable during La Nina (with
90% coherence) than during El Nino (70%). Further-more, the area with high coherence is larger during LaNina than during El Nino. It is known that these anomalypatterns are not always present during ENSO events.Our analysis suggests that during extreme events, these

15 AUGUST 2001 3417P O Z O – V A Z Q U E Z E T A L .
FIG. 6. Study of the consistency among events of the relationship between the ENSO and SLP anomalies. (a) The percentage of eventshaving anomalies with a sign consistent with the composite anomaly for El Nino and during the winter. (b) As (a) but for La Nina. (c) and(d) As, respectively, (a) and (b) but for the spring following an extreme ENSO event during the winter. Dotted line indicates 70% andcontinuous line indicates 90%.
patterns are very likely to be found. Over the south ofthe peninsula of Baja California, coherence reaches 90%during La Nina. Strong coherence also appears over theNorth Atlantic area during La Nina, with 90% coherencein the central Atlantic and over Iceland (roughly overthe dipole centers of the NAO). No significant coherenceis evident over this area during El Nino. This indicatesthat the SLP anomaly patterns over the North Atlanticarea in Figs. 2d and 2e are not the result from a fewmajor events, but rather because the SLP anomaly inthis area during cold ENSO events is quite stable and
qualitatively similar to those found during the positivephase of the NAO.
During the spring following an extreme ENSO eventin winter the percentage of coherence is lower than dur-ing winter, but in some areas it still greater than 70%.Particularly, over the Aleutian Islands, the percentagereaches 70% both during warm and cold ENSO events.In the North Atlantic area, the percentage is 70% overthe central Atlantic and reaches 90% over Greenland.In the southern part of Florida 90% coherence can alsobe found.

3418 VOLUME 14J O U R N A L O F C L I M A T E
FIG. 7. Study of the consistency among events of the relationship between the ENSO and temperature anomalies. (a) The percentage ofevents having anomalies with a sign consistent with the composite anomaly for El Nino and during the winter. (b) As (a) but for La Nina.(c) and (d) As, respectively, (a) and (b) but for the spring following an extreme ENSO event during the winter. Contour interval is 20%,ranging from 60% to 100%.
2) CONSISTENCY OF THE TEMPERATURE PATTERNS
We have also studied the consistency among events inthe relationship between ENSO and temperatures. Figures7a and 7b show, respectively, the results for El Nino andLa Nina during winter, and Figs. 7c and 7d show the resultsfor El Nino and La Nina during spring. The greatest con-sistency appears for La Nina during winter (Fig. 7b). Val-ues between 80% and 100% are registered over the IberianPeninsula, the British Isles, southern Scandinavia, northernGermany, and Poland, the areas complements those foundin section 3a(2) using the t test and agrees with the resultsof the SLP analysis, showing that the temperature anom-alies in the former regions of Europe are not the resultsof statistical sampling or a few La Nina events, but ratherare associated with a cold ENSO event signature in theclimate of Europe. On the other hand, during El Ninoevents (Fig. 7a) no coherence is found. This means thatthe positive composite temperature anomalies detected
over central Europe during El Nino events (Fig. 3a) donot constitute a stable signal, but rather that this value isdue to sampling and/or to a few anomalies associated withsome particular El Nino events. As in the La Nina events,this result confirms the results of the t test in section 3a(2)and agrees with the results of the SLP analysis.
During spring and for El Nino events (Fig. 7c) nocoherence appears, as might be expected based on thet-test analysis of the temperatures (Fig. 5c). For La Ninaevents (Fig. 7d) and over the southwestern part of theIberian Peninsula, coherence around 80% is found, con-firming the results of the t test in Fig. 5e.
4. Concluding remarks
a. Summary
The association between the ENSO and SLP and tem-peratures in Europe has been analyzed during the period

15 AUGUST 2001 3419P O Z O – V A Z Q U E Z E T A L .
1873–1995. The study is carried out for winter and withthe constraint that the ENSO events were well developedduring the winter of study. Composites of winter North-ern Hemisphere SLP and European temperatures wereobtained for the selected cold and warm ENSO eventsand compared with the composites made for normalyears.
In the North Atlantic area during winter and for LaNina events, we found a statistically significant SLPanomaly pattern resembling the positive phase of theNAO. No statistically significant patterns associatedwith El Nino events are found.
For the temperatures in Europe, statistically nonsig-nificant differences are detected between El Nino andnormal winters. Differences between La Nina wintersand normal winters are statistically significant and neg-ative over the center and south of the Iberian Peninsula.Differences are also statistically significant but positiveover northern Britain and southern Scandinavia. Thetemperature anomalies are consistent with the changesin the circulation resulting from the SLP analysis (thepositive phase of the NAO).
The SLP and temperature anomalies were also ana-lyzed for the spring following an ENSO event duringwinter. The analysis of the SLP during La Nina yearsshows, over the North Atlantic region, an anomaly pat-tern resembling the positive phase of the NAO, similarto that found for winter, but the anomalies are lowerthan in that case and northwardly displaced. The anal-ysis of the European temperatures shows nonstatisticallysignificant anomalies during the El Nino event. Differ-ences between La Nina and normal events are statisti-cally significant and negative over the western IberianPeninsula.
The consistency analysis of the SLP and the temper-atures shows that the significant patterns found in thecomposite analysis in the North Atlantic area are notthe result of a few major events, but rather that boththe SLP and temperature anomalies in this area duringcold ENSO events are stable and qualitatively similarto those found during the positive phase of the NAO.
b. Discussion
The composite and consistency analysis suggests aninfluence of the cold ENSO events on the atmosphericcirculation of the North Atlantic region, particularly inthe state of the NAO. Our results confirm those foundby Dong et al. (2000) in the analysis of the influenceof the La Nina 1998/99 events in the circulation of theNorth Atlantic region. Our results also agree with thoseof Fraedrich (1990), who reported that the Europeanclimate was influenced more strongly by cold than bywarm ENSO events. The physical basis for this influ-ences of the ENSO on the state of the NAO, and, par-ticularly, for the more important influence of cold thanwarm ENSO events on the European climate, is difficultto assess.
Our analysis suggests that the PNA pattern may playan key role in the connection between the tropical forc-ing and the extratropical circulation response in theNorth Atlantic area, since the anomaly pattern in theAleutian Islands was present in all the cold events an-alyzed. This anomaly pattern disturbs the mean flowand can trigger a standing wave train that propagatesdownstream to the North Atlantic area and, particularly,can give rise to the stable SLP anomaly pattern resem-bling the positive phase of the NAO found associatedwith the cold phase of ENSO. However, this simpleRossby wave–propagation paradigm does not explainwhy no signal is found in the North Atlantic area duringthe warm ENSO phase. The analysis of the SLP anom-alies associated with individual El Nino events showsthat the response of the SLP in the North Atlantic areato warm events greatly varies between events. One ex-planation for such a different response could be thedifferent stability of the signal in the Aleutian Islands,which is more probable to be found during cold events(more than 90%) than during warm events (70% of thecases).
The tropical Atlantic SST could also act as a linkbetween the tropical Pacific SST anomalies and the cir-culation of the North Atlantic region. In a recent work,Latif and Grotzner (2000) found an influence of theENSO on the SST variability of the equatorial Atlantic,the equatorial Atlantic SST lagging by about 6 months.Saravan and Chang (2000) and Li (2000) have also de-scribed an influence of the ENSO on the tropical At-lantic. Additionally, several studies, both using GCMexperiments and observational records, suggested thatchanges in tropical Atlantic heating might affect North-ern Atlantic circulation. Particularly, Watanabe andKimoto (1999) found that tropical Atlantic SST anom-alies seem to enhance the NAO selectively among othercirculation patterns in the North Atlantic. Robertson etal. (2000) found an important influence of the tropicalAtlantic SST anomalies on the NAO and proposed amechanism to explain such influence. Also, Rajagopalanet al. (1998) found evidence for the influence of thetropical Atlantic SST on the NAO state.
It appears, therefore, that the response of the circu-lation in the North Atlantic region is some kind of mix-ture of tropical Atlantic forcing related to the tropicalPacific SST anomalies and the midlatitudes atmosphericforcing through the PNA teleconnection over NorthAmerica. The difficulty in separating the influence fromthe tropical Pacific from those of the tropical Atlantic(Watanabe and Kimoto 1999; Dong et al. 2000) makesit difficult to assess which mechanisms are the mostimportant in determining the state of the NAO.
Although our analysis suggests a stable influence ofthe cold phase of the ENSO on the NAO state, thejudgment of the possible significance of this influenceand its physical basis, founded just on the observationalrecord analyzed, is difficult and must wait further anal-yses with GCMs and other observational record.

3420 VOLUME 14J O U R N A L O F C L I M A T E
Acknowledgments. The Spanish CICYT ProjectCLI98-0930-C02-01 financed this study. We would liketo thank Dr. Phil Jones (Climatic Research Unit, Uni-versity of East Anglia, United Kingdom) for providingthe pressure and temperature data used. The UKMOGISST 2.2 data were kindly provided by the BritishAtmospheric Data Centre, Rutherford Appleton Labo-ratory, Chilton, Oxon, United Kingdom. The commentsof two anonymous reviewers helped substantially to im-prove the manuscript.
REFERENCES
Dong, B. W., R. T. Sutton, S. P. Jewson, A. O’Neill, J. M. Slingo,2000: Predictable winter climate in the North Atlantic sectorduring the 1997–1999 ENSO cycle. Geophys. Res. Lett., 27, 985–988.
Fraedrich, K., 1990: European Grosswetter during the warm and coldextremes of the El Nino/Southern Oscillation. Int. J. Climatol,10, 21–31.
——, 1994: An ENSO impact on Europe? Tellus, 46A, 541–552.——, and K. Muller, 1992: Climate anomalies in Europe associated
with ENSO extremes. Int. J. Climatol., 12, 25–31.——, ——, and R. Kuglin, 1992: Northern hemisphere circulation
regimes during the extremes of the El Nino/Southern Oscillation.Tellus, 44A, 33–40.
Grotzner, A., M. Lafif, and D. Dommenget, 2000: Atmospheric re-sponse to sea-surface temperature anomalies during El-Nino1997/98 as simulated by ECHAM4. Quart. J. Roy. Meteor. Soc.,126, 2175–2198.
Halpert, M. S., and C. F. Ropelewski, 1992: Surface temperaturepatterns associated with the Southern Oscillation. J. Climate, 5,577–593.
Hoerling, M. P., A. Kumar, and M. Zhong, 1997: El Nino, La Ninaand the nonlinearity of their teleconnections. J. Climate, 10,1769–1786.
Huang, J., K. Higuchi, and A. Shabbar, 1998: The relationship be-tween the North Atlantic Oscillation and El Nino–Southern Os-cillation. Geophys. Res. Lett., 25, 2707–2710.
Hurrell, J. W., 1995: Decadal trends in North Atlantic Oscillation andrelationship to regional temperature and precipitation. Science,269, 676–679.
——, and H. van Loon, 1997: Decadal variations in climate associatedwith the North Atlantic Oscillation. Climatic Change, 36, 301–326.
Jones, P. D., 1987: The early twentieth century Arctic high—Fact orfiction? Climate Dyn., 1, 63–75.
——, 1994: Hemispheric surface air temperature variations: A re-analysis and an update to 1993. J. Climate, 7, 1794–1802.
——, T. M. L. Wigley, and K. R. Briffa, 1987: Monthly mean pressurereconstruction for Europe (back to 1780) and North America (to1858). U.S. Dept. of Energy, Carbon Dioxide Research DivisionTech. Rep TR038, 99 pp.
——, T. Johnson, and D. Wheeler, 1997: Extension to the NorthAtlantic Oscillation index using early instrumental pressure ob-servations from Gibraltar and South-West Iceland. Int. J. Cli-matol., 17, 1–18.
——, M. New, D. E. Parker, S. Martin, and I. G. Rigor, 1999: Surfaceair temperature and its changes over the past 150 years. Rev.Geophys., 37, 173–199.
Kiladis, N., and H. F. Diaz, 1989: Global climatic anomalies asso-
ciated with extremes of the Southern Oscillation. J. Climate, 2,1069–1090.
Latif, M., and A. Grotzner, 2000: The equatorial Atlantic Oscillationand its response to ENSO. Climatic Dyn., 16, 213–218.
——, and Coauthors, 1998: A review of the predictability and pre-diction of ENSO. J. Geophys. Res., 103, 14 375–14 393.
Li, Z. X., 2000: Influence of tropical Pacific El Nino on SST of theSouthern Ocean through atmospheric bridge. Geophys. Res.Lett., 27, 3505–3508.
Moses, T., G. Kiladis, H. F. Dıaz, and R. Barry, 1987: Characteristicand frequency of reversal in mean sea level pressure in the NorthAtlantic sector and their relationship to long-term temperaturetrends. Int. J. Climatol., 7, 13–30.
Osborn, J., K. R. Briffa, S. F. B. Tett, P. D. Jones, and R. M. Trigo,1999: Evaluation of the North Atlantic Oscillation as simulatedby a coupled climate model. Climate Dyn., 15, 685–702.
Pozo-Vazquez, D., M. J. Esteban-Parra, F. S. Rodrigo, and Y. Castro-Dıez, 2000: An analysis of the variability of the North AtlanticOscillation in the time and the frequency domains. Int. J. Cli-matol., 20, 1675–1992.
——, 2001: A study on NAO variability and its possible non-linearinfluences on European surface temperatures. Climate Dyn., 17,701–715.
Rajagopalan, B., Y. Kushnir, and Y. Tourre, 1998: Observed decadalmidlatitude and tropical Atlantic climate variability. Geophys.Res. Lett., 25, 3967–3970.
Rayner, N. A., E. B. Horton, D. E. Parker, C. K. Folland, and R. B.Hackett, 1996: The Global sea-Ice and Sea Surface Temperaturedata set version 2.2, 1903-10994. CRTN 74. [Available fromHadley Centre, Met Office, Bracknell, Berkshire RG12 2SZ,United Kingdom.]
Robertson, A. W., C. R. Mechoso, and Y. J. Kim, 2000: The influenceof the Atlantic sea surface temperature anomalies on the NorthAtlantic oscillation. J. Climate, 13, 122–138.
Rodo, X., E. Baert, and F. Comın, 1997: Variations in the seasonalrainfall in Southern Europe during the present century: Rela-tionship with the North Atlantic Oscillation and the El Nino–Southern Oscillation. Climate Dyn., 13, 275–284.
Rogers, J. C., 1984: The association between the North Atlantic Os-cillation and the Southern Oscillation in the Northern Hemi-sphere. Mon. Wea. Rev., 112, 1999–2015.
Ropelewski, C. F., and M. S. Halpert, 1989: Precipitation patternsassociated with the high phase of the Southern Oscillation. J.Climate, 2, 268–284.
Saravanan, R., and P. Chang, 2000: Interaction between tropical At-lantic variability and El Nino–Southern Oscillation. J. Climate,13, 2195–2216.
Trenberth, K. E., 1997a: Short-term climate variations: Recent ac-complishments and issues for future progress. Bull. Amer. Me-teor. Soc., 78, 1081–1096.
——, 1997b: The definition of El Nino. Bull. Amer. Meteor. Soc, 78,2771–2777.
——, and J. W. Hurrell, 1994: Decadal atmosphere–ocean variationsin the Pacific. Climate Dyn., 9, 303–319.
——, G. W. Branstator, D. Karoly, A. Kumar, N. Lau, and C. Ro-pelewski, 1998: Progress during associated with tropical sea sur-face temperatures. J. Geophys. Res., 103, 14 291–14 324.
van Loon, H., and R. A. Madden, 1981: The Southern Oscillation.Part I: Global associations with pressure and temperature in thenorthern winter. Mon. Wea. Rev., 109, 1150–1162.
Watanabe, M., and M. Kimoto, 1999: Tropical-extratropical connec-tion in the Atlantic atomosphere–ocean variability. Geophys.Res. Lett., 26, 2247–2250.
Wilby, R. L., 1993: Evidence of ENSO in the synoptic climate of theBritish Isles since 1880. Weather, 48, 234–239.