The Assessment of Quality of Life (AQoL) II instrument. Overview of the Assessment of Quality of...
31
Centre for Health Economics Working Paper 144 The Assessment of Quality of Life (AQoL) II Instrument Overview of the Assessment of Quality of Life Mark 2 Project Professor Jeff Richardson Director, Health Economics Unit, Monash University Mr Neil Atherton Day Principal Research Fellow, Centre for Program Evaluation, The University of Melbourne Dr Stuart Peacock Senior Lecturer, Health Economics Unit, Monash University Mr Angelo Iezzi Research Fellow, Health Economics Unit, Monash University March, 2004 ISSN 1448 - 6822 ISBN 1 876662 65 4
-
Upload
independent -
Category
Documents
-
view
3 -
download
0
Transcript of The Assessment of Quality of Life (AQoL) II instrument. Overview of the Assessment of Quality of...

Centre for Health Economics
Working Paper 144
The Assessment of Quality of Life (AQoL) II Instrument
Overview of the Assessment of Quality of Life Mark 2 Project
Professor Jeff Richardson Director, Health Economics Unit, Monash University
Mr Neil Atherton Day
Principal Research Fellow, Centre for Program Evaluation, The University of Melbourne
Dr Stuart Peacock Senior Lecturer, Health Economics Unit, Monash University
Mr Angelo Iezzi Research Fellow, Health Economics Unit, Monash University
March, 2004 ISSN 1448 - 6822
ISBN 1 876662 65 4
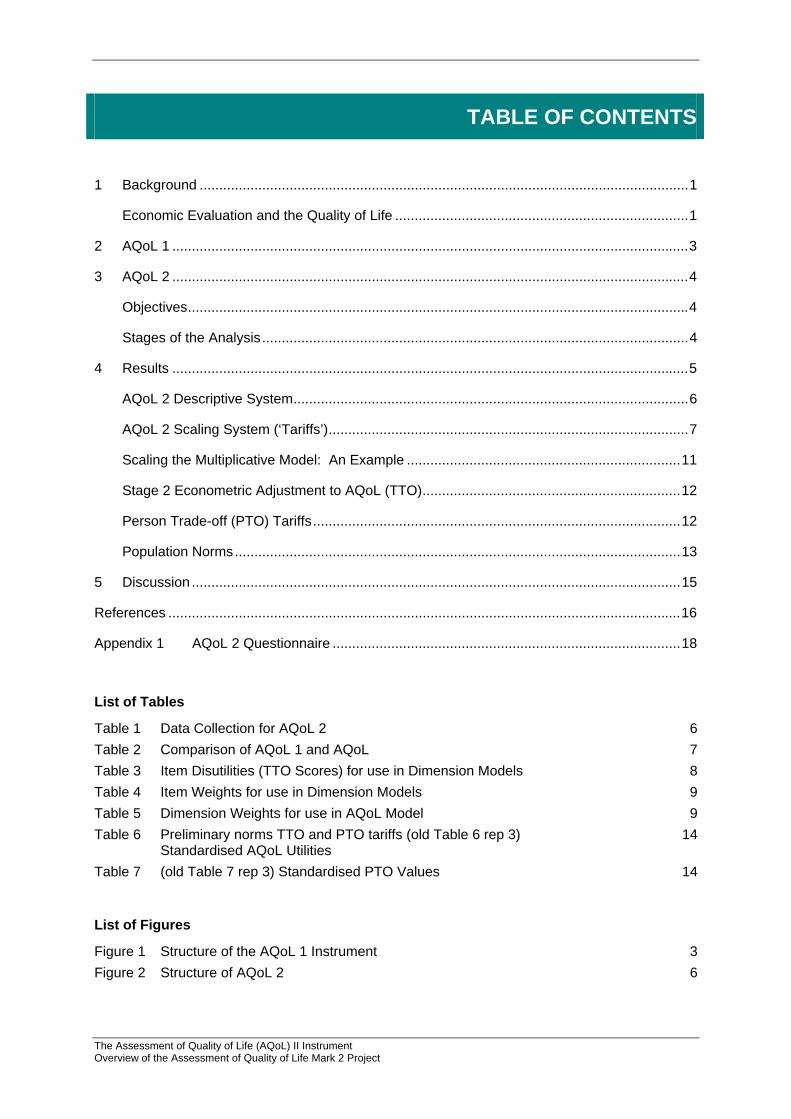
TABLE OF CONTENTS
1 Background .............................................................................................................................1
Economic Evaluation and the Quality of Life ...........................................................................1
2 AQoL 1 ....................................................................................................................................3
3 AQoL 2 ....................................................................................................................................4
Objectives................................................................................................................................4
Stages of the Analysis.............................................................................................................4
4 Results ....................................................................................................................................5
AQoL 2 Descriptive System.....................................................................................................6
AQoL 2 Scaling System (‘Tariffs’)............................................................................................7
Scaling the Multiplicative Model: An Example ......................................................................11
Stage 2 Econometric Adjustment to AQoL (TTO)..................................................................12
Person Trade-off (PTO) Tariffs..............................................................................................12
Population Norms..................................................................................................................13
5 Discussion .............................................................................................................................15
References ...................................................................................................................................16
Appendix 1 AQoL 2 Questionnaire .........................................................................................18
List of Tables
Table 1 Data Collection for AQoL 2 6 Table 2 Comparison of AQoL 1 and AQoL 7 Table 3 Item Disutilities (TTO Scores) for use in Dimension Models 8 Table 4 Item Weights for use in Dimension Models 9 Table 5 Dimension Weights for use in AQoL Model 9 Table 6 Preliminary norms TTO and PTO tariffs (old Table 6 rep 3) 14 Standardised AQoL Utilities Table 7 (old Table 7 rep 3) Standardised PTO Values 14
List of Figures
Figure 1 Structure of the AQoL 1 Instrument 3 Figure 2 Structure of AQoL 2 6
The Assessment of Quality of Life (AQoL) II Instrument Overview of the Assessment of Quality of Life Mark 2 Project

List of Boxes
Box 1 Multiplicative Disutility Equations 10 Box 2 Calculating a utility score: A numerical example 11
The Assessment of Quality of Life (AQoL) II Instrument Overview of the Assessment of Quality of Life Mark 2 Project
The Assessment of Quality of Life (AQoL) II Instrument Overview of the Assessment of Quality of Life Mark 2 Project
PREFACE Economic evaluation of health and health care related activities must quantify the importance of the quality of life of the outcome. This is done through the use of the Quality Adjusted Life Year (QALY) as a unit of outcome. As QALYs are defined as the product of life years and an index of the quality of life, this latter quantity requires measurement. This task is carried out by measuring the strength of preference for a health state relative to full health and death.
A number of utility instruments exist but the utility scores produced by them differ very significantly (Hawthorne et al 2001). The AQoL project was a response to the implied challenge. It was undertaken in an attempt to improve the methodology of MAU instrument construction and, hopefully, to produce utility scores which had greater reliability and validity.
Innovations include the following:
(i) The descriptive system
• use of the correct psychometric procedures for instrument construction; • a description based upon ‘handicap’—problems in a social context—as distinct
from a ‘within the skin’ descriptive system; • a multi level descriptive system which permits redundancy—double counting—
within dimensions in order to achieve instrument sensitivity, but structural independence between the dimensions;
• an increase in the sensitivity of the descriptive system in the region of full health and specifically a system which permits the evaluation of health promotional activities.
(ii) Tariffs (Scaling/Calibration)
• The creation of at least two scaling systems based upon the time trade-off (as with AQoL 1) and the person trade-off (PTO) scaling methodologies. The appropriate choice of scaling instrument has not been determined in the literature;
• A reworking of the utility scores employing techniques to eliminate one possible source of bias in previous methodologies (including AQoL 1), viz a ‘focusing effect’;
• The testing and use of ‘deliberative weights’ which permit and encourage the contemplation of the health states over a significant period of time;
• The use of a more flexible two stage modelling methodology to combine disaggregated dimension scores into an overall utility score for a multi attribute health state.
Results from the AQoL 2 project are published in four reports. These are:
(i) Conceptualising the Assessment of Quality of Life Instrument Mark 2 (AQoL 2), Methodological Innovations and the Development of the AQoL Descriptive System;
(ii) The Assessment of Quality of Life (AQoL) II Instrument: Derivation of the scaling weights using a multiplicative model and econometric second stage correction;
(iii) The Assessment of Quality of Life (AQoL) II Instrument: The effect of deliberation and alternative utility weights in a multi attribute utility instrument;
(iv) Overview of the Assessment of Quality of Life Mark 2 Project.
The Assessment of Quality of Life (AQoL) II Instrument Overview of the Assessment of Quality of Life Mark 2 Project 1
The Assessment of Quality of Life (AQoL) II Instrument
Overview of the Assessment of Quality of Life (AQoL) Project
1 Background Economic evaluation of health and health care related activities must quantity the importance of the quality of life of the outcome. This is done through the use of the Quality Adjusted Life Year (QALY) as a unit of outcome. As QALYs are defined as the product of life years and an index of the quality of life, this latter quantity requires measurement. This task is carried out by measuring the strength of preference for a health state relative to full health and death. The strength of preference in this context is referred to as the ‘utility’ of the health state. The fundamental ethical assumption in economic evaluation is that, all else equal, we should maximise utility defined as the strength of preferences.
Economic Evaluation and the Quality of Life
The quantification of 'utility' in cost utility analysis (CUA) requires two broad tasks. First, the health state under investigation must be described; secondly, a scaling technique such as the time trade-off (TTO) or standard gamble (SG) must be used to attach a numerical value to the health state such that this value measures the strength of a person's preference (utility value) for the health state.
Two broad approaches to this two stage procedure have normally been used1, namely holistic (or 'composite') and multi-attribute utility (MAU) measurement (Torrance 1986). With the first of these, a scenario or vignette is constructed which describes the health state (Step 1). The entire scenario is then 'scaled' (Step 2), ie a survey is conducted specifically to elicit 'utility' values for the scenario.
With the second approach a generic 'descriptive system' or ‘descriptive instrument’ is created which is capable of describing a wide range of health states and utility weights are attached to every possible state. This is normally achieved by measuring a limited number of health states and using these to calibrate a model which is then used to infer the utility values of every other health state in the 'descriptive system'.2 The model may either be derived by econometric analysis of the observed utilities (as with the EuroQoL (Williams 1995)) or through the use of decision analytic techniques to fit the simple additive model (as used in the Quality of Wellbeing Instrument (QWB) (Kaplan et al 1996) and 15D (Sintonen and Pekurinen 1993)) or a multiplicative model (the Health Utilities Index (HUI1 and 2) (Feeny, Torrance et al 1996). The fully scaled MAU instrument may then be used to estimate the utility of health states.
1 In principle, these two steps can be collapsed by asking patients directly the value of the health state that they are
currently experiencing. In practice this approach has seldom been used. 2 In principle every health state may be individually measured. In practice, the number of health states in the
'descriptive system' is normally so large that this is infeasible. The only example of this approach is the original Rosser Kind Index which is now seldom used because of its limited sensitivity.
The Assessment of Quality of Life (AQoL) II Instrument Overview of the Assessment of Quality of Life Mark 2 Project 2
Both approaches have strengths and weaknesses. Holistic measurement permits a description which is tailored to a particular health state. Unique aspects of the health state, its content, its consequences, the process of health delivery, risk and prognosis may all be included in the vignette. Validation of health state specific vignettes, however, is seldom, if ever, carried out. By contrast, the generic descriptive system of the MAU approach may be unable to capture many of the nuances of the health state and be incapable of capturing the importance of the process or context of the health state or intervention. However, this approach should, in principle, be based upon a descriptive system, the reliability and validity of which can be investigated using standard procedures.3 After construction, the use of an MAU instrument is cheap and easy and allows the rapid estimation of utilities in the context of a longitudinal trial. This means that it is feasible to construct a time profile of each of the dimensions of health included in the instrument. Because of these respective strengths and weaknesses both techniques have a role in CUA.
To date, only a handful of generic instruments have attempted to measure utility; viz, the UK Rosser-Kind Index (Rosser 1993), the US QWB (Kaplan, Ganiats et al 1996), the Canadian HUI instruments (Feeny, Torrance et al 1996), the Finnish 15D (Sintonen and Pekurinen 1993) and the European EuroQoL (Kind 1996). While each of these instruments has particular strengths, to our knowledge none were constructed using normal psychometric principles to ensure construct validity and structural independence. Consider, for example, this second issue. MAU theory postulates there should be no 'redundancy' amongst items in a descriptive system. That is, a single attribute should not be described in more than one way (von Winterfeldt and Edwards 1986). If redundancy occurs then the (dis)utility of the attribute will be double counted. A sufficient (but not necessary) condition for non-redundancy is that the different scales within the instrument are orthogonal.4 However, the requirement of non redundancy appears to be in conflict with the need for 'sensitivity' and several instruments have reduced redundancy by the adoption of very simple descriptive systems; but this simplicity has been achieved at the expense of sensitivity. Other problems also exist. Some instruments have unsatisfactory models for inferring utility values; others have adopted scaling techniques which probably do not measure utility (Richardson 1994). Consequently there is a challenge to develop a generic instrument which overcomes these weaknesses.
3 Essentially, HRQoL is a psychometric concept, as are utilities. They cannot be directly measured, but are uniquely
individual. Although instruments can be developed from other measurement – traditions such as clinometrics, economics or decision-making – this property of HRQoL suggests that the application of psychometrics is particularly appropriate during instrument construction.
4 It is not strictly necessary as scales may be 'environmentally correlated', which does not necessarily indicate double counting. Von Winterfeldt & Edwards illustrate this in the case of a manufacturing plant, the management of which is concerned with the cost of production and distribution (von Winterfeldt and Edwards 1986). These costs will correlate because each correlates with the scale of production. Despite this, there is no redundancy and each attribute is independently important. Even with this example, however, careful construction of the instrument can eliminate the correlation. There is no necessary reason why scale of production, unit production costs and unit distribution costs will correlate (if there are no economies of scale).

2 AQoL 1 The AQoL project was designed to assist with meeting this challenge. Specifically the project sought to create an instrument where the descriptive system is:
• derived using correct psychometric procedures for instrument construction and hence achieves construct validity;
• sensitive to as much of the full universe of HRQoL as is practical;
• based upon structurally independent dimensions of health; • based upon a description of ‘handicap’—problems in a social context—as distinct from a
‘within the skin’ descriptive system; • hierarchical, ie the descriptive system permits redundancy—double counting—within
dimensions in order to achieve instrument sensitivity but structural independence between the dimensions.
The achievement of these properties is described elsewhere (Hawthorne, Richardson et al 1997). The procedures adopted in this part of the project resulted in an instrument which is unique in two respects: viz,
(i) use of an hierarchical descriptive structure in which structural independence is achieved between dimensions but not within dimensions; and
(ii) a descriptive system which can claim to have construct validity, which increases confidence in the validity of the health state descriptions.
The structure of AQoL 1 is described in Figure 1. By January 2003 the instrument was being used in approximately 65 studies, translated into Danish and translation into Chinese had commenced.
Figure 1 Structure of the AQoL 1 Instrument
Socialrelationships
Independent living
Illness
Physical senses
Psychologicalwell-being
prescribed medicinesmedication and aidsmedical treatment
self - care household tasks
mobility
relationships with otherssocial isolation
family role
seeinghearing
communication
sleepanxiety & depressed
pain
Health Related
Quality ofLife
The Assessment of Quality of Life (AQoL) II Instrument Overview of the Assessment of Quality of Life Mark 2 Project 3
The Assessment of Quality of Life (AQoL) II Instrument Overview of the Assessment of Quality of Life Mark 2 Project 4
A major five instrument validation study was carried out some of the results being described in Hawthorne et al (2001). The result of this was that the first dimension, illness, was deleted from the scoring algorithm (nevertheless it is still recommended that this descriptively useful dimension be included in studies).
The major conclusion from this five instrument study was that the very low correlation between instruments raises serious doubts about their validity. AQoL 1 performed as well as other instruments in terms of its predictive power and showed greater upper level sensitivity, ie in the range of full health. However, along with the Health Utilities Index, the magnitude of disutilities appeared very high. This is not a problem for ranking the quality of life of different health states. It does, however, cast doubt upon the validity of quality-quantity comparisons.
3 AQoL 2 Objectives
The objectives of AQoL 2 are discussed in two earlier reports (Richardson et al 2003a, 2003b). The additional objectives sought in the AQoL 2 project were:
(i) An increase in the sensitivity of the descriptive system in the region of full health and a description which permitted the evaluation of health promotional activities;
(ii) The creation of at least two scaling systems based upon the time trade-off (as with AQoL 1) and the person trade-off (PTO) scaling methodologies. The appropriate choice of scaling instrument has not been determined in the literature;
(iii) A reworking of the utility scores employing techniques to eliminate one possible source of bias in previous methodologies (including AQoL 1), viz a ‘focusing effect’;
(iv) The testing and use of ‘deliberative weights’ which permit and encourage the contemplation of the health states over a significant time period;
(v) The use of a more flexible two stage modelling methodology to combine disaggregated dimension scores into an overall utility score for a multi attribute health state.
Stages of the Analysis
In broad terms AQoL 1 and AQoL 2 have a very similar methodology. This involved the following steps:
(i) Selection of a ‘theory’ relating to the appropriate form of the construct ‘health’. The theory determines the contents of the ‘descriptive system’.
(ii) Creation of an item bank, ie a large number of alternative items which describe the construct;
(iii) The creation of a descriptive system using items from the item bank and an analytical process to determine the best items for the description of the health construct;
(iv) Comparison of the theoretical construct with the empirical results and the synthesis of these to determine the final structure of the descriptive system;
(v) The construction of a ‘scaling system’; viz, a formula to attach a utility score to every health state described in the descriptive system.

The Assessment of Quality of Life (AQoL) II Instrument Overview of the Assessment of Quality of Life Mark 2 Project 5
Both AQoL 1 and AQoL 2 sought to create a descriptive system based upon handicap; that is, a description of health states in terms of their effect upon individuals in a social context and the impact upon individuals functioning in a social context.
With both instruments a databank was constructed from the existing literature and from a series of focus groups with providers and patients in order to determine health dimensions or elements of dimensions not included in AQoL 1. In particular, AQoL 2 sought to describe health states in a way that would be relevant for the evaluation of health promotional interventions.
The final selection of items for inclusion in the AQoL instrument was based upon a two part analysis. In the first, items were subject to logical and linguistic analysis to determine the appropriateness of content and grammar. A reduced number of items were then included in a survey in which respondents completed every item. These were then subject to exploratory then confirmatory factor analysis for AQoL 1 and multi level modelling procedures in AQoL 2. These techniques grouped items according to the pattern of responses and evaluated the ‘explanatory power’ of different groupings with respect to the empirically obtained patterns of responses. Both instruments obtained good results. AQoL 2 achieved a CFI score of 0.99; that is, 99 percent of correlation between items can be explained by the hypothesised structure of the model. This is an exceptional result.
One of the challenges in the construction of an MAU instrument is the trade-off between instrument sensitivity and redundancy. Health states are nuanced in an exceedingly large number of ways. Capturing each ‘element’ of a health state can result in ‘double counting’—redundancy—ie, in the inclusion of an element or elements in several places in the description. A system which limits redundancy by limitations on the items is likely to be insensitive. AQoL 1 and AQoL 2 sought to overcome this problem by adopting, for the first time, a hierarchical descriptive system in which redundancy was permitted within dimension but the dimension disutility was independently assessed and dimension utilities limited to this level.
AQoL 2 also included three innovations in the construction of its scaling (scoring) system. First, a two part scaling procedure was adopted. In the first part a multiplicative model was fitted to the item scores. In the second part these scores were used to statistically ‘explain’ multi attribute utility scores for a range of health states. This second part was designed to correct error resulting from the simplicity of the multiplicative model.
Secondly, AQoL 2 obtained data to construct a descriptive system based upon the time trade-off (TTO) and the person trade-off (PTO). Data on ‘self-TTO’ were also collected for future analysis. These data are the number of years a person would sacrifice of their own life and in their present health state to obtain the AQoL best health state for the remainder of their truncated life.
Finally, the project was designed to permit respondent deliberation about health states. Interviews were carried out in two stages and respondents in the first were asked to complete a number of tasks designed to evoke deliberation about reducing their length of life in exchange for a better quality of life.
4 Results Two postal surveys and two sets of interviews (with the same respondent) were conducted. The first postal survey was for the completion of items in the item bank. The two sets of interviews were carried out to obtain time trade-off, person trade-off and self TTO data.
The second postal survey was used in preference to additional time trade-off interviews because of the cost of individual interviews and the burden already placed upon interview respondents.

The strategy required the subsequent transformation of rating scale into time trade-off scores. This is discussed later.
The number of respondents and response rates are shown in Table 1.
Table 1 Data collection for AQoL 2
Purpose respondents n
response rate %
Postal survey 1: completion of items in item bank
316 44
Interview 1 TTO = dimension worsts, multi attribute health states
411 47
Interview 2 Multi attribute health states (cont) Person trade-off, self TTO
411 47
Postal Survey 2 Rating Scale: Item responses, item worst scores
163 40
AQoL 2 Descriptive System
The AQoL descriptive system is reproduced as Appendix 1 and its structure is depicted in Figure 2 (below).
Figure 2 Structure of AQoL 2
AQOL1.00
SOCIAL
INDLIV
MHEALTH
COPING
PAIN
SENSPER
Q1 0.75
Q2 0.27
Q3 0.22
Q4 0.20
Q5 0.16
Q6 0.33
Q7 0.31
Q8 0.36
Q9 0.31
Q12 0.45
Q15 0.13
Q16 0.28
Q17 0.33
Q10 0.50
Q14 0.56
Q11 0.67
Q13 0.56
Q18 0.67
Q19 0.55
Q20 0.66
0.500.850.88
0.900.920.820.83
0.800.83
0.74
0.930.850.82
0.70
0.66
0.58
0.66
0.580.670.59
0.96
0.86
0.83
0.96
0.73
0.51
Chi - Square = 460.73, df = 164, P - value = 0.00000, RMSEA = 0.054, CFI = 0.99
The instrument consists of 6 dimensions and 20 items. Each of these had between 4 and 6 response levels. Table 2 compares this structure with the structure of AQoL 1.
AQoL 2 subsumes AQoL 1 both in terms of the range of health states covered by each item and by the elements of health embodied in the instrument. In particular AQoL 2 gives additional items relating to coping and pain. It does not include items relating to illness as did the initial AQoL instrument but which was subsequently removed during the validation process.
The Assessment of Quality of Life (AQoL) II Instrument Overview of the Assessment of Quality of Life Mark 2 Project 6

The descriptive system defines 6.58 x 10¹³ or about 12.960 health states for every human being on the planet (With a 2.5 population growth rate the AQoL will provide one unique health state per person in 383.5 years!) The overwhelming majority of these are irrelevant as they consist of combinations of health states which cannot exist. Nevertheless the number indicates that the instrument achieves an unprecedented level of detail with respect to the dimensions of health which it encompasses.
Data for the construction of the descriptive system and for its scaling (calibration) were collected in two postal surveys and two face-to-face interviews.
Construction of the descriptive system is described in Richardson et al 2003b. The final AQoL questionnaire is reproduced in Appendix 1 and its structure is shown in Figure 2. Table 2 describes the relationship between AQoL 1 and AQoL 2.
Table 2 Comparison of AQoL 1 and AQoL 2
AQoL 1* AQoL 2 Dimension
Items Combinations Items Combinations 1 Independent living 3 (444) 64 4 (5665) 900 2 Social relationships 3 (444) 64 3 (544) 80 3 Physical senses 3 (444) 64 3 (664) 144 4 Psychological
wellbeing 3 (444) 60 4 (5555) 625
5 Pain - 3 (445) 80 6 Coping - 3 (555) 125
* Following a number of validating studies the illness dimension was removed from the final scoring algorithm
AQoL 2 Scaling System (‘Tariffs’)
The first stage of the scaling of AQoL 2 consisted of the use of a multiplicative model. This is similar to equation 1 below.
U(AQoL) = U1 * U2 * U3 * U4 * U5 * U6 … (1)
The actual model is somewhat more flexible. It is calculated using disutilities rather than utilities and these are adjusted for the relative importance of each of the dimensions (1)-(6). This results in equation 2 in which wi are the dimension (or item) weights and k is the overall scaling constant. This is obtained by solving equation 3. It is similar to the requirement in an additive model that the dimension weights sum to unity.
( )[ ⎥⎦
⎤⎢⎣
⎡−+= ∏
=
1111
ijii
n
i
xDUkwk
DU ]
U *
… (2)
… (3) 1)1(1
−+Π== i
n
ikwk
The relationship between utility and disutility is given in equation 4.
U … (4) D* = −1
This multiplicative model was applied at two levels; first, to combine items into dimensions and, secondly, to combine dimensions into the overall AQoL score.
The Assessment of Quality of Life (AQoL) II Instrument Overview of the Assessment of Quality of Life Mark 2 Project 7

The Assessment of Quality of Life (AQoL) II Instrument Overview of the Assessment of Quality of Life Mark 2 Project 8
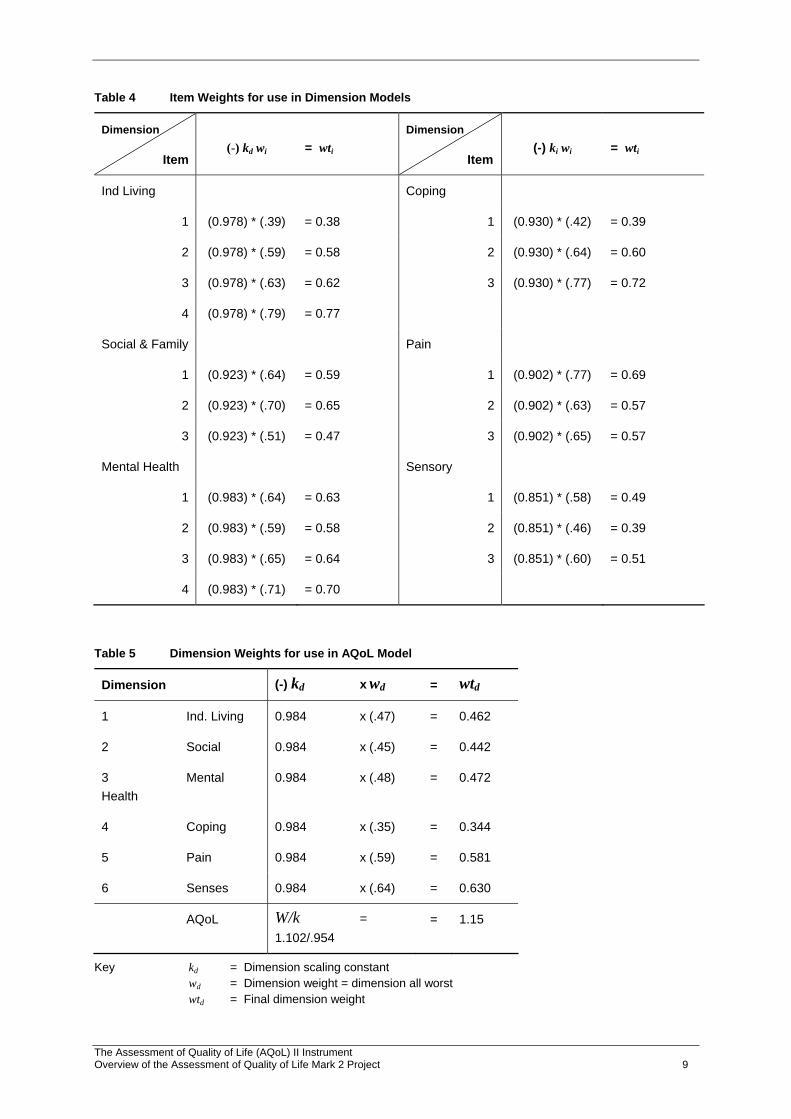
The chief results from these procedures for the dimension models and the overall AQoL model are shown in Tables 3 to 5. Table 3 reports item response utilities on a (1-0) scale where the endpoints of the scale are the item best (DU = 0.00) and worst (DU = 1.00) response levels. In Table 4 the individual item importance weights, wi, are calculated as the item worst score on a scale from dimension best to dimension worst health state. These are multiplied by the dimension scaling factor (kd) which is derived from the item weights and from equation 3 above. The overall or net item weight is used to construct the dimension formulae shown in Box 1.
Similar results are shown for the overall AQoL in Table 4. In this wd represents the dimension importance weights measured on an AQoL best to death scale. The AQoL scaling constant, k, is derived form these six weights. The product of the weights and the scaling constant give the effective weights Wd. It is used to derive the overall AQoL formula in Box 1.
Table 3 Item Disutilities (TTO Scores) for use in Dimension Models
Dimension 1
Dimension 2
Dimension 3
Dimension 4
Dimension 5
Dimension 6
Response Level
Mean Mean Mean Mean Mean Mean
Item 1 Item 5 Item 8 Item 12 Item 15 Item 181 0.00 0.00 0.00 0.00 0.00 0.00 2 0.07 0.07 0.13 0.06 0.13 0.03 3 0.44 0.46 0.39 0.34 0.64 0.22 4 0.82 0.84 0.84 0.72 1.00 0.62 5 1.00 1.00 1.00 1.00 0.84 6 1.00 Item 2 Item 6 Item 9 Item 13 Item 16 Item 19
1 0.00 0.00 0.00 0.00 0.00 0.00 2 0.03 0.19 0.14 0.06 0.20 0.02 3 0.224 0.76 0.39 0.38 0.76 0.20 4 0.47 1.00 0.82 0.77 1.00 0.59 5 0.83 1.00 1.00 0.82 6 1.00 1.00 Item 3 Item 7 Item 10 Item 14 Item 17 Item 20
1 0.00 0.00 0.00 0.00 0.00 0.00 2 0.04 0.20 0.10 0.06 0.07 0.19 3 0.25 0.65 0.33 0.42 0.33 0.69 4 0.57 1.00 0.78 0.83 1.00 1.00 5 0.83 1.00 1.00 6 1.00 Item 4 Item 11
1 0.00 0.00 2 0.04 0.06 3 0.30 0.37 4 0.80 0.84 5 1.00 1.00
Notes: Item best and worst disutilities are set equal to 0.00 and 1.00 respectively. Item best and worst responses are set as endpoints for rating scale evaluations.
The Assessment of Quality of Life (AQoL) II Instrument Overview of the Assessment of Quality of Life Mark 2 Project 9
Table 4 Item Weights for use in Dimension Models
Dimension
Item
(-) kd wi
= wti
Dimension
Item
(-) ki wi
= wti
Ind Living Coping
1 (0.978) * (.39) = 0.38 1 (0.930) * (.42) = 0.39
2 (0.978) * (.59) = 0.58 2 (0.930) * (.64) = 0.60
3 (0.978) * (.63) = 0.62 3 (0.930) * (.77) = 0.72
4 (0.978) * (.79) = 0.77
Social & Family Pain
1 (0.923) * (.64) = 0.59 1 (0.902) * (.77) = 0.69
2 (0.923) * (.70) = 0.65 2 (0.902) * (.63) = 0.57
3 (0.923) * (.51) = 0.47 3 (0.902) * (.65) = 0.57
Mental Health Sensory
1 (0.983) * (.64) = 0.63 1 (0.851) * (.58) = 0.49
2 (0.983) * (.59) = 0.58 2 (0.851) * (.46) = 0.39
3 (0.983) * (.65) = 0.64 3 (0.851) * (.60) = 0.51
4 (0.983) * (.71) = 0.70
Table 5 Dimension Weights for use in AQoL Model
Dimension (-) kd x wd = wtd
1 Ind. Living 0.984 x (.47) = 0.462
2 Social 0.984 x (.45) = 0.442
3 Mental Health
0.984 x (.48) = 0.472
4 Coping 0.984 x (.35) = 0.344
5 Pain 0.984 x (.59) = 0.581
6 Senses 0.984 x (.64) = 0.630
AQoL W/k = 1.102/.954
= 1.15
Key kd = Dimension scaling constant wd = Dimension weight = dimension all worst wtd = Final dimension weight

Box 1 Multiplicative Disutility Equations
Dimensions
General Formula ( )[ ] 0 ; 1111
>−−= ∏ = diin
id kDUkwk
DU
Independent Living ( )( )( )( )[ ]43211 77.0162.0158.0.138.01102.1 dudududuDU −−−−−=
Social and Family ( )( )( )[ ]7652 47.0165.0.159.01108.1 dududuDU −−−−=
Mental Health ( )( )( )( )[ ]1110983 70.0164.0166.0.163.01102.1 dudududuDU −−−−−=
Coping ( )( )( )[ ]1413214 72.0160.0.139.01108.1 dududuDU −−−−=
Pain ( )( )( )[ ]1716155 57.0157.0169.01108.1 dududuDU −−−−=
Senses ( )( )( )[ ]2019186 51.0139.0149.01118.1 dududuDU −−−−=
AQoL General Formula ( )( )[ ] 0 ; 11 >−∏−= kDUxkwk
WDU iddAQoL
( )( )( )( )( )( )[ ]654321 630.01581.01344.01472.01442.01462.011150.1 DUDUDUDUDUDUDU AQoL −−−−−−−=
Key: W = the conversion factor between the 0-1 (death, full health) model
Each of the 6 dimension and the AQoL disutilities may be transformed into utility scores using the equation
Ui = 1 - DU
where Ui and DUi are utility are disutility respectively.
The Assessment of Quality of Life (AQoL) II Instrument Overview of the Assessment of Quality of Life Mark 2 Project 10

Scaling the Multiplicative Model: An Example
Assigning a utility score to a health state involves the following steps.
(i) Complete the AQoL questionnaire and determine the 20 response levels which define the health state.
(ii) Read the 20 item disutility scores, dui, which correspond with the response levels from Table 3. These ‘disutilities’ are measured on a (1-0) scale with the item best and worst defining the endpoints.
(iii) Enter the item disutility scores, dui, into the corresponding equation in Box 1. Calculate the six dimension disutility scores DUd. These disutilities are measured on a (0-1) scale where the endpoints are the dimension best and dimension ‘all worst’ (all items at their worst level).
(iv) Enter the six dimension DUd scores into the final AQoL equation in Box 1. The score obtained is the predicted disutility for the health state.
(v) Convert disutilities into utilities using the equation U = 1 - DU.
These steps are illustrated for a randomly chosen health state in Box 2. Box 2 Calculating a utility score: A numerical example
1 Complete the AQoL questionnaire to obtain 20 response levels; 1 per item
Example: Response levels are: D 1(1,1,2,1); D 2(2,2,1); D 3 (3,2,3,1); D 4(1,1,1); D 5(2,1,1); D 6(2,1,2)
2 Read the 20 disutility scores from Table 3
In the example: ( ) ( ) ( ) ( ) ( ) ( 19,.00,03.60,.0,.13.5:0,0,0400,.33,.14,.39.3:65,.19,.07.2:04.0,01 DDDDDD )
3 Enter the 20 disutility scores into the equations in Box 1
( )( )( )( )[ ]077.104.62.1058.10381102.11 ∗−∗−∗−∗−−=DU = 0.03
[ ( )( )( )0.47.119.65.107.59.1108.12 ∗−∗−∗−−=DU = 0.17
[ ( )( )( )( )07.133.64.114.66.139.63.1102.13 ∗−∗−∗−∗−−=DU = 0.40
[ ( )( )( )0.72.1060.1039.1108.14 ∗−∗−∗−−=DU = 0.00
[ ( )( )( )0.57.1057.113.69.1108.15 ∗−∗−∗−−=DU = 0.10
[ ( )( )( )19.51.1039.103.04.1.118.16 ∗−∗−∗−−=DU = 0.12
4 Enter the DUi scores into the AQoL formula Box 1
[ ( )( )( )4.472.117.442.103.462.1115.1 ∗−∗−∗−−=AQolDU
( )( )( ) 42.]12.*63.11.*581.10.0*344.1 =−−−
5 Convert disutility to utilities from the equation U = 1 - DUi
Dimension Utilities = 0.97; 0.83; 0.6; 1.00; 0.9; 0.88 Global U = 0.58;
The Assessment of Quality of Life (AQoL) II Instrument Overview of the Assessment of Quality of Life Mark 2 Project 11

The Assessment of Quality of Life (AQoL) II Instrument Overview of the Assessment of Quality of Life Mark 2 Project 12
Stage 2 Econometric Adjustment to AQoL (TTO)
The purpose of the econometric adjustment to the scaling formulae was to correct error induced by the simplicity of the multiplicative model. In principle, this second step is straight forward. The predicted disutility from the multiplicative model is used to econometrically ‘explain’ the TTO score directly elicited from respondents. If the multiplicative model was a perfect fit then the estimated equation would take the form TTO (MA) = 1.00 (AQoL) or AQoL1.00 where TTO(MA) is the observed TTO for the multi attribute health state and ‘AQoL’ is the predicted score from the multiplicative model. Unexplained variation could be random or non random and the econometric adjustment is seeking to explain the latter. In principle a very large number of adjustment variables could be used, including the respondent’s age, sex, social status and world view. In the present project we have sought non random elements from the disutility data itself; that is, non random variation which could be modelled directly but which is not detected by the simple multiplicative model.
Econometric modelling to date has used a power function transformation (ie a function of the form: Y = Nx). This function passes through two pivotal points, viz, (0.0, 0.00) and (1.00,1.00).
The best fitting power function—the function explaining the greatest variation in TTO scores—is given in the following equation.
AQoL = TTO3.05
where x = 0.67Slope 1 + 1.61 Slope 2 + 3.77 Slope 3
-0.77 Dim2 - 0.81 Dim 2
-1.39 Dim4 - 0.35 Dim 5
R2 = 0.76
(no. of observations = 1042)
Further econometric testing is underway and, consequently, the stage 2 correction has not yet been used to generate population norms.
Person Trade-off (PTO) Tariffs
Two other sets of data were collected during the two interviews. These were person trade-off scores for selected health states and ‘self TTO’, viz, the amount of life in the respondent’s present health state that they would sacrifice to achieve the AQoL all best health state. These latter data are not analysed.
The person trade-off technique is of importance for two reasons. First, and in principle the more important reason, is that it incorporates a different perspective. Respondents are asked to act as a social decision maker and to pass judgement upon the (life saving) treatments of alternative groups of patients. The most common variant of the technique is to ask respondents the number of people that would need to be returned from imminent death to full health to be of equivalent in value to saving the lives of 100 people who were returned to the health state being evaluated. Respondents are not personally involved and the results of the technique are commonly interpreted as indicating social value as distinct from (personal) utility as obtained from the TTO technique.
The Assessment of Quality of Life (AQoL) II Instrument Overview of the Assessment of Quality of Life Mark 2 Project 13
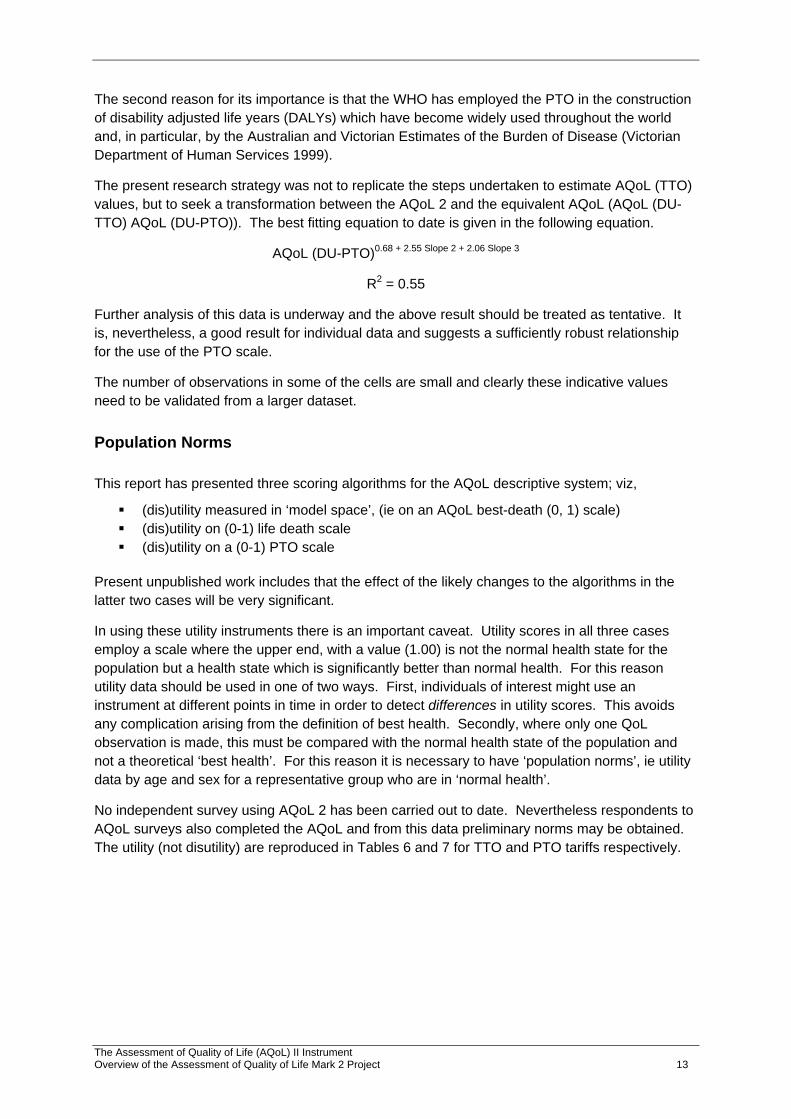
The second reason for its importance is that the WHO has employed the PTO in the construction of disability adjusted life years (DALYs) which have become widely used throughout the world and, in particular, by the Australian and Victorian Estimates of the Burden of Disease (Victorian Department of Human Services 1999).
The present research strategy was not to replicate the steps undertaken to estimate AQoL (TTO) values, but to seek a transformation between the AQoL 2 and the equivalent AQoL (AQoL (DU-TTO) AQoL (DU-PTO)). The best fitting equation to date is given in the following equation.
AQoL (DU-PTO)0.68 + 2.55 Slope 2 + 2.06 Slope 3
R2 = 0.55
Further analysis of this data is underway and the above result should be treated as tentative. It is, nevertheless, a good result for individual data and suggests a sufficiently robust relationship for the use of the PTO scale.
The number of observations in some of the cells are small and clearly these indicative values need to be validated from a larger dataset.
Population Norms
This report has presented three scoring algorithms for the AQoL descriptive system; viz,
(dis)utility measured in ‘model space’, (ie on an AQoL best-death (0, 1) scale) (dis)utility on (0-1) life death scale (dis)utility on a (0-1) PTO scale
Present unpublished work includes that the effect of the likely changes to the algorithms in the latter two cases will be very significant.
In using these utility instruments there is an important caveat. Utility scores in all three cases employ a scale where the upper end, with a value (1.00) is not the normal health state for the population but a health state which is significantly better than normal health. For this reason utility data should be used in one of two ways. First, individuals of interest might use an instrument at different points in time in order to detect differences in utility scores. This avoids any complication arising from the definition of best health. Secondly, where only one QoL observation is made, this must be compared with the normal health state of the population and not a theoretical ‘best health’. For this reason it is necessary to have ‘population norms’, ie utility data by age and sex for a representative group who are in ‘normal health’.
No independent survey using AQoL 2 has been carried out to date. Nevertheless respondents to AQoL surveys also completed the AQoL and from this data preliminary norms may be obtained. The utility (not disutility) are reproduced in Tables 6 and 7 for TTO and PTO tariffs respectively.

The Assessment of Quality of Life (AQoL) II Instrument Overview of the Assessment of Quality of Life Mark 2 Project 14
Table 6 Preliminary norms TTO and PTO tariffs (old Table 6 rep 3) Standardised AQoL Utilities
Age Male Female Total
<25 1.00 1.00 1.00
25-34 0.83 0.83 0.82
35-44 0.92 0.92 0.82
45-54 0.75 0.75 0.72
55-64 0.62 0.62 0.64
65-74 0.71 0.71 0.69
>75 0.70 0.70 0.64
Table 7 Standardised PTO Values
Age Male Female Total
<25 1.00 1.00 1.00
25-34 0.77 0.78 0.79
35-44 0.89 0.75 0.79
45-54 0.81 0.67 0.68
55-64 0.52 0.62 0.60
65-74 0.64 0.61 0.65
>75 0.58 0.55 0.59
The Assessment of Quality of Life (AQoL) II Instrument Overview of the Assessment of Quality of Life Mark 2 Project 15
5 Discussion There are numerous unresolved issues associated with the construction of MAU instruments and, more fundamentally, with the measurement and the valuation of outcomes from health related intervention or health programs. As decisions concerning patient treatment and the net benefit of different services for a health scheme cannot wait until these issues are resolved, it is legitimate and important for decisions to be based upon current best practice, both medical and evaluative. This rationale extends to the construction of instruments for measuring quality of life.
Despite this, it remains important to recognise the limitations with current state of the art instrument construction and to progressively correct and improve measurement. It is likewise important to recognise the possibility of different patterns of preferences between different population groups or different social contexts. Where significant differences are observed in the pattern of preferences, instruments must be adapted.
It is also necessary to recognise the possibility that the fundamental assumption behind MAU instrument construction may be wrong or overridden on occasions. The assumption is that values and preferences are sufficiently similar over a range of social and medical settings for a single index of the strength of preferences to be a useful adjunct to other elements in an evaluation study. This may not always be true. For example it is very unlikely that the values obtained from the cross section of Melbourne residents for this project would reflect the values of the Koorie population. It is clearly desirable to validate the instrument for use in as many contexts and with as many different population sub-groups as possible.
The initial use of MAU instruments such as the AQoL was to calculate Quality Adjusted Life Years (QALYs) as a unit of outcome in an economic evaluation. It is now recognised that the QALY may be an overly simplistic construct (although, of course, an improvement upon the unweighted life year as a metric to measure social benefits). Various extensions have been suggested to take account of other elements of social value associated with a patient’s age, illness severity per se, the distribution of benefits, certainly effects, etc. It has been suggested to Nord (1999) that the title ‘Cost Value Analysis’ (CVA) be used when such elements of social value are considered to be relevant in an analysis.
The Assessment of Quality of Life (AQoL) II Instrument Overview of the Assessment of Quality of Life Mark 2 Project 16
References Department of Human Services 1999, The Victorian Burden of Disease Study: Mortality,
Epidemiology Section, Health Intelligence and Disease Control, Public Health and Development Division, Victorian Government Department of Human Services.
Feeny D, Torrance G et al 1996, ‘Health utilities index’, Quality of Life and Pharmacoeconomics in Clinical Trials, B Spilker, Lippincott-Raven Publishers, Philadelphia.
Hawthorne G, Richardson J et al 1997, The Assessment of Quality of Life (AQoL) Instrument: Construction, Initial Validation and Utility Scaling’, Working Paper 76 Centre for Health Program Evaluation, Monash University.
Hawthorne G, Richardson J and Day NA 2001, ‘A comparison of the assessment of quality of life (AQoL) with four other generic utility instruments’, Annals of Medicine, vol 33, no 5, pp 358-370.
Kaplan R, Ganiats T et al 1996, ‘The quality of wellbeing scale’, Medical Outcome Trust Bulletin, 4:2-3.
Kind P 1996, ‘The EuroQoL instrument: an index of health related quality of life’, Quality of Life and Pharmacoeconomics in Clinical Trials, B Spilker, Lippincott-Raven Publishers, Philadelphia.
Nord E 1999, Cost Value Analysis, Cambridge University Press, Cambridge.
Richardson J 1994, ‘Cost utility analysis: what should be measured’, Social Science and Medicine, 39:(1)7-21.
Richardson et al 2003a, The Assessment of Quality of Life (AQoL) II Instrument: Conceptualising the Assessment of Quality of Life Instrument Mark 2 (AQoL 2) Methodological Innovations and the Development of the AQoL Descriptive System, Report to Population Health Division of Commonwealth Department of Health and Ageing, Centre for Health Program Evaluation, Monash University.
Richardson et al 2003b, The Assessment of Quality of Life (AQoL) II Instrument: Derivation of the Scaling Weights Using a Multiplicative Model and Econometric Second Stage Correction, Report to Population Health Division of Commonwealth Department of Health and Ageing, Centre for Health Program Evaluation, Monash University.
Richardson et al 2003c, The Assessment of Quality of Life (AQoL) II Instrument: The effective deliberation and alternative utility weights in a multi attribute utility instrument, Report to Population Health Division of Commonwealth Department of Health and Ageing, Centre for Health Program Evaluation, Monash University.
Rosser R 1993, ‘A health index and output measure’, Quality of Life Assessment: Key Issues in the 1990s, S Walker and R Rosser (eds), Kluwer Academic Publishers, Dordrecht.
Sintonen H and Pekurinen M 1993, ‘A fifteen dimensional measure of health related quality of life (15D) and its applications’, Quality of Life Assessment, S Walker and R Rosser (eds), Kluwer Academic Publishers, Dordrecht.

The Assessment of Quality of Life (AQoL) II Instrument Overview of the Assessment of Quality of Life Mark 2 Project 17
Torrance G 1986 ‘Measurement of health state utilities for economic appraisal: a review’, Journal of Health Economics, 5:1-30.
von Winterfeldt DV and Edwards W 1986, Decision Analysis and Behavioural Research, Cambridge University Press, Cambridge.
Williams A 1995, ‘The measurement and valuation of health: final report on the modelling of valuation tariffs’, MVH Group, Centre for Health Economics, University of York, York.
Appendix 1 AQoL 2 Questionnaire
Assessment of Quality of Life (AQoL) Mark 2.
How to answer
Please read the Explanatory Statement and sign a consent form before you begin.
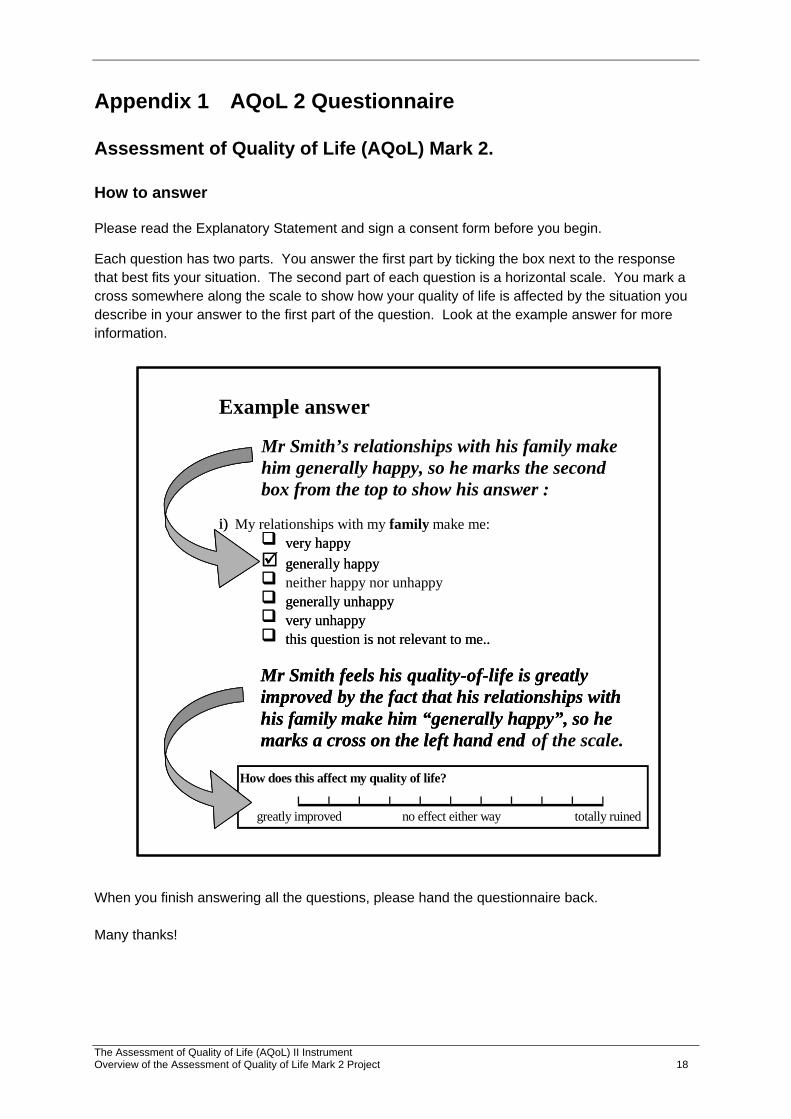
Each question has two parts. You answer the first part by ticking the box next to the response that best fits your situation. The second part of each question is a horizontal scale. You mark a cross somewhere along the scale to show how your quality of life is affected by the situation you describe in your answer to the first part of the question. Look at the example answer for more information.
How does this affect my quality of life?
totally ruinedgreatly improved no effect either way
Example answer Mr Smith’s relationships with his family make him generally happy, so he marks the second box from the top to show his answer :
i) My relationships with my family make me:
very happy generally happy neither happy nor unhappy generally unhappy very unhappy this question is not relevant to me..
Mr Smith feels his quality - of - life is greatly improved by the fact that his relationships with his family make him “generally happy”, so he marks a cross on the left hand end of the scale.
i)
very happy generally happy generally unhappy very unhappy this question is not relevant to me..
Mr Smith feels his quality - of - life is greatly improved by the fact that his relationships with his family make him “generally happy”, so he marks a cross on the left hand end
When you finish answering all the questions, please hand the questionnaire back. Many thanks!
The Assessment of Quality of Life (AQoL) II Instrument Overview of the Assessment of Quality of Life Mark 2 Project 18
Assessment of Quality of Life (AQoL) Mark 2.
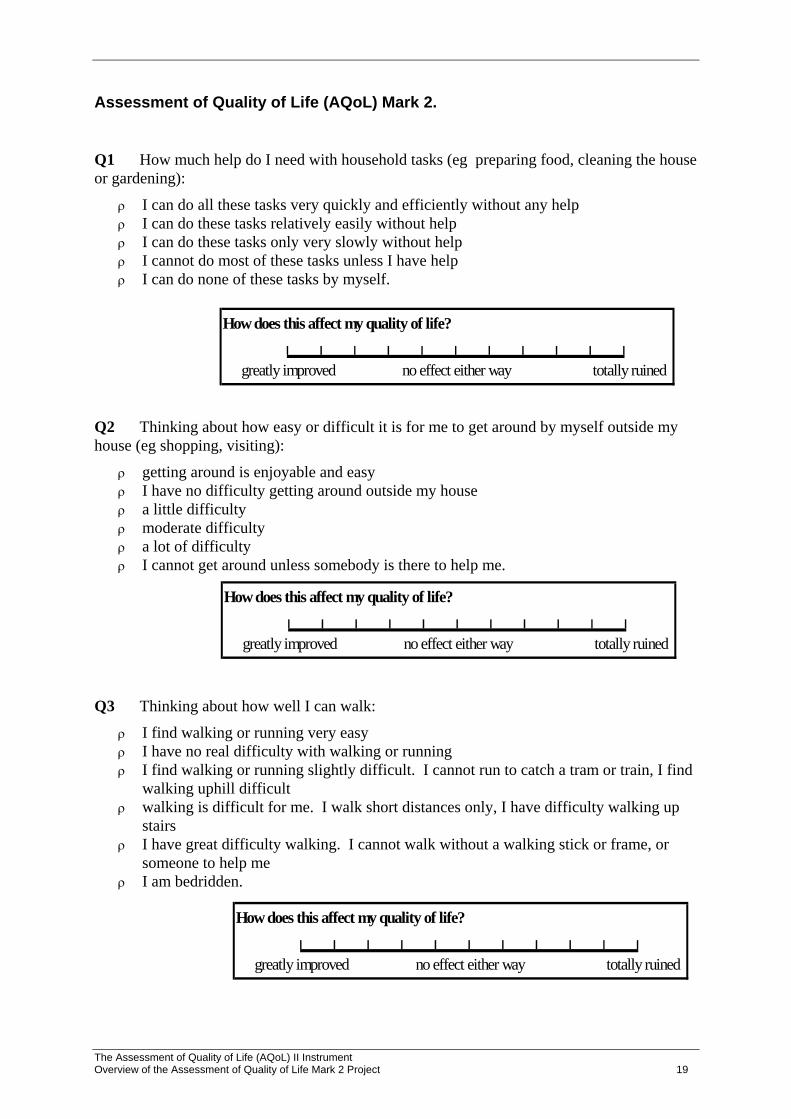
Q1 How much help do I need with household tasks (eg preparing food, cleaning the house or gardening):
ρ I can do all these tasks very quickly and efficiently without any help ρ I can do these tasks relatively easily without help ρ I can do these tasks only very slowly without help ρ I cannot do most of these tasks unless I have help ρ I can do none of these tasks by myself.
How does this affect my quality of life?
totally ruinedgreatly improved no effect either way
Q2 Thinking about how easy or difficult it is for me to get around by myself outside my house (eg shopping, visiting):
ρ getting around is enjoyable and easy ρ I have no difficulty getting around outside my house ρ a little difficulty ρ moderate difficulty ρ a lot of difficulty ρ I cannot get around unless somebody is there to help me.
How does this affect my quality of life?
totally ruinedgreatly improved no effect either way
Q3 Thinking about how well I can walk:
ρ I find walking or running very easy ρ I have no real difficulty with walking or running ρ I find walking or running slightly difficult. I cannot run to catch a tram or train, I find
walking uphill difficult ρ walking is difficult for me. I walk short distances only, I have difficulty walking up
stairs ρ I have great difficulty walking. I cannot walk without a walking stick or frame, or
someone to help me ρ I am bedridden.
How does this affect my quality of life?
totally ruinedgreatly improved no effect either way
The Assessment of Quality of Life (AQoL) II Instrument Overview of the Assessment of Quality of Life Mark 2 Project 19

Q4 Thinking about washing myself, toileting, dressing, eating or looking after my appearance:
ρ these tasks are very easy for me ρ I have no real difficulty in carrying out these tasks ρ I find some of these tasks difficult, but I manage to do them on my own ρ many of these tasks are difficult, and I need help to do them ρ I cannot do these tasks by myself at all.
How does this affect my quality of life?
totally ruinedgreatly improved no effect either way
Q5 My close and intimate relationships (including any sexual relationships) make me:
ρ very happy ρ generally happy ρ neither happy nor unhappy ρ generally unhappy ρ very unhappy
How does this affect my quality of life?
totally ruinedgreatly improved no effect either way
Q6 Thinking about my health and my relationship with my family:
ρ my role in the family is unaffected by my health ρ there are some parts of my family role I cannot carry out ρ there are many parts of my family role I cannot carry out ρ I cannot carry out any part of my family role.
How does this affect my quality of life?
totally ruinedgreatly improved no effect either way
Q7 Thinking about my health and my role in my community (that is to say neighbourhood, sporting, work, church or cultural groups):
ρ my role in the community is unaffected by my health ρ there are some parts of my community role I cannot carry out ρ there are many parts of my community role I cannot carry out ρ I cannot carry out any part of my community role.
How does this affect my quality of life?
totally ruinedgreatly improved no effect either way
The Assessment of Quality of Life (AQoL) II Instrument Overview of the Assessment of Quality of Life Mark 2 Project 20
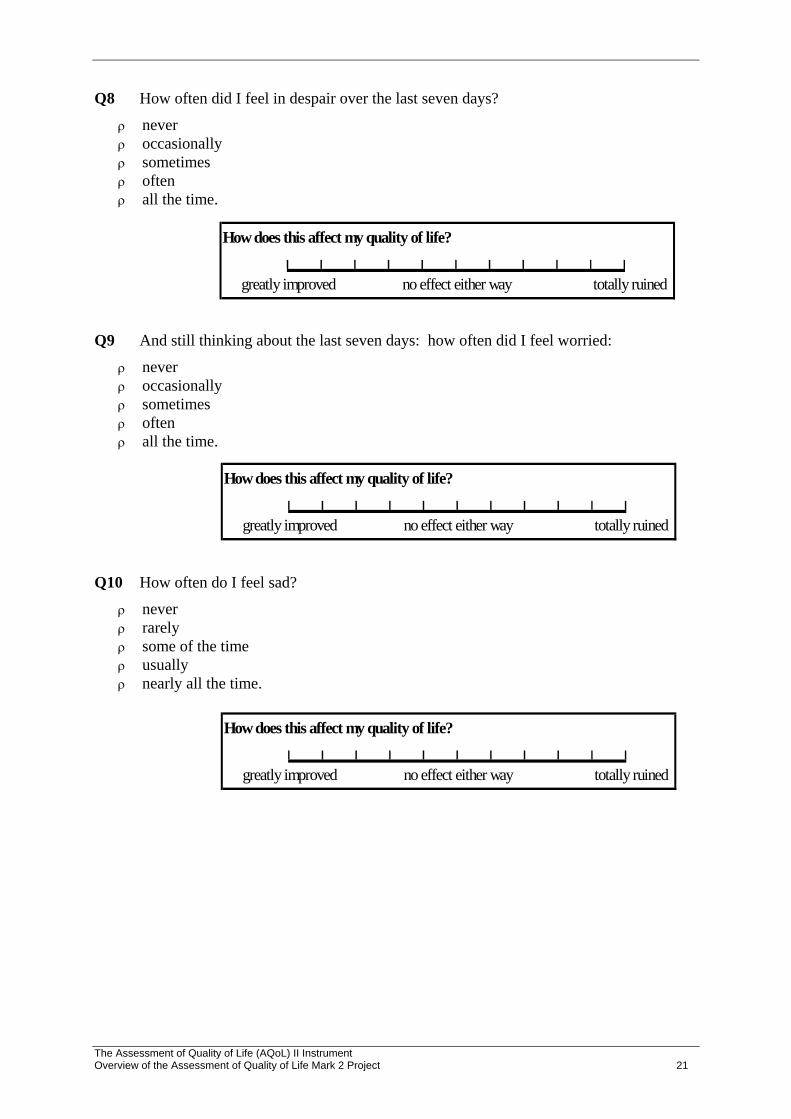
Q8 How often did I feel in despair over the last seven days?
ρ never ρ occasionally ρ sometimes ρ often ρ all the time.
How does this affect my quality of life?
totally ruinedgreatly improved no effect either way
Q9 And still thinking about the last seven days: how often did I feel worried:
ρ never ρ occasionally ρ sometimes ρ often ρ all the time.
How does this affect my quality of life?
totally ruinedgreatly improved no effect either way
Q10 How often do I feel sad?
ρ never ρ rarely ρ some of the time ρ usually ρ nearly all the time.
How does this affect my quality of life?
totally ruinedgreatly improved no effect either way
The Assessment of Quality of Life (AQoL) II Instrument Overview of the Assessment of Quality of Life Mark 2 Project 21

Q11 When I think about whether I am calm and tranquil or agitated:
ρ always calm and tranquil ρ usually calm and tranquil ρ sometimes calm and tranquil, sometimes agitated ρ usually agitated ρ always agitated.
How does this affect my quality of life?
totally ruinedgreatly improved no effect either way
Q12 Thinking about how much energy I have to do the things I want to do, I am:
ρ always full of energy ρ usually full of energy ρ occasionally energetic ρ usually tired and lacking energy ρ always tired and lacking energy.
How does this affect my quality of life?
totally ruinedgreatly improved no effect either way
Q13 How often do I feel in control of my life?
ρ always ρ mostly ρ sometimes ρ only occasionally ρ never.
How does this affect my quality of life?
totally ruinedgreatly improved no effect either way
Q14 How much do I feel I can cope with life’s problems?
ρ completely ρ mostly ρ partly ρ very little ρ not at all.
How does this affect my quality of life?
totally ruinedgreatly improved no effect either way
The Assessment of Quality of Life (AQoL) II Instrument Overview of the Assessment of Quality of Life Mark 2 Project 22

Q15 Thinking about how often I experience serious pain. I experience it:
ρ very rarely ρ less than once a week ρ three to four times a week ρ most of the time.
How does this affect my quality of life?
totally ruinedgreatly improved no effect either way
Q16 How much pain or discomfort do I experience:
ρ none at all ρ I have moderate pain ρ I suffer from severe pain ρ I suffer unbearable pain.
How does this affect my quality of life?
totally ruinedgreatly improved no effect either way
Q17 How often does pain interfere with my usual activities?
ρ never ρ rarely ρ sometimes ρ often ρ always.
How does this affect my quality of life?
totally ruinedgreatly improved no effect either way
Q18 Thinking about my vision (using my glasses or contact lenses if needed):
ρ I have excellent sight ρ I see normally ρ I have some difficulty focusing on things, or I do not see them sharply. E.g. small
print, a newspaper or seeing objects in the distance. ρ I have a lot of difficulty seeing things. My vision is blurred. I can see just enough to
get by with. ρ I only see general shapes. I need a guide to move around ρ I am completely blind.
How does this affect my quality of life?
totally ruinedgreatly improved no effect either way
The Assessment of Quality of Life (AQoL) II Instrument Overview of the Assessment of Quality of Life Mark 2 Project 23
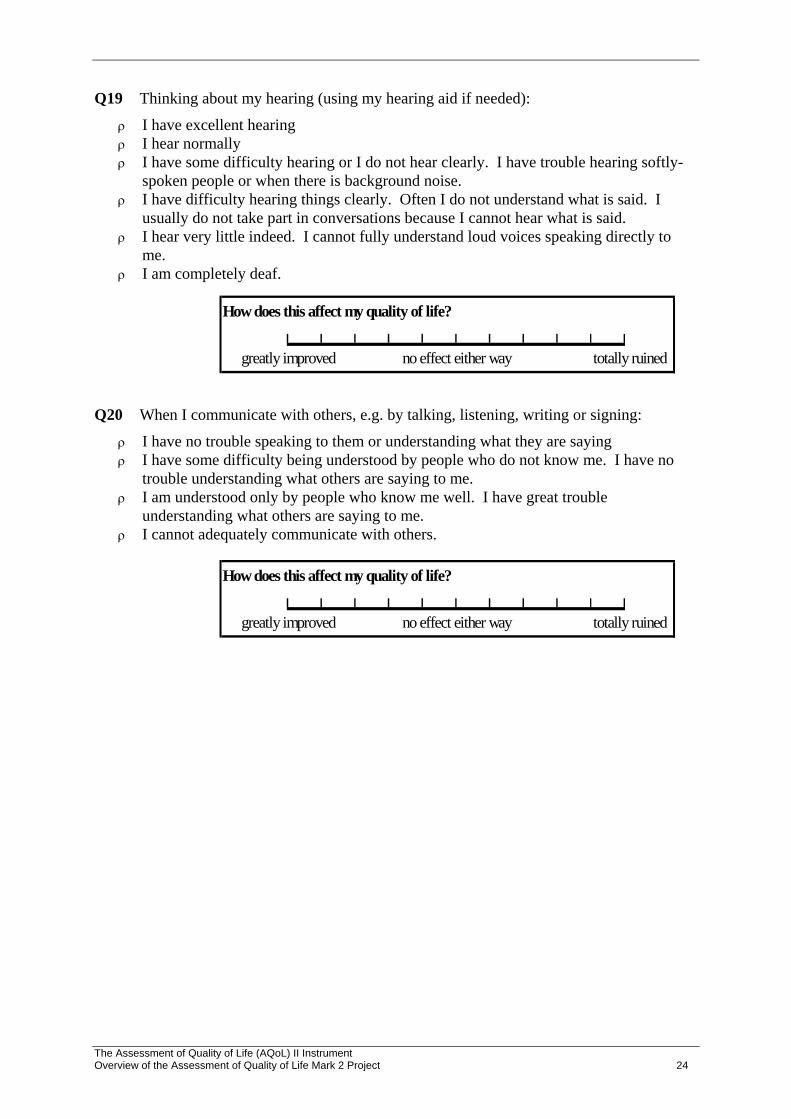
Q19 Thinking about my hearing (using my hearing aid if needed):
ρ I have excellent hearing ρ I hear normally ρ I have some difficulty hearing or I do not hear clearly. I have trouble hearing softly-
spoken people or when there is background noise. ρ I have difficulty hearing things clearly. Often I do not understand what is said. I
usually do not take part in conversations because I cannot hear what is said. ρ I hear very little indeed. I cannot fully understand loud voices speaking directly to
me. ρ I am completely deaf.
How does this affect my quality of life?
totally ruinedgreatly improved no effect either way
Q20 When I communicate with others, e.g. by talking, listening, writing or signing:
ρ I have no trouble speaking to them or understanding what they are saying ρ I have some difficulty being understood by people who do not know me. I have no
trouble understanding what others are saying to me. ρ I am understood only by people who know me well. I have great trouble
understanding what others are saying to me. ρ I cannot adequately communicate with others.
How does this affect my quality of life?
totally ruinedgreatly improved no effect either way
The Assessment of Quality of Life (AQoL) II Instrument Overview of the Assessment of Quality of Life Mark 2 Project 24

The Assessment of Quality of Life (AQoL) II Instrument Overview of the Assessment of Quality of Life Mark 2 Project 25
AQoL Study Background Questions
Please tick one box per question.
21 Are you:
male female
22 In what year were you born? 19____
23 Where were you born?
Australia Other country? Which one? ____________
24 Is English your first language?
yes no Specify: ____________
25 What is your highest level of education?
primary schooling only secondary schooling completed secondary schooling not completed. How many years completed? ___ trade qualification or TAFE: Specify course: _____________ University or other tertiary study Other or not applicable: please describe: ______________________
26 Which best describes your work situation: (Tick as many boxes as apply)
full-time: self-employed or employee part-time: self-employed or employee unemployed, seeking work working in the home / home duties retired student other: please describe: ____________________
If You Are Employed Or Self-Employed Or Seeking Work:
27 What is your occupation?
28 What do you do in your job?

The Assessment of Quality of Life (AQoL) II Instrument Overview of the Assessment of Quality of Life Mark 2 Project 26
29 Do you receive any Government pension or benefit?
no yes Which pension(s) or benefit(s): ___________________
30 Are you:
married or living with a partner single: never married single: widowed single: divorced or separated
31 How would you rate your current level of health, for someone of your age?
excellent very good good fair poor very poor extremely poor
32 Mark one box on the scale to show how important or unimportant is religion or spirituality is in your life
very
important
important unimportant very unimportant
33 Please mark one box to show your HOUSEHOLD income, either annually, monthly or weekly. Include income that comes to the household from all sources. You may estimate either before or after tax.
yearly monthly fortnightly weekly
under $20,000 under $1,665 under $800 under $385
$20,001-$30,000 $1,665-$2,500 $800-$1,155 $385-$575
$30,001-$40,000 $2,501-$3,330 $1,156-$1,535 $576-$770
$40,001-$50,000 $3,331-$4,165 $1,536-$1,925 $771-$960
$50,001-$60,000 $4,166-$5,000 $1,926-$2,305 $961-$1,155
$60,001-$80,000 $5,001-$6665 $2,306-$3,075 $1,156-$1,540
more than $80,000 more than $6665 more than $3,075 more than $1,540
The Assessment of Quality of Life (AQoL) II Instrument Overview of the Assessment of Quality of Life Mark 2 Project 27
34 Please mark a box to show whether your answer is before or after tax.
before tax
after tax
Thank you! Please bring this questionnaire with you when you attend the group session/interview.