Women's Political Participation, Empowerment and Inclusions ...
Political Participation and Quality of Life
9.1 Introduction
Political participation within a society takes variuos forms andshapes. It can be initiated by a mere verbal comment towards theauthorities or governments to involving in legal or illegalprotestings. One of the most fundamental forms of participatingis voting. Although it is not as demanding as other forms ofparticipation, it is likely the most frequent form ofparticipation and the basis of legitimacy for all moderndemocracies (Shapiro and Winters, 2008). As such it is theintention of this section to study the interrelationships betweenthe act of voting and the individual life satisfaction in presentday. By using the basis of Pilihanraya Umum Dewan Undangan NegeriPulau Pinang, 2008, a survey1 of 254 respondents was deployed toseek the responses from various categories of people in theSeberang Perai Districts towards their voting patterns inrelation to the present life satisfcation. Life satisfaction hereis used quite loosely to mean the general satisfaction in life asthe basis used in the Quality of Life2 (QoL) Index Measurement.Life satisfaction is also referred to by some scholars as(individual) happiness or (subjective) well-being (see forexamples Shapiro and Winters, 2008 or Flavin and Keane, 2008).
The orientation of this section is geared towards theidentification and discussion of the respondents voting patternsin lieu of the extraordinary 2008 General Election (GE) resultsin the Seberang Perai Districts. It is an attempt to establsihsome linkages that may exist between the voting patterns amongthe households and selected indicators of the QoL. It is1 The survey was conducted through the USM Research University Grant, titled, Measuring the Quality of Life in Urban Residential Neighborhoods, 2007-2010.2 Some of the commonly used measures of QoL are the United Nations Human Development Index by the United Nations Development Programme (UNDP); Worldwide Cost of Living Survey by the Economist Intelligence Unit (EIU); and the Worldwide Quality of Living Survey and Cost of Living Survey, both by Mercer Human Resource Consulting
postulated that the change in governance in some areas during theelection may or may not be associated with changing lifesatisfaction among some quarters. Research results may be used bymunnicipal authorities to raise awareness on wide-ranging QoLissues, as well as to stimulate grass roots and stakeholdersparticipation and involvement towards improving the QoL, vis-à-vis, life satisfaction in general.
9.2 Political Participation and Life Satisfaction
The theoretical basis of the discussions on politicalparticipartion spins from the work of many scholars around theglobe. Some contemporary work includes Shapiro and Winters, 2008,Mohd. Faisal, Neilson Ilan Mersot & Ahi Sarok, 2002, Abdul HamidAbdullah, 1995, Chandra Muzaffar, 1989, Syamsuddin Haris, 2004,Almond, G., and S. Verba. 1989, Frey, B.S., and A. Stutzer. 2000,Sen, A.K. 1995, 2000, Wan Rohila Ganti, 2008 and Marsyelayanti,2009,. A whole range of participation issues are discussed andexamined by these scholars including the orientation of votingpatterns and the relations between participation and lifesatisfaction.
The study of political participation stems from the examinationof one’s political culture. Political culture is associated withsuch acts as voting, involvement in club activities, professingpreferences for a political party, discussing political issues,or involving in campaign for a candidate or a party(Marsyelayanti, 2009). All these activities are regarded as theattitudes toward politics and the role within the politicalsystem, or political culture which Almond and Verba (1963),referred to the specifically political orientations-attitudestoward the political system and its various parts and attitudestoward the role of the self in the system. These behaviors orcultures differed from one country to another due to thebackground of the society, history, religion, education,structure and so forth, as it was related to the society itself(Ahmad Nizamuddin, 2002). In its simplest form, political culturerefers to a set of values and orientations which determine andinfluence the public’s perception of politics (Kamrava, 1996).
Culture and participation in politics are intertwined in thatculture in many cases dictates the degree of participation amongindividuals. The individuals engaged in such participation likelyexpect—or at least hope—that these actions will have some impacton the content of government policies. However, the effects ofpolitical participation might not be limited to outcomes.Political participation might also affect individual lifesatisfaction and happiness (Shapiro and Winters, 2008). Politicalculture is partly inluenced by socieconomic status of anindividual, its demographic structure and the scenario of itspolitical system (Wan Rohila Ganti, 2008). One of the elementaryissues of participation is understanding the reasons as to whypeople participate. Mohd Fazil, Neilson and Ahi Sarok (2002)iterated from their study of electorates in Sarawak, Malaysia,that “candidate profile” plays an important role in mobilizingpeople to cast their votes. Voters look at the candidate whocomes in a package; has a very good personality, charismatic,educated and of course, displays leadership skills. The candidatewho has a debating skill or an ability to give an emotionalspeech would have an advantage over others. This is agreed byAbdul Hamid Abdullah (1995) who added additional attributes suchas belonging to a respected family. It is an advantage if thecandidate is a local person. He also argued that in aconventional society, gender played an important role. A malecandidate was preferable to a female candidate. Ethnicity wasalso important to be considered in that the Malays tend to votefor Malay candidates and the Chinese for the Chinese candidates.Welsh (1996), confirmed that ethnicity is at the core ofdifferences in political attitudes. Her survey on politicalattitudes in Malaysia suggested that there were differentopinions on democracy: Malays opposed the expansion of democracy,but Indians favored it, while the Chinese were ambivalent. Thisdifferent view within ethnic groups was due to class background.She adds that class differences are emerging as a potential forcein differentiation of attitudes, i.e. between the lower class,middle class and upper class society.
Chandra Muzaffar (1989) and Syamsuddin Haris (2004) found thatthe source of information, i.e., media, plays an important rolein motivating people to cast their votes to a specific politicalparty. People will get the information regarding the candidates,issues and programs via the media and it is concluded that theparty (normally the ruling party) who controls the media may beable to control voting preferences.
Shi (1997) in the study of political participation in Beijingfound that participation is a concept derived from democracyideologies which means literally as “ruled by the people”.Interestingly, such participation also churns out psychologicaland attitudinal values of the participants. The act ofparticipation, i.e. voting for instance, gives two types ofsatisfactions namely, the satisfaction with the governmentpolicies or system as well as the satisfaction with their rolesin societies. Participation embeds the “sense of membership” orsense of belonging within the political system. Shapiro andWinters (2008) further elaborated that political participationthrough voting helps voters to express satisfaction towards thepolitical system. Participants always feel that voting gives themempowerment as the members of society who have the ability tochange. Almond and Verba (1963) suggested the basic criteria forany individual who wish to participate politically. The firstcriteria revolved around the level of involvement by anindividual in a poltical system. It was imperative that theindividual was actively involved in politics. Secondly, theindividual should be rational in his or her approach to politics.The individual should be guided by reasons and not emotions andfinally, the individual should be well-informed about politics.On the same note, Ruedin (2007), concluded that there were 3levels of participation, the gladitorials who were most active inpolitics at the top level, the spectators (voters) who wereturning programs into reality and the apathetics who were themost passive in politics.
In short, political participation can take many forms. It can beinitiated by a citizen who expects to result in particularizedbenefits. Participation may also be employed by individuals or
collectives, organized or spontaneous, sustained or sporadic,legal or illegal, effective or ineffective (Huntington andNelson, 1976). Voting is the most pertinent act of participationas agreed by many scholars. It is through voting that votersanticipate changes in outcomes of the electoral process.
Does political participation affect life satisfaction? Doesvoting increase subjective well-being? Some scholars tend toagree that in a way, political participation does affect changesin life satistaction but many are unsure of the degree ofparticipation that is required to do so. Shapiro and Winters(2008) in one of their major findings from the study ofparticipation and its relation to QoL in Latin American States,concluded that participation was an effect rather than a causefor enhancing utility, or what is termed as “procedural utility”.They found out that, happier people were more likely toparticipate in politics, “…happier people opt to vote morefrequently than unhappy people”. Procedural utility refers tosatisfaction people received through political participation.Satisfaction in their views comes from three sources namely,autonomy, which is related to empowerment, relatedness, which isassociated with social being and how the individual relates toothers in the society and competence, which is linked to theincrease base of knowledge particularly on local politics. Thus,participation at whatever level is said to provide individualswith a sense of worth as a member of the society.
Frey and Stutzer (2006), found that the opportunity for politicalparticipation is associated with an increase in individuals senseof well-being. They asserted that, “…individuals who have moreopportunities for participation in direct democracy (i.e. voting)are more satisfied with their lives than those without suchopportunities…” (Shapiro and Winters, 2008, pg. 12). The study ofhappiness in modern economics emerged in the 1970s and initiallypaid significant attention to the relationship between income andhappiness. In recent years, the literature on happiness hasincorporated many other predictor variables, and researchersregularly find that variables like church attendance and maritalstatus are associated with individual happiness. A few authors
have investigated the effects of political variables onhappiness, as well. So, for example, Radcliff (2001) finds thathappiness is higher on average in countries with left-leaninggovernments. Cross country studies of participation andindividual happiness shows also that happiness may come frompolitical democracy and freedom of the press (Veenhoven, 1995)while happiness could also be strongly associated with politicalrights, gender equality and indiviudalism (Schyns, 1998).
Although only a handful of studies directed towards examininglife satisfaction in relation to political participation, many ofthe findings indicated that happier citizens may participate morein voluntary organizations and are generally more concerned withpolitical and social problems. Some research, however, showsthat higher life satisfaction is also associated with lowerinclination to participate in protests and strikes to achievepolicy desires. In sum, the literature on life satisfaction asrelated to variables of political interest is focused on cross-national variation in subjective life satisfaction as affected bypolitical culture or political institutions. Based on suchassumptions and findings, Flavin and Keane (2008) also concludedthat life satisfaction or happiness, when related to politicalparticipation, should be treated as independent variable ratherthan dependent. This may be due largely to the nearly exclusivestudy of life satisfaction as a dependent variable – i.e., tothis point political scientists, economists, and sociologistshave concentrated on how institutional performance and otherpolitical arrangements bear on individuals’ life satisfaction, orhappiness. By turning to happiness as an independent variable,they found that individuals who are more satisfied with theirlives are more likely to participate politically.
Apparently, political participation and life satisfaction hasbeen the subject that sparks interests of many scholars andstudies. The extent of political participation in relation tolife satisfaction can be tracked from the issues of why peoplewould participate to establshing the relevances between the twovariables. It seems that people would participate politically fora number of different reasons and justifications. Most dominant
among those is the feeling of empowerment, that, they asindividuals can affect changes to the system. It is alsoimperative to note that, participation may not lead to theexpected outcomes, such as increase of life satisfaction, but itgives the sense of worth to individuals as the member of thesociety. Voting is the most fundamental act of participation indemocratic societies and through voting, people might findsatisfaction as they feel that they are able to contribute to thesociety, though, the outcomes are not as expected. By being ableto experience such opportunities, people may be satisfied to beinvolved in the electoral process despite its outcomes.Nevertheless, the question remains whether happier (more lifesatisfaction) people are more likely to vote or vice versa.
As mentioned, the voting patterns of the respondents in DewanUndangan Negeri (DUN) General Election 2008 of Seberang Peraimight be able to shed some lights regarding the relationshipbetween political participation and life satisfaction.
9.3 Survey
The findings in this section are derived from the collection ofprimary data through a survey using a face to face interviewmethod on sampled households in the Northern Region of Malaysia,The survey was completed as part of a study entitled “Measuringthe Quality of Life in Urban Residential Neighborhoods” (2007)3.The section was focused on the political participation aspects ofQoL (see Section H of the questionnaire, Appendix…).
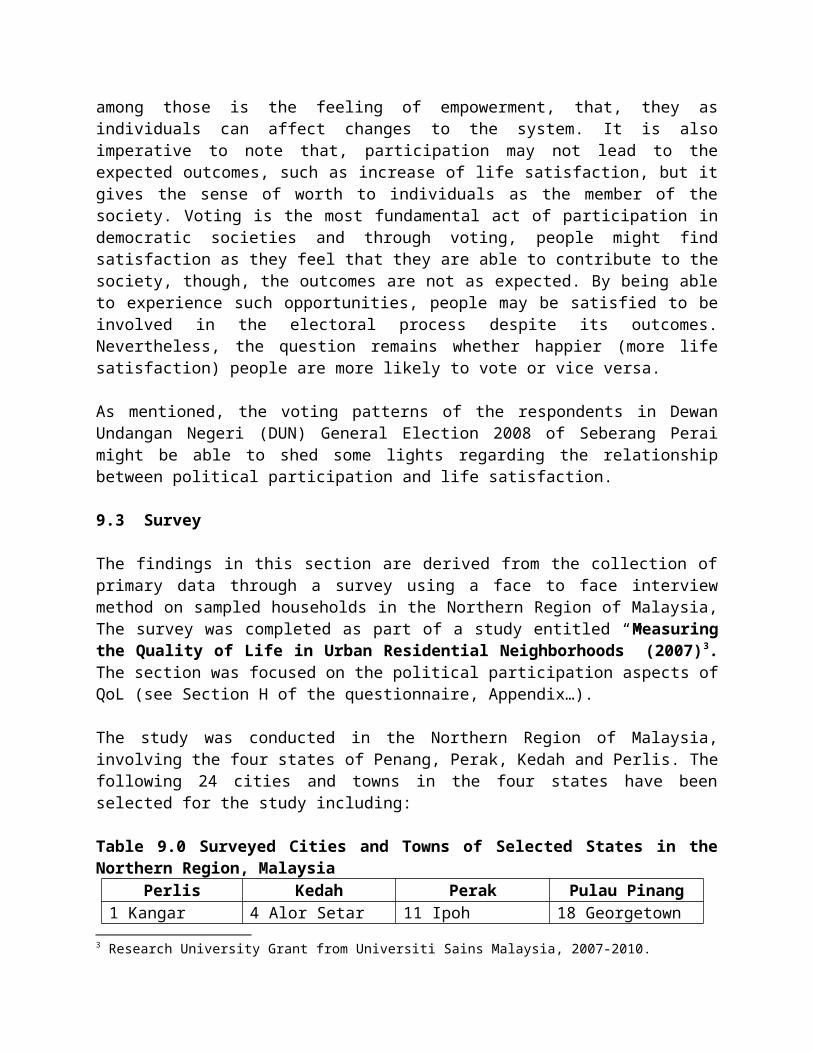
The study was conducted in the Northern Region of Malaysia,involving the four states of Penang, Perak, Kedah and Perlis. Thefollowing 24 cities and towns in the four states have beenselected for the study including:
Table 9.0 Surveyed Cities and Towns of Selected States in theNorthern Region, Malaysia
Perlis Kedah Perak Pulau Pinang1 Kangar 4 Alor Setar 11 Ipoh 18 Georgetown
3 Research University Grant from Universiti Sains Malaysia, 2007-2010.
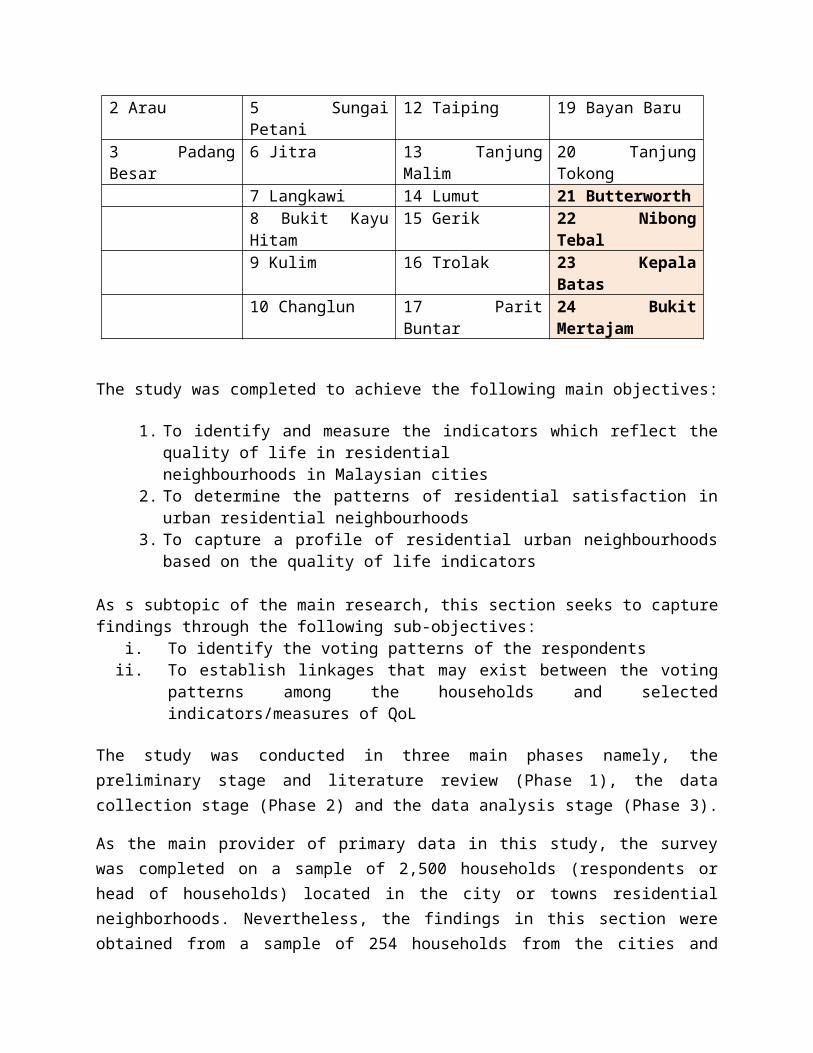
2 Arau 5 SungaiPetani
12 Taiping 19 Bayan Baru
3 PadangBesar
6 Jitra 13 TanjungMalim
20 TanjungTokong
7 Langkawi 14 Lumut 21 Butterworth8 Bukit KayuHitam
15 Gerik 22 NibongTebal
9 Kulim 16 Trolak 23 KepalaBatas
10 Changlun 17 ParitBuntar
24 BukitMertajam
The study was completed to achieve the following main objectives:
1. To identify and measure the indicators which reflect thequality of life in residential neighbourhoods in Malaysian cities
2. To determine the patterns of residential satisfaction inurban residential neighbourhoods
3. To capture a profile of residential urban neighbourhoodsbased on the quality of life indicators
As s subtopic of the main research, this section seeks to capturefindings through the following sub-objectives:
i. To identify the voting patterns of the respondentsii. To establish linkages that may exist between the voting
patterns among the households and selectedindicators/measures of QoL
The study was conducted in three main phases namely, thepreliminary stage and literature review (Phase 1), the datacollection stage (Phase 2) and the data analysis stage (Phase 3).
As the main provider of primary data in this study, the surveywas completed on a sample of 2,500 households (respondents orhead of households) located in the city or towns residentialneighborhoods. Nevertheless, the findings in this section wereobtained from a sample of 254 households from the cities and
towns in the Seberang Perai District, including Butterworth,Nibong Tebal, Kepala Batas and Bukit Mertajam as shown in Table9.0.
Data collected was processed and analyzed using descriptivestatistics and qualitative analysis.
9.3.1 Questionnaire
The questionnaire consisted of several key sections that relateto QoL (Appendix…).
1. Housing Location2. Profile of Respondents or Head of Households3. Housing Aspects4. Environmental and Neighborhood Aspects5. Public Safety6. Public Transport7. Community Organization8. Political Aspects9. Future Aspirations
9.4 Scenario
The 12th General Election (GE) of Malaysia in 2008 has been dubbed as the turning point in the history of Malaysian politics in which the opposition party has swept surprising results againts the ruling party of Barisan Nasional (BN). The BN had experienced reduced majority and the loss of five state assemblies in comparison to the 11th GE in 2004. According to the 12th GE results posted inhttp:en/wikepedia.org/wiki/malaysian general election,2008#results, 222 parliamentary seats and 12 state legislatureswere contested in 2008, with voter turnout among Malaysia's 10.9million eligible voters estimated to be 70 percent. BN won 91percent of parliamentary seats in 2004 election, but its majoritywas clipped in 2008 as it sufferred a backlash from ethnicChinese and Indians. BN was able to return to power and form thenext government, with a simple majority but without the crucial
two-thirds majority in parliament. It is BN's worst performancein Malaysia's general election since independence in 1957,winning only 63.5% (140 out of 222) of parliamentary seats thatwere contested. Component parties in BN, including the MalaysianChinese Association (MCA), Malaysian Indian Congress (MIC),and Gerakan, saw its number of state and federal seats severelyreduced by half or more. UMNO also saw its number reducedsignificantly but not by as much as half. The results of severalstates have been rather surprising to everybody involved. Many ofthe states BN have lost were those on the western coast ofPeninsular Malaysia where it has traditionally focused most ofits attention to. These states experienced more development andinvestment than other states, and account for much of thecountry's population. The remaining states that have given BN itssimple majority are states that are economically weaker than whatthe opposition have gained.
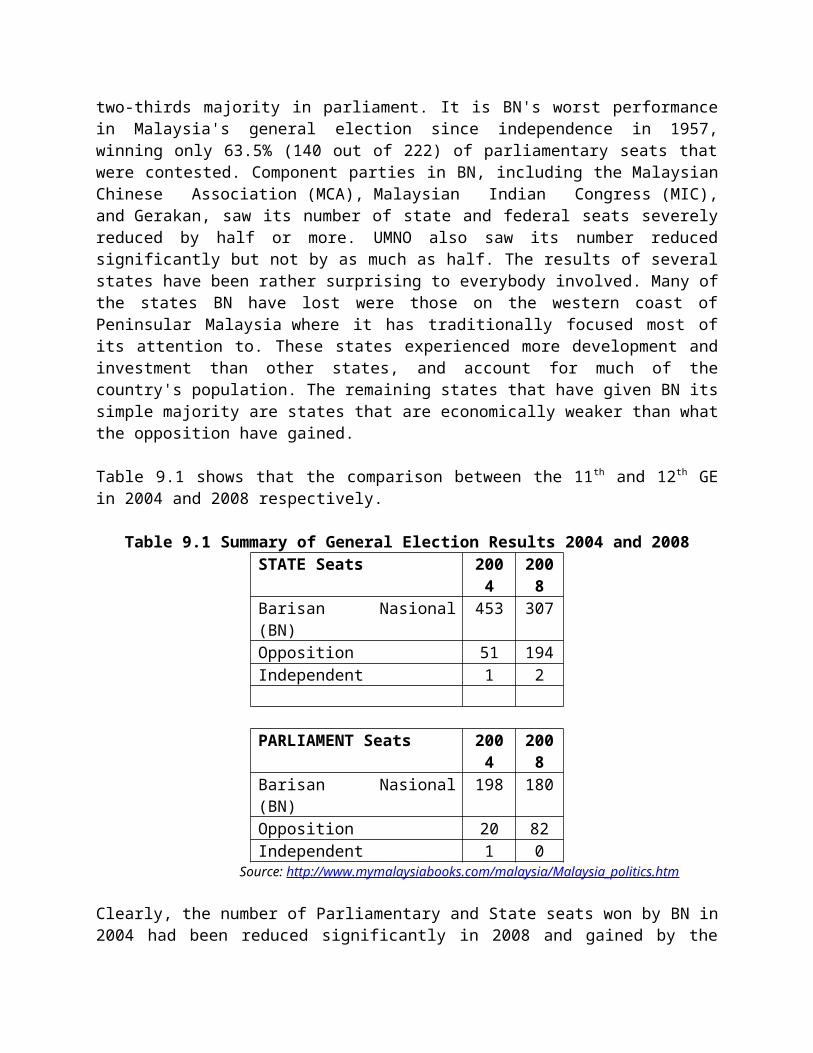
Table 9.1 shows that the comparison between the 11th and 12th GEin 2004 and 2008 respectively.
Table 9.1 Summary of General Election Results 2004 and 2008STATE Seats 200
42008
Barisan Nasional(BN)
453 307
Opposition 51 194Independent 1 2
PARLIAMENT Seats 2004
2008
Barisan Nasional(BN)
198 180
Opposition 20 82Independent 1 0
Source: http://www.mymalaysiabooks.com/malaysia/Malaysia_politics.htm
Clearly, the number of Parliamentary and State seats won by BN in2004 had been reduced significantly in 2008 and gained by the
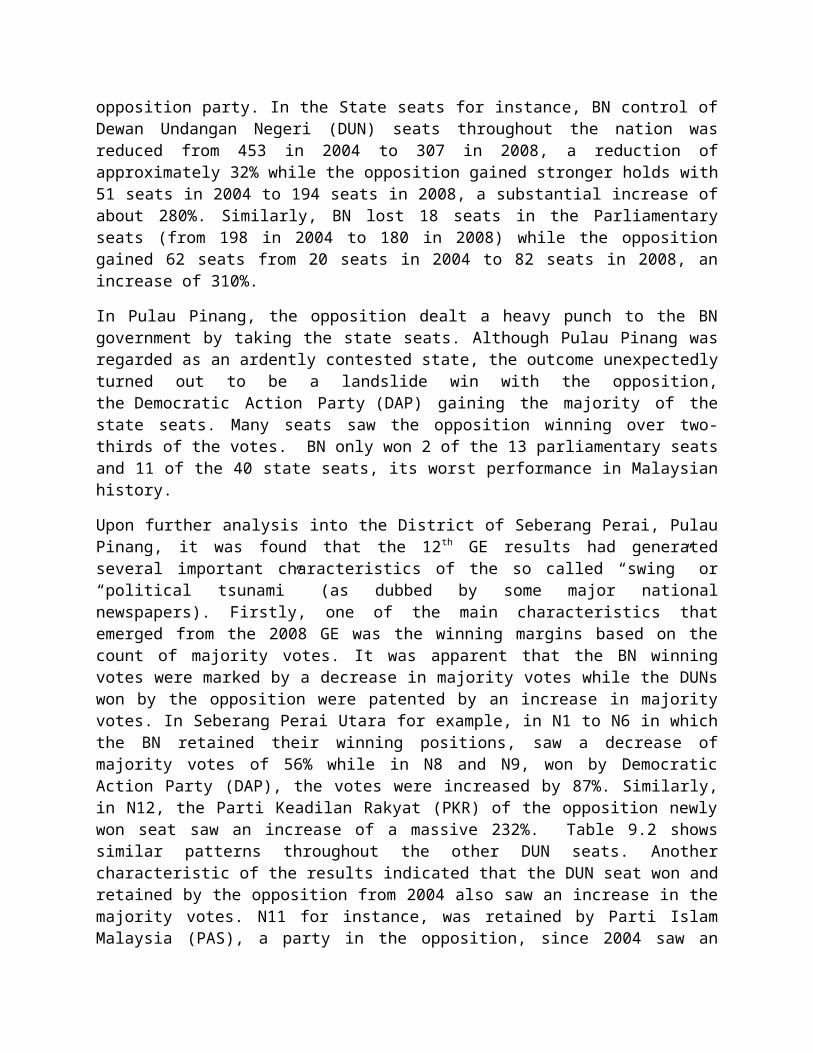
opposition party. In the State seats for instance, BN control ofDewan Undangan Negeri (DUN) seats throughout the nation wasreduced from 453 in 2004 to 307 in 2008, a reduction ofapproximately 32% while the opposition gained stronger holds with51 seats in 2004 to 194 seats in 2008, a substantial increase ofabout 280%. Similarly, BN lost 18 seats in the Parliamentaryseats (from 198 in 2004 to 180 in 2008) while the oppositiongained 62 seats from 20 seats in 2004 to 82 seats in 2008, anincrease of 310%.
In Pulau Pinang, the opposition dealt a heavy punch to the BNgovernment by taking the state seats. Although Pulau Pinang wasregarded as an ardently contested state, the outcome unexpectedlyturned out to be a landslide win with the opposition,the Democratic Action Party (DAP) gaining the majority of thestate seats. Many seats saw the opposition winning over two-thirds of the votes. BN only won 2 of the 13 parliamentary seatsand 11 of the 40 state seats, its worst performance in Malaysianhistory.
Upon further analysis into the District of Seberang Perai, PulauPinang, it was found that the 12th GE results had generatedseveral important characteristics of the so called “swing” or“political tsunami” (as dubbed by some major nationalnewspapers). Firstly, one of the main characteristics thatemerged from the 2008 GE was the winning margins based on thecount of majority votes. It was apparent that the BN winningvotes were marked by a decrease in majority votes while the DUNswon by the opposition were patented by an increase in majorityvotes. In Seberang Perai Utara for example, in N1 to N6 in whichthe BN retained their winning positions, saw a decrease ofmajority votes of 56% while in N8 and N9, won by DemocraticAction Party (DAP), the votes were increased by 87%. Similarly,in N12, the Parti Keadilan Rakyat (PKR) of the opposition newlywon seat saw an increase of a massive 232%. Table 9.2 showssimilar patterns throughout the other DUN seats. Anothercharacteristic of the results indicated that the DUN seat won andretained by the opposition from 2004 also saw an increase in themajority votes. N11 for instance, was retained by Parti IslamMalaysia (PAS), a party in the opposition, since 2004 saw an
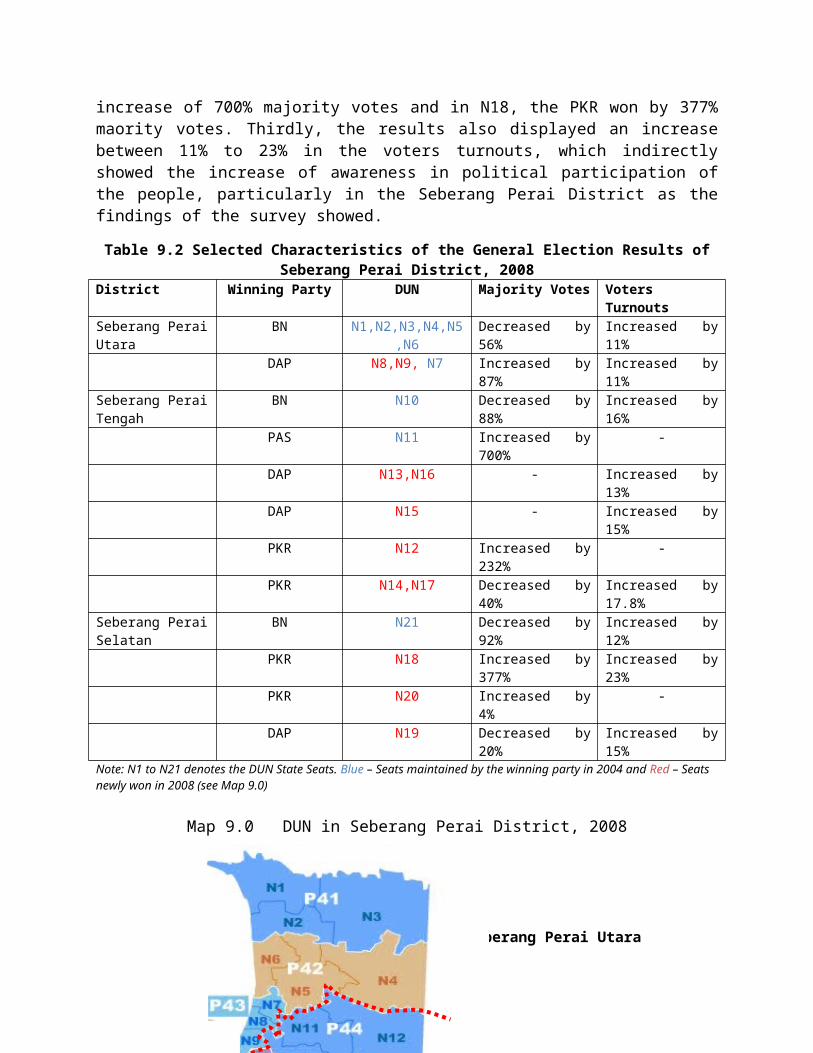
Seberang Perai Utara
increase of 700% majority votes and in N18, the PKR won by 377%maority votes. Thirdly, the results also displayed an increasebetween 11% to 23% in the voters turnouts, which indirectlyshowed the increase of awareness in political participation ofthe people, particularly in the Seberang Perai District as thefindings of the survey showed.
Table 9.2 Selected Characteristics of the General Election Results ofSeberang Perai District, 2008
District Winning Party DUN Majority Votes VotersTurnouts
Seberang PeraiUtara
BN N1,N2,N3,N4,N5,N6
Decreased by56%
Increased by11%
DAP N8,N9, N7 Increased by87%
Increased by11%
Seberang PeraiTengah
BN N10 Decreased by88%
Increased by16%
PAS N11 Increased by700%
-
DAP N13,N16 - Increased by13%
DAP N15 - Increased by15%
PKR N12 Increased by232%
-
PKR N14,N17 Decreased by40%
Increased by17.8%
Seberang PeraiSelatan
BN N21 Decreased by92%
Increased by12%
PKR N18 Increased by377%
Increased by23%
PKR N20 Increased by4%
-
DAP N19 Decreased by20%
Increased by15%
Note: N1 to N21 denotes the DUN State Seats. Blue – Seats maintained by the winning party in 2004 and Red – Seats newly won in 2008 (see Map 9.0)
Map 9.0 DUN in Seberang Perai District, 2008
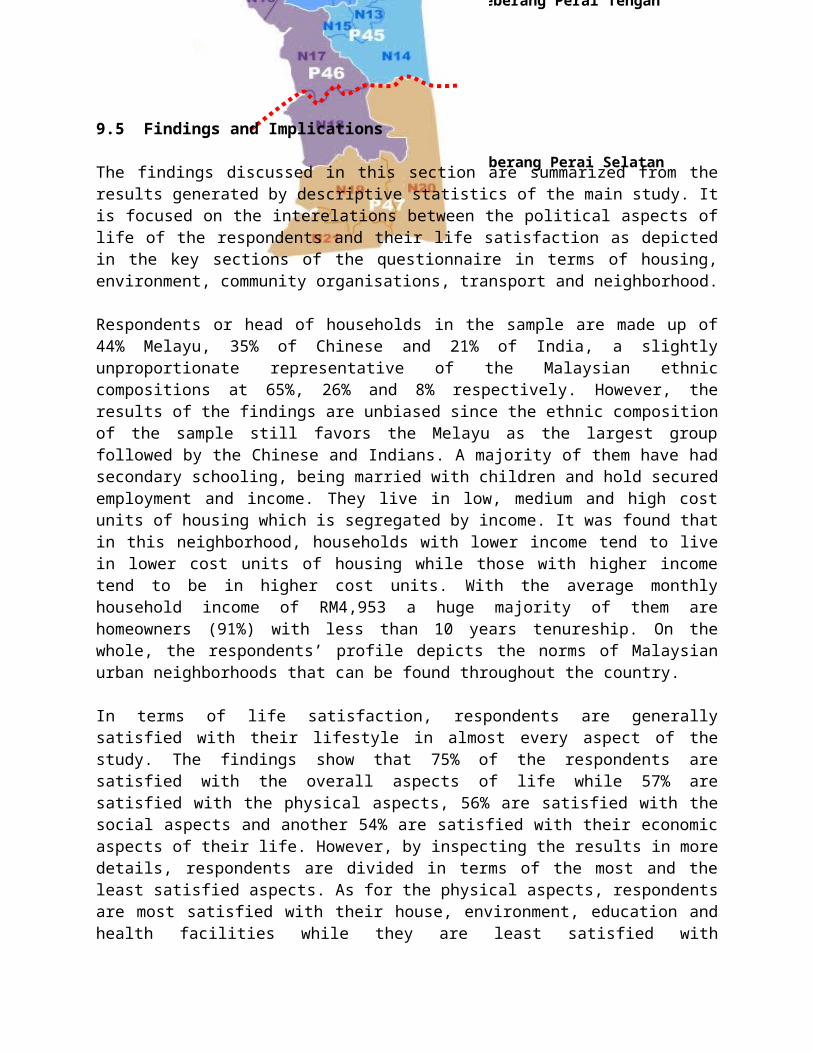
Seberang Perai Tengah
Seberang Perai Selatan
9.5 Findings and Implications
The findings discussed in this section are summarized from theresults generated by descriptive statistics of the main study. Itis focused on the interelations between the political aspects oflife of the respondents and their life satisfaction as depictedin the key sections of the questionnaire in terms of housing,environment, community organisations, transport and neighborhood.
Respondents or head of households in the sample are made up of44% Melayu, 35% of Chinese and 21% of India, a slightlyunproportionate representative of the Malaysian ethniccompositions at 65%, 26% and 8% respectively. However, theresults of the findings are unbiased since the ethnic compositionof the sample still favors the Melayu as the largest groupfollowed by the Chinese and Indians. A majority of them have hadsecondary schooling, being married with children and hold securedemployment and income. They live in low, medium and high costunits of housing which is segregated by income. It was found thatin this neighborhood, households with lower income tend to livein lower cost units of housing while those with higher incometend to be in higher cost units. With the average monthlyhousehold income of RM4,953 a huge majority of them arehomeowners (91%) with less than 10 years tenureship. On thewhole, the respondents’ profile depicts the norms of Malaysianurban neighborhoods that can be found throughout the country.
In terms of life satisfaction, respondents are generallysatisfied with their lifestyle in almost every aspect of thestudy. The findings show that 75% of the respondents aresatisfied with the overall aspects of life while 57% aresatisfied with the physical aspects, 56% are satisfied with thesocial aspects and another 54% are satisfied with their economicaspects of their life. However, by inspecting the results in moredetails, respondents are divided in terms of the most and theleast satisfied aspects. As for the physical aspects, respondentsare most satisfied with their house, environment, education andhealth facilities while they are least satisfied with
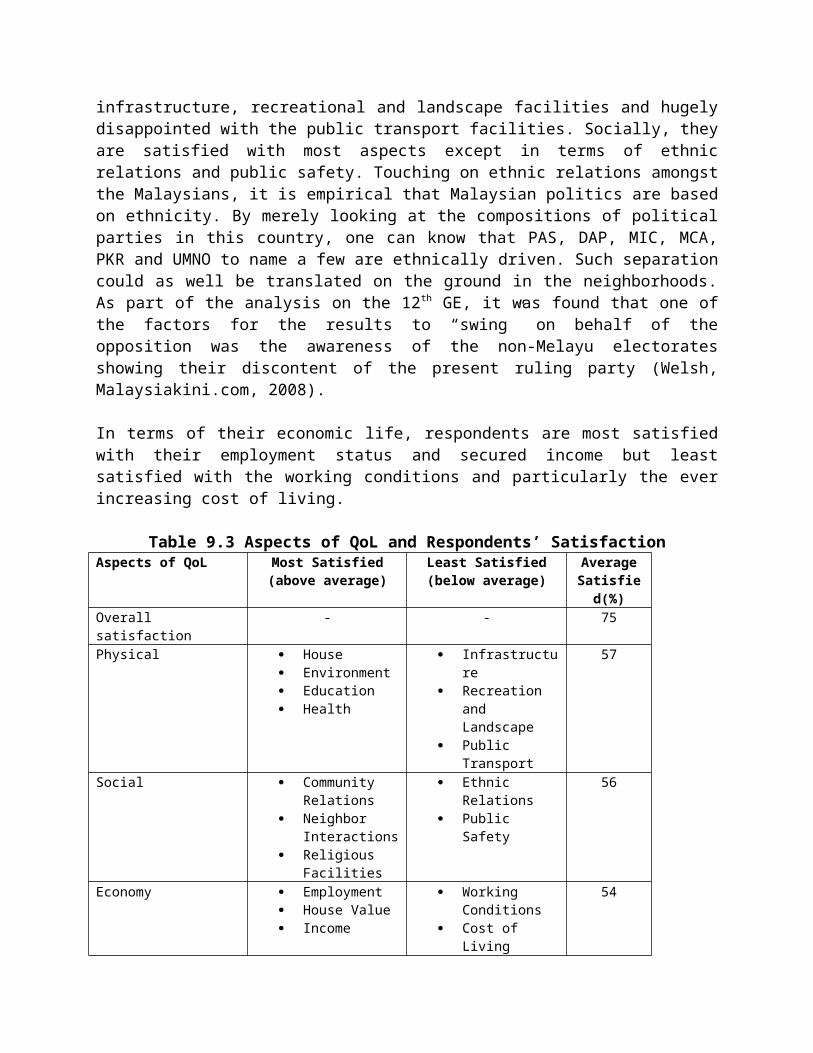
infrastructure, recreational and landscape facilities and hugelydisappointed with the public transport facilities. Socially, theyare satisfied with most aspects except in terms of ethnicrelations and public safety. Touching on ethnic relations amongstthe Malaysians, it is empirical that Malaysian politics are basedon ethnicity. By merely looking at the compositions of politicalparties in this country, one can know that PAS, DAP, MIC, MCA,PKR and UMNO to name a few are ethnically driven. Such separationcould as well be translated on the ground in the neighborhoods.As part of the analysis on the 12th GE, it was found that one ofthe factors for the results to “swing” on behalf of theopposition was the awareness of the non-Melayu electoratesshowing their discontent of the present ruling party (Welsh,Malaysiakini.com, 2008).
In terms of their economic life, respondents are most satisfiedwith their employment status and secured income but leastsatisfied with the working conditions and particularly the everincreasing cost of living.
Table 9.3 Aspects of QoL and Respondents’ SatisfactionAspects of QoL Most Satisfied
(above average)Least Satisfied(below average)
AverageSatisfied(%)
Overallsatisfaction
- - 75
Physical House Environment Education Health
Infrastructure
Recreation and Landscape
Public Transport
57
Social Community Relations
Neighbor Interactions
Religious Facilities
Ethnic Relations
Public Safety
56
Economy Employment House Value Income
Working Conditions
Cost of Living
54
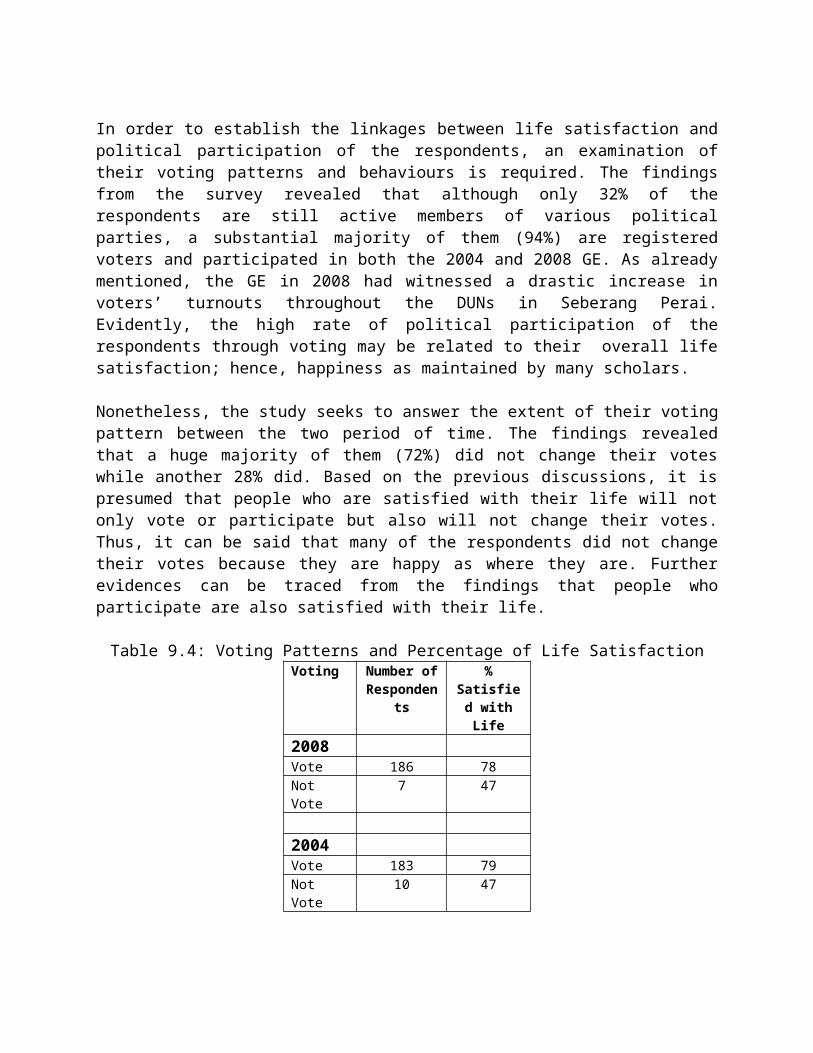
In order to establish the linkages between life satisfaction andpolitical participation of the respondents, an examination oftheir voting patterns and behaviours is required. The findingsfrom the survey revealed that although only 32% of therespondents are still active members of various politicalparties, a substantial majority of them (94%) are registeredvoters and participated in both the 2004 and 2008 GE. As alreadymentioned, the GE in 2008 had witnessed a drastic increase invoters’ turnouts throughout the DUNs in Seberang Perai.Evidently, the high rate of political participation of therespondents through voting may be related to their overall lifesatisfaction; hence, happiness as maintained by many scholars.
Nonetheless, the study seeks to answer the extent of their votingpattern between the two period of time. The findings revealedthat a huge majority of them (72%) did not change their voteswhile another 28% did. Based on the previous discussions, it ispresumed that people who are satisfied with their life will notonly vote or participate but also will not change their votes.Thus, it can be said that many of the respondents did not changetheir votes because they are happy as where they are. Furtherevidences can be traced from the findings that people whoparticipate are also satisfied with their life.
Table 9.4: Voting Patterns and Percentage of Life SatisfactionVoting Number of
Respondents
%Satisfied withLife
2008Vote 186 78NotVote
7 47
2004Vote 183 79NotVote
10 47
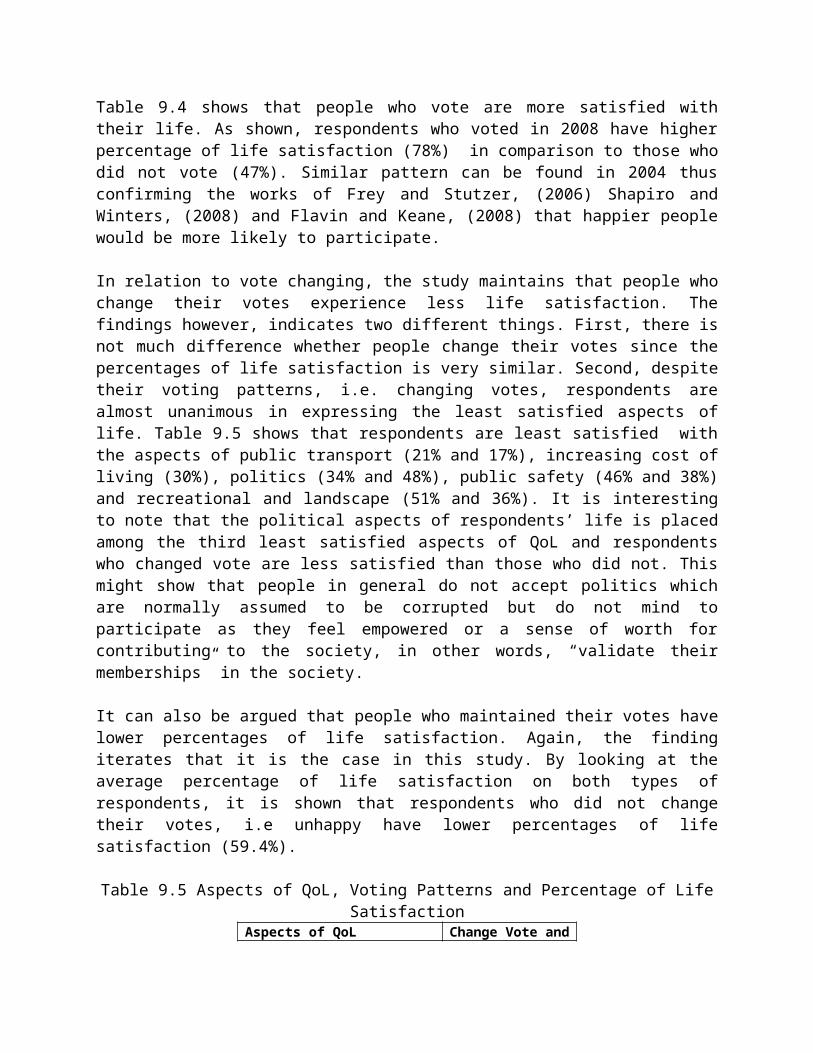
Table 9.4 shows that people who vote are more satisfied withtheir life. As shown, respondents who voted in 2008 have higherpercentage of life satisfaction (78%) in comparison to those whodid not vote (47%). Similar pattern can be found in 2004 thusconfirming the works of Frey and Stutzer, (2006) Shapiro andWinters, (2008) and Flavin and Keane, (2008) that happier peoplewould be more likely to participate.
In relation to vote changing, the study maintains that people whochange their votes experience less life satisfaction. Thefindings however, indicates two different things. First, there isnot much difference whether people change their votes since thepercentages of life satisfaction is very similar. Second, despitetheir voting patterns, i.e. changing votes, respondents arealmost unanimous in expressing the least satisfied aspects oflife. Table 9.5 shows that respondents are least satisfied withthe aspects of public transport (21% and 17%), increasing cost ofliving (30%), politics (34% and 48%), public safety (46% and 38%)and recreational and landscape (51% and 36%). It is interestingto note that the political aspects of respondents’ life is placedamong the third least satisfied aspects of QoL and respondentswho changed vote are less satisfied than those who did not. Thismight show that people in general do not accept politics whichare normally assumed to be corrupted but do not mind toparticipate as they feel empowered or a sense of worth forcontributing to the society, in other words, “validate theirmemberships” in the society.
It can also be argued that people who maintained their votes havelower percentages of life satisfaction. Again, the findingiterates that it is the case in this study. By looking at theaverage percentage of life satisfaction on both types ofrespondents, it is shown that respondents who did not changetheir votes, i.e unhappy have lower percentages of lifesatisfaction (59.4%).
Table 9.5 Aspects of QoL, Voting Patterns and Percentage of LifeSatisfaction
Aspects of QoL Change Vote and
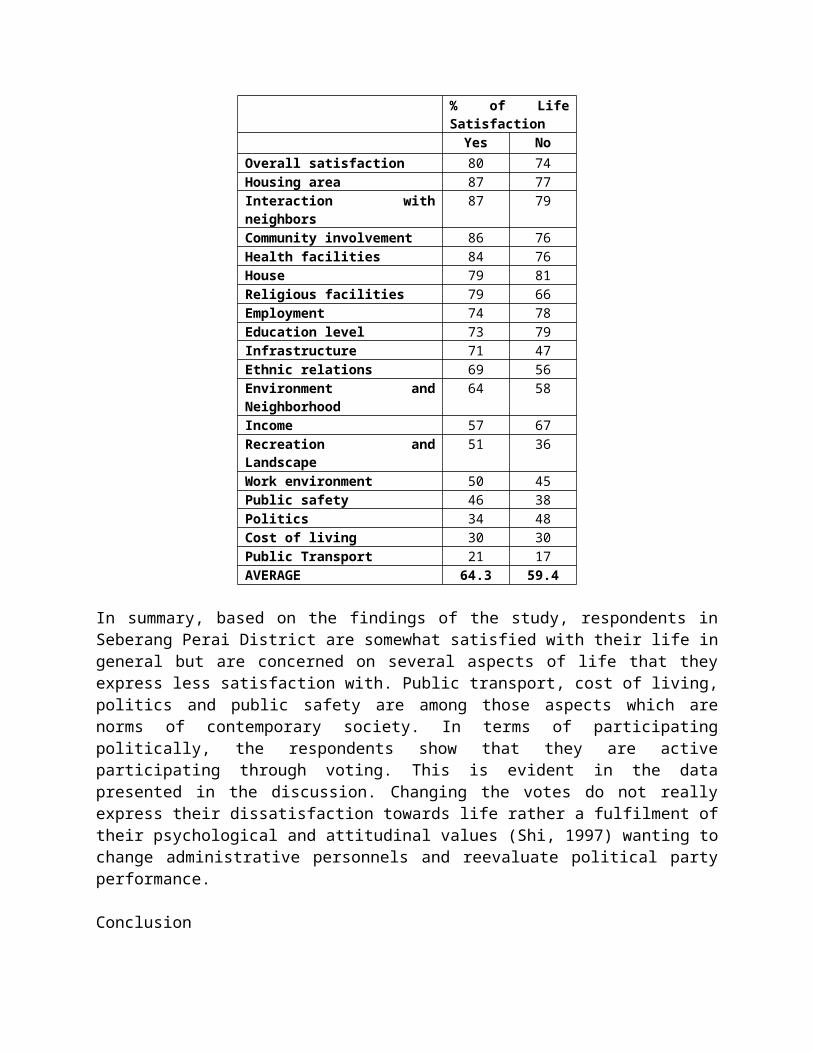
% of LifeSatisfactionYes No
Overall satisfaction 80 74Housing area 87 77Interaction withneighbors
87 79
Community involvement 86 76Health facilities 84 76House 79 81Religious facilities 79 66Employment 74 78Education level 73 79Infrastructure 71 47Ethnic relations 69 56Environment andNeighborhood
64 58
Income 57 67Recreation andLandscape
51 36
Work environment 50 45Public safety 46 38Politics 34 48Cost of living 30 30Public Transport 21 17AVERAGE 64.3 59.4
In summary, based on the findings of the study, respondents inSeberang Perai District are somewhat satisfied with their life ingeneral but are concerned on several aspects of life that theyexpress less satisfaction with. Public transport, cost of living,politics and public safety are among those aspects which arenorms of contemporary society. In terms of participatingpolitically, the respondents show that they are activeparticipating through voting. This is evident in the datapresented in the discussion. Changing the votes do not reallyexpress their dissatisfaction towards life rather a fulfilment oftheir psychological and attitudinal values (Shi, 1997) wanting tochange administrative personnels and reevaluate political partyperformance.
Conclusion
Based on the discussions on the literature and supported by someempirical evidences from the survey, it can be noted that peopleare willing to participate politically through voting since theyfeel a sense of empowerment as a member of the society with theability to change, in this case, the representatives in thegovernment. Apart from this reason, people are also participatingwhen they are more satisfied with their life confirming the worksof many other scholars although at the back of our minds, wewould want to suppose that unhappy people would be more willingto participate, more eager to change. Such assumption does notmaterialize in this case. Therefore, the extraordinary 12th GEresults in Pulau Pinang and Seberang Perai in particular was notreally triggered by the fact that the people are less satisfiedwith their life. There should be some other factors contributingto the swing of political tsunami in the 12th GE in 2008. Welshin her article commenting on the 12th GE in the Malaysiakini.com.2008 voiced out that the Reformasi movement and people symphatyon the alleged Anwar Ibrahim might have played important roles inchanging the political wave at the time. In addition to that, theimpacts of new medium of communication via internets and globalnetworks might also be vital in affecting the changes byproviding alternative information channels.
References
Ahmad Nidzammuddin Sulaiman, 2002.“Budaya Politik Dalam Masyarakat Majmuk Malaysia” [Political Culture in Malaysia’s Plural Society] in Etika dan Budaya Berpolitik dari Perspektif Islam [Ethics and Political Culture from Islamic Perspective], edited by Abdul Monir Yaacob and Suzalie Mohamad (Kuala Lumpur: Institut Kefahaman Islam Malaysia), 34.
Chandra Muzaffar, 1989. “The Barisan’s 2/3 majority: Why the opposition failed” in Challenges and choices in Malaysian politics and society (Penang: Aliran), 114.
Frey, B. and Stutzer, A. 2006. Political Participation and Procedural Utility, University of Zurich, Switzerland.
Gabriel A. Almond & Sidney Verba, 1963. The Civic Culture: Political Attitudes and Democracy in Five Nations (London: Sage Publications), 12.
Huntington, S.P. and Nelson, J.M. 1976. No easy Choice, Cambridge Harvard University Press, Marsyelayanti Mohd Ghazali, 2009. Political Culture And PoliticalParticipation In Malaysia,2007-2008: An Analytical Survey, UIA
Mehran Kamrava, M. 1996. Understanding Comparative Politics: A Framework forAnalysis (London: Routledge), 58.
Mohd Fazil Syam, Neilson Ilan and Ahi Sarok, 2002. Tingkahlaku Pengundian dalam Pilihanraya Parlimen Sarawak, UNIMAS.
Radcliff, B. 2001. “Politics, Markets and Life Satisfaction: The Political Economy of HumanHappiness.” American Political Science Review 95(4): 939-52.
Schyns, P. 1998. “Crossnational Differences in Happiness: Economic and Cultural FactorsExplored.” Social Indicators Research 43: 3-26
Sen, A.K. 1995. “Rationality and Social Choice.” American Economic Review 85: 1-24.-----. 2001. Development as Freedom. New York, United States: OxfordUniversity Press
Shapiro-Weitz, R. and Winters, M. 2008. Political Participation and Quality of Life, Inter American Development Bank, Research Department, Working Paper #638.
Shi, Tianjin, 1997. Political Participation in Beijing, CambridgeHarvard University Press
Stutzer, A., and B.S. Frey. 2006. “Political Participation and Procedural Utility: An EmpiricalStudy.” European Journal of Political Research 45(3): 391-418.
Syamsuddin Haris, 2004.“Politicization of Religion and the Failure of Islamic Parties in the 1999 General Election” in Elections in Indonesia. eds. Hans Antlov & Steven Cederroth (London: Routledge), 87.
Veenhoven, R. 1995. “The Cross-National Pattern of Happiness: Test of Predictions Implied inThree Theories of Happiness.” Social Indicators Research 34(1): 33-68
Wan Rohila Ganti Wan A Ghapar, 2008. Political Culture and Political Participation of the Electorates in Kuala Berang: A Post Election Survey, Universiti Islam Antarabangsa.
Welsh, B. 1996.“Attitudes Toward Democracy in Malaysia: Challenges to the Regime?” AsianSurvey, Vol. 17, No. 9: 903
Copyright © 2022 FDOKUMEN